Correction Technique for Cascade Gammas in I-124 Imaging on a Fully3D, Time-of-Flight PET Scanner

Available online at www.sciencedirect.com
Nuclear Medicine and Biology 37 (2010) 227–235www.elsevier.com/locate/nucmedbio
Three-region MRI-based whole-body attenuation correction for automatedPET reconstruction
Jeffrey Steinberga,⁎, Guang Jiab, Steffen Sammetb, Jun Zhangb,Nathan Hallb, Michael V. Knoppb
aDepartment of Radiology, Duke University Medical Center, Durham, NC, USAbDepartment of Radiology, The Ohio State University, Columbus, OH, USA
Received 24 August 2009; received in revised form 28 October 2009; accepted 10 November 2009
Abstract
Introduction: In this study we proposed and developed a simple attenuation mapping approach based on magnetic resonance imaging (MRI)for the purpose of reconstructing positron emission tomography (PET) images in PET/MRI imaging devices.Methods: After experimental development, an in vivo calibration was performed by whole-body scanning of five beagles on both a PET/CTand an MRI. The attenuation was determined by using an automated segmentation algorithm to segment regions of background, lung, softtissue and bone, and assigning them values of 0.002, 0.030, 0.098 and 0.130 cm−1, respectively.Results: The CT-attenuated and MRI-attenuated PET images had average standardized uptake values (SUVs) that differed by 1–6% for mostregions of interest (ROIs). Also, mean relative differences (MRDs) between the images were between 5% and 9% for most regions. The onlyexception is bone, where the three-region MRI-attenuated PET images had an SUV 10% less on average than the CT-attenuation images, andthe MRD averaged 14%. Also, additional segmentation of the bone in the four-region MRI-attenuated PET images reduced the SUVdifference to 3% and the MRD to 6%.Conclusion: Therefore, despite the improvements in the four-region segmentation, the three-region segmentation, without delineation ofosseous tissues, produces high-quality images that are sufficient for most expected clinical and research purposes.© 2010 Elsevier Inc. All rights reserved.
Keywords: PET/MRI development; Multimodal imaging; PET attenuation correction; PET reconstruction; Segmentation
1. Introduction
Hybrid imaging, the combination of two distinct imagingsystems, is a highly useful diagnostic tool that has beenresearched extensively in recent years [1–3]. Imagingsystems such as positron emission tomography (PET)/computed tomography (CT) and single photon emissioncomputed tomography (SPECT)/CT are widely used in bothclinical and research settings due to the combined functionalinformation concerning metabolic processes (PET, SPECT)and anatomical detail (CT). There is a lot of interest insimultaneous acquisition of high-resolution morphologicimaging with molecular imaging systems. Whereas PET/CT
⁎ Corresponding author. Tel.: +1 614 432 8031 (cell), +1 919 681 9529(office).
E-mail address: [email protected] (J. Steinberg).
0969-8051/$ – see front matter © 2010 Elsevier Inc. All rights reserved.doi:10.1016/j.nucmedbio.2009.11.002
and SPECT/CT are acquired sequentially, the integration ofPET/MRI is seen as one of the opportunities to do this in asimultaneous way [4–6]. Magnetic resonance imaging(MRI) also has several advantages over CT, including highsoft tissue contrast, the ability to scan in all three dimensions,higher resolution, no ionizing radiation, and can be used witha wide variety of contrast materials. Several prototypes havebeen developed in research groups around the worldincluding a 7-T MRI combined with an animal PET scannerthat allows for simultaneous acquisition [7–9].
Attenuation correction is a necessary step in PETreconstruction to obtain adequate images [10]. Imageswithout attenuation correction have poor contrast andartifacts, such as high signal in the lungs and on the surfaceof the body. The attenuation can be determined using atransmission scan, which uses one or more rotatingradioactive sources to measure the attenuation along all the

228 J. Steinberg et al. / Nuclear Medicine and Biology 37 (2010) 227–235
lines of response. The emergence of PET/CT hybrids hasallowed the attenuation to be measured using CT, eliminatingthe need for an additional transmission scan [11–14].Likewise, PET/MRI systems could theoretically use theMRI scan to obtain the attenuation correction. This wouldeliminate the need for CT and transmission scans, whichincrease the radiation exposure to the patient and wouldrequire additional time and money to integrate them into thesystem. Therefore, the most feasible way to acquireattenuation information in PET/MRI systems is to approx-imate the attenuation from the MRI scan.
Acquiring attenuation information from MRI is challeng-ing due to its measurement method. Whereas CT andtransmission scans directly measure the attenuation ofionizing radiation passing through the body, MRI measuresproton density and magnetic characteristics of various nuclei.One problem in particular is that proton MRI signal does notallow visualization of calcium and phosphorus, which aresome of the strongest absorbers of ionizing radiation. Thisposes a technological problem due to the difficulty ofdistinguishing bone from surrounding tissues. However,some researchers have developed sequences for high bonecontrast using ultrashort TE imaging, but the additional scanwould be unfavorable due to the added time to the protocol[15,16]. Zaidi et al. [17] and Hofmann et al. [18] havedevelopedmethods for segmenting the bone from surroundingtissues in the brain, but no one has yet presented a method foradequately segmenting bone from the entire body. It has alsobeen suggested by Martinez-Möller et al. [19] that segmen-tation of the bone for attenuation corrections is not necessary.
This study concerns evaluating the effectiveness andfeasibility of estimating the attenuation based on segmen-tation of the acquired MRI images. This is achieved byapproximating the attenuation by segmenting and catego-rizing tissue groups based on the pixel intensities of certainregions. The resulting PET images reconstructed usingapproximate MRI-based attenuation maps are compared toPET images reconstructed using CT-based attenuation maps.The goal of the study was to measure the effectiveness of asimple approximation of the attenuation on the resultingPET images.
2. Materials and methods
In vivo evaluations using an animal model wereperformed by deriving an approximate attenuation mapfrom MRI as a method for reconstruction of PET. The PETwas also reconstructed using attenuation maps derived fromCT. The two approaches of using MRI and CT forattenuation correction were analyzed by a thorough inves-tigation into the SUV of commonly imaged tissues.
2.1. In vivo animal studies
After some consideration, it was decided that the mostappropriate possibility for an objective assessment was the
implementation of an animal study using beagles. The studywas designed by an interdisciplinary team highly experi-enced in imaging beagles, and the protocol of the procedurewas approved by the Institutional Animal Care and UseCommittee, a local animal experimentation committee. Fivebeagles with an average weight of 11.1±2.6 kg and noknown preexisting conditions were scanned on both a PET/CT and an MRI system. Each scan was performed one timeon separate days, and the beagles were not euthanized afterscanning. The beagles were anesthetized for the purpose ofkeeping the beagles immobile during scanning. Anesthesiawas induced with 1 mg/kg diazepam and 1 mg/kg xylazinefollowed by maintenance of isoflurane inhalation (1–3%).Each beagle was placed in the prone position on the table andkept immobile using sheets for support on the sides and astrap over the back. After the beagle was secure, the scanswere taken. The procedure above was repeated for both thePET/CT scan and MRI scan, and no beagles had undergoneboth scans on the same day.
2.2. Positron emission tomography/computed tomography
The PET examinations were performed on a SiemensBiograph 16 HI-REZ PET/CT. A routine survey scan of thesubject was performed initially followed by a whole-bodyCT scan (matrix size 512×512 with in-plane resolution of0.32×0.32 mm2; 507 slices; 3 mm slice thickness). Next, adynamically acquired PET scan of a fixed bed positionencompassing the lungs was obtained. The scan acquireddata in listmode in 1-min segments so that 60 images of thesame bed position were obtained during the 60-min scan.After 1 min of acquisition, approximately 3 mCi of 18FDG(fluoro-2-deoxyglucose) was injected. After the dynamicscan, a topogram and whole-body CT were retaken, followedby a PET scan. The PET scan used a total of six to seven beds(162 mm long; 40 mm overlap; matrix size 168×168 with in-plane resolution of 2.0×2.0 mm2; 81 slices; 2 mm slicethickness) for a total of 371–429 slices. The scan was awhole-body scan covering the entire length of the beagleexcept for the tail and hind legs. The acquisition times for theCT and PET scans were approximately 20 s and 20 min,respectively. The total scan time including the dynamicallyacquired scan was 80 min. The raw data output was insinogram format and had been corrected for random events.
2.3. Magnetic resonance imaging
The MRI examinations were performed on a PhilipsAchieva 3-T MRI system using the standard spine coil. Afterroutine localization images, a T1-weighted 3D turbo spinecho thrive sequence (TR/TE=2.7 ms/1.22 ms; field ofview=300×300 mm2; matrix 256×256 with in-plane resolu-tion of 1.17×1.17 mm2; 140 slices; 2 mm slice thickness,contiguous slices) was acquired. The acquisition time for thethrive sequence was 11 min 12 s.
The sequences were repeated three times for threedifferent anatomical areas. The first anatomical area was

Fig. 2. Axial chest slices of a beagle for (left) CT image after bilinear scalingwith ROIs drawn for background, lung, tissue and spine; (middle) three-region segmentation of background, lung and tissue; (right) four-regionsegmentation of background, lung, tissue and bone using the assigned values.
229J. Steinberg et al. / Nuclear Medicine and Biology 37 (2010) 227–235
from the tip of the nose to the neck, the second was from theneck to the upper abdomen and the third was from the upperabdomen to the rear. The tail and rear limbs were notincluded in the scan. Each scan had a 20- to 40-mm overlapto facilitate the process of combining the three sections into acontinuous whole-body image set. Also, the overlap helpseliminate artifacts that may appear near the fringes of thescan. The total scan time was approximately 45 min, whichtakes into account acquisition times for three scans,repositioning of the bed in between scans and the internalMRI adjustments prior to each scan.
2.4. Registration
Registration of the PET and MRI images was done usingthe Medical Image Processing, Analysis & Visualization(MIPAV) software package. Due to the difficulty ofregistering MRI to PET, CT was used in place of PET forregistration purposes. After the MRI and CT images wereloaded in the software, a landmark-based registration using athin-plate spline was used for nonlinear registration of thetwo modalities [20]. In order to achieve adequate registrationbetween the modalities, 30–50 points were manually chosenin each image for the landmark registration.
Registration between PET and CT is automaticallyperformed by the PET/CT scanner. Because the device is acombined scanner, the patient can stay in the same positionfor both scans thus minimizing registration errors. However,some registration errors are presented due to internal motionsuch as misregistration in the lungs due to breathing [21].Since these same errors are present in MRI registration, theireffect can be ignored since this is a comparison studybetween MRI and CT attenuation.
2.5. Segmentation
An automated algorithm for segmentation of the MRIimages was developed in Interactive Data Language (IDL;Research Systems, Inc.). The first step in the attenuation is tosegment the background in MRI from body tissues andcavities. Since the background has a very low pixel value inall modalities, it can be easily segmented using a thresholdwith a maximum allowed value. However, lungs have a lowpixel value as well, which can range from as low as thebackground to as high as soft tissue.
Fig. 1. An axial chest slice of a beagle for (A) the original MRI image; (B)image after threshold between high and low pixel values; (C) backgroundand body segmented image after region cut of the lung; and (D) lungsegmentation derived after subtraction of image (B) from image (C).
Fig. 1 shows the various steps of the segmentationprocess. Fig. 1A shows the original MRI of an axial slice ofthe beagle's chest. A simple threshold of the original MRI isused to separate tissues from the background. As seen inFig. 1B, there are regions within the body labeled asbackground and outside the body not labeled as background.Most importantly, the threshold identifies lung as thebackground. The way to segment the background is to doa region labeling algorithm that identifies each group ofpixels of equal value. Then, the number of pixels in eachlabeled region is calculated using a histogram algorithm. Thesmall regions can be cut by cutting all regions of a size belowa certain threshold. Since the background and tissue are thelargest regions, all cuts smaller than these two regions are cutleaving the background segmentation in Fig. 1C. The lungscan then be segmented by subtracting Fig. 1B from Fig. 1Cto obtain the lung segmentation shown in Fig. 1D. Once thebackground and lungs are segmented, all other pixels areassumed to be soft tissue.
Bone is by far the hardest to segment in MRI. Althoughsome groups have developed sequences for labeling bonestructure [14,16], there have been no established methodsyet for bone segmentation. In order to sidestep thisproblem, segmentation of bone was done by using athreshold of 100 Hounsfield units (HU) on CT. Thisnumber was chosen since soft tissue is generally under 100HU, and none of the tissue surrounding the spine wasabove this value. The segmented bone was then overlappedonto the registered MRI. This method requires a CT andcannot be used in practice. It is presented here forcomparisons of attenuation correction with and withoutincluding bone in the segmentation.
Once the regions of background, lung, bone and softtissue are formed, the attenuation values for the specifictissue group are assigned to each region. An attenuationvalue of 0.002 cm−1 is assigned to the background, 0.030cm−1 to lung, 0.098 cm−1 to soft tissue and 0.130 cm−1 tobone. The attenuation values are derived from averaging theregions in the CT attenuation maps after bilinear scaling [14]for all five beagles as shown in Fig. 2. Regions of interest(ROIs) are drawn on the CT map for several slices for all thebeagles to obtain an average attenuation for each region. Inthis study two attenuation maps are of interest. One map,called a three-region map, consists of segmenting onlybackground, lung and other tissues. The other map, called a

230 J. Steinberg et al. / Nuclear Medicine and Biology 37 (2010) 227–235
four-region map, is a segmentation of background, lung, softtissue and bone.
2.6. PET Reconstruction
Reconstruction of the PET data was done using the freelyavailable Software for Tomographic Image Reconstruction(STIR). The software package provides tools for normaliza-tion, rebinning and reconstruction. The three input filesneeded to reconstruct the PET data are the raw data, whichcontain the sinograms; the normalization file; and theattenuation file.
Attenuation correction is done during normalization byprojecting the attenuation images to match the raw sinogramdata. This is multiplied by the normalization factors, whichcontain information about geometric parameters, crystalinterference, crystal efficiencies and deadtime parameters[22]. After normalization, the data are rebinned using Fourierrebinning (FORE) [23]. The rebinned data then undergo 2Dordered subset expectation maximum [24] with eight subsetsand two iterations. The result is a normalized andattenuation-corrected PET image.
2.7. Analysis
In an effort to quantify the accuracy of the MRI-attenuated vs. the CT-attenuated maps, a couple of methodswere used. One method is to calculate the standardizeduptake values (SUVs) of manually selected ROIs andcompare the results among the different attenuation maps.The other method is to take the mean relative difference(MRD) of images reconstructed from different atte-nuation maps. These methods for quantifying the accuracywere used in conjunction with visual assessments of theresulting images.
The first method for analyzing the data was to draw anROI around the lungs, heart, liver and spine. In the case ofthe spine, the ROI was drawn from the registered CTattenuation image. After the ROI was drawn, the SUVs [25]were averaged over the entire region. The SUV of the ROIwas calculated by
SUV ¼ Tissue concentration ðBq=mlÞInjected dose ðBqÞ=Patient0s weight ðgÞ ð1Þ
where the tissue concentration is calculated by
Tissue concentration =Pixel intensity
e− ln 2ð Þ4t = t1 = 2 ð2Þ
where t is the time after injection, t1/2 is the half life of18F and pixel intensity has been rescaled to achieveconcentrations in becquerel per milliliter. This same methodwas used for calculating the SUV of an ROI for adynamically acquired scan.
Another method for comparing the differences betweenthe images is to calculate the differences on a pixel-by-
pixel basis. This involves calculating the MRD usingthe equation,
MRD =1N
XN
i=0
jP1;i − P2;i jP1;i + P2;i
� �= 2
� � ð3Þ
where i is the pixel number, N is the total number of pixels,P1,i is the value at pixel i of the first image and P2,i is the valueat pixel i of the second image. As can be seen from Eqs. (1)and (2), the pixel intensity is directly proportional to the SUV,so the MRD calculated in Eq. (3) is actually the MRD of theSUVs of the two images.
2.8. Methods summary
The methods outlined earlier were performed for all fivebeagles using the approved protocol. Each beagle underwentboth a PET/CT and an MRI scan. The resulting images wereused for registration, segmentation and attenuation correc-tion. The PET was reconstructed from the raw data usingthis information, and analysis of the SUV and MRD wasperformed. Lastly, the dynamically acquired data wereevaluated for changes in results due to the time the scanwas taken after injection of FDG.
3. Results
3.1. Beagle images
Four slices of a beagle for each of four differentattenuation maps are shown in Fig. 3. Fig. 4 shows a CTtopogram indicating the head, neck, chest and hind slicesused in Fig. 3. None refers to no attenuation, MR3R refers toa three-region segmentation, MR4R refers to a four-regionsegmentation and CT refers to CT attenuation. Theunattenuated PET images had much lower pixel values inthe neck and hind regions as well as high pixel values in thelung compared to the CT. MR3R and MR4R are indistin-guishable from each other despite the difference inattenuation maps. Also, both theMRI-attenuated PET imagesare similar to the CT-attenuated images, differing mainly inareas where misregistration errors occurred. Fig. 5 showsexamples of the resulting PET images from three differentattenuation maps along with the corresponding attenuationmaps. The figure indicates errors where misregistrationoccurred as well as the spine, which showed significantdifferences due to the approximation using segmentation.
3.2. Standardized uptake values for various regions
Fig. 6 shows the SUVs for the liver, lung and spineaveraged for all five beagles using three different attenuationmethods along with no attenuation. Table 1 shows the SUVof the heart, liver, lung, spine, brain, kidney and bladder, andTable 2 shows the percent difference between the differentmethods. As can be seen in the figure and tables, the averageSUVs using the CT-based attenuations are within 10% of the
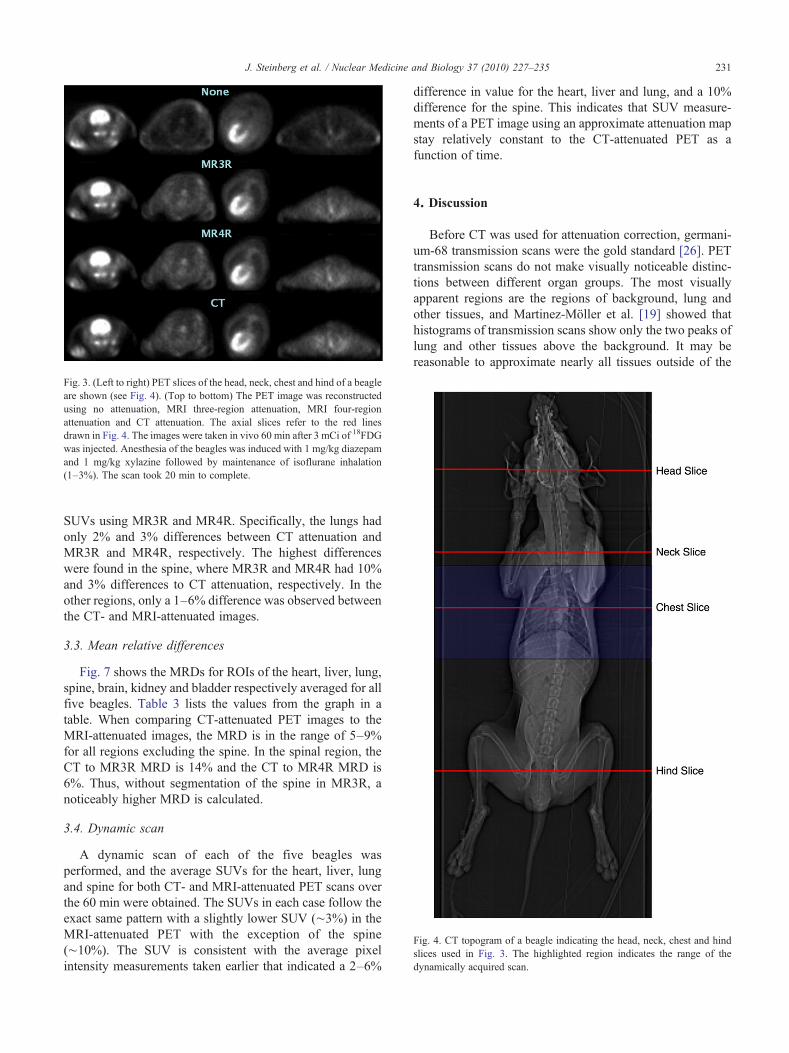
Fig. 3. (Left to right) PET slices of the head, neck, chest and hind of a beagleare shown (see Fig. 4). (Top to bottom) The PET image was reconstructedusing no attenuation, MRI three-region attenuation, MRI four-regionattenuation and CT attenuation. The axial slices refer to the red linesdrawn in Fig. 4. The images were taken in vivo 60 min after 3 mCi of 18FDGwas injected. Anesthesia of the beagles was induced with 1 mg/kg diazepamand 1 mg/kg xylazine followed by maintenance of isoflurane inhalation(1–3%). The scan took 20 min to complete.
ig. 4. CT topogram of a beagle indicating the head, neck, chest and hindices used in Fig. 3. The highlighted region indicates the range of theynamically acquired scan.
231J. Steinberg et al. / Nuclear Medicine and Biology 37 (2010) 227–235
SUVs using MR3R and MR4R. Specifically, the lungs hadonly 2% and 3% differences between CT attenuation andMR3R and MR4R, respectively. The highest differenceswere found in the spine, where MR3R and MR4R had 10%and 3% differences to CT attenuation, respectively. In theother regions, only a 1–6% difference was observed betweenthe CT- and MRI-attenuated images.
3.3. Mean relative differences
Fig. 7 shows the MRDs for ROIs of the heart, liver, lung,spine, brain, kidney and bladder respectively averaged for allfive beagles. Table 3 lists the values from the graph in atable. When comparing CT-attenuated PET images to theMRI-attenuated images, the MRD is in the range of 5–9%for all regions excluding the spine. In the spinal region, theCT to MR3R MRD is 14% and the CT to MR4R MRD is6%. Thus, without segmentation of the spine in MR3R, anoticeably higher MRD is calculated.
3.4. Dynamic scan
A dynamic scan of each of the five beagles wasperformed, and the average SUVs for the heart, liver, lungand spine for both CT- and MRI-attenuated PET scans overthe 60 min were obtained. The SUVs in each case follow theexact same pattern with a slightly lower SUV (∼3%) in theMRI-attenuated PET with the exception of the spine(∼10%). The SUV is consistent with the average pixelintensity measurements taken earlier that indicated a 2–6%
difference in value for the heart, liver and lung, and a 10%difference for the spine. This indicates that SUV measure-ments of a PET image using an approximate attenuation mapstay relatively constant to the CT-attenuated PET as afunction of time.
4. Discussion
Before CT was used for attenuation correction, germani-um-68 transmission scans were the gold standard [26]. PETtransmission scans do not make visually noticeable distinc-tions between different organ groups. The most visuallyapparent regions are the regions of background, lung andother tissues, and Martinez-Möller et al. [19] showed thathistograms of transmission scans show only the two peaks oflung and other tissues above the background. It may bereasonable to approximate nearly all tissues outside of the
Fsld

able 1tandardized uptake values for CT-attenuated PET (CT), MRI three-regionttenuated PET (MR3R), MRI four-region attenuated PET (MR4R)
UV (g/ml) CT MR3R MR4R
eart 5.5 5.2 5.4iver 2.4 2.3 2.3ung 0.8 0.8 0.8pine 1.8 1.6 1.8rain 5.4 5.7 5.7idney 9.7 9.5 9.5ladder 138 147 147
Fig. 5. Above shows a chest slice of a beagle using a (A) CT attenuationmap, (B) MRI three-region attenuation map and (C) MRI four-regionattenuation map. These attenuation maps were used to reconstruct the (D)CT-attenuated PET images, (E) MRI three-region attenuated PET imagesand (F) MRI four-region attenuated PET images. The red arrows indicate amisregistration error, and the blue arrows indicate small segmentation errorsdue to segmentation of the spine.
232 J. Steinberg et al. / Nuclear Medicine and Biology 37 (2010) 227–235
lungs with the same attenuation value, so there is no need tosegment further. This was the main inspiration toward thedevelopment of a three-region segmented MRI for attenu-ation corrections in PET imaging. The data suggest that athree-region segmented MRI is an accurate attenuation mapand the resulting PET images are very similar in appearanceand uptake values to those of a CT-attenuated PET image.
The results show that there is a small, but noticeabledifference between using attenuation images with or withoutbone. Fig. 6 shows SUVs of the spine 10% lower on averagefor the three-region attenuation compared to the CTattenuation, and a 3% difference in SUV for the four-regionsegmentation. Also, the difference in SUV averages betweenthe CT and the MRI segmented PET was only 1–6%. Sincethe SUVs for both MRI-attenuated PET images are about the
Fig. 6. The average SUV differences of the heart, liver, lung, spine, brain,kidney and bladder for all the beagles between reconstructed PET usingthese attenuations: (1) CT and three-region MRI (MR3R) and (2) CT andfour-region MRI (MR4R).
TSa
S
HLLSBKB
same, differences in the attenuation maps of the spinal regiondo not have a noticeable effect on surrounding tissues.
The differences in SUV were explored in more detail byintroducing the MRD calculation. The MRD between the CTand the four-region segmented PET for the spinal region was6% and between the CT and the three-region segmented PETwas 14%. For the heart, liver and lung, the MRD between CTand the three-region segmented PET was 6–8%, andbetween CT and the four-region segmented PET was 5–7%. The MRD confirms the results of the SUV averagecalculation that the three-region segmentation is highlyaccurate for most regions, and it is only slightly less accuratein the spinal region.
Segmenting the spine might only be necessary forquantitative calculations in the spine, such as finding theSUV of a spinal tumor. However, for qualitative assess-ments, the difference between the three-region segmentedPET and the four-region segmented PET is not noticeablydifferent (see Fig. 5). Martinez-Möller et al. [19] suggestedthat segmentation of bone for attenuation images may not benecessary. Our study confirms the validity of such astatement due to the relatively small SUV differencesbetween the CT-attenuated and three-region attenuatedimages of 10% in the spine and less than 6% in othertissues. Hofmann et al. [18] suggested that quantitativedifferences of less than 10% generally do not affectdiagnosis. Thus, segmentation of bone in the thoracic andabdominal regions is not necessary for a valid diagnosis.However, PET/MRI is likely to be used heavily as a researchtool, so a 10% difference could affect results of a prospectivestudy. In the head, Kops and Herzog [27] averagedapproximately a 10% error using both a segmentation
able 2ercent difference of the average SUV over a whole ROI between CT-ttenuated PET and MRI-attenuated PET images
UV Averages CT to MR3R CT to MR4R MR3R to MR4R
eart 5% 1% 4%iver 6% 4% 2%ung 2% 3% 1%pine 10% 3% 12%rain 5% 6% 1%idney 1% 2% 3%ladder 6% 6% 0.1%
TPa
S
HLLSBKB

Fig. 7. The average MRD of the heart, liver, lung, spine, brain, kidney andbladder for all the beagles between reconstructed PET using theseattenuations: (1) CT and three-region MRI (MR3R) and (2) CT and four-region MRI (MR4R).
Table 3Mean relative differences on a pixel-by-pixel basis for ROIs between CT-attenuated PET and MRI-attenuated PET images
MRD Averages CT to MR3R CT to MR4R MR3R to MR4R
Heart 6% 5% 2%Liver 7% 7% 2%Lung 8% 7% 4%Spine 14% 6% 13%Brain 6% 7% 2%Kidney 9% 8% 3%Bladder 5% 5% 1%
233J. Steinberg et al. / Nuclear Medicine and Biology 37 (2010) 227–235
method developed by Dogdas et al. [28] and their own. Sincea 10% error was observed using skull segmentation, one caninfer that the error would be noticeable larger withoutsegmentation of the skull. So, existing protocols forsegmentation of the head should still be used [17,18,27,28].The aforementioned studies were performed on humanpatients where the skeletal composition and weight aredifferent from those of beagles. The average skeletal weightto total weight is 14% in humans and 6% in beagles [29,30].Also, the relative weights of bones compared to total skeletalweight are different between humans and animals. Thisdifference indicates that the results of segmentation,especially in the brain and spine, are likely to be differentusing a similar procedure on humans.
Segmentation of the lungs in a practical setting is notstraightforward. Assigning a single attenuation value to allpatients in all settings is not adequate since the attenuation oflungs varies from subject to subject, and it depends onbreathing patterns, age and the presence of respiratorydiseases [31,32]. Due to the different anatomies, beagles andhumans are expected to have different attenuations in thelung. This study estimates attenuation to be 0.030 cm−1 inbeagles, whereas Martinez-Möller et al. [19] estimated theattenuation to be 0.018 cm−1 in humans. Also, thecomposition of tissues in the chest region is different,where lungs are larger relative to the surrounding tissue inhumans than in beagles. However, the attenuation of thesurrounding tissue has minimal effects on the lung SUV, sothe procedure outlined in this article can be applied tohumans as long as an accurate estimation of the attenuation isused. In this specific case, five healthy beagles were scanned,so the attenuation of the lungs is not likely to vary greatlyfrom beagle to beagle in the study. A more significant errorintroduced into the procedure was from registration andsegmentation, which would cause errors on the outerportions of the lungs. This error was avoided by drawingan ROI within the lungs far from the boundary betweenlungs and adjacent tissue. However, with accurate registra-tion and segmentation techniques, assignment of a single
attenuation value to the lungs in most patients will yield PETimages similar in quality to PET images reconstructed fromCT attenuation.
The dynamically acquired PET scans performed over a60-min period indicated that the percentage difference inSUVs between the CT- and MRI-attenuated PET images wasrelatively constant over that period. SUV time independenceis important because in this particular study, the scan wastaken approximately 60 min after injection of 18FDG. Otherhospitals and research groups may take PET scans anywherefrom 30 to 90 min after injection [33,34], so it is important toobtain the same result at any time after injection. Since thedynamic scan demonstrates SUV time independence, thepercentage differences in SUV averages shown in Tables 2and 3 would be approximately the same at any scan time.
As has previously been shown, the attenuation is essentialfor both high-quality PET images and accurate SUVcalculations. Small changes to the attenuation map can resultin noticeable visual and quantitative changes in the final PETimage. Thus, it is essential to achieve appropriate attenuationimages when performing the reconstruction. However, in thecase of whole-body MRI-based attenuation, only anapproximate attenuation map derived from visually distin-guishable tissues of the images is possible. It is neitherfeasible nor practical to derive attenuation images from MRIto be equivalent to the CT attenuation, so an approximateattenuation image must be generated. The most importantquestion to ask is what tissue areas of the body have thelargest difference in attenuation to other areas. For example,the heart, liver and kidneys all have approximately the sameattenuation value, so assigning each one a differentattenuation value will not produce noticeably higher qualityPET images than assigning a single attenuation value for allthree. On the other hand, the lungs have much lowerattenuation than the heart, so it is necessary to assign thelungs a different attenuation value than the other tissues inthe body. It should also be noted that fat has a significantlylower attenuation value than other soft tissue, but segmen-tation of fat was not included in this study. It is currentlyunknown whether inclusion of fatty tissues in the attenuationwill result in significantly better PET images. The researchso far suggests that segmenting and assigning attenuationvalues to three regions can yield images comparable to thosereconstructed with CT attenuation.

234 J. Steinberg et al. / Nuclear Medicine and Biology 37 (2010) 227–235
The first example of the segmentation of tissue regions forthe purpose of deriving attenuation maps was discussed in anarticle by Zaidi et al. [17]. In the article, the authors [17]demonstrated an automated segmentation algorithm for thehead that involved segmenting regions of background, skull,nasal cavities and other tissues. The segmented tissue regionswere then assigned their corresponding attenuation valuesand were used for PET reconstruction. In the article, a singleattenuation value was assigned to the brain, scalp andintercranial fluids due to their relative similarity inattenuation value. The result of their work was high-qualityPET images of the brain that were nearly indistinguishable toPET images derived from transmission-based attenuationmaps. Another example of segmentation was recentlypresented by Hofmann et al. [18]. Their method involvedderiving pseudo-CT images from MRI for attenuationcorrection in PET. A combination of atlas registration andpattern recognition was used to obtain the pseudo-CTimages. These images were then used for attenuationcorrection of PET in the brain, and a mean error of 3.2%was observed. They also presented preliminary results usinga rabbit for future studies in whole-body animal imaging.
The recent publication by Martinez-Möller et al. [19] usestissue classification to derive an approximate attenuationmap similar to the research presented here. In the article, theauthors used a four-region segmentation of CT images intogroups of background, lung, fat and other tissues. Theyreached a similar conclusion that the difference in SUVbetween PET images using CT and segmented attenuation invarious locations in the body was generally under 10%, withthe exception of bone, where the difference was over 10%.However, it is not clear whether the additional segmentationof fat actually resulted in smaller differences in the SUVcalculation. Also, the research uses attenuation maps derivedfrom CT rather than from MRI, so it only presents atheoretical case and cannot be used in practice. The researchpresented here for three-region segmentation is fullyautomated with the exception of image registration and canbe used as a good starting point for reconstruction of PETimages from MRI-based attenuation maps.
5. Conclusion
A three-region segmentation of a whole-body MRI scanis a good approximation for an attenuation map for PETreconstruction, and it does not differ much from the CT-attenuated PET images. This result shows that smallchanges in attenuation between various tissues, such as inthe heart, liver and brain, do not greatly affect the resultingreconstruction. So, it is reasonable to assign a singleattenuation value to fat, muscles and even bone. However,it was shown that assigning a higher attenuation value tobone in the four-region segmentation does improve theaccuracy of uptake values in the bone, but for tissuesoutside of the bone, there does not seem to be any
significant qualitative or quantitative differences. Due tothe need to acquire MRI attenuation maps quicklyalongside with the desired MRI images, a fast acquisitionas well as a fast segmentation is needed. In this research, itwas found that a short repetition time on the order of a fewmilliseconds produced MRI images that are the easiest tosegment. A single slice of this MRI attenuation scan can beacquired in a fraction of a second. However, segmentationof the bone would likely require additional scans andlonger computation times, so it would not be practical forfast acquisitions. Therefore, a three-region segmentation,without segmentation of the bone, is a fast, approximateand practical solution to attenuation correction in PET/MRIhybrid systems.
References
[1] Townsend DW, Beyer T. A combined PET/CT scanner: the path to trueimage fusion. Br J Radiol 2002;75:24–30.
[2] Keidar Z, Israel O, Krausz Y. SPECT/CT in tumor imaging:technical aspects and clinical applications. Semin Nucl Med 2003;33:205–18.
[3] Antoch G, Vogt FM, Freudenberg LS, et al. Whole-body dual-modality PET/CT and whole-body MRI for tumor staging in oncology.JAMA 2003;290:3199–206.
[4] Gaa J, Rummeny EJ, Seemann MD. Whole-body imaging with PET/MRI. Eur J Med Res 2004;9:309–12.
[5] Seemann MD. Whole-body PET/MRI: the future in oncologicalimaging. Technol Cancer Res Treat 2005;4:577–82.
[6] Zaidi H, Mawlawi O, Orton CG. Simultaneous PET/MR will replacePET/CT as the molecular multimodality imaging platform of choice.Med Phys 2007;34:1525–8.
[7] Judenhofer MS, Wehrl HF, Newport DF, et al. Simultaneous PET-MRI: a new approach for functional and morphological imaging. NatMed 2008;14:459–65.
[8] Schlyer D, Vaska P, Tomasi D, et al. Preliminary studies of asimultaneous PET/MRI scanner based on the RatCAP small animaltomograph. IEEE Nucl Sci Symp Conf Rec 2006;4:2340–4.
[9] Catana C, Wu Y, Judenhofer M, et al. Simultaneous acquisition ofmultislice PET and MR images: initial results with a MR-compatiblePET scanner. J Nucl Med 2006;47:1968–76.
[10] Townsend DW. Physical principles and technology of clinical petimaging. Ann Acad Med Singapore 2004;33:133–45.
[11] Kinahan PE, Alessio AM, Fessler JA. Dual energy CT attenuationcorrection methods for quantitative assessment of response to cancertherapy with PET/CT imaging. Technol Cancer Res Treat 2006;5:319–27.
[12] Kamel E, Hany TF, Burger C, et al. CT vs 68Ge attenuation correctionin a combined PET/CT system: evaluation of the effect of lowering thect tube current. Eur J Nucl Med Mol Imaging 2002;29:346–50.
[13] Kinahan PE, Townsend DW, Beyer T, Sashin D. Attenuationcorrection for a combined 3D PET/CT scanner. Med Phys 1998;25:2046–53.
[14] Kinahan P, Hasegawa BH, Beyer T. X-ray-based attenuationcorrection for positron emission tomography/computed tomographyscanners. Semin Nucl Med 2003;33:166–79.
[15] Robson MD, Bydder GM. Clinical ultrashort echo time imagingof bone and other connective tissues. NMR Biomed 2006;19:765–80.
[16] Tyler DJ, Robson MD, Henkelman RM, Young IR, Bydder GM.Magnetic resonance imaging with ultrashort TE (UTE) PULSEsequences: technical considerations. J Magn Reson Imaging 2007;25:279–89.

235J. Steinberg et al. / Nuclear Medicine and Biology 37 (2010) 227–235
[17] Zaidi H, Montandon ML, Slosman DO. Magnetic resonance imaging-guided attenuation and scatter corrections in three-dimensional brainpositron emission tomography. Med Phys 2003;30:937–48.
[18] Hofmann M, Steinke F, Scheel V, Charpiat G, Farquhar J, Aschoff P,et al. MRI-based attenuation correction for PET/MRI: a novel approachcombining pattern recognition and atlas registration. J Nucl Med2008;49:1875–83.
[19] Martinez-Möller A, Souvatzoglou M, Delso G, et al. Tissueclassification as a potential approach for attenuation correction inwhole-body PET/MRI: evaluation with PET/CT data. J Nucl Med2009;50(4):520–6.
[20] Bookstein FL. Principal warps: thin-plate splines and the decompo-sition of deformations. IEEE Trans Pattern Anal Mach Intell 1989;11:567–85.
[21] Beyer T, Antoch G, Blodgett T, Freudenberg LF, Akhurst T, MuellerS. Dual-modality PET/CT imaging: the effect of respiratory motion oncombined image quality in clinical oncology. Eur J Nucl Med MolImaging 2003;30:588–96.
[22] Casey ME, Gadagkar H, Newport D. A component-based method fornormalization in volume PET. Proc. 3rd Int. Meeting on Fully Three-Dimensional Image Reconstruction in Radiology and NuclearMedicine; 1995. p. 61–5.
[23] Defrise M, Kinahan PE, Townsend DW, Michel C, Sibomana M,Newport DF. Exact and approximate rebinning algorithms for 3-D PETdata. IEEE Trans Med Imaging 1997;16:145–58.
[24] Hudson HM, Larkin RS. Accelerated image reconstruction usingordered subsets of projection data. IEEE Trans Med Imaging1994;13:601–9.
[25] Zasadny KR, Wahl RL. Standardized uptake values of normal tissuesat PET with 2-[fluorine-18]-fluoro-2-deoxy-D-glucose: variations withbody weight and a method for correction. Radiology 1993;189:847–50.
[26] Ostertag H, Kubler WK, Doll J, Lorenz WJ. Measured attenuationcorrection methods. Eur J Nucl Med 1989;15:722–6.
[27] Kops ER, Herzog H. Alternative methods for attenuation correction forPET images in MR-PET scanners. IEEE Nucl Sci Symp Conf Rec2007;6:4327–30.
[28] Dogdas B, Shattuck DW, Leahy RM. Segmentation of skull and scalpin 3-D humanMRI using mathematical morphology. Hum Brain Mapp2005;26:273–85.
[29] Polig E, Jee WS. Bone structural parameters, dosimetry, andrelative radiation risk in the beagle skeleton. Radiat Res 1989;120:83–101.
[30] Steele DG, Bramblett CA. The anatomy and biology of the humanskeleton. College Station: Texas A&M University Press; 1988.
[31] Webb WR, Stern EJ, Kanth N, Gamsu G. Dynamic pulmonary CT:findings in healthy adult men. Radiology 1993;186:117–24.
[32] Stern EJ, Frank MS. Small-airway diseases of the lungs: findings atexpiratory CT. Am Roentgen Ray Soc 1994;163:37–41.
[33] Ishii K, Sakamoto S, Hosaka K, Mori T, Sasaki M. Variation in FDGuptakes in different regions in normal human brain as a function of thetime (30 and 60 minutes) after injection of FDG. Ann Nucl Med2002;16:299–301.
[34] Belhocine T, Pierard G, Labrassinne M, Lahaye T, Rigo P. Staging ofregional nodes in AJCC Stage I and II melanoma: 18FDG PET imagingversus sentinel node detection. Oncologist 2002;7:271–8.
Copyright © 2022 FDOKUMEN