This paper must be cited as - RiuNet
40
Document downloaded from: This paper must be cited as: The final publication is available at Copyright Additional Information http://doi.org/10.1002/pi.5143 http://hdl.handle.net/10251/97801 John Wiley & Sons Valencia-Sullca, CE.; Jiménez Serrallé, M.; Jiménez Marco, A.; Atarés Huerta, LM.; Vargas, M.; Chiralt A. (2016). Influence of liposome encapsulated essential oils on properties of chitosan films. Polymer International (Online). 65(8):979-987. doi:10.1002/pi.5143
-
Upload
khangminh22 -
Category
Documents
-
view
4 -
download
0
Transcript of This paper must be cited as - RiuNet

Document downloaded from:
This paper must be cited as:
The final publication is available at
Copyright
Additional Information
http://doi.org/10.1002/pi.5143
http://hdl.handle.net/10251/97801
John Wiley & Sons
Valencia-Sullca, CE.; Jiménez Serrallé, M.; Jiménez Marco, A.; Atarés Huerta, LM.; Vargas,M.; Chiralt A. (2016). Influence of liposome encapsulated essentialoils on properties of chitosan films. Polymer International (Online). 65(8):979-987.doi:10.1002/pi.5143

INFLUENCE OF LIPOSOME ENCAPSULATED ESSENTIAL OILS ON
PROPERTIES OF CHITOSAN FILMS
Cristina Valencia-Sullca; Miriam Jiménez; Alberto Jiménez; Lorena Atarés;
Maria Vargas*; Amparo Chiralt
Instituto de Ingeniería de Alimentos para el Desarrollo, Departamento de Tecnología de
Alimentos, Universitat Politècnica de València, Camino de Vera s/n, 46022 Valencia, Spain
Abstract
The effect of the encapsulation of eugenol and cinnamon leaf essential oil
(CLEO) in lecithin liposomes on the losses of these compounds during the
chitosan film formation process by casting was evaluated. Film-forming
dispersions and films with eugenol or CLEO (either free or encapsulated) were
obtained and characterized. The content of eugenol in active films was
quantified by means of solvent extraction and GC analysis. The encapsulation
of eugenol or CLEO in lecithin liposomes led to the films retaining 40-50% of the
incorporated eugenol, whereas only 1-2% was retained when eugenol was
incorporated by direct emulsification. Films with liposomes exhibited a lamellar
microstructure which improved film extensibility and increased water vapour
barrier capacity with respect to those with free emulsified compounds.
Liposomes also modified the optical properties of the films, reducing their gloss,
increasing colour saturation and making them redder in colour. The
encapsulation of volatile active compounds in liposomes appears to be a good
strategy for obtaining antimicrobial films with essential oils.
Key Words: chitosan, eugenol, liposome, lecithin, cinnamon leaf essential oil,
encapsulation.
1. Introduction
Biopolymer films containing antioxidant/antimicrobial compounds, which can be
useful for the development of active packaging materials, are of great interest
for the purposes of food quality and safety preservation and as a means of
extending shelf-life. In this sense, the use of biodegradable polymers is
advisable in order to reduce the environmentally harmful effects caused by the
use of synthetic polymer-based packages and in order to limit the exploitation of
constantly shrinking oil reserves.[1]
Chitosan (CH) is a cationic, non-toxic, biodegradable polysaccharide,
compatible with other biopolymers, which film-forming properties have been
extensively studied.[2] This natural biopolymer can be obtained from the
deacetylation of the chitin present in crustacean exoskeletons, and it has
potential applications in the food industry on the basis of its described
characteristics and its antimicrobial properties. CH films exhibit good
mechanical and structural properties and constitute a good barrier to gases and
aromas.
The incorporation of essential oils (EO) into the chitosan matrix could improve
its functionality for food preservation purposes, since antimicrobial properties
would be enhanced at the same time as the water barrier capacity of the films
was improved, in line with the increase in the films’ hydrophobic fraction.[3]
Particularly, cinnamon leaf essential oil (CLEO) and its main compound,
eugenol, have been described as antibacterial and antifungal agents at
relatively low concentrations in previous studies.[4-6] The minimal inhibitory
concentration (MIC) of eugenol against Listeria monocytogenes and
Escherichia coli is 1.5 g/L and 1.0 g/L, respectively.[7] Eugenol has been
recognized as safe by the FDA (Food and Drug Administration)[8] and approved
by the European Union as a safe savoring agent for foods.[9]
Different essential oils have been widely used in the formulation of active
biodegradable films,[10] but, on top of their potential sensory impact on the
coated or packaged product, the losses of these volatile compounds during film
preparation represent an added problem.[11,12] EOs have been incorporated into
hydrophilic biopolymer films by emulsification in the aqueous film-forming
dispersion of the polymer before film formation, which was performed by casting
technique.[13,14] Nevertheless, during the film drying step, oil droplets flocculate,
coalesce and cream to the top of the drying film, where oil components volatilize
together with water at a lower temperature than their boiling point (steam
distillation).[3]
The encapsulation of essential oil compounds before film preparation can
mitigate both the losses and the sensory impact of EOs, also contributing to
modulate the release kinetics of actives into the product. In this sense, the use
of liposomes or nanoliposomes,[15] which can act as carrier systems of a wide
range of compounds, represent an interesting alternative. Nevertheless, the
presence of these lipid structures in the film matrix may affect the functional
(mechanical, barrier or optical) film properties as packaging material.
The aim of this study was to assess the effect of the encapsulation of eugenol
(Eu) and cinnamon leaf essential oil (CLEO) within lecithin nanoliposomes on
their retention in chitosan films during film formation, as compared to free
compounds. Likewise, the effects of the incorporation of nanoencapsulated

compounds on the film structur, physical properties and antimicrobial activity,
were analysed, in comparison with the free-form incorporation.
2. Materials and methods
2.1 Materials
High molecular weight chitosan (practical grade, >75% deacetylation degree,
Batch MKBP1333V, supplied by Sigma-Aldrich Chemie, Steinheim, Germany)
was used as film-forming polymer. Glacial acetic acid, magnesium nitrate-6-
hydrate and diethyl ether (ethanol stabilized) were supplied by Panreac
Química SLU (Castellar del Vallés, Barcelona, Spain). For nanoliposome
formulation, non-GMO sunflower seed lecithin with 20% phosphatidylcholine,
supplied by Lipoid H20 (Lipoid gmbh, Ludwigshafen, Germany) was used.
Cinnamon leaf oil (Herbes de Molí, Coop. V., Benimarfull, Alicante, Spain) and
its main component, eugenol (Sigma Aldrich Química S.L., Madrid, Spain) were
used as antimicrobial agents. SephadexR G50 and anhydrous sodium sulphate
were purchased from Sigma Aldrich Química S.L., (Madrid, Spain) and Triton
X100 from Carl Roth GmbH (Karlsruhe, Germany).
2.2. Preparation of nanoliposome dispersions
Preparation of nanoliposome dispersions was carried out according to a
previously described method.[15,16] Lecithin was dispersed in distilled water (5 wt
%) and stirred for 4 hours at 700 rpm. Eugenol or CLEO at 5 wt % was

incorporated to the lecithin dispersion and afterwards three different liposome
samples were obtained (Lec, Lec-Eu and Lec-CLEO) by sonication at 20 kHz
for 10 minutes with one-second pulses. The ultrasound probe was placed in the
center of the sample.
The encapsulation efficiency in the nanoliposome dispersions was determined.
To this end, Sephadex® gel filtration was conducted. Sephadex G50 (0.5g) was
added to swell in deionized water (10 mL) for 6h. A layer of about 5 cm of gel
was formed. In order to eliminate the excess water, the column was centrifuged
at 1,500rpm for 7 min (Medifriger-BL, P-Selecta, Barcelona, Spain). Finally, 1 ml
Lec-Eu or Lec-ClEO liposome sample was added on the top of the column and
the centrifugation was repeated. The gel-filtered liposomes were destabilized by
the addition of 3 mL of 0.15 w/v% Triton X100 followed by vortexing. The active
compounds were recovered by extraction with 2 ml diethylether and
centrifugation at 2000 rpm for 10 min, which were repeated three times. The
extract was dehydrated with anhydrous sodium sulphate, afterwards filtered and
dry nitrogen flow was used to eliminate the remaining solvent. Finally, the
extract was stored in a desiccator with silicagel, and the mass of encapsulated
active compound was determined. The results of encapsulation efficiency were
expressed as the ratio between the encapsulated and the incorporated active
compound.
2.3. Preparation of chitosan films with active compounds
A solution of 1% chitosan (w/w) was prepared in a 1% (v/w) acetic acid solution.
This was stirred at room temperature for 24 hours and then filtered with a sieve

(120m pore size). The active compounds (Eu and CLEO) were incorporated in
two different forms: either encapsulated in lecithin liposomes or by direct
emulsification. For this purpose, 0.5 g of active compound (Eu or CLEO), either
as free form or as lecithin liposomes (in this case 1.0 g of the active liposome
dispersion) were added to 90 g of the chitosan solution. In this way, a 26 or 36
wt % of Eu or CLEO in the film dry solids was obtained for films with and without
lecithin, respectively. This percentage was selected to overcome the values of
the minimal inhibitory concentration (MIC) of actives against some typical
patogens or food spoilage microorganisms[7,17] according to previuos studies
with chitosan films containg CLEO.[3] A control film with lecithin liposomes
without active compound was also obtained by incorporating to 0.5 g of lecithin
as liposome dispersion (26 wt % of the film solids).
Film-forming dispersions with liposomes were kept under stirring for 2 hours
before casting, while those containing free active compounds were
homogenized in an Ultraturrax homogenizer (Yellow Line Model DI 25 basic,
IKA, Germany) at 13,500 rpm for 4 minutes.
Thus, 6 film-forming dispersions (FFD) were obtained: pure chitosan (CH),
control with lecithin (CH/Lec), films with eugenol or cinnamon leaf essential oil,
non-encapsulated (CH/Eu and CH/CLEO) and encapsulated in lecithin (CH/Lec-
Eu and CH/Lec-CLEO). The FFDs were poured into 150 mm diameter Teflon
plates (1 g of solids per plate). The films were obtained by drying at 25 °C and
45% relative humidity.
Prior to characterization, the films were conditioned for one week at 53%
relative humidity, using saturated solutions of Mg (NO3)2, at 25 °C.
2.4. Characterization of nanoliposome and film-forming dispersions
Both nanoliposome and film-forming dispersions (ND and FFD) were
characterized in triplicate as to their density, ζ-potential and particle size. The
density of the different samples was measured using the pycnometer method.
In order to determine the diameter (z-average) and ζ-potential of
nanoliposomes, the samples were diluted in distilled water (1:100) and
measured at 25 °C in a Zetasizer Nano-Z device (Nano series model Zen 2600,
Malvern Instruments, Worcestershire, United Kingdom). This equipment
measures the electrophoretic mobility through light scattering caused by the
dispersed particles, and the ζ-potential is determined using the Smoluchowsky
model. All of the samples were measured in triplicate.
2.5 Film characterization
2.5.1. Eugenol retention in the films
Retention of the EO compounds in the films during the film formation was
determined through the total eugenol content in the films analysed by GC. To
this end, 0.3 g film samples were extracted with 10 mL of diethyl ether for 24
hours. This time was set after preliminary tests as the total extraction time. 2 l
of extracts were injected (injection temperature, 50 °C) in a gas chromatograph
(Hewlett Packard 6890 FID GC System) with flame ionization detector (GC-FID)
using a DB-5 column (30 mm x 0.32 mm of internal diameter); 0.25 µm film
thickness (V J & Scientifics, Agilent, Palo Alto, USA). Helium (1 mL / min) was
used as carrier gas. The heating schedule was: heating at 5ºC/min from 50 °C
to 130 °C, and holding at 130 °C for 5 min, followed by heating at 10ºC/min up
to 200ºC.[18] For the purposes of eugenol quantification, a calibration curve
using eugenol solutions in ethyl ether in the range of 50-2000 ppm was
obtained. The wt % of Eu in CLEO was also determined through GC analysis
under the same conditions. The amount of retained Eu in the films was
obtained. For films contining CLEO, the quantified Eu peak in each extract and
the corresponding Eu percentage in the CLEO were taken into account. Results
were expressed as the percentage of retained eugenol in the film (mass of
extracted compound/mass of incorporated compound).
2.5.2. Thickness
Film thickness was measured using a digital electronic micrometer (Palmer
model, Comecta S.A., Barcelona, Spain) to the nearest 0.0005 mm. Six
measurements per sample were taken performed in random positions, and the
results were used to analyze the tensile and barrier properties of the films.
2.5.3. Tensile properties
The tensile behaviour of films was tested by using a universal test Machine
(TA.XTplus model, Stable Micro Systems, Haslemere, England). The elastic
modulus (EM), tensile strength (TS) and elongation at fracture (%E) were
determined following ASTM standard method D882.[19] These parameters were
obtained from the stress-Henky strain curves calculated from the force-distance
data.
Equilibrated film strips (25 mm wide, 100 mm long) were mounted in the film-
extension grips of the testing machine and stretched at 50 mm min-1 until
breaking. At least eight replicates were obtained per formulation.
2.5.4. Moisture content, water vapor permeability and solubility
The moisture content of the films was determined using a gravimetric method.
Firstly, the film samples were dried in a convection oven at 60 °C for 24 h, and
then in a vacuum oven (Vacioterm-T, JP-selecta S.A., Barcelona, Spain) at 60
°C and 0.8 bar for 48 h. Finally, in order to remove the residual moisture, the
samples were conditioned in a dessicator with P2O5 till constant weight. The
results were expressed as g of water per 100 g of dry film.
The WVP of the films was determined by using the ASTM E96-95 gravimetric
method,[20] taking into account the modification proposed by other authors. [21]
Films were selected based on the lack of physical defects, such as cracks,
bubbles, or pinholes. Six samples per formulation were cut, and distilled water
was placed in Payne permeability cups (3.5 cm diameter, Elcometer SPRL,
Hermelle /s Argenteau, Belgium) to expose the film to 100% RH on one side.
Once the films were secured, each cup was placed in a relative humidity
equilibrated cabinet at 25 oC, with a fan placed on the top of the cup in order to
reduce resistance to water vapor transport. The RH of the cabinets (53%) was
held constant using oversaturated solutions of magnesium nitrate-6-hydrate.
The cups were weighed every 1.5 h for 24 h with an analytical scales (ME36S
Sartorius, Alemania - 0.0001 g). Once the steady state had been reached,
water vapor transmission rate was determined from the slope obtained from the
regression analysis of weight loss data versus time, divided by the film area.
WVP was obtained taking into account the average film thickness in each case.
The equation proposed by other studies[21] was used to correct the effect of
concentration gradients established in the stagnant air gap inside the cup.

In order to determine the film solubility, film samples were immersed in double
distilled water (film: water mass ratio 1:200), and kept at 25 °C for 24 hours.
After this, the films were dried in a convection oven (JP Selecta, SA Barcelona,
Spain) at 60°C for 24 hours. Finally, the film samples were dried in a vacuum
oven at 60 °C to constant mass. Solubility was expressed as the percentual loss
of the dry solids of the film by water solution, as rrefered to the initial mass of
the dry film.
2.5.5. Optical properties
The opacity of the films was determined by applying the Kubelka-Munk theory
for multiple scattering.[22,23] A spectrocolorimeter (CM-3600d Minolta CO.,
Tokyo) was used to obtain the reflection spectra of the films on a white (R) and
a black (R0) background between 400 and 700 nm, as well as the spectrum of
the white background used (Rg). From these spectra, the internal transmittance
(Ti, a transparency indicator) and R∞ (the reflectance of an infinitely thick film),
were calculated using equations (1) to (4). Three measurements were taken on
each film and three films were considered per formulation. From R∞ spectra, the
CIEL*a*b* color coordinates were determined using the 10° observer and the
D65 illuminant as reference.[23] Moreover, hue (hab*) and chroma (Cab*) were
calculated by using equations (5) and (6).
𝑇𝑖 = √(𝑎 + 𝑅0)2 − 𝑏2 (1)
a = 1
2· (R +
R0 − R + Rg
R0Rg) (2)

b = (a2 − 1)1/2 (3)
R∞ = a − b (4)
ℎ𝑎𝑏∗ = 𝑎𝑟𝑐𝑡𝑔 (
𝑏∗
𝑎∗) (5)
𝐶𝑎𝑏∗ = √a∗2 + b∗2 (6)
Gloss was measured using a flat surface gloss meter Multi Gloss 268 (Minolta,
Langenhagen, Germany) at a 60º angle of incidence according to ASTM D523
standard.[24] The film samples were placed on a matte black surface, and nine
measurements per formulation were taken on the side of the film that was
exposed to the atmosphere during drying.
2.5.6. Scanning electron microscopy (SEM)
The microstructural analysis of the cross-sections and surface images of the
films was carried out using a scanning electron microscope (model JEOL JSM-
5410, Japan). The film samples were maintained in desiccators with P2O5 in
order to eliminate film moisture. Film pieces (0.5 cm2 approximately) were
cryofractured by immersion in liquid nitrogen and mounted on copper stubs.
After gold coating, the samples were observed using an accelerating voltage of
10 kV.
2.5.6. Thermogravimetric analysis (TGA)
The thermal stability of the films was studied by TGA using a Mettler-Toledo
thermobalance (model TGA / SDTA 851e, Schwarzenbach, Switzerland).
Crushed film samples (3mg) were gradually heated at 7 °C / min from room

temperature to 600 °C under nitrogen flow (50 mL / min). The onset
temperature (T0) and maximum degradation rate temperature (Tmax) of the films
were registered in two replicates per formulation.
2.6. Antimicrobial activity
Listeria innocua (CECT 910) and Escherichia coli (CECT 101) were supplied by
the Spanish Type Culture Collection (CECT, Burjassot, Spain). These bacterial
cultures were regenerated (from a culture stored at -25 ºC) by transferring a
loopful into 10 mL of Tryptone Soy Broth (TSB, Scharlab, Barcelona, Spain) and
incubating at 37 ºC for 24 hours. From this culture, a 10 µL aliquot was again
transferred into 10 mL of TSB and grown at 37 ºC for 24 hours more in order to
obtain a culture in exponential phase of growth. Afterwards, this bacterial
culture was appropriately diluted in TSB tubes to get a target inoculum of 105
CFU/mL. Circular samples of 55 mm in diameter, obtained from the different
types of film formulations were placed on inoculated Tryptose Soya Agar plates
(solid medium test) and in Tryptose Soya Agar tubes (liquid medium test).
Inoculated tubes and plates without film were used as control samples.
Immediately after the inoculation and after 6 days at 10ºC the microbial counts
on Tryptone Soy Agar (TSA, Scharlab, Barcelona, Spain) plates were
determined. In the liquid medium tests (broth tubes), serial dilutions were made
and poured onto TSA dishes which were incubated for 24 hours at 37 ºC. For
the solid medium tests (agar plates) the dishes content was removed aseptically
and placed in a sterile plastic bag with 90 mL of Buffered Peptone Water. The
bags were homogenized with a Stomacher (Interscience BagMixer Stomacher
400 W Homogenizer, France). Serial dilutions were made and then poured into

TSA Petri dishes. Samples were incubated at 37ºC for 24 hours before colonies
were counted. All the tests were run in triplicate.
2.7. Statistical analysis
The statistical analysis of the data was performed through an analysis of
variance (ANOVA) using Statgraphics Centurion XVI.II. Fisher’s least significant
difference (LSD) procedure was used.
3. Results and discussion
3.1. Properties of nanoliposome and film-forming dispersions
The encapsulation degree in the nanoliposome dispersions was 98.2 ±0.7%,
without significant differences for the type of active (Eu or CLEO). So, the non-
encapsulated oil ratio was negligible in both cases, which indicates that the
direct incorporation of ND into the FFD is an adequate method for the
formulation of films with nanoliposomes.
The density and ζ-potential values of ND and FFD are shown in Table 1. No
significant differences were found for the density values of nanoliposome
dispersions with essential oil or with eugenol. The lecithin nanoliposomes
exhibited negative ζ-potential values, with a greater negative charge when the
active compounds were incorporated. The FFD had high positive values of ζ-
potential due to the charges of the chitosan chain with protonated amine groups
at low pH.[25,26] The FFD with liposomes exhibited the highest values of positive
ζ-potential, without no significant differences between them, which indicates that
the positively charged chitosan molecules adsorbed on the negatively charged
nanoliposomes, thus giving rise to a reversed surface charge and greater

values of ζ-potential than pure CH dispersions and those containing emulsified
compounds. On the other hand, the addition of emulsified active compounds
also promoted the increase in ζ-potential values, which indicates that CH
molecules also adsorb on the droplet surface, but to a lesser extent than on
negatively charged liposomes, due to the electrostatic interactions with the
positively charged chains. CH adsorption will contribute to the stability of the
liposomes during the film drying, in which water loss can lead to phase
transitions in the lipid structures,[27,28] releasing the encapsulated material.
The size distribution of lipid particles dispersed in the film-forming emulsions
affects the properties of the final film, such as water vapor permeability and
mechanical properties.[29] Figure 1 shows the particle size distribution in the
obtained liposome dispersions, and the zeta average size values in the three
nanoliposome dispersions, where significant differences can be seen (p <0.05).
Incorporating eugenol or essential oil to liposomes led to an increase in the size
of the smaller particles, hence an increase in the average zeta size.
Nevertheless, no notable differences were observed for size distributions of
liposomes loaded with both components. Pure lecithin nanoliposomes had the
smallest average size (90.6 nm) and the incorporation of the active compounds
resulted in larger particles due to their incorporation in the liposome core. The
size of lipid associations in an aqueous medium tends to increase as the
hydrophobic nature of their molecules increases.[30,31]
3.2. Film properties
3.2.1. Eugenol and essential oil retention

Table 2 shows the amount of active compound extracted from the films, the
nominal mass of active compound added to the film sample and the respective
percentage retention (with respect to the initial amount) in each sample. The
encapsulation of the active compounds in lecithin liposomes greatly reduced the
loss of the active compounds during the film drying step, and 40-50% of the
incorporated eugenol was retained in the film. This indicates the effectiveness
of this strategy as a means of preventing the losses of volatile compounds
during the film drying. The highest eugenol retention (51%) was obtained from
the films containing encapsulated cinnamon leaf oil, which may be due to the
predominant loss of other, more volatile essential oil compounds during the
drying step. On the other hand, in the films with non-encapsulated active
compounds, eugenol losses reached 99% of the added amount, which implies a
final content in the dried film of 0.6 wt % of the total solids. This amount is very
low and suggests that a part of the active could be bonded to the polymer
matrix and it was not extracted by the solvent. Nevertheless, the obtained
results demonstrate the efficacy of liposome encapsulation to limit volatile
losses during the film preparation process.
3.2.2. Thickness and tensile properties
Table 3 shows the thickness and tensile parameters of the films. The chitosan
film thickness ranged between 33 and 49 m, and it decreased when free
essential oils were incorporated. This is coherent with the partial volatilization of
the oils, involving an effective reduction in the amount of solids per area unit of
the film. The addition of encapsulated compounds provoked an increase in the
films’ thickness with respect to pure chitosan in line with the lower losses of

volatiles and a different microstructural arrangement of the film components as
previously observed by other authors.[16]
The elastic modulus (EM), tensile strength (TS) and deformation at break (%E)
describe the tensile properties of the films, which are closely related to their
structure.[32] The EM significantly decreased subsequent to the addition of
lecithin liposomes, both single and loaded with actives, which can be attributed
to the interruptions in the polymer matrix introduced by lipid particles. This leads
to a loss of network cohesion, as observed by other authors when studying
different matrices.[30,31] Adding non-encapsulated oils only caused a slight EM
reduction, which can be explained by the lower lipid ratio and the arrangement
of the lipid droplets in the film matrix. Whereas TS and %E were not affected by
the addition of non-encapsulated oils, the films with liposomes exhibited
increased extensibility, with similar TS values to the CH control film. Pure
chitosan films were mechanically stronger and less extensible than films with
liposomes. This different behavior may be explained by the different structural
arrangement of components, as commented on below.
3.2.3. Moisture content, water vapor permeability and solubility
Water vapor permeability (WVP) is a relevant property directly related to the
usefulness of the film in food applications, and should be as low as possible to
prevent the transfer of water.[33] Table 4 shows the moisture content, water
vapor permeability and solubility of the films. The equilibrium moisture content
of the films decreased significantly when both free and encapsulated lipid
compounds were added, since the proportion of active sites for water
adsorption per unit dry mass decreases.[34] Likewise, possible interactions
between the chitosan chains and the active compounds could reduce the

availability of the chitosan polar groups to form hydrophilic bonds with water
molecules.[35] As compared to the films with non-encapsulated active
compounds, lecithin incorporation resulted in a significant WVP decrease. A
different final amount of lipid in the films, as well as the differences in their
structural arrangement, may explain their different effectiveness at reducing
water vapor permeability. Film solubility in water was also significantly reduced
by the addition of lipids (lecithin or EO compounds); the greater the total lipid
content, the lower the solubility values, coherently with the increased
hydrophobic character of the film.[36]
3.2.4. Optical properties
According to other studies,[23] the transparency and brightness of the material
are the most important optical properties with which to assess the direct impact
on the appreciation of the color and appearance of a coated/packaged product.
Table 4 shows the values of lightness (L*), chroma (C*ab), hue (h*ab) and gloss
at 60° of the different samples. Due to the typical color of lecithin, films with
liposomes were darker, with a more saturated reddish color than the pure
chitosan films. This effect was also previously observed in starch-sodium
caseinate films with lecithin liposomes.[16] The gloss was decreased by
incorporating active compounds, especially in free form, which can be attributed
to the increase in surface roughness associated with the creaming of lipids
during drying, as previously observed for lipid containing films.[31,37]
Figure 2 shows the spectral distribution curves of Ti. The incorporation of free
lipids, and particularly the incorporation of liposomes, reduced the Ti of the
films; in line with the presence of a dispersed phase in the matrix which

enhances light scattering. In the case of liposomes, the absorbance of lecithin
also contributes to lower the transmittance of the films.
3.2.5. Microstructural properties
A microstructural study of the films allows the arrangement of the components
in the dry films to be observed, and correlates these observations with other
functional-characteristics, such as the barrier, mechanical and optical
properties.[38] Figures 3 and 4 show the micrographs of the cross section and
surface of the obtained films, respectively. The holes corresponding to eugenol
or oil droplets in the cross section of the films can be seen when these are
incorporated in free form (CH/Eu, CH/CLEO). On the surface of the films with
these free compounds, some droplet footprint can also be observed, whereas
the films with liposomes show a smoother surface. These holes were probably
caused by the evaporation of the volatile compounds during the film drying or
during SEM observation under high vacuum conditions. On the other hand,
when active compounds are incorporated in liposome form, no visible drops can
be seen in the structure whereas laminar formations can be observed, where
void layers intercalate with polymer fibrous arrangements. This appearance
suggests that lamellar liposomal lipid associations were formed during the film
drying step, in line with the liotropic mesomorphism of lipid associations, [28]
which would be inserted between the polymer layers producing a laminated
structure. In this arrangement, eugenol or cinnamon essential oil would occupy
the hydrophobic core of the laminar structures. CH/Lec films also exhibited a
laminar structure, but the separation between layers expands when there is
eugenol or essential oil in the formulation. So, as the water content in the FFD
is reduced during film drying, the micellar associations undergo phase

transitions and lamellar structures tend to form, containing lipids at the
hydrophobic core.[27]
This laminar structure explains the greater elongation capability of the films
containing liposomes during the tensile test, especially those containing
eugenol or essential oil, since the layers can easily slide during the test, hence
allowing for a greater deformation before fracture. However, the weaker
cohesive force between layers, as compared to that acting between polymer
chains, would lead to softer films (less resistant to deformation) with lower
elastic modulus, as shown in Table 3. Likewise, the formation of lipid layers
perpendicular to the mass transport in the film, also explains the great reduction
in the water vapour permeability and water solubility of the films when
liposomes were added to the film formulation.
3.2.6. Thermogravimetric analysis (TGA)
Figure 5 shows the thermal degradation curves (derivative curve: DTGA) of
chitosan films, where three stages can be observed. The first mass loss step
below about 100ºC is due to the evaporation of residual water from the films.
The second step can either be attributed to the degradation/volatilization of low
molecular weight fractions, such as volatile compounds and lecithin, or to the
losses of some groups (such as NH2) from chitosan chains, and the third step is
associated with the decomposition of polymer units, as observed by other
authors.[35] Films containing lecithin exhibited greater weight loss in the second
stage, which can be attributed to the gradual decomposition of lecithin (about
20% weight loss at 270ºC) as deduced from the TGA of pure lecithin. The
boiling point of eugenol is 253 ºC,[39] which implies that when Eu or CLEO are
present in the film, their thermal release would overlap with the polymer’s
degradation temperature range.
Table 6 shows the onset temperature (T0) and maximum degradation rate
temperature (Tmax) of the polymer for the different films. The onset and Tmax
temperature values of polymer decomposition were hardly affected by the lipid
presence, which indicates that no strong interactions occurred among lipid
molecules and polymer chains. Nevertheless, the thermal degradation of lipid
components affected the thermogram shape. The films with free eugenol or
CLEO had the highest onset temperature and degradation rate of the polymer,
which could indicate that the eugenol remaining in the film may be strongly
bonded to the polymer chains, thus affecting their thermal behavior. In this
sense, its extraction could be limited, this contributing to the very low retention
determined, as previously comented.
3.3. Antimicrobial activity
Table 7 and 8 show E. coli and L. innocua counts, respectively, immediately
after the inoculation of the bacterial culture (0 days) and after 6 days of cold
storage. Microbial counts were significantly reduced by film application right
after the inoculation. The higher antibacterial effect (lower bacterial counts) was
obtained for E. coli, which is in agreement with the greatest antimicrobial effect
of chitosan against Gram – negative bacteria40, as compared to Gram -positive
bacteria such as L innocua. In the liquid medium, the application of films
containing the active compound led to no bacterial growth during the whole
period of cold storage, for both E. coli and L. Innocua. This can be explained by
the solution of the film matrix and the rapid release of the active compound. In
the agar plates, immediately after inoculation, samples coated with films
containing eugenol or cinnamon leaf essential oil led to a signficant reduction in
the growth of both bacteria as compared to those non-coated (control) and
those coated with CH or CH/Lec. In samples coated with films containg the
active compouns no growth was detected at the end of the storage period.
4. Conclusions
The incorporation of lecithin liposomes containing eugenol or cinnamon leaf
essential oil into chitosan films obtained by casting allowed for a high retention
ratio (40-50%) of volatile compounds, as compared to the 1-2% which is
retained when they are free incorporated by emulsification. Films with
liposomes exhibited a lamellar microstructure where lipid lecithin layers seem to
alternate with polymer layers, due to the liposome phase transitions during the
progressive film drying. This microstructure improved the extensibility of the
films, while reducing their firmness and water vapor permeability. Liposome
incorporation modified the optical properties of the films; the gloss was reduced,
chrome was increased and the films became reddish, coherently with the
chromatic properties of lecithin. The addition of the active compounds enhanced
the antimicrobial activity of pure chitosan films for both, free or lecithin
encapsulated form. Encapsulation did not affect the effective release of actives
to exert the antimicrobial effect. Therefore, the encapsulation of volatile active
compounds in liposomes emerges as a good strategy for the obtention of active
films with essential oils.
5. Acknowledgements

The authors acknowledge the financial support provided by the Ministerio de
Economía y Competitividad (Project AGL2013-42989-R). Cristina Valencia
Sullca thanks the Programa Nacional de Becas del Perú (Pronabec) for the
completion of her doctoral thesis.
6. References
1. Jiménez A, Fabra MJ, Talens P and Chiralt A, J. Food Eng. 116(3): 695-
702 (2013).
http://dx.doi.org/10.1016/j.jfoodeng.2013.01.010
2. Zhai M, Zhao L, Yoshii F and Kume T, Carbohydr. Polym. 57(1): 83-88
(2004).
http://dx.doi.org/10.1016/j.carbpol.2004.04.003
3. Perdones Á, Vargas M, Atarés L and Chiralt A, Food Hydrocolloids 36:
256-264 (2014).
http://dx.doi.org/10.1016/j.foodhyd.2013.10.003
4. Singh G, Maurya S, de Lampasona MP and Catalan CAN, Food Chem.
Toxicol. 45: 1650-1661 (2007).
doi:10.1016/j.fct.2007.02.031
5. De Martino L, De Feo V, Fratianni F and Nazzaro F, Natural Product
Communications 4: 1741–1750 (2009).
ISSN 1934-578X
6. Bajpai VK, Baek KH and Kang SC, Food Res. Int. 45, 722–734 (2012).
doi:10.1016/j.foodres.2011.04.052
7. Shah B, Davidson M and Zhong Q, Int. J. Food Microbiol. 161: 53-59
(2013).
http://dx.doi.org/10.1016/j.ijfoodmicro.2012.11.020
8. FDA, US Food and Drug Administration. Code of Federal Regulations,
Title 21-Food and Drugs, Part 172, Subpart F, Section 172.515 (2009).
9. Sebaaly C, Jraij A, Fessi H, Charcosset C and Greige-Gerges H, Food
Chem. 178: 52-62 (2015).
http://dx.doi.org/10.1016/j.foodchem.2015.01.067
10. Atares L and Chiralt A, Trends Food Sci Technol. 48: 51-62 (2016).
doi:10.1016/j.tifs.2015.12.001
11. Sánchez-González L, Chiralt A, González-Martínez C and Cháfer M, J.
Food Eng. 105(2): 246-253 (2011).
http://dx.doi.org/10.1016/j.jfoodeng.2011.02.028
12. Bakkali F, Averbeck S, Averbeck D and Idaomar M, Food Chem. Toxicol.
46(2): 446-475 (2008).
http://dx.doi.org/10.1016/j.fct.2007.09.106
13. Wu J, Liu H, Ge S, Wang S, Qin Z, Chen L, Zheng Q, Liu Q and Zhang
Q, Food Hydrocolloids 43: 427-435 (2015).
http://dx.doi.org/10.1016/j.foodhyd.2014.06.017
14. Imran M, Revol-Junelles AM, René N, Jamshidian M, Akhtar MJ, Arab-
Tehrany E and Desobry S, Food Hydrocolloids 29(2): 407-419 (2012).
http://dx.doi.org/10.1016/j.foodhyd.2012.04.010
15. Zhang HY, Tehrany EA, Kahn CJF, Ponçot M, Linder M and Cleymand
F, Carbohydr. Polym. 88: 618-627 (2012).
http://dx.doi.org/10.1016/j.carbpol.2012.01.007
16. Jiménez A, Sánchez-González L, Desobry S, Chiralt A and Tehrany EA,
Food Hydrocolloids 35: 159-169 (2014).
http://dx.doi.org/10.1016/j.foodhyd.2013.05.006
17. Olasupo NA, Fitzgerald DJ, Gasson MJ and Narbad A, Lett. Appl.
Microbiol. 37: 448–451(2003).
doi: 10.1046/j.1472-765X.2003.01427.x

18. Alma HM, Ertas M, Nitz S and Kollmannsberger H, BioResources
2(2):265-269 (2007).
ISSN: 1930-2126
19. ASTM, Standard test method for tensile properties of thin plastic
sheeting, Standard D882, In Annual book of American standard testing
methods, Philadelphia, PA: American Society for Testing and Materials,
pp. 162-170 (2001).
View Record in Scopus
20. ASTM, Standard test methods for water vapour transmission of
materials, Standard designations: E96-95 Annual book of ASTM
standards, Philadelphia, PA: American Society for Testing and Materials,
pp. 406-413 (1995).
View Record in Scopus
21. Mc Hugh TH, Avena‐Bustillos R and Krochta JM, J. Food Sci. 58(4): 899-
903 (1993).
http://dx.doi.org/10.1111/j.1365-2621.1993.tb09387.x
22. Judd DB and Wyszecki G. Colour in business, science and industry, 3rd
edition, New York, NY: John Wiley and Sons, Inc., ISBN 0471452122
(1975).
23. Hutchings JB, Food and colour appearance, 2nd edition, Gaithersburg,
MD: Chapman and Hall Food Science Book, Aspen Publication (1999).
ISBN: 978-1-4613-6007-0 (Print) 978-1-4615-2373-4 (Online)
http://dx.doi.org/10.1007/978-1-4615-2373-4
24. ASTM, Standard test method for specular gloss, In Designation (D523),
Annual book of ASTM standards, Vol. 06.01, Philadelphia, PA: American
Society for Testing and Materials (1999).

25. Falguera V, Quintero JP, Jiménez A, Muñoz JA and Ibarz A, Trends
Food Sci. Technol. 22(6): 292-303 (2011).
http://dx.doi.org/10.1016/j.tifs.2011.02.004
26. Leceta I, Guerrero P and De la Caba K, Carbohydr. Polym. 93(1): 339-
346 (2013).
http://dx.doi.org/10.1016/j.carbpol.2012.04.031
27. Krog NJ, Food emulsifiers and their chemical and physical properties, In
Larsson EDK and Friberg SE (Eds.), Food emulsions. New York and
Basel: Marcel Dekker, Inc., pp.127-180 (1990).
28. Larsson K and Dejmek P, Crystal and liquid crystal structures of lipids, In
Larsson EDK and Friberg SE (Eds.), Food emulsions. New York and
Basel: Marcel Dekker, Inc., pp.97-125 (1990).
29. Pérez-Gago MB and Krochta JM, J Agric Food Chem. 49: 996–1002
(2001).
http://dx.doi.org/10.1021/jf000615f
30. Fabra MJ, Talens P and Chiralt A, J. Food Eng. 85(3): 393-400 (2008).
http://dx.doi.org/10.1016/j.jfoodeng.2007.07.022
31. Sánchez-González L, Vargas M, González-Martínez C, Chiralt A and
Cháfer M, Food Hydrocolloids 23(8): 2102-2109 (2009).
http://dx.doi.org/10.1016/j.foodhyd.2009.05.006
32. Mc Hugh TH and Krochta JM, J. Am. Oil Chem. Soc. 71(3): 307-312
(1994).
http://dx.doi.org/10.1007/BF02638058
33. Ma X, Chang PR and Yu J, Carbohydr. Polym. 72(3): 369-375 (2008).
http://dx.doi.org/10.1016/j.carbpol.2007.09.002
34. Fabra MJ, Talens P and Chiralt A, Food Hydrocolloids 24(4): 384-
391(2010).
http://dx.doi.org/10.1016/j.foodhyd.2009.11.004
35. Shen Z and Kamdem DP, Int. J. Biol. Macromol. 74: 289-296 (2015).
http://dx.doi.org/10.1016/j.ijbiomac.2014.11.046
36. Ojagh SM, Rezaei M, Razavi SH and Hashem SM, Food Chem.
122:161–166 (2010).
doi:10.1016/j.foodchem.2010.02.033
37. Fabra MJ, Talens P and Chiralt A, Food Hydrocolloids 23(3): 676-683
(2009).
http://dx.doi.org/10.1016/j.foodhyd.2008.04.015
38. Cano A, Jiménez A, Cháfer M, Gónzalez C and Chiralt A, Carbohydr.
Polym. 111: 543-555 (2014).
http://dx.doi.org/10.1016/j.carbpol.2014.04.075
39. Van Roon A, Parsons JR and Govers HAJ, J. Chromatogr. A. 955: 105–
115 (2002).
http://dx.doi.org/10.1016/S0021-9673(02)00200-5
40. Devlieghere, A. Vermeulen and J. Debevere, Food Microbiology. 21:
703-714 (2004).
http://dx.doi.org/10.1016/j.fm.2004.02.008

Figures
Figure 1. Typical particle size distribution curves of the nanoliposome
dispersions Lec: lecithin, Eu: eugenol, CLEO: cinnamon leaf essential oil.
0
2
4
6
8
10
12
0.1 1 10 100 1000 10000
Vo
lum
e (
%)
Particle size (nm)
Lec
Lec-Eu
Lec-CLEO
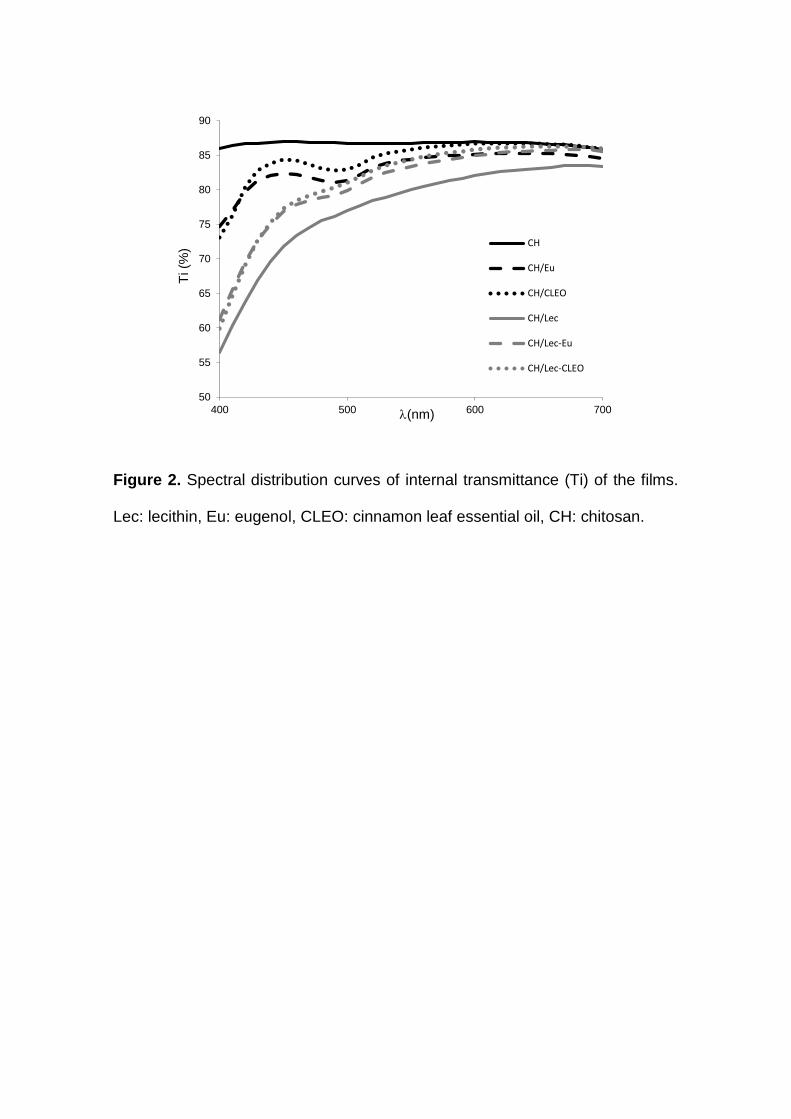
Figure 2. Spectral distribution curves of internal transmittance (Ti) of the films.
Lec: lecithin, Eu: eugenol, CLEO: cinnamon leaf essential oil, CH: chitosan.
50
55
60
65
70
75
80
85
90
400 500 600 700
Ti (%
)
l(nm)
CH
CH/Eu
CH/CLEO
CH/Lec
CH/Lec-Eu
CH/Lec-CLEO

Figure 3: SEM micrographs of the cross section of the chitosan films with and
without eugenol and cinnamon leaf essential oil in free form (left) or lecithin
liposomes (right). Lec: lecithin, Eu: eugenol, CLEO: cinnamon leaf essential oil,
CH: chitosan.
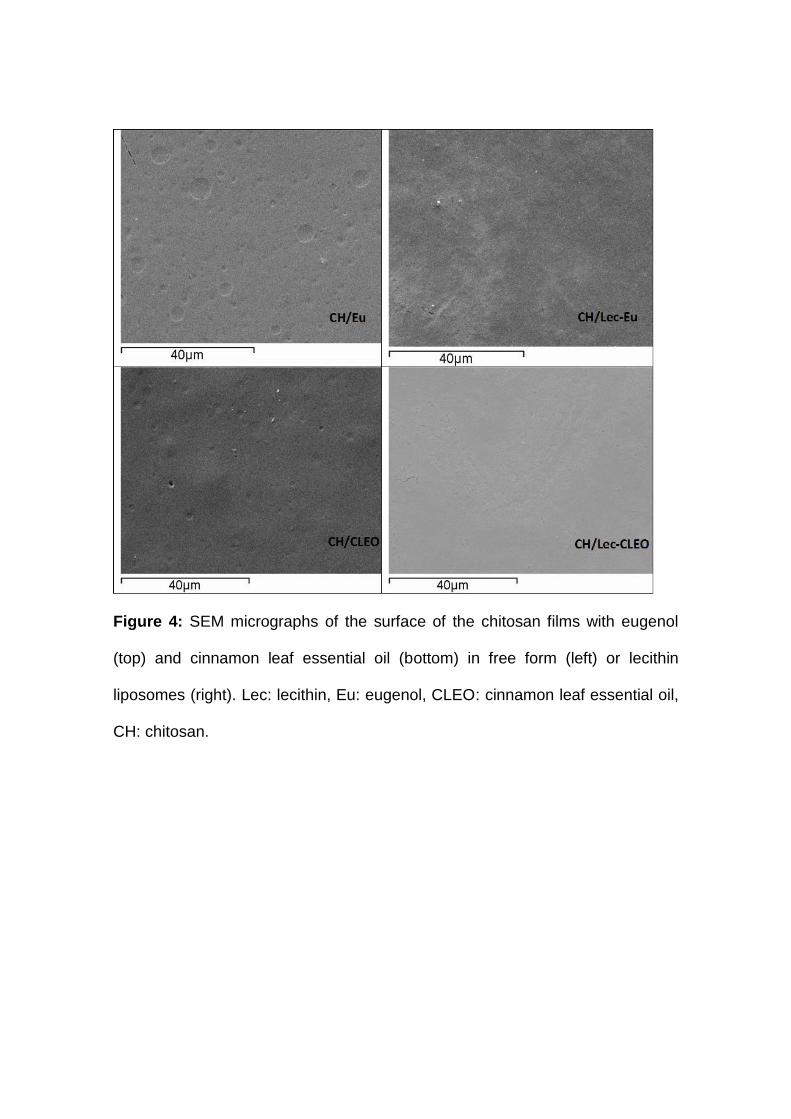
Figure 4: SEM micrographs of the surface of the chitosan films with eugenol
(top) and cinnamon leaf essential oil (bottom) in free form (left) or lecithin
liposomes (right). Lec: lecithin, Eu: eugenol, CLEO: cinnamon leaf essential oil,
CH: chitosan.

Figure 5. First derivative of weight loss vs. temperature curves obtained from
TGA. Lec: lecithin, Eu: eugenol, CLEO: cinnamon leaf essential oil, CH:
chitosan.

Table 1. Density and ζ-potential of nanoliposome dispersions (ND) and film-forming dispersions (FFD). Mean values and standard deviation. Lec: lecithin, Eu: eugenol, CLEO: cinnamon leaf essential oil, CH: chitosan.
ND ρ (kg/m3) ζ- Potencial
(mV)
Lec 1007 ± 2a -35.1 ± 1.6c
Lec-Eu 1009 ± 1a -43.0 ± 0.7a
Lec-CLEO 1009 ± 2a -41.4 ± 0.5b
FFD ρ (kg/m3) ζ (mV)
CH 1004 ± 3a 30.3 ± 1.4a
CH/Eu 1006 ± 1a 43 ± 3b
CH/CLEO 1006 ± 1a 57 ± 2c
CH/Lec 1018 ± 2b 65 ± 3d
CH/Lec-Eu 1005 ± 1a 66.4 ± 0.3d
CH/Lec-CLEO 1005 ± 1a 67.3 ± 0.5d
Different superscript letters (a, b, c, d) within the same column indicate significant differences among formulations (p < 0.05).

Table 2. Mass fraction of eugenol in the dried films (mg/g film solids), extracted in the dried film and initially incorporated, and percentage retention (extracted with respect to the initially added). Lec: lecithin, Eu: eugenol, CLEO: cinnamon leaf essential oil, CH: chitosan.
Film Extracted Incorporated % Retention
CH/Eu 4.9 ± 1.0b 357 1
CH/Lec-Eu 108.9 ± 1.3c 263 41
CH/CLEO 5.4 ± 1.3d 318 2
CH/Lec-CLEO 118 ± 3e 234 51
Different superscript letters (a, b, c) within the same column indicate significant differences among formulations (p < 0.05).

Table 3. Thickness and tensile parameters (elastic modulus, EM; tensile strength, TS; percentage elongation, %E) of the films. Mean values and standard deviation. Lec: lecithin, Eu: eugenol, CLEO: cinnamon leaf essential oil, CH: chitosan.
Film Thickness
(µm) EM (MPa) TS (MPa) %E
CH 43 ± 2b 1660 ± 170d 53 ± 4b 6 ± 1a
CH/Eu 33 ± 2a 1623 ± 70d 46 ± 4ab 8 ± 3a
CH/CLEO 35 ± 2a 1460 ± 30c 42 ± 3a 7 ± 4a
CH/Lec 45 ± 1b 1145 ± 4b 41 ± 1a 11 ± 3a
CH/Lec-Eu 48 ± 2c 840 ± 80a 51 ± 10b 31 ± 8b
CH/Lec-CLEO 49 ± 2c 860 ± 70a 43 ± 3a 27 ± 4b
Different superscript letters (a, b, c) within the same column indicate significant differences among formulations (p < 0.05).
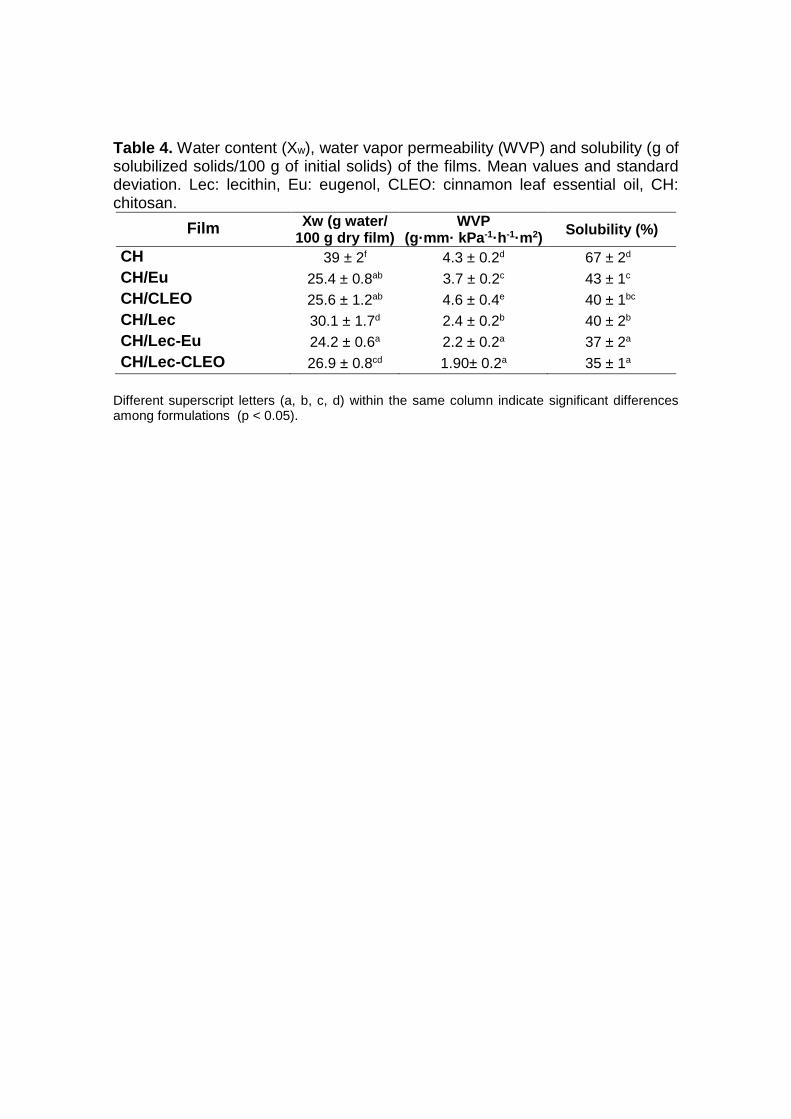
Table 4. Water content (Xw), water vapor permeability (WVP) and solubility (g of solubilized solids/100 g of initial solids) of the films. Mean values and standard deviation. Lec: lecithin, Eu: eugenol, CLEO: cinnamon leaf essential oil, CH: chitosan.
Film Xw (g water/
100 g dry film) WVP
(g·mm· kPa-1·h-1·m2) Solubility (%)
CH 39 ± 2f 4.3 ± 0.2d 67 ± 2d
CH/Eu 25.4 ± 0.8ab 3.7 ± 0.2c 43 ± 1c
CH/CLEO 25.6 ± 1.2ab 4.6 ± 0.4e 40 ± 1bc
CH/Lec 30.1 ± 1.7d 2.4 ± 0.2b 40 ± 2b
CH/Lec-Eu 24.2 ± 0.6a 2.2 ± 0.2a 37 ± 2a
CH/Lec-CLEO 26.9 ± 0.8cd 1.90± 0.2a 35 ± 1a
Different superscript letters (a, b, c, d) within the same column indicate significant differences among formulations (p < 0.05).

Table 5. Lightness (L*), chroma (C*ab), hue (h*ab) and gloss (60°) of the films. Mean values and standard deviation. Lec: lecithin, Eu: eugenol, CLEO: cinnamon leaf essential oil, CH: chitosan.
Film L* C*ab h*ab Gloss (60°)
CH 91 ± 2e 4 ± 2a 109 ± 5c 51 ± 6d
CH/Eu 75 ± 4cd 14 ± 6b 66 ± 6a 19 ± 2b
CH/CLEO 77.3 ± 1.3d 15.0 ± 1.3b 66 ± 2a 15 ± 3a
CH/Lec 67.4 ± 1.1a 23.0 ± 0.2c 80.4 ± 0.7c 33 ± 2c
CH/Lec-Eu 69.6 ± 1.1ab 23.0 ± 0.3c 78.4 ± 0.3c 15 ± 2a
CH/Lec-CLEO 72.0 ± 0.3bc 26.3 ± 0.4c 80.0 ± 0.2c 20 ± 3b
Different superscript letters (a, b, c, d) within the same column indicate significant differences among formulations (p < 0.05).
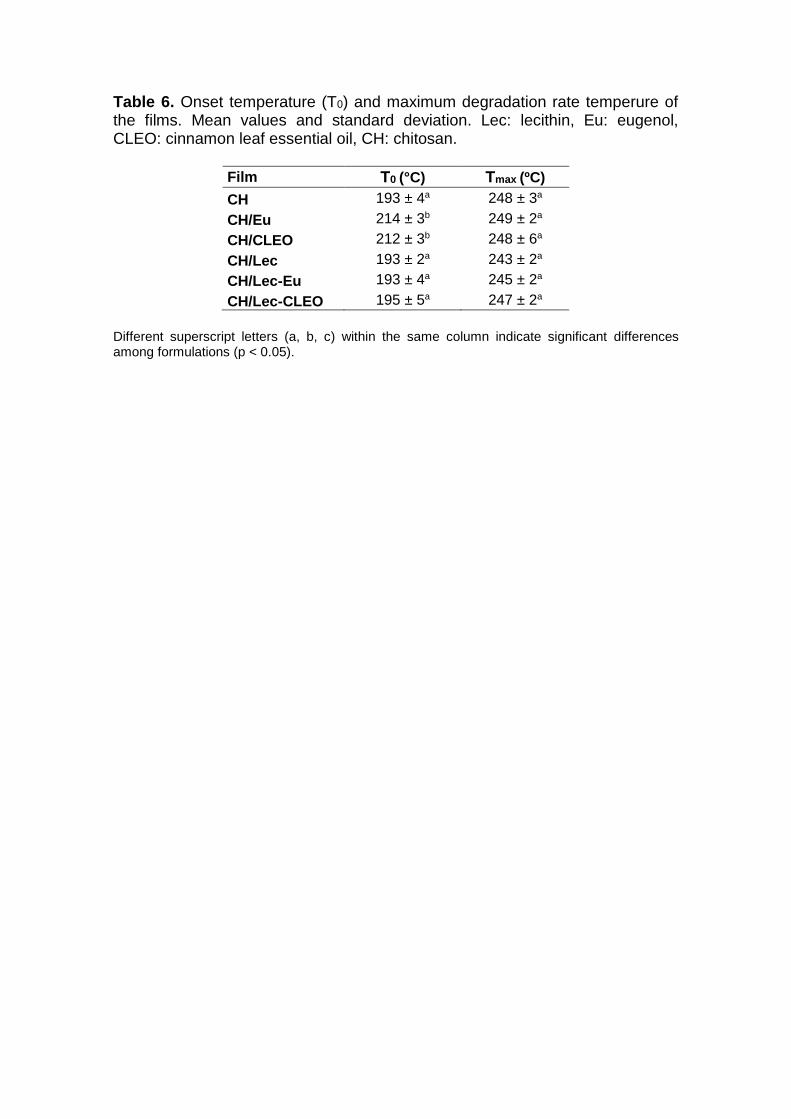
Table 6. Onset temperature (T0) and maximum degradation rate temperure of the films. Mean values and standard deviation. Lec: lecithin, Eu: eugenol, CLEO: cinnamon leaf essential oil, CH: chitosan.
Film T0 (°C) Tmax (ºC)
CH 193 ± 4a 248 ± 3a
CH/Eu 214 ± 3b 249 ± 2a
CH/CLEO 212 ± 3b 248 ± 6a
CH/Lec 193 ± 2a 243 ± 2a
CH/Lec-Eu 193 ± 4a 245 ± 2a
CH/Lec-CLEO 195 ± 5a 247 ± 2a
Different superscript letters (a, b, c) within the same column indicate significant differences among formulations (p < 0.05).
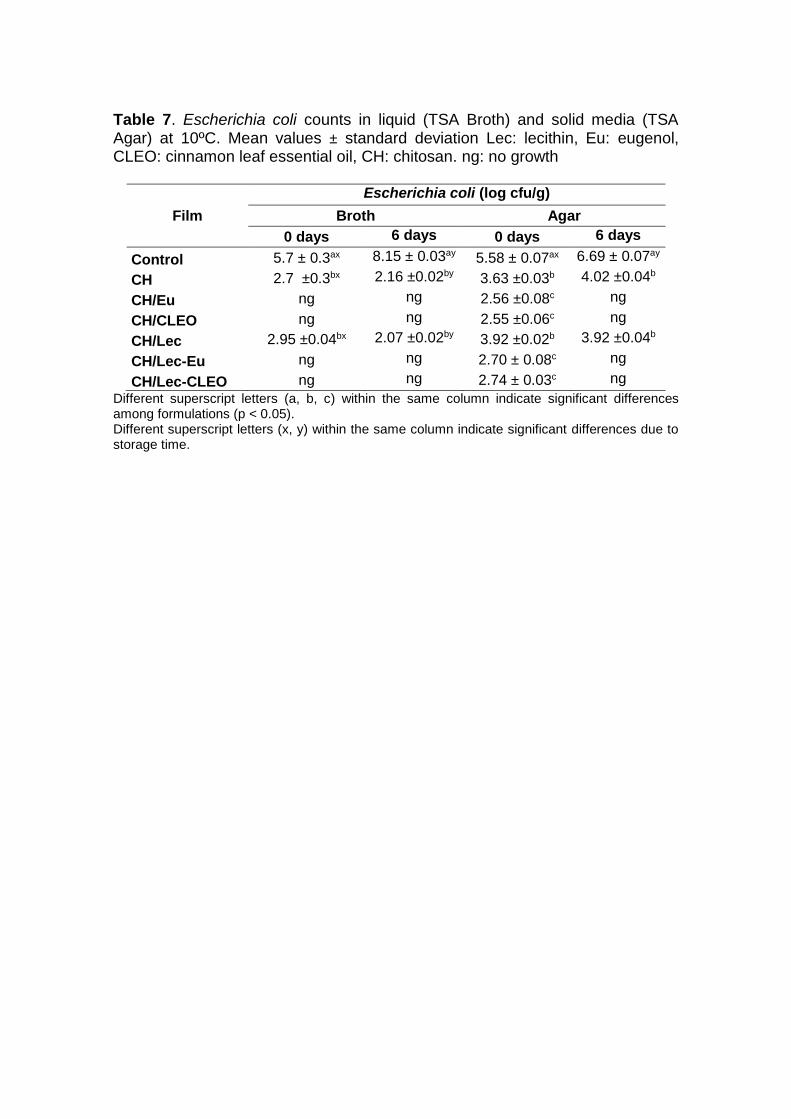
Table 7. Escherichia coli counts in liquid (TSA Broth) and solid media (TSA Agar) at 10ºC. Mean values ± standard deviation Lec: lecithin, Eu: eugenol, CLEO: cinnamon leaf essential oil, CH: chitosan. ng: no growth
Film
Escherichia coli (log cfu/g)
Broth Agar
0 days 6 days 0 days 6 days
Control 5.7 ± 0.3ax 8.15 ± 0.03ay 5.58 ± 0.07ax 6.69 ± 0.07ay
CH 2.7 ±0.3bx 2.16 ±0.02by 3.63 ±0.03b 4.02 ±0.04b
CH/Eu ng ng 2.56 ±0.08c ng
CH/CLEO ng ng 2.55 ±0.06c ng
CH/Lec 2.95 ±0.04bx 2.07 ±0.02by 3.92 ±0.02b 3.92 ±0.04b
CH/Lec-Eu ng ng 2.70 ± 0.08c ng
CH/Lec-CLEO ng ng 2.74 ± 0.03c ng
Different superscript letters (a, b, c) within the same column indicate significant differences among formulations (p < 0.05). Different superscript letters (x, y) within the same column indicate significant differences due to storage time.
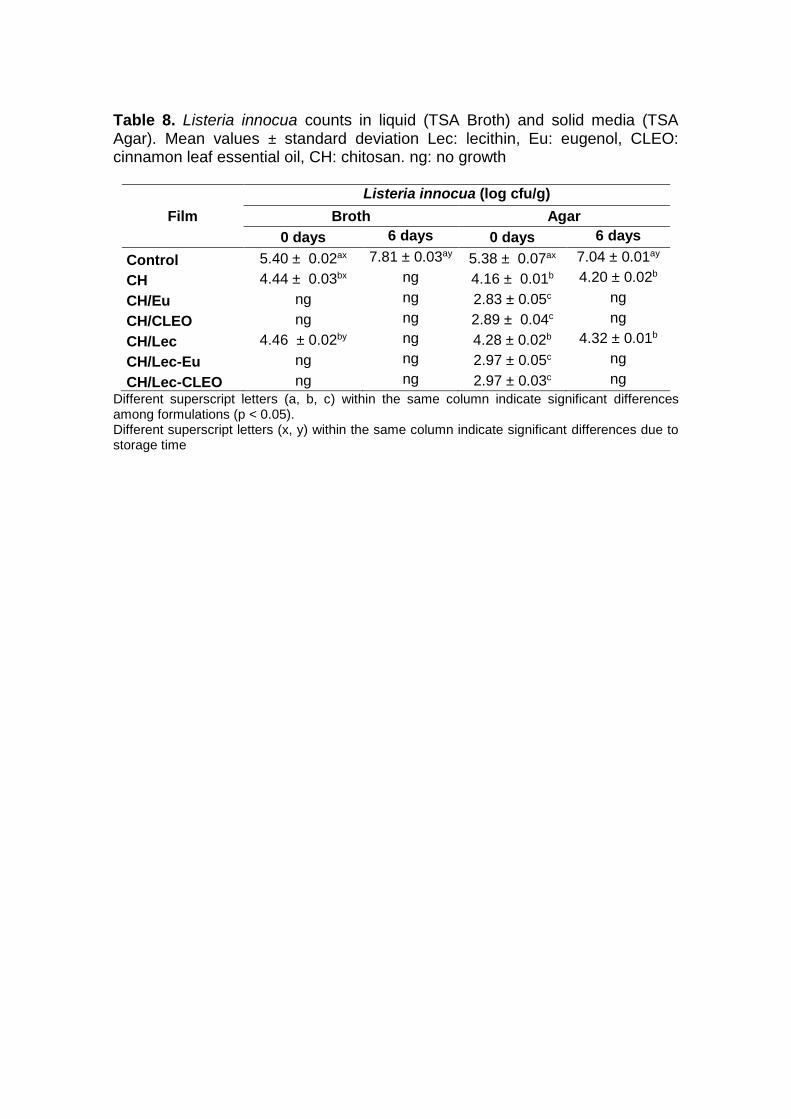
Table 8. Listeria innocua counts in liquid (TSA Broth) and solid media (TSA Agar). Mean values ± standard deviation Lec: lecithin, Eu: eugenol, CLEO: cinnamon leaf essential oil, CH: chitosan. ng: no growth
Film
Listeria innocua (log cfu/g)
Broth Agar
0 days 6 days 0 days 6 days
Control 5.40 ± 0.02ax 7.81 ± 0.03ay 5.38 ± 0.07ax 7.04 ± 0.01ay
CH 4.44 ± 0.03bx ng 4.16 ± 0.01b 4.20 ± 0.02b
CH/Eu ng ng 2.83 ± 0.05c ng
CH/CLEO ng ng 2.89 ± 0.04c ng
CH/Lec 4.46 ± 0.02by ng 4.28 ± 0.02b 4.32 ± 0.01b
CH/Lec-Eu ng ng 2.97 ± 0.05c ng
CH/Lec-CLEO ng ng 2.97 ± 0.03c ng
Different superscript letters (a, b, c) within the same column indicate significant differences among formulations (p < 0.05). Different superscript letters (x, y) within the same column indicate significant differences due to storage time