THIRD UPDATE - Groupe Société Générale
56
A French corporation with share capital of EUR 1,007,625,077.50 Registered office: 29 boulevard Haussmann - 75009 PARIS 552 120 222 R.C.S. PARIS THIRD UPDATE TO THE 2015 REGISTRATION DOCUMENT Registration document filed with the AMF (French Securities Regulator) on March 4, 2015 under No. D.15-0104. The first update was filed with the AMF on May 11, 2015 under No D.15-0104-A01 The second update was filed with the AMF on August 06, 2015 under No D.15-0104-A02 The AMF has conducted no verification of the content of this document. Only the French version of the Registration Document (“Document de Référence”) has been controlled by the AMF. The original update to the registration document was filed with the AMF (French Securities Regulator) on November 6, 2015, under the number D.15-0104-A03. It may be used to support a financial transaction if accompanied by a prospectus duly approved by the AMF. This document was produced by the issuer and is binding upon its signatory. 1/56
-
Upload
khangminh22 -
Category
Documents
-
view
1 -
download
0
Transcript of THIRD UPDATE - Groupe Société Générale
A French corporation with share capital of EUR 1,007,625,077.50 Registered office: 29 boulevard Haussmann - 75009 PARIS 552 120 222 R.C.S. PARIS
THIRD UPDATE
TO THE
2015 REGISTRATION DOCUMENT
Registration document filed with the AMF (French Securities Regulator) on March 4, 2015 under No. D.15-0104.
The first update was filed with the AMF on May 11, 2015 under No D.15-0104-A01 The second update was filed with the AMF on August 06, 2015 under No D.15-0104-A02
The AMF has conducted no verification of the content of this document. Only the French version of the Registration Document (“Document de Référence”) has been controlled by the
AMF. The original update to the registration document was filed with the AMF (French Securities
Regulator) on November 6, 2015, under the number D.15-0104-A03. It may be used to support a financial transaction if accompanied by a prospectus duly approved by the AMF. This
document was produced by the issuer and is binding upon its signatory.
1/56

CONTENTS UPDATE OF THE 2014 REGISTRATION DOCUMENT BY CHAPTER
1 - CHAPTER 1: HISTORY AND PROFILE OF SOCIETE GENERALE .................................................. 3
1.1 RECENT PRESS RELEASES AND EVENTS SUBSEQUENT TO THE SUBMISSION OF THE SECOND UPDATE TO THE 2015 REGISTRATION DOCUMENT ................................................................................................................ 3
1.1.1 Press release dated November 02, 2015 : Amundi1 launches its initial public offering on the regulated market of Euronext Paris ............................................................................................................ 3
1.1.2 Press release dated November 05, 2015 : Third Quarter 2014 Results ........................................... 4
2 - CHAPTER 2 – GROUP MANAGEMENT REPORT ............................................................................. 5
2.1 THIRD QUARTER 2015 RESULTS (PRESS RELEASE DATED NOVEMBER 5, 2015) - UPDATE OF THE 2015 REGISTRATION DOCUMENT PAGE 24 – 45 .................................................................................................... 5
2.2 SIGNIFICANT NEW PRODUCTS OR SERVICES ........................................................................................ 32
2.3 FINANCIAL POLICY ............................................................................................................................. 38
2.3.1 Group debt policy ............................................................................................................................ 38
3 - CHAPTER 3 : CORPORATE GOVERNANCE ................................................................................... 40
3.1 EXECUTIVE COMMITEE ....................................................................................................................... 40
4 - CHAPTER 4 : RISKS AND CAPITAL ADEQUACY .......................................................................... 41
4.1 REGULATORY RATIOS ........................................................................................................................ 41
4.1.1 Prudential ratio management – Update of the 2015 registration document page 165-168 ............ 41
4.1.2 RISK- WEIGHTED ASSETS* (CRR/CRD4, in EUR bn) – Update of the 2015 registration document page 145 .................................................................................................................................. 42
4.1.3 Reconciliation of book and prudential capital and CRR / CRD4 – Update of the 2015 registration document page 168 .................................................................................................................................. 43
4.1.4 CRR LEVERAGE RATIO ................................................................................................................ 44
4.2 PROVISIONING OF DOUBTFUL LOANS - UPDATE OF THE 2015 REGISTRATION DOCUMENT PAGE 213 ........ 44
4.3 CHANGE IN TRADING VAR - UPDATE OF THE 2015 REGISTRATION DOCUMENT PAGE 250 ....................... 45
4.4 LIQUIDITY RISKS ................................................................................................................................ 46
4.4.1 Liquid asset buffer - Update of the 2015 registration document page 271 ..................................... 46
4.5 LEGAL RISKS – UPDATE OF THE 2015 REGISTRATION DOCUMENT PAGE 281 .......................................... 47
5 - CHAPTER 8 : PERSON RESPONSIBLE FOR UPDATING THE REGISTRATION DOCUMENT ... 48
5.1 PERSON RESPONSIBLE FOR UPDATING THE REGISTRATION DOCUMENT ................................................ 48
5.2 STATEMENT OF THE PERSON RESPONSIBLE FOR UPDATING THE REGISTRATION DOCUMENT .................. 48
5.3 PERSONS RESPONSIBLE FOR THE AUDIT OF THE FINANCIAL STATEMENTS .............................................. 49
6 - CHAPTER 9 : CROSS-REFERENCE TABLE ................................................................................... 50
6.1 UPDATE TO THE REGISTRATION DOCUMENT CROSS-REFERENCE TABLE ................................................ 50
6.2 CROSS-REFERENCE TABLE OF PILLAR 3 REPORT ................................................................................. 52
6.3 PILLAR 3 REPORT TABLES INDEX ......................................................................................................... 53
6.4 CROSS REFERENCE TABLE WITH THE RECOMMENDATIONS MADE BY THE ENHANCED DISCLOSURE TASK FORCE .................................................................................................................................................... 55
2/56

1 - Chapter 1: History and profile of Societe Generale
1.1 Recent press releases and events subsequent to the submission of the Second update to the 2015 registration document
1.1.1 Press release dated November 02, 2015 : Amundi 1 launches its initial public offering on the regulated market of Euronext Paris
Crédit Agricole S.A. and Société Générale today announces the launch of the initial public offering of Amundi (the “IPO”), their asset management joint venture set up in 2010, on the regulated market of Euronext Paris. This IPO will give Amundi access to a new source of financing, enhance its strategic and financial flexibility and support its development in France and internationally. As provided for under the shareholders’ agreement entered into upon Amundi’s creation, Société Générale plans to sell the entire 20% it holds in Amundi, equivalent to 33.4 million shares. The two companies will remain bound by their distribution agreements, which have been extended for a renewable period of five years from the completion date of the IPO. In so doing, Société Générale has reaffirmed its long-term industrial partnership with Amundi, which will remain its chosen provider of savings and investment solutions to its retail banking and insurance networks. “We are extremely happy with our special relationship with Amundi, which we view as a long-term business partner for Société Générale in asset management”, stated Frédéric Oudéa, Chief Executive Officer of Société Générale. Furthermore, in parallel to the initial public offering, Crédit Agricole S.A. has reached an agreement with a subsidiary of Agricultural Bank of China to sell it around 2 per cent of Amundi’s capital at the final IPO price. The purchase of this stake reflects the goal of Agricultural Bank of China and Amundi to expand their cooperation beyond the joint venture set up in 2008. Agricultural Bank of China is one of the top four banks in China2 with 450 million retail customers. Crédit Agricole S.A. has also decided to grant an over-allotment option to the banks coordinating the IPO of 3 per cent of Amundi’s capital to enhance the liquidity of Amundi shares and stabilise market prices in the first few days of trading. Following the initial public offering, the Crédit Agricole Group will remain Amundi’s majority shareholder with a stake of between 74.6% and 77.6%3. “This transaction confirms the strategic importance of asset management within the Credit Agricole Group, and its role as a key driver of the overall development of the Group” said Philippe Brassac, Chief Executive Officer of Crédit Agricole S.A. 1 The change of the name of the company from Amundi Group to Amundi was authorized by the General Meeting of shareholders that took place on
September 30, 2015, it will take effect as of the date of the first listing of the company’s shares on Euronext Paris. 2 Ranking based on a comparative analysis of the annual reports of the main banks in China, based on the number of branches and customers reported 3 assuming the issue of the maximum number of New Shares Reserved for Employees and based on the lower end of the Indicative Price Range for the
Offer Price
3/56
1.1.2 Press release dated November 05, 2015 : Third Quarter 2014 Results
See chapter 2-1, page 5
4/56
2 - Chapter 2 – Group management report
2.1 Third Quarter 2015 Results (press release dated November 5, 2015) - Update of the 2015 registration document page 24 – 41
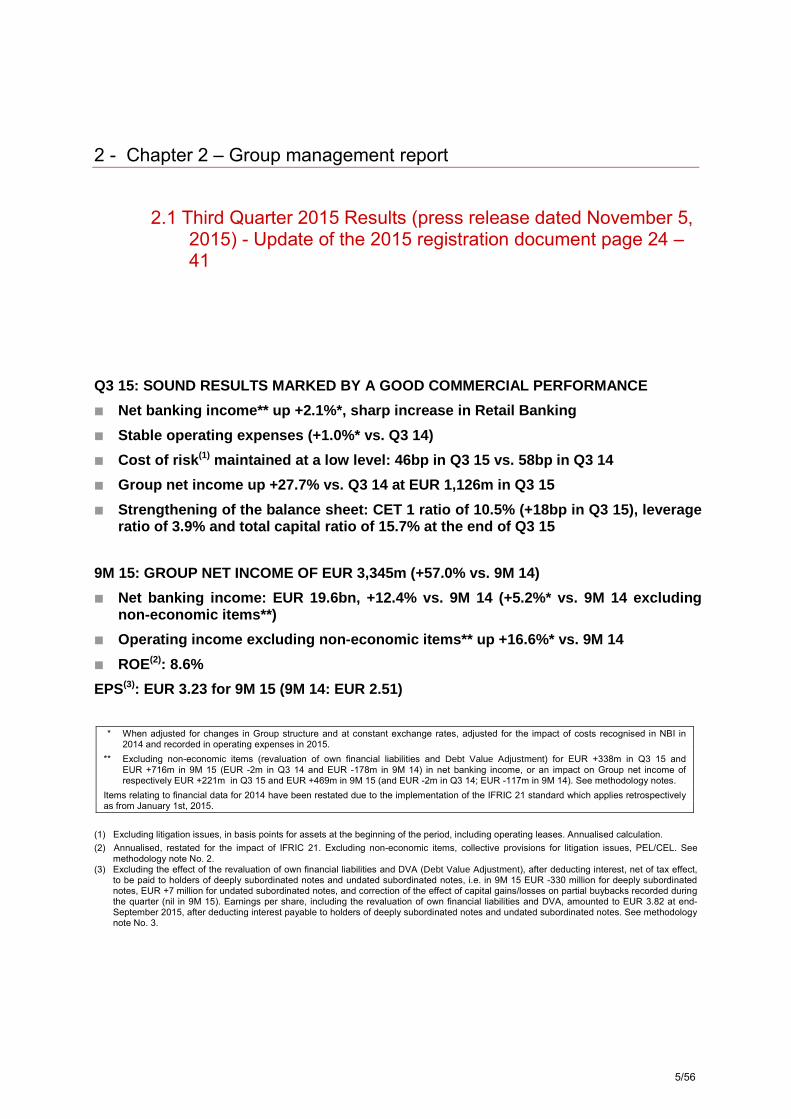
Q3 15: SOUND RESULTS MARKED BY A GOOD COMMERCIAL PERFORMANCE
� Net banking income** up +2.1%*, sharp increase in Retail Banking
� Stable operating expenses (+1.0%* vs. Q3 14)
� Cost of risk (1) maintained at a low level: 46bp in Q3 15 vs. 58bp in Q3 14
� Group net income up +27.7% vs. Q3 14 at EUR 1,126m in Q3 15
� Strengthening of the balance sheet: CET 1 ratio of 10.5% (+18bp in Q3 15), leverage ratio of 3.9% and total capital ratio of 15.7% at the end of Q3 15
9M 15: GROUP NET INCOME OF EUR 3,345m (+57.0% vs. 9M 14)
� Net banking income: EUR 19.6bn, +12.4% vs. 9M 14 (+5.2%* vs. 9M 14 excluding non-econo mic items**)
� Operating income excluding non-economic items** up +16.6%* vs. 9M 14
� ROE(2): 8.6%
EPS(3): EUR 3.23 for 9M 15 (9M 14: EUR 2.51)
* When adjusted for changes in Group structure and at constant exchange rates, adjusted for the impact of costs recognised in NBI in
2014 and recorded in operating expenses in 2015. ** Excluding non-economic items (revaluation of own financial liabilities and Debt Value Adjustment) for EUR +338m in Q3 15 and
EUR +716m in 9M 15 (EUR -2m in Q3 14 and EUR -178m in 9M 14) in net banking income, or an impact on Group net income of respectively EUR +221m in Q3 15 and EUR +469m in 9M 15 (and EUR -2m in Q3 14; EUR -117m in 9M 14). See methodology notes.
Items relating to financial data for 2014 have been restated due to the implementation of the IFRIC 21 standard which applies retrospectively as from January 1st, 2015.
(1) Excluding litigation issues, in basis points for assets at the beginning of the period, including operating leases. Annualised calculation. (2) Annualised, restated for the impact of IFRIC 21. Excluding non-economic items, collective provisions for litigation issues, PEL/CEL. See
methodology note No. 2. (3) Excluding the effect of the revaluation of own financial liabilities and DVA (Debt Value Adjustment), after deducting interest, net of tax effect,
to be paid to holders of deeply subordinated notes and undated subordinated notes, i.e. in 9M 15 EUR -330 million for deeply subordinated notes, EUR +7 million for undated subordinated notes, and correction of the effect of capital gains/losses on partial buybacks recorded during the quarter (nil in 9M 15). Earnings per share, including the revaluation of own financial liabilities and DVA, amounted to EUR 3.82 at end-September 2015, after deducting interest payable to holders of deeply subordinated notes and undated subordinated notes. See methodology note No. 3.
5/56

Societe Generale’s Board of Directors met on November 4th, 2015 under the chairmanship of Lorenzo Bini Smaghi and examined the results for Q3 2015. Group net income was EUR 1,126 million in Q3 2015, up +27.7% vs. Q3 2014, taking the cumulative result for the first 9 months of the year to EUR 3,345 million, vs. EUR 2,130 million for the same period in 2014. Net banking income, restated for non-economic items**, totalled EUR 6,026 million in Q3 2015 (+2.1%* vs. Q3 2014 ), and EUR 18,870 million for the first 9 months of 2015 (+5.2%* vs. the first 9 months of 2014)(1). The Group provided further evidence in Q3 of the excellent performance of its Retail Banking activities, both in France (up +4.2% excluding PEL/CEL effect vs. Q3 2014) and for International Retail Banking & Financial Services (+5.0%*), whereas the challenging market conditions observed during the summer led to Global Banking & Investor Solutions’ revenues declining -10.7%*, despite dynamic Financing & Advisory activity. The Group has accelerated the rollout of its new relationship model in Retail Banking, adapted to the new behaviour of its customers in the digital revolution era. In France, this is based on its three major brands (Societe Generale, Crédit du Nord and Boursorama). It intends to accelerate the expansion of Boursorama and exceed 2 million customers between now and 2020 on the back of its position as the leader in online banking in France. The Group is also accelerating the transformation of the Societe Generale and Crédit du Nord networks around three pillars: reinventing the relationship model, launching new digital initiatives and accompanying its employees in the transformation. This plan will enable the Group to improve the customer experience, based on an omnichannel relationship, while at the same time being more efficient, with the ambition of achieving a ROE of 15% by 2020 in French Retail Banking. Operating expenses are under control (+1.0%* in Q3 2015 vs. Q3 2014). With the completion of the 2013-2015 cost savings plan (EUR 900 million of recurring savings secured), the transformation plan for 2017 is being implemented. This new plan aims to reduce recurring operating expenses by an additional EUR 850 million for EUR 450 million of restructuring costs. A EUR 40 million restructuring provision was recognised during the third quarter. The net cost of risk was down -7.9%* in Q3 2015 vs. Q3 2014 with, in particular, a decline in the commercial cost of risk from 58 to 46 basis points, still below the targets set out in the strategic plan for end-2016 (55-60 basis points). The “Basel 3” Common Equity Tier 1 (CET1) ratio stood at 10.5% (2), (10.1% at end-September 2014), the leverage ratio at 3.9% (stable vs. end-September 2014) and the total capital ratio at 15.7% (14.6% at end-September 2014). The Group’s ROE(3) stood at 8.6% in the first 9 months of 2015 (8.0% for the same period in 2014).
(1) In absolute terms, net banking income amounted to EUR 6,364 million in Q3 2015 (up +8.3% vs. Q3 14), and
EUR 19,586 million for the first 9 months of the year (+12.4% vs. the first 9 months of 2014) (2) The published solvency ratios are calculated based on CRR/CRD4 rules, fully loaded, unless specified
otherwise, see methodology note No. 5. (3) Excluding collective provisions for litigation issues, non-economic items, PEL/CEL provision and adjusted for
the effect of the implementation of the IFRIC 21 standard, as well as the goodwill write-down on the Russian activities and the badwill recognised on the consolidation of Newedge in 2014. Annualised calculation, see methodology note No. 2 – ROE in absolute terms of 9.0% in 9M 15 and 5.8% in 9M 14.
6/56
Commenting on the Group’s results for Q3 2015, Frédéric Oudéa – Chief Executive Officer – stated: “The Soci ete Generale Group has posted sound results in Q3 2015 on the back of a good commercial performance and the continued control of costs and risks. We have provided further evidence of our growth potential against the backdrop of a recovery in Europe, with a substantial increase in our Retail Banking activities, in France with record growth in new customers and also internationally. Our ability to generate capital has enabled us to strengthen our financial solidity, with a CET1 ratio of 10.5%, in line with our target of around 11% at end-2016. Our balanced model and customer-focused strategy demonstrate our ability to create value and adapt to rapid changes in our customers’ needs in an even more demanding regulatory environment. In keeping with the digital revolution that is accelerating in the banking world, we have decided to speed up and go further in the transformation of our French Retail Banking model based on the complementary nature of our three brands, and with the ambition of reinforcing our promise of being a reference in relationship banking.”
7/56

1 - GROUP CONSOLIDATED RESULTS
In EUR m Q3 14 Q3 15 Change
9M 14 9M 15 Change
Net banking income 5,876 6,364 8.3% +7.9%* 17,432 19,586 12.4% +10.3%* Net banking income (1) 5,878 6,026 +2.5% +2.1%* 17,610 18,870 +7.2% +5.2%* Operating expenses (3,920) (3,978) +1.5% +1.0%* (11,825) (12,544) +6.1% +3.4%* Gross operating income 1,956 2,386 +22.0% +21.8%* 5,607 7,042 +25.6% +25.3%* Gross operating income (1) 1,958 2,048 +4.6% +4.4%* 5,785 6,326 +9.4% +9.1%* Net cost of risk (642) (571) -11.1% -7.9%* (2,061) (1,908) -7.4% -5.1%* Operating income 1,314 1,815 +38.1% +35.4%* 3,546 5,134 +44.8% +42.1%* Operating income (1) 1,316 1,477 +12.2% +10.1%* 3,724 4,418 +18.6% +16.6%* Net profits or losses from other assets (7) (1) NM NM* 193 (42) NM NM*
Impairment losses on goodwill 0 0 NM NM* (525) 0 NM NM* Reported Group net income 882 1,126 +27.7% +25.3%* 2,130 3,345 +57.0% +53.6%* Group net income (1) 884 905 +2.4% +0.5%* 2,247 2,876 +28.0% +25.4%* Group ROE (after tax) 7.2% 9.0% 5.8% 9.0%
(1) Adjusted for revaluation of own financial liabilities and DVA
Net banki ng income The Group’s net banking income totalled EUR 6,364 million in Q3 15, up +7.9%* vs. Q3 14 and EUR 19,586 million in 9M 15, up +10.3%* vs. 9M 14. Excluding non-economic items, the Group’s net banking income amounted to EUR 6,026 million in Q3 15 (up +2.1%* vs. Q3 14) and EUR 18,870 million in 9M 15 (+5.2%* vs. 9M 14).
- French Retail Banking (RBDF) revenues rose +4.2% in Q3 15 vs. Q3 14 (and +3.5% in the first 9 months), excluding the PEL/CEL provision (or respectively +7.1% and +3.4% in absolute terms). In an environment of low interest rates, French Retail Banking continued to enjoy dynamic activity, with a record number of accounts opened in the last ten years and strong growth in outstanding deposits and loans.
- International Retail Banking & Financial Services’ (IBFS) net banking income rose +5.0%*
in Q3 15 vs. Q3 14 (and +3.1%* in the first 9 months of 2015 vs. the same period in 2014). When adjusted for changes in Group structure and at constant exchange rates, revenues were higher in all the activities excluding Russia, particularly in Financial Services to Corporates and Insurance (+13.6%* between Q3 14 and Q3 15, and +12.2%* in the first 9 months of the year). In International Retail Banking, revenues increased +0.7%* overall between Q3 14 and Q3 15 (-1.3%* between 9M 14 and 9M 15), due primarily to the slowdown observed in Russia where, nevertheless, the situation stabilised in the third quarter.
- In challenging market conditions in Q3 15, Global Banking & Investor Solutions (GBIS) posted revenues down -10.7%* vs. Q3 14 despite the growth in Financing & Advisory activities. Revenues were up +2.6%* in 9M 15 vs. 9M 14 (stable at +0.7%* in Global Markets and Investor Services, up +3.6%* in Asset and Wealth Management, and +7.8%* in Financing & Advisory).
8/56

The accounting impact of the revaluation of the Group’s own financial liabilities was EUR +447 million in Q3 15 (EUR -4 million in Q3 14), or EUR +821 million for 9M 15 (EUR -183 million in 9M 14). The DVA impact (see methodology note No. 7) totalled EUR -109 million in Q3 15 (EUR +2 million in Q3 14), and EUR -105 million in the first 9 months of 2015 (EUR +5 million in 9M 14). These two factors constitute the restated non-economic items in the analyses of the Group’s results. Operating expenses The Group’s operating expenses were generally stable in Q3 15 vs. Q3 14 (+1.0%*). Over 9 months, they amounted to EUR 12,544 million in 2015 vs. EUR 11,825 million in 2014. Operating expenses take account of the change in accounting method caused by the implementation of the IFRIC 21 standard. This has resulted in a number of costs, which would have been smoothed over the year according to previous accounting standards, being recognised in one instalment. The Group completed its 2013-2015 cost savings plan during Q3 2015 and secured the entire EUR 900 million of planned recurring savings by mobilising EUR 457 million of transformation costs, less than the initial budget. Under the new transformation plan initiated in 2015, a EUR 40 million provision has been recognised in order to deal with the restructuring announced under this project, which aims to reduce the Group’s recurring costs by EUR 850 million. Operating income The Group’s gross operating income amounted to EUR 2,386 million in Q3 15, vs. EUR 1,956 million in Q3 14, up +21.8%* (and +25.3%* between 9M 14 and 9M 15, at EUR 7,042 million). This sharp increase can be explained primarily by the non-economic variation in the revaluation of own financial liabilities. If non-economic items are stripped out, gross operating income rose +4.4%* in Q3 15 vs. Q3 14 and +9.1%* between 9M 14 and 9M 15.
The Group’s net cost of risk amounted to EUR -571 million in Q3 15, down -7.9%* vs. Q3 14.
The Group’s commercial cost of risk (expressed as a fraction of outstanding loans) confirmed its downtrend, in line with the 2016 target. It stood at 46(1) basis points in Q3 15 vs. 44 basis points in Q2 15 and 58 basis points in Q3 14.
- In French Retail Banking , the commercial cost of risk was stable vs. Q2 15 at 42 basis points (38 basis points in Q2 15 and 51 basis points in Q3 14), due to the low level for business customers.
- At 91 basis points (vs. 96 basis points in Q2 15 and 128 basis points in Q3 14), International Retail Banking & Financial Services’ cost of risk was lower overall. The cost of risk stabilised in Russia despite a challenging economic environment.
- Global Banking & Investor Solutions’ cost of risk remained low in Q3 15 at 17 basis points (vs. 10 basis points in Q2 15 and 6 basis points in Q3 14), despite prudent provisioning in respect of oil and gas exposure.
The net cost of risk was EUR -1,908 million in 9M 15 vs. EUR -2,061 million in 9M 14.
The gross doubtful outstandings ratio was 5.5% at end-September 2015 (vs. 6.4% at end-September 2014). The Group’s gross coverage ratio for doubtful outstandings stood at 64%, up +1 point vs. end-September 2014.
(1) Annualised rate, excluding litigation issues, in respect of assets at the beginning of the period and including
operating leases
9/56
The Group’s operating income was substantially higher, at EUR 1,815 million in Q3 15 (+35.4%* vs. Q3 14) and EUR 5,134 million for the first 9 months of 2015 (+42.1%* vs. the same period in 2014), due to the reduction in the net cost of risk and the increase in gross operating income. Net income After taking into account tax (the Group’s effective tax rate was 34.7% in Q3 15 and 31.3% in 9M 15) and the contribution of non-controlling interests, Group net income totalled EUR 1,126 million in Q3 15 and EUR 3,345 million on a cumulative basis at end-September 2015. Group net income was EUR 882 million in Q3 14, with an effective tax rate of 30.2% and EUR 2,130 million for 9M 14, with an effective tax rate of 26.7%. When corrected for non-economic items (revaluation of own financial liabilities and DVA)(1), Group net income amounted to EUR 905 million in Q3 15 vs. EUR 884 million in Q3 14. The cumulative result, excluding non-economic items, amounted to EUR 2,876 million at end-September 2015 (EUR 2,247 million over the same period in 2014). ROE and EPS The Group’s ROE(2) stood at 8.6% for 9M 15. On a like-for-like basis, ROE was 8.0% for 9M 14. Earnings per share (EPS) amounts to EUR 3.82 at end-September 2015 (EUR 2.35 at end-September 2014), after deducting interest payable to holders of deeply subordinated notes and undated subordinated notes(3). If the revaluation of own financial liabilities and DVA are stripped out, earnings per share amounts to EUR 3.23 (EUR 2.51 at end-September 2014), after deducting interest payable to holders of deeply subordinated notes and undated subordinated notes. This is the basis for the calculation of the proposed dividend distribution to be submitted to the Board of Directors and the Annual General Meeting (50% payout ratio).
(1) Excluding non-economic items detailed in methodology note No. 7 for 2014 and 2015 (2) See methodology note No. 5, excluding non-economic items, collective provision for litigation issues,
PEL/CEL and adjusted for the effect of IFRIC 21. Excluding the goodwill write-down in Russia and the initial consolidation of Newedge in 2014 (or effect of EUR -315 million on income). The adjustment relating to IFRIC 21 corrects, for each quarter, 25% of the taxes borne in their entirety in respect of the financial year. ROE in absolute terms in Q3 14: 7.2%, in 9M 14: 5.8%. ROE for Q3 15 and 9M 15 in absolute terms: 9.0%
(3) After deducting interest, net of tax effect, to be paid to holders of deeply subordinated notes and undated subordinated notes for 9M 15: EUR -330 million for deeply subordinated notes and EUR +7 million for undated subordinated notes. See methodology note No. 3
10/56
2 - THE GROUP’S FINANCIAL STRUCTURE Group shareholders’ equity totalled EUR 57.9 billion(1) at September 30th, 2015 (EUR 55.2 billion at December 31st, 2014) and tangible net asset value per share was EUR 53.98, corresponding to net asset value per share of EUR 60.46, including EUR 1.48 of unrealised capital gains. The consolidated balance sheet totalled EUR 1,352 billion at September 30th, 2015 (EUR 1,308 billion at December 31st, 2014). The net amount of customer loans (excluding securities purchased under resale agreements), including lease financing, was EUR 381 billion (EUR 356 billion at December 31st, 2014). At the same time, customer deposits amounted to EUR 352 billion vs. EUR 328 billion at December 31st, 2014 (excluding securities sold under repurchase agreements). At the end of Q3 2015, the liquidity raised in respect of the 2015 medium/long-term financing programme amounted to EUR 31.0(a) billion in senior and subordinated debt. At parent company level, EUR 26.0(a) billion had been raised at September 30th, 2015. Refinancing sources break down between EUR 6.1 billion of unsecured senior vanilla issues, EUR 13.8(a) billion of structured private placements, EUR 1.5 billion of secured financing (SG SFH and SG SCF), EUR 3.5 billion of subordinated Tier 2 issues and EUR 1.1 billion of deeply subordinated Additional Tier 1 issues. At the level of the subsidiaries, EUR 5.0 billion had been raised at September 30th, 2015. The LCR (Liquidity Coverage Ratio ) amounted to 144% at end-September 2015, vs. 118% at end-2014. The Group’s risk-weighted assets amounted to EUR 355 billion at September 30th, 2015 (vs. EUR 353 billion at end-December 2014 and at end-September 2014; EUR 361 billion at end-June 2015) according to CRR/CRD4 rules. Risk-weighted assets in respect of credit risk still represent the bulk of the bank’s risks, more than 80% of the total, up by nearly two points year-on-year. At September 30th, 2015, the Group’s Common Equity Tier 1 ratio (2) stood at 10.5%(3) (10.1% at end-December 2014), for a target at end-2016 of around 11%. The Tier 1 ratio was 13.2% (12.6% at end-December 2014) and the total capital ratio amounted to 15.7% (14.3% at end-December 2014). The Group announced its intention to dispose of its stake in Amundi during the IPO launched on November 2nd, 2015. Based on the indicative price range fixed at between EUR 42.00 and EUR 52.50, the disposal of Societe Generale’s entire stake would have an impact of between 22 and 26 basis points on the Common Equity Tier 1 ratio at December 31st, 2015. The leverage ratio stood at 3.9%(2) at end-September 2015 (3.8% at end-December 2014). The Group is rated by the rating agencies DBRS (long-term rating: “A (high)” with a stable outlook; short-term rating: “R-1 (middle)” with a stable outlook), FitchRatings (long-term rating: “A” with a stable outlook; short-term rating: “F1”), Moody’s (deposit and senior unsecured long-term ratings: “A2” with a stable outlook; short-term rating: “P-1” and long-term Counterparty Risk Assessment of “A1” and short-term Counterparty Risk Assessment of “P-1”), Standard & Poor’s (long-term rating: “A” with a negative outlook; short-term rating: “A-1”) and R&I (attribution of a long-term rating of “A” with a stable outlook). (1) This figure includes notably EUR 9.4 billion of deeply subordinated notes and EUR 0.4 billion of undated
subordinated notes (2) Fully-loaded ratios. See methodology note No. 5 (3) The phased-in ratio, including the earnings of the current financial year, stood at 11.1% at end-September
2015, vs. 10.9% at end-December 2014. See methodology note No. 5 (a) Amounts adjusted with respect to information published on 5th November 2015, respectively: total EUR
31.5bn; parent company EUR 26.5bn; structured private placements EUR 14.3bn
11/56
3 - FRENCH RETAIL BANKING
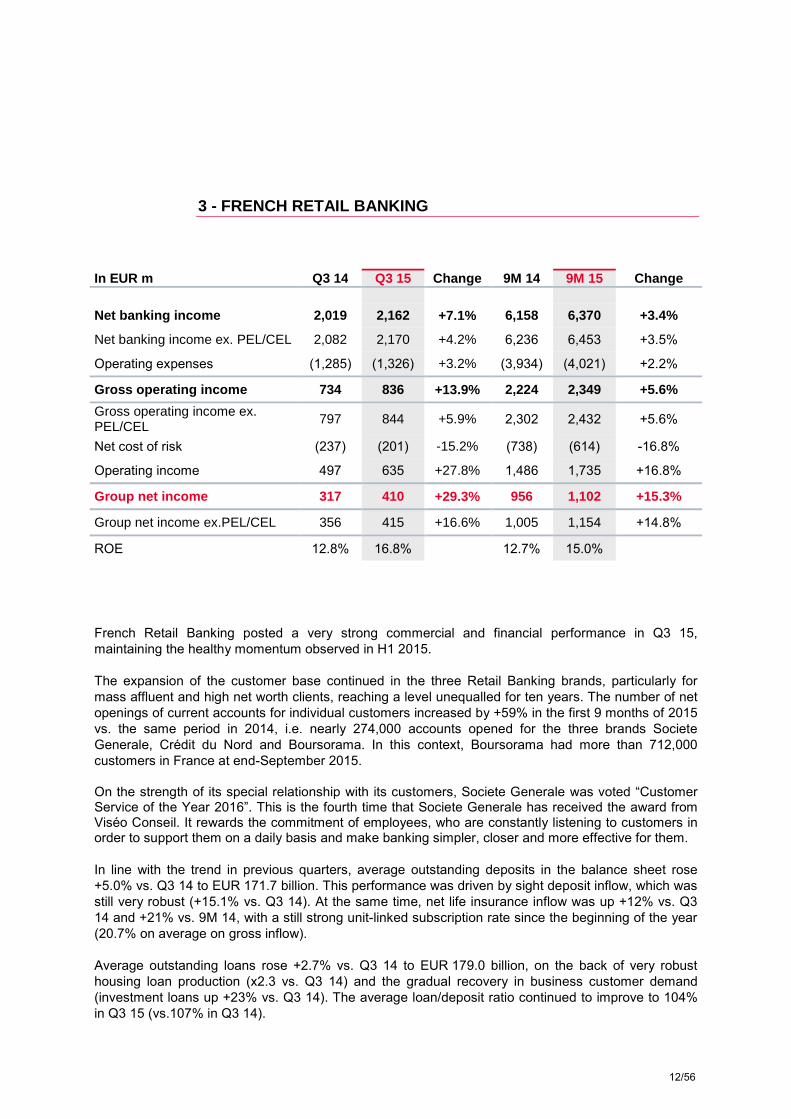
In EUR m Q3 14 Q3 15 Change 9M 14 9M 15 Change Net banking income 2,019 2,162 +7.1% 6,158 6,370 +3.4%
Net banking income ex. PEL/CEL 2,082 2,170 +4.2% 6,236 6,453 +3.5%
Operating expenses (1,285) (1,326) +3.2% (3,934) (4,021) +2.2%
Gross operating income 734 836 +13.9% 2,224 2,349 +5.6%
Gross operating income ex. PEL/CEL
797 844 +5.9% 2,302 2,432 +5.6%
Net cost of risk (237) (201) -15.2% (738) (614) -16.8%
Operating income 497 635 +27.8% 1,486 1,735 +16.8%
Group net income 317 410 +29.3% 956 1,102 +15.3%
Group net income ex.PEL/CEL 356 415 +16.6% 1,005 1,154 +14.8%
ROE 12.8% 16.8% 12.7% 15.0%
French Retail Banking posted a very strong commercial and financial performance in Q3 15, maintaining the healthy momentum observed in H1 2015. The expansion of the customer base continued in the three Retail Banking brands, particularly for mass affluent and high net worth clients, reaching a level unequalled for ten years. The number of net openings of current accounts for individual customers increased by +59% in the first 9 months of 2015 vs. the same period in 2014, i.e. nearly 274,000 accounts opened for the three brands Societe Generale, Crédit du Nord and Boursorama. In this context, Boursorama had more than 712,000 customers in France at end-September 2015. On the strength of its special relationship with its customers, Societe Generale was voted “Customer Service of the Year 2016”. This is the fourth time that Societe Generale has received the award from Viséo Conseil. It rewards the commitment of employees, who are constantly listening to customers in order to support them on a daily basis and make banking simpler, closer and more effective for them. In line with the trend in previous quarters, average outstanding deposits in the balance sheet rose +5.0% vs. Q3 14 to EUR 171.7 billion. This performance was driven by sight deposit inflow, which was still very robust (+15.1% vs. Q3 14). At the same time, net life insurance inflow was up +12% vs. Q3 14 and +21% vs. 9M 14, with a still strong unit-linked subscription rate since the beginning of the year (20.7% on average on gross inflow). Average outstanding loans rose +2.7% vs. Q3 14 to EUR 179.0 billion, on the back of very robust housing loan production (x2.3 vs. Q3 14) and the gradual recovery in business customer demand (investment loans up +23% vs. Q3 14). The average loan/deposit ratio continued to improve to 104% in Q3 15 (vs.107% in Q3 14).
12/56
Driven by the strong commercial performance and after neutralisation of the impact of PEL/CEL provisions, French Retail Banking revenues were up +4.2% vs. Q3 14 (and +3.5% in 9M 15 vs. end-September 2014). Excluding the PEL/CEL effect, net interest income rose +3.4% vs. Q3 14 and 9M 14: the increase in outstanding deposits and loans and the good level of loan was greater than the negative effects of low interest rates and housing loan renegotiations. The growth in commissions accelerated in Q3 15 to +5.5% vs. Q3 14, taking their increase to +3.5% in 9M 15, on the back of dynamic life insurance business and the development of synergies with the Group’s other businesses. Operating expenses were up +3.2% vs. Q3 14 and +2.2% vs. 9M 14, due primarily to the implementation of the European Single Resolution Fund and the acceleration of digital investments. However, the increase in operating expenses remained lower than the growth in NBI, resulting in French Retail Banking posting a cost to income ratio of 62.1% in 9M 15 (excluding the PEL/CEL effect and restated for 25% of the impact of the implementation of the IFRIC 21 standard), in line with the Group’s targets. The net cost of risk was substantially lower (-15.2% between Q3 14 and Q3 15 and -16.8% between 9M 14 and 9M 15). Excluding the PEL/CEL effect, French Retail Banking’s contribution to Group net income totalled EUR 415 million in Q3 15, up +16.6% vs. Q3 14. In 9M 15, it amounted to EUR 1,154 million (up +14.8%), resulting in a sound level of profitability (ROE of 15.9% excluding PEL/CEL effect and restated for 25% of the impact of the implementation of IFRIC 21).
13/56
4 - INTERNATIONAL RETAIL BANKING & FINANCIAL SERVICES
In EUR m Q3 14 Q3 15 Change
9M 14 9M 15 Change
Net banking income 1,899 1,888 -0.6% +5.0%* 5,576 5,524 -0.9% +3.1%*
Operating expenses (1,048) (1,018) -2.9% +2.1%* (3,208) (3,222) +0.4% +3.9%*
Gross operating income 851 870 +2.2% +8.6%* 2,368 2,302 -2.8% +2.1%*
Net cost of risk (378) (302) -20.1% -14.4%* (1,068) (922) -13.7% -8.7%*
Operating income 473 568 +20.1% +26.1%* 1,300 1,380 +6.2% +10.7%*
Net profits or losses from other assets
(1) (1) +0.0% NM* 2 (27) NM NM*
Impairment losses on goodwill
0 0 NM NM* (525) 0 NM NM*
Group net income 311 342 +10.0% +16.4%* 302 793 x2.6 x 2.9*
ROE 12.9% 14.2% 4.2% 11.0%
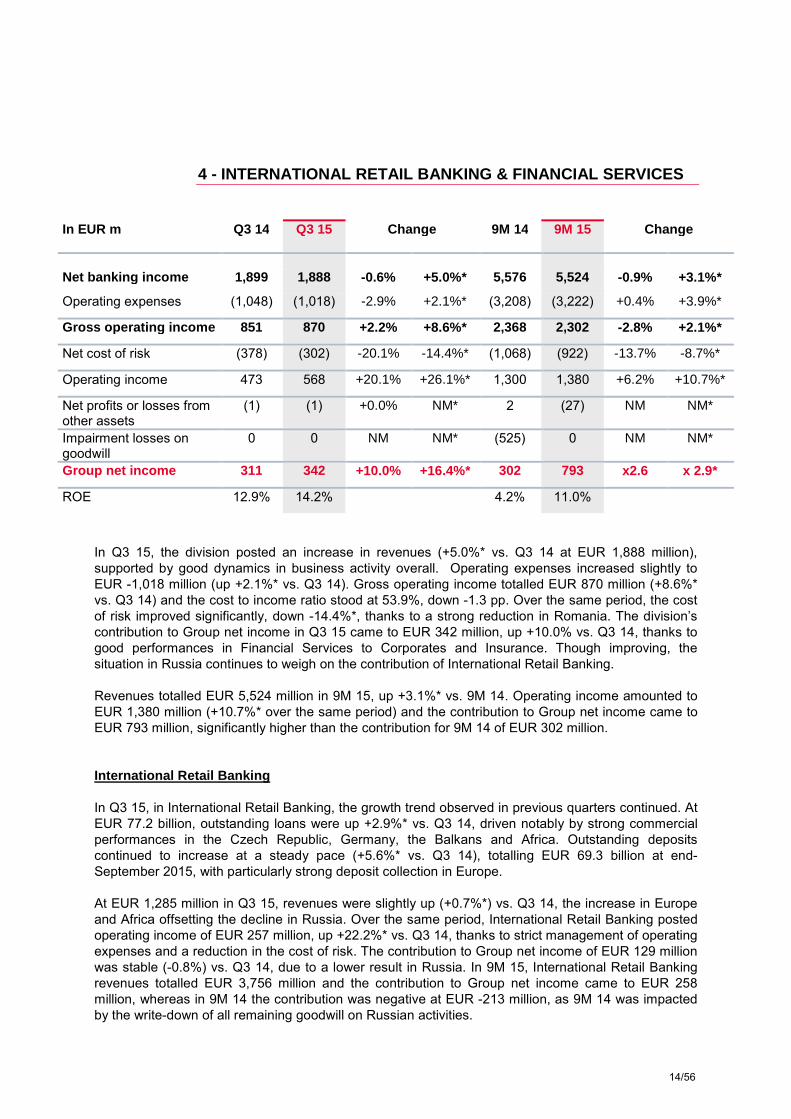
In Q3 15, the division posted an increase in revenues (+5.0%* vs. Q3 14 at EUR 1,888 million), supported by good dynamics in business activity overall. Operating expenses increased slightly to EUR -1,018 million (up +2.1%* vs. Q3 14). Gross operating income totalled EUR 870 million (+8.6%* vs. Q3 14) and the cost to income ratio stood at 53.9%, down -1.3 pp. Over the same period, the cost of risk improved significantly, down -14.4%*, thanks to a strong reduction in Romania. The division’s contribution to Group net income in Q3 15 came to EUR 342 million, up +10.0% vs. Q3 14, thanks to good performances in Financial Services to Corporates and Insurance. Though improving, the situation in Russia continues to weigh on the contribution of International Retail Banking. Revenues totalled EUR 5,524 million in 9M 15, up +3.1%* vs. 9M 14. Operating income amounted to EUR 1,380 million (+10.7%* over the same period) and the contribution to Group net income came to EUR 793 million, significantly higher than the contribution for 9M 14 of EUR 302 million. International Retail Banking In Q3 15, in International Retail Banking, the growth trend observed in previous quarters continued. At EUR 77.2 billion, outstanding loans were up +2.9%* vs. Q3 14, driven notably by strong commercial performances in the Czech Republic, Germany, the Balkans and Africa. Outstanding deposits continued to increase at a steady pace (+5.6%* vs. Q3 14), totalling EUR 69.3 billion at end-September 2015, with particularly strong deposit collection in Europe. At EUR 1,285 million in Q3 15, revenues were slightly up (+0.7%*) vs. Q3 14, the increase in Europe and Africa offsetting the decline in Russia. Over the same period, International Retail Banking posted operating income of EUR 257 million, up +22.2%* vs. Q3 14, thanks to strict management of operating expenses and a reduction in the cost of risk. The contribution to Group net income of EUR 129 million was stable (-0.8%) vs. Q3 14, due to a lower result in Russia. In 9M 15, International Retail Banking revenues totalled EUR 3,756 million and the contribution to Group net income came to EUR 258 million, whereas in 9M 14 the contribution was negative at EUR -213 million, as 9M 14 was impacted by the write-down of all remaining goodwill on Russian activities.
14/56

In Western Europe , where the division has consumer finance operations in Germany, Italy and France, outstanding loans were up +5.1%* vs. Q3 14 at EUR 14.3 billion, driven by strong momentum in Germany (+13.0%*), notably on car loans. In Q3 15, the region posted revenues of EUR 173 million (+8.4%* vs. Q3 14) and gross operating income of EUR 87 million (+11.9%*). The contribution to Group net income was significantly higher at EUR 36 million (+80.0% vs. Q3 14). In the Czech Republic , the Komercni Banka Group (KB) enjoyed good commercial dynamics in Q3 15, with outstanding loans growing by +8.5%* vs. Q3 14 to EUR 19.4 billion, driven by housing loans and large corporates. Outstanding deposits grew by +3.6%* to EUR 24.5 billion. Revenues were down -1.7%* vs. Q3 14 at EUR 255 million, in a context of low market rates. Operating expenses were stable* at EUR 133 million. The contribution to Group net income was maintained at a solid level, at EUR 55 million (+1.9% vs. Q3 14), with a low cost of risk. In Romania, despite the improvement in the economic environment, loan demand remained low, resulting in a reduction in loan outstandings for the BRD Group of -2.7%* vs. Q3 14 at EUR 6.2 billion. Deposit collection however remained very strong in Q3 15, with outstandings increasing +13.2%* vs. Q3 14 at EUR 8.7 billion. The BRD Group’s revenues were down in Q3 15 at EUR 129 million (-6.2%* vs. Q3 14), due to strong pressure on net interest margins in a low interest rate environment. However BRD made a positive contribution to Group net income of EUR 9 million in Q3 15, due to strictly monitored operating expenses and a sharp reduction in the cost of risk (-71.6%*). In other European countries , outstanding loans were up +6.4%* at EUR 11.1 billion, notably with the good growth in the Balkans (+6.3%*), both for corporate and individual customers. Outstanding deposits were up +9.5%* vs. Q3 14 at EUR 10.6 billion. Revenues were 10.7%* higher in Q3 15 than in Q3 14 at EUR 187 million, while operating expenses remained under control at EUR 111 million (+1.1%*). The contribution to Group net income in Q3 15 came to EUR 10 million vs. EUR 26 million in Q3 14, due to a higher cost of risk. In Russia , in a challenging environment, outstanding loans remained below the level of Q3 14, down -14.3%*, at EUR 8.5 billion. However, outstanding loans began to rebound in Q3 15 (+2.6%* vs. Q2 15), due to sustained activity in corporates and recovery in retail loan production. Outstanding deposits were unchanged* vs. Q3 14 at EUR 6.8 billion. SG Russia’s liquidity position remained strong, with a loan to deposit ratio for Rosbank of 86% at end-September 2015. Net banking income declined by -10.0%*, to EUR 169 million, but improved significantly vs. Q2 15 (+26.3%*) thanks to improving margins and increasing volumes. Operating expenses were well contained at EUR 132 million despite double-digit inflation, increasing by +1.1%* vs. Q3 14, and operations were further rationalised (-2,669 FTE and -77 branches vs. December 2014). Overall, losses from SG Russia(1) were further reduced this quarter to EUR -20 million in Q3 15, vs. EUR -45 million in Q2 15. In Africa and other regions where the Group operates, outstanding loans rose +5.2%* overall in Q3 15 vs. Q3 14 to EUR 17.8 billion, rising sharply in Africa in particular (+9.0%*). Over the same period, outstanding deposits increased by +5.6%* overall. Revenues totalled EUR 372 million in Q3 15, up +2.4%* vs. Q3 14, driven by volume growth in Africa. Operating expenses were stable vs. Q3 14 (-1.0%*) at EUR 207 million. The cost of risk declined by -17.4%* over the same period. The contribution to Group net income totalled EUR 49 million, up +2.1% vs. Q3 14. (1) SG Russia’s result: contribution of Rosbank, Delta Credit Bank, Rusfinance Bank, Societe Generale Insurance,
ALD Automotive and their consolidated subsidiaries to the results of the Group’s businesses International Retail Banking in Russia: contribution of EUR -30 million in Q3 15 and EUR +4 million in Q3 14.
15/56
Insurance The Insurance business maintained its healthy commercial momentum in Q3 15, with gross life insurance inflow of EUR 2.2 billion in Q3 15. Life insurance outstandings rose by +5.5%* vs. Q3 14 to EUR 92.7 billion, with the unit-linked share increasing to 20.8% of outstandings. In Personal Protection and Property & Casualty insurance, premiums totalled EUR 315 million in Q3 15 (3.7%* higher than in Q3 14), due to the good performance in France over the period (+10.0%*). Net banking income totalled EUR 206 million in Q3 15 (+7.7%* vs. Q3 14) and EUR 616 million in 9M 15 (+9.8%* vs. 9M 14). The contribution of the Insurance business to Group net income amounted to EUR 89 million in Q3 15 (+8.5% vs. Q3 14) and EUR 247 million in 9M 15 (+8.3% vs. 9M 14). Financial Services to Corporates Financial Services to Corporates enjoyed a very good commercial momentum and strong earnings growth in Q3 15. ALD continued to grow its vehicle fleet organically (+6.8%* vs. Q3 14), thereby maintaining its strong market positions. Equipment Finance enjoyed a good level of new business in Q3 15 (up +5.2%* excluding factoring vs. Q3 14), driven by Scandinavia and Italy. Outstanding loans totalled EUR 15.3 billion (+4.3%* vs. Q3 14, excluding factoring). In total, revenues from Financial Services to Corporates rose strongly (+16.9%* in Q3 15 vs. Q3 14) to EUR 394 million. Over the same period, strictly monitored costs limited the growth in operating expenses to +7.4%*, resulting in a +27.3%* increase in gross operating income vs. Q3 14. The contribution to Group net income was up +23.1% at EUR 128 million in Q3 15. In 9M 15, revenues amounted to EUR 1,140 million (+13.6%* vs. 9M 14) and the contribution to Group net income came to EUR 355 million (+22.0% vs. 9M 14).
16/56

5 - GLOBAL BANKING & INVESTOR SOLUTIONS In EUR m Q3 14 Q3 15 Change 9M 14 9M 15 Change
Net banking income 2,115 2,000 -5.4% -10.7%* 6,537 7,265 +11.1% +2.6%*
Operating expenses (1,537) (1,562) +1.6% -2.8%* (4,621) (5,196) +12.4% +3.2%*
Gross operating income 578 438 -24.2% -30.6%* 1,916 2,069 +8.0% +1.3%*
Net cost of risk (27) (68) x2.5 x2.2* (53) (174) x3.3 x 2,9*
Operating income 551 370 -32.8% -38.4%* 1,863 1,895 +1.7% -4.3%*
Group net income 456 320 -29.8% -34.8%* 1,487 1,533 +3.1% -2.5%*
ROE 13.7% 8.5% 15.5% 13.9%
Global Banking & Investor Solutions posted revenues of EUR 2,000 million in Q3 15, down -5.4% vs. Q3 14, reflecting the growth in Financing & Advisory and the decline in Global Markets in a challenging market environment. The division’s revenues totalled EUR 7,265 million in the first 9 months of 2015, representing a solid increase of +11.1% vs. the first 9 months of 2014.
Global Markets & Investor Services
The environment in the third quarter was marked by the consequences of the devaluation of the yuan in China and the turbulence in equity markets, triggering notably a substantial increase in volatility and correlation. As a result, after solid growth in H1, Global Markets and Investor Services’ revenues amounted to EUR 1,185 million, down -10.4% in Q3 15 vs. Q3 14. However, revenues for the first 9 months of 2015 were significantly higher, +10.9% vs. the same period last year at EUR 4,687 million.
• At EUR 411 million in Q3 15, Equity revenues declined -5.5% vs. Q3 14 while at the same time maintaining a substantial increase of +31.0%(1) in the first 9 months of 2015 at EUR 2,064 million. Third quarter revenues were adversely affected by challenging market conditions in Europe combined with lower commercial activity for structured products. This decline was partially offset by flow activities which benefited from the increase in volatility and growing client demand, particularly for derivatives. The Group saw an increase in its market share in cash equity activity and listed products.
• Fixed Income, Currencies & Commodities posted revenues down -22.7% at EUR 479 million in Q3 15, and -13.6%(1) in the first 9 months of 2015. The uncertainty in China created an unfavourable market environment for structured products and fixed income activities during a summer period characterised by reduced volumes. This decline was partially offset by the good performance of activities in emerging markets and in commodities.
(1) At constant structure
17/56

• Prime Services’ revenues were sharply higher (+37.5%) at EUR 143 million in Q3 15 (and +34.1%(1) in the first 9 months of 2015 vs. the first 9 months of 2014), bolstered by strong client demand in volatile equity markets, especially in Europe.
• Securities Services’ assets under custody were up +4.8% at EUR 3,995 billion year-on-year. At the same time, assets under administration increased +7.2% to EUR 585 billion. Securities Services’ revenues were down -6.7% in Q3 15 vs. Q3 14. However, revenues for the first 9 months of 2015 were up +1.6% compared with the same period in 2014.
Financing & Advisory Financing & Advisory continued to experience a strong commercial momentum in Q3 15, with revenues of EUR 561 million, up +7.9% vs. Q3 14. Natural resources financing enjoyed another excellent quarter marked by numerous transactions, while export and infrastructure financing also contributed to the business line’s good performance. Advisory and capital market activities posted stable revenues vs. Q3 14 against the backdrop of a market lull. Financing & Advisory revenues rose +16.4% to EUR 1,768 million in the first 9 months of 2015, reflecting the sharp increase in the number of transactions. Asset and Wealth Management The revenues of the Asset and Wealth Management business line totalled EUR 254 million in Q3 15, down -7.0% vs. Q3 14. Revenues rose +2.3% to EUR 810 million in the first 9 months of 2015. Private Banking’s assets under management amounted to EUR 112 billion at end-September 2015, up 2.4% at constant structure vs. end-September 2014, due to a good level of inflow driven by France and Luxembourg and a positive currency impact partially offset by an unfavourable market effect. The business posted net banking income of EUR 204 million in Q3 15, down -6.8% vs. the high level in Q3 14. Revenues in the first 9 months of 2015 remained higher than the same period last year, with a gross margin maintained at a high level of 108 basis points (vs. 103 basis points last year). Driven by an inflow of EUR +22.2 billion since the beginning of the year, Lyxor’s assets under management totalled EUR 105.7 billion at end-September 2015. Lyxor confirmed its No. 3 ranking in ETFs in Europe, with a market share of 10.8% at end-September 2015 (Euronext). Lyxor’s revenues came to EUR 44 million in Q3 15, down -10.2% vs. Q3 14, reflecting the development of the business mix towards lower margin ETF activities. Operating expenses In Q3 15, Global Banking & Investor Solutions’ operating expenses increased +1.6% but fell -2.8%* when adjusted for changes in Group structure and at constant exchange rates, reflecting good cost control. Operating expenses were up +3.2%* in the first 9 months of 2015, adversely affected by the contribution to the Single Resolution Fund (EUR 100 million, recognised in its entirety in the first quarter in accordance with the IFRIC 21 standard). The division’s cost to income ratio stood at 71.5% at end-September 2015. Operating income Gross operating income came to EUR 438 million in Q3 15, down -24.2% vs. Q3 14. In the first 9 months of 2015, the increase amounted to +8.0% at EUR 2,069 million. (1) At constant structure
18/56

The net cost of risk totalled EUR -174 million in the first 9 months of 2015, reflecting an increase in provisions in the oil sector, vs. a particularly low level of EUR -53 million in the first 9 months of 2014. The division’s operating income totalled EUR 1,895 million in the first 9 months of 2015, up +1.7% year-on-year. Net income Global Banking & Investor Solutions’ contribution to Group net income amounted to EUR 320 million in Q3 15 and EUR 1,533 million in the first 9 months of 2015, up +3.1%. Pro forma for the IFRIC 21 impact, ROE amounted to 14.2% in the first 9 months of 2015.
19/56
6 - CORPORATE CENTRE In EUR m Q3 14 Q3 15 9M 14 9M 15
Net banking income (157) 314 (839) 427
Net banking income (1) (153) (133) (656) (394)
Operating expenses (50) (72) (62) (105)
Gross operating income (207) 242 (901) 322
Gross operating income (1) (203) (205) (718) (499)
Net cost of risk 0 0 (202) (198)
Net profits or losses from other assets 0 1 206 (2)
Group net income (202) 54 (615) (83)
Group net income (1) (199) (239) (495) (621)
(1) Adjusted for revaluation of own financial liabilities
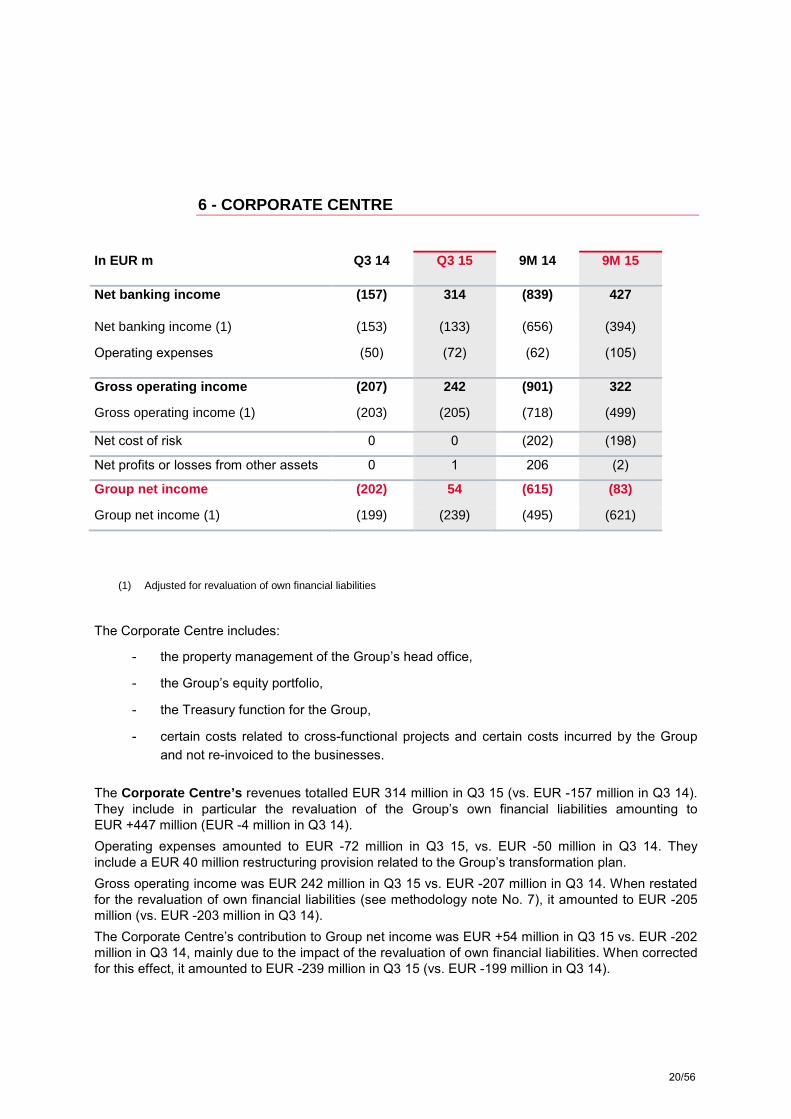
The Corporate Centre includes:
- the property management of the Group’s head office,
- the Group’s equity portfolio,
- the Treasury function for the Group,
- certain costs related to cross-functional projects and certain costs incurred by the Group and not re-invoiced to the businesses.
The Corporate Centre’s revenues totalled EUR 314 million in Q3 15 (vs. EUR -157 million in Q3 14). They include in particular the revaluation of the Group’s own financial liabilities amounting to EUR +447 million (EUR -4 million in Q3 14). Operating expenses amounted to EUR -72 million in Q3 15, vs. EUR -50 million in Q3 14. They include a EUR 40 million restructuring provision related to the Group’s transformation plan. Gross operating income was EUR 242 million in Q3 15 vs. EUR -207 million in Q3 14. When restated for the revaluation of own financial liabilities (see methodology note No. 7), it amounted to EUR -205 million (vs. EUR -203 million in Q3 14). The Corporate Centre’s contribution to Group net income was EUR +54 million in Q3 15 vs. EUR -202 million in Q3 14, mainly due to the impact of the revaluation of own financial liabilities. When corrected for this effect, it amounted to EUR -239 million in Q3 15 (vs. EUR -199 million in Q3 14).
20/56

7 - CONCLUSION Societe Generale has pursued its transformation in order to adapt to the new regulatory and technological environment, demonstrating its ability to create value for its shareholders and customers. The Group is capitalising on its advance in terms of digital banking services, its integrated bank model and its ability to control its costs and risk in order to establish itself as the reference in relationship banking, helping to finance the economy. Accordingly, net asset value per share increased by 4.5% between end-September 2014 and end-September 2015, to EUR 60.46 at end-September 2015. Tangible net asset value per share amounted to EUR 53.98 (up by nearly 5.2% vs. end-September 2014) and EPS of EUR 3.23 (net of the revaluation of own financial liabilities and interest payable to holders of deeply subordinated notes and undated subordinated notes) at end-September exceeded the total for 2014, with a proposal to distribute 50% to shareholders.
8 - 2016 FINANCIAL CALENDAR
2015/2016 financial communication calendar February 11th, 2016 Publication of fourth quarter and FY 2015 results May 4th, 2016 Publication of first quarter 2016 results August 3rd, 2016 Publication of second quarter and first half 2016 results November 3rd, 2016 Publication of third quarter 2016 results
This document contains forward-looking statements relating to the targets and strategies of the Societe Generale Group.
These forward-looking statements are based on a series of assumptions, both general and specific, in particular the application of accounting principles and methods in accordance with IFRS (International Financial Reporting Standards) as adopted in the European Union, as well as the application of existing prudential regulations.
These forward-looking statements have also been developed from scenarios based on a number of economic assumptions in the context of a given competitive and regulatory environment. The Group may be unable to:
- anticipate all the risks, uncertainties or other factors likely to affect its business and to appraise their potential consequences;
- evaluate the extent to which the occurrence of a risk or a combination of risks could cause actual results to differ materially from those provided in this document and the related presentation.
Therefore, although Societe Generale believes that these statements are based on reasonable assumptions, these forward-looking statements are subject to numerous risks and uncertainties, including matters not yet known to it or its management or not currently considered material, and there can be no assurance that anticipated events will occur or that the objectives set out will actually be achieved. Important factors that could cause actual results to differ materially from the results anticipated in the forward-looking statements include, among others, overall trends in general economic activity and in Societe Generale’s markets in particular, regulatory and prudential changes, and the success of Societe Generale’s strategic, operating and financial initiatives.
More detailed information on the potential risks that could affect Societe Generale’s financial results can be found in the Registration Document filed with the French Autorité des Marchés Financiers.
Investors are advised to take into account factors of uncertainty and risk likely to impact the operations of the Group when considering the information contained in such forward-looking statements. Other than as required by applicable law, Societe Generale does not undertake any obligation to update or revise any forward-looking information or statements. Unless otherwise specified, the sources for the business rankings and market positions are internal.
21/56
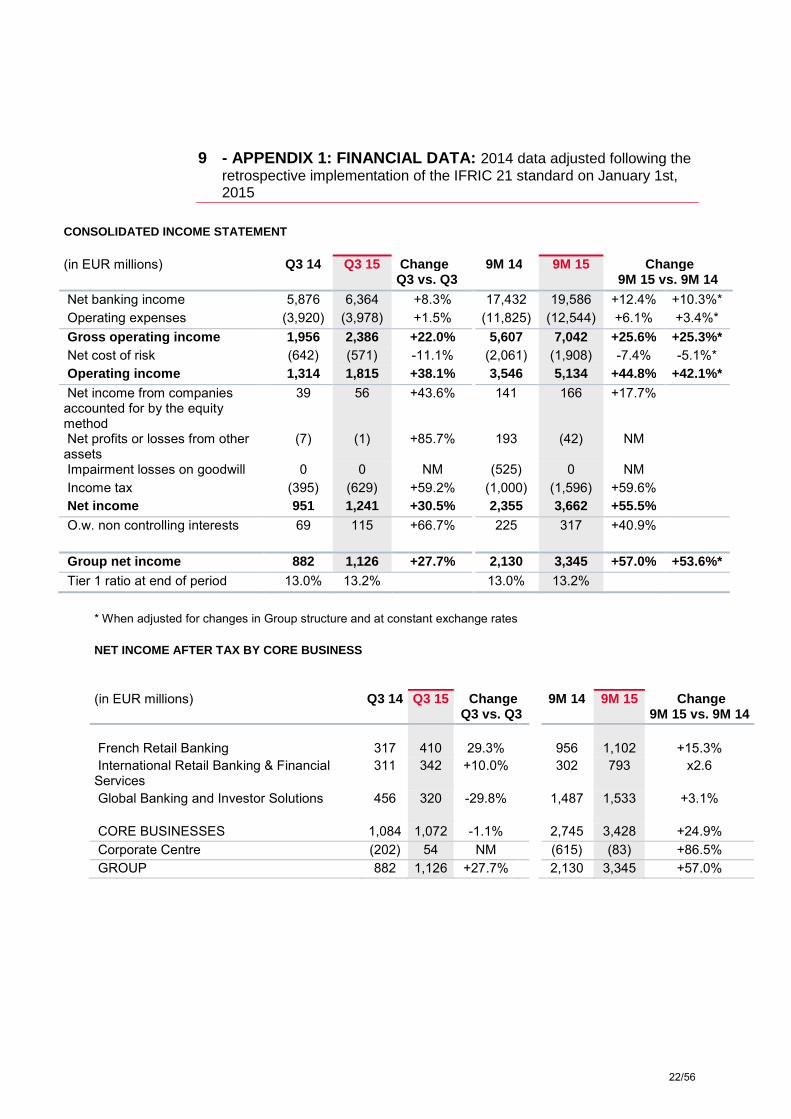
9 - APPENDIX 1: FINANCIAL DATA: 2014 data adjusted following the retrospective implementation of the IFRIC 21 standard on January 1st, 2015
CONSOLIDATED INCOME STATEMENT (in EUR millions) Q3 14 Q3 15 Change
Q3 vs. Q3 9M 14 9M 15 Change
9M 15 vs. 9M 14
Net banking income 5,876 6,364 +8.3% 17,432 19,586 +12.4% +10.3%* Operating expenses (3,920) (3,978) +1.5% (11,825) (12,544) +6.1% +3.4%* Gross operating income 1,956 2,386 +22.0% 5,607 7,042 +25.6% +25.3%* Net cost of risk (642) (571) -11.1% (2,061) (1,908) -7.4% -5.1%* Operating income 1,314 1,815 +38.1% 3,546 5,134 +44.8% +42.1%* Net income from companies accounted for by the equity method
39 56 +43.6% 141 166 +17.7%
Net profits or losses from other assets
(7) (1) +85.7% 193 (42) NM
Impairment losses on goodwill 0 0 NM (525) 0 NM Income tax (395) (629) +59.2% (1,000) (1,596) +59.6% Net income 951 1,241 +30.5% 2,355 3,662 +55.5% O.w. non controlling interests 69 115 +66.7% 225 317 +40.9%
Group net income 882 1,126 +27.7% 2,130 3,345 +57.0% +53.6%* Tier 1 ratio at end of period 13.0% 13.2% 13.0% 13.2%
* When adjusted for changes in Group structure and at constant exchange rates
NET INCOME AFTER TAX BY CORE BUSINESS
(in EUR millions) Q3 14 Q3 15 Change
Q3 vs. Q3 9M 14 9M 15 Change
9M 15 vs. 9M 14 French Retail Banking 317 410 29.3% 956 1,102 +15.3% International Retail Banking & Financial Services
311 342 +10.0% 302 793 x2.6
Global Banking and Investor Solutions 456 320 -29.8% 1,487 1,533 +3.1%
CORE BUSINESSES 1,084 1,072 -1.1% 2,745 3,428 +24.9% Corporate Centre (202) 54 NM (615) (83) +86.5% GROUP 882 1,126 +27.7% 2,130 3,345 +57.0%
22/56
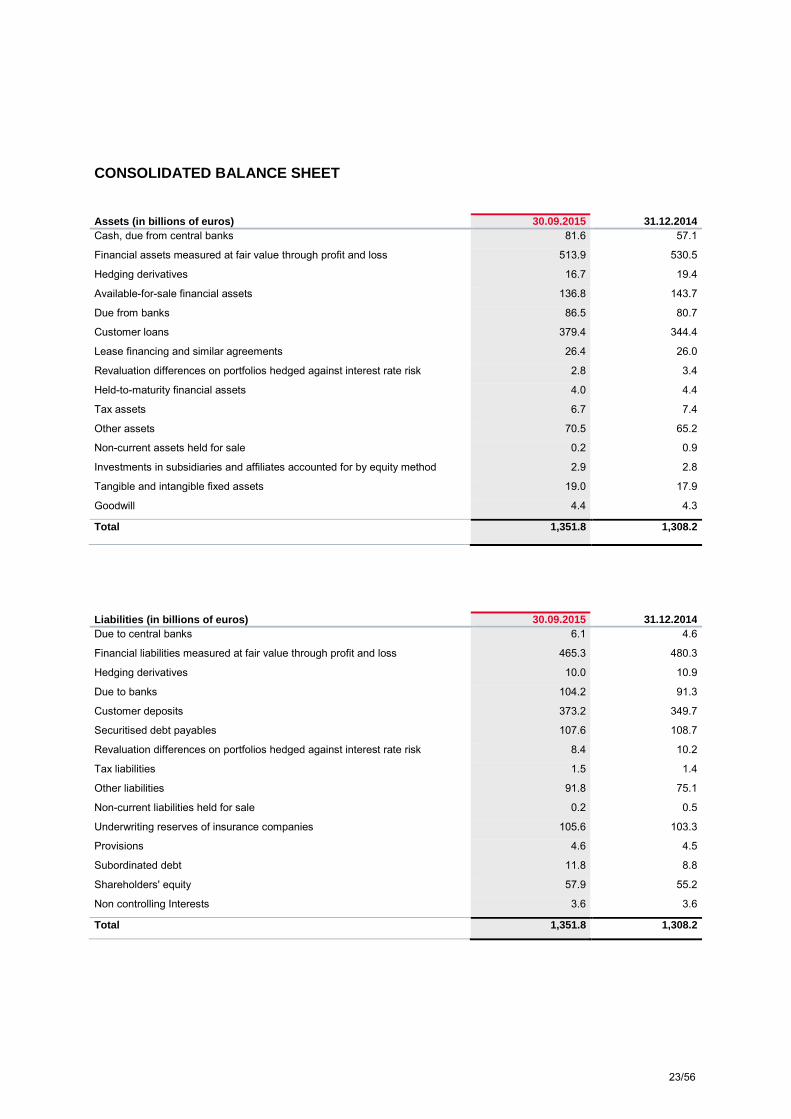
CONSOLIDATED BALANCE SHEET Assets (in billions of euros) 30.09.2015 31.12.2014 Cash, due from central banks 81.6 57.1
Financial assets measured at fair value through profit and loss 513.9 530.5
Hedging derivatives 16.7 19.4
Available-for-sale financial assets 136.8 143.7
Due from banks 86.5 80.7
Customer loans 379.4 344.4
Lease financing and similar agreements 26.4 26.0
Revaluation differences on portfolios hedged against interest rate risk 2.8 3.4
Held-to-maturity financial assets 4.0 4.4
Tax assets 6.7 7.4
Other assets 70.5 65.2
Non-current assets held for sale 0.2 0.9
Investments in subsidiaries and affiliates accounted for by equity method 2.9 2.8
Tangible and intangible fixed assets 19.0 17.9
Goodwill 4.4 4.3
Total 1,351.8 1,308.2
Liabilities (in billions of euros) 30.09.2015 31.12.2014 Due to central banks 6.1 4.6
Financial liabilities measured at fair value through profit and loss 465.3 480.3
Hedging derivatives 10.0 10.9
Due to banks 104.2 91.3
Customer deposits 373.2 349.7
Securitised debt payables 107.6 108.7
Revaluation differences on portfolios hedged against interest rate risk 8.4 10.2
Tax liabilities 1.5 1.4
Other liabilities 91.8 75.1
Non-current liabilities held for sale 0.2 0.5
Underwriting reserves of insurance companies 105.6 103.3
Provisions 4.6 4.5
Subordinated debt 11.8 8.8
Shareholders' equity 57.9 55.2
Non controlling Interests 3.6 3.6
Total 1,351.8 1,308.2
23/56

10 - APPENDIX 2: METHODOLOGY 1- The Group’s consolidated results as at September 30th, 2015 were examined by the Board of Directors on November 4th, 2015. The financial information presented in respect of Q3 2015 has been prepared in accordance with IFRS as adopted in the European Union and applicable at that date, and has not been audited. Note that the data for the 2014 financial year have been restated due to the retrospective implementation on January 1st, 2015 of the IFRIC 21 standard, resulting in the publication of adjusted data for the previous financial year. 2- Group ROE is calculated on the basis of average Group shareholders’ equity under IFRS excluding (i) unrealised or deferred capital gains or losses booked directly under shareholders' equity excluding conversion reserves, (ii) deeply subordinated notes, (iii) undated subordinated notes recognised as shareholders’ equity (“restated”), and deducting (iv) interest payable to holders of deeply subordinated notes and of the restated, undated subordinated notes, (v) a provision in respect of dividends to be paid to shareholders (EUR 1,285 million at September 30th, 2015). The net income used to calculate ROE is based on Group net income excluding interest, net of tax impact, to be paid to holders of deeply subordinated notes for the period and, since 2006, holders of deeply subordinated notes and restated, undated subordinated notes (see below). As from January 1st, 2014, the allocation of capital to the different businesses is based on 10% of risk-weighted assets at the beginning of the period. 3- For the calculation of earnings per share , “Group net income for the period” is corrected (reduced in the case of a profit and increased in the case of a loss) for capital gains/losses recorded on partial buybacks (neutral in 2015) and interest, net of tax impact, to be paid to holders of:
(i) deeply subordinated notes (EUR -111 million in respect of Q3 15 and EUR -330 million for 9M 15),
(ii) undated subordinated notes recognised as shareholders’ equity (EUR +3 million in respect of Q3 15 and EUR +7 million for 9M 15).
Earnings per share is therefore calculated as the ratio of corrected Group net income for the period to the average number of ordinary shares outstanding, excluding own shares and treasury shares but including (a) trading shares held by the Group and (b) shares held under the liquidity contract. 4- Net assets are comprised of Group shareholders’ equity, excluding (i) deeply subordinated notes (EUR 9.4 billion), undated subordinated notes previously recognised as debt (EUR 0.4 billion) and (ii) interest payable to holders of deeply subordinated notes and undated subordinated notes, but reinstating the book value of trading shares held by the Group and shares held under the liquidity contract. Tangible net assets are corrected for net goodwill in the assets and goodwill under the equity method. In order to calculate Net Asset Value Per Share or Tangible Net Asset Value Per Share, the number of shares used to calculate book value per share is the number of shares issued at September 30th, 2015, excluding own shares and treasury shares but including (a) trading shares held by the Group and (b) shares held under the liquidity contract. 5- The Societe Generale Group’s Common Equity Tier 1 capital is calculated in accordance with applicable CRR/CRD4 rules. The fully-loaded solvency ratios are presented pro forma for current earnings, net of dividends, for the current financial year, unless specified otherwise. When there is reference to phased-in ratios, these do not include the earnings for the current financial year, unless specified otherwise. The leverage ratio is calculated according to applicable CRR/CRD4 rules including the provisions of the delegated act of October 2014.
24/56

6- The Group’s ROTE is calculated on the basis of tangible capital, i.e. excluding cumulative average book capital (Group share), average net goodwill in the assets and underlying average goodwill relating to shareholdings in companies accounted for by the equity method. The net income used to calculate ROTE is based on Group net income excluding goodwill write-down, reinstating interest net of tax on deeply subordinated notes for the period (including issuance fees paid, for the period, to external parties and the discount charge related to the issue premium for deeply subordinated notes) and interest net of tax on undated subordinated notes (including issuance fees paid, for the period, to external parties and the discount charge related to the issue premium for undated subordinated notes). 7 – Non-economic items and restatements Non-economic items correspond to the revaluation of own financial liabilities and DVA. Details of these items, and other items that are restated, are given below for Q3 14, Q3 15, 9M 14 and 9M 15. In EUR m
Q3 14 Net banking income
Operating expenses
Others Cost of risk Group net income
Revaluation of own financial liabilities* (4) (3) Corporate Centre Accounting impact of DVA* 2 1 Group Accounting impact of CVA** (39) (26) Group
Provision PEL/CEL (63) (39) French Retail Banking
Q3 15 Net
banking income
Operating expenses
Others Cost of risk
Group net income
Revaluation of own financial liabilities* 447 293 Corporate Centre Accounting impact of DVA* (109) (71) Group Accounting impact of CVA** (14) (9) Group
Provision PEL/CEL (8) (5) French Retail Banking
* Non-economic items **For information
25/56
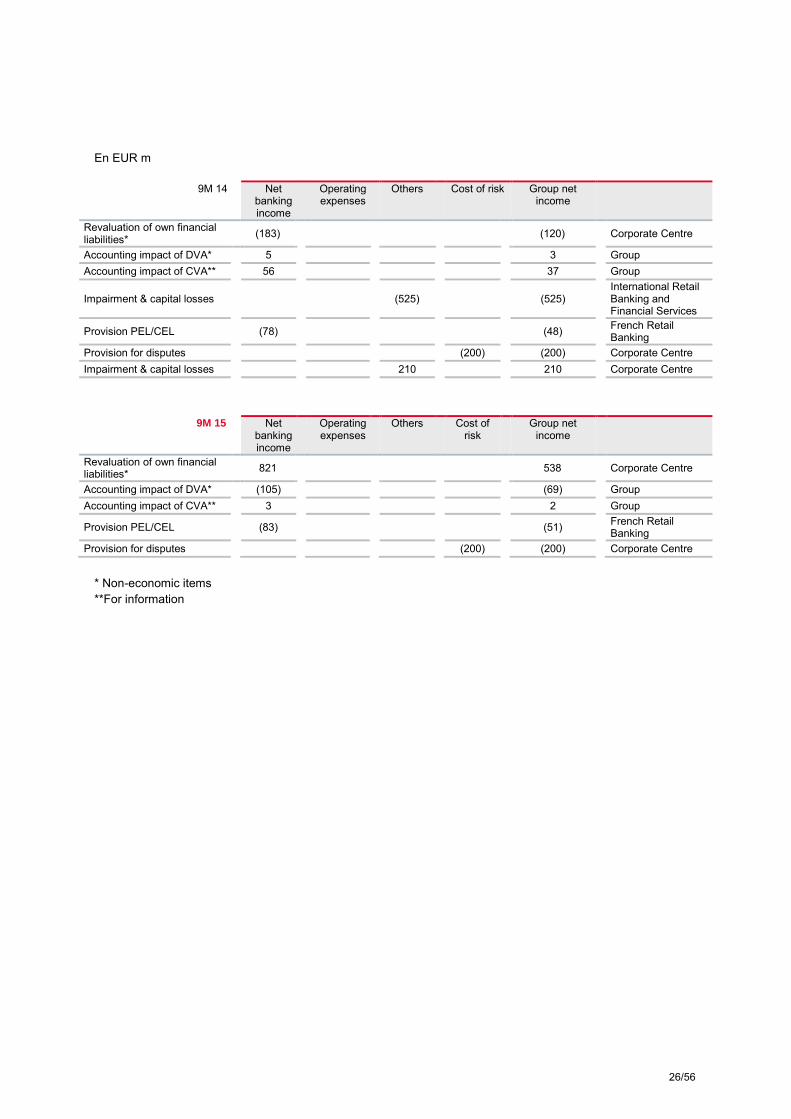
En EUR m
9M 14 Net banking income
Operating expenses
Others Cost of risk Group net income
Revaluation of own financial liabilities* (183) (120) Corporate Centre
Accounting impact of DVA* 5 3 Group Accounting impact of CVA** 56 37 Group
Impairment & capital losses (525) (525) International Retail
Banking and Financial Services
Provision PEL/CEL (78) (48) French Retail Banking
Provision for disputes (200) (200) Corporate Centre Impairment & capital losses 210 210 Corporate Centre
9M 15 Net banking income
Operating expenses
Others Cost of risk
Group net income
Revaluation of own financial liabilities* 821 538 Corporate Centre
Accounting impact of DVA* (105) (69) Group Accounting impact of CVA** 3 2 Group
Provision PEL/CEL (83) (51) French Retail Banking
Provision for disputes (200) (200) Corporate Centre
* Non-economic items **For information
26/56
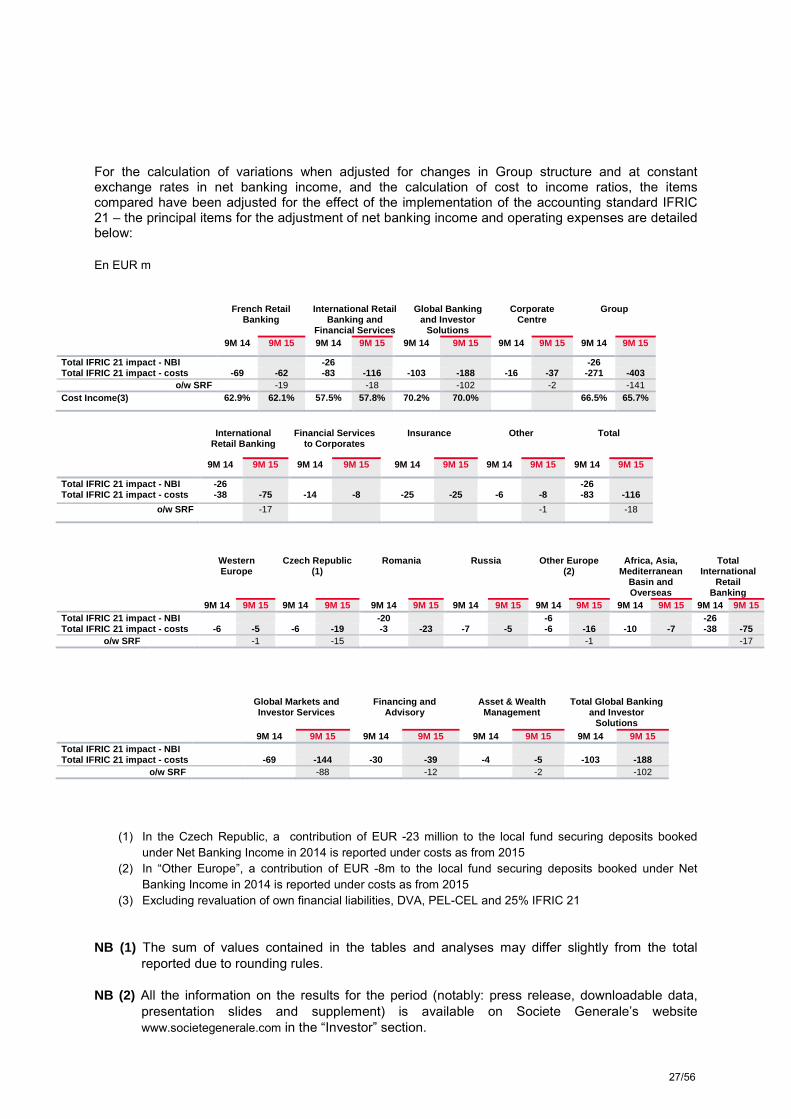
For the calculation of variations when adjusted for changes in Group structure and at constant exchange rates in net banking income, and the calculation of cost to income ratios, the items compared have been adjusted for the effect of the implementation of the accounting standard IFRIC 21 – the principal items for the adjustment of net banking income and operating expenses are detailed below: En EUR m
French Retail Banking
International Retail Banking and
Financial Services
Global Banking and Investor
Solutions
Corporate Centre
Group
9M 14 9M 15 9M 14 9M 15 9M 14 9M 15 9M 14 9M 15 9M 14 9M 15
Total IFRIC 21 impact - NBI -26 -26 Total IFRIC 21 impact - costs -69 -62 -83 -116 -103 -188 -16 -37 -271 -403
o/w SRF -19 -18 -102 -2 -141 Cost Income(3) 62.9% 62.1% 57.5% 57.8% 70.2% 70.0% 66.5% 65.7%
International
Retail Banking Financial Services
to Corporates Insurance Other Total
9M 14 9M 15 9M 14 9M 15 9M 14 9M 15 9M 14 9M 15 9M 14 9M 15
Total IFRIC 21 impact - NBI -26 -26 Total IFRIC 21 impact - costs -38 -75 -14 -8 -25 -25 -6 -8 -83 -116
o/w SRF -17 -1 -18
Western Europe
Czech Republic (1)
Romania Russia Other Europe (2)
Africa, Asia, Mediterranean
Basin and Overseas
Total International
Retail Banking
9M 14 9M 15 9M 14 9M 15 9M 14 9M 15 9M 14 9M 15 9M 14 9M 15 9M 14 9M 15 9M 14 9M 15 Total IFRIC 21 impact - NBI -20 -6 -26 Total IFRIC 21 impact - costs -6 -5 -6 -19 -3 -23 -7 -5 -6 -16 -10 -7 -38 -75
o/w SRF -1 -15 -1 -17
Global Markets and Investor Services
Financing and Advisory
Asset & Wealth Management
Total Global Banking and Investor
Solutions 9M 14 9M 15 9M 14 9M 15 9M 14 9M 15 9M 14 9M 15
Total IFRIC 21 impact - NBI Total IFRIC 21 impact - costs -69 -144 -30 -39 -4 -5 -103 -188
o/w SRF -88 -12 -2 -102
(1) In the Czech Republic, a contribution of EUR -23 million to the local fund securing deposits booked under Net Banking Income in 2014 is reported under costs as from 2015
(2) In “Other Europe”, a contribution of EUR -8m to the local fund securing deposits booked under Net Banking Income in 2014 is reported under costs as from 2015
(3) Excluding revaluation of own financial liabilities, DVA, PEL-CEL and 25% IFRIC 21 NB (1) The sum of values contained in the tables and analyses may differ slightly from the total
reported due to rounding rules. NB (2) All the information on the results for the period (notably: press release, downloadable data,
presentation slides and supplement) is available on Societe Generale’s website www.societegenerale.com in the “Investor” section.
27/56

11 - QUARTERLY SERIES
(in millions of euros) Q1 14 Q2 14 Q3 14 Q4 14 2014 Q1 15 Q2 15 Q3 15
French Retail Banking
Net banking income 2,073 2,066 2,019 2,117 8,275 2,055 2,153 2,162 Operating expenses -1,380 -1,269 -1,285 -1,423 -5,357 -1,391 -1,304 -1,326 Gross operating income 693 797 734 694 2,918 664 849 836 Net cost of risk -232 -269 -237 -303 -1,041 -230 -183 -201 Operating income 461 528 497 391 1,877 434 666 635 Net income from companies accounted for by
the equity method 10 12 13 10 45 15 7 15
Net income from other assets -5 1 -6 -11 -21 -17 -2 0 Income tax -174 -201 -186 -143 -704 -159 -252 -240 Net income 292 340 318 247 1,197 273 419 410 O.w. non controlling interests 1 -8 1 -1 -7 0 0 0 Group net income 291 348 317 248 1,204 273 419 410 Average allocated capital 10,166 10,101 9,892 9,601 9,940 9,743 9,821 9,754 (in millions of euros) Q1 14 Q2 14 Q3 14 Q4 14 2014 Q1 15 Q2 15 Q3 15
International Retail Banking & Financial Services Net banking income 1,790 1,887 1,899 1,848 7,424 1,782 1,854 1,888 Operating expenses -1,119 -1,041 -1,048 -1,071 -4,279 -1,157 -1,047 -1,018 Gross operating income 671 846 851 777 3,145 625 807 870 Net cost of risk -378 -312 -378 -374 -1,442 -333 -287 -302 Operating income 293 534 473 403 1,703 292 520 568 Net income from companies accounted for by
the equity method 7 11 13 19 50 14 7 8
Net income from other assets 3 0 -1 -200 -198 -25 -1 -1 Impairment losses on goodwill -525 0 0 0 -525 0 0 0 Income tax -82 -144 -128 -105 -459 -81 -146 -158 Net income -304 401 357 117 571 200 380 417 O.w. non controlling interests 39 67 46 49 201 61 68 75 Group net income -343 334 311 68 370 139 312 342 Average allocated capital 9,564 9,335 9,676 9,727 9,576 9,513 9,667 9,641
28/56
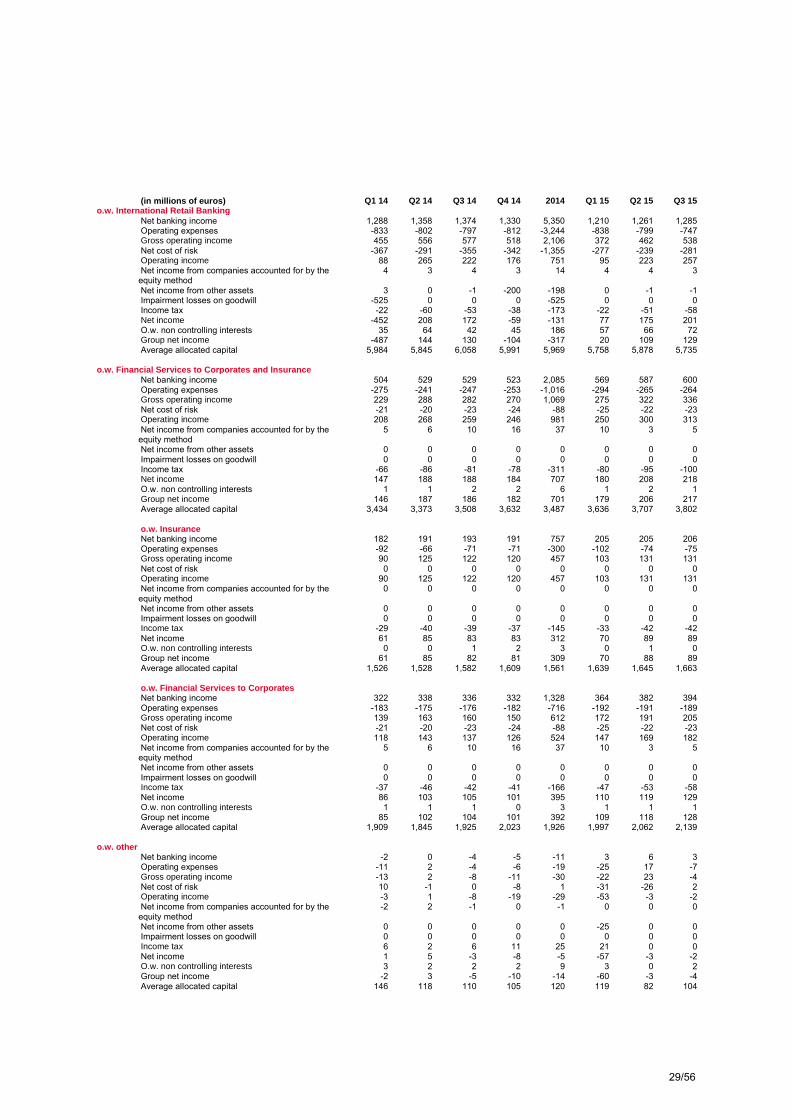
(in millions of euros) Q1 14 Q2 14 Q3 14 Q4 14 2014 Q1 15 Q2 15 Q3 15 o.w. International Retail Banking
Net banking income 1,288 1,358 1,374 1,330 5,350 1,210 1,261 1,285 Operating expenses -833 -802 -797 -812 -3,244 -838 -799 -747 Gross operating income 455 556 577 518 2,106 372 462 538 Net cost of risk -367 -291 -355 -342 -1,355 -277 -239 -281 Operating income 88 265 222 176 751 95 223 257 Net income from companies accounted for by the
equity method 4 3 4 3 14 4 4 3
Net income from other assets 3 0 -1 -200 -198 0 -1 -1 Impairment losses on goodwill -525 0 0 0 -525 0 0 0 Income tax -22 -60 -53 -38 -173 -22 -51 -58 Net income -452 208 172 -59 -131 77 175 201 O.w. non controlling interests 35 64 42 45 186 57 66 72 Group net income -487 144 130 -104 -317 20 109 129 Average allocated capital 5,984 5,845 6,058 5,991 5,969 5,758 5,878 5,735
o.w. Financial Services to Corporates and Insurance Net banking income 504 529 529 523 2,085 569 587 600 Operating expenses -275 -241 -247 -253 -1,016 -294 -265 -264 Gross operating income 229 288 282 270 1,069 275 322 336 Net cost of risk -21 -20 -23 -24 -88 -25 -22 -23 Operating income 208 268 259 246 981 250 300 313 Net income from companies accounted for by the
equity method 5 6 10 16 37 10 3 5
Net income from other assets 0 0 0 0 0 0 0 0 Impairment losses on goodwill 0 0 0 0 0 0 0 0 Income tax -66 -86 -81 -78 -311 -80 -95 -100 Net income 147 188 188 184 707 180 208 218 O.w. non controlling interests 1 1 2 2 6 1 2 1 Group net income 146 187 186 182 701 179 206 217 Average allocated capital 3,434 3,373 3,508 3,632 3,487 3,636 3,707 3,802 o.w. Insurance Net banking income 182 191 193 191 757 205 205 206 Operating expenses -92 -66 -71 -71 -300 -102 -74 -75 Gross operating income 90 125 122 120 457 103 131 131 Net cost of risk 0 0 0 0 0 0 0 0 Operating income 90 125 122 120 457 103 131 131 Net income from companies accounted for by the
equity method 0 0 0 0 0 0 0 0
Net income from other assets 0 0 0 0 0 0 0 0 Impairment losses on goodwill 0 0 0 0 0 0 0 0 Income tax -29 -40 -39 -37 -145 -33 -42 -42 Net income 61 85 83 83 312 70 89 89 O.w. non controlling interests 0 0 1 2 3 0 1 0 Group net income 61 85 82 81 309 70 88 89 Average allocated capital 1,526 1,528 1,582 1,609 1,561 1,639 1,645 1,663 o.w. Financial Services to Corporates Net banking income 322 338 336 332 1,328 364 382 394 Operating expenses -183 -175 -176 -182 -716 -192 -191 -189 Gross operating income 139 163 160 150 612 172 191 205 Net cost of risk -21 -20 -23 -24 -88 -25 -22 -23 Operating income 118 143 137 126 524 147 169 182 Net income from companies accounted for by the
equity method 5 6 10 16 37 10 3 5
Net income from other assets 0 0 0 0 0 0 0 0 Impairment losses on goodwill 0 0 0 0 0 0 0 0 Income tax -37 -46 -42 -41 -166 -47 -53 -58 Net income 86 103 105 101 395 110 119 129 O.w. non controlling interests 1 1 1 0 3 1 1 1 Group net income 85 102 104 101 392 109 118 128 Average allocated capital 1,909 1,845 1,925 2,023 1,926 1,997 2,062 2,139
o.w. other Net banking income -2 0 -4 -5 -11 3 6 3 Operating expenses -11 2 -4 -6 -19 -25 17 -7 Gross operating income -13 2 -8 -11 -30 -22 23 -4 Net cost of risk 10 -1 0 -8 1 -31 -26 2 Operating income -3 1 -8 -19 -29 -53 -3 -2 Net income from companies accounted for by the
equity method -2 2 -1 0 -1 0 0 0
Net income from other assets 0 0 0 0 0 -25 0 0 Impairment losses on goodwill 0 0 0 0 0 0 0 0 Income tax 6 2 6 11 25 21 0 0 Net income 1 5 -3 -8 -5 -57 -3 -2 O.w. non controlling interests 3 2 2 2 9 3 0 2 Group net income -2 3 -5 -10 -14 -60 -3 -4 Average allocated capital 146 118 110 105 120 119 82 104
29/56
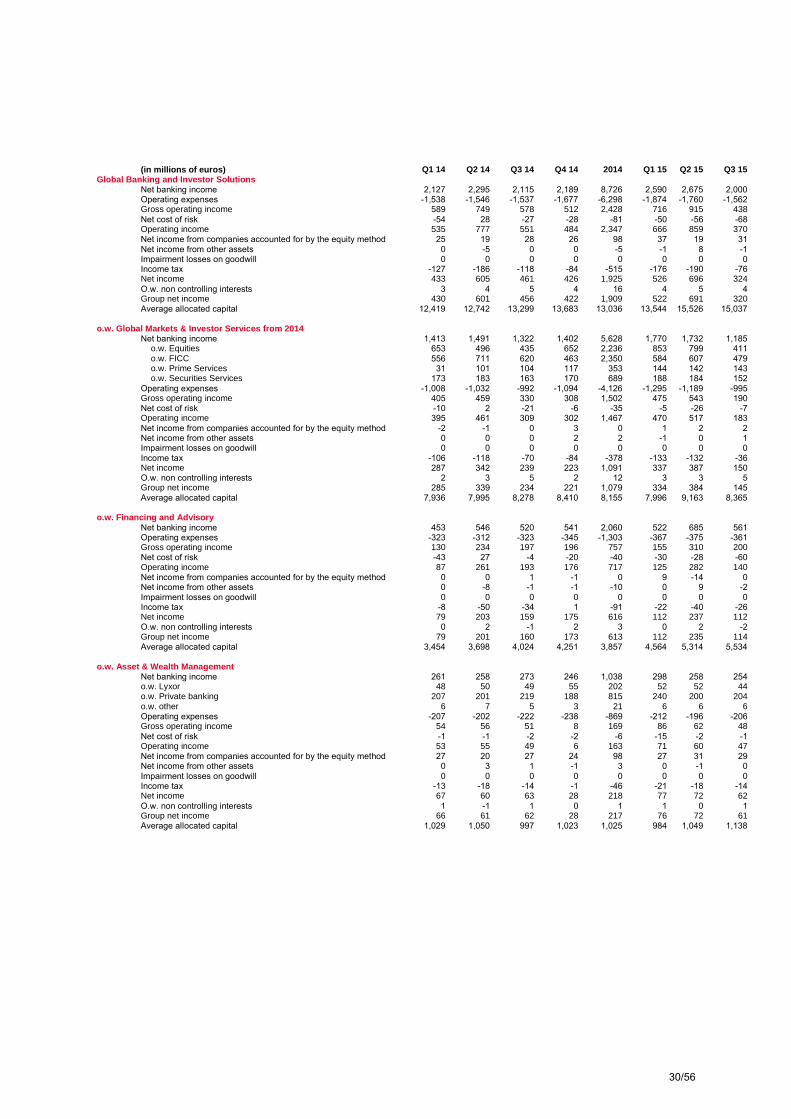
(in millions of euros) Q1 14 Q2 14 Q3 14 Q4 14 2014 Q1 15 Q2 15 Q3 15
Global Banking and Investor Solutions Net banking income 2,127 2,295 2,115 2,189 8,726 2,590 2,675 2,000 Operating expenses -1,538 -1,546 -1,537 -1,677 -6,298 -1,874 -1,760 -1,562 Gross operating income 589 749 578 512 2,428 716 915 438 Net cost of risk -54 28 -27 -28 -81 -50 -56 -68 Operating income 535 777 551 484 2,347 666 859 370 Net income from companies accounted for by the equity method 25 19 28 26 98 37 19 31 Net income from other assets 0 -5 0 0 -5 -1 8 -1 Impairment losses on goodwill 0 0 0 0 0 0 0 0 Income tax -127 -186 -118 -84 -515 -176 -190 -76 Net income 433 605 461 426 1,925 526 696 324 O.w. non controlling interests 3 4 5 4 16 4 5 4 Group net income 430 601 456 422 1,909 522 691 320 Average allocated capital 12,419 12,742 13,299 13,683 13,036 13,544 15,526 15,037
o.w. Global Markets & Inv estor Services from 2014 Net banking income 1,413 1,491 1,322 1,402 5,628 1,770 1,732 1,185 o.w. Equities 653 496 435 652 2,236 853 799 411 o.w. FICC 556 711 620 463 2,350 584 607 479 o.w. Prime Services 31 101 104 117 353 144 142 143 o.w. Securities Services 173 183 163 170 689 188 184 152 Operating expenses -1,008 -1,032 -992 -1,094 -4,126 -1,295 -1,189 -995 Gross operating income 405 459 330 308 1,502 475 543 190 Net cost of risk -10 2 -21 -6 -35 -5 -26 -7 Operating income 395 461 309 302 1,467 470 517 183 Net income from companies accounted for by the equity method -2 -1 0 3 0 1 2 2 Net income from other assets 0 0 0 2 2 -1 0 1 Impairment losses on goodwill 0 0 0 0 0 0 0 0 Income tax -106 -118 -70 -84 -378 -133 -132 -36 Net income 287 342 239 223 1,091 337 387 150 O.w. non controlling interests 2 3 5 2 12 3 3 5 Group net income 285 339 234 221 1,079 334 384 145 Average allocated capital 7,936 7,995 8,278 8,410 8,155 7,996 9,163 8,365
o.w. Financing and Advisory Net banking income 453 546 520 541 2,060 522 685 561 Operating expenses -323 -312 -323 -345 -1,303 -367 -375 -361 Gross operating income 130 234 197 196 757 155 310 200 Net cost of risk -43 27 -4 -20 -40 -30 -28 -60 Operating income 87 261 193 176 717 125 282 140 Net income from companies accounted for by the equity method 0 0 1 -1 0 9 -14 0 Net income from other assets 0 -8 -1 -1 -10 0 9 -2 Impairment losses on goodwill 0 0 0 0 0 0 0 0 Income tax -8 -50 -34 1 -91 -22 -40 -26 Net income 79 203 159 175 616 112 237 112 O.w. non controlling interests 0 2 -1 2 3 0 2 -2 Group net income 79 201 160 173 613 112 235 114 Average allocated capital 3,454 3,698 4,024 4,251 3,857 4,564 5,314 5,534
o.w. Asset & Wealth Management Net banking income 261 258 273 246 1,038 298 258 254 o.w. Lyxor 48 50 49 55 202 52 52 44 o.w. Private banking 207 201 219 188 815 240 200 204 o.w. other 6 7 5 3 21 6 6 6 Operating expenses -207 -202 -222 -238 -869 -212 -196 -206 Gross operating income 54 56 51 8 169 86 62 48 Net cost of risk -1 -1 -2 -2 -6 -15 -2 -1 Operating income 53 55 49 6 163 71 60 47 Net income from companies accounted for by the equity method 27 20 27 24 98 27 31 29 Net income from other assets 0 3 1 -1 3 0 -1 0 Impairment losses on goodwill 0 0 0 0 0 0 0 0 Income tax -13 -18 -14 -1 -46 -21 -18 -14 Net income 67 60 63 28 218 77 72 62 O.w. non controlling interests 1 -1 1 0 1 1 0 1 Group net income 66 61 62 28 217 76 72 61 Average allocated capital 1,029 1,050 997 1,023 1,025 984 1,049 1,138
30/56
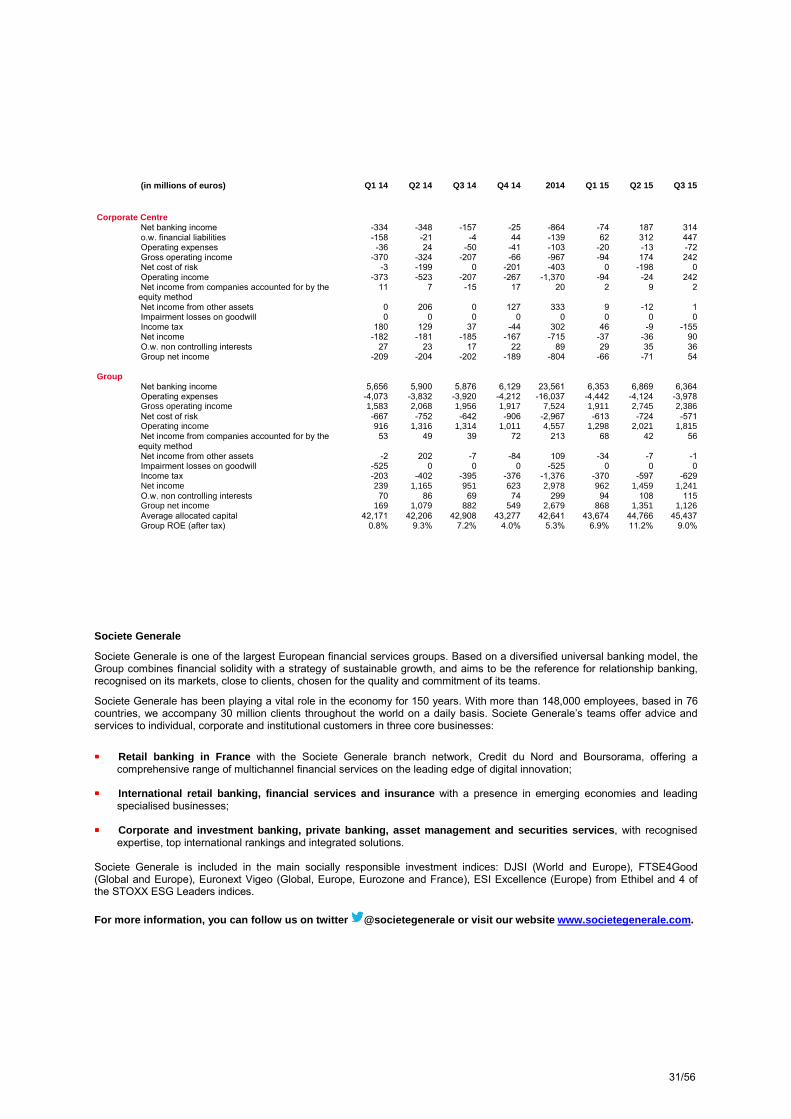
(in millions of euros) Q1 14 Q2 14 Q3 14 Q4 14 2014 Q1 15 Q2 15 Q3 15
Corporate Centre Net banking income -334 -348 -157 -25 -864 -74 187 314 o.w. financial liabilities -158 -21 -4 44 -139 62 312 447 Operating expenses -36 24 -50 -41 -103 -20 -13 -72 Gross operating income -370 -324 -207 -66 -967 -94 174 242 Net cost of risk -3 -199 0 -201 -403 0 -198 0 Operating income -373 -523 -207 -267 -1,370 -94 -24 242 Net income from companies accounted for by the
equity method 11 7 -15 17 20 2 9 2
Net income from other assets 0 206 0 127 333 9 -12 1 Impairment losses on goodwill 0 0 0 0 0 0 0 0 Income tax 180 129 37 -44 302 46 -9 -155 Net income -182 -181 -185 -167 -715 -37 -36 90 O.w. non controlling interests 27 23 17 22 89 29 35 36 Group net income -209 -204 -202 -189 -804 -66 -71 54
Group Net banking income 5,656 5,900 5,876 6,129 23,561 6,353 6,869 6,364 Operating expenses -4,073 -3,832 -3,920 -4,212 -16,037 -4,442 -4,124 -3,978 Gross operating income 1,583 2,068 1,956 1,917 7,524 1,911 2,745 2,386 Net cost of risk -667 -752 -642 -906 -2,967 -613 -724 -571 Operating income 916 1,316 1,314 1,011 4,557 1,298 2,021 1,815 Net income from companies accounted for by the
equity method 53 49 39 72 213 68 42 56
Net income from other assets -2 202 -7 -84 109 -34 -7 -1 Impairment losses on goodwill -525 0 0 0 -525 0 0 0 Income tax -203 -402 -395 -376 -1,376 -370 -597 -629 Net income 239 1,165 951 623 2,978 962 1,459 1,241 O.w. non controlling interests 70 86 69 74 299 94 108 115 Group net income 169 1,079 882 549 2,679 868 1,351 1,126 Average allocated capital 42,171 42,206 42,908 43,277 42,641 43,674 44,766 45,437 Group ROE (after tax) 0.8% 9.3% 7.2% 4.0% 5.3% 6.9% 11.2% 9.0%
Societe Generale
Societe Generale is one of the largest European financial services groups. Based on a diversified universal banking model, the Group combines financial solidity with a strategy of sustainable growth, and aims to be the reference for relationship banking, recognised on its markets, close to clients, chosen for the quality and commitment of its teams.
Societe Generale has been playing a vital role in the economy for 150 years. With more than 148,000 employees, based in 76 countries, we accompany 30 million clients throughout the world on a daily basis. Societe Generale’s teams offer advice and services to individual, corporate and institutional customers in three core businesses:
���� Retail banking in France with the Societe Generale branch network, Credit du Nord and Boursorama, offering a comprehensive range of multichannel financial services on the leading edge of digital innovation;
���� International retail banking, financial services and insuranc e with a presence in emerging economies and leading
specialised businesses; ���� Corporate and investment banking, private banking, asset mana gement and securities services , with recognised
expertise, top international rankings and integrated solutions. Societe Generale is included in the main socially responsible investment indices: DJSI (World and Europe), FTSE4Good (Global and Europe), Euronext Vigeo (Global, Europe, Eurozone and France), ESI Excellence (Europe) from Ethibel and 4 of the STOXX ESG Leaders indices. For more information, you can follow us on twitter @societegenerale or visit our website www.societegenerale.com .
31/56
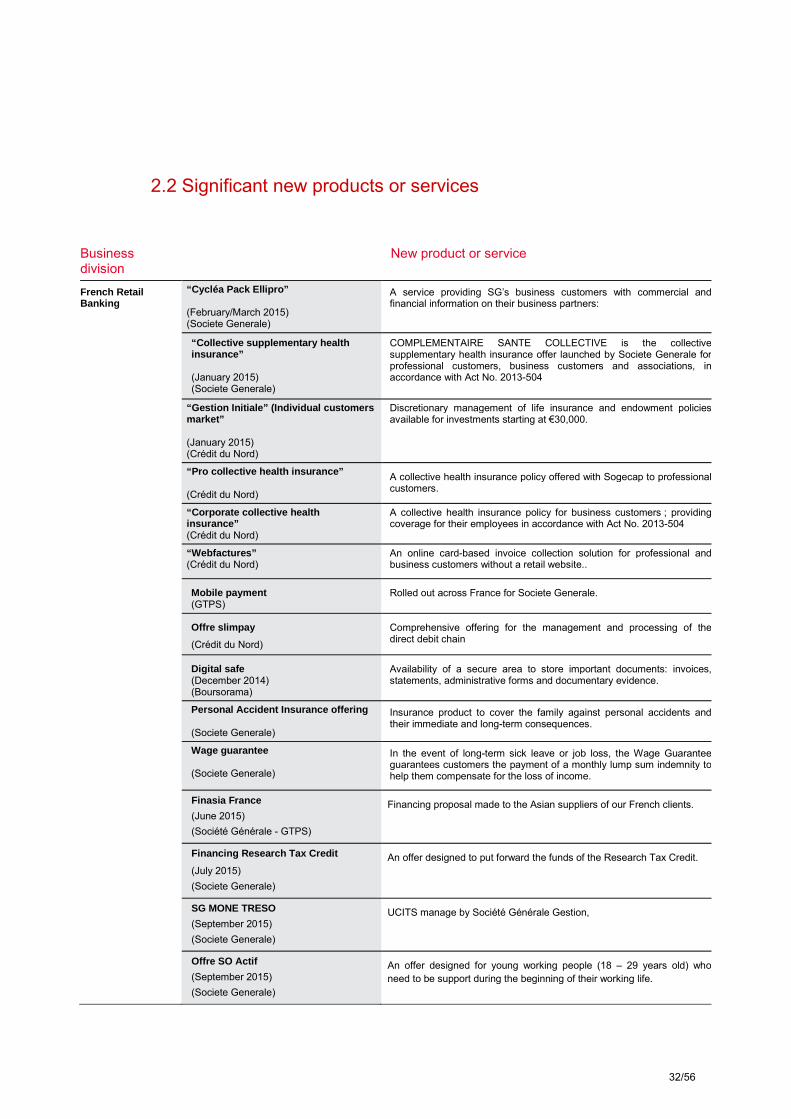
2.2 Significant new products or services
Business division
New product or service
French Retail Banking
“Cycléa Pack Ellipro” (February/March 2015) (Societe Generale)
A service providing SG’s business customers with commercial and financial information on their business partners:
“Collective supplementary health insurance” (January 2015) (Societe Generale)
COMPLEMENTAIRE SANTE COLLECTIVE is the collective supplementary health insurance offer launched by Societe Generale for professional customers, business customers and associations, in accordance with Act No. 2013-504
“Gestion Initiale” (Individual customers market” (January 2015) (Crédit du Nord)
Discretionary management of life insurance and endowment policies available for investments starting at €30,000.
“Pro collective health insurance” (Crédit du Nord)
A collective health insurance policy offered with Sogecap to professional customers.
“Corporate collective health insurance” (Crédit du Nord)
A collective health insurance policy for business customers ; providing coverage for their employees in accordance with Act No. 2013-504
“Webfactures” (Crédit du Nord)
An online card-based invoice collection solution for professional and business customers without a retail website..
Mobile payment (GTPS)
Rolled out across France for Societe Generale.
Offre slimpay
(Crédit du Nord) Comprehensive offering for the management and processing of the direct debit chain
Digital safe (December 2014) (Boursorama)
Availability of a secure area to store important documents: invoices, statements, administrative forms and documentary evidence.
Personal Accident Insurance offering (Societe Generale)
Insurance product to cover the family against personal accidents and their immediate and long-term consequences.
Wage guarantee (Societe Generale)
In the event of long-term sick leave or job loss, the Wage Guarantee guarantees customers the payment of a monthly lump sum indemnity to help them compensate for the loss of income.
Finasia France
(June 2015) (Société Générale - GTPS)
Financing proposal made to the Asian suppliers of our French clients.
Financing Research Tax Credit
(July 2015) (Societe Generale)
An offer designed to put forward the funds of the Research Tax Credit.
SG MONE TRESO
(September 2015) (Societe Generale)
UCITS manage by Société Générale Gestion,
Offre SO Actif
(September 2015) (Societe Generale)
An offer designed for young working people (18 – 29 years old) who need to be support during the beginning of their working life.
32/56

Business division
New product or service
International Retail Banking and Financial Services
“A car with Brains” (March 2015 ; Essox-Czech Republic)
(International Retail Banking)
New service advising clients how to avoid the usual pitfalls of purchasing a car from private individuals. Legal services provided to clients include a draft purchase contract, a vetting of technical conditions and a history of chosen vehicle
“Sound Drive et Sound Cash” (February 2015; SGGH-Ghana)
(International Retail Banking)
Sound Drive is a new motor insurance product allowing to protect a client and its vehicle. Customers may choose from two types of cover:
- Sound Drive Comprehensive, an extensive level of cover and full reimbursement whatever the damage to the vehicle may be
- Sound Drive Third Party, which serves as the minimum compulsory and basic cover for all vehicles.
Sound Cash is a new card protection insurance, first of its kind in Ghana and is designed to protect customers against fraudulent use, in the event where their bank cards or cheque books are lost or stolen.
“Agence bancaire mobile” (February 2015 ; SGBF-Burkina Faso) (International Retail Banking)
New concept of mobile banking agency equipped with a satellite antenn. That point of sale offers the same amenities and the same services as the traditional ‘brick and mortar' agencies. The agency has 4 customer advisor offices, one welcome desk, one cashier desk, a cosy waiting room and an Automated Teller Machine. This concept of mobile banking agency is genuinely innovative, illustrating perfectly SGBF's determination to be close to its clients.
“Booster” ( February 2015 ;BFV-SG-Madagascar) (International Retail Banking))
New dynamic savings offer with new maturities and more advantageous interest rates. BOOSTER is one of the best savings solutions on the Madagascan market by offering a 1 to 36 month placement, with outstanding interest rates starting from 4.5% to 11.5%, according to the duration of the chosen investment. This applies to any account opened from 16th February to 2nd May 2015
“Family insurance 100% online” (March 2015 ; Sogecap-France) (Equipment Finance and Insurance)
New family insurance designed to protect the family, unique on the market for several reasons:
- 100% online, you can subscribe to it immediately without having to have any medical examinations. Amending and closing the contract are also possible online.
Comprehensive and flexible, it includes a lump sum payment in the event of death.
- Comprehensive in the choice between covering being signed off from work alone or covering being signed off from work + being made unemployed, proposing a flat-rate benefit plan (differing from the market which offers benefits according to the type of compensation)
- Offering unique features, it even covers the customer's children in the event of invalidity due to a serious accident, with a lump sum payment and a medical help line available online or by telephone: "Médecin direct" can be used at any time.
« Long-term rental offer for 2-wheelers » (May 2015; ALD-Morocco) (Equipment Finance and Insurance)
New offer allowing rental of 2-wheelers, in order mainly to meet the growing market demand from corporates. This solution consists of a variable duration lease contract associated with a range of services - insurance, maintenance, assistance and tyres. This offer, the first of its kind in Morocco, was implemented in partnership with MOB SHOP (KYMCO's local importer and distributor).
« Home loan with a fixed interest rate » (March/April 2015; BRD-Romania) (International Retail Banking)
New home loan on the Romanian market, denominated in lei and euro, with a fixed 30 year interest rate. The new banking product enables customers to foresee and not be affected by the interest rate and foreign exchange rate evolutions.
33/56
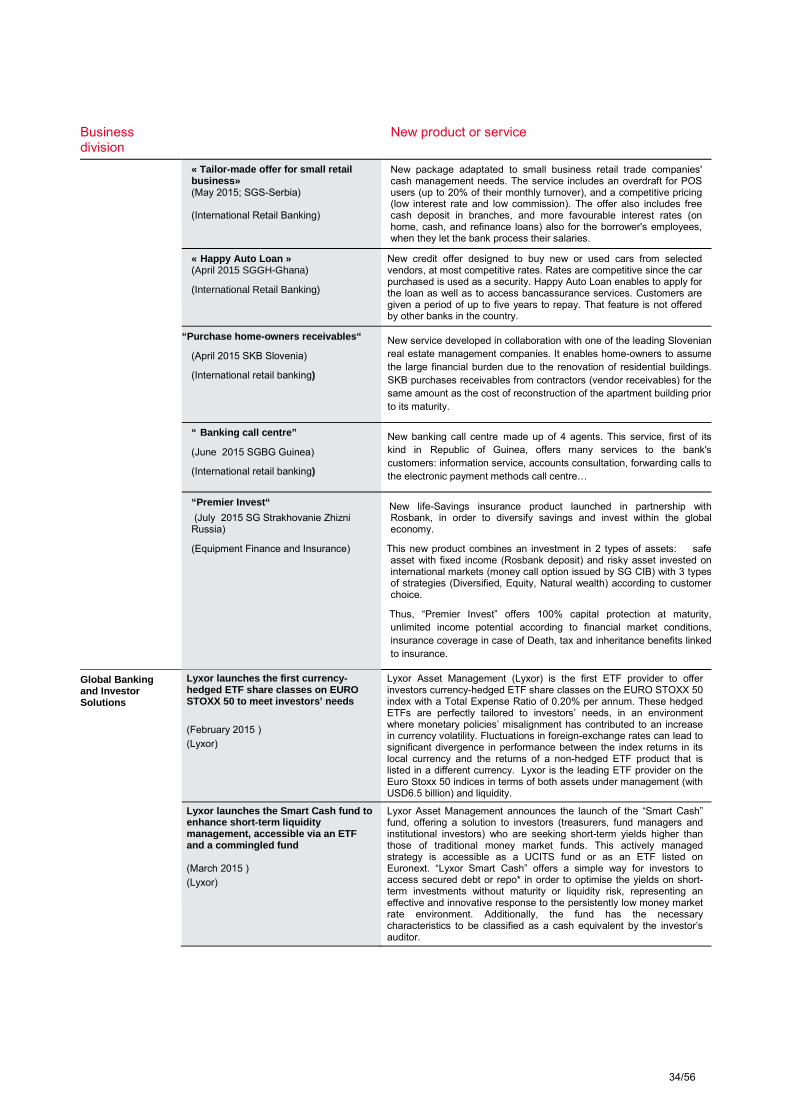
Business division
New product or service
« Tailor-made offer for small retail business» (May 2015; SGS-Serbia) (International Retail Banking)
New package adaptated to small business retail trade companies' cash management needs. The service includes an overdraft for POS users (up to 20% of their monthly turnover), and a competitive pricing (low interest rate and low commission). The offer also includes free cash deposit in branches, and more favourable interest rates (on home, cash, and refinance loans) also for the borrower's employees, when they let the bank process their salaries.
« Happy Auto Loan » (April 2015 SGGH-Ghana)
(International Retail Banking)
New credit offer designed to buy new or used cars from selected vendors, at most competitive rates. Rates are competitive since the car purchased is used as a security. Happy Auto Loan enables to apply for the loan as well as to access bancassurance services. Customers are given a period of up to five years to repay. That feature is not offered by other banks in the country.
“Purchase home-owners receivables“
(April 2015 SKB Slovenia)
(International retail banking)
New service developed in collaboration with one of the leading Slovenian real estate management companies. It enables home-owners to assume the large financial burden due to the renovation of residential buildings.SKB purchases receivables from contractors (vendor receivables) for the same amount as the cost of reconstruction of the apartment building prior to its maturity.
“ Banking call centre”
(June 2015 SGBG Guinea)
(International retail banking)
New banking call centre made up of 4 agents. This service, first of its kind in Republic of Guinea, offers many services to the bank's customers: information service, accounts consultation, forwarding calls to the electronic payment methods call centre…
“Premier Invest“
(July 2015 SG Strakhovanie Zhizni Russia)
(Equipment Finance and Insurance)
New life-Savings insurance product launched in partnership with Rosbank, in order to diversify savings and invest within the global economy.
This new product combines an investment in 2 types of assets: safe asset with fixed income (Rosbank deposit) and risky asset invested on international markets (money call option issued by SG CIB) with 3 types of strategies (Diversified, Equity, Natural wealth) according to customer choice.
Thus, “Premier Invest” offers 100% capital protection at maturity, unlimited income potential according to financial market conditions,insurance coverage in case of Death, tax and inheritance benefits linked to insurance.
Global Banking and Investor Solutions
Lyxor launches the first currency-hedged ETF share classes on EURO STOXX 50 to meet investors’ needs (February 2015 ) (Lyxor)
Lyxor Asset Management (Lyxor) is the first ETF provider to offer investors currency-hedged ETF share classes on the EURO STOXX 50 index with a Total Expense Ratio of 0.20% per annum. These hedged ETFs are perfectly tailored to investors’ needs, in an environment where monetary policies’ misalignment has contributed to an increase in currency volatility. Fluctuations in foreign-exchange rates can lead to significant divergence in performance between the index returns in its local currency and the returns of a non-hedged ETF product that is listed in a different currency. Lyxor is the leading ETF provider on the Euro Stoxx 50 indices in terms of both assets under management (with USD6.5 billion) and liquidity.
Lyxor launches the Smart Cash fund to enhance short-term liquidity management, accessible via an ETF and a commingled fund (March 2015 ) (Lyxor)
Lyxor Asset Management announces the launch of the “Smart Cash” fund, offering a solution to investors (treasurers, fund managers and institutional investors) who are seeking short-term yields higher than those of traditional money market funds. This actively managed strategy is accessible as a UCITS fund or as an ETF listed on Euronext. “Lyxor Smart Cash” offers a simple way for investors to access secured debt or repo* in order to optimise the yields on short-term investments without maturity or liquidity risk, representing an effective and innovative response to the persistently low money market rate environment. Additionally, the fund has the necessary characteristics to be classified as a cash equivalent by the investor’s auditor.
34/56
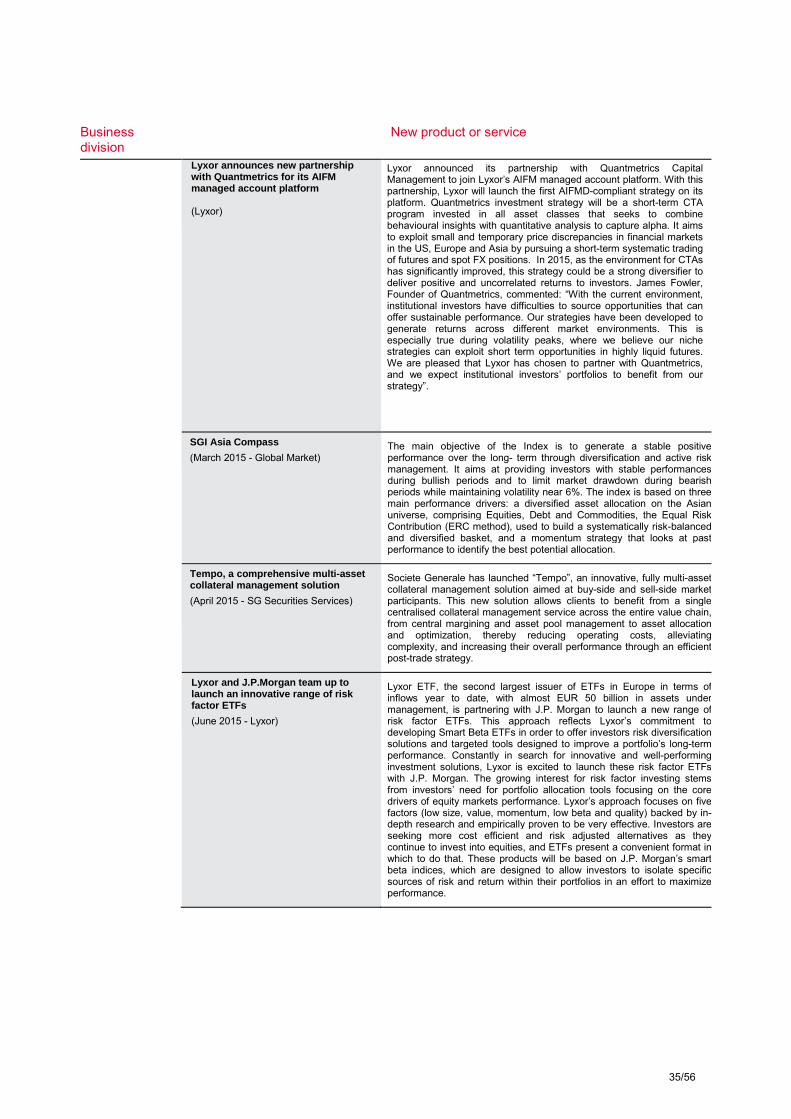
Business division
New product or service
Lyxor announces new partnership with Quantmetrics for its AIFM managed account platform (Lyxor)
Lyxor announced its partnership with Quantmetrics Capital Management to join Lyxor’s AIFM managed account platform. With this partnership, Lyxor will launch the first AIFMD-compliant strategy on its platform. Quantmetrics investment strategy will be a short-term CTA program invested in all asset classes that seeks to combine behavioural insights with quantitative analysis to capture alpha. It aims to exploit small and temporary price discrepancies in financial markets in the US, Europe and Asia by pursuing a short-term systematic trading of futures and spot FX positions. In 2015, as the environment for CTAs has significantly improved, this strategy could be a strong diversifier to deliver positive and uncorrelated returns to investors. James Fowler, Founder of Quantmetrics, commented: “With the current environment, institutional investors have difficulties to source opportunities that can offer sustainable performance. Our strategies have been developed to generate returns across different market environments. This is especially true during volatility peaks, where we believe our niche strategies can exploit short term opportunities in highly liquid futures. We are pleased that Lyxor has chosen to partner with Quantmetrics, and we expect institutional investors’ portfolios to benefit from our strategy”.
SGI Asia Compass
(March 2015 - Global Market) The main objective of the Index is to generate a stable positive performance over the long- term through diversification and active risk management. It aims at providing investors with stable performances during bullish periods and to limit market drawdown during bearish periods while maintaining volatility near 6%. The index is based on three main performance drivers: a diversified asset allocation on the Asian universe, comprising Equities, Debt and Commodities, the Equal Risk Contribution (ERC method), used to build a systematically risk-balanced and diversified basket, and a momentum strategy that looks at past performance to identify the best potential allocation.
Tempo, a comprehensive multi-asset collateral management solution
(April 2015 - SG Securities Services)
Societe Generale has launched “Tempo”, an innovative, fully multi-asset collateral management solution aimed at buy-side and sell-side market participants. This new solution allows clients to benefit from a single centralised collateral management service across the entire value chain, from central margining and asset pool management to asset allocation and optimization, thereby reducing operating costs, alleviating complexity, and increasing their overall performance through an efficient post-trade strategy.
Lyxor and J.P.Morgan team up to launch an innovative range of risk factor ETFs (June 2015 - Lyxor)
Lyxor ETF, the second largest issuer of ETFs in Europe in terms of inflows year to date, with almost EUR 50 billion in assets under management, is partnering with J.P. Morgan to launch a new range of risk factor ETFs. This approach reflects Lyxor’s commitment to developing Smart Beta ETFs in order to offer investors risk diversification solutions and targeted tools designed to improve a portfolio’s long-term performance. Constantly in search for innovative and well-performing investment solutions, Lyxor is excited to launch these risk factor ETFs with J.P. Morgan. The growing interest for risk factor investing stems from investors’ need for portfolio allocation tools focusing on the core drivers of equity markets performance. Lyxor’s approach focuses on five factors (low size, value, momentum, low beta and quality) backed by in-depth research and empirically proven to be very effective. Investors are seeking more cost efficient and risk adjusted alternatives as they continue to invest into equities, and ETFs present a convenient format in which to do that. These products will be based on J.P. Morgan’s smart beta indices, which are designed to allow investors to isolate specific sources of risk and return within their portfolios in an effort to maximize performance.
35/56
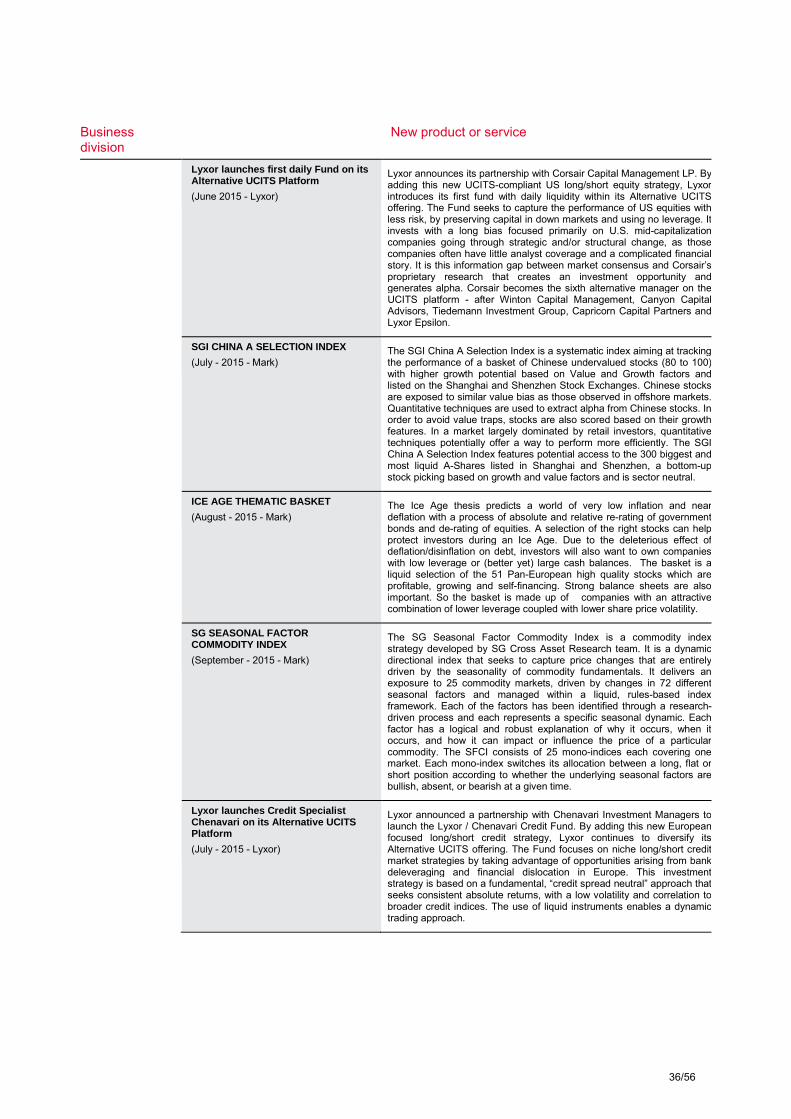
Business division
New product or service
Lyxor launches first daily Fund on its Alternative UCITS Platform
(June 2015 - Lyxor)
Lyxor announces its partnership with Corsair Capital Management LP. By adding this new UCITS-compliant US long/short equity strategy, Lyxor introduces its first fund with daily liquidity within its Alternative UCITS offering. The Fund seeks to capture the performance of US equities with less risk, by preserving capital in down markets and using no leverage. It invests with a long bias focused primarily on U.S. mid-capitalization companies going through strategic and/or structural change, as those companies often have little analyst coverage and a complicated financial story. It is this information gap between market consensus and Corsair’s proprietary research that creates an investment opportunity and generates alpha. Corsair becomes the sixth alternative manager on the UCITS platform - after Winton Capital Management, Canyon Capital Advisors, Tiedemann Investment Group, Capricorn Capital Partners and Lyxor Epsilon.
SGI CHINA A SELECTION INDEX
(July - 2015 - Mark) The SGI China A Selection Index is a systematic index aiming at tracking the performance of a basket of Chinese undervalued stocks (80 to 100) with higher growth potential based on Value and Growth factors and listed on the Shanghai and Shenzhen Stock Exchanges. Chinese stocks are exposed to similar value bias as those observed in offshore markets. Quantitative techniques are used to extract alpha from Chinese stocks. In order to avoid value traps, stocks are also scored based on their growth features. In a market largely dominated by retail investors, quantitative techniques potentially offer a way to perform more efficiently. The SGI China A Selection Index features potential access to the 300 biggest and most liquid A-Shares listed in Shanghai and Shenzhen, a bottom-up stock picking based on growth and value factors and is sector neutral.
ICE AGE THEMATIC BASKET
(August - 2015 - Mark) The Ice Age thesis predicts a world of very low inflation and near deflation with a process of absolute and relative re-rating of government bonds and de-rating of equities. A selection of the right stocks can help protect investors during an Ice Age. Due to the deleterious effect of deflation/disinflation on debt, investors will also want to own companies with low leverage or (better yet) large cash balances. The basket is a liquid selection of the 51 Pan-European high quality stocks which are profitable, growing and self-financing. Strong balance sheets are also important. So the basket is made up of companies with an attractive combination of lower leverage coupled with lower share price volatility.
SG SEASONAL FACTOR COMMODITY INDEX
(September - 2015 - Mark)
The SG Seasonal Factor Commodity Index is a commodity index strategy developed by SG Cross Asset Research team. It is a dynamic directional index that seeks to capture price changes that are entirely driven by the seasonality of commodity fundamentals. It delivers an exposure to 25 commodity markets, driven by changes in 72 different seasonal factors and managed within a liquid, rules-based index framework. Each of the factors has been identified through a research-driven process and each represents a specific seasonal dynamic. Each factor has a logical and robust explanation of why it occurs, when it occurs, and how it can impact or influence the price of a particular commodity. The SFCI consists of 25 mono-indices each covering one market. Each mono-index switches its allocation between a long, flat or short position according to whether the underlying seasonal factors are bullish, absent, or bearish at a given time.
Lyxor launches Credit Specialist Chenavari on its Alternative UCITS Platform
(July - 2015 - Lyxor)
Lyxor announced a partnership with Chenavari Investment Managers to launch the Lyxor / Chenavari Credit Fund. By adding this new European focused long/short credit strategy, Lyxor continues to diversify its Alternative UCITS offering. The Fund focuses on niche long/short credit market strategies by taking advantage of opportunities arising from bank deleveraging and financial dislocation in Europe. This investment strategy is based on a fundamental, “credit spread neutral” approach that seeks consistent absolute returns, with a low volatility and correlation to broader credit indices. The use of liquid instruments enables a dynamic trading approach.
36/56
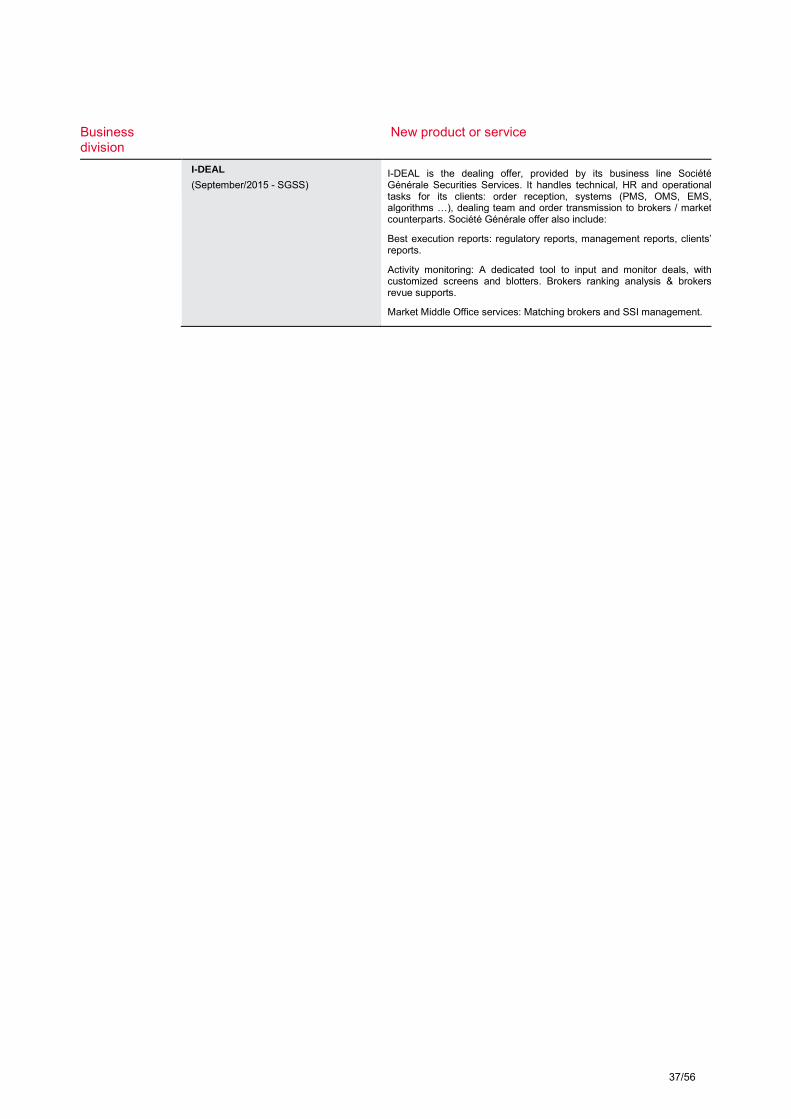
Business division
New product or service
I-DEAL
(September/2015 - SGSS) I-DEAL is the dealing offer, provided by its business line Société Générale Securities Services. It handles technical, HR and operational tasks for its clients: order reception, systems (PMS, OMS, EMS, algorithms …), dealing team and order transmission to brokers / market counterparts. Société Générale offer also include:
Best execution reports: regulatory reports, management reports, clients’ reports.
Activity monitoring: A dedicated tool to input and monitor deals, with customized screens and blotters. Brokers ranking analysis & brokers revue supports.
Market Middle Office services: Matching brokers and SSI management.
37/56
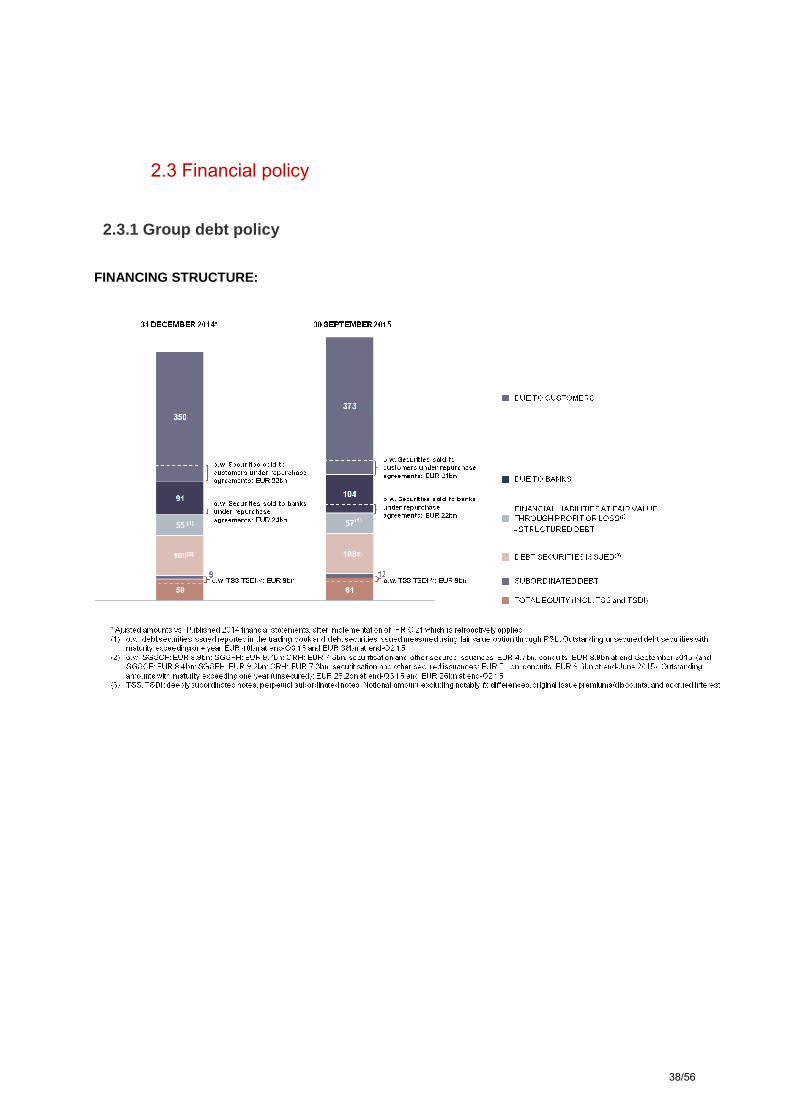
2.3 Financial policy
2.3.1 Group debt policy
FINANCING STRUCTURE:
38/56
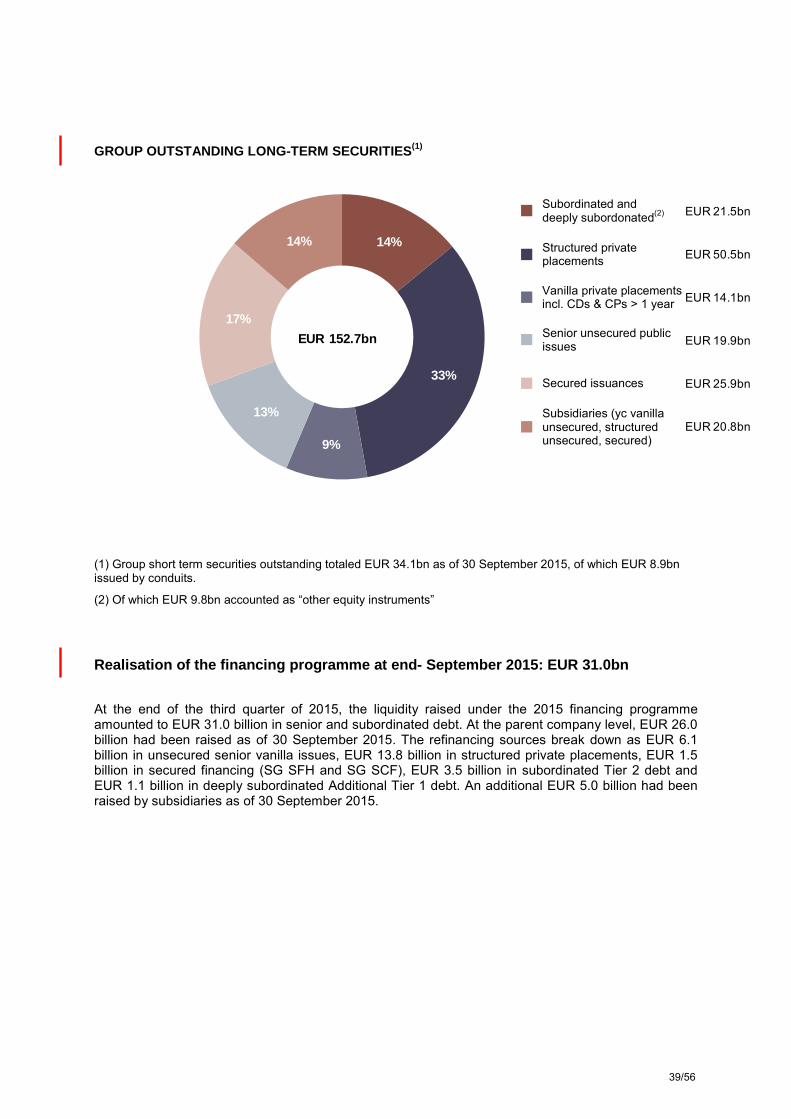
GROUP OUTSTANDING LONG-TERM SECURITIES(1)
14%
33%
9%
13%
17%
14%
EUR 21.5bn
EUR 50.5bn
EUR 14.1bn
EUR 19.9bn
EUR 25.9bn
EUR 20.8bn
EUR 152.7bn
(1) Group short term securities outstanding totaled EUR 34.1bn as of 30 September 2015, of which EUR 8.9bn issued by conduits.
(2) Of which EUR 9.8bn accounted as “other equity instruments”
Realisation of the financing programme at end- September 2015: EUR 31.0bn
At the end of the third quarter of 2015, the liquidity raised under the 2015 financing programme amounted to EUR 31.0 billion in senior and subordinated debt. At the parent company level, EUR 26.0 billion had been raised as of 30 September 2015. The refinancing sources break down as EUR 6.1 billion in unsecured senior vanilla issues, EUR 13.8 billion in structured private placements, EUR 1.5 billion in secured financing (SG SFH and SG SCF), EUR 3.5 billion in subordinated Tier 2 debt and EUR 1.1 billion in deeply subordinated Additional Tier 1 debt. An additional EUR 5.0 billion had been raised by subsidiaries as of 30 September 2015.
Structured private placements
Senior unsecured public issues
Secured issuances
Subordinated and deeply subordonated(2)
Vanilla private placements incl. CDs & CPs > 1 year
Subsidiaries (yc vanilla unsecured, structured unsecured, secured)
39/56
3 - Chapter 3 : Corporate Governance
3.1 Executive Commitee (At 1st September 2015)
Frédéric OUDÉA Chief Executive Officer
Séverin CABANNES Deputy Chief Executive Officer
Bernardo SANCHEZ INCERA Deputy Chief Executive Officer
Gilles BRIATTA Corporate Secretary and Group Chief Compliance Officer
Laurent GOUTARD Head of Societe Generale French Retail Banking
Caroline GUILLAUMIN Head of Group Communication
Didier HAUGUEL Co-Head of International Banking and Financial Services
Philippe HEIM Group Chief Financial Officer
Edouard-Malo HENRY Group Head of Human Resources
Françoise MERCADAL-DELASALLES Group Head of Corporate Resources and Innovation
Benoît OTTENWAELTER Group Chief Risk Officer
Jean-Luc PARER Co-Head of International Banking and Financial Services
Didier VALET Head of Corporate & Investment Banking, Private Banking, Asset Management and Securities Services
40/56

4 - Chapter 4 : Risks and capital adequacy
4.1 Regulatory ratios
4.1.1 Prudential ratio management – Update of the 2015 registration document page 165-168
During the three first quarters of 2015, Societe Generale has issued the following Tier 2 notes: - EUR 1.25 bn on 27 February 2015 ; - USD 1.5 bn on 14 April 2015 ; - EUR150 M on 15 April 2015 ; - AUD 125 M on 2 June 2015 and AUD 50 million on 10 June 2015 ; - CNY 1.2 bn on 3 June 2015 ; - JPY 43.6 bn on 12 June 2015. - USD 50 M on 22 July 2015 ; - JPY 20 bn on 30 September 2015.
In addition, Societe Generale issued a USD 1.25 bn Additional Tier 1 bond on 29 September, 2015. Over the same period, the Group redeemed, at maturity date or on the first call date, the following issues:
- Additional Tier 1 implemented in January 2005 for EUR 728 M; - Additional Tier 1 implemented in October 2009 for USD 1.0 bn; - Tier 2 implemented in April 2000 for EUR 366 M; - Tier 2 implemented in June 2000 for EUR 125 M; - Tier 2 implemented in April 2003 for EUR 94 M
41/56
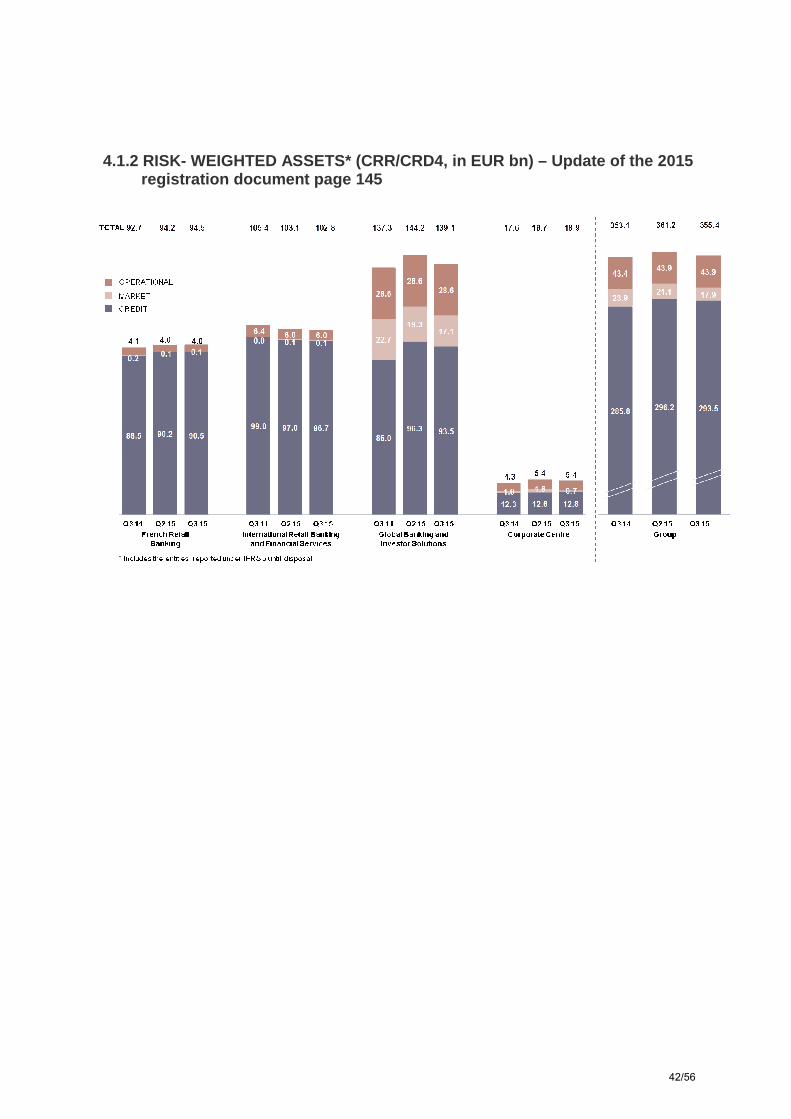
4.1.2 RISK- WEIGHTED ASSETS* (CRR/CRD4, in EUR bn) – Update of the 2015 registra tion document page 145
42/56
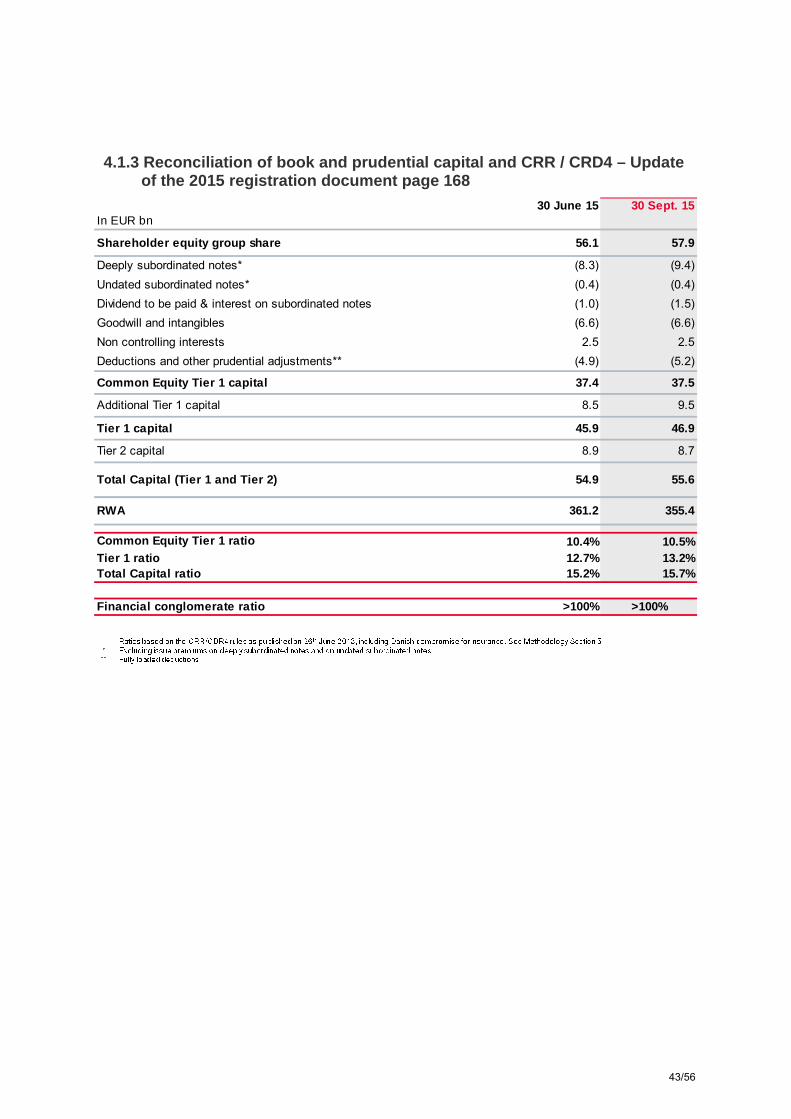
4.1.3 Reconciliation of book and prudential capital and CRR / CRD4 – Update of the 2 015 registration document page 168
30 June 15 30 Sept. 15In EUR bn
Sharehold er equity group share 56.1 57.9
Deeply subordinated notes* (8.3) (9.4)Undated subordinated notes* (0.4) (0.4)Dividend to be paid & interest on subordinated notes (1.0) (1.5)Goodwill and intangibles (6.6) (6.6)Non controlling interests 2.5 2.5Deductions and other prudential adjustments** (4.9) (5.2)
Common Equity Tier 1 capital 37.4 37.5
Additional Tier 1 capital 8.5 9.5
Tier 1 capital 45.9 46.9
Tier 2 capital 8.9 8.7
Total Capital (Tier 1 and Tier 2) 54.9 55.6
RWA 361.2 355.4
Common Equity Tier 1 ratio 10.4% 10.5%Tier 1 ratio 12.7% 13.2%Total Capital ratio 15.2% 15.7%
Financial conglomerate ratio >100% >100%
43/56
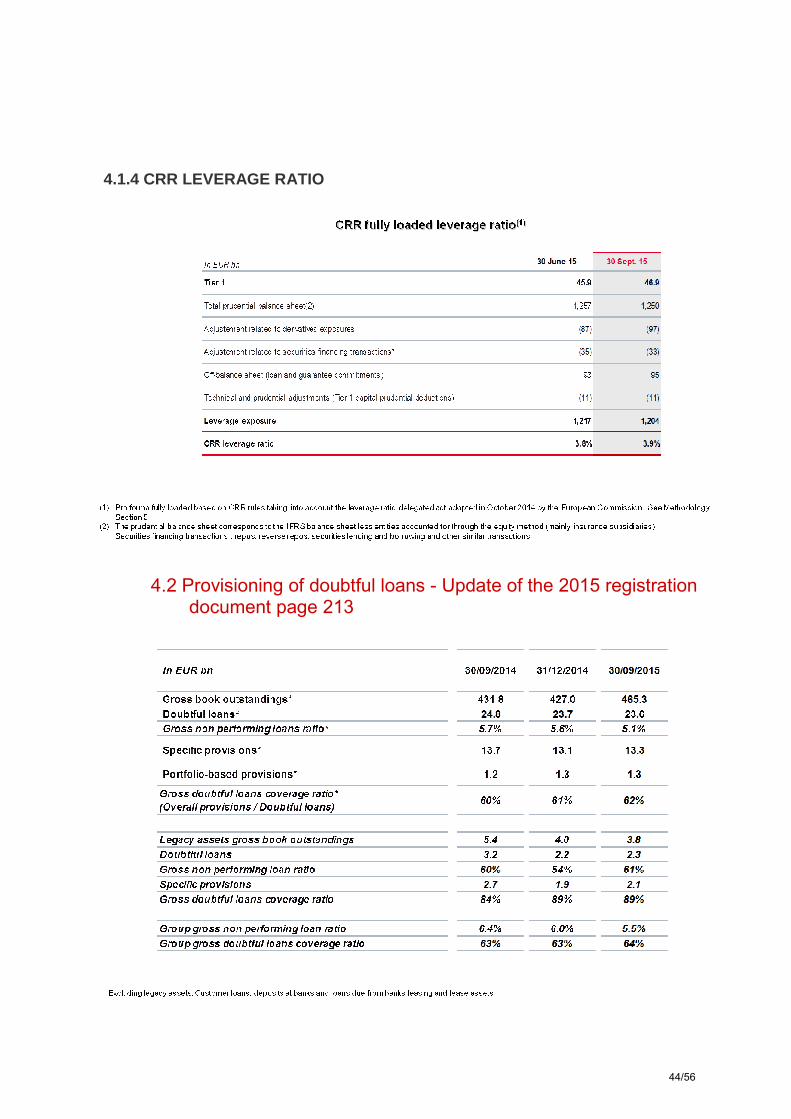
4.1.4 CRR LEVERAGE RATIO
4.2 Provisioning of doubtful loans - Update of the 2015 registration document page 213
44/56

4.3 Change in trading VaR - Update of the 2015 registration document page 250
Quarterly average 99% Value at Risk (VaR), a composite indicator used for the day-to-day monitoring of the market risks incurred by the bank, on the scope of its trading activities, in millions of euros:
CHANGE IN TRADING VAR*
45/56

4.4 Liquidity risks
4.4.1 Liquid asset buffer - Update of the 2015 registration document page 271
LIQUID ASSET BUFFER
46/56
4.5 Legal risks – update of the 2015 registration document page 281
• Societe Generale, along with other financial institutions, also has been named as a defendant in
a second putative class action involving Yen LIBOR and Euroyen TIBOR. The suit is brought on behalf of plaintiffs who purchased financial instruments tied to Yen LIBOR or Euroyen TIBOR and alleges claims under US antitrust law and the civil provision of the Racketeer Influenced Corrupt Organization (“RICO”) Act, among other claims. Societe Generale, along with other financial institutions, also has been named as a defendant in a putative class action in the United States District Court in Manhattan that alleges violations of, among other laws, United States antitrust laws, the United States Commodity Exchange Act in connection with a Euro denominated index. The action is brought on behalf of purchasers or sellers of EURIBOR-linked futures contracts on the NYSE LIFFE exchange, Euro currency futures contracts on the Chicago Mercantile Exchange and other Euro-linked derivatives which are alleged to have traded at artificial levels due to alleged manipulation of EURIBOR rates. A motion to dismiss has been filed.
• Societe Generale, along with other financial institutions, has been named as a defendant in a putative class action alleging violations of United States antitrust laws and the United States Commodity Exchange Act in connection with its involvement in the London Gold Market Fixing. The action is brought on behalf of persons or entities that sold physical gold, sold gold futures contracts traded on the Chicago Mercantile Exchange (“COMEX”), sold shares in gold ETFs, sold gold call options traded on COMEX; bought gold put options traded on COMEX, sold over-the-counter gold spot or forward contracts or gold call options, or bought over-the-counter gold put options. The action is pending in the United States District Court in Manhattan. Motions to dismiss the action have been filed and are pending.
• SG Americas Securities, LLC, along with other financial institutions, has been named as a defendant in several putative class actions alleging violations of United States antitrust laws and the United States Commodity Exchange Act in connection with its activities as a United States Primary Dealer, buying and selling United States Treasury securities. The matter is pending in the United States District Court in Manhattan. SGAS’s time to respond to the complaints has not yet been set.
• Societe Generale, along with several other financial institutions, has been named as a defendant in a putative class action that is pending in the United States District Court in Manhattan. The action, which is brought by persons or entities that transacted in certain over the counter and exchange-traded foreign exchange instruments, alleges violations of United States antitrust laws and the United States Commodity Exchange Act in connection with foreign exchange spot and derivatives trading. Societe Generale has also been named as a defendant in two class actions in Canada on the same grounds.
• On 22 May 2013, the ACPR launched disciplinary proceedings against Societe Generale in
relation to the resources and procedures deployed by its pursuant to the legal requirements relating to the “right to a bank account” (“Droit au compte”). On 11 April 2014, the ACPR sanctions commission imposed the following sanctions on Societe Generale: a fine of EUR 2 million, a reprimand, and the publication of the decision. In May 2014, Societe Generale referred this decision to the Conseil d’Etat. By a judgment handed down on 14 October 2015, the Conseil d’Etat cancelled the ACPR’s penalty of 11th April 2014.
47/56
5 - Chapter 8 : Person responsible for updating the Registration Document
5.1 Person responsible for updating the Registration Document Mr. Frédéric OUDÉA, Chief Executive Officer of Societe Generale
5.2 Statement of the person responsible for updating the Registration Document
I hereby certify, having taken all reasonable measures to this effect and to the best of my knowledge that the information contained in the present update of the 2015 Registration Document is in accordance with the facts and that it makes no omission likely to affect its import.
I have received a completion letter from the Statutory Auditors, stating that they have verified the information contained in the present update about the Group’s financial position and accounts and that they have read the 2015 Registration Document, its updates A-01, A-02 and the present update in their entirety.
The historical financial information presented in the 2015 Registration Document has been discussed in the Statutory Auditors’ reports found on pages 460 to 461 and 518 to 519 of the 2015 Registration Document, and those enclosed for reference purposes for the financial years 2012 and 2013, found respectively on pages 385 to 386 and 446 to 447 of the 2013 Registration Document and on pages 376 to 377 and 434 to 435 of the 2014 Registration Document. The Statutory Auditors’ reports on the 2014 and 2013 consolidated financial statements and on the 2012 parent company financial statements contain observations. The Statutory Auditors’ report on the condensed interim consolidated financial statements dated June 30, 2015 contains an observation.
Paris, November 6th, 2015
Mr. Frédéric OUDÉA
Chief Executive Officer of Societe Generale
48/56

5.3 Persons responsible for the audit of the financial statements STATUTORY AUDITORS Name: Société Ernst & Young et Autres
represented by Ms. Isabelle Santenac Address : 1/2, place des Saisons
92400 Courbevoie – Paris-La Défense 1 Date of appointment : May 22, 2012 Term of current mandate : 6 fiscal years End of current mandate : at the end of the Ordinary General Meeting which will approve the financial statements for the year ended December 31, 2017. Name: Société Deloitte et Associés
represented by Mr. José-Luis Garcia Address : 185, avenue Charles de Gaulle
92524 Neuilly-sur-Seine Cedex Date of first appointment : April 18, 2003 Date of renewal : May 22, 2012 Term of current mandate : 6 fiscal years End of current mandate : at the end of the Ordinary General Meeting which will approve the financial statements for the year ended December 31, 2017. SUBSTITUTE STATUTORY AUDITORS Name: Société Picarle et Associés Address : 1/2, place des Saisons
92400 Courbevoie – Paris-La Défense 1 Date of appointment : May 22, 2012 Term of current mandate : 6 fiscal years Name: Société BEAS Address : 7-9 Villa Houssay
92200 Neuilly-sur-Seine Date of appointment : May 22, 2012 Term of mandate : 6 fiscal years Ernst & Young et Autres and Deloitte et Associés are registered as Statutory Auditors with the Compagnie régionale des Commissaires aux comptes de Versailles.
49/56
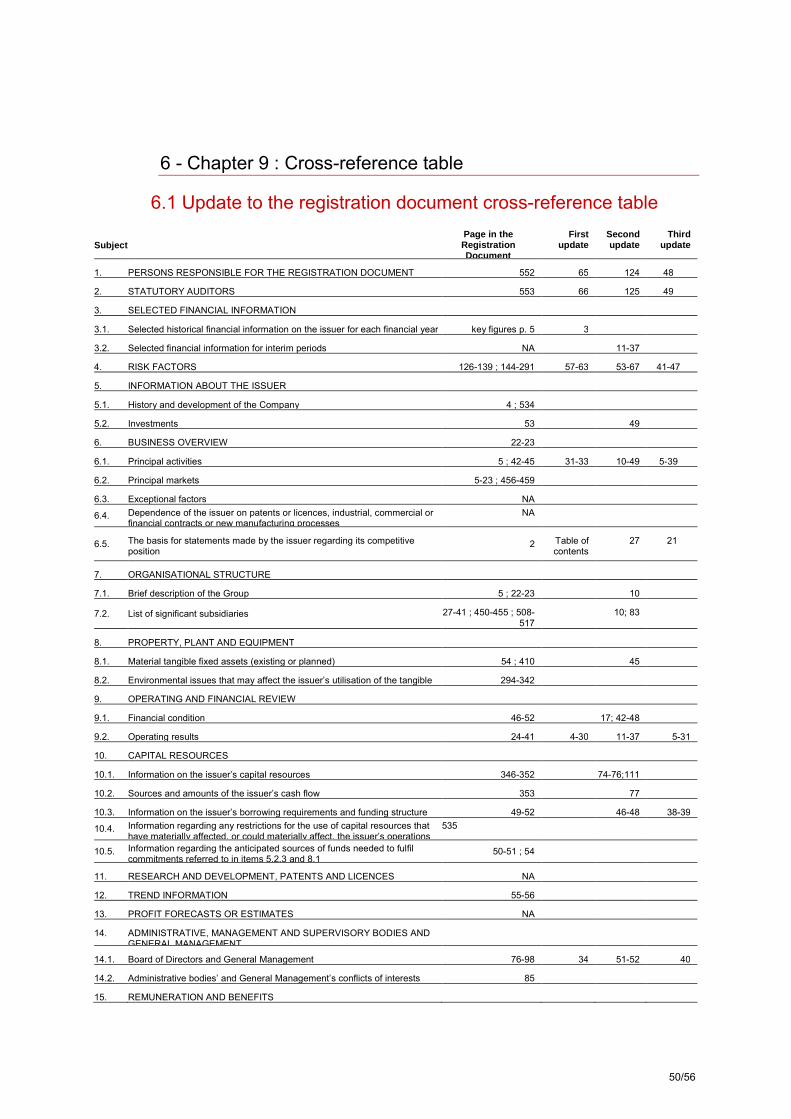
6 - Chapter 9 : Cross-reference table
6.1 Update to the registration document cross-reference table
Subject Page in the Registration Document
First update
Second update
Third update
1. PERSONS RESPONSIBLE FOR THE REGISTRATION DOCUMENT 552 65 124 48
2. STATUTORY AUDITORS 553 66 125 49
3. SELECTED FINANCIAL INFORMATION 3.1. Selected historical financial information on the issuer for each financial year key figures p. 5 3
3.2. Selected financial information for interim periods NA 11-37
4. RISK FACTORS 126-139 ; 144-291 57-63 53-67 41-47
5. INFORMATION ABOUT THE ISSUER 5.1. History and development of the Company 4 ; 534
5.2. Investments 53 49
6. BUSINESS OVERVIEW 22-23
6.1. Principal activities 5 ; 42-45 31-33 10-49 5-39
6.2. Principal markets 5-23 ; 456-459
6.3. Exceptional factors NA
6.4. Dependence of the issuer on patents or licences, industrial, commercial or financial contracts or new manufacturing processes
NA
6.5. The basis for statements made by the issuer regarding its competitive position 2 Table of
contents 27 21
7. ORGANISATIONAL STRUCTURE 7.1. Brief description of the Group 5 ; 22-23 10
7.2. List of significant subsidiaries 27-41 ; 450-455 ; 508-517
10; 83
8. PROPERTY, PLANT AND EQUIPMENT 8.1. Material tangible fixed assets (existing or planned) 54 ; 410 45
8.2. Environmental issues that may affect the issuer’s utilisation of the tangible
294-342
9. OPERATING AND FINANCIAL REVIEW 9.1. Financial condition 46-52 17; 42-48
9.2. Operating results 24-41 4-30 11-37 5-31
10. CAPITAL RESOURCES 10.1. Information on the issuer’s capital resources 346-352 74-76;111
10.2. Sources and amounts of the issuer’s cash flow 353 77
10.3. Information on the issuer’s borrowing requirements and funding structure 49-52 46-48 38-39
10.4. Information regarding any restrictions for the use of capital resources that have materially affected, or could materially affect, the issuer’s operations
535
10.5. Information regarding the anticipated sources of funds needed to fulfil commitments referred to in items 5.2.3 and 8.1 50-51 ; 54
11. RESEARCH AND DEVELOPMENT, PATENTS AND LICENCES NA
12. TREND INFORMATION 55-56
13. PROFIT FORECASTS OR ESTIMATES NA
14. ADMINISTRATIVE, MANAGEMENT AND SUPERVISORY BODIES AND GENERAL MANAGEMENT
14.1. Board of Directors and General Management 76-98 34 51-52 40
14.2. Administrative bodies’ and General Management’s conflicts of interests 85
15. REMUNERATION AND BENEFITS
50/56

15.1. Amount of remuneration paid and benefits in kind 99-123 34-56
15.2. Total amounts set aside or accrued by the issuer to provide pension, 446
Subject Page in the Registration Document
First update
Second update
Third update
16. BOARD PRACTICES 16.1. Date of expiration of the current term of office 77-82
16.2. Members of the administrative bodies’ service contracts with the issuer NA
16.3. Information about the issuer’s Audit Committee and Remuneration
94-96
16.4. Statement as to whether or not the issuer complies with the corporate governance regime
87
17. EMPLOYEES 17.1. Number of employees 313-327
17.2. Shareholdings and stock options awarded to directors 77-81 ; 99-123 103
17.3. Arrangements for involving employees in the capital of the issuer 327
18. MAJOR SHAREHOLDERS 18.1. Shareholders owning more than 5% of capital or voting rights 528-529 111
18.2. Different voting rights held by the major shareholders 528-529 ; 535 111
18.3. Control of the issuer 528-529
18.4. Arrangements known to the issuer, the operation of which may at a subsequent date result in a change in control of the issuer
NA
19. RELATED PARTY TRANSACTIONS 124-125 ; 446 ; 508-517
20. FINANCIAL INFORMATION CONCERNING THE ASSETS AND LIABILITIES, FINANCIAL POSITION AND PROFITS AND LOSSES OF
20.1. Historical financial information 346-459 ; 464-517; 557
20.2. Pro forma financial information NA
20.3. Financial statements 346-459 ; 464-517
20.4. Auditing of historical annual financial information 140-141 ; 460-461 ; 518-519
20.5. Age of latest financial information 346 ; 464 68
20.6. Interim financial information NA 4-30 11-37; 68-108
5-31
20.7. Dividend policy 522-525 51
20.8. Legal and arbitration proceedings 281-283 47
20.9. Significant changes in the issuer’s financial or trading position 53
21. ADDITIONAL INFORMATION 21.1. Share capital 526-535 64 111
21.2. Memorandum and by-laws 536-540 64
22. MATERIAL CONTRACTS 54
23. THIRD-PARTY INFORMATION AND STATEMENTS BY EXPERTS AND DECLARATIONS OF ANY INTEREST NA
24. DOCUMENTS ON DISPLAY 535
25. INFORMATION ON HOLDINGS 22-23 ; 450-455 ; 508-517
51/56
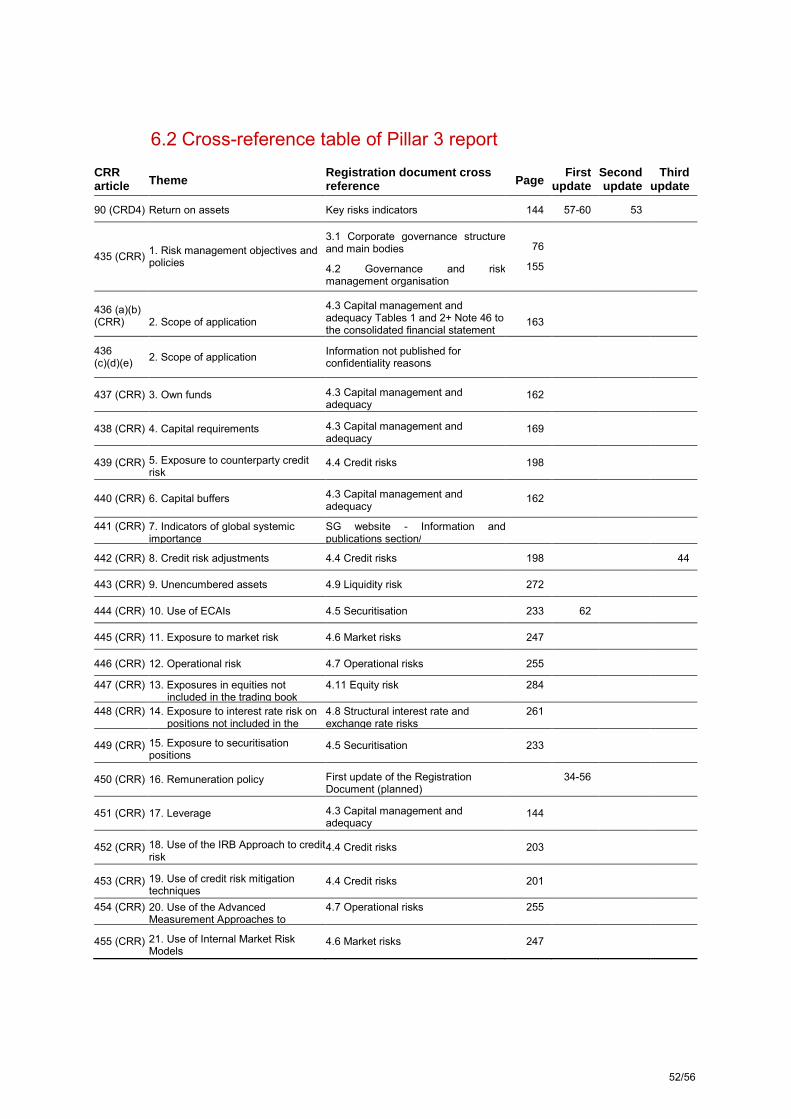
6.2 Cross-reference table of Pillar 3 report CRR arti cle Theme Registration document cross
referenc e Page First update
Second update
Third update
90 (CRD4) Return on assets Key risks indicators 144 57-60 53
435 (CRR) 1. Risk management objectives and policies
3.1 Corporate governance structure and main bodies
4.2 Governance and risk management organisation
76 155
436 (a)(b) (CRR) 2. Scope of application
4.3 Capital management and adequacy Tables 1 and 2+ Note 46 to the consolidated financial statement
163
436 (c)(d)(e)
(CRR)
2. Scope of application Information not published for confidentiality reasons
437 (CRR) 3. Own funds 4.3 Capital management and adequacy
162
438 (CRR) 4. Capital requirements 4.3 Capital management and adequacy
169
439 (CRR) 5. Exposure to counterparty credit risk
4.4 Credit risks 198
440 (CRR) 6. Capital buffers 4.3 Capital management and adequacy 162
441 (CRR) 7. Indicators of global systemic importance
SG website - Information and publications section/
442 (CRR) 8. Credit risk adjustments 4.4 Credit risks 198 44
443 (CRR) 9. Unencumbered assets 4.9 Liquidity risk 272
444 (CRR) 10. Use of ECAIs 4.5 Securitisation 233 62
445 (CRR) 11. Exposure to market risk 4.6 Market risks 247
446 (CRR) 12. Operational risk 4.7 Operational risks 255
447 (CRR) 13. Exposures in equities not included in the trading book
4.11 Equity risk 284
448 (CRR) 14. Exposure to interest rate risk on positions not included in the
4.8 Structural interest rate and exchange rate risks
261
449 (CRR) 15. Exposure to securitisation positions
4.5 Securitisation 233
450 (CRR) 16. Remuneration policy First update of the Registration Document (planned)
34-56
451 (CRR) 17. Leverage 4.3 Capital management and adequacy
144
452 (CRR) 18. Use of the IRB Approach to credit risk
4.4 Credit risks 203
453 (CRR) 19. Use of credit risk mitigation techniques
4.4 Credit risks 201
454 (CRR) 20. Use of the Advanced Measurement Approaches to
4.7 Operational risks 255
455 (CRR) 21. Use of Internal Market Risk Models
4.6 Market risks 247
52/56
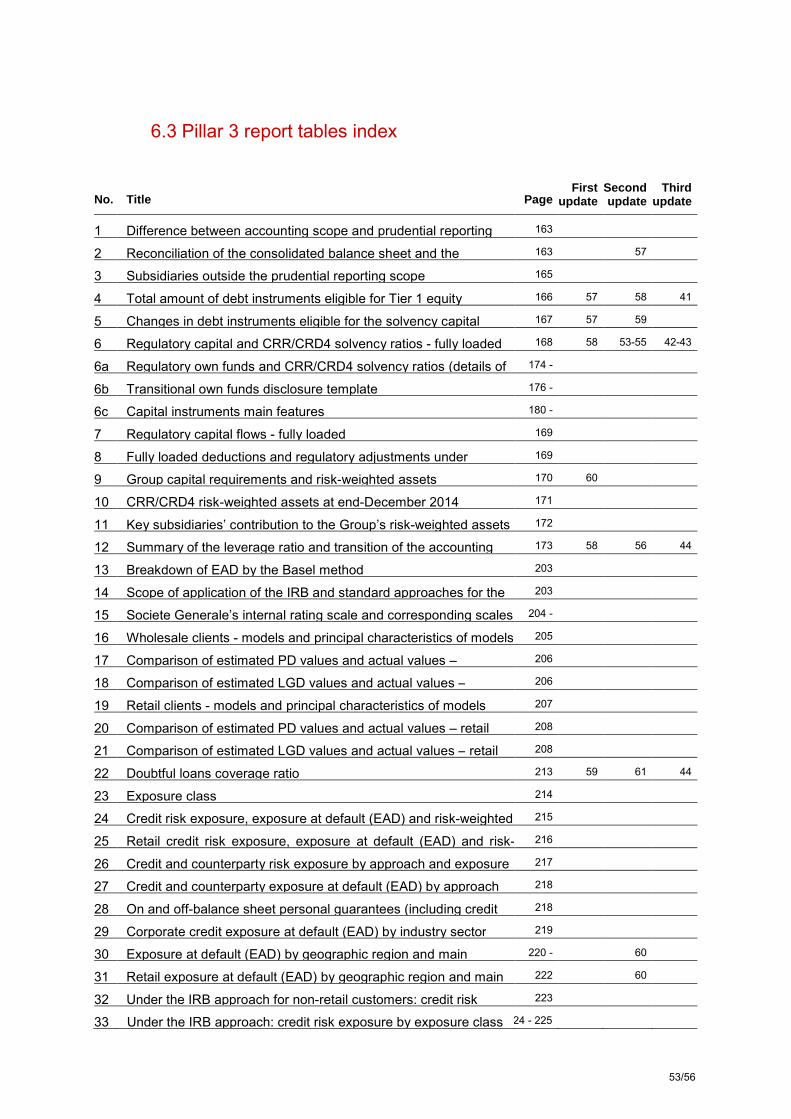
6.3 Pillar 3 report tables index
No. Title Page First
update Second update
Third update
1 Difference between accounting scope and prudential reporting
163
2 Reconciliation of the consolidated balance sheet and the
163 57
3 Subsidiaries outside the prudential reporting scope 165
4 Total amount of debt instruments eligible for Tier 1 equity 166 57 58 41
5 Changes in debt instruments eligible for the solvency capital
167 57 59
6 Regulatory capital and CRR/CRD4 solvency ratios - fully loaded 168 58 53-55 42-43
6a Regulatory own funds and CRR/CRD4 solvency ratios (details of
174 - 175
6b Transitional own funds disclosure template 176 - 179
6c Capital instruments main features 180 - 197
7 Regulatory capital flows - fully loaded 169
8 Fully loaded deductions and regulatory adjustments under
169
9 Group capital requirements and risk-weighted assets 170 60
10 CRR/CRD4 risk-weighted assets at end-December 2014 171
11 Key subsidiaries’ contribution to the Group’s risk-weighted assets 172
12 Summary of the leverage ratio and transition of the accounting
173 58 56 44
13 Breakdown of EAD by the Basel method 203
14 Scope of application of the IRB and standard approaches for the
203
15 Societe Generale’s internal rating scale and corresponding scales
204 - 242
16 Wholesale clients - models and principal characteristics of models 205
17 Comparison of estimated PD values and actual values –
206
18 Comparison of estimated LGD values and actual values –
206
19 Retail clients - models and principal characteristics of models 207
20 Comparison of estimated PD values and actual values – retail
208
21 Comparison of estimated LGD values and actual values – retail
208
22 Doubtful loans coverage ratio 213 59 61 44
23 Exposure class 214
24 Credit risk exposure, exposure at default (EAD) and risk-weighted
215
25 Retail credit risk exposure, exposure at default (EAD) and risk-
216
26 Credit and counterparty risk exposure by approach and exposure
217
27 Credit and counterparty exposure at default (EAD) by approach
218
28 On and off-balance sheet personal guarantees (including credit
218
29 Corporate credit exposure at default (EAD) by industry sector 219
30 Exposure at default (EAD) by geographic region and main
220 - 221
60
31 Retail exposure at default (EAD) by geographic region and main
222 60
32 Under the IRB approach for non-retail customers: credit risk
223
33 Under the IRB approach: credit risk exposure by exposure class
224 - 225
53/56
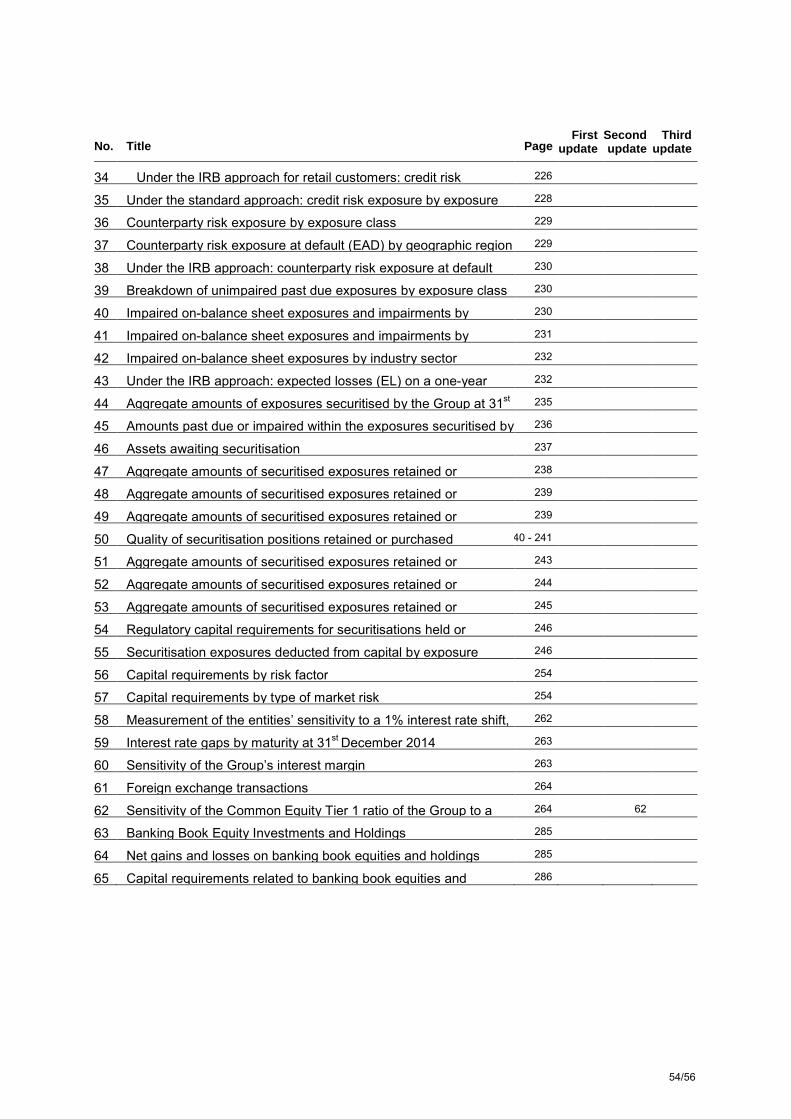
No. Title Page First
update Second update
Third update
34 Under the IRB approach for retail customers: credit risk 226
35 Under the standard approach: credit risk exposure by exposure
228
36 Counterparty risk exposure by exposure class 229
37 Counterparty risk exposure at default (EAD) by geographic region
229
38 Under the IRB approach: counterparty risk exposure at default
230
39 Breakdown of unimpaired past due exposures by exposure class 230
40 Impaired on-balance sheet exposures and impairments by
230
41 Impaired on-balance sheet exposures and impairments by
231
42 Impaired on-balance sheet exposures by industry sector 232
43 Under the IRB approach: expected losses (EL) on a one-year
232
44 Aggregate amounts of exposures securitised by the Group at 31st
235
45 Amounts past due or impaired within the exposures securitised by
236
46 Assets awaiting securitisation 237
47 Aggregate amounts of securitised exposures retained or
238
48 Aggregate amounts of securitised exposures retained or
239
49 Aggregate amounts of securitised exposures retained or
239
50 Quality of securitisation positions retained or purchased 240 - 241
51 Aggregate amounts of securitised exposures retained or 243
52 Aggregate amounts of securitised exposures retained or 244
53 Aggregate amounts of securitised exposures retained or
245
54 Regulatory capital requirements for securitisations held or
246
55 Securitisation exposures deducted from capital by exposure
246
56 Capital requirements by risk factor 254
57 Capital requirements by type of market risk 254
58 Measurement of the entities’ sensitivity to a 1% interest rate shift, st
262
59 Interest rate gaps by maturity at 31st December 2014 263
60 Sensitivity of the Group’s interest margin 263
61 Foreign exchange transactions 264
62 Sensitivity of the Common Equity Tier 1 ratio of the Group to a
264 62
63 Banking Book Equity Investments and Holdings 285
64 Net gains and losses on banking book equities and holdings 285
65 Capital requirements related to banking book equities and
286
54/56

6.4 Cross reference table with the recommendations made by the Enhanced Disclosure Task Force
N° Recommandation Details Page Third update
1 Present all related risk information together in any particular report
� Chapter 1 (description of the Group, strategy, presentation of the businesses)
5 and following.
� Chapter 2 (management report, balance sheet structure, recent developments and outlook)
21 and following.
� Chapter 4 (risks, capital adequacy, Pillar 3) 144 and following.
2 Definition of the principal terms and metrics used
� Availability of a glossary of the principal terms used 566 � Definitions as necessary in the chapters concerned - credit risks 198 - market risks 247 - operational risks 255
3 Definition and classification of risks and risk outlook
� Key figures 144-145 � Types of risks 146 � Risk factors 147 � Recent developments and outlook 6 ; 55
4 Definition of regulatory changes and new key ratios
� Fully-loaded Basel 3 capital ratio 144 � Phase-in stages 167 � Additional GSIB buffer 162 � Leverage ratio 144-173 � LCR 271 � NSFR 271
5 Risk governance � Group governance principles (summary diagram) 76 � Chairman’s report on corporate governance 87 � Chairman’s report on internal control and risk management 126 � Risk management principles (summary diagram) 134-155 � Credit risks 198 � Market risks 247 � Operational risks 255
6 Risk culture � Organisation and governance of the risk management system 155 � “Enterprise Risk Management” programme 158
7 Key figures for the businesses, risk appetite, risk management
� Key Group figures 5 � Description of the businesses 9 � Key risk figures 144-145 � Risk appetite 158-159 � Governance of risk management 126 et s. 156-157
8 Stress test system � General description 158-159 � Credit stress tests 199 � Market risk stress tests 251
9 Capital requirements � Exigences de fonds propres par type de risque 170 � Coussin complémentaire GSIB 162
10 Information on the composition of regulatory capital Reconciliation of accounting and regulatory data
� Composition of regulatory capital 168 � Details of regulatory capital 174 � Reconciliation of the accounting balance sheet and the regulatory
balance sheet 163
� Reconciliation of accounting capital and regulatory capital 163 11 Changes in regulatory capital � Capital reconciliation chart 50
� Regulatory capital flow statement 169 � Qualitative comment 172
12 Regulatory capital targets � Information on ratio targets and constraints (CET 1) 55, 172 � Regulatory information 162, 167
13 Distribution of risk-weighted assets by business
� Chart 145 � Additional information in the analyses by risk type (credit, market,
operational, etc.) 170-171
14 Table of RWA by calculation method � Group risk-weighted assets 170 � Credit risks 198 and
following.
� Market risks 247 and following.
55/56

N° Recommandation Détails Page Third update
15 Table of credit risks by Basel portfolio
� Details provided in the Credit Risk section of Chapter 4 198 and following.
16 Analysis of movements in RWA and capital requirements
� Credit risk table (summary) 170-171 � Market risk table (summary) 170-171 � Market risk table (VAR by risk type and - changes in capital requirements) 250-254
17 Back testing � Credit risks 206-208 � Market risks 248
18 Liquidity reserve � Qualitative and quantitative comment 271 � Liquidity reserve (amount and composition) 271 46
19 Encumbered assets � Encumbered assets 266 � Market financing (schedule of securitised issues) 267
20 Balance sheet by contractual Maturities
� Liabilities and off-balance sheet: Note 30 to the consolidated financial statements
432
� Balance sheet 272-273 21 Refinancing strategy � Group’s debt situation, debt policy 51
� Refinancing strategy 266-267 22 Reconciliation of risk-weighted
assets and accounting items for exposures sensitive to market risks
Information not communicated
23 Structural risk factors (sensitivity of structural positions to market factors)
� Structural interest rate and exchange rate risks section 261 � Note 23 of the consolidated financial statements (employee
benefits) � VAR analysis
419 248-250
24 Market risk modelling principles � Organisation and governance 247 � Methods for measuring market risk and defining limits 248 � Governance 253
25 Market risk measurement methods � Methods for measuring market risk and defining limits 248 � VAR and control of VAR 248-250 45 � Stress tests, scenarii and results 251-252
26 Loan portfolio structure � Key figures 145 � Portfolio structure � Quantitative data
209-212 209-232
27 Impairment policy Loan provisions and impairment
� Note 1 to the consolidated financial statements 354-371 � Credit policy � Quantitative data
198-200 212-213 230 and
following
44
28 Movements in provisions and impairment
� Consolidated financial statements, Note 22 418 � Doubtful loans coverage ratio 213.
29 Counterparty risks on market transactions
� By exposure category and geographic region 229
� Note No. 27 “Commitments” of the consolidated financial statements
429.
30 Information relating to collateral and � Hedging of credit risk: guarantees and collateral 201-203 measures to reduce counterparty
risk credit derivatives, risk mitigation measures, credit insurance .
31 Other risks � Description: types of risks 146 � Management (summary)
� Operational risks � Structural interest rate and exchange rate risks � Compliance, reputational and legal risks � Equity risk � Strategic risks � Business risks � Risks related to insurance activities � Environ mental and social risk
155 255 261 274 284 286 286 286
286.
47
32 Analysis of losses related to operational risk, including litigation and compliance
� Quantitative 259
� Risks and litigation 281.
56/56