THIRD QUARTERLY REPORT OF 2020
27
- 1 - Hong Kong Exchanges and Clearing Limited and The Stock Exchange of Hong Kong Limited take no responsibility for the contents of this announcement, make no representation as to its accuracy or completeness and expressly disclaim any liability whatsoever for any loss howsoever arising from or in reliance upon the whole or any part of the contents of this announcement. (A joint stock company incorporated in the People’s Republic of China with limited liability) (Stock Code: 1339) THIRD QUARTERLY REPORT OF 2020 This announcement is made by The People’s Insurance Company (Group) of China Limited (the “Company”) pursuant to the Inside Information Provisions under Part XIVA of the Securities and Futures Ordinance (Chapter 571 of the Laws of Hong Kong) and Rules 13.09 and 13.10B of the Rules Governing the Listing of Securities on The Stock Exchange of Hong Kong Limited. The financial data of the Company for the third quarter of 2020 are unaudited and have been prepared in accordance with the PRC Accounting Standards for Business Enterprises. 1. IMPORTANT INFORMATION 1.1 The Board of Directors, the Board of Supervisors, the directors, the supervisors and the senior management of the Company undertake that the contents of this quarterly report are true, accurate and complete and that there is no false record, misleading statement or material omission in this quarterly report; and they severally and jointly accept responsibility for the contents of this quarterly report. 1.2 The 2020 Third Quarterly Report of the Company was considered and approved at the 23rd meeting of the 3rd session of the Board of Directors of the Company on 28 October 2020, which 11 directors were required to attend and 10 of them attended in person, amongst which, Mr. Wang Tingke, the Executive Director and Vice Chairman, did not attend the board meeting due to other business engagements and appointed Mr. Xie Yiqun, the Executive Director, to attend the meeting and vote on his behalf in writing. Note: Unless otherwise specified, the currencies in this report are all in RMB.
-
Upload
khangminh22 -
Category
Documents
-
view
3 -
download
0
Transcript of THIRD QUARTERLY REPORT OF 2020

- 1 -
Hong Kong Exchanges and Clearing Limited and The Stock Exchange of Hong Kong Limited take no responsibility for the contents of this announcement, make no representation as to its accuracy or completeness and expressly disclaim any liability whatsoever for any loss howsoever arising from or in reliance upon the whole or any part of the contents of this announcement.
(A joint stock company incorporated in the People’s Republic of China with limited liability)
(Stock Code: 1339)
THIRD QUARTERLY REPORT OF 2020
This announcement is made by The People’s Insurance Company (Group) of China Limited (the “Company”) pursuant to the Inside Information Provisions under Part XIVA of the Securities and Futures Ordinance (Chapter 571 of the Laws of Hong Kong) and Rules 13.09 and 13.10B of the Rules Governing the Listing of Securities on The Stock Exchange of Hong Kong Limited.
The financial data of the Company for the third quarter of 2020 are unaudited and have been prepared in accordance with the PRC Accounting Standards for Business Enterprises.
1. IMPORTANT INFORMATION
1.1 The Board of Directors, the Board of Supervisors, the directors, the supervisors and the senior management of the Company undertake that the contents of this quarterly report are true, accurate and complete and that there is no false record, misleading statement or material omission in this quarterly report; and they severally and jointly accept responsibility for the contents of this quarterly report.
1.2 The 2020 Third Quarterly Report of the Company was considered and approved at the 23rd meeting of the 3rd session of the Board of Directors of the Company on 28 October 2020, which 11 directors were required to attend and 10 of them attended in person, amongst which, Mr. Wang Tingke, the Executive Director and Vice Chairman, did not attend the board meeting due to other business engagements and appointed Mr. Xie Yiqun, the Executive Director, to attend the meeting and vote on his behalf in writing.
Note: Unless otherwise specified, the currencies in this report are all in RMB.

- 2 -
1.3 Mr. Lou Xi (Person in charge of the Company), Mr. Wang Tingke (Person in charge of accounting work) and Mr. Zhang Hongtao (Head of the Finance Department) warrant the truthfulness, accuracy and completeness of the financial statements contained in this quarterly report.
1.4 The financial data contained in the 2020 Third Quarterly Report of the Company are unaudited and have been prepared in accordance with the PRC Accounting Standards for Business Enterprises.
2. BASIC INFORMATION OF THE COMPANY
2.1 Key Financial Data
Unit: RMB million
As of 30 September
2020
As of 31 December
2019 Change (%)
Total Assets 1,257,704 1,132,771 11.0Equity attributable to shareholders
of the parent company 197,790 183,133 8.0Net assets per share attributable to the
shareholders of the parent company (RMB/share) 4.47 4.14 8.0
January to September
2020
January to September
2019 Change (%)
Net cash flows generated from operating activities 16,587 16,369 1.3
Operating income 453,065 423,759 6.9Net profit attributable to shareholders
of the parent company 18,736 21,368 (12.3)Net profit attributable to shareholders
of the parent company after deducting non-recurring items 18,624 17,908 4.0
Basic earnings per share (RMB/share) 0.42 0.48 (12.3)Diluted earnings per share (RMB/share) 0.42 0.48 (12.3)Basic earnings per share after deducting
non-recurring items (RMB/share) 0.42 0.40 4.0Weighted average return on equity (%) 9.8 13.0 Decrease of 3.2 ptWeighted average return on equity after
deducting non-recurring items (%) 9.7 10.9 Decrease of 1.2 pt

- 3 -
2.2 Non-recurring Items
Unit: RMB million
July to September
2020
January to September
2020 Gains or losses from disposal of non-current assets 4 52 Government grants included in profit or loss 51 185 Net non-recurring items other than those mentioned above 17 (74)Effect of income tax on extraordinary items (15) (51)Attributable to non-controlling interests (2) – Total 55 112
2.3 Solvency of the Group and its Subsidiaries
Unit: RMB million
As of 30 September 2020 PICC Group PICC P&C PICC Life PICC Health Core capital 323,780 169,212 104,019 14,632Actual capital 385,769 196,964 116,727 18,176Minimum capital 120,623 65,807 43,962 8,414Core solvency margin ratio (%) 268 257 237 174Comprehensive solvency
margin ratio (%) 320 299 266 216
Notes:
1. PICC Group means the Company;
2. PICC P&C means PICC Property and Casualty Company Limited;
3. PICC Life means PICC Life Insurance Company Limited;
4. PICC Health means PICC Health Insurance Company Limited.

- 4 -
2.4 Total Number of Shareholders, Shareholdings of the Top Ten Shareholders and Top Ten Shareholders not Subject to Selling Restrictions as at the End of the Reporting Period
Unit: Share
Total number of shareholders (Shareholder) A Share: 251,227; H Share: 5,758Shareholdings of the Top Ten Shareholders
Name of shareholder (in full name)
Number of shares held as at the end
of the reporting period
Proportion (%)
Number of shares held subject to
selling restrictions
Pledged or frozen shares
Class of Shareholder
Status of the shares
Number of shares
Ministry of Finance of the People’s Republic of China
26,906,570,608 60.84 26,906,570,608 – – The State
HKSCC Nominees Limited 8,703,036,698 19.68 – – – Foreign legal person
National Council for Social Security Fund, PRC
6,657,410,578 15.05 2,989,618,956 – – The State
New China Life Insurance Company Ltd.-Dividend-Personal dividend-018L-FH002 SH
47,188,500 0.11 – – – Others
Hong Kong Securities Clearing Company Limited
36,846,312 0.08 – – – Foreign legal person
Beijing Hengzhaoweiye Investment Company Limited
20,107,653 0.05 – – – Others
China Construction Bank Corporation-E Fund 3-year Closed Operation Mixed Securities Investment Fund with Strategic Placement and Flexible Allocation (LOF)
19,910,000 0.05 – – – Others
Industrial and Commercial Bank of China Limited-Shanghai stock exchange 50 trading open index securities investment fund
15,380,477 0.03 – – – Others
Mo Jianrong 13,252,729 0.03 – – – OthersJin Baoshan 11,040,808 0.02 – – – Others
- 5 -
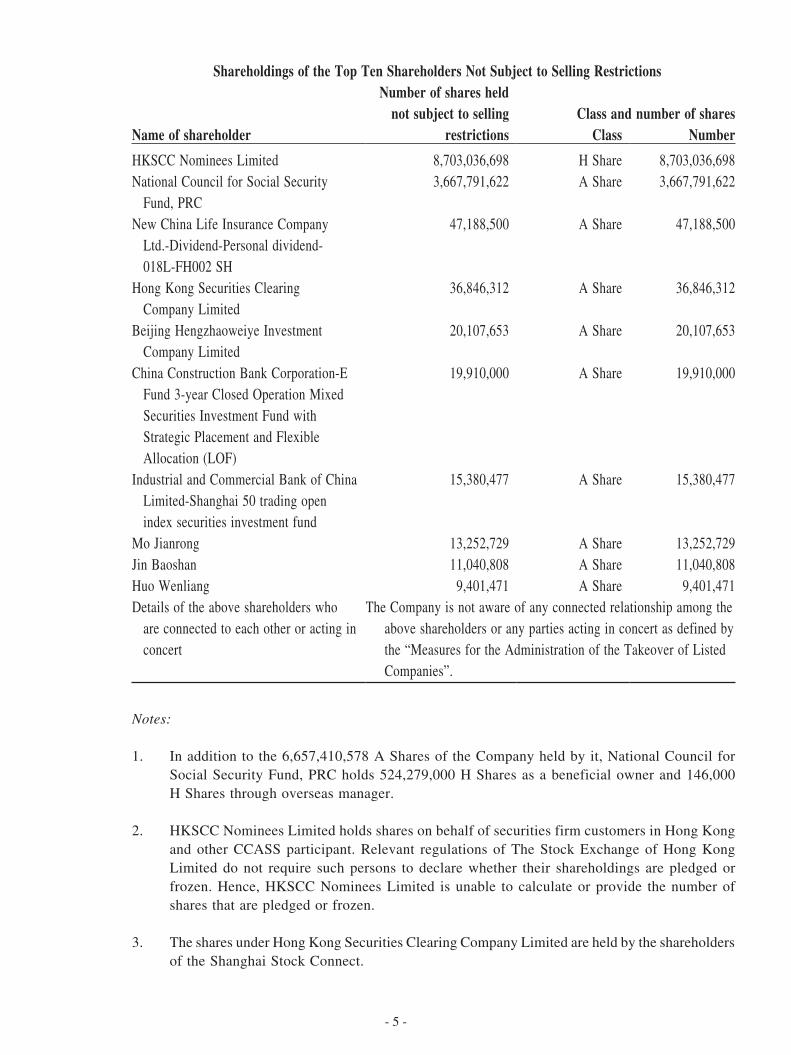
Shareholdings of the Top Ten Shareholders Not Subject to Selling Restrictions
Name of shareholder
Number of shares held not subject to selling
restrictionsClass and number of shares
Class Number
HKSCC Nominees Limited 8,703,036,698 H Share 8,703,036,698National Council for Social Security
Fund, PRC3,667,791,622 A Share 3,667,791,622
New China Life Insurance Company Ltd.-Dividend-Personal dividend- 018L-FH002 SH
47,188,500 A Share 47,188,500
Hong Kong Securities Clearing Company Limited
36,846,312 A Share 36,846,312
Beijing Hengzhaoweiye Investment Company Limited
20,107,653 A Share 20,107,653
China Construction Bank Corporation-E Fund 3-year Closed Operation Mixed Securities Investment Fund with Strategic Placement and Flexible Allocation (LOF)
19,910,000 A Share 19,910,000
Industrial and Commercial Bank of China Limited-Shanghai 50 trading open index securities investment fund
15,380,477 A Share 15,380,477
Mo Jianrong 13,252,729 A Share 13,252,729Jin Baoshan 11,040,808 A Share 11,040,808Huo Wenliang 9,401,471 A Share 9,401,471Details of the above shareholders who
are connected to each other or acting in concert
The Company is not aware of any connected relationship among the above shareholders or any parties acting in concert as defined by the “Measures for the Administration of the Takeover of Listed Companies”.
Notes:
1. In addition to the 6,657,410,578 A Shares of the Company held by it, National Council for Social Security Fund, PRC holds 524,279,000 H Shares as a beneficial owner and 146,000 H Shares through overseas manager.
2. HKSCC Nominees Limited holds shares on behalf of securities firm customers in Hong Kong and other CCASS participant. Relevant regulations of The Stock Exchange of Hong Kong Limited do not require such persons to declare whether their shareholdings are pledged or frozen. Hence, HKSCC Nominees Limited is unable to calculate or provide the number of shares that are pledged or frozen.
3. The shares under Hong Kong Securities Clearing Company Limited are held by the shareholders of the Shanghai Stock Connect.

- 6 -
3. QUARTERLY BUSINESS ANALYSIS
3.1 Key Financial Indicators
Unit: RMB million
January to September
2020
January to September
2019 Change (%)
Gross written premiums 456,131 440,355 3.6Profit before tax 30,889 28,664 7.8Net profit 25,997 29,931 (13.1)Net profit attributable to shareholders
of the parent company 18,736 21,368 (12.3)Basic earnings per share (RMB/share) 0.42 0.48 (12.3)Weighted average return on equity (%) 9.8 13.0 Decrease of 3.2 pt
As of 30 September
2020
As of 31 December
2019 Change (%)
Total assets 1,257,704 1,132,771 11.0Total liabilities 991,728 885,932 11.9Total equity 265,976 246,839 7.8Net assets per share attributable to
shareholders of the parent company (RMB/share) 4.47 4.14 8.0
Gearing ratio (%) 78.9 78.2 Increase of 0.7 pt
In face of the impact caused by the novel coronavirus pneumonia epidemic for the first three quarters of 2020, the Group1 has kept its mission “people’s insurance serves the people” in mind, intensified efforts in performing responsibilities, made progress in the prevention and control of the epidemic situation and maintained a steady and positive progress in development of its core business. For the first three quarters, the insurance income of the Group amounted to RMB456.131 billion, representing an increase of 3.6% on a period-to-period basis. The net profit amounted to RMB25.997 billion, representing a decrease of 13.1% on a period-to-period basis. The net profit attributable to the shareholders of the parent company amounted to RMB18.736 billion, representing a decrease of 12.3% on a period-to-period basis. The net profit attributable to shareholders of the parent company after deducting non-recurring items amounted to RMB18.624 billion, representing an increase of 4.0% on a period-to-period basis. The earnings per share amounted to RMB0.42, representing a decrease of 12.3% on a period-to-period basis. The weighted average return on equity in the first three quarters was 9.8%, representing a decrease of 3.2 percentage points on a period-to-period basis.
1 The Group means the Company and all of its subsidiaries.

- 7 -
The capital of the Group was further enriched. As of 30 September 2020, the total equity was RMB265.976 billion, representing an increase of 7.8% as compared to the beginning of the year; the net assets per share attributable to the shareholders of the parent company was RMB4.47, representing an increase of 8.0% as compared to the beginning of the year.
3.2 Insurance Business
3.2.1 PICC P&C
During the first three quarters of 2020, in the face of multiple challenges and tests brought by the novel coronavirus pneumonia epidemic, comprehensive auto insurance reforms, and complex and changeable domestic and foreign environments, PICC P&C was committed to serving national strategies, public health, social governance, and innovation driven strategies, strengthened business collaboration, and continuously increased insurance services quality; focused on “cost reduction and efficiency enhancement”, optimized business structure, and maintained the bottom line of avoiding systemic risks so as to create value for customers. During the reporting period, PICC P&C1 received original premiums income of RMB344.173 billion, representing a year-on-year increase of 3.7%; combined ratio reached 98.4%, representing a year-on-year increase of 0.5 percentage point; net profit reached RMB17.344 billion, representing a year-on-year decrease of 21.1% due to the impact of handling charges tax policy over the same period last year.
The original premiums income by type from PICC P&C for the above periods is indicated as follows:
Unit: RMB million
January to September
2020
January to September
2019 Change (%)
Motor vehicle insurance 199,284 189,174 5.3Accidental injury and health
insurance 59,452 50,204 18.4Agricultural insurance 31,772 27,217 16.7Liability insurance 22,805 21,931 4.0Commercial property insurance 12,171 12,136 0.3Credit insurance 5,203 18,047 (71.2)Cargo insurance 2,930 3,062 (4.3)Other P&C insurance 10,556 9,984 5.7
Total 344,173 331,755 3.7
1 The data is from the individual statement of PICC P&C as the parent company.

- 8 -
3.2.2 PICC Life
During the first three quarters of 2020, PICC Life accelerated the transformation of business models, improved product structure, vigorously promoted team building and valuable regular premiums business development, strictly adhered to the risk bottom line, consolidated the foundation for development, and improved the profitability by centering on value-oriented operation. During the reporting period, the original premiums income of PICC Life amounted to RMB82.117 billion, representing a decrease of 5.3% on a period-to-period basis. PICC Life achieved RMB59.404 billion in regular premiums of original premiums income, representing an increase of 6.2% on a period-to-period basis. The ten-year or more first-year regular total written premiums of PICC life amounted to RMB5.535 billion, representing an increase of 3.7% on a period-to-period basis. The net profit of PICC Life amounted to RMB6.704 billion, representing an increase of 33.9% on a period-to-period basis.
The original premiums income by type from PICC Life for the above periods is indicated as follows:
Unit: RMB million
January to September
2020
January to September
2019 Change (%)
First-year business of long-term insurance 37,701 45,551 (17.2)Single premiums 20,299 28,201 (28.0)First-year regular premiums 17,402 17,350 0.3
Renewal business 41,746 38,468 8.5 Short-term insurance 2,670 2,711 (1.5)
Total 82,117 86,730 (5.3)

- 9 -
3.2.3 PICC Health
During the first three quarters of 2020, PICC Health firmly adhered to the development direction of serving the people’s health, focused on the two major functions of “protecting health risks and providing health services”, steadily promoted the transformation of business models, PICC Health promoted the professionalization of social insurance business, personalization of group business, high-end personal business, internet business universalization, health management platformization and product supply specialization, created a professional health insurance business system with PICC characteristics, and accelerated the transformation to high-quality development under serving the “Healthy China” strategy and the construction of the national multi-level medical security system. Thus, the business achieved a relatively fast growth and a further optimization of its structure. During the reporting period, the first-year regular premiums of PICC Health amounted to RMB6.042 billion, representing an increase of 19.3% on a period-to-period basis and representing 60.4% of the first-year business of long-term insurance. The net profit of PICC Health amounted to RMB0.144 billion, representing a decrease of 55.8% on a period-to-period basis.
The original premiums income by type from PICC Health for the above periods is indicated as follows:
Unit: RMB millionJanuary to September
2020
January to September
2019 Change (%)
First-year business of long-term insurance 10,005 5,522 81.2Single premiums 3,963 458 765.3First-year regular premiums 6,042 5,064 19.3
Renewal business 5,705 2,142 166.3Short-term insurance 11,617 11,125 4.4
Total 27,327 18,789 45.4
3.3 Asset Management Business
During the first three quarters of 2020, the Group’s asset management segment actively served the country’s new development pattern of “dual cycles”, strove to give full play to the role of the main force of investment income, and effectively prevented investment risks. Bond investment increased the allocation of interest rate bonds, effectively lengthened the duration of assets, and did not gain high returns at the expense of credit sinking. In terms of equity investment, it grasped the market rhythm and continuously optimized the position structure. It sped up the allocation of high-quality non-standard assets.

- 10 -
4 IMPORTANT INFORMATION
4.1 Particulars of and Reasons for Material Changes in Major Accounting Items and Financial Indicators of the Company
4.1.1 Changes in key financial indicators and the reasons
Unit: RMB million
Key financial indicators
As of 30 September
2020
As of 31 December
2019 Change (%)Reasons of major changes
Total assets 1,257,704 1,132,771 11.0 Expanded scale of insurance business and the increased scale of assets available for investment
Total liabilities 991,728 885,932 11.9 Increase in insurance reservesEquity attributable to
shareholders of the parent company
197,790 183,133 8.0 Increase in net profits
Unit: RMB million
Key financial indicators
January to September
2020
January to September
2019 Change (%)Reasons of major changes
Operating income 453,065 423,759 6.9 Growth in insurance business and increase in investment income
Net profit attributable to shareholders of the parent company
18,736 21,368 (12.3) Impact of new tax regulations on handling fees last year

- 11 -
4.1.2 Material changes in major financial items and analysis
Unit: RMB million
Items in Balance Sheet
As of 30 September
2020
As of 31 December
2019 Change (%)Reasons of major changes
Premiums receivable 65,880 39,292 67.7 Growth of government coordinating business scale
Receivables from reinsurers 21,071 16,175 30.3 Affected by the reinsurance settlement cycle
Reinsurers’ share of unearned premium reserves
14,186 10,367 36.8 Cumulative scale growth of ceded business
Reinsurers’ share of life insurance reserves
27 15 80.0 Cumulative scale growth of ceded business
Reinsurers’ share of long-term health insurance reserves
2,530 1,534 64.9 Cumulative scale growth of ceded business
Other receivables 20,632 12,817 61.0 Newly acquired assets waited for acceptance
Deferred tax assets 11,841 8,699 36.1 Change of insurance reservesShort-term borrowing 205 – – Increase in short-term
financing of the subsidiaries of PICC Financial Services Company Limited
Securities sold under agreements to repurchase
83,107 58,263 42.6 Liquidity arrangement
Premiums received in advance
13,071 26,798 (51.2) Changes in regulatory policy for auto insurance business signing
Payables to reinsurers 30,308 19,046 59.1 Increase of coded scale and the influence of reinsurance settlement cycle
Tax payable 11,309 8,551 32.3 Impact of new tax regulations on handling fees last year
Long-term health insurance reserves
40,253 30,683 31.2 Growth of long-term health insurance premium income
Premiums reserve 3,575 2,388 49.7 Growth of agricultural insurance business
Deferred tax liabilities 2,345 1,486 57.8 Impact of capital market volatility

- 12 -
Unit: RMB million
Items in income statement
January to September
2020
January to September
2019 Change (%)Reasons of major changes
Change in unearned premium reserves
14,995 27,312 (45.1) Changes in insurance business growth
Fair value (losses)/gains (273) 300 – Floating loss of trading assets
Exchange (losses)/gains (322) 335 – Fluctuation in exchange rateReinsurers’ share of
insurance contract liability reserves
2,262 3,448 (34.4) Structural adjustment of the ceded business
Policyholder dividends expenses
2,703 1,675 61.4 Increase in policyholder dividends for the reporting period
Reinsurance expenses 612 908 (32.6) Decrease in inward businessIncome tax expense/(credit) 4,892 (1,267) – Impact of new tax
regulations on handling fees last year
Other comprehensive income, net of tax
1,667 11,954 (86.1) Impact of capital market volatility
Total comprehensive income
27,664 41,885 (34.0) The combined effect of the above reasons
4.2 Explanation and Analysis of Significant Events and Their Impacts and Solutions
□Applicable √Not applicable
4.3 Undertakings Were Not Implemented in Due Time During the Reporting Period
□Applicable √Not applicable
4.4 Warning of Projection on Cumulative Net Profit for the Period from the Beginning of the Year to the End of the Next Reporting Period to be at a Loss or Expected to Have Material Changes as Compared to the Corresponding Period of Last Year and Its Explanation
□Applicable √Not applicable

- 13 -
5 APPENDIX
5.1 Consolidated statement of financial position and statement of financial position of the Company as at 30 September 2020 and 31 December 2019
Consolidated Statement of Financial PositionAs at 30 September 2020(Amounts in millions of Renminbi, unless otherwise stated)
30 September 2020
31 December 2019
(Unaudited) (Audited)
ASSETSCash and bank balances 24,172 24,064Financial assets at fair value through profit or loss 30,182 27,032Financial assets purchased under resale agreements 45,086 53,038Premiums receivable 65,880 39,292Receivables from reinsurers 21,071 16,175Reinsurers’ share of unearned premium reserves 14,186 10,367Reinsurers’ share of outstanding claim reserves 18,312 17,058Reinsurers’ share of life insurance reserves 27 15Reinsurers’ share of long-term health insurance
reserves 2,530 1,534Policy loans 5,091 4,508Other receivables 20,632 12,817Term deposits 94,249 87,009Available-for-sale financial assets 358,816 316,901Held-to-maturity investments 173,553 140,398Investments classified as loans and receivables 173,852 182,858Long-term equity investments 121,968 117,083Restricted statutory deposits 12,995 12,994Investment properties 12,239 12,445Fixed assets 28,020 25,636Right-of-use assets 2,716 3,307Intangible assets 7,489 7,807Deferred tax assets 11,841 8,699Other assets 12,797 11,734
12,797
TOTAL ASSETS 1,257,704 1,132,771

- 14 -
30 September 2020
31 December 2019
(Unaudited) (Audited)
LIABILITIES AND EQUITY
LIABILITIESShort-term bank borrowing 205 -Securities sold under agreements to repurchase 83,107 58,263Premiums received in advance 13,071 26,798Handling charges and commission payable 9,635 8,240Payables to reinsurers 30,308 19,046Salaries and staff welfare payables 18,861 18,756Tax payable 11,309 8,551Claims payable 10,038 10,272Policyholders’ dividend payable 4,168 3,816Other payables 15,950 15,622Policyholders’ deposits 39,203 41,014Unearned premium reserves 179,422 160,608Outstanding claim reserves 174,406 153,920Life insurance reserves 291,792 270,475Long-term health insurance reserves 40,253 30,683Premiums reserve 3,575 2,388Bonds payable 56,911 48,780Lease liabilities 2,678 3,051Deferred tax liabilities 2,345 1,486Other liabilities 4,491 4,163
TOTAL LIABILITIES 991,728 885,932

- 15 -
30 September 2020
31 December 2019
(Unaudited) (Audited)
EQUITYIssued capital 44,224 44,224Share premium account 7,543 7,516Other comprehensive income 12,807 11,783Surplus reserve fund 12,551 12,551General risk reserve 11,885 11,885Agriculture catastrophic loss reserve 1,235 1,235Retained profits 107,545 93,939
Equity attributable to equity holders of the Company 197,790 183,133Non-controlling interests 68,186 63,706
TOTAL EQUITY 265,976 246,839
TOTAL LIABILITIES AND EQUITY 1,257,704 1,132,771

- 16 -
Statement of Financial PositionAs at 30 September 2020(Amounts in millions of Renminbi, unless otherwise stated)
30 September 2020
31 December 2019
(Unaudited) (Audited)
ASSETSCash and bank balances 473 755Financial assets at fair value through profit or loss 1,431 1,222Financial assets purchased under resale agreements 290 2,248Other receivables 379 386Term deposit 4,466 4,068Available-for-sale financial assets 12,408 10,352Investments classified as loans and receivables 7,483 6,487Long term equity investments 90,712 90,417Investment properties 2,656 2,656Fixed assets 2,815 2,900Intangible assets 83 83Other assets 39 68
TOTAL ASSETS 123,235 121,642
LIABILITIES AND EQUITY
LIABILITIESSecurities sold under agreements to repurchase 41 63 Salaries and staff welfare payables 3,568 3,582Tax payable 17 13Other payables 415 874Bonds payable 17,986 17,982Deferred tax liabilities 508 – Other liabilities 422 649
TOTAL LIABILITIES 22,957 23,163

- 17 -
30 September 2020
31 December 2019
(Unaudited) (Audited)
EQUITYIssued capital 44,224 44,224Share premium account 35,578 35,578Other comprehensive income reserve 182 912Surplus reserve fund 12,551 12,551Retained profits 7,743 5,214
TOTAL EQUITY 100,278 98,479
TOTAL LIABILITIES AND EQUITY 123,235 121,642

- 18 -
5.2 Consolidated income statement and income statement of the Company for the nine months ended 30 September 2020 and for the nine months ended 30 September 2019
Consolidated Income StatementFor the nine months ended 30 September 2020(Amounts in millions of Renminbi, unless otherwise stated)
Three months ended
30 September 2020
Nine months ended
30 September 2020
Three months ended
30 September 2019
Nine months ended
30 September 2019
(Unaudited) (Unaudited) (Unaudited) (Unaudited)
OPERATING INCOME 142,788 453,065 133,980 423,759Net earned premiums 125,836 406,088 120,153 383,501Gross written premiums 119,290 456,131 117,481 440,355
Included: Reinsurance premiums assumed 660 2,349 1,556 2,978Less: Premiums ceded to reinsurers (10,097) (35,048) (9,310) (29,542)Change in unearned premium reserves 16,643 (14,995) 11,982 (27,312)Investment income 16,826 44,890 12,744 36,915
Included: Share of profits and losses of associates and joint ventures 2,448 7,884 3,381 8,959
Fair value (losses)/gains (331) (273) (193) 300Exchange (losses)/gains (512) (322) 335 335Gains on disposal of assets 4 52 49 57Other income 30 296 41 234Other operating income 935 2,334 851 2,417
OPERATING EXPENSES 133,339 422,180 124,689 395,155Surrenders 3,245 42,260 2,633 45,633Gross claims paid 82,828 214,631 75,161 207,454Less: Paid losses recoverable from reinsurers (7,222) (15,892) (5,654) (13,592)Change in insurance contract liability reserves 8,996 50,545 18,285 42,132Less: Reinsurers’ share of insurance contract
liability reserves (129) (2,262) (3,199) (3,448)Change in premium reserve 178 1,067 194 1,003Interest expenses credited to policyholders’
deposits 507 2,703 282 1,675Reinsurance expenses 144 612 528 908Tax and other surcharges 409 1,483 413 1,484Handling charges and commissions 16,600 51,674 15,887 49,602General and administrative expenses 28,681 76,039 20,073 62,140Less: Net reinsurance commission income (3,029) (9,199) (2,658) (8,284)Other operating costs 2,022 5,579 1,938 6,049Impairment losses 109 2,940 806 2,399

- 19 -
Three months ended
30 September 2020
Nine months ended
30 September 2020
Three months ended
30 September 2019
Nine months ended
30 September 2019
(Unaudited) (Unaudited) (Unaudited) (Unaudited)
OPERATING PROFIT 9,449 30,885 9,291 28,604Add: Non-operating income 96 182 82 212Less: Non-operating expenses (45) (178) (82) (152)
PROFIT BEFORE TAX 9,500 30,889 9,291 28,664 Less: Income tax (expense)/credit (1,199) (4,892) (1,036) 1,267
NET PROFIT 8,301 25,997 8,255 29,931
By continuing operations:Net profit from continuing operations 8,301 25,997 8,255 29,931
By ownership:1. Ne t profit attributable to equity holders
of the Company 6,134 18,736 5,851 21,368 2. Ne t profit attributable to non-controlling
interests 2,167 7,261 2,404 8,563
OTHER COMPREHENSIVE (EXPENSE)/INCOME FOR THE YEAR, NET OF TAXOther comprehensive (expense)/income
attributable to equity holders of the Company, net of tax (588) 1,024 1,541 8,937
OTHER COMPREHENSIVE INCOME/(EXPENSE) THAT MAY BE RECLASSIFIED TO PROFIT OR LOSSFair value gains of available-for-sale
financial assets 197 1,958 1,746 8,707Portion of fair value changes attributable
to participating policyholders (247) (480) – –Gains/(losses) on revaluation transfered
to investment properties 4 73 (6) 46Other comprehensive (expense)/income
that may be reclassified to profit or loss under the equity method (495) (426) (237) 156
Exchange differences arising on translation of foreign operations (46) (23) 26 32

- 20 -
Three months ended
30 September 2020
Nine months ended
30 September 2020
Three months ended
30 September 2019
Nine months ended
30 September 2019
(Unaudited) (Unaudited) (Unaudited) (Unaudited)
OTHER COMPREHENSIVE INCOME/(EXPENSE) THAT WILL NOT BE RECLASSIFIED TO PROFIT OR LOSSRemeasurement of the variation of
defined benefit plans – (80) – (11)Other comprehensive (expense)/income
that cannot be reclassified to profit or loss under the equity method (1) 2 12 7
Other comprehensive (expense)/income attributable to non-controlling interests, net of tax (110) 643 456 3,017
TOTAL (698) 1,667 1,997 11,954
TOTAL COMPREHENSIVE INCOME 7,603 27,664 10,252 41,885
Attributable to equity holders of the Company 5,546 19,760 7,392 30,305Attributable to non-controlling interests 2,057 7,904 2,860 11,580
EARNINGS PER SHARE (in RMB Yuan)– Basic 0.14 0.42 0.13 0.48
Note: The Group had no diluted potential ordinary shares in issue during the nine months ended 30 September 2020 and the nine months ended 30 September 2019.

- 21 -
Income StatementFor the nine months ended 30 September 2020(Amounts in millions of Renminbi, unless otherwise stated)
Three months ended
30 September 2020
Nine months ended
30 September 2020
Three months ended
30 September 2019
Nine months ended
30 September 2019
(Unaudited) (Unaudited) (Unaudited) (Unaudited)
OPERATING INCOME 1,496 9,791 389 5,728Investment income 1,426 9,537 227 5,402
Included: Share of profits and losses of associates 103 301 54 195
Fair value (losses)/gains (34) 1 5 8Exchange gains – 7 3 5Other operating income 104 246 154 313
OPERATING EXPENSES 448 1,370 479 1,378Tax and other surcharges 8 38 7 39General and administrative expenses 187 562 215 568Other operating costs 253 755 255 767Impairment losses – 15 2 4
OPERATING PROFIT 1,048 8,421 (90) 4,350Add: Non-operating income 1 1 7 8Less: Non-operating expenses – (1) (1) (1)
PROFIT BEFORE TAX 1,049 8,421 (84) 4,357Less: Income tax (expense)/credit – (762) (46) 118
NET PROFIT 1,049 7,659 (130) 4,475

- 22 -
Three months ended
30 September 2020
Nine months ended
30 September 2020
Three months ended
30 September 2019
Nine months ended
30 September 2019
(Unaudited) (Unaudited) (Unaudited) (Unaudited)
OTHER COMPREHENSIVE INCOME/(EXPENSE)OTHER COMPREHENSIVE INCOME/
(EXPENSE) THAT MAY BE RECLASSIFIED TO PROFIT OR LOSSFair value gains/(losses) of available-for-
sale financial assets 113 (652) 220 712Other comprehensive income that may be
reclassified to profit or loss under the equity method – 2 – 17
OTHER COMPREHENSIVE EXPENSE THAT WILL NOT BE RECLASSIFIED TO PROFIT OR LOSSRemeasurement of the variation of defined
benefit plans – (80) – (11)
OTHER COMPREHENSIVE INCOME/(EXPENSE), NET OF TAX 113 (730) 220 718
TOTAL COMPREHENSIVE INCOME 1,162 6,929 90 5,193

- 23 -
5.3 Consolidated statement of cash flow and statement of cash flow of the Company for the nine months ended 30 September 2020 and for the nine months ended 30 September 2019
Consolidated Statement of Cash FlowsFor the nine months ended 30 September 2020(Amounts in millions of Renminbi, unless otherwise stated)
Nine months ended
30 September 2020
Nine months ended
30 September 2019
(Unaudited) (Unaudited)
CASH FLOWS FROM OPERATING ACTIVITIES
Cash received from premiums under direct insurance contracts 426,658 402,242
Other cash inflows from operating activities 2,941 9,176
Cash inflows from operating activities 429,599 411,418
Cash paid for claims payments under direct insurance contracts (212,340) (206,938)
Decrease from policyholders’ deposits (2,623) (3,461)Cash paid for reinsurance, net (5,220) (6,859)Handling charges and commissions paid (52,018) (49,008)Interest paid to policyholders’ deposits (2,350) (1,420)Payment to and on behalf of staff (35,333) (40,851)Taxes and surcharges paid (14,296) (13,382)Other cash outflows for operating activities (88,832) (73,130)
Cash outflows for operating activities (413,012) (395,049)
Net cash flows generated from operating activities 16,587 16,369

- 24 -
Nine months ended
30 September 2020
Nine months ended
30 September 2019
(Unaudited) (Unaudited)
CASH FLOWS FROM INVESTING ACTIVITIES
Proceeds from disposals of investments 211,140 160,027Cash received from investment income 38,299 31,931Proceeds from disposals of fixed assets,
intangible assets and other long term assets 157 303Proceeds from disposal of associates 594 -
Cash inflows from investing activities 250,190 192,261
Payment for purchases of investments (286,864) (205,919)Net increase in policy loans (583) (648)Payment for purchases of fixed assets, intangible
assets and other long term assets (8,214) (2,622)Other cash outflows for investing activities (51) (25)
Cash outflows for investing activities (295,712) (209,214)
Net cash flows used in investing activities (45,522) (16,953)

- 25 -
Nine months ended
30 September 2020
Nine months ended
30 September 2019
(Unaudited) (Unaudited)
CASH FLOWS FROM FINANCING ACTIVITIES
Issue of debts 8,000 –Proceeds from banks and other financial
institutions 205 –Funds from non-controlling shareholders 9 –Net cash received from financial assets sold under
agreements to repurchase 24,844 19,287
Cash inflows from financing activities 33,058 19,287
Repayment of debts – (800)Repayments of lease liabilities (743) (889)Cash paid for distribution of dividends,
profits or interests (11,137) (6,979)Other cash outflows for financing activities – (119)
Cash outflows for financing activities (11,880) (8,787)
Net cash flows generated from financing activities 21,178 10,500
NET FOREIGN EXCHANGE DIFFERENCES (298) 32
NET (DECREASE)/INCREASE IN CASH AND CASH EQUIVALENTS (8,055) 9,948
Cash and cash equivalents at beginning of the period 76,984 61,601
CASH AND CASH EQUIVALENTS AT END OF THE PERIOD 68,929 71,549

- 26 -
Statement of Cash FlowFor the nine months ended 30 September 2020(Amounts in millions of Renminbi, unless otherwise stated)
Nine months ended
30 September 2020
Nine months ended
30 September 2019
(Unaudited) (Unaudited)
CASH FLOWS FROM OPERATING ACTIVITIES
Other cash inflows from operating activities 91 145
Cash inflows from operating activities 91 145
Payment to and on behalf of staff (472) (436)Taxes and surcharges paid (35) (34)Other cash outflows for operating activities (136) (139)
Cash outflows for operating activities (643) (609)
Net cash flows used in operating activities (552) (464)
CASH FLOWS FROM INVESTING ACTIVITIESProceeds from disposals of investments 7,790 7,082Investment income received 9,002 5,299Proceeds from disposals of subsidiaries 242 –Other cash inflows from investing activities – 123
Cash inflows from investing activities 17,034 12,504
Payment for purchases of investments (12,615) (10,426)Payment for purchases of fixed assets, intangible
assets and other long term assets (29) (27)Other cash outflows for investing activities (36) (63)
Cash outflows for investing activities (12,680) (10,516)
Net cash flows generated from investing activities 4,354 1,988

- 27 -
Nine months ended
30 September 2020
Nine months ended
30 September 2019
(Unaudited) (Unaudited)
CASH FLOWS FROM FINANCING ACTIVITIES
Net cash received from financial assets sold under agreements to repurchase – 150
Cash inflows from financing activities – 150
Interests paid (904) (916)Cash paid for distribution of dividends (5,130) (2,021)Net cash paid for financial assets sold under
agreements to repurchase (21) –Other cash outflows for financing activities – (119)
Cash outflows for financing activities (6,055) (3,056)
Net cash flows used in financing activities (6,055) (2,906)
NET FOREIGN EXCHANGE DIFFERENCES 14 4
NET DECREASE IN CASH AND CASH EQUIVALENTS (2,239) (1,378)
Cash and cash equivalents at beginning of the period 3,003 2,294
CASH AND CASH EQUIVALENTS AT END OF THE PERIOD 764 916
By Order of the BoardThe People’s Insurance Company (Group) of China Limited
Wang TingkeVice Chairman
Beijing, the PRC, 28 October 2020
As at the date of this announcement, the executive directors of the Company are Mr. Wang Tingke and Mr. Xie Yiqun, the non-executive directors are Mr. Wang Qingjian, Mr. Xiao Xuefeng, Ms. Cheng Yuqin and Mr. Wang Zhibin, and the independent non-executive directors are Mr. Shiu Sin Por, Mr. Ko Wing Man, Mr. Luk Kin Yu, Peter, Mr. Lin Yixiang and Mr. Chen Wuzhao.