Thin fluorinated polymer film microcavity arrays for 3D cell ...
14
Thin fluorinated polymer film microcavity arrays for 3D cell culture and label-free automated feature extraction Citation for published version (APA): Samal, P., Gubbins, E., van Blitterswijk, C., Truckenmuller, R., & Giselbrecht, S. (2021). Thin fluorinated polymer film microcavity arrays for 3D cell culture and label-free automated feature extraction. Biomaterials Science, 9(23), 7838-7850. https://doi.org/10.1039/d1bm00718a Document status and date: Published: 23/11/2021 DOI: 10.1039/d1bm00718a Document Version: Publisher's PDF, also known as Version of record Document license: Taverne Please check the document version of this publication: • A submitted manuscript is the version of the article upon submission and before peer-review. There can be important differences between the submitted version and the official published version of record. People interested in the research are advised to contact the author for the final version of the publication, or visit the DOI to the publisher's website. • The final author version and the galley proof are versions of the publication after peer review. • The final published version features the final layout of the paper including the volume, issue and page numbers. Link to publication General rights Copyright and moral rights for the publications made accessible in the public portal are retained by the authors and/or other copyright owners and it is a condition of accessing publications that users recognise and abide by the legal requirements associated with these rights. • Users may download and print one copy of any publication from the public portal for the purpose of private study or research. • You may not further distribute the material or use it for any profit-making activity or commercial gain • You may freely distribute the URL identifying the publication in the public portal. If the publication is distributed under the terms of Article 25fa of the Dutch Copyright Act, indicated by the “Taverne” license above, please follow below link for the End User Agreement: www.umlib.nl/taverne-license Take down policy If you believe that this document breaches copyright please contact us at: [email protected] providing details and we will investigate your claim. Download date: 27 Sep. 2022
-
Upload
khangminh22 -
Category
Documents
-
view
2 -
download
0
Transcript of Thin fluorinated polymer film microcavity arrays for 3D cell ...

Thin fluorinated polymer film microcavity arrays for 3Dcell culture and label-free automated feature extractionCitation for published version (APA):
Samal, P., Gubbins, E., van Blitterswijk, C., Truckenmuller, R., & Giselbrecht, S. (2021). Thin fluorinatedpolymer film microcavity arrays for 3D cell culture and label-free automated feature extraction.Biomaterials Science, 9(23), 7838-7850. https://doi.org/10.1039/d1bm00718a
Document status and date:Published: 23/11/2021
DOI:10.1039/d1bm00718a
Document Version:Publisher's PDF, also known as Version of record
Document license:Taverne
Please check the document version of this publication:
• A submitted manuscript is the version of the article upon submission and before peer-review. There canbe important differences between the submitted version and the official published version of record.People interested in the research are advised to contact the author for the final version of the publication,or visit the DOI to the publisher's website.• The final author version and the galley proof are versions of the publication after peer review.• The final published version features the final layout of the paper including the volume, issue and pagenumbers.Link to publication
General rightsCopyright and moral rights for the publications made accessible in the public portal are retained by the authors and/or other copyrightowners and it is a condition of accessing publications that users recognise and abide by the legal requirements associated with theserights.
• Users may download and print one copy of any publication from the public portal for the purpose of private study or research.• You may not further distribute the material or use it for any profit-making activity or commercial gain• You may freely distribute the URL identifying the publication in the public portal.
If the publication is distributed under the terms of Article 25fa of the Dutch Copyright Act, indicated by the “Taverne” license above,please follow below link for the End User Agreement:
www.umlib.nl/taverne-license
Take down policyIf you believe that this document breaches copyright please contact us at:
providing details and we will investigate your claim.
Download date: 27 Sep. 2022

BiomaterialsScience
PAPER
Cite this: Biomater. Sci., 2021, 9,7838
Received 8th May 2021,Accepted 2nd October 2021
DOI: 10.1039/d1bm00718a
rsc.li/biomaterials-science
Thin fluorinated polymer film microcavity arraysfor 3D cell culture and label-free automatedfeature extraction†
Pinak Samal, Eva Gubbins, Clemens van Blitterswijk, Roman Truckenmüller andStefan Giselbrecht *
There is an increasing need for automated label-free morphometric analysis using brightfield microscopy
images of 3D cell culture systems. This requires automated feature detection which can be achieved by
improving the image contrast, e.g. by reducing the refractive index mismatch in the light path. Here, a
novel microcavity platform fabricated using microthermoforming of thin fluorinated ethylene–propylene
(FEP) films which match the refractive index of cell culture medium and provide a homogenous back-
ground signal intensity is described. FEP is chemically inert, mechanically stable and has been used as a
substrate for light sheet microscopy. The microcavities promote formation of mouse embryonic stem cell
(mESC) aggregates, which show axial elongation and germ layer specification similar to embryonic devel-
opment. A label-free feature extraction pipeline based on a machine-learning plugin for FIJI is used to
extract morphometric features from time-lapse imaging in a highly robust and reproducible manner.
Lastly, the pipeline is utilized for testing the effect of the drug Latrunculin A on the mESC aggregates,
highlighting the platform’s potential for high-content screening (HCS) in drug discovery. This new micro-
engineered tool is an important step towards label-free imaging of free-floating stem cell aggregates and
paves the way for high-content drug testing and translational studies.
1. Introduction
A major challenge during the study of 3D cell-based systems isthe use of streamlined data acquisition and analysis pipelines,which are free, accessible and easy to use. Further, to studytemporal dynamics of a biological system, the pipeline alsoneeds to be able to extract morphological changes in theobject of interest (here the cell aggregate) and easily discern itfrom the background. One way of achieving this is by using afluorescent label or dye, which increases the contrast betweenthe cells and the background and hence makes the objectdetection easier. However, this often involves either creatingtransgenic cell lines or pre-labelling the samples, which addsan additional step in the experimental workflow. In many bio-logical laboratories, acquiring brightfield images using themore accessible widefield microscope is preferable, quickerand easier. Such brightfield images are seldom quantified due
to challenges in automated detection of cells and 3Dmicrotissues.
Here, we propose the use of a transparent Teflon plastic,fluorinated ethylene–propylene (FEP), as a material, whichenables automated label-free feature extraction using bright-field and/or fluorescence time-lapse imaging of stem cellaggregates which mimic embryonic axial morphogenesis andtissue patterning in vitro. We focus on the suitability and useof FEP for high-content screening (HCS) in combination withthe stem cell aggregates. Analysis and interpretation of image-based HCS data can be challenging and several possible solu-tions have been reviewed in detail elsewhere.1 To significantlysimplify the analysis of multi-time-point images acquiredduring our screening process, we further describe image ana-lysis using a freely available machine-learning based approach.
Teflon (DuPont), which consists of different perfluorinatedpolymers, are chemically inert and undergo minimal adsorp-tion and leaching of molecules, making them ideal for biologi-cal and pharmaceutical applications. FEP is a semi-crystallinefluorinated polymer and thin films of FEP are optically trans-parent thereby rendering it suitable for microscopy.2,3 Further,the refractive index of FEP is 1.344 (manufacturer’s datasheet),which is close to the refractive index of liquids commonly usedfor cell culture (between 1.33 and 1.34, Table 1). This reduces
†Electronic supplementary information (ESI) available. See DOI: 10.1039/d1bm00718a
MERLN Institute for Technology-Inspired Regenerative Medicine, Maastricht
University, Universiteitssingel 40, 6229 ER Maastricht, The Netherlands.
E-mail: [email protected]
7838 | Biomater. Sci., 2021, 9, 7838–7850 This journal is © The Royal Society of Chemistry 2021
Publ
ishe
d on
21
Oct
ober
202
1. D
ownl
oade
d on
12/
9/20
21 8
:25:
03 A
M.
View Article OnlineView Journal | View Issue

mismatch between refractive indexes of materials present inthe light path.4 In contrast, thermoplastic polymers which areconventionally used as substrates for cell cultures, e.g. polycar-bonate (PC) and polystyrene (PS), often have higher refractiveindices of more than 1.4.5 It is known that refractive index mis-match can decrease the image quality in microscopy due tomisalignment of optical paths caused by spherical aberra-tions.6 It has also been previously described that microcavitiesmanufactured from high refractive index materials can causeimaging artifacts at the edges due to light scattering andrefraction.7 The matching refractive indices of FEP and cellculture medium thus make it favorable for imaging of biologi-cal samples. FEP tubes filled with agarose or methylcellulosehave been previously used for confining and studying zebrafishembryos using light sheet microscopy and widefield fluo-rescence microscopy and this led to improved image qualityand reduced image distortion.8,9
Microcavities have become important tools in 3D cellculture in recent years due to the high degree of versatility andability to perform high-throughput studies.10 Several microfab-rication methods, e.g. soft lithography and molding tech-niques, have been used in conjunction with different types ofpolymers including polydimethylsiloxane (PDMS), PS, etc.(reviewed in ref. 11). However, fabrication of micropatterns inFEP has been considered challenging due to its chemical inert-ness and compatibility with limited microfabricationtechniques.2,12 Further, although melt processing of FEP athigh temperatures is possible (>260 °C as mentioned in ref. 2),it is limited in terms of the types of microstructures which canbe fabricated and is prone to air entrapment.2 Here, wedescribe microthermoforming of FEP films at relatively lowertemperatures of 153 °C and a pressure of 25 bar using a thin(<50 µm thickness) PC film as backing to obtain microcavityarrays with uniform depths. Previously, microwells with pyra-midal shapes from thin FEP foils have been fabricated byothers using vacuum thermoforming.13 The microwells weresubsequently used for spheroid formation.13
We used FEP microcavities in combination with a custo-mized image analysis pipeline to study polarization ofBrachyury expression and axial elongation morphogenesis in3D free-floating aggregates of mouse embryonic stem cells(mESCs). These aggregates, also termed “gastruloids”, whencultured under specific conditions, e.g. controlled cell numberand culture medium, have been shown to mimic certainaspects of mammalian gastrulation-like germ layer specifica-tion, axial elongation and polarized expression of the gastrula-
tion (and mesoderm) marker Brachyury.14–16 Since gastrulationis an important landmark which leads to germ layer specifica-tion and tissue patterning, understanding the temporaldynamics of mesoderm formation can increase our insightinto tissue and organ formation.
2. Experimental2.1. Microthermoforming
For microthermoforming, the molds were designed inAutodesk Inventor 2018 and microfabricated in brass plates(MS63, CuZn37) on a micromilling machine (Minitech, USA).After micromilling, the brass plates were cleaned with acetonefollowed by ethanol and subsequently dried at ambient con-ditions. FEP polymer films (measured thickness = 47 ± 1 µm;three different points measured across three different samplesusing Heidenhain height probe (Germany)) were obtainedfrom Goodfellow (Catalogue number 27570742). For microther-moforming of FEP films, an extruded PC film (measured thick-ness = 40 ± 2 µm; three different points measured across fourdifferent samples using Heidenhain height probe) was firstplaced on top of the FEP film before placing the film on top ofthe brass mold. Microthermoforming (as a free-formingvariant) was performed using a Specac Atlas series hydraulicpress which were fitted with Specac Atlas heated plates andtemperature controller. Using a custom-made apparatus con-sisting of two brass plates between which the brass mold andthe polymer films were placed, the press was first heated to153 °C with a dwell time of 10 seconds before reducing thetemperature. The pressure (25 bar) was applied during heatingwhen the press reached 75 °C. The pressure was maintainedover the polymer film via the top brass plate which had anopening for introducing and releasing (pressurized) nitrogengas. The heated press was then cooled to at least 125 °C beforedemolding the polymer films. The resulting depth of themicrocavities were measured using a confocal laser scanning-based optical profilometer (Keyence, Japan).
2.2. Contact angle measurement
A Drop Shape Analyzer device (DSA25-Kruss Germany) wasused for the measurement of the contact angle of water on theFEP films. The films were attached to a glass slide to ensure asmooth homogeneous surface. Measurements were carried outat room temperature. A 4 µL droplet of water was dropped at arate of 100 µL min−1 onto the surface of the sample using thesessile drop method. The drop was captured by video over a60-second time frame. The water contact angle was determinedfor each frame of the video captured via the Drop ShapeAnalyzer software using the Tangent – 2 fit. The results displaythe water contact angle average for left-hand side and right-hand side of the drop at t = 30 seconds.
2.3. Adapting microcavities for cell culture
After microthermoforming, the microcavity arrays werepunched (cut) using a manual punch to fit inside a well of 24
Table 1 Refractive indices of various materials referred to in themanuscript
Material Refractive index Source
DMEM cell culture medium 1.337 29PBS 1.335 29FEP 1.34 4PC 1.586 5PS 1.592 5
Biomaterials Science Paper
This journal is © The Royal Society of Chemistry 2021 Biomater. Sci., 2021, 9, 7838–7850 | 7839
Publ
ishe
d on
21
Oct
ober
202
1. D
ownl
oade
d on
12/
9/20
21 8
:25:
03 A
M.
View Article Online

well plate. The microcavities were then hydrophilized by usingan ethanol dilution series: 100% ethanol for 15 minutes fol-lowed by 70% ethanol for another 15 minutes. After this, suc-cessive washes with 50% and 20% ethanol followed by twowashes with sterile water (Lonza) were performed. The micro-cavities were then placed into a non-tissue-culture-treated24-well plate and a sterile O ring (Eriks BV) was added on top.To prevent cell attachment, 3% Pluronic F108 (Sigma Aldrich)solution was put into each well and the wells were incubatedin the solution overnight. Before cell seeding, the films werewashed with Phosphate Buffered Saline (PBS) thrice. Afterseeding cells into the microcavity arrays, cell culture mediumwas added to the well along the sides to ensure the presence ofmedium between the well and the microcavities.
2.4. Culture and seeding of mESCs for gastruloid formation
E14Tg2A mESCs17 (ES-E14TG2a, ECACC 08021401) and T/Bra::GFP mESCs18,44 (hereby referred to as Bra::GFP mESCs18,44)were used for aggregate formation. Both cells were cultured ina T-25 flask coated with 0.1% gelatin in GMEMBHK-21 medium containing 10% v/v foetal calf serum (FCS)and supplemented with leukemia inhibitory factor (LIF), MEMnon-essential amino acids, sodium pyruvate, GlutaMax andβ-Mercaptoethanol. The cells were cultured in an incubatorwith 5% CO2 at 37 °C with daily refreshment of medium. Forformation of gastruloids, the methods previously described byothers14–16,19 was adapted for FEP microcavities. Gastruloidswere also formed in U-bottomed 96 well plates (GreinerCellstar). 250–300 cells per microcavity were seeded in the FEPmicrocavities in a seeding volume of 0.5 mL N2B27 medium(per well of a 24 well plate) and the cells were allowed to settlefor 5 minutes. This was followed by addition of 1.5 mL ofN2B27 to each well. At 48 hours post seeding (hps), a pulse of3 µM CHIR99021 (Stemcell Technologies) was applied for24 hours. At 72hps, medium was changed to either freshN2B27 or N2B27 containing 1.5 µM Latrunculin A (LatA)(Abcam). Initial analysis of machine learning pipeline was per-formed using brightfield images of red fluorescent protein(RFP)-tagged histone H2B mESCs (H2B-RFP mESCs, describedpreviously in ref. 20) which were expanded in advanced N2B27supplemented with CHIR99021, PD0325901 and LIF (advancedN2B27 with 2i/LIF) cultured on 0.1% Gelatin coating. Thesame medium was used to seed these mESCs on either PC orFEP microcavities. The seeding efficiency (calculated amongst122 microcavities located in two different microcavity arrays)was found to be 95.9 percent (Fig. S1†).
2.5. Time-lapse imaging
For time-lapse imaging, the well plate was placed in a Nikoneclipse Ti-S microscope with an incubator (Okolab boldine)which was maintained at 37 °C with 5% CO2 and 51% relativehumidity. Prior to the start of time-lapse imaging, Bra::GFPmESC aggregates were manually selected based on the GFPexpression. The imaging was started at 72 hps and imageswere taken every 30 minutes subsequently.
2.6. Image processing
Images were obtained using a Nikon eclipse Ti-S or a Nikoneclipse TS100 microscope unless otherwise mentioned. Theimages were post-processed using FIJI. The gray values for themicrocavities were obtained using the plot profile option.Initial tests for global image thresholding were performedusing the Auto Threshold plugin in FIJI with default para-meters. Machine-learning based segmentation was performedusing Trainable Weka Segmentation in FIJI.21,22 Prior to seg-mentation, the images were cropped to reduce the overall seg-mentation area. Time-lapse image sequences of aggregateswere non-randomly preselected based on prominent Brachyuryexpression and polarization across the various time points.The resulting segmented images were then processed usingFIJI and results were exported to Microsoft Excel. PPSV (in %)was determined from images (with edge length of at least 486pixels) of either PC or FEP microcavities (after 15 minutes ofcell seeding with H2B-RFP mESCs) acquired randomly from atleast three independent sets of microcavity arrays (N ≥ 3).PPSV is defined by the following equation:
PPSV ¼ true positive areatrue positive areaþ false positive area
� 100 ð1Þ
where the true positive area is the correctly detected area ofthe cell cluster and the false positive area is the area which isfalsely detected as the cell cluster after training of theTrainable Weka Segmentation (TWS) pipeline. For PPSV deter-mination, the model was set to identify two classes of objects(either cell clusters or the background) based on one labelassigned per class. Since the pipeline was not trained toexclude air bubbles and cells in other focal planes, the areasresulting from these objects was excluded from the PPSVmeasurements wherever possible.
2.7. Scanning electron microscopy
For scanning electron microscopy (SEM), the samples wereglued to aluminum stubs and sputter-coated (with either goldor iridium). The SEM images were acquired using either PhilipsXL30 or FEI Teneo microscope with the beam at 2–5 kV.
2.8. Statistical analysis
Depending on the datasets, either (one-, two- or three-way)analysis of variance (ANOVA) followed by Bonferroni’s multiplecomparison test or t-test was performed using GraphPad Prismversion 8.0.2 for Windows (GraphPad Software, La JollaCalifornia USA, http://www.graphpad.com). For all samples, atleast three measurements were considered (N ≥ 3). p < 0.05was considered significant for all the tests. Wherever men-tioned, ns represents not significant.
3. Results and discussion
To harbor single mESCs aggregates which have been reportedto grow up to 500 µm (or even larger if/when transferred to
Paper Biomaterials Science
7840 | Biomater. Sci., 2021, 9, 7838–7850 This journal is © The Royal Society of Chemistry 2021
Publ
ishe
d on
21
Oct
ober
202
1. D
ownl
oade
d on
12/
9/20
21 8
:25:
03 A
M.
View Article Online

shaker culture), we first devised a method to fabricate micro-cavities with a diameter of 800 µm using thin, commerciallyavailable FEP films.
To produce microcavity arrays using thin FEP films, we uti-lized the process of microthermoforming, which has been well
described in conjunction with thermoplastic polymers.23–27
Briefly, the process consists of the application of controlledpressure at elevated temperatures to three-dimensionallystretch a thin polymer film into a mold (Fig. 1a). The brassmolds were fabricated using precision micromilling and
Fig. 1 Microfabrication of cavities using thin FEP films. (a) Schematic showing process of microthermoforming, which utilizes elevated temperatureand pressure to form the polymer film (purple) into a predefined mold (orange) after which the resulting microcavity is used for culturing cells as 3Daggregates. (b and c) Depth profile and optical image of the precision micromilled (800 µm diameter) brass array used for fabrication of the cavitiesshowing no visible defects. (d) Punched thermoformed FEP microcavities, which can be fit in a 24-well plate alongside a 2 euro cent coin for scale.SEM images showing (e) an overview and (f ) a magnified image of the FEP microcavities. (g) Image from a laser scanning microscope showing themicrothermoformed FEP microcavity arrays. (h) Height profile of the microcavity arrays showing homogenous depth profile of the microcavities. Theheight scale is shown in µm. (i) The average depth of the FEP microcavities was 325.8 (±60.46) µm as quantified using the optical profilometer. ( j)The microthermoforming process did not lead to change in the hydrophobicity of the FEP film which remained significantly higher than TCP bothbefore and after being subjected to the forming temperature and pressure. Scale bars represent: 1000 µm for (c), (g) and (h); 500 µm for (e); 200 µmfor (f ). *** indicates p < 0.001.
Biomaterials Science Paper
This journal is © The Royal Society of Chemistry 2021 Biomater. Sci., 2021, 9, 7838–7850 | 7841
Publ
ishe
d on
21
Oct
ober
202
1. D
ownl
oade
d on
12/
9/20
21 8
:25:
03 A
M.
View Article Online

showed uniform height profile and no defects when observedusing laser scanning optical profilometer (Fig. 1b and c). Theparameters for microthermoforming were optimized toproduce chips with 77 microcavity arrays per chip, which weredesigned to fit in a 24 well plate (Fig. 1d). Further, the micro-thermoforming parameters were chosen to yield a depth ofmore than 250 µm depth in the microcavities which wouldenable secure handling of cell clusters without risk of beingremoved from the cavity. When observed using SEM, theresulting microcavities were found to be uniform (Fig. 1e andf). Optical and height profile images of the FEP microcavityarray obtained using laser scanning microscope showed ahomogenous depth profile without any defects (Fig. 1g and h).When quantified across 12 independent points spread across
four different films, the parameters used for microthermo-forming gave rise to a depth consistently above our aim of250 µm (325.8 ± 60.46 µm) (Fig. 1i). The standard deviation of60.46 µm is possibly caused due to a combination of shorterdwell times used in this study (10 seconds at the microthermo-forming temperature of 153 °C) and the layout of microcavityarrays in the mold as shown in Fig. S2.† Since all the arrayswere not equidistant from the center, this could result in avariation in heating at the different arrays leading to higherdeviation. This could be circumvented by increasing the dwelltime or by modifying the mold design. The FEP films exposedto the microthermoforming parameters showed no significantchanges to contact angle (Fig. 1j) compared to untreated FEPfilms (107.20° ± 3.76 before forming; 104.60° ± 5.44 after
Fig. 2 FEP can be formed into various shapes using microthermoforming. (a) Depth profile of the precision micromilled (500 µm wide and1000 µm long) brass cavity array used for fabrication of the cavities showing no visible defects. (b) Optical image of the resulting microthermo-formed elongated microcavity array. (c and d) Magnified optical image and depth profile of a single elongated microcavity showing a resulting depthof 353.01 µm. The height scale is shown in µm. SEM images showing (e) elongated FEP microcavities and (f ) magnified image of the area shown inred dashed box in (e). Scale bars represent 2000 µm, 200 µm, 250 µm and 500 µm for (b), (c), (e) and (f ) respectively.
Paper Biomaterials Science
7842 | Biomater. Sci., 2021, 9, 7838–7850 This journal is © The Royal Society of Chemistry 2021
Publ
ishe
d on
21
Oct
ober
202
1. D
ownl
oade
d on
12/
9/20
21 8
:25:
03 A
M.
View Article Online

forming) and the values were considerably higher than tissueper cell culture treated PS (TCP) (64.53° ± 1.72). This showedthat the microthermoforming process did not alter the wettingbehavior of the FEP film.
To show that the process of forming FEP microcavities isnot restricted to a specific shape and can be easily adapted toother shapes and sizes, we used a mold with elongated micro-cavities,28 which were 1000 µm long and 500 µm wide (Fig. 2a;Fig. S3†). An overview of the microthermoformed elongatedFEP microcavities is shown in Fig. 2b, with enlarged opticalimage in Fig. 2c showing no deformation of the structures.The elongated FEP microcavity had a depth of 353.01 µm andthe depth map is shown in Fig. 2d. The elongated FEP micro-cavities were uniformly shaped as observed using SEM (Fig. 2eand f). Thus, we were able to fabricate elongated microcavitieswith depth of more than 350 µm, which could be used toproduce one cell aggregate per cavity while preventing aggre-gate movement as well as rotation. This allows spatial controlover the movement of an aggregate which can simplify trackingof single cells within the 3D construct.
An important property of FEP films is the similarity inrefractive index (n = 1.344, manufacturer’s datasheet) com-pared to common cell culture medium (e.g. Dulbecco’sModified Eagle Medium (DMEM), n = 1.337)29 and PBS (n =1.335).29 To quantify and compare the background gray values(pixel brightness) when using FEP or PC microcavities foroptical microscopy, we captured brightfield images of micro-
thermoformed FEP films and PC films (which was used asbacking film during FEP forming) at the same microscope set-tings after placing them in cell culture medium. The resultingimages showed a significant difference in the gray valuesacross the two materials (PC shown in Fig. 3a and FEP shownin Fig. 3b). Upon quantification of the gray values, it wasobserved that FEP microcavities had a homogenous back-ground intensity profile while PC microcavities showed signifi-cant variations in the background intensity profile (Fig. 3c;Fig. S4;† N = 3; as an example, white lines in Fig. 3a and bshow the measurement line for the respective cavities). Theseproperties have important implications for image segmenta-tion, which is an image processing technique used to identifyobjects and features by dividing the image into differentsegments.21,30 A homogenous background signal in brightfieldimages can aid in demarcation between cellular entities andthe background, which in turn can aid label free image seg-mentation. This is especially apparent when H2B-RFP mESCssuspension is seeded into the PC and FEP microcavities. Whilethe cell clusters seeded in the FEP microcavities can be visuallyidentified even without using a microscope, the cell clustersare difficult to discern in the PC microcavities (Fig. 3d and e;Fig. S5†). To determine whether this property is beneficial forthe (global) image thresholding methods available in the com-monly used open-source software FIJI,22 we applied the 17different thresholding methods using default settings tobrightfield images of either a PC or FEP microcavity containing
Fig. 3 FEP microcavities show excellent optical properties for microscopy imaging. (a) Brightfield image of thermoformed PC microcavity showingvariation in intensity across the microcavity area. (b) Brightfield image of thermoformed FEP microcavity showing homogenous intensity across themicrocavity area. (c) Quantification of gray values across randomly selected FEP and PC cavities (example lines shown as the white lines in theimages a and b) showing significantly higher variation of gray value when using PC films (averaged across N = 3). Photos of (d) PC and (e) FEP micro-cavities in cell culture media after seeding of H2B-RFP mESCs. (f ) The use of FEP microcavities led to a significantly higher positive predictive seg-mentation value (∼85% average) compared to PC microcavities (∼65% average) when using the machine-learning pipeline described in this manu-script (N ≥ 3; significance levels indicate: * p < 0.05). Scale bar represents 250 µm.
Biomaterials Science Paper
This journal is © The Royal Society of Chemistry 2021 Biomater. Sci., 2021, 9, 7838–7850 | 7843
Publ
ishe
d on
21
Oct
ober
202
1. D
ownl
oade
d on
12/
9/20
21 8
:25:
03 A
M.
View Article Online

mESCs. 12 methods correctly segmented the images whenusing FEP microcavity, while background interference wasobserved in all the methods when using the PC microcavity(Fig. S6†). Even after the application of the machine-learningbased automated segmentation pipeline which is describedlater in this manuscript, the segmentation accuracy was higherwhen using FEP microcavities compared to PC microcavities.To quantify this segmentation accuracy, we calculated the posi-tive predictive segmentation value (PPSV in %, eqn (1) inMaterials and methods) for the cell cluster area. We definePPSV as the ratio of the true positive area (i.e., actual cellcluster area) to the total positive area (i.e., sum of true andfalse positive areas). PPSV was significantly higher when usingFEP microcavities compared to PC microcavities (Fig. 3f;average PPSV of 85.29% for FEP compared to 65.03% for PC, N≥ 3, p < 0.05). These results show that the FEP microcavitiesare well-suited for label-free feature extraction.
We next utilized the FEP microcavities to form 3D free-float-ing mESC aggregates which have been previously shown toundergo axial elongation, symmetry breaking and polarizedBrachyury expression14,15 similar to a gastrulating embryo(Fig. 4a; Fig. S7†). In order to evaluate whether the cells experi-enced cytotoxicity when cultured in FEP microcavities, we first
formed and cultured E14Tg2A mESC aggregates in the FEPmicrocavities for 48 hours and then performed a live/deadassay. The results show that the aggregates were stained predo-minantly green (live) and the platform does not interfere withthe sensitive aggregation process (Fig. 4b). Cuvettes manufac-tured from FEP have been previously shown to be permissibleto fixation and staining of biological specimens without theneed to transfer them to another substrate.4 Further culture ofthe E14Tg2A mESCs until 96 hps showed aggregate elongationand upon on-chip immunostaining, polarized expression ofBrachyury was observed (Fig. 4c).
In order to analyze the propagation of Brachyury signal inreal-time, we decided to use Bra::GFP18 mESCs which is areporter cell line for Brachyury expression. When cultured inthe FEP microcavities till 91.5 hps, the Bra::GFP mESC aggre-gates also showed polarized Brachyury expression and axialelongation (Fig. 5a, ESI Movie S1†). The Brachyury signal wasfurther analyzed and averaged across different aggregates (N ≥3) and showed an increasingly localized expression with pro-gressing culture time (Fig. 5b). We thus concluded that theFEP microcavities were capable of sustaining aggregate elonga-tion and polarized Brachyury expression when mESC aggre-gates were cultured in 3D free-floating suspension culture
Fig. 4 mESCs can be aggregated and cultured using the FEP microcavities. (a) Schematic showing part of the process of forming aggregates ofmESCs (gastruloids) which show processes like symmetry breaking and axial elongation similar to embryonic morphogenesis. (b) Live/dead stainingof E14Tg2A mESC aggregates cultured in the FEP microcavity for 48 hours post seeding. (c) On-chip immunostaining for mesoderm markerBrachyury performed on E14Tg2A mESC aggregates 96 hps showed polarized Brachyury expression in the elongated aggregates. Scale bars rep-resent 250 µm and 100 µm for (b) and (c) respectively.
Paper Biomaterials Science
7844 | Biomater. Sci., 2021, 9, 7838–7850 This journal is © The Royal Society of Chemistry 2021
Publ
ishe
d on
21
Oct
ober
202
1. D
ownl
oade
d on
12/
9/20
21 8
:25:
03 A
M.
View Article Online

within the microcavities. Further, the platform is suitable foron-chip immunostaining, which increases its utility bydecreasing the need for an additional sample harvesting step.
Single plane (2D) microscopy (for example, using widefieldmicroscopy) has been previously used by others as a well-estab-lished method for quantification of aggregate dimension orthe underlying germ layer patterning in elongating 3D pluripo-tent cell aggregates.16,31,32 Long-term time-lapse imaging ofbiological samples generates multiple image sequences, whichcan be labor and resource intensive to quantify manually. Wedeveloped a pipeline consisting of freely available, open sourcemachine learning based TWS21 plugin which works with FIJI22
for automated feature extraction from time-lapse image seriesacross different aggregates (Fig. 6a, Fig. S8a†). This enables asingle-step, quick (∼2 seconds per image) feature extractionprocess which can even be applied to photos from a mobilephone camera to determine the location and relative sizes of
cell clusters in the FEP microcavity array (Fig. S8b†). The appli-cation of the pipeline to a series of time-lapse images showedrobust and reproducible segmentation of the aggregate com-pared to the background in brightfield images (Fig. 6b).Further, the Brachyury expressing region of the aggregatescould be demarcated from the total aggregate area using fluo-rescence microscopy images (Fig. 6c). Quantification of dataacross different aggregates (N ≥ 3) showed that the manuallymeasured values of area (59 423 ± 19 167) µm2 and perimeter(967.3 ± 123.9) µm were similar to automatically measuredarea (61 713 ± 18 391) µm2 and perimeter (987.4 ± 116.2) µmvalues when the analysis was performed on 72 hps aggregates(Fig. 6d and e). This proved that the pipeline can be used forrobust automated feature extraction from time-lapsemicroscopy images obtained using FEP microcavities. We thenused the developed pipeline to quantify morphometric fea-tures of the aggregate over a period of 19.5 hours (from 72 to
Fig. 5 Bra::GFP mESC aggregates show axial elongation and Brachyury polarization. (a) Images from time-lapse sequence showing real-time pro-gression of Brachyury localization between 72 and 91.5 hps when cultured in FEP microcavities. (b) Quantification of Brachyury localization in 72and 91.5 hps aggregates cultured in FEP cavities shows increased localization of Brachyury towards one end of the elongating aggregate (averagedsignal intensities of at least three aggregates). Scale bar represents 200 µm.
Biomaterials Science Paper
This journal is © The Royal Society of Chemistry 2021 Biomater. Sci., 2021, 9, 7838–7850 | 7845
Publ
ishe
d on
21
Oct
ober
202
1. D
ownl
oade
d on
12/
9/20
21 8
:25:
03 A
M.
View Article Online
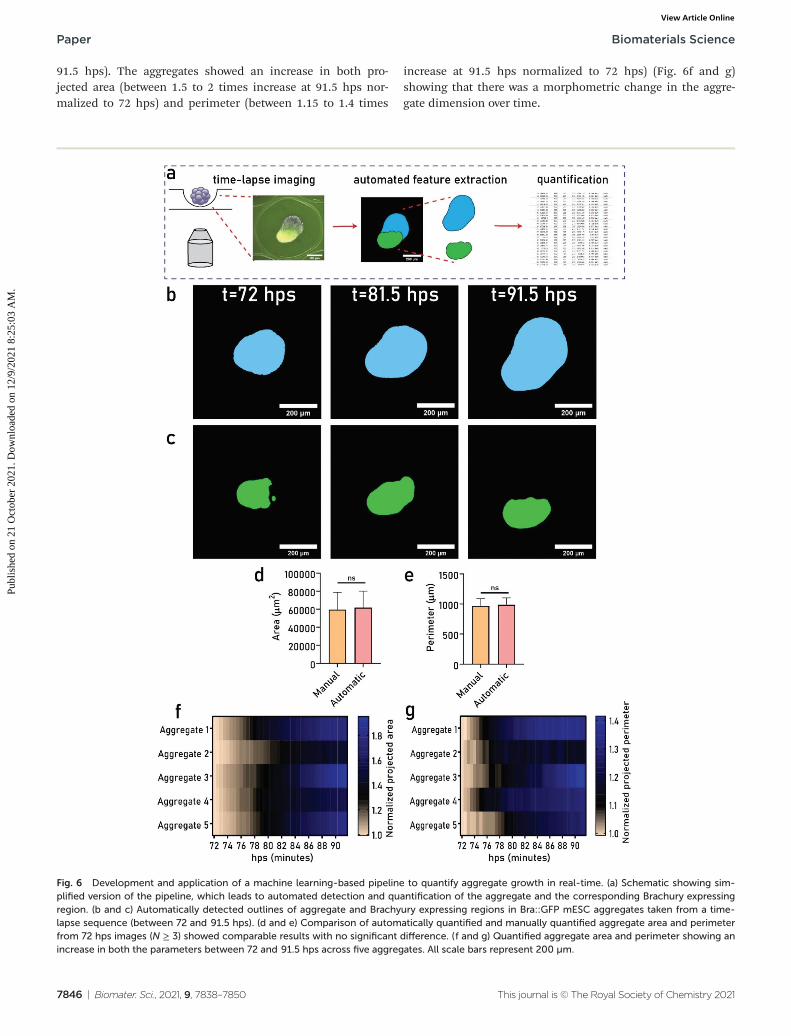
91.5 hps). The aggregates showed an increase in both pro-jected area (between 1.5 to 2 times increase at 91.5 hps nor-malized to 72 hps) and perimeter (between 1.15 to 1.4 times
increase at 91.5 hps normalized to 72 hps) (Fig. 6f and g)showing that there was a morphometric change in the aggre-gate dimension over time.
Fig. 6 Development and application of a machine learning-based pipeline to quantify aggregate growth in real-time. (a) Schematic showing sim-plified version of the pipeline, which leads to automated detection and quantification of the aggregate and the corresponding Brachury expressingregion. (b and c) Automatically detected outlines of aggregate and Brachyury expressing regions in Bra::GFP mESC aggregates taken from a time-lapse sequence (between 72 and 91.5 hps). (d and e) Comparison of automatically quantified and manually quantified aggregate area and perimeterfrom 72 hps images (N ≥ 3) showed comparable results with no significant difference. (f and g) Quantified aggregate area and perimeter showing anincrease in both the parameters between 72 and 91.5 hps across five aggregates. All scale bars represent 200 µm.
Paper Biomaterials Science
7846 | Biomater. Sci., 2021, 9, 7838–7850 This journal is © The Royal Society of Chemistry 2021
Publ
ishe
d on
21
Oct
ober
202
1. D
ownl
oade
d on
12/
9/20
21 8
:25:
03 A
M.
View Article Online

Use of in vitro embryonic morphogenesis models in combi-nation with microengineered platforms could serve as a valu-able tool for testing developmental toxicity31,33–37 of variousdrugs and small molecules. Due to the low molecular absorp-tion and adsorption properties of FEP, it serves as an ideal
material for screening of small molecules. A potential appli-cation of the FEP microcavities was showcased for drug andpharmacological testing in conjunction with the describedhigh-throughput image analysis pipeline. LatA is a knowninhibitor of actin polymerization38 and has been known to
Fig. 7 Application of FEP microcavities and the developed pipeline for drug-testing. (a) Fluorescence microscopy images of LatA exposed Bra::GFPmESC aggregates showing ablation of Brachyury expressing region between 72 and 91.5 hps. (b and c) Automatically detected outlines of aggregateand Brachyury expressing regions in LatA exposed Bra::GFP mESC aggregates taken from a time-lapse sequence (between 72 and 91.5 hps). (d)Quantified Brachyury expressing area shows similar values for control aggregates and carrier-exposed aggregates. LatA exposed aggregates show adrastic decrease in the Brachyury expressing area which completely ablates within approximately 12 hours. Scale bars represent 200 µm for (a) and150 µm for (b) and (c).
Biomaterials Science Paper
This journal is © The Royal Society of Chemistry 2021 Biomater. Sci., 2021, 9, 7838–7850 | 7847
Publ
ishe
d on
21
Oct
ober
202
1. D
ownl
oade
d on
12/
9/20
21 8
:25:
03 A
M.
View Article Online

interfere with gastrulation and Brachyury expression in rabbitembryos.39 mESC aggregates exposed to LatA showed a clearand marked change in aggregate morphology as well asBrachyury expression. Upon exposure to LatA, the gastruloidsundergo reduction in Brachyury expressing region followed bycomplete ablation of detectable expression and polarization asshown in fluorescence microscopy images (Fig. 7a–c). Withinten hours of exposure, the sharper aggregate edges changedinto irregular outlines consisting of single cells (Fig. 7a). Bythe end of 19.5 hours of imaging, it was observed that none ofthe LatA treated aggregates showed elongation morphogenesis(Fig. 7a). When the area of Brachyury expression was quanti-fied across the imaging period, we found that the control gas-truloids (not exposed to any drug) and carrier (DMSO) exposedgastruloids showed no ablation of Brachyury expressingregions. In contrast, all the LatA exposed aggregates (N ≥ 3)showed a rapid decline in the detectable Brachyury expressingarea, which decreased below an arbitrary threshold within afew hours (Fig. 7d). Overall, these results indicate that LatAinterferes with aggregate elongation and polarization ofBrachyury expression by inhibiting important cellular pro-cesses like cell division and migration as has been previouslyshown in rabbit embryos.39 These results thus indicate thatthe microengineered tool described in this manuscript can beused for drug and small molecule testing in a reproducibleand robust manner. Using the described automated label freefeature extraction methods, drug and dosage testing of otherpharmacological agents could be performed using live-cellimaging. These experiments could decipher new chemicalcues which interfere with processes involved in tissue morpho-genesis, e.g., cell migration, proliferation and differentiation.Here, we focused on the development, application and suit-ability of a FEP-based microengineered platform for image-based HCS. Future studies detailing comparative resultsbetween FEP-based platforms and established platforms (e.g.using PC and PS) are warranted, although they are beyond thescope of this manuscript.
The use of transparent fluorinated polymer films for stemcell culture can be advantageous due to its chemical inertnessespecially in relation to molecular (surface) adsorption and poten-tial leaching.2 FEP has also been previously used as a material forcuvette fabrication in conjunction with long term imaging of epi-thelial organoids using light sheet fluorescence microscopybecause it could “preserve physiological culture conditions fororganoid cultures” and was permissible to high-resolutionimaging.40 Future experiments to exploit the use of FEP microcav-ities with other 3D cell culture models, such as organoids, arewarranted, possibly by using other shapes and sizes of microcav-ities. For example, flat-bottomed microcavities could be generatedby modifying the design and micromilling parameters of themold which would be used for microthermoforming.
We had previously developed a PC microcavity platform forsingle cell tracking within 3D cell culture models using fluo-rescence confocal microscopy which could also be used forlabel free feature extraction from brightfield images.28
However, this feature extraction process required the use of
multiple software for image processing and data extractionsteps. This multi-step procedure was needed for the removal ofbackground signal prior to quantification of aggregate sizewhich also led to an increased image processing time. Thepipeline described here only utilizes FIJI software which isalready widely used by the biomedical research communityand can be easily adapted for studies with other types of cellsand microtissues since the involved plugins and software areopen source. This is especially relevant for analyzing long-termimaging experiments using the different morphogenesismodels of mouse and human embryonic development whichare currently available,20,32,41,42 e.g., to study the effect ofpharmacological agents and small molecules on embryonicdevelopment in a high-content manner. Combination withother technologies, such as microfluidics, to manipulate tissuepatterning and morphogenesis within these in vitro stem cell-based models, will further bring new important insights intoearly embryonic development.43
4. Conclusions
To conclude, we used a custom-fabricated thin film FEP micro-cavity array in conjunction with 3D aggregates of mESCs grownin suspension culture. The microcavities provide excellentoptical properties with a homogenous background contrastdue to the matched refractive index of the material with thesurrounding medium. Further, the use of an open-sourcemachine-learning plugin-based pipeline was described whichenables automated feature extraction from a series of label-freebrightfield time-lapse image sequence with minimal userinput except for initial training of the segmentation model. Welastly showed the potential of this platform by using it fortesting the effect of an actin polymerization inhibitor drugLatA, which interferes with axial elongation and germ layerspecification. Future studies using the described platform andpipeline in combination with other in vitro models of embryo-nic development will help in broadening our knowledge ofmorphogenetic events involved in embryonic development.
Author contributions
P.S., R.T. and S.G. conceptualized and designed the study. P.S.conducted the experiments, analyzed the data and wrote themanuscript. E.G. helped with the contact angle measurementsand analysis. S.G contributed to writing and refining themanuscript while all co-authors edited the manuscript. S.G.,R.T. and C.v.B. provided overall direction, supervision andacquired funding.
Conflicts of interest
The authors declare the following competing interests: R.T.and S.G. are founders and shareholders of 300MICRONSGmbH.
Paper Biomaterials Science
7848 | Biomater. Sci., 2021, 9, 7838–7850 This journal is © The Royal Society of Chemistry 2021
Publ
ishe
d on
21
Oct
ober
202
1. D
ownl
oade
d on
12/
9/20
21 8
:25:
03 A
M.
View Article Online

Acknowledgements
The authors acknowledge financial support by the DutchProvince of Limburg (program ‘Limburg INvesteert in haarKenniseconomie/LINK’) and Stichting De Weijerhorst. Theauthors would like to acknowledge Amit Chandrakar (MERLNInstitute) and Denis van Beurden (MERLN Institute) for helpwith the SEM imaging of the FEP microcavities. The authorswould like to acknowledge help from Professor AlfonsoMartinez Arias and Tina Balayo for setting up the gastruloidculture and for the Bra::GFP mESCs. The authors acknowledgehelp from Dr. Philipp Maurer for micromilling of the brassmold. Part of the schematics used in this manuscript werecreated with BioRender.com.
Notes and references
1 S. Lin, K. Schorpp, I. Rothenaigner and K. Hadian, DrugDiscovery Today, 2020, 25, 1348–1361.
2 K. Ren, W. Dai, J. Zhou, J. Su and H. Wu, Proc. Natl. Acad.Sci. U. S. A., 2011, 108, 8162–8166.
3 W. H. Grover, M. G. von Muhlen and S. R. Manalis, LabChip, 2008, 8, 913–918.
4 K. Hötte, M. Koch, L. Hof, M. Tuppi, T. Moreth,M. M. A. Verstegen, L. J. W. van der Laan, E. H. K. Stelzerand F. Pampaloni, Sci. Rep., 2019, 9, 17292.
5 M. Stefik, S. Guldin, S. Vignolini, U. Wiesner andU. Steiner, Chem. Soc. Rev., 2015, 44, 5076–5091.
6 T. Boothe, L. Hilbert, M. Heide, L. Berninger,W. B. Huttner, V. Zaburdaev, N. L. Vastenhouw,E. W. Myers, D. N. Drechsel and J. C. Rink, eLife, 2017, 6,e27240.
7 D. N. H. Kim, K. T. Kim, C. Kim, M. A. Teitell andT. A. Zangle, Microfluid. Nanofluid., 2017, 22, 2.
8 A. Kaufmann, M. Mickoleit, M. Weber and J. Huisken,Development, 2012, 139, 3242–3247.
9 A. M. Petzold, V. M. Bedell, N. J. Boczek, J. J. Essner,D. Balciunas, K. J. Clark and S. C. Ekker, Zebrafish, 2010, 7,149–154.
10 M. Charnley, M. Textor, A. Khademhosseini andM. P. Lutolf, Integr. Biol., 2009, 1, 625–634.
11 S.-H. Kim, G. H. Lee and J. Y. Park, Biomed. Eng. Lett., 2013,3, 131–137.
12 E. Sahlin, A. T. Beisler, S. J. Woltman and S. G. Weber,Anal. Chem., 2002, 74, 4566–4569.
13 Micro-Precision 3D Printing Makes Micro Molds forThermoformed Microplates, https://bmf3d.com/resource/micro-precision-3d-printing-makes-micro-molds-for-ther-moformed-microplates/, (accessed 4th August, 2021).
14 S. C. van den Brink, P. Baillie-Johnson, T. Balayo,A.-K. Hadjantonakis, S. Nowotschin, D. A. Turner andA. Martinez Arias, Development, 2014, 141, 4231–4242.
15 P. Baillie-Johnson, S. C. van den Brink, T. Balayo,D. A. Turner and A. Martinez Arias, J. Vis. Exp., 2015,e53252.
16 D. A. Turner, M. Girgin, L. Alonso-Crisostomo, V. Trivedi,P. Baillie-Johnson, C. R. Glodowski, P. C. Hayward,J. Collignon, C. Gustavsen, P. Serup, B. Steventon, M. P. Lutolfand A. Martinez Arias, Development, 2017, 144, 3894–3906.
17 A. G. Smith and M. L. Hooper, Dev. Biol., 1987, 121, 1–9.18 H. J. Fehling, G. Lacaud, A. Kubo, M. Kennedy,
S. Robertson, G. Keller and V. Kouskoff, Development, 2003,130, 4217–4227.
19 L. Beccari, N. Moris, M. Girgin, D. A. Turner, P. Baillie-Johnson, A. C. Cossy, M. P. Lutolf, D. Duboule andA. M. Arias, Nature, 2018, 562, 272–276.
20 N. C. Rivron, J. Frias-Aldeguer, E. J. Vrij, J.-C. Boisset,J. Korving, J. Vivié, R. K. Truckenmüller, A. vanOudenaarden, C. A. van Blitterswijk and N. Geijsen, Nature,2018, 557, 106–111.
21 I. Arganda-Carreras, V. Kaynig, C. Rueden, K. W. Eliceiri,J. Schindelin, A. Cardona and H. Sebastian Seung,Bioinformatics, 2017, 33, 2424–2426.
22 J. Schindelin, I. Arganda-Carreras, E. Frise, V. Kaynig,M. Longair, T. Pietzsch, S. Preibisch, C. Rueden,S. Saalfeld, B. Schmid, J. Y. Tinevez, D. J. White,V. Hartenstein, K. Eliceiri, P. Tomancak and A. Cardona,Nat. Methods, 2012, 9, 676–682.
23 S. Giselbrecht, T. Gietzelt, E. Gottwald, C. Trautmann,R. Truckenmuller, K. F. Weibezahn and A. Welle, Biomed.Microdevices, 2006, 8, 191–199.
24 S. Giselbrecht, E. Gottwald, R. Truckenmueller,C. Trautmann, A. Welle, A. Guber, V. Saile, T. Gietzelt andK.-F. Weibezahn, J. Visualized Exp., 2008, 699, DOI:10.3791/699.
25 R. Truckenmüller, S. Giselbrecht, M. Escalante-Marun,M. Groenendijk, B. Papenburg, N. Rivron, H. Unadkat,V. Saile, V. Subramaniam, A. van den Berg, C. vanBlitterswijk, M. Wessling, J. de Boer and D. Stamatialis,Biomed. Microdevices, 2012, 14, 95–107.
26 R. Truckenmüller, S. Giselbrecht, N. Rivron, E. Gottwald,V. Saile, A. van den Berg, M. Wessling and C. vanBlitterswijk, Adv. Mater., 2011, 23, 1311–1329.
27 R. Truckenmuller, S. Giselbrecht, C. van Blitterswijk,N. Dambrowsky, E. Gottwald, T. Mappes, A. Rolletschek,V. Saile, C. Trautmann, K. F. Weibezahn and A. Welle, LabChip, 2008, 8, 1570–1579.
28 P. Samal, P. Maurer, C. van Blitterswijk, R. Truckenmüllerand S. Giselbrecht, Adv. Mater., 2020, 32, 1907966.
29 V. T. Hoang, G. Stępniewski, K. H. Czarnecka,R. Kasztelanic, V. C. Long, K. D. Xuan, L. Shao,M. Śmietana and R. Buczyński, Appl. Sci., 2019, 9, 1145.
30 Y. Tan, in Gpu-Based Parallel Implementation of SwarmIntelligence Algorithms, ed. Y. Tan, Morgan Kaufmann,2016, pp. 167–177, DOI: 10.1016/B978-0-12-809362-7.50011-X.
31 E. L. L. Warkus, A. A. Y. Q. Yuen, C. G. Y. Lau andY. Marikawa, Toxicol. Sci., 2015, 149, 15–30.
32 N. Moris, K. Anlas, S. C. van den Brink, A. Alemany,J. Schröder, S. Ghimire, T. Balayo, A. van Oudenaarden andA. Martinez Arias, Nature, 2020, 582, 410–415.
Biomaterials Science Paper
This journal is © The Royal Society of Chemistry 2021 Biomater. Sci., 2021, 9, 7838–7850 | 7849
Publ
ishe
d on
21
Oct
ober
202
1. D
ownl
oade
d on
12/
9/20
21 8
:25:
03 A
M.
View Article Online

33 Y. Marikawa, D. A. Tamashiro, T. C. Fujita andV. B. Alarcon, Genesis, 2009, 47, 93–106.
34 C. G. Lau and Y. Marikawa, Mol. Reprod. Dev., 2014, 81,994–1008.
35 A. S. W. Li and Y. Marikawa, Mol. Reprod. Dev., 2015, 82,1015–1036.
36 E. L. L. Warkus and Y. Marikawa, Toxicol. Sci., 2017, 157,235–245.
37 C. J. Yuan and Y. Marikawa, Food Chem. Toxicol., 2017, 109,376–385.
38 I. Spector, N. R. Shochet, D. Blasberger and Y. Kashman,Cell Motil., 1989, 13, 127–144.
39 V. Stankova, N. Tsikolia and C. Viebahn, Development,2015, 142, 92–98.
40 L. Hof, T. Moreth, M. Koch, T. Liebisch, M. Kurtz, J. Tarnick,S. M. Lissek, M. M. A. Verstegen, L. J. W. van der Laan,M. Huch, F. Matthäus, E. H. K. Stelzer and F. Pampaloni,BMC Biol., 2021, 19, 37.
41 R. Li, C. Zhong, Y. Yu, H. Liu, M. Sakurai, L. Yu, Z. Min,L. Shi, Y. Wei, Y. Takahashi, H. K. Liao, J. Qiao, H. Deng,E. Nunez-Delicado, C. Rodriguez Esteban, J. Wu andJ. C. Izpisua Belmonte, Cell, 2019, 179, 687–702.
42 S. E. Harrison, B. Sozen, N. Christodoulou, C. Kyprianouand M. Zernicka-Goetz, Science, 2017, 356, eaal1810.
43 P. Samal, C. van Blitterswijk, R. Truckenmuller andS. Giselbrecht, Adv. Mater., 2019, 31, e1805764.
44 D. A. Turner, P. Rué, J. P. Mackenzie, E. Davies andA. Martinez Arias, BMC Biol., 2014, 12, 1–19.
Paper Biomaterials Science
7850 | Biomater. Sci., 2021, 9, 7838–7850 This journal is © The Royal Society of Chemistry 2021
Publ
ishe
d on
21
Oct
ober
202
1. D
ownl
oade
d on
12/
9/20
21 8
:25:
03 A
M.
View Article Online