Electron an ion kinetics in fluorinated gases for electrical ...
169
Research Collection Doctoral Thesis Electron an ion kinetics in fluorinated gases for electrical insulation Author(s): Chachereau, Alise Publication Date: 2018 Permanent Link: https://doi.org/10.3929/ethz-b-000311172 Rights / License: In Copyright - Non-Commercial Use Permitted This page was generated automatically upon download from the ETH Zurich Research Collection . For more information please consult the Terms of use . ETH Library
-
Upload
khangminh22 -
Category
Documents
-
view
2 -
download
0
Transcript of Electron an ion kinetics in fluorinated gases for electrical ...
Research Collection
Doctoral Thesis
Electron an ion kinetics in fluorinated gases for electricalinsulation
Author(s): Chachereau, Alise
Publication Date: 2018
Permanent Link: https://doi.org/10.3929/ethz-b-000311172
Rights / License: In Copyright - Non-Commercial Use Permitted
This page was generated automatically upon download from the ETH Zurich Research Collection. For moreinformation please consult the Terms of use.
ETH Library
DISS. ETH NO. 25657
Electron and ion kinetics influorinated gas mixtures for
electrical insulation.
A thesis submitted to attain the degree of
DOCTOR OF SCIENCES of ETH ZURICH
(Dr. sc. ETH Zurich)
presented by
Alise Chachereau
Ingénieur diplômé de l’Ecole centrale de Lyon
born on 28.10.1990citizen of France
accepted on the recommendations of:
Prof. Dr. Christian M. Franck,Prof. Dr. Nickolay L. Aleksandrov
2018

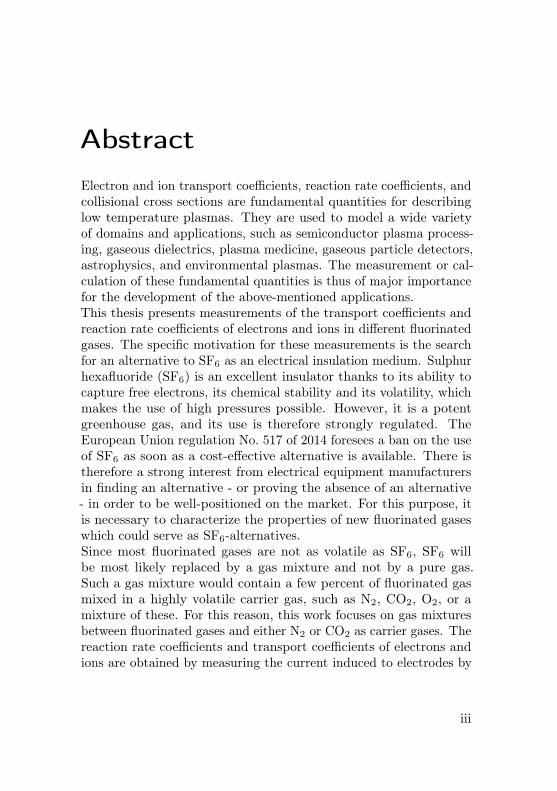
Abstract
Electron and ion transport coefficients, reaction rate coefficients, andcollisional cross sections are fundamental quantities for describinglow temperature plasmas. They are used to model a wide varietyof domains and applications, such as semiconductor plasma process-ing, gaseous dielectrics, plasma medicine, gaseous particle detectors,astrophysics, and environmental plasmas. The measurement or cal-culation of these fundamental quantities is thus of major importancefor the development of the above-mentioned applications.This thesis presents measurements of the transport coefficients andreaction rate coefficients of electrons and ions in different fluorinatedgases. The specific motivation for these measurements is the searchfor an alternative to SF6 as an electrical insulation medium. Sulphurhexafluoride (SF6) is an excellent insulator thanks to its ability tocapture free electrons, its chemical stability and its volatility, whichmakes the use of high pressures possible. However, it is a potentgreenhouse gas, and its use is therefore strongly regulated. TheEuropean Union regulation No. 517 of 2014 foresees a ban on the useof SF6 as soon as a cost-effective alternative is available. There istherefore a strong interest from electrical equipment manufacturersin finding an alternative - or proving the absence of an alternative- in order to be well-positioned on the market. For this purpose, itis necessary to characterize the properties of new fluorinated gaseswhich could serve as SF6-alternatives.Since most fluorinated gases are not as volatile as SF6, SF6 willbe most likely replaced by a gas mixture and not by a pure gas.Such a gas mixture would contain a few percent of fluorinated gasmixed in a highly volatile carrier gas, such as N2, CO2, O2, or amixture of these. For this reason, this work focuses on gas mixturesbetween fluorinated gases and either N2 or CO2 as carrier gases. Thereaction rate coefficients and transport coefficients of electrons andions are obtained by measuring the current induced to electrodes by
iii

iv
electron avalanches in these gas mixtures, with a pulsed Townsendexperiment.The main scientific contributions of this thesis are the following. Firstof all, two problematic aspects of the pulsed Townsend experimentsare identified and remedied: the need to distinguish the currentinduced by the electron avalanche from the capacitive rechargingcurrent of the electrodes, and the need to ensure a low charge densityof the electron avalanche, so that the space charge electric field isnegligible compared to the externally applied field.Secondly, analytic models and tools for the analysis, interpretationand inter-comparison of measurements are developed. In particular,a new model for calculating the ionization and attachment ratecoefficients is obtained.Thirdly, the reaction rate coefficients and transport coefficients aremeasured in eight fluorinated gases: octafluorooxolane (c-C4F8O),octafluorobutene (2-C4F8), hexafluoropropylene oxide (C3F6O), (1E)-1,3,3,3-tetrafluoropropene (C3H2F4), trifluoromethylsulphur hexaflu-oride (SF5CF3), heptafluoropropane (C3HF7), heptafluoroisobuty-ronitrile (C4F7N) and heptafluoroisopropyl trifluoromethyl ketone(C5F10O), and their mixtures with N2 and CO2. In order to makethe obtained results publicly available, an online database "ETHZ" isopened on the platform of the Plasma Data Exchange Project LXcat.For some of the investigated gases, the total electron attachment crosssection is estimated from the measured attachment rate coefficientsusing a linear inversion method. The obtained electron attachmentcross sections are compared with those measured in electron beamexperiments with ion mass spectrometry.Finally, the properties of these gases and gas mixtures are comparedin regard to their performance for electrical insulation. The electronattachment cross sections of the gases are compared, and set in rela-tion with the synergism observed in gas mixtures. The dependenceof the results on the gas pressure and the consequences for highpressure applications are discussed.
RésuméLes coefficients de transport des electrons et des ions en milieugazeux, les taux de réactions et les sections efficaces de collisionsont des quantités fondamentales pour la description des plasmas àbasse température. Elles sont utilisées pour modéliser une grandevariété d’applications, telles que le traitement de semiconducteurspar plasma, l’isolation électrique gazeuse, les plasmas à applicationmédicale, les détecteurs de particules, les plasmas en astrophysiqueet les plasmas à application environnementale. La mesure ou le calculde ces quantités fondamentales ont donc une importance capitalepour le dévelopement des applications sus-mentionnées.Cette thèse présente les résultats de mesures de coefficients de trans-ports et taux de réactions dans différents gaz fluorinés. La motivationspécifique à ces mesures est la recherche d’un gaz pouvant offrir unealternative au SF6 comme isolant électrique gazeux. L’hexafluorurede soufre (SF6) est un excellent insolant grâce à sa capacité à captu-rer les électrons libres, à sa stabilité chimique et à sa volatilité, quipermet l’utilisation de hautes pressions. Cependant, c’est aussi unpuissant gaz à effet de serre, et son usage est donc strictement régulé.La régulation de l’Union Européene no 517 de 2014 prévoit uneinterdiction de l’usage du SF6 comme isolant électrique dès qu’une al-ternative économiquement viable se présentera. Il est donc fortementdans l’intérêt des producteurs d’équipement électrique de trouverles premiers une alternative, ou d’en démontrer l’impossibilité, defaçon à bien se positionner sur le marché. Dans cet objectif, il estnécessaire de charactériser les propriétes de nouveaux gaz fluorinésqui pourraient présenter des alternatives au SF6.La majorité des gaz fluorinés étant moins volatiles que le SF6, il estprobable que le SF6 ne soit pas remplacé par un gaz pur, mais parun mélange. Un tel mélange serait constitué de quelques pourcentsde gaz fluoriné, dilué dans un gaz très volatile tel que N2, CO2,O2, où d’un mélange de ces derniers. Pour cette raison, ce travailporte principalement sur des mélanges gazeux entre des gaz fluorinés
v
vi
et soit N2, soit CO2 comme gaz de dilution. Les taux de réactionset coefficients de transports des électrons et des ions sont obtenusgrâce à la mesure du courant induit dans des électrodes par desavalanches électroniques se propageant dans ces mélanges gazeux(’pulsed Townsend experiment’).Les principales contributions scientifiques de cette thèse sont lessuivantes. Premièrement, deux aspects problématiques de cette expé-rience sont identifiés et corrigés : la nécessité de distinguer le courantinduit par l’avalanche électronique du courant capacitif de rechargedes électrodes, et la nécessité de limiter la densité de charge del’avalanche électronique de façon à ce que le champ électrique dela distribution de charges soit négligeable face au champ électriqueexterne appliqué aux électrodes.Deuxièmement, des modèles et outils analitiques pour l’analise, l’in-terprétation et la comparaison des mesures sont développés. Enparticulier, un nouveau modèle pour obtenir les taux de réactiond’ionisation et d’attachement électronique est obtenu.Troisièmement, les taux de réactions et coefficients de transportssont mesurés dans huit gaz fluorinés différents : octafluorooxolane(c-C4F8O), octafluorobutene (2-C4F8), hexafluoropropylene oxide(C3F6O), (1E)-1,3,3,3-tetrafluoropropene (C3H2F4), trifluoromethyl-sulphur pentafluoride (SF5CF3), heptafluoropropane (C3HF7), hep-tafluoroisobutyronitrile (C4F7N) and heptafluoroisopropyl trifluoro-methyl ketone (C5F10O), ainsi que dans des mélanges de ces gaz avecN2 ou avec CO2. Afin de rendre ces résultats accessibles au public,une base de données nommée "ETHZ" est ouverte sur la plateformedu projet LXcat pour l’échange de données sur les plasmas (’PlasmaData Exchange Project’). Pour certains des gaz étudiés, la sectionefficace totale d’attachement électronique est estimée à partir desmesures de taux d’attachement en utilisant une méthode d’inversionlinéaire. Les sections efficaces obtenues sont ensuites comparées aveccelles mesurées dans des expériences à faisceau électronique.Pour finir, les propriétés de ces gaz sont comparées vis à vis deleur performance comme isolants électriques. Les sections efficacesd’attachement électronique de ces gaz sont comparées et mises enrelation avec les synergies observées dans les mélanges gazeux. Ladépendance des résultats de la pression est mise en évidence et sesconséquences pout les applications à haute pressions sont discutées.
List of Own Publications
First-Author Journal Publications
[CHF2018b] - A. Chachereau, A. Hösl, and C. M. Franck. Electri-cal insulation properties of the perfluoronitrile C4F7N. Journal ofPhysics D: Applied Physics, 51(49):495201, 2018[CHF2018a] - A. Chachereau, A. Hösl, and C. M. Franck. Electricalinsulation properties of the perfluoroketone C5F10O. Journal ofPhysics D: Applied Physics, 51(33):335204, 2018[CF2017b] - A. Chachereau and C. M. Franck. Measurement of theelectron attachment properties of SF5CF3 and comparison to SF6.Journal of Physics D: Applied Physics, 50(44):445204, 2017[CFJ+2016] - A. Chachereau, J. Fedor, R. Janečková, J. Kočišek,M. Rabie, and C. M. Franck. Electron attachment properties ofc-C4F8O in different environments. Journal of Physics D: AppliedPhysics, 49(37):37 5201, 2016[CRF2016] - A. Chachereau, M. Rabie, and C. M. Franck. Electronswarm parameters of the hydrofluoroolefine HFO1234ze. PlasmaSources Science and Technology, 25(4):045005, 2016[CP2014] - A. Chachereau and S. Pancheshnyi. Calculation of the ef-fective ionization rate in air by considering electron detachment fromnegative ions. IEEE Transactions on Plasma Science, 42(10):3328–3338, Oct 20141
First-Author Conference Publications
[CF2018] - A. Chachereau and C. M. Franck. Electron swarm param-eters of the hydrofluorocarbon HFC-227ea and its mixtures with N2
and CO2. Proceedings of the 22nd International Conference
1This article was not written as part of the present thesis.
vii
viii
on Gas Discharges and their Applications (GD), 2018[CF2017a] - A. Chachereau and C. M. Franck. Characterization ofHFO-1234ze mixtures with N2 and CO2 for use as gaseous electricalinsulation media. Proceedings of the 20th International Sym-posium on High Voltage Engineering (ISH), 2017[CF2015] - A. Chachereau and C. M. Franck. Electron swarm param-eter measurements of perfluorobut-2-ene (2-C4F8). Proceedings ofthe 32nd International Conference on Phenomena in Ion-ized Gases (ICPIG), 2015
Co-Authored journal publications
[HCF2019] - A. Hösl, A. Chachereau, and C. M. Franck. Identifi-cation of the discharge kinetics in the perfluoronitrile C4F7N withswarm and breakdown experiments. J. Phys. D: Appl. Phys., 2019.in preparation[HPCF2019] - A. Hösl, J. Pachin, A. Chachereau, and C. M. Franck.Perfluoro-1,3-dioxolane and perfluoro-oxetane: promising gases forelectrical insulation. J. Phys. D: Appl. Phys., 52(5):055203, 2019[ZKK+2018] - M. Zawadzki, D. Kollárová, J. Kočišek, J. Fedor,A. Chachereau, and C. M. Franck. Electron attachment to hexafluo-ropropylene oxide (HFPO). J. Chem Phys., 149(20):204305, 2018[PAB+2017] - L. C. Pitchford, L. L. Alves, K. Bartschat, S. F. Biagi,M-C. Bordage, I. Bray, C. E. Brion, M. J. Brunger, L. Campbell,A. Chachereau, B. Chaudhury, L. G. Christophorou, E. Carbone,N. A. Dyatko, C. M. Franck, D. V. Fursa, R. K. Gangwar, V. Guerra,P. Haefliger, G. J. M. Hagelaar, A. Hösl, Y. Itikawa, I. V. Kochetov,R. P. McEachran, W. L. Morgan, A. P. Napartovich, V. Puech,M. Rabie, L. Sharma, R. Srivastava, A. D. Stauffer, J. Tennyson,J. de Urquijo, J. van Dijk, L. A. Viehland, M. C. Zammit, O. Zat-sarinny, and S Pancheshnyi. LXCat: an Open-Access, Web-BasedPlatform for Data Needed for Modeling Low Temperature Plasmas.Plasma Processes and Polymers, 14(1-2):1600098, 2017[RHCF2015] - M. Rabie, P. Haefliger, A. Chachereau, and C. M.Franck. Obtaining electron attachment cross sections by meansof linear inversion of swarm parameters. J. Phys. D: Appl. Phys.,48(7):075201, 2015
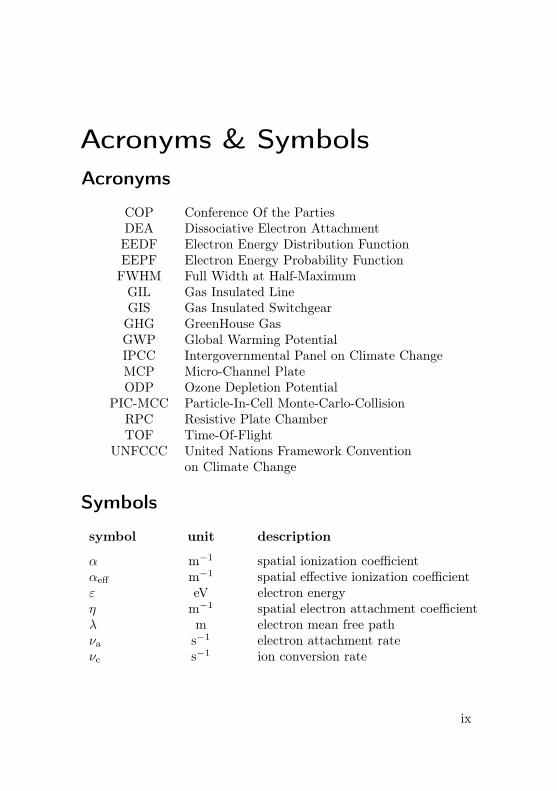
Acronyms & SymbolsAcronyms
COP Conference Of the PartiesDEA Dissociative Electron AttachmentEEDF Electron Energy Distribution FunctionEEPF Electron Energy Probability FunctionFWHM Full Width at Half-MaximumGIL Gas Insulated LineGIS Gas Insulated SwitchgearGHG GreenHouse GasGWP Global Warming PotentialIPCC Intergovernmental Panel on Climate ChangeMCP Micro-Channel PlateODP Ozone Depletion Potential
PIC-MCC Particle-In-Cell Monte-Carlo-CollisionRPC Resistive Plate ChamberTOF Time-Of-Flight
UNFCCC United Nations Framework Conventionon Climate Change
Symbols
symbol unit description
α m−1 spatial ionization coefficientαeff m−1 spatial effective ionization coefficientε eV electron energyη m−1 spatial electron attachment coefficientλ m electron mean free pathνa s−1 electron attachment rateνc s−1 ion conversion rate
ix
x
νd s−1 electron detachment rateνeff s−1 effective ionization rateνi s−1 ionization rateσ m2 collision cross sectionσa m2 attachment cross sectionσi m2 ionization cross sectionτ−1det s−1 auto-detachment rateτD s characteristic time for longitudinal
electron diffusionB T magnetic fieldd m electrode spacingDL m2 s−1 longitudinal electron diffusion
coefficientDT m2 s−1 transverse electron diffusion
coefficientE Vm−1 electric fieldE/N Td density-reduced electric field(E/N)crit Td density-reduced critical electric fieldF eV−1 electron energy distribution functionF0 eV−3/2 electron energy probability functionIe A electron displacement currentIion A ion displacement currentka m3 s−1 electron attachment rate coefficientkB m2 kg s−2 K−1 Boltzmann’s constantkc m3 s−1 ion conversion rate coefficientkd m3 s−1 electron detachment rate coefficientkeff m3 s−1 effective ionization rate coefficientki m3 s−1 ionization rate coefficientkquad m6 s−1 three-body attachment rate
coefficientL Jmol−1 vaporization enthalpyM gmol−1 molar massme kg electron massN m−3 gas number densityp Pa gas pressurepc Pa critical pressureq0 Q elementary charge
xi
R Jmol−1 K−1 ideal gas constantT K gas temperatureTb K boiling temperature at normal
pressureTc K critical temperatureTe s electron drift timeTn s negative ion drift timeTp s negative ion drift timeUBd V breakdown voltageUcrit V critical voltagewe ms−1 electron drift velocitywn ms−1 negative drift velocitywp ms−1 positive ion drift velocity

Contents
Abstract iii
Résumé v
List of Own Publications vii
Acronyms & Symbols ix
1 Introduction 11.1 General context . . . . . . . . . . . . . . . . . . . . . 11.2 Gaseous electrical insulation . . . . . . . . . . . . . . 11.3 Approaches to obtain data . . . . . . . . . . . . . . . 3
2 Physics of gaseous electrical discharges 52.1 Electron and ion kinetic processes . . . . . . . . . . 62.2 Calculation methods . . . . . . . . . . . . . . . . . . 11
2.2.1 Solving the electron Boltzmann equation . . . 112.2.2 Monte Carlo simulation . . . . . . . . . . . . 15
2.3 Experimental approaches . . . . . . . . . . . . . . . 182.3.1 Swarm experiments . . . . . . . . . . . . . . 182.3.2 Electron beam experiments . . . . . . . . . . 19
2.4 Dimensioning criteria for electrical insulation . . . . 20
3 Scope of this work 23
4 Measurement and analysis techniques 274.1 Pulsed Townsend experiment . . . . . . . . . . . . . 27
4.1.1 Measurement techniques . . . . . . . . . . . . 274.1.2 Analysis techniques . . . . . . . . . . . . . . 31
4.2 Electron beam experiments . . . . . . . . . . . . . . 554.2.1 Pulsed attachment spectrometer . . . . . . . 554.2.2 Continuous attachment spectrometer . . . . . 57
xiii
xiv Contents
4.2.3 Ionization spectrometer . . . . . . . . . . . . 57
5 Results 595.1 Octafluorooxolane . . . . . . . . . . . . . . . . . . . 595.2 (1E)-1,3,3,3-tetrafluoropropene . . . . . . . . . . . . 65
5.2.1 Three-body electron attachment . . . . . . . 655.2.2 Ion kinetics . . . . . . . . . . . . . . . . . . . 655.2.3 Mixtures with nitrogen or carbon dioxide . . 66
5.3 Trifluoromethylsulfur pentafluoride . . . . . . . . . . 735.3.1 Electron attachment . . . . . . . . . . . . . . 735.3.2 Mixtures with nitrogen or carbon dioxide . . 73
5.4 Octafluorobutene . . . . . . . . . . . . . . . . . . . . 775.5 Heptafluoropropane . . . . . . . . . . . . . . . . . . . 795.6 Hexafluoropropylene oxide . . . . . . . . . . . . . . . 825.7 Heptafluoroisopropyl trifluoromethyl ketone . . . . . 85
5.7.1 Electron attachment . . . . . . . . . . . . . . 855.7.2 Mixtures with nitrogen or carbon dioxide . . 88
5.8 Heptafluoroisobutyronitrile . . . . . . . . . . . . . . 925.8.1 Electron attachment . . . . . . . . . . . . . . 925.8.2 Importance of ion kinetics . . . . . . . . . . . 945.8.3 Electron kinetics . . . . . . . . . . . . . . . . 95
6 Inter-comparison of the gases under study 1016.1 Electron attachment cross sections . . . . . . . . . . 1016.2 Synergism in gas mixtures . . . . . . . . . . . . . . . 1036.3 Dependence on the gas pressure . . . . . . . . . . . . 111
6.3.1 Three-body electron attachment . . . . . . . 1116.3.2 Electron detachment . . . . . . . . . . . . . . 112
6.4 Electric strength versus minimum temperature . . . 1146.5 Optimal gas mixture for electrical insulation . . . . . 119
7 Conclusion and Outlook 121
Bibliography 123
Appendixes 145A F-gas regulations . . . . . . . . . . . . . . . . . . . . 145
Contents xv
B Saturated vapor pressure curves . . . . . . . . . . . . 147B.1 Sulphur hexafluoride . . . . . . . . . . . . . . 147B.2 Octafluorooxolane . . . . . . . . . . . . . . . 147B.3 (1E)-1,3,3,3-tetrafluoropropene . . . . . . . . 147B.4 Trifluoromethylsulphur pentafluoride . . . . . 148B.5 Octafluorobutene . . . . . . . . . . . . . . . . 148B.6 Hexafluoropropane . . . . . . . . . . . . . . . 149B.7 Hexafluoropropylene oxide . . . . . . . . . . . 149B.8 Heptafluoroisopropyl trifluoromethyl ketone . 150B.9 Heptafluoroisobutyronitrile . . . . . . . . . . 150
C Physical, environmental and safety properties . . . . 151

1 Introduction1.1 General contextCollision cross sections, reaction rate coefficients and transport co-efficients of electrons and ions in gases are essential quantities fordescribing and modelling low-temperature plasmas. Vast amountsof data were therefore collected over the second half of the 20thcentury [Dut1975,GBDP1983,Raj2012]. Nowadays however, thesemeasurements are no longer considered cutting edge research, andmost of the research community has moved on to more exotic phe-nomena, or is developing sophisticated simulation tools to modelcomplex applications. Plasma models can be generally separatedinto three categories: Particle-In-Cell Monte-Carlo-Collision (PIC-MCC) models [DSC+2012], which use collision cross sections, fluidmodels [BP1995], which use rate coefficients and transport coeffi-cients, and hybrid models [LTN+2012], which use a combinationof both. These fundamental data and models are used in diversedomains and applications, including for instance gaseous electricalinsulation [Chr1978], semiconductor plasma processing [CO2004],particle detectors [GDS2013], plasma thrusters [Ahe2011], astro-physics [MWF2017], plasma medicine [KKM+2009], and environmen-tal plasmas [GVG+2007]. However, even as modelling tools growmore sophisticated, the accuracy of results is limited in many cases bythe lack of knowledge of these fundamental quantities [PDM+2009,ABB+2017]. Since the theoretical calculation of these data is stillnot possible today, their measurement remains essential for the de-velopment of plasma physics.
1.2 Gaseous electrical insulationFor the application of gaseous dielectrics, there is currently a strongneed for fundamental data of many fluorinated gases in order to find
1
2 1 Introduction
an environment-friendly gas or gas mixture to replace SF6 in electri-cal insulation. Sulphur hexafluoride (SF6) is widely used as electricalinsulator and arc-quenching gas in equipment for the transmissionand distribution of electric power. This includes various medium andhigh voltage applications, such as gas-insulated switchgear (GIS),gas-insulated lines (GIL), transformers and bushings. The mostimportant of these applications are maybe the SF6 gas-insulatedsubstations, which are very compact compared to air insulated sub-stations, making them a desirable solution in densely populated areas.However, the 100-year global warming potential (GWP) of SF6 rela-tive to CO2 is 23 500 [MSB+2013], and despite efforts to reduce SF6
emissions, a steady increase of its atmospheric concentration is stillobserved [ESRL]. Additionally, SF6 has a very long atmospheric life-time, which makes its climate impact almost irreversible. The atmo-spheric lifetime of SF6 is difficult to estimate precisely, it is commonlysaid to be about 3200 years [MSB+2013], although it was estimatedin a more recent study to be rather about 850 years [RME+2017].Therefore, the use of SF6 raises environmental concerns: SF6 waslisted in December 1977 in the Kyoto Protocol [KP1997] as a po-tent greenhouse gas (GHG), which emissions should be reduced. InMay 2006, the European Union adopted a regulation on fluorinatedgreenhouse gases [EC2006] to contain, prevent and thereby reduceemissions of the fluorinated greenhouse gases covered by the KyotoProtocol, addressing in particular the containment, use, recovery anddestruction of these gases. This regulation was strengthened in April2014 [EU2014] to improve the prevention of leaks from equipmentcontaining F-gases and avoid altogether the use of F-gases whereenvironmentally superior alternatives are cost-effective (a more com-plete chronology of the organizations involved in climate researchand resulting regulations on fluorinated gases is given in appendix A).For these reasons, there is a strong interest from electrical equipmentmanufacturers in finding low-GWP alternatives to SF6 as electricalinsulation medium [COG1997,Nie1998,RF2018], or alternatively, inproving that such an alternative does not exist so that SF6 cannot bebanned. The requirements for these alternative compounds, besidesgood electrical insulation performance, are numerous. They include,for instance, high volatility of the compound to enable the use of highpressures, low toxicity (ideally none), no ozone depleting potential
1.3 Approaches to obtain data 3
(ODP), low global warming potential (GWP), and chemical stabilityover decades in the equipment. This last requirement of chemicalstability conflicts somewhat with that of a low GWP, because thelatter is often achieved by choosing a compound which will rapidlydissociate in the atmosphere. Since most fluorinated gases are not asvolatile as SF6, they would have to be used as part of a gas mixture.Such a gas mixture would contain a few percent of fluorinated gasmixed in a highly volatile carrier gas, such as N2, CO2, O2, or amixture of these.
1.3 Approaches to obtain data
The main approaches to obtain the transport parameters, rate coef-ficients and collisional cross sections in these new fluorinated gasesare swarm experiments [HC1974], beam experiments [Chr1984] and -more recently - ab-initio quantum-mechanical calculations [ZSFB2016].These approaches correspond to different levels of physical under-standing of plasmas, from the macroscopical fluid parameters given bythe swarm experiments, to the microscopical collisional cross sectionsobtained by the beam experiments and down to the molecular prop-erties for the ab-initio calculations. Each of these approaches comeswith inherent advantages and limitations. For instance, ab-initiocalculations, which are already difficult for atomic gases, becomeconsiderably more difficult/unfeasible with increasing size of themolecule, and are therefore not an option to characterize the largefluorinated molecules of interest for gaseous dielectrics. In generalhowever, there is no superior approach, but rather, it is beneficial tocombine these three approaches as they complement each other withdifferent degrees of physical detail. In this thesis, the reaction ratecoefficients and transport coefficients of electrons and ions in thefluorinated gases and gas mixtures under study are obtained using apulsed Townsend experiment. For some of these gases, the electronattachment cross section is also estimated from the measured attach-ment rate coefficients using a linear inversion method, or measuredwith an electron beam experiment, in collaboration with anotherresearch group.

2 Physics of gaseouselectrical discharges
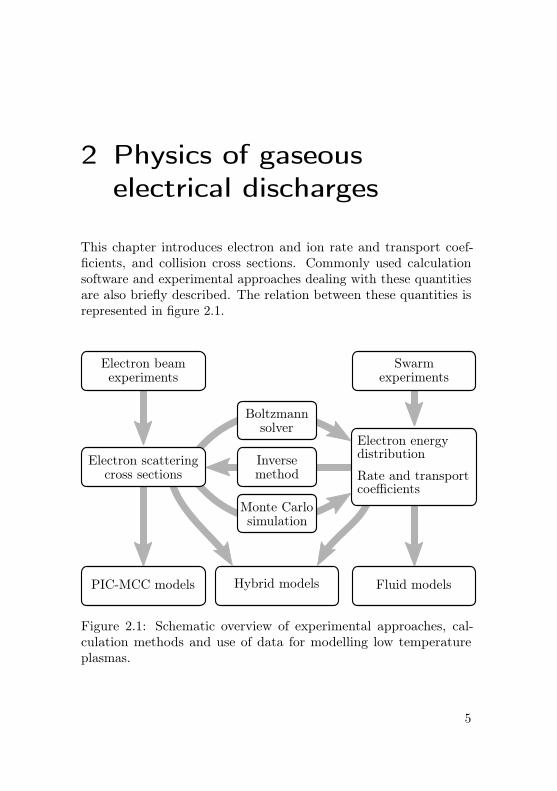
This chapter introduces electron and ion rate and transport coef-ficients, and collision cross sections. Commonly used calculationsoftware and experimental approaches dealing with these quantitiesare also briefly described. The relation between these quantities isrepresented in figure 2.1.
PIC-MCC models Hybrid models Fluid models
Electron energydistribution
Rate and transportcoefficients
Electron beamexperiments
Swarmexperiments
Electron scatteringcross sections
Boltzmannsolver
Inversemethod
Monte Carlosimulation
Figure 2.1: Schematic overview of experimental approaches, cal-culation methods and use of data for modelling low temperatureplasmas.
5
6 2 Physics of gaseous electrical discharges
2.1 Electron and ion kinetic processes
Gaseous electrical discharges are caused by the propagation and multi-plication of charge carriers in a gaseous medium, which can ultimatelymake the medium electrically conductive. When an electric field is ap-plied to a gas, free electrons and ions are accelerated by the coulombforce and collide randomly with surrounding gas molecules. Thesecollisions can result into many different elementary kinetic processes.We consider in this work a very weakly ionized gas, with a chargedparticle density of at most 1014 m−3 and neutral particle densitiesranging from 1022 m−3 to 1025 m−3. This leads to ionization degreesof 10−11 to 10−8, therefore, collisions between charged particles arevery unlikely. It is generally recommended to take them into accountfor ionization degrees of 10−6 or above [HP2005,Hag2016]. Therefore,only collisions between charged particles and neutral particles aredescribed below.
• Elastic collision:
e− +M −→ e− +M (2.1)
Electrons can collide elastically with heavier neutrals (atomsor molecules). As a result, the electron transfers a part ofits kinetic energy to its colliding partner. This loss of kineticenergy equals at most 2me/m where me is the mass of theelectron and m that of the neutral particle. Since the massratio is at most 10−4, this loss of energy is small.
• Excitation:
e− +M −→ e− +M∗ (2.2)
Upon collision with a neutral particle, an electron can alsotransfer some energy to the particle by exciting it to a higherenergy level. This may be rotational, vibrational or electronicexcitation.
• De-excitation (superelastic collision):
e− +M∗ −→ e− +M (2.3)
2.1 Electron and ion kinetic processes 7
Superelastic collisions are the inverse process of excitationcollisions: upon collision with an excited neutral particle, theelectron can de-excite it to a lower energy level it and gain thecorresponding energy as kinetic energy.
• Impact ionization:
e− +AB −→ AB+ + 2e− (non-dissociative) (2.4)
e− +AB −→ A+ +B + 2e− (dissociative) (2.5)
If an electron has sufficient energy when colliding with a neutralparticle, it can create a positive ion and free an additionalelectron. This ionization process may be dissociative (2.5) ornon-dissociative (2.4).
• Dissociative electron attachment:
e− +AB −→ A− +B (2.6)
Electrons can be captured by neutral particles and form neg-ative ions. This process reduces the number of free electronsin the gas. In the above example, electron attachment is dis-sociative, as the molecule M is broken into fragments A− andB.
• Parent ion attachment:
e− +M −→ (M−)∗ (metastable ion formation) (2.7)
(M−)∗ −→M + e− (auto-detachment) (2.8)
(M−)∗ +M −→ 2M + e− (collisional detachment) (2.9)
(M−)∗ +M −→M− +M (stabilization) (2.10)
Electron attachment can also be non-dissociative via processes(2.7) and (2.10). If auto-detachment occurs on the sametimescale as stabilization, this type of electron attachmentis called three-body electron attachment.
• Electron detachment from negative ions:
A− +B −→ A+ e− +B (2.11)
A− +B −→ AB + e− (2.12)
8 2 Physics of gaseous electrical discharges
As negative ions collide with neutral particles, they may free oneelectron and become neutral, this process is called collisionalelectron detachment. This process may be associative as inequation (2.12).
• Ion conversion or charge transfer:
A− +B −→ A+B− (2.13)
A− +B −→ AB− (2.14)
As positive or negative ions collide with neutral particles, theymay transfer their charge or react to form another ion.
The occurrence probability of these elementary processes stronglydepends on the energy of the charged particle (electron or ion) and onthe number density N of the neutral collision partner. Each processcan be described by a collision cross section (also scattering crosssection), which gives the collision probability as a function of theparticle energy. The mean path traveled by a charged particle beforeundergoing the elementary process with a collision cross section σ(ε)is
λ =1
Nσ(ε). (2.15)
Likewise, the frequency at which the charged particle undergoes thesame elementary process is given by
ν = Nσ(ε)v, (2.16)
where v is the velocity of the charged particle, or
ν = Nσ(ε)
√2ε
m, (2.17)
where ε is the kinetic energy of the charged particle and m its mass.This concept is illustrated in figure 2.2. As an example, sets ofelectron scattering cross sections for CO2 and SF6 are shown infigure 2.3. For simplicity, only the total cross sections for electronattachment, ionization and excitation are shown, instead of theindividual cross sections of each elementary process.
2.1 Electron and ion kinetic processes 9
e− σ (m2)
λ1 (m) < λ2 (m)
N2 (m−3)N1 (m−3) >
Figure 2.2: Illustration of the concept of electron scattering crosssection σ and mean free path λ. A higher particle number densityN1 leads to a shorter mean free path of the electrons λ1, comparedto a lower particle density N2.
In a homogeneous electric field E, for a given gas density N , thecharge carriers gain kinetic energy as they are accelerated by theCoulomb force, and loose energy upon collision with neutral particles(except for superelastic collisions, in which they gain energy fromexcited neutral particles). Due to their lighter mass, the electronsreceive a larger acceleration than the ions in the electric field, andloose less energy during elastic collisions. Therefore, the electronscan reach higher energy than the ions and electron kinetic processesare often dominant.When energy losses in collisions with neutrals balance the electricacceleration of electrons, the electrons reach a stationary electronenergy distribution function (EEDF) F , which usually depends onthe ratio of the electric field to the gas number density E/N , and noton E and N separately. The E/N ratios are expressed in this work inthe unit Townsend (Td), which is defined by 1Td = 10−21 Vm2. Theelectron energy distribution function (EEDF) F (ε, E/N) is expressedin eV−1 and is normalized as∫ ∞
0
F (ε, E/N)dε = 1. (2.18)
10 2 Physics of gaseous electrical discharges
10�2
10�1
100
101
102
10�24
10�23
10�22
10�21
10�20
10�19
10�18
10�17
CO2
Elastic
Attachment
Ionization
Excitation
(a)
" (eV)
�(m
2)
10�2
10�1
100
101
102
10�24
10�23
10�22
10�21
10�20
10�19
10�18
10�17
SF6
Elastic
Attachment
Ionization
Excitation
(b)
" (eV)
�(m
2)
Figure 2.3: (a) Electron scattering cross sections of CO2 from theSiglo dataset [Siglo]. (b) Electron scattering cross sections of SF6
from Biagi’s Magboltz dataset [Biagi].
2.2 Calculation methods 11
In principle, the same approach is possible for ions, but whilescattering electron scattering cross sections are known for manygases [PAB+2017], ion scattering cross sections are very scarce. It istherefore not possible in general to calculate the energy distributionsof both electrons and ions, which may even be coupled via processessuch as ionization, electron attachment or detachment.From a macroscopic point of view, each kinetic process can be de-scribed by a reaction rate coefficient k expressed in the unit m3s−1
and dependent on the reduced electric field E/N ,
k(E/N) =
√2
m
∫ ∞0
χσ(ε)F (E/N, ε)√ε dε, (2.19)
where χ is the mole fraction of the target species in the gas mixture(χ = 1 for a pure gas). Similarly, the transport of each type of chargedparticle can be described by its mobility and its diffusion coefficient.These quantities, which can be measured in swarm experiments, serveas input for fluid models to describe macroscopically electrical gasdischarges [BP1995].
2.2 Calculation methods
Two methods are commonly used to calculate the reaction rates andtransport coefficients of electrons from a complete set of electronscattering cross sections, namely solving numerically the electronBoltzmann equation, or using Monte-Carlo simulations.
2.2.1 Solving the electron Boltzmann equation
The position and velocity of electrons as a function of time can bedescribed by a distribution f(t,v, r) with follows the Boltzmannequation [MP2006,HP2005,Hag2016]
∂f
∂t+ v · ∂f
∂r− q0
me(E + v ×B) · ∂f
∂v= C(f), (2.20)
where r are the spatial coordinates, v are the velocity coordinates, Eis the electric field, and C(f) is the collision operator. The collision
12 2 Physics of gaseous electrical discharges
operator C(f) accounts for the change of f due to elastic and inelasticcollisions of the electrons with the gas, and is calculated from theelectron scattering cross sections.The solution of the Boltzmann equation generally requires severalsimplifying assumptions. In the present work, we use the Boltzmannequation solver Bolsig+ [HP2005] in the version of 08/2012, whichrelies on the following assumptions. The magnetic field is zero,the electric field is constant in space and time and there are noboundaries. The electron motion is nearly isotropic, so that thedistribution function f can be approximated by
f(r,v, t) = f0(r, v, t) + f1(r, v, t) cos θ, (2.21)
where v = ‖v‖ =√2ε/me and θ is the angle between v and E.
Furthermore, we consider that the velocity (energy) dependence of fis independent of time and space, so that we can write
f0(r, v, t) =n(r, t)
2πγ3F0(ε), (2.22)
f1(r, v, t) =n(r, t)
2πγ3F1(ε), (2.23)
where γ =√2/me and n(r, t) is the electron density. The isotropic
part of F0 the energy distribution is the electron energy probabilityfunction (EEPF), expressed in eV−3/2. It relates to the electronenergy distribution function (EEDF) F expressed in eV−1 as
F = ε1/2F0. (2.24)
The electron transport coefficients and rate coefficients are definedas
k = γ
∫ ∞0
εσ(ε)F0(ε)dε, (2.25)
we =γ
3
∫ ∞0
εF1(ε)dε, (2.26)
NDT =γ
3
∫ ∞0
ε
σ̃mF0(ε)dε. (2.27)
2.2 Calculation methods 13
where σ̃m is the effective total momentum-transfer cross sectionincluding electron loss and creation
σ̃m(ε) =∑k=all
σk(ε) +keff
γε1/2. (2.28)
More accurate and advanced transport coefficients can be obtained byusing a density-gradient expansion of f instead of considering that f isindependent of space [MP2006,VKL+2017]. In particular, differencescan arise between ’bulk’ and ’flux’ coefficients [PDM+2009].The longitudinal diffusion coefficient of electrons depends on G0, thefirst-order component of density-gradient expansion of f
NDL =γ
3
∫ ∞0
ε
σ̃mF0(ε)dε+ (E/N)
γ
3
∫ ∞0
ε
σ̃m
∂G0
∂εdε
−wbulke
3
∫ ∞0
ε1/2
σ̃mF1(ε)dε.
(2.29)
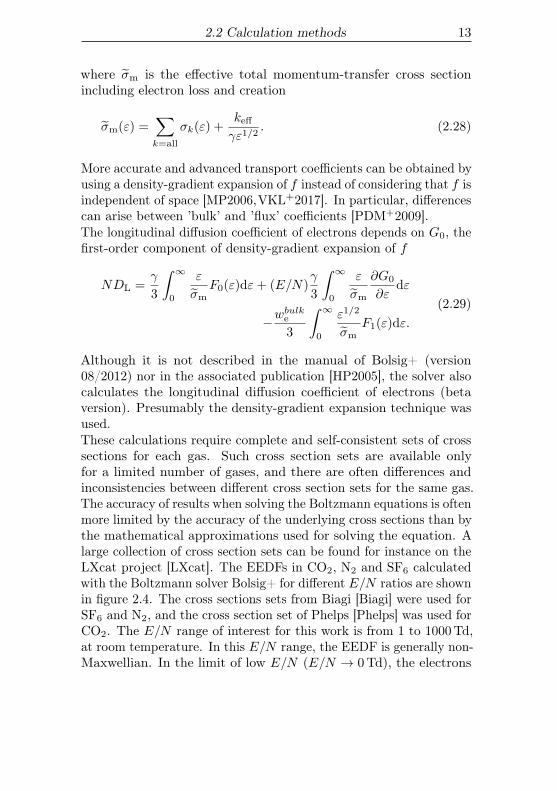
Although it is not described in the manual of Bolsig+ (version08/2012) nor in the associated publication [HP2005], the solver alsocalculates the longitudinal diffusion coefficient of electrons (betaversion). Presumably the density-gradient expansion technique wasused.These calculations require complete and self-consistent sets of crosssections for each gas. Such cross section sets are available onlyfor a limited number of gases, and there are often differences andinconsistencies between different cross section sets for the same gas.The accuracy of results when solving the Boltzmann equations is oftenmore limited by the accuracy of the underlying cross sections than bythe mathematical approximations used for solving the equation. Alarge collection of cross section sets can be found for instance on theLXcat project [LXcat]. The EEDFs in CO2, N2 and SF6 calculatedwith the Boltzmann solver Bolsig+ for different E/N ratios are shownin figure 2.4. The cross sections sets from Biagi [Biagi] were used forSF6 and N2, and the cross section set of Phelps [Phelps] was used forCO2. The E/N range of interest for this work is from 1 to 1000Td,at room temperature. In this E/N range, the EEDF is generally non-Maxwellian. In the limit of low E/N (E/N → 0Td), the electrons

14 2 Physics of gaseous electrical discharges
0 0:5 1 1:5 210�4
10�3
10�2
10�1
100
101 E=N = 1TdCO2
N2
SF6
(a)
" (eV)
EEDF(eV�1)
1 2 3 4 5 6 710�4
10�3
10�2
10�1
100
101 E=N = 10Td(b)
" (eV)
EEDF(eV�1)
0 5 10 15 2010�4
10�3
10�2
10�1
100
101 E=N = 100Td(c)
" (eV)
EEDF(eV�1)
0 20 40 60 8010�4
10�3
10�2
10�1
100
101 E=N = 1000Td(d)
" (eV)
EEDF(eV�1)
Figure 2.4: Electron energy distribution functions in N2, CO2 andSF6 for different E/N ratios: (a) E/N = 1Td (b) E/N = 10Td, (c)E/N = 100Td and (d) E/N = 1000Td. The mean electron energyfor each distribution is marked by a vertical line.
receive no energy from the electric field but are thermalized bythe gas: they gain momentum via superelastic collisions with gasparticles, and loose momentum via elastic and inelastic collisions,and the electron distribution function becomes therefore Maxwellianat gas temperature. In the present work, we neglect superelasticcollisions when calculating the EEDFs. Depending on the gas andon the gas temperature, this is not appropriate for E/N below afew Townsend, causing unphysical artifacts such as the electronscooling down below the gas temperature [HP2005]. For instance, thecalculated EEDF in CO2 at 1Td (figure 2.4a) is likely inaccurate,
2.2 Calculation methods 15
because the obtained mean electron 〈ε〉 = 0.03 eV energy is below thethermal energy of the gas 3/2 kBT = 0.04 eV. To calculate accuratelythe EEDF for E/N below a few Townsend, it would be necessary totake into account the population of excited states in the consideredgas, at room temperature. The additional production of excitedneutrals by the discharge itself could be neglected in the present case,due to the low ionization degree considered. For CO2, a completecross section set including the required de-excitation cross sectionshas been recently proposed by Grofulović et al. [GAG2016, IST], andit would be advisable to use it in future works for calculating theEEDF below 10Td in CO2.The two-term approximation fails at high E/N where most collisionsare inelastic and f becomes strongly anisotropic [All1982]. At veryhigh E/N , a fraction of electrons pass to a mode of continuousacceleration (so-called runaway electrons), so that the two-termapproximation is not valid. For N2, the E/N ratio where electronrunaway is possible was estimated to be about 2000Td [SAP+2001].At lower reduced fields, typically below 1000Td, calculations ofswarm parameters in molecular gases yield generally good agreementwith measurements [PP1985,PBH+2012].
2.2.2 Monte Carlo simulation of electron transportThe electron rate and transport coefficients can also be obtained bymeans of Monte Carlo simulations [RF2016]. In this approach, thetrajectories and collisions of each electron are simulated, and theresults are averaged over a large number of electrons to obtain themacroscopic parameters of interest. The equation of motion for theelectrons is
med2r
dt2= −q0E. (2.30)
The electrons thus gain kinetic energy through the electric field (or,when they travel against the electric field, they are accordingly decel-erated). In addition, upon collision with gas particles, the electronsmay loose energy and change directions. If at a given time, anelectron has an energy ε, the collision frequency for each elementaryprocess depends on the magnitude of the corresponding scattering
16 2 Physics of gaseous electrical discharges
cross section at the given energy ε according to equation (2.16). Sincethe collisions are a statistical process, the time between collisionsand the type of collision occurring are chosen in the Monte Carlosimulation by using random numbers.The electron rate and transport coefficients can be obtained byaveraging the simulation results over a large number of electrons.The bulk drift velocity is defined as
we =d〈x〉dt
, (2.31)
the bulk longitudinal diffusion coefficient as
DL =1
2
d⟨(x− 〈x〉)2
⟩dt
, (2.32)
the flux drift velocity as
wfluxe =
⟨dx
dt
⟩, (2.33)
and the flux longitudinal diffusion coefficient as
DfluxL = 〈xv〉 − 〈x〉〈v〉. (2.34)
The effective ionization rate coefficient is obtained as
keff =1
N
logNe(t)− logNe(t0)
t− t0, (2.35)
and the rate coefficients of other processes are obtained as
k =keff
eνeff t − 1
logN(t)− logN(t0)
N(t0), (2.36)
where N(t) is the count of the occurrences of this process. In contrastto the Boltzmann equation approach, the Monte Carlo requires noassumption on the electron distribution function, and the definitionof the transport coefficients is straightforward and intuitive. Anotheradvantage of Monte Carlo simulations is that they can be used tostudy the statistical behaviour of discharges with very few charge

2.2 Calculation methods 17
carriers, which cannot be done with the fluid approach. Monte Carlosimulations are however, computationally more expensive, and theresulting rate and transport coefficients are subject to statisticalnoise. Similarly to solving the Boltzmann equation, the Monte Carlosimulations also require complete and self-consistent cross sectionsets, and the results can only be as precise as the underlying crosssections.
18 2 Physics of gaseous electrical discharges
2.3 Experimental approaches
Reaction rates and transport coefficients of electrons and ions can beobtained in so-called swarm experiments, which typically operate atintermediate pressures (102 Pa - 105 Pa) in order to ensure numerouscollisions between charged and neutral particles. In contrast to this,collision cross sections can be obtained only at much lower pressures(∼10−2 Pa) in electron beam experiments, where it is important toensure that the electrons collide only once - with a defined energy -with neutral particles.
2.3.1 Swarm experimentsDifferent techniques for observing electron and ion swarms have beenreviewed by Raether [Rae1964], Huxley and Crompton [HC1974]and Kumar [Kum1984]. In general, swarm experiments rely on away to produce some free electrons in a gas, in order to measuretheir transport properties. Thus, they may be classified by the mode(pulsed or continuous) in which the electron source is operated, aswell as by the means of observation of the electron and ion swarm(current, potential, light, imaging).The most intuitive method to observe electron avalanches is maybethe cloud chamber experiment developed by Raether, where pho-tographs of the electron avalanche can be taken at different points intime, allowing to visualize its spatial expansion and thus to obtainthe electron drift velocity and diffusion coefficient. For the purposeof this experiment, the test chamber needs to be filled with supersat-urated vapor, which condensates on the ions formed in the electronavalanche. The water droplets form a visible trace of the electronavalanche.Raether also describes an optical method, which consists in observingwith a photomultiplier the light emission from the electron avalanchedue to successive excitation and de-excitation of gas particles. Thelight intensity is generally proportional to the number of free elec-trons, which makes it possible to obtain information on the effectiveionization coefficient. However, it is not the most practical methodbecause the light intensity and wavelength vary greatly betweendifferent gases.
2.3 Experimental approaches 19
The most practical quantities to measure are maybe the electricalcurrent or potential of the electrodes. The steady-state Townsend ex-periment for instance, relies on a continuous electron release from thecathode, and measures the current resulting from the superposition ofmany electron avalanches, in steady-state. The steady-state value ofthe current is measured as a function of the electrode spacing, whichgives information on the spatial effective ionization coefficient, pro-vided that the electron source is stable. The temporal developmentof the electron avalanche can be observed with pulsed experiments,such as pulsed Townsend [VvdL1984], Time-of-Flight, and (scanning)drift tube [VKL+2017].By measuring macroscopic quantities such as the current, the poten-tial or the light emission, swarm experiments obtain only indirectinformation on the elementary processes occurring within the elec-tric discharge. The assumption of a reaction kinetic model for theelectrons and ions is necessary in order to interpret the measurements.
2.3.2 Electron beam experiments
Electron beam experiments rely on the production of a monochro-matic electron beam which targets a sample gas at very low pressureconditions to ensure that each electron may collide only once with aneutral gas particle. This condition ensures that only collisions at adefined energy are observed.Some beam experiments obtain the total collision cross section bymeasuring the ratio of electrons transmitted through the gas sample(electrons deviated by collisions are lost). Alternatively, angularly-resolved differential scattering cross sections can be obtained bymeasuring the intensity of the electron beam at different angles fromthe incident path.Other beam experiments, equipped with an ion mass spectrometer,extract the ions produced in the collision chamber and identify thembased on the obtained mass spectra. Quantitative ionization andattachment cross sections may be obtained in this way if the measuredvalues are calibrated against a known cross section.By observing only low pressure collisions, beam experiments cannotaccess information on high pressure processes or ionic processes suchas three-body electron attachment, collisional electron detachment
20 2 Physics of gaseous electrical discharges
or ion conversion. However, in contrast to swarm experiments, theproduced ions are clearly identified. In that sense, beam and swarmexperiments are complementary [KI2014,CFJ+2016].
2.4 Dimensioning criteria for electricalinsulation
From the perspective of electrical insulation, electric discharges maybe categorized in two types: partial discharges, and breakdown.Partial discharges occur without causing immediate failure of theinsulation system, although they may contribute to the ageing ofthe system, whereas breakdown is an immediate failure, where theinsulating gas turns conductive and short-circuits the system. Mostdischarges start with one or a few free electrons, which develop intoan electron avalanche, before possibly evolving into other types ofdischarges, such as streamer and leader discharges. In an electronavalanche, the number of free electrons increases due to impactionization of gas particles, and decreases due to electron attachmentto gas particles. The ionization rate νi (s−1) depends on the ionizationrate coefficient ki (m3s−1) and on the gas number density N (m−3)as νi = kiN . Likewise, the electron attachment rate is obtained asνa = kaN . As these two processes compete with each other, thenumber of free electrons varies with the rate νeff = νi − νa, whichis called the effective ionization rate. If the ionization rate exceedsthe attachment rate νi > νa (i.e. νeff > 0), the number of freeelectrons increases, whereas if νi < νa (i.e. νeff < 0) the numberof free electrons decreases. When increasing the electric field, theconditions νi > νa is always reached eventually, because for highelectron energies impact ionization is much more likely than electronattachment. For dimensioning an electrical insulation system, it isinteresting to know the maximum electric field that can be appliedwithout failure of the insulation.A good first criterion is the density-reduced critical electric field(E/N)crit, which is defined as the E/N ratio for which νi = νa, thatis νeff = 0. For E/N < (E/N)crit, electron attachment is dominatingover ionization, therefore, electrical discharges are suppressed. The
2.4 Dimensioning criteria for electrical insulation 21
reason for using high gas pressures (i.e. high N) in electrical insu-lation is because this enables to apply high electric fields E whilestaying below the limiting value (E/N)crit.Since SF6 is widely used in electrical insulation, it is common practiceto define the relative electric strength (or dielectric strength) of agas or gas mixture as the ratio of its density-reduced critical electricfield (E/N)crit (or its breakdown voltage UBd) to that of SF6.When the electric field is spatially homogeneous, and the insulationdistance d and gas density N are sufficiently large, the density-reduced critical electric field (E/N)crit gives approximately the ACor DC breakdown voltage UBd of the system
(E/N)crit ' UBd/(Nd). (2.37)
When the electric field is spatially inhomogeneous, the streamercriterion or streamer integral is commonly used as dimensioningcriterion. For instance the density-reduced electric field E/N mayexceed locally (E/N)crit, between the positions x = 0 and x = xcrit,and be lower than (E/N)crit over the rest of the insulation distance.An electron avalanche may grow inside this region where the localelectric field exceeds (E/N)crit. If the avalanche produces a sufficientnumber of electrons, the electric field of this charge distribution canbecome comparably high as the externally applied field, and willtherefore contribute into propagating the discharge even further, intoregions where originally the electric field was below (E/N)crit. Thetheory of this transition of the electron avalanche into a streamerdischarge was proposed by Meek [Mee1940], based on the observationsof Loeb [LK1939] and Raether [Rae1939]. The number of electronsproduced in the original avalanche is calculated by integrating thespatial effective ionization coefficient αeff (m−1), which gives thenumber of free electrons released by distance traveled by an electron.If this integral exceeds a certain constant K, a streamer dischargeoccurs∫ xcrit
x=0
αeff(x)dx ≥ K. (2.38)
The value of K ∼ 18 or 20 initially proposed by Raether fits wellexperimental results for homogeneous electric field configurations,
22 2 Physics of gaseous electrical discharges
whereas for inhomogeneous electric fields, it is suggested to use lowervalues of K, from 9 to 10 [ZP1994]. The streamer criterion providesthe streamer inception voltage, which is a good approximation for thebreakdown voltage in slighty inhomogeneous electric fields, but maydiffer significantly from the breakdown voltage in very inhomogeneousfields.In very inhomogeneous electric fields, the breakdown voltage maybe much higher than the streamer inception voltage. There is, ingeneral, no straightforward criterion for predicting the breakdownvoltage in this case, although for strongly electron attaching gasesa semi-empirical stepped leader model may be used [NUW1989,SNB2009,KF2015], and empirical relations have been formulated forair [Phi1988].
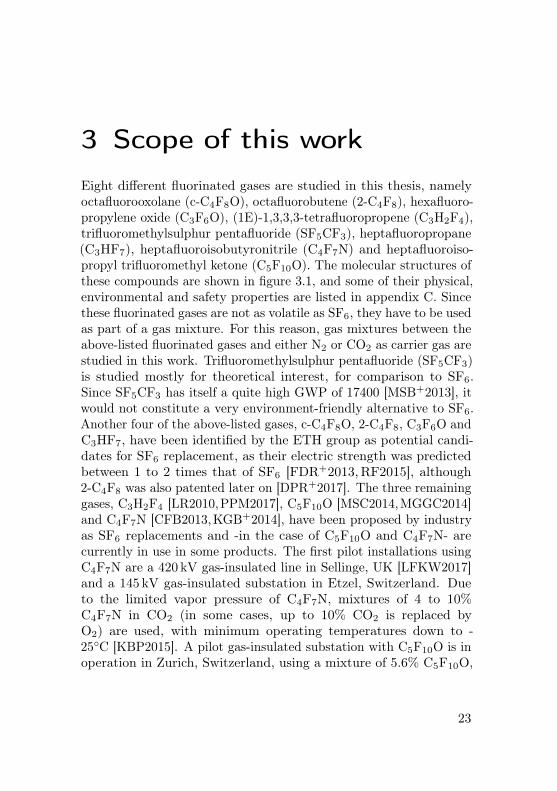
3 Scope of this work
Eight different fluorinated gases are studied in this thesis, namelyoctafluorooxolane (c-C4F8O), octafluorobutene (2-C4F8), hexafluoro-propylene oxide (C3F6O), (1E)-1,3,3,3-tetrafluoropropene (C3H2F4),trifluoromethylsulphur pentafluoride (SF5CF3), heptafluoropropane(C3HF7), heptafluoroisobutyronitrile (C4F7N) and heptafluoroiso-propyl trifluoromethyl ketone (C5F10O). The molecular structures ofthese compounds are shown in figure 3.1, and some of their physical,environmental and safety properties are listed in appendix C. Sincethese fluorinated gases are not as volatile as SF6, they have to be usedas part of a gas mixture. For this reason, gas mixtures between theabove-listed fluorinated gases and either N2 or CO2 as carrier gas arestudied in this work. Trifluoromethylsulphur pentafluoride (SF5CF3)is studied mostly for theoretical interest, for comparison to SF6.Since SF5CF3 has itself a quite high GWP of 17400 [MSB+2013], itwould not constitute a very environment-friendly alternative to SF6.Another four of the above-listed gases, c-C4F8O, 2-C4F8, C3F6O andC3HF7, have been identified by the ETH group as potential candi-dates for SF6 replacement, as their electric strength was predictedbetween 1 to 2 times that of SF6 [FDR+2013,RF2015], although2-C4F8 was also patented later on [DPR+2017]. The three remaininggases, C3H2F4 [LR2010,PPM2017], C5F10O [MSC2014,MGGC2014]and C4F7N [CFB2013,KGB+2014], have been proposed by industryas SF6 replacements and -in the case of C5F10O and C4F7N- arecurrently in use in some products. The first pilot installations usingC4F7N are a 420 kV gas-insulated line in Sellinge, UK [LFKW2017]and a 145 kV gas-insulated substation in Etzel, Switzerland. Dueto the limited vapor pressure of C4F7N, mixtures of 4 to 10%C4F7N in CO2 (in some cases, up to 10% CO2 is replaced byO2) are used, with minimum operating temperatures down to -25◦C [KBP2015]. A pilot gas-insulated substation with C5F10O is inoperation in Zurich, Switzerland, using a mixture of 5.6% C5F10O,
23
24 3 Scope of this work
11.1% O2 and 83.3% CO2 in the high voltage switchgear with arated voltage of 170 kV, and C5F10O/synthetic air mixtures in themedium voltage panels [TDM+2015,DTM2016]. Medium voltagering main units using C5F10O/synthetic air mixtures are also avail-able [KES+2017]. Although the focus of this thesis is on gaseouselectrical insulation, the obtained data may be of use for other applica-tions. For instance, C3H2F4 is of interest for resistive plate chambers(RPC) [GCM2016], c-C4F8O for Cherenkov detectors [ABB+2006],and C3F6O for plasma-assisted polymerization [CB2017].This dissertation starts with an introduction to some aspects ofthe physics of gaseous electrical discharges, followed by a descrip-tion of the experimental methods and physical models used for themeasurement analysis.In particular, two problematic aspects of the pulsed Townsend exper-iments have been identified and remedied: the need to distinguishthe current induced by the electron avalanche from the capacitiverecharging current of the electrodes, and the need to ensure a lowcharge density of the electron avalanche, so that the space chargeelectric field is negligible compared to the externally applied field.Analytic models and tools for the analysis and interpretation of thesemeasurements have also been reviewed in detail and further devel-oped. For the electron current analysis, two cases are distinguished,depending whether or not the electron density is coupled with theion densities. In the case where the electron density is decoupledfrom the ion densities, a detailed analytic description is given. Thisanalytic description is, to a large extend, adapted from previousworks, but some points are clarified and a new method is proposedfor calculating the ionization and attachment rates. In the casewhere the electron and ion densities are coupled, and the reactionkinetic model is known, an optimization procedure can be used toobtain the rates and transport coefficients. This procedure was notdeveloped or used in the present thesis but is rather described forcompleteness. Additionally two existing methods for estimating theelectron attachment cross section are described.The main results obtained for the eight fluorinated gases under studyare then presented. The reaction rate coefficients and transportcoefficients have been obtained with a pulsed Townsend experimentin the eight fluorinated gases and their mixtures with N2 and CO2.
25
O
C C
CC
F
F FF
F
FFF
CC C
C
F F
F
F
F
F
FF
C
CC
F F
FF
FF
O
F
F
F
F
C
C
C
H HF
F
F C
FF C
C
F
CN F
F
FFC
SF
FF
F
F
F
F
F
C
F
F
CC
FF
OC
CF
FF
(a) (b)
(c) (d) (e)
(f) (g) (h)
FF
F
F
CCC
HF
FF
Figure 3.1: Molecular structures of the gases under study: (a) C3HF7,(b) 2-C4F8, (c) C3F6O, (d) c-C4F8O, (e) SF5CF3, (f) C4F7N, (g)C5F10O and (h) C3H2F4.
An online database ETHZ [ETHZ] was created during this thesis,using the infrastructure of the LXcat project [PAB+2017] to makethis data publicly available. For some of the investigated gases, thetotal electron attachment cross section was estimated from the mea-sured attachment rate coefficients using a linear inversion method,or measured with an electron beam experiment using ion mass spec-trometry.Finally, the properties of these gases are compared in regard to theirperformance as gaseous dielectrics. The electron attachment crosssections of the gases are compared, and set in relation with thesynergism observed in gas mixtures. The dependence of the resultson the gas pressure due to electron detachment or three-body electronattachment and its consequences for high pressure applications arediscussed. The present results are applied to compare the relativeelectrical insulation performance of the investigated gases.

4 Measurement and analysistechniques
Parts of this chapter are based on the following publications by theauthor: [CRF2016,CHF2018a,CFJ+2016]
4.1 Pulsed Townsend experiment
4.1.1 Measurement techniques
The principle of the pulsed Townsend experiment is to generate anelectron avalanche in the gas under test in a homogeneous electricfield, and to measure the current induced to the electrodes by thedrift of electrons and ions. Electrons are released from the cathodeand accelerated towards the anode due to the applied electric field.Electrons colliding with gas molecules may ionize them, formingpositive ions and releasing new electrons, or may be captured, formingnegative ions. The ions also drift in the electric field and participateto the induced current. The measurement and analysis of the currentwith a suitable reaction kinetic model provides information on thereaction rate coefficients and transport parameters of electrons andions.
Experimental setup
A schematic of the experiment is shown in figure 4.1. The gas or gasmixture under test is filled into a vessel containing two electrodeswith adjustable spacing d, across which a voltage U is applied. TheRogowski shape of the electrodes ensures the homogeneity of theelectric field E in the gap between electrodes. A photocathode, i.e. a
27
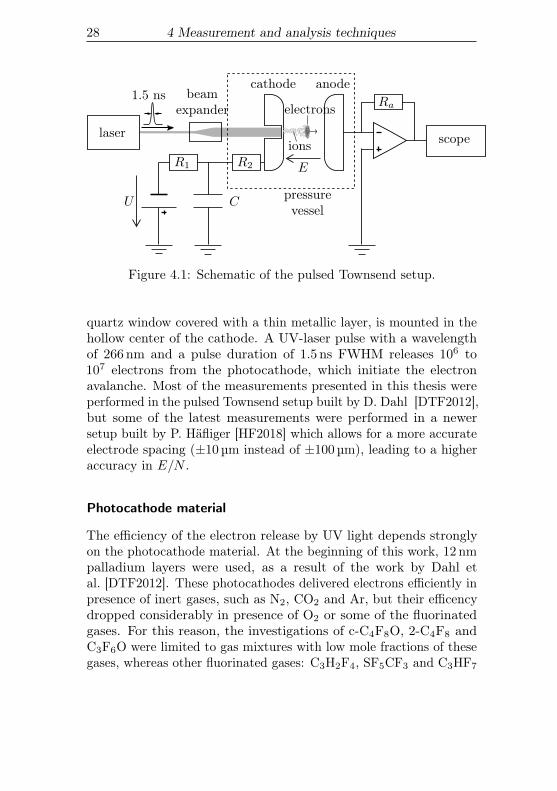
28 4 Measurement and analysis techniques
laser scope
Ra
R1
C
cathode anode
E
U
beamexpander
R2
pressurevessel
1.5 ns
ions
electrons
Figure 4.1: Schematic of the pulsed Townsend setup.
quartz window covered with a thin metallic layer, is mounted in thehollow center of the cathode. A UV-laser pulse with a wavelengthof 266nm and a pulse duration of 1.5ns FWHM releases 106 to107 electrons from the photocathode, which initiate the electronavalanche. Most of the measurements presented in this thesis wereperformed in the pulsed Townsend setup built by D. Dahl [DTF2012],but some of the latest measurements were performed in a newersetup built by P. Häfliger [HF2018] which allows for a more accurateelectrode spacing (±10 µm instead of ±100 µm), leading to a higheraccuracy in E/N .
Photocathode material
The efficiency of the electron release by UV light depends stronglyon the photocathode material. At the beginning of this work, 12 nmpalladium layers were used, as a result of the work by Dahl etal. [DTF2012]. These photocathodes delivered electrons efficiently inpresence of inert gases, such as N2, CO2 and Ar, but their efficencydropped considerably in presence of O2 or some of the fluorinatedgases. For this reason, the investigations of c-C4F8O, 2-C4F8 andC3F6O were limited to gas mixtures with low mole fractions of thesegases, whereas other fluorinated gases: C3H2F4, SF5CF3 and C3HF7
4.1 Pulsed Townsend experiment 29
were less problematic in this regard. More recently, it was found byHäfliger et al. [HF2018] that a photocathode coated with two metalliclayers: a 10 nm magnesium layer, topped with a 5 nm palladium layer,performs much better than a single-layer palladium photocathode.These two-layer photocathodes were used in the investigation ofC5F10O and C4F7N.
Measuring the displacement current
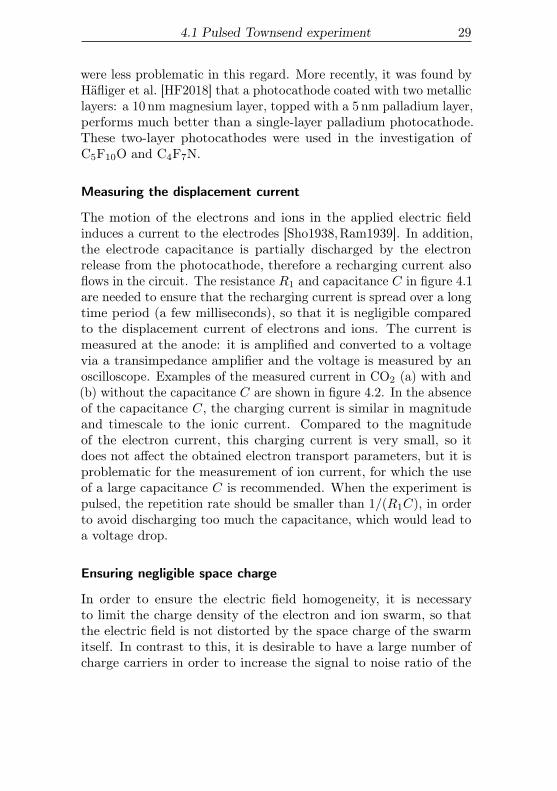
The motion of the electrons and ions in the applied electric fieldinduces a current to the electrodes [Sho1938,Ram1939]. In addition,the electrode capacitance is partially discharged by the electronrelease from the photocathode, therefore a recharging current alsoflows in the circuit. The resistance R1 and capacitance C in figure 4.1are needed to ensure that the recharging current is spread over a longtime period (a few milliseconds), so that it is negligible comparedto the displacement current of electrons and ions. The current ismeasured at the anode: it is amplified and converted to a voltagevia a transimpedance amplifier and the voltage is measured by anoscilloscope. Examples of the measured current in CO2 (a) with and(b) without the capacitance C are shown in figure 4.2. In the absenceof the capacitance C, the charging current is similar in magnitudeand timescale to the ionic current. Compared to the magnitudeof the electron current, this charging current is very small, so itdoes not affect the obtained electron transport parameters, but it isproblematic for the measurement of ion current, for which the useof a large capacitance C is recommended. When the experiment ispulsed, the repetition rate should be smaller than 1/(R1C), in orderto avoid discharging too much the capacitance, which would lead toa voltage drop.
Ensuring negligible space charge
In order to ensure the electric field homogeneity, it is necessaryto limit the charge density of the electron and ion swarm, so thatthe electric field is not distorted by the space charge of the swarmitself. In contrast to this, it is desirable to have a large number ofcharge carriers in order to increase the signal to noise ratio of the
30 4 Measurement and analysis techniques
0 50 100 150 200
0
10
20
30
40(a)
t (ns)
I(µA)
measurement with C
analytic �t
measurement without C
analytic �t
0 20 40 60 80 100 120
0
20
40
60(b)
t (µs)
I(nA)
Figure 4.2: Measured current in CO2 with, and without the capac-itance C, in otherwise similar conditions: E/N ∼ 90Td, pressure∼1.8 kPa and electrode spacing ∼17mm, shown (a) on the timescaleof electron transit and (b) on the timescale of ion transit. Thecurrent measured without the capacitance C has been multiplied by1.7 in order to have the same amplitude as the other at t = 50ns.
4.1 Pulsed Townsend experiment 31
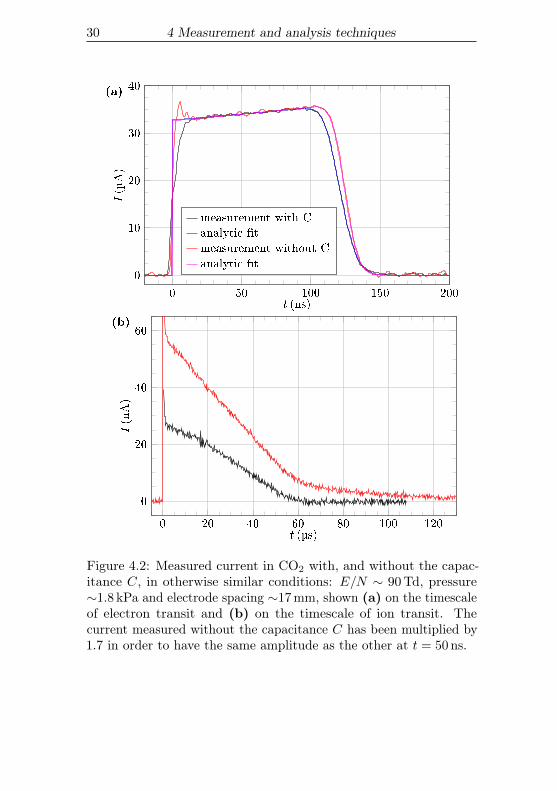
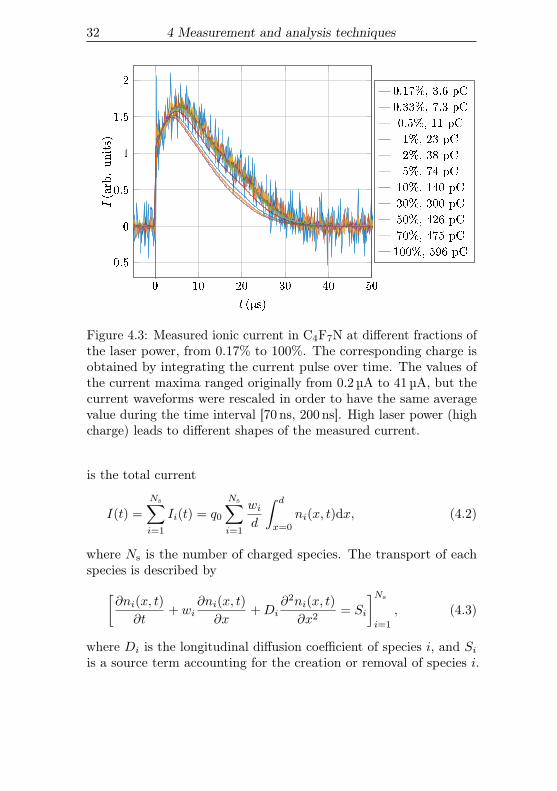
measured current. The solution to this dilemma is to broaden thelaser beam, illuminating a larger area of the photocathode. For afixed number of charge carriers, broadening their spatial distributionreduces the space charge density. In the present experiment, thenumber of released electrons can be tuned by attenuating the laserpower down do 1% using a dedicated attenuator, and further by1/2 and 1/3 by placing two optical filters in the laser path. Thenumber of released electrons varies linearly with the laser power, asis expected for single-photon photoemission from the photocathode.As an example, the ionic current in C4F7N was measured for differentnumbers of start electrons, and rescaled to the same initial amplitude.The different numbers of start electrons were obtained by usingdifferent fractions of the laser power, from 0.17% to 100%. The resultsare shown in figure 4.3, where the total charge of each avalancheis also indicated. The measured current is consistent for the laserpowers up to 1%, corresponding to a total charge of 23 pC, but startsto deviate for 2% or higher laser powers, corresponding to a totalcharge of 38 pC or higher. The likely explanation for this deviationis that for the highest charge densities, the distortion of the electricfield affects the particle transport. In practice, to avoid this effect,the total charge of the avalanche was always kept below 10 pC (i.e.about 108 elementary charges).
4.1.2 Analysis techniques
In order to extract information from the measured current, a physicalmodel linking the measured current to the reactions rates and trans-port coefficients is needed. The drift of each charged species (electronsand ions) i induces a current to the electrodes [Sho1938,Ram1939]
Ii(t) = q0widNi(t) = q0
wid
∫ d
x=0
ni(x, t)dx, (4.1)
where Ni is the number of particles of species i, wi is the drift velocityof species i, and ni is the linear number density of species i, i.e. thenumber density of species i projected along the E-field direction(x-axis). The quantity measured in the pulsed Townsend experiment
32 4 Measurement and analysis techniques
0 10 20 30 40 50
�0:5
0
0:5
1
1:5
2
t (µs)
I(arb.units)
0.17%, 3.6 pC
0.33%, 7.3 pC
0.5%, 11 pC
1%, 23 pC
2%, 38 pC
5%, 74 pC
10%, 140 pC
30%, 300 pC
50%, 426 pC
70%, 475 pC
100%, 596 pC
Figure 4.3: Measured ionic current in C4F7N at different fractions ofthe laser power, from 0.17% to 100%. The corresponding charge isobtained by integrating the current pulse over time. The values ofthe current maxima ranged originally from 0.2 µA to 41 µA, but thecurrent waveforms were rescaled in order to have the same averagevalue during the time interval [70 ns, 200 ns]. High laser power (highcharge) leads to different shapes of the measured current.
is the total current
I(t) =
Ns∑i=1
Ii(t) = q0
Ns∑i=1
wid
∫ d
x=0
ni(x, t)dx, (4.2)
where Ns is the number of charged species. The transport of eachspecies is described by[
∂ni(x, t)
∂t+ wi
∂ni(x, t)
∂x+Di
∂2ni(x, t)
∂x2= Si
]Ns
i=1
, (4.3)
where Di is the longitudinal diffusion coefficient of species i, and Siis a source term accounting for the creation or removal of species i.
4.1 Pulsed Townsend experiment 33
The source term Si may depend on the densities nj of any of thecharged species j = 1..Ns (i included). The continuity equation (4.3)is obtained by integrating the Boltzmann equation (2.20) over thevelocity space.
Case 1: Electron density decoupled from ion densities
Quite often, the electron density is entirely decoupled from the iondensities, that is, the electron source term Se depends solely on theelectron density ne, via the effective ionization rate νeff . In otherterms, no ionic reactions lead to the creation or removal of electrons.This gives, for the electron transport equation
∂ne(x, t)
∂t+ we
∂ne(x, t)
∂x−DL
∂2ne(x, t)
∂x2= νeffne. (4.4)
In this case, the electron transport equation can be solved indepen-dently from the ion transport equations. This case has been coveredin previous works [Rae1964,Bra1964,BJ1984,Asc1985].For an initial electron source at t = 0 in x = 0, the solution ofequation (4.4) for the linear density of electrons is a Gaussian functionwith a time-dependent amplitude, propagating at constant velocitywe along the field direction, and broadening in time due to thediffusion of electrons DL [BJ1984]
ne(x, t) =Ne(0) exp(νefft)√
4πDLtexp
(− (x− wet)
2
4DLt
). (4.5)
At time t = 0, the Ne(0) electrons released from the cathode at theposition x = 0 have unknown energy. Therefore, there is actually ashort non-equilibrium phase before a steady-state energy distributionof the electrons is reached and the electron swarm drifts at a constantvelocity we in the direction of the anode. This short non-equilibriumphase is neglected in the analytic treatment because at the consideredpressures it occurs on the picosecond timescale [RF2016].
34 4 Measurement and analysis techniques
Expression of the electron current
The equation for the electron current is then obtained by combiningequations (4.1) and (4.5)
Ie(t) = q0we
dNe(t)
= q0we
d
∫ d
x=0
ne(x, t)dx
= Ne(0)q0we
d
exp(νefft)√4πDLt
∫ d
x=0
exp
(− (x− wet)
2
4DLt
)dx
= Ne(0)q0we
dexp(νefft)
[−1
2erf
(wet− x√4DLt
)]d0
=Ne(0)q0
2
we
dexp(νefft)
(erf
(wet√4DLt
)− erf
(wet− d√4DLt
)).
Introducing the electron drift time Te = d/we and the characteristictime for longitudinal electron diffusion τD = 2DL/w
2e yields
Ie(t) =Ne(0)q0
2Teexp(νefft)
(erf
(t√2τDt
)− erf
(t− Te√2τDt
)). (4.6)
Equation (4.6) is valid only for t ≥ 0, because the initial electronsare created at t = 0. In practice, the action of diffusion in the veryfirst instants via the term erf
(t/√2τDt
)cannot be measured because
the measured rise-time of the current is limited by the measurementcutoff frequency. Therefore, equation (4.6) is simplified as
Ie(t) =Ne(0)q0
2Teexp(νefft)
(1− erf
(t− Te√2τDt
)). (4.7)
Expression of the ion current during the electron transit
An example kinetic model where the electron density is decoupledfrom the ion densities is shown in figure 4.4. In this example, thecontinuity equations for the densities of electrons (e−) and ions (AB+,AB−, A− and A2B−) are
4.1 Pulsed Townsend experiment 35
AB+ e− AB−
A− A2B−
kquad
+ ABki
kda
kc
+ AB
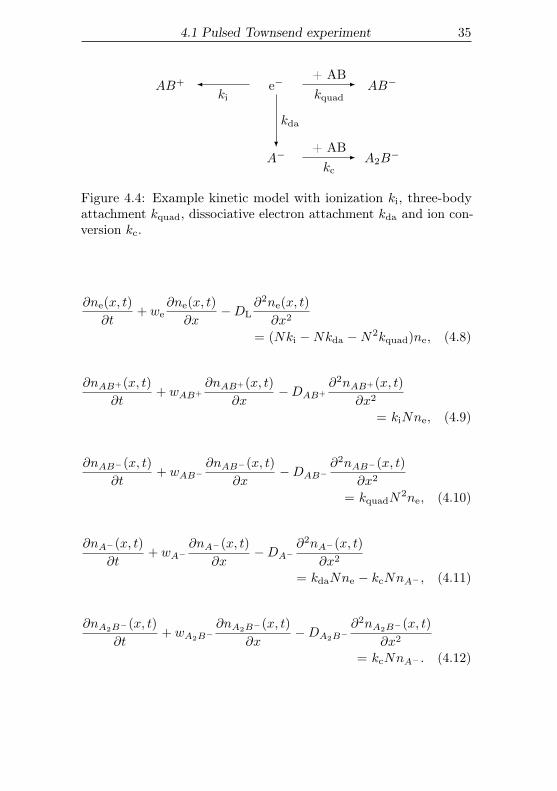
Figure 4.4: Example kinetic model with ionization ki, three-bodyattachment kquad, dissociative electron attachment kda and ion con-version kc.
∂ne(x, t)
∂t+ we
∂ne(x, t)
∂x−DL
∂2ne(x, t)
∂x2
= (Nki −Nkda −N2kquad)ne, (4.8)
∂nAB+(x, t)
∂t+ wAB+
∂nAB+(x, t)
∂x−DAB+
∂2nAB+(x, t)
∂x2
= kiNne, (4.9)
∂nAB−(x, t)
∂t+ wAB−
∂nAB−(x, t)
∂x−DAB−
∂2nAB−(x, t)
∂x2
= kquadN2ne, (4.10)
∂nA−(x, t)
∂t+ wA−
∂nA−(x, t)
∂x−DA−
∂2nA−(x, t)
∂x2
= kdaNne − kcNnA− , (4.11)
∂nA2B−(x, t)
∂t+ wA2B−
∂nA2B−(x, t)
∂x−DA2B−
∂2nA2B−(x, t)
∂x2
= kcNnA− . (4.12)
36 4 Measurement and analysis techniques
In particular, the electron source term is given by
Se = (Nki −Nkda −N2kquad)ne = νeffne. (4.13)
The electron drift velocity typically exceeds the ion drift velocitiesby two to three orders of magnitude, which makes it reasonable totreat ions as immobile during the electron transit (neglecting thedrift and diffusion terms). In the example kinetic model of figure 4.4,the densities of the ions then obey
∂nAB+(x, t)
∂t= kiNne, (4.14)
∂nAB−(x, t)
∂t= kquadN
2ne, (4.15)
∂nA−(x, t)
∂t= kdaNne − kcNnA− , (4.16)
∂nA2B−(x, t)
∂t= kcNnA− . (4.17)
This gives for the ionic currents
IAB+(t) = kiNwAB+
we
∫ t′
0
Ie(t′)dt′, (4.18)
IAB−(t) = kquadN2wAB−
we
∫ t′
0
Ie(t′)dt′, (4.19)
IA−(t) = kdaNwA−
we
∫ t′
0
Ie(t′)dt′ − kcN
∫ t′
0
IA−(t′)dt′, (4.20)
IA2B−(t) = kcNwA2B−
wA−
∫ t′
0
IA−(t′)dt′. (4.21)
The total ion current Iion(t) is obtained as
Iion(t) = IAB+(t) + IAB−(t) + IA−(t) + IA2B−(t). (4.22)
Therefore, in most cases (i.e. if there is no ion conversion, or ifwA− ∼ wA2B− or kda � kc or kda � kc), there is a proportionality
4.1 Pulsed Townsend experiment 37
between the total ion current Iion and the integral of the electroncurrent
Iion(t) ∝∫ t′
0
Ie(t′)dt′. (4.23)
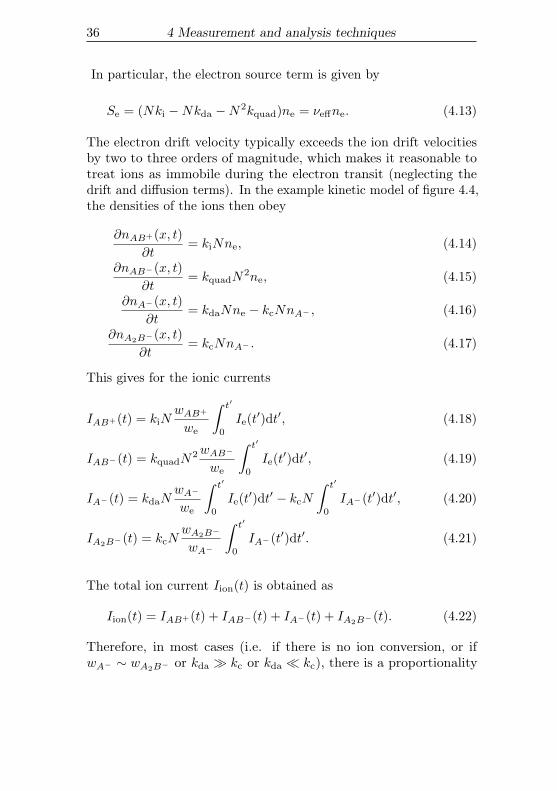
Then, the electronic and ionic contributions to I(t) can be separatedusing the procedure described in the following section.An exception is if both kda ∼ kc and wA− 6= wA2B− . In this case, itis not possible to easily separate the contributions of the electron andthe ion current, a numerical solution of the full system of continuityequations would be in principle needed to fit the measured current.However, it is not always crucial to be able to separate accurately theelectron and ion contributions. When the ionization and attachmentrates are not too high, the ion contribution is not very large on thetimescale of the electron transit, and even neglecting it altogetherwould lead only to a small error. For instance, in the measuredcurrent shown in figure 4.5 the ion current amplitude represents atmost 2% of the electron current.
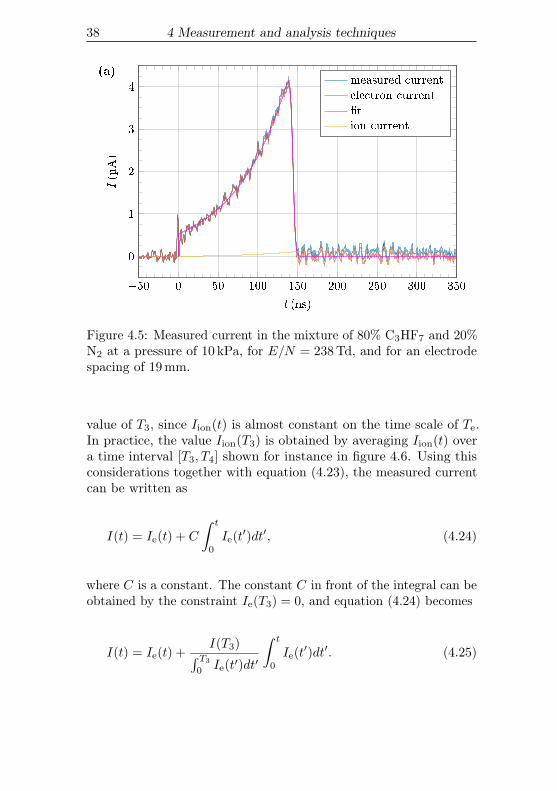
Separation of the total current into the electron and ioncurrents
The measured current I(t) in the pulsed Townsend experiment isthe sum of the electron and ion currents (see equation (4.2)). Foranalyzing the electron current Ie on the basis of equation (4.7), itis necessary to extract Ie(t) from I(t). In the case of zero electrondiffusion, all electrons arrive at the anode at the same time Te = d/we.However, in the case of non-zero diffusion, some electrons arrive earlierand some delayed. Therefore, a time T3 is defined, at which "nearly"all electrons arrived. We determine Te from the measured current andwe usually set T3 = 2Te. For typical electrode spacing and pressuresin our experiments Te is two orders of magnitude larger than τD, thatis Te/τD ≈ 102. In this case, the electron current at time T3 dropsto Ie(T3)/I0 ∝ (1− erf
(0.5√Te/τD
)) ≈ 10−12 of its initial current,
according to equation (4.7). Thus, from this time point on, no moreelectrons are present and the measured current is only from ionsI(T3) = Iion(T3). There is little sensitivity of Iion(T3) on the exact
38 4 Measurement and analysis techniques
�50 0 50 100 150 200 250 300 350
0
1
2
3
4
(a)
t (ns)
I(µA)
measured current
electron current
�t
ion current
Figure 4.5: Measured current in the mixture of 80% C3HF7 and 20%N2 at a pressure of 10 kPa, for E/N = 238Td, and for an electrodespacing of 19mm.
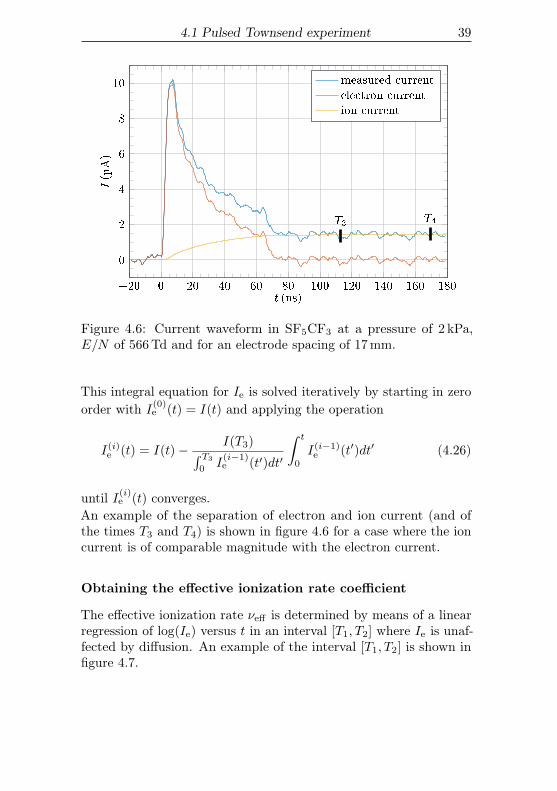
value of T3, since Iion(t) is almost constant on the time scale of Te.In practice, the value Iion(T3) is obtained by averaging Iion(t) overa time interval [T3, T4] shown for instance in figure 4.6. Using thisconsiderations together with equation (4.23), the measured currentcan be written as
I(t) = Ie(t) + C
∫ t
0
Ie(t′)dt′, (4.24)
where C is a constant. The constant C in front of the integral can beobtained by the constraint Ie(T3) = 0, and equation (4.24) becomes
I(t) = Ie(t) +I(T3)∫ T3
0Ie(t′)dt′
∫ t
0
Ie(t′)dt′. (4.25)
4.1 Pulsed Townsend experiment 39
�20 0 20 40 60 80 100 120 140 160 180
0
2
4
6
8
10
T3 T4
t (ns)
I(µA)
measured current
electron current
ion current
Figure 4.6: Current waveform in SF5CF3 at a pressure of 2 kPa,E/N of 566Td and for an electrode spacing of 17mm.
This integral equation for Ie is solved iteratively by starting in zeroorder with I(0)
e (t) = I(t) and applying the operation
I(i)e (t) = I(t)− I(T3)∫ T3
0I
(i−1)e (t′)dt′
∫ t
0
I(i−1)e (t′)dt′ (4.26)
until I(i)e (t) converges.
An example of the separation of electron and ion current (and ofthe times T3 and T4) is shown in figure 4.6 for a case where the ioncurrent is of comparable magnitude with the electron current.
Obtaining the effective ionization rate coefficient
The effective ionization rate νeff is determined by means of a linearregression of log(Ie) versus t in an interval [T1, T2] where Ie is unaf-fected by diffusion. An example of the interval [T1, T2] is shown infigure 4.7.
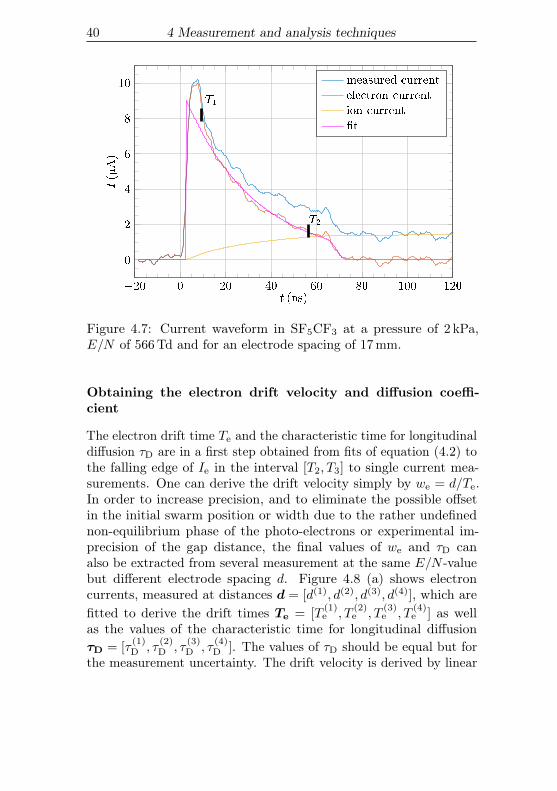
40 4 Measurement and analysis techniques
�20 0 20 40 60 80 100 120
0
2
4
6
8
10
T1
T2
t (ns)
I(µA)
measured current
electron current
ion current
�t
Figure 4.7: Current waveform in SF5CF3 at a pressure of 2 kPa,E/N of 566Td and for an electrode spacing of 17mm.
Obtaining the electron drift velocity and diffusion coeffi-cient
The electron drift time Te and the characteristic time for longitudinaldiffusion τD are in a first step obtained from fits of equation (4.2) tothe falling edge of Ie in the interval [T2, T3] to single current mea-surements. One can derive the drift velocity simply by we = d/Te.In order to increase precision, and to eliminate the possible offsetin the initial swarm position or width due to the rather undefinednon-equilibrium phase of the photo-electrons or experimental im-precision of the gap distance, the final values of we and τD canalso be extracted from several measurement at the same E/N -valuebut different electrode spacing d. Figure 4.8 (a) shows electroncurrents, measured at distances d = [d(1), d(2), d(3), d(4)], which arefitted to derive the drift times Te = [T
(1)e , T
(2)e , T
(3)e , T
(4)e ] as well
as the values of the characteristic time for longitudinal diffusionτD = [τ
(1)D , τ
(2)D , τ
(3)D , τ
(4)D ]. The values of τD should be equal but for
the measurement uncertainty. The drift velocity is derived by linear
4.1 Pulsed Townsend experiment 41
regression of d versus Te, corresponding to the slope in Figure 4.8(b). Similarly, we obtain the final value for τD from linear regressionof τDTe versus Te, as shown in Figure 4.8 (c).
Obtaining the ionization and attachment rate coefficients
A simple model for the ion current Iion was described in a previouswork [CRF2016] for the case where only one type of cation and onetype of anion are present. This approach fails for instance when twotypes of negative ions (or two types of positive ions) with differentdrift velocities are present. This can occur due to the existence ofseveral attachment (or several ionization) processes, or due to ionconversion or charge transfer. With a more sophisticated approach, itis possible to analyze cases with several anion species, including evenion kinetics [HHF2017], but this requires an extensive knowledge ofthe kinetic processes, which is not always available.A simpler analysis was developed during this thesis [CHF2018a],which makes it possible to obtain only the ionization and attachmentrate coefficients ki and ka without making assumptions on the numberof ion species nor on the number of ionization, attachment and ionconversion processes. We still assume that the effective ionizationrate coefficient keff is simply given by the difference between theionization and attachment rate coefficients
keff = ki − ka, (4.27)
explicitly excluding electron detachment and any other process thatcould lead to secondary electron production. This analysis reliesfurthermore on the fact that keff and Ne(0) are already known fromthe electron current analysis. For simplicity, we neglect electrondiffusion in the following calculations so that the number of electronsat an instant 0 ≤ t ≤ Te is given by
Ne(t) = Ne(0) exp(keffNt). (4.28)
The time integral of the measured current I gives the total amount ofcharge that transits through the gap between the electrodes. Dividingit by the elementary charge q0, we obtain the number Nc of charge
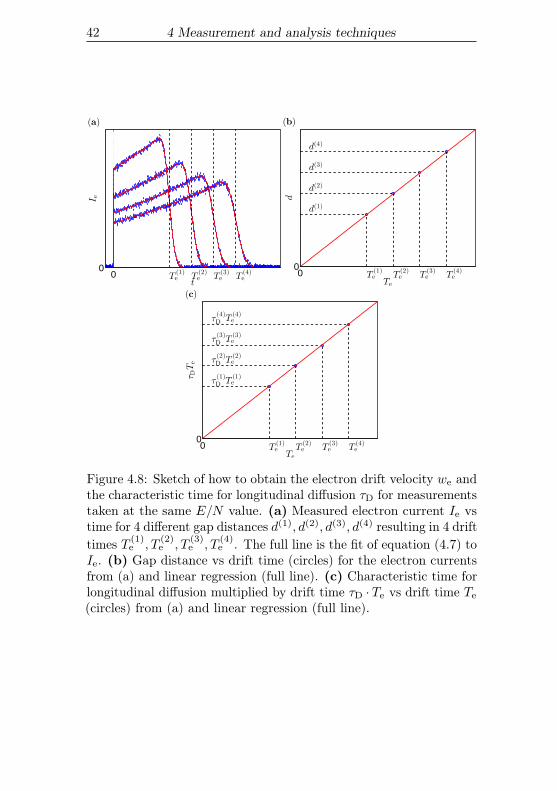
42 4 Measurement and analysis techniques
00
t
Ie
T(1)e T
(2)e T
(3)e T
(4)e
(a)
00
Ted
T(1)e
d(1)
T(2)e
d(2)
T(3)e
d(3)
T(4)e
d(4)
(b)
00
Te
τDTe
T(1)e
τ(1)D T
(1)e
T(2)e
τ(2)D T
(2)e
T(3)e
τ(3)D T
(3)e
T(4)e
τ(4)D T
(4)e
(c)
Figure 4.8: Sketch of how to obtain the electron drift velocity we andthe characteristic time for longitudinal diffusion τD for measurementstaken at the same E/N value. (a) Measured electron current Ie vstime for 4 different gap distances d(1), d(2), d(3), d(4) resulting in 4 drifttimes T (1)
e , T(2)e , T
(3)e , T
(4)e . The full line is the fit of equation (4.7) to
Ie. (b) Gap distance vs drift time (circles) for the electron currentsfrom (a) and linear regression (full line). (c) Characteristic time forlongitudinal diffusion multiplied by drift time τD · Te vs drift time Te
(circles) from (a) and linear regression (full line).
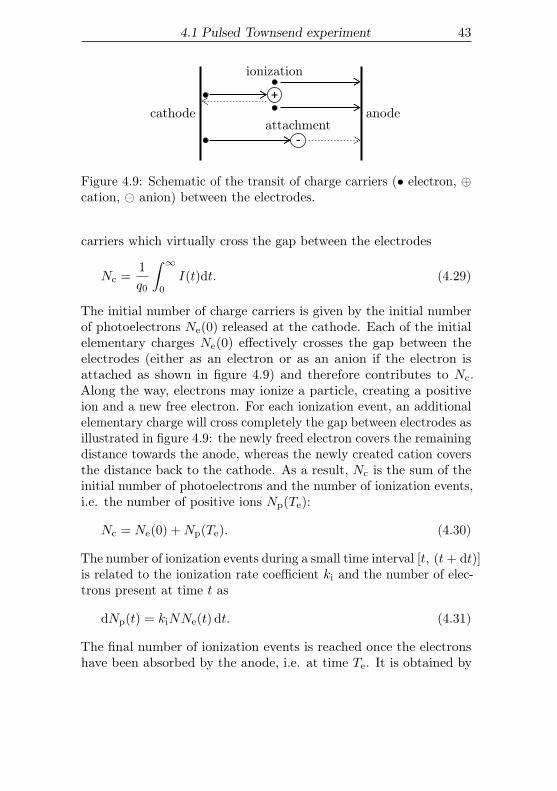
4.1 Pulsed Townsend experiment 43
ionization
attachmentcathode anode
Figure 4.9: Schematic of the transit of charge carriers (• electron, ⊕cation, � anion) between the electrodes.
carriers which virtually cross the gap between the electrodes
Nc =1
q0
∫ ∞0
I(t)dt. (4.29)
The initial number of charge carriers is given by the initial numberof photoelectrons Ne(0) released at the cathode. Each of the initialelementary charges Ne(0) effectively crosses the gap between theelectrodes (either as an electron or as an anion if the electron isattached as shown in figure 4.9) and therefore contributes to Nc.Along the way, electrons may ionize a particle, creating a positiveion and a new free electron. For each ionization event, an additionalelementary charge will cross completely the gap between electrodes asillustrated in figure 4.9: the newly freed electron covers the remainingdistance towards the anode, whereas the newly created cation coversthe distance back to the cathode. As a result, Nc is the sum of theinitial number of photoelectrons and the number of ionization events,i.e. the number of positive ions Np(Te):
Nc = Ne(0) +Np(Te). (4.30)
The number of ionization events during a small time interval [t, (t+ dt)]is related to the ionization rate coefficient ki and the number of elec-trons present at time t as
dNp(t) = kiNNe(t) dt. (4.31)
The final number of ionization events is reached once the electronshave been absorbed by the anode, i.e. at time Te. It is obtained by
44 4 Measurement and analysis techniques
integrating the cation production between instants 0 and Te
Np(Te) = kiN
∫ Te
0
Ne(t) dt
= Ne(0)ki
keff(exp(keffNTe)− 1)
=ki
keff(Ne(Te)−Ne(0)) . (4.32)
Replacing equation (4.32) into (4.30) yields
Nc = Ne(0) +ki
keff(Ne(Te)−Ne(0)) . (4.33)
And this yields for ki and ka
ki = keffNc −Ne(0)
Ne(Te)−Ne(0), (4.34)
ka = ki − keff = keffNc −Ne(Te)
Ne(Te)−Ne(0). (4.35)
The key assumption of this method is the absence of ionizationevents after the electron drift time Te. The occurrence of ionizationevents after Te is not accounted for in the calculation of Np(Te)with equation (4.32), using the present method would thus result inoverestimating ki and ka.
Three-body electron attachment
The effective ionization coefficient keff , or more precisely the totalattachment coefficient ka, may depend on the gas number densityN due to three-body electron attachment. As described briefly insection 2.1, three-body electron attachment is a mechanism wherea metastable anion (M−)∗ is formed, which may be stabilized in a
4.1 Pulsed Townsend experiment 45
further collision with a neutral particle.
e+Akm−−→ (A−)∗ (metastable ion formation) (4.36)
(A−)∗τ−1det−−→ A+ e (auto-detachment) (4.37)
(A−)∗ +Bkd−→ A+B + e (collisional detachment) (4.38)
(A−)∗ +Bks−→ A− +B (collisional stabilization) (4.39)
In the above mechanism km (m3s−1) is the rate coefficient for themetastable ion formation, τ−1
det (s−1) is the electron auto-detachmentrate from the metastable ion, kd (m3s−1) is the collisional detachmentrate coefficient and ks (m3s−1) is the collisional stabilization ratecoefficient. The three-body attachment rate νa (s−1) resulting fromthis mechanism is [Ale1988]
νa =kmksχAχBN
2
τ−1det + (kd + ks)χBN
, (4.40)
where χA and χB are the mole fractions of A and B in the gasmixture (A and B can in principle also be the same molecule).Depending on the gas number density N , different cases can bedistinguished in equation (4.40). If we note Nsat = τ−1
det(ks + kd)−1
and kquad = kmksτdet, equation (4.40) becomes
νa =kquadχAχBN
2
1 + χBN/Nsat. (4.41)
Two limiting cases of equation (4.41) can be identified by comparingthe gas density N to the quantity Nsat [Ale1988]
(i) When χBN � Nsat, equation (4.41) simplifies as
νa = kquadχAχBN2, (4.42)
and the three-body attachment rate increases quadraticallywith the gas density.
(ii) When χBN � Nsat, equation (4.41) simplifies as
νa = kquadNsatχAN = ksatχAN, (4.43)
46 4 Measurement and analysis techniques
and the three-body attachment rate increases linearly with thegas density.
The quantityNsat can be seen as a "saturation" density for three-bodyattachment. Indeed, when the gas density greatly exceeds Nsat, theauto-detachment lifetime τdet is much longer than the mean time forthe unstable anion to react with a third body (τdet � ((ks+kd)N)−1),therefore, the unstable anion is systematically stabilized/detachedwhereas the auto-detachment becomes irrelevant. In this case, three-body attachment appears outwardly as a two-body process, with theapparent two-body rate coefficient ksat = kquadNsat (m3s−1).In pure C3H2F4, the measured effective ionization rate νeff dependson the gas density as
νeff(N) = k0effN − kquadN
2, (4.44)
corresponding to case (i) above. This suggests that some two-bodyprocesses such as impact ionization and dissociative electron attach-ment occur, with the rate coefficient k0
eff (m3s−1), as well as three-body electron attachment, with the rate coefficient kquad (m6s−1).The values of k0
eff and kquad can be obtained by a regression ofνeff(N) with equation (4.44). An example is shown in figure 4.10 formeasurements of νeff(N) in C3H2F4.An example of case (ii) is SF6, where the metastable (SF−6 )∗ formedby thermal electron attachment to SF6 is so long-lived that is issystematically stabilized.In the case of c-C4F8O mixtures with N2 and CO2, the measuredionization rate νeff depends on the gas density as
νeff(N) = k0eff(χ)N −
kquadχN2
1 +N/Nsat, (4.45)
where χ is the mole fraction of c-C4F8O in the mixture, with χA =χ � 1 and χB = 1 − χ ' 1. This corresponds to the generalcase of equation (4.41). Example regressions of equation (4.41) tomeasurement of νeff(N) in c-C4F8O mixtures are shown in figure 4.11.
Case 2: Electron density coupled with ion densities
When the electron density is coupled with the ion densities, forinstance due to the occurrence of electron detachment, it is not
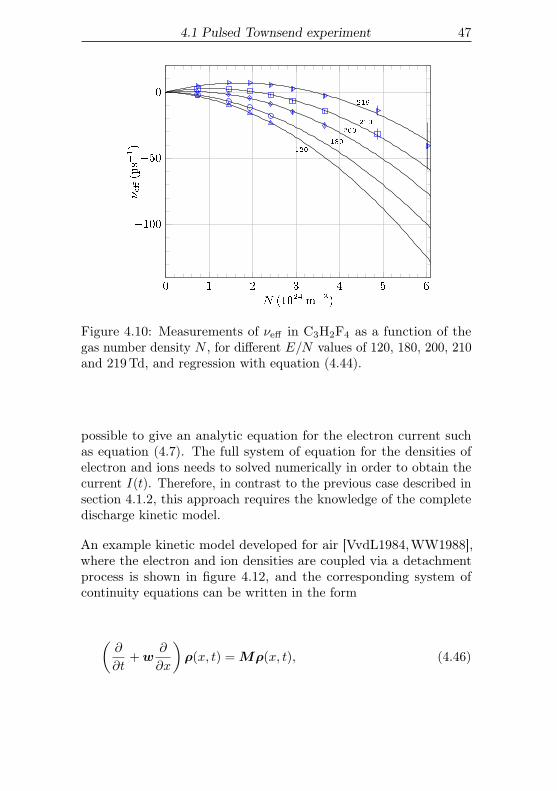
4.1 Pulsed Townsend experiment 47
0 1 2 3 4 5 6
�100
�50
0219
210
200
180
120
N (1024m�3)
�e�(µs�1)
Figure 4.10: Measurements of νeff in C3H2F4 as a function of thegas number density N , for different E/N values of 120, 180, 200, 210and 219Td, and regression with equation (4.44).
possible to give an analytic equation for the electron current suchas equation (4.7). The full system of equation for the densities ofelectron and ions needs to solved numerically in order to obtain thecurrent I(t). Therefore, in contrast to the previous case described insection 4.1.2, this approach requires the knowledge of the completedischarge kinetic model.
An example kinetic model developed for air [VvdL1984,WW1988],where the electron and ion densities are coupled via a detachmentprocess is shown in figure 4.12, and the corresponding system ofcontinuity equations can be written in the form
(∂
∂t+w
∂
∂x
)ρ(x, t) =Mρ(x, t), (4.46)
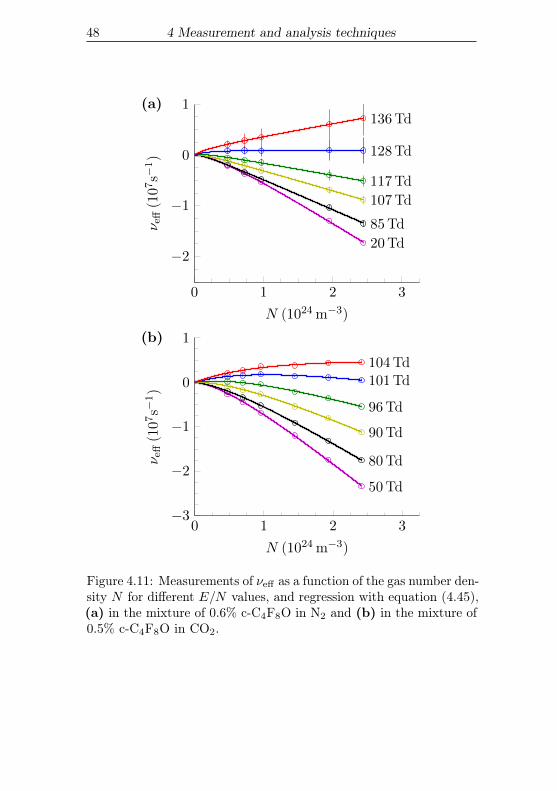
48 4 Measurement and analysis techniques
0 1 2 3
−2
−1
0
1
20Td85Td
107Td117Td
128Td
136Td(a)
N (1024 m−3)
ν eff
(107
s−1)
0 1 2 3−3
−2
−1
0
1
50Td
80Td
90Td
96Td
101Td104Td
(b)
N (1024 m−3)
ν eff
(107
s−1)
Figure 4.11: Measurements of νeff as a function of the gas number den-sity N for different E/N values, and regression with equation (4.45),(a) in the mixture of 0.6% c-C4F8O in N2 and (b) in the mixture of0.5% c-C4F8O in CO2.
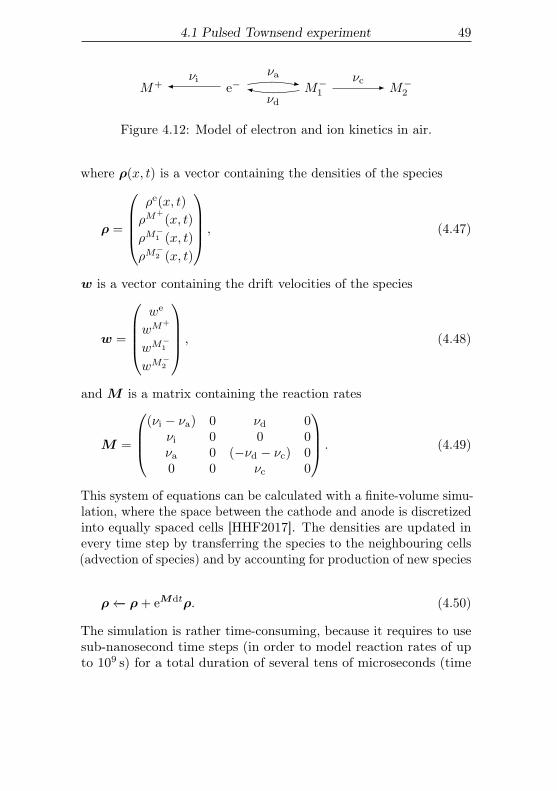
4.1 Pulsed Townsend experiment 49
M+ e− M−1 M−2νi
νa
νd
νc
Figure 4.12: Model of electron and ion kinetics in air.
where ρ(x, t) is a vector containing the densities of the species
ρ =
ρe(x, t)
ρM+
(x, t)
ρM−1 (x, t)
ρM−2 (x, t)
, (4.47)
w is a vector containing the drift velocities of the species
w =
we
wM+
wM−1
wM−2
, (4.48)
and M is a matrix containing the reaction rates
M =
(νi − νa) 0 νd 0
νi 0 0 0νa 0 (−νd − νc) 00 0 νc 0
. (4.49)
This system of equations can be calculated with a finite-volume simu-lation, where the space between the cathode and anode is discretizedinto equally spaced cells [HHF2017]. The densities are updated inevery time step by transferring the species to the neighbouring cells(advection of species) and by accounting for production of new species
ρ←− ρ+ eMdtρ. (4.50)
The simulation is rather time-consuming, because it requires to usesub-nanosecond time steps (in order to model reaction rates of upto 109 s) for a total duration of several tens of microseconds (time
50 4 Measurement and analysis techniques
needed by the ions to cross a 2 cm gap between electrodes). The ratecoefficients and transport parameters of electrons and ions can thenbe obtained as the result of an optimization procedure minimizing thedifference between the simulated and measured currents [HHF2017],starting with a random guess of the reaction rates.
Estimation of the electron attachment cross section
Two methods developed in a previous work [RHCF2015] are usedin this thesis to estimate the attachment cross sections of severalfluorinated gases based on their attachment rates in various carriergases. The relation between effective ionization rate coefficient keff =ki − ka of a gas mixture and the attachment and ionization crosssections of its components is given by (see for instance equation (10)of reference [HP2005])
keff = ki − ka, (4.51)
ki(E/N) =
√2
me
∫ ∞0
∑n species
χnσ(n)i (ε)εF0(E/N, ε) dε, (4.52)
ka(E/N) =
√2
me
∫ ∞0
∑n species
χnσ(n)a (ε)εF0(E/N, ε) dε, (4.53)
where χn is the mole fraction of species n in the mixture, σ(n)a is the
total attachment cross section of species n, σ(n)i is the total ionization
cross section of species n, me is the electron mass and F0(E/N, ε)is the electron energy probability function (EEPF) in the mixture.The EEPF is normalized as follows∫ ∞
ε=0
√εF0(E/N, ε) dε = 1. (4.54)
In the particular case where a sample gas is added with a small molefraction χ� 1 to a carrier gas, the EEPF of the gas mixture can beassumed to be the same as that of the pure carrier gas and equations(4.51)-(4.53) simplify to
4.1 Pulsed Townsend experiment 51
k[mixture]eff (E/N) ' (1− χ)k[carrier gas]
eff (E/N) (4.55)
+ χ
√2
me
∫ ∞ε=0
(σi − σa)(ε)εF[carrier gas]0 (ε, E/N)dε,
where k[carrier gas]eff is the effective ionization rate coefficient in the
pure carrier gas, σi and σa are the total ionization and attachmentcross sections of the sample gas, and F [carrier gas]
0 is the EEPF of thecarrier gas. When considering rather low E/N values, the ionizationof the sample gas can be neglected and equation (4.55) simplifies to
k[mixture]eff (E/N) ' (1− χ)k[carrier gas]
eff (E/N) (4.56)
− χ√
2
me
∫ ∞ε=0
σa(ε)εF[carrier gas]0 (ε, E/N)dε.
For the carrier gases N2 and CO2, complete sets of electron scatteringcross sections are available, for instance via the LXcat project [LXcat,PAB+2017]. In the present work, Biagi’s cross section sets [Biagi]are used for N2 and O2, and Phelps [Phelps] for CO2. The effectiveionization rate coefficient k[carrier gas]
eff and EEDF for these gasesare obtained by solving the Boltzmann equation in the two-termapproximation, using the solver Bolsig+ [HP2005]. The diagram offigure 4.13 should help the reader to keep track of the data sources.Using equation (4.55), only the ionization and attachment crosssections of the sample gas (and not a complete cross section setof the sample gas) are required for calculating keff in diluted gasmixtures. The attachment cross section σa may be estimated throughequation (4.55) using measurements of keff . Equation (4.55) can bediscretized into a matrix problem of the form
Aσa = b, (4.57)
where A and b are known (in function of the quantities keff , kbeff , F0
and σi), and σa needs to be determined [RHCF2015]. This constitutesa so-called discrete ill-posed problem. To limit the amplification
52 4 Measurement and analysis techniques
keff in diluted gasmixtures
keff in diluted gasmixture
keff in pure buffergas
keff in pure buffergas
Linear inversionmethod [RHCF2015]
Bolsig+[HP2005]
Direct calculationequation (4.55)
Swarm data
LXcat [LXcat] Beam data
Attachment crosssection of sample gas
Ionization crosssection of sample gas
Full cross section setfor N2 [Biagi]
Full cross section setfor CO2 [Phelps]
EEDF EEDF
Attachment crosssection of sample gas
Figure 4.13: Data flow between rate coefficients (top row) and elec-tron scattering cross sections (bottom row). keff : effective ionizationrate coefficient. EEDF: electron energy distribution function.
of measurement noise during the inversion process, the Tikhonovregularization method proposes to minimize
‖Aσa − b‖22 + λ ‖σa‖22 , (4.58)
which is equivalent to minimizing∥∥∥∥(AλI)σa −
(b0
)∥∥∥∥2
2
, (4.59)
where I is the identity matrix, and λ ∈]0;+∞[ is a regularizationparameter to be chosen. The choice of the regularization parameteris a compromise between a ’good’ solution (‖Aσa − b‖22 → 0) anda ’smooth’ solution (λ ‖σa‖22 → 0). This trade-off is best visualizedwith the so-called L-curve, which is obtained by plotting ‖Aσa − b‖22versus λ ‖σa‖22. An example of the L-curve obtained when calculating
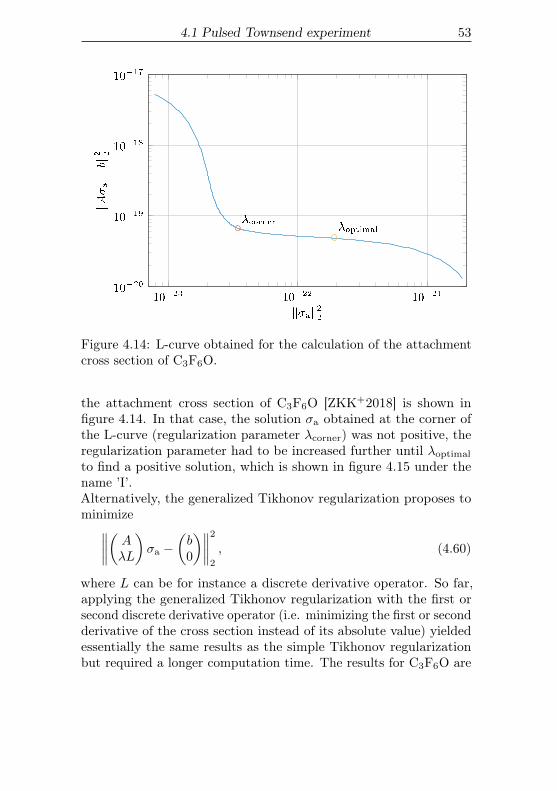
4.1 Pulsed Townsend experiment 53
10�23
10�22
10�21
10�20
10�19
10�18
10�17
�corner�optimal
k�ak2
2
kA�a�bk2 2
Figure 4.14: L-curve obtained for the calculation of the attachmentcross section of C3F6O.
the attachment cross section of C3F6O [ZKK+2018] is shown infigure 4.14. In that case, the solution σa obtained at the corner ofthe L-curve (regularization parameter λcorner) was not positive, theregularization parameter had to be increased further until λoptimal
to find a positive solution, which is shown in figure 4.15 under thename ’I’.Alternatively, the generalized Tikhonov regularization proposes tominimize∥∥∥∥( AλL
)σa −
(b0
)∥∥∥∥2
2
, (4.60)
where L can be for instance a discrete derivative operator. So far,applying the generalized Tikhonov regularization with the first orsecond discrete derivative operator (i.e. minimizing the first or secondderivative of the cross section instead of its absolute value) yieldedessentially the same results as the simple Tikhonov regularizationbut required a longer computation time. The results for C3F6O are
54 4 Measurement and analysis techniques
0 1 2 3 4 5 6 70
0:5
1
1:5
" (eV)
�a(10�21m
2)
I
L1L2
Figure 4.15: Attachment cross section of C3F6O obtained by mini-mizing the norm of the solution (L = I), its first derivative (L = L1)or its second derivative (L = L2).
shown in figure 4.15.The linear inversion method has the advantage to yield a uniquesolution, since it requires no initial guess of the solution, in contrastto iterative methods [PDM+2009].For comparison with the linear inversion method, a two or three-termGaussian expansion was used, i.e. the attachment cross section wasfitted by the sum of two or three Gaussian functions
σa(ε) =
3∑i=1
cie−(ε−εi)2/(2s2i ), (4.61)
where ci, εi and si are the amplitude, position and width of theGaussian peaks, determined by the fit. This latter method is usefulto verify the energy range and magnitude of the attachment crosssection, but it is of course a strong assumption on the shape of thecross section.
4.2 Electron beam experiments 55
4.2 Electron beam experiments
During the course of this thesis, two of the gases under study, namelyc-C4F8O and C3F6O, were also investigated in electron beam ex-periments by the group of Juraj Fedor (which was initially based inFribourg, Switzerland, then moved to Prague, Czech Republic), andthe results were compared to the present swarm measurements. Forcompleteness, the experimental setups and methods used by Fedor etal. are briefly described here. Three experimental setups were used.
4.2.1 Quantitative pulsed electron attachmentspectrometer
The first setup is a quantitative electron attachment spectrometerwith time-of-flight mass analyzer [FMA2008,MFIA2008,MFA2009].The electrons emitted from a hot filament are selected according totheir kinetic energy in a trochoidal electron monochromator. Theyare then accelerated to the desired energy and pass through a col-lision cell filled with the gas under study (which is stagnant). Thepressure in the collision cell is monitored with a capacitance manome-ter and is varied from 1 to 10 × 10−2 Pa. This is sufficiently lowpressure to ensure that each electron may collide only once with a gasmolecule, and that the collision probability of created anions withother molecules is negligible on timescale of the anion extraction.The electron current is monitored by a Faraday cup located behindthe collision cell.The experiment is pulsed with 50 kHz frequency. The electron beampasses the collision chamber during 200 ns while it is field-free. Afteradditional 200ns, a negative voltage of −300V is pulsed acrossthe chamber which pushes the anions formed in the collision celltowards the ion time-of-flight (TOF) mass analyzer in the directionperpendicular to the electron beam. The collision cell, ion opticsand the ion detection scheme were designed such that the extraction,transmission and the detection efficiency are independent of the ionmass or initial kinetic energy [MFA2009].The ion time-of-flight (TOF) mass analyzer, shown schematicallyin figure 4.16, works as follows: the anions are detected with a mi-

56 4 Measurement and analysis techniques
Figure 4.16: Beam experiment time-of-flight (TOF) tube. Theorientation of electron beam is perpendicular to the paper plane.MCP: Micro-Channel Plate used for the detection of ions.
crochannel plate (MCP), counted, and their arrival times are analyzed.The time between the anion production in the collision chamber andtheir detection in the MCP is in the order of microseconds.
The results are two-dimensional maps of ion count as a function ofelectron energy and of arrival time. This allows the extraction ofboth negative ion mass spectra and ion-yield versus electron-energyfor each anion.
The electron-energy scale is calibrated using the onset of O− signalfrom CO2 at 3.99 eV. The shape of the O− peak is also used todetermine the energy resolution of the electron beam as describedin [JMMF2014]. The electron-beam resolution in the current experi-ment is approximately 250 meV.
In order to obtain absolute cross sections from the ion yield curves,the latter are normalized against a well-known cross section for theproduction of O− from CO2 at 4.4 eV band [JKM+2013] (integratedcross section of 13.3 eV pm2). The uncertainty of the obtainedabsolute cross sections is ±20% (two standard deviations). It isobtained as a combination or the error of the relative measurements(± 15%) and of the error of the absolute cross section of O− used fornormalization. The latter is taken as ± 15% in view of the resultsfrom various groups listed in [JKM+2013].
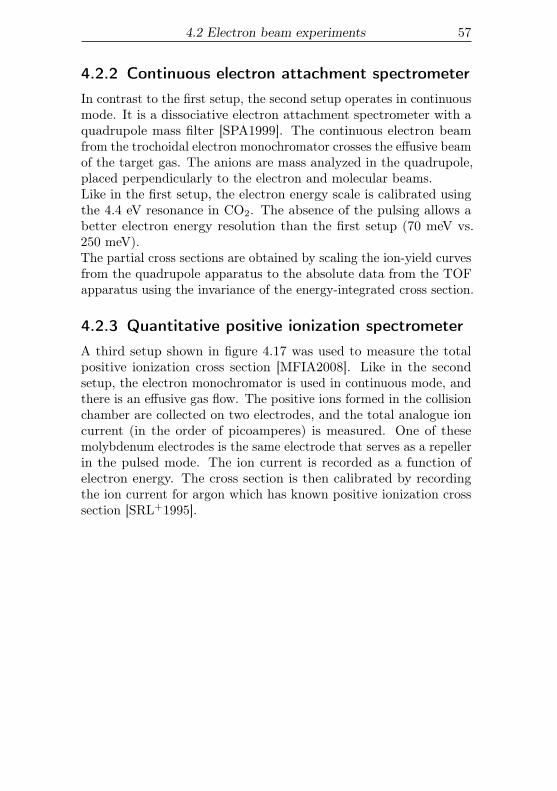
4.2 Electron beam experiments 57
4.2.2 Continuous electron attachment spectrometerIn contrast to the first setup, the second setup operates in continuousmode. It is a dissociative electron attachment spectrometer with aquadrupole mass filter [SPA1999]. The continuous electron beamfrom the trochoidal electron monochromator crosses the effusive beamof the target gas. The anions are mass analyzed in the quadrupole,placed perpendicularly to the electron and molecular beams.Like in the first setup, the electron energy scale is calibrated usingthe 4.4 eV resonance in CO2. The absence of the pulsing allows abetter electron energy resolution than the first setup (70 meV vs.250 meV).The partial cross sections are obtained by scaling the ion-yield curvesfrom the quadrupole apparatus to the absolute data from the TOFapparatus using the invariance of the energy-integrated cross section.
4.2.3 Quantitative positive ionization spectrometerA third setup shown in figure 4.17 was used to measure the totalpositive ionization cross section [MFIA2008]. Like in the secondsetup, the electron monochromator is used in continuous mode, andthere is an effusive gas flow. The positive ions formed in the collisionchamber are collected on two electrodes, and the total analogue ioncurrent (in the order of picoamperes) is measured. One of thesemolybdenum electrodes is the same electrode that serves as a repellerin the pulsed mode. The ion current is recorded as a function ofelectron energy. The cross section is then calibrated by recordingthe ion current for argon which has known positive ionization crosssection [SRL+1995].
58 4 Measurement and analysis techniques
Figure 4.17: Beam experiment collision chamber and electrodescollecting the positive ions, connected to femtoamperemeter.
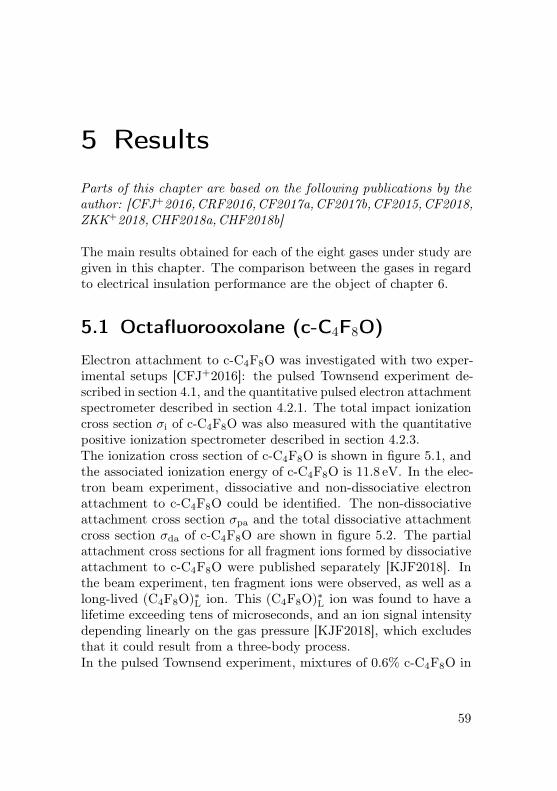
5 Results
Parts of this chapter are based on the following publications by theauthor: [CFJ+2016,CRF2016,CF2017a,CF2017b,CF2015,CF2018,ZKK+2018,CHF2018a,CHF2018b]
The main results obtained for each of the eight gases under study aregiven in this chapter. The comparison between the gases in regardto electrical insulation performance are the object of chapter 6.
5.1 Octafluorooxolane (c-C4F8O)
Electron attachment to c-C4F8O was investigated with two exper-imental setups [CFJ+2016]: the pulsed Townsend experiment de-scribed in section 4.1, and the quantitative pulsed electron attachmentspectrometer described in section 4.2.1. The total impact ionizationcross section σi of c-C4F8O was also measured with the quantitativepositive ionization spectrometer described in section 4.2.3.The ionization cross section of c-C4F8O is shown in figure 5.1, andthe associated ionization energy of c-C4F8O is 11.8 eV. In the elec-tron beam experiment, dissociative and non-dissociative electronattachment to c-C4F8O could be identified. The non-dissociativeattachment cross section σpa and the total dissociative attachmentcross section σda of c-C4F8O are shown in figure 5.2. The partialattachment cross sections for all fragment ions formed by dissociativeattachment to c-C4F8O were published separately [KJF2018]. Inthe beam experiment, ten fragment ions were observed, as well as along-lived (C4F8O)∗L ion. This (C4F8O)∗L ion was found to have alifetime exceeding tens of microseconds, and an ion signal intensitydepending linearly on the gas pressure [KJF2018], which excludesthat it could result from a three-body process.In the pulsed Townsend experiment, mixtures of 0.6% c-C4F8O in
59
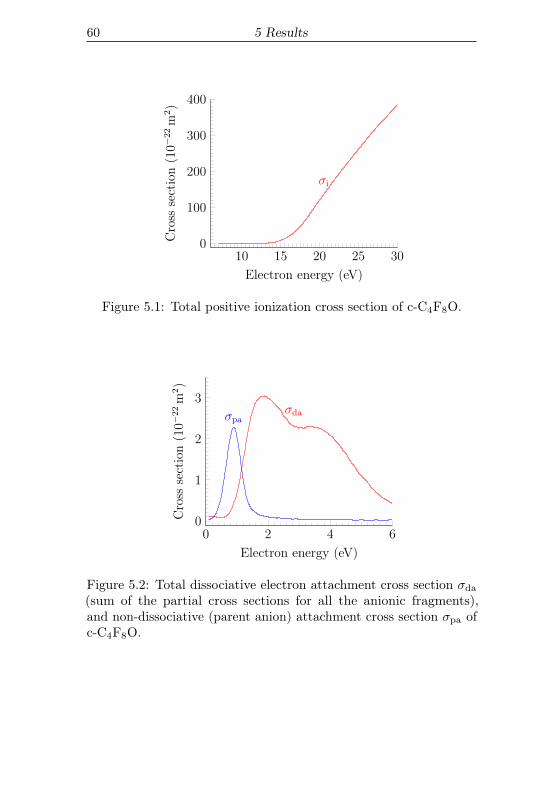
60 5 Results
10 15 20 25 300
100
200
300
400
σi
Electron energy (eV)
Cro
ssse
ctio
n(10−
22m
2)
Figure 5.1: Total positive ionization cross section of c-C4F8O.
0 2 4 60
1
2
3
σpaσda
Electron energy (eV)
Cro
ssse
ctio
n(10−
22m
2)
Figure 5.2: Total dissociative electron attachment cross section σda
(sum of the partial cross sections for all the anionic fragments),and non-dissociative (parent anion) attachment cross section σpa ofc-C4F8O.
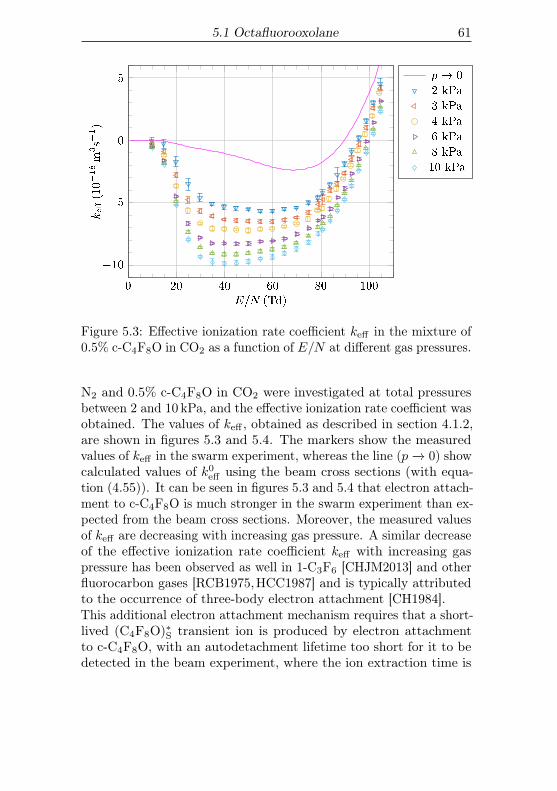
5.1 Octafluorooxolane 61
0 20 40 60 80 100
�10
�5
0
5
E=N (Td)
ke�(10�18m
3s�
1)
p! 0
2 kPa
3 kPa
4 kPa
6 kPa
8 kPa
10 kPa
Figure 5.3: Effective ionization rate coefficient keff in the mixture of0.5% c-C4F8O in CO2 as a function of E/N at different gas pressures.
N2 and 0.5% c-C4F8O in CO2 were investigated at total pressuresbetween 2 and 10 kPa, and the effective ionization rate coefficient wasobtained. The values of keff , obtained as described in section 4.1.2,are shown in figures 5.3 and 5.4. The markers show the measuredvalues of keff in the swarm experiment, whereas the line (p −→ 0) showcalculated values of k0
eff using the beam cross sections (with equa-tion (4.55)). It can be seen in figures 5.3 and 5.4 that electron attach-ment to c-C4F8O is much stronger in the swarm experiment than ex-pected from the beam cross sections. Moreover, the measured valuesof keff are decreasing with increasing gas pressure. A similar decreaseof the effective ionization rate coefficient keff with increasing gaspressure has been observed as well in 1-C3F6 [CHJM2013] and otherfluorocarbon gases [RCB1975,HCC1987] and is typically attributedto the occurrence of three-body electron attachment [CH1984].This additional electron attachment mechanism requires that a short-lived (C4F8O)∗S transient ion is produced by electron attachmentto c-C4F8O, with an autodetachment lifetime too short for it to bedetected in the beam experiment, where the ion extraction time is
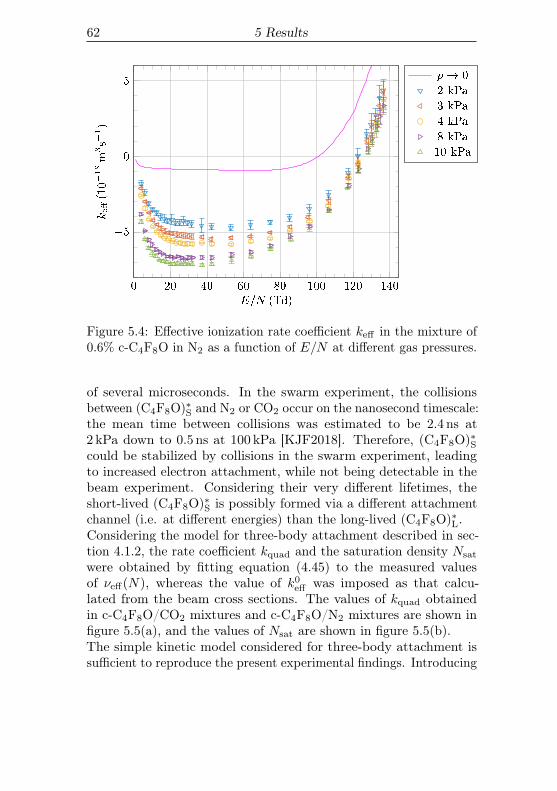
62 5 Results
0 20 40 60 80 100 120 140
�5
0
5
E=N (Td)
ke�(10�18m
3s�
1)
p! 0
2 kPa
3 kPa
4 kPa
8 kPa
10 kPa
Figure 5.4: Effective ionization rate coefficient keff in the mixture of0.6% c-C4F8O in N2 as a function of E/N at different gas pressures.
of several microseconds. In the swarm experiment, the collisionsbetween (C4F8O)∗S and N2 or CO2 occur on the nanosecond timescale:the mean time between collisions was estimated to be 2.4 ns at2 kPa down to 0.5 ns at 100 kPa [KJF2018]. Therefore, (C4F8O)∗Scould be stabilized by collisions in the swarm experiment, leadingto increased electron attachment, while not being detectable in thebeam experiment. Considering their very different lifetimes, theshort-lived (C4F8O)∗S is possibly formed via a different attachmentchannel (i.e. at different energies) than the long-lived (C4F8O)∗L.Considering the model for three-body attachment described in sec-tion 4.1.2, the rate coefficient kquad and the saturation density Nsat
were obtained by fitting equation (4.45) to the measured valuesof νeff(N), whereas the value of k0
eff was imposed as that calcu-lated from the beam cross sections. The values of kquad obtainedin c-C4F8O/CO2 mixtures and c-C4F8O/N2 mixtures are shown infigure 5.5(a), and the values of Nsat are shown in figure 5.5(b).The simple kinetic model considered for three-body attachment issufficient to reproduce the present experimental findings. Introducing
5.1 Octafluorooxolane 63
additional kinetic processes involving for instance ion clusters cannotbe justified based on these findings alone, but it is clear that suchprocesses could occur. The problem of non-uniqueness of the kineticmodel derived from swarm data is well-known [PSN+2002007]. Inthe case of c-C4F8O for instance, it was suggested that the electronattachment occurs via ring opening [SD2018], so that the (C4F8O)∗Ldetected and identified by its mass in the electron beam experimentis not necessarily cyclic.
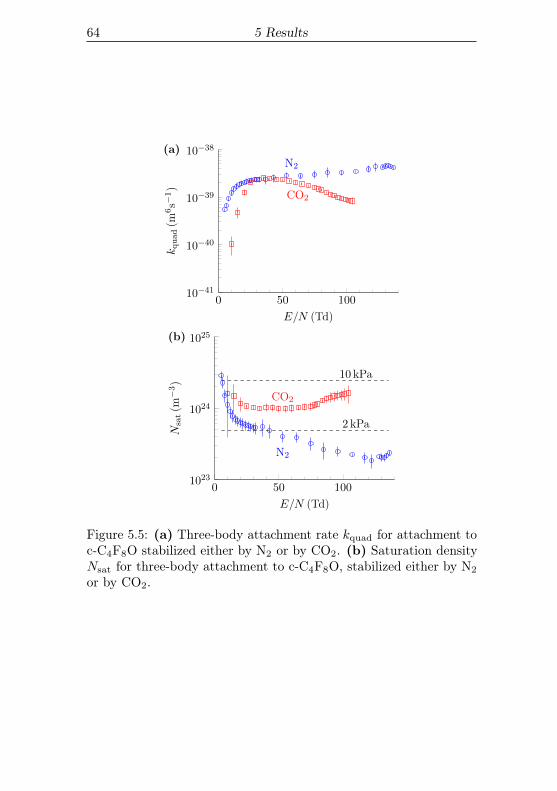
64 5 Results
0 50 10010−41
10−40
10−39
10−38
N2
CO2
(a)
E/N (Td)
kquad(m
6s−
1)
0 50 1001023
1024
1025
10 kPa
2 kPa
N2
CO2
(b)
E/N (Td)
Nsat(m
−3)
Figure 5.5: (a) Three-body attachment rate kquad for attachment toc-C4F8O stabilized either by N2 or by CO2. (b) Saturation densityNsat for three-body attachment to c-C4F8O, stabilized either by N2
or by CO2.
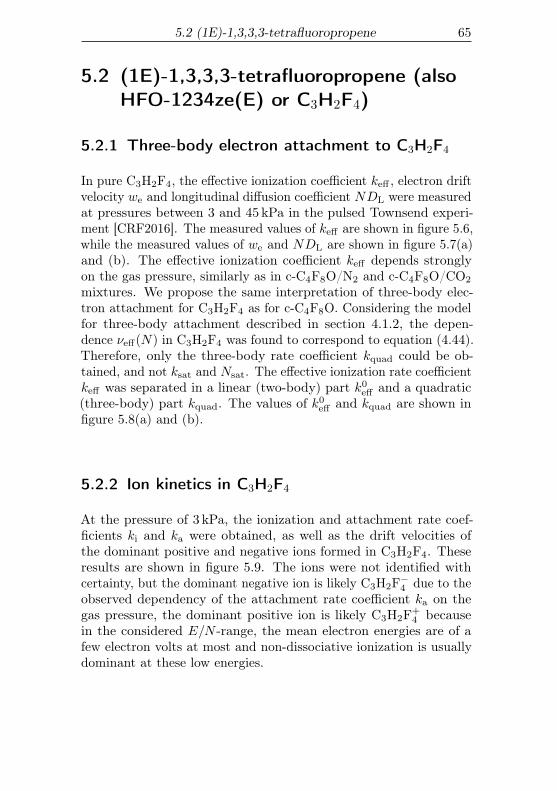
5.2 (1E)-1,3,3,3-tetrafluoropropene 65
5.2 (1E)-1,3,3,3-tetrafluoropropene (alsoHFO-1234ze(E) or C3H2F4)
5.2.1 Three-body electron attachment to C3H2F4
In pure C3H2F4, the effective ionization coefficient keff , electron driftvelocity we and longitudinal diffusion coefficient NDL were measuredat pressures between 3 and 45 kPa in the pulsed Townsend experi-ment [CRF2016]. The measured values of keff are shown in figure 5.6,while the measured values of we and NDL are shown in figure 5.7(a)and (b). The effective ionization coefficient keff depends stronglyon the gas pressure, similarly as in c-C4F8O/N2 and c-C4F8O/CO2
mixtures. We propose the same interpretation of three-body elec-tron attachment for C3H2F4 as for c-C4F8O. Considering the modelfor three-body attachment described in section 4.1.2, the depen-dence νeff(N) in C3H2F4 was found to correspond to equation (4.44).Therefore, only the three-body rate coefficient kquad could be ob-tained, and not ksat and Nsat. The effective ionization rate coefficientkeff was separated in a linear (two-body) part k0
eff and a quadratic(three-body) part kquad. The values of k0
eff and kquad are shown infigure 5.8(a) and (b).
5.2.2 Ion kinetics in C3H2F4
At the pressure of 3 kPa, the ionization and attachment rate coef-ficients ki and ka were obtained, as well as the drift velocities ofthe dominant positive and negative ions formed in C3H2F4. Theseresults are shown in figure 5.9. The ions were not identified withcertainty, but the dominant negative ion is likely C3H2F−4 due to theobserved dependency of the attachment rate coefficient ka on thegas pressure, the dominant positive ion is likely C3H2F+
4 becausein the considered E/N -range, the mean electron energies are of afew electron volts at most and non-dissociative ionization is usuallydominant at these low energies.
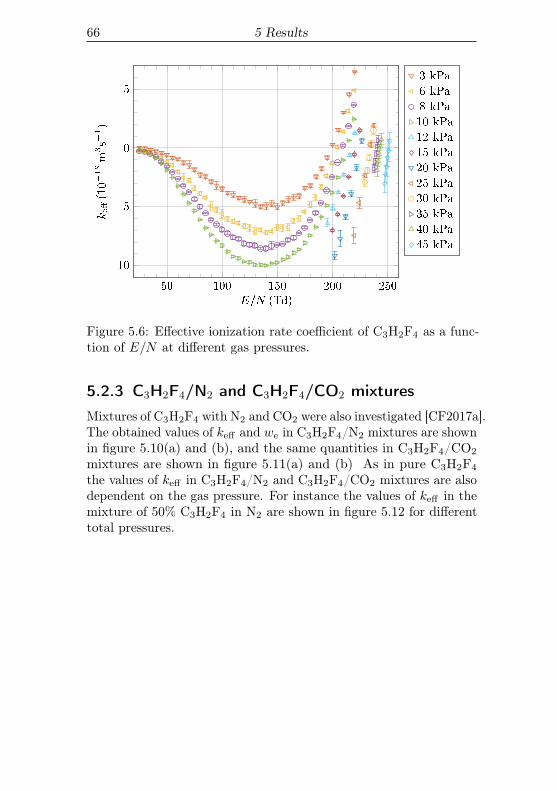
66 5 Results
50 100 150 200 250
�10
�5
0
5
E=N (Td)
ke�(10�18m
3s�
1)
3 kPa
6 kPa
8 kPa
10 kPa
12 kPa
15 kPa
20 kPa
25 kPa
30 kPa
35 kPa
40 kPa
45 kPa
Figure 5.6: Effective ionization rate coefficient of C3H2F4 as a func-tion of E/N at different gas pressures.
5.2.3 C3H2F4/N2 and C3H2F4/CO2 mixturesMixtures of C3H2F4 with N2 and CO2 were also investigated [CF2017a].The obtained values of keff and we in C3H2F4/N2 mixtures are shownin figure 5.10(a) and (b), and the same quantities in C3H2F4/CO2
mixtures are shown in figure 5.11(a) and (b) As in pure C3H2F4
the values of keff in C3H2F4/N2 and C3H2F4/CO2 mixtures are alsodependent on the gas pressure. For instance the values of keff in themixture of 50% C3H2F4 in N2 are shown in figure 5.12 for differenttotal pressures.
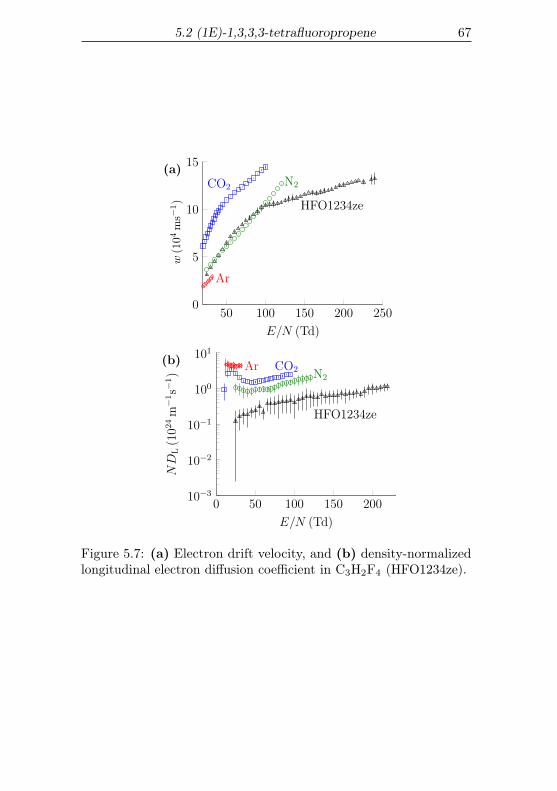
5.2 (1E)-1,3,3,3-tetrafluoropropene 67
50 100 150 200 2500
5
10
15
N2CO2
Ar
HFO1234ze
(a)
E/N (Td)
w(104
ms−
1)
0 50 100 150 20010−3
10−2
10−1
100
101
N2CO2Ar
HFO1234ze
(b)
E/N (Td)
ND
L(102
4m
−1s−
1)
Figure 5.7: (a) Electron drift velocity, and (b) density-normalizedlongitudinal electron diffusion coefficient in C3H2F4 (HFO1234ze).
68 5 Results
50 100 150 200 250
0
20
40(a)
E/N (Td)
(k
ef
f 1
0−18m
3s−
1)
0
50 100 150 200 250
0
1
2
3
(b)
E/N (Td)
kquad(10−
42m
6s−
1)
Figure 5.8: (a) Two-body rate coefficient k0eff for effective ionization
in C3H2F4. (b) Rate coefficient kquad for three-body attachment toC3H2F4.
5.2 (1E)-1,3,3,3-tetrafluoropropene 69
120 140 160 180 200 220
−5
0
5
10
15
keff
ki
ka
(a)
E/N (Td)
k(10−
18m
3s−
1)
120 140 160 180 200 2200
100
200
300
p
n
(b)
E/N (Td)
(ms−
1)
w
w
w
Figure 5.9: (a) ionization and attachment rate coefficients ki andka, and (b) positive and negative ion drift velocities wp and wn inC3H2F4.
70 5 Results
0 50 100 150 200
-10
-8
-6
-4
-2
0
2N2
10%
29:2%
50:1%
75:1%
HFO1234ze
(a)
E=N (Td)
ke�(10�18m3s�
1)
0 50 100 150 2000
2
4
6
8
10
12
14(b)
E=N (Td)
w(104ms�1)
Figure 5.10: (a) Effective ionization rate coefficient and (b) electrondrift velocity in C3H2F4/N2 mixtures at fixed total pressure of 10 kPa.The percentage of C3H2F4 is indicated in (a).
5.2 (1E)-1,3,3,3-tetrafluoropropene 71
0 50 100 150 200
-10
-8
-6
-4
-2
0
2CO2 10%
30:1%
50%
75%
HFO1234ze
(a)
E=N (Td)
ke�(10�18m3s�
1)
0 50 100 150 2000
5
10
15
(b)
E=N (Td)
w(104ms�1)
Figure 5.11: (a) Effective ionization rate coefficient and (b) electrondrift velocity in C3H2F4/CO2 mixtures at fixed total pressure of10 kPa. The percentage of C3H2F4 is indicated in (a).
72 5 Results
0 20 40 60 80 100 120 140
-4
-2
0
23 kPa4 kPa6 kPa8 kPa10 kPa
E=N (Td)
ke�(10�18m3s�
1)
Figure 5.12: Effective ionization rate coefficient in the mixture of50% C3H2F4 in N2 at different pressures between 3 and 10 kPa.
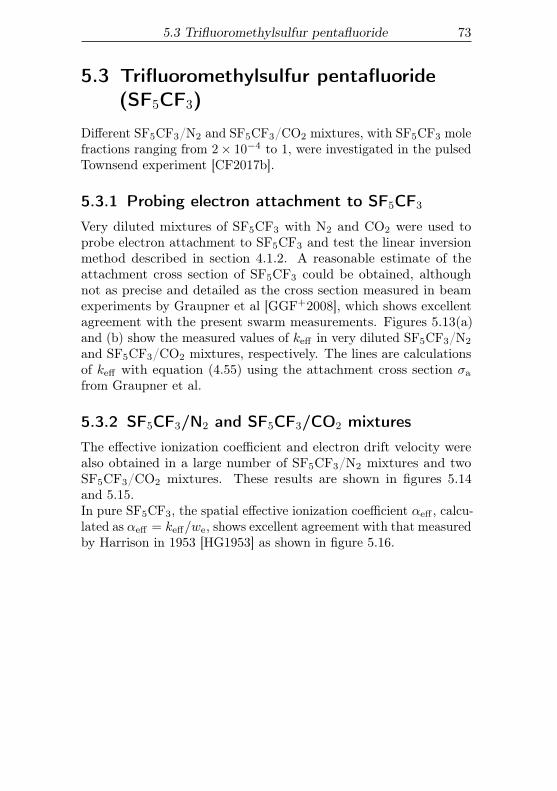
5.3 Trifluoromethylsulfur pentafluoride 73
5.3 Trifluoromethylsulfur pentafluoride(SF5CF3)
Different SF5CF3/N2 and SF5CF3/CO2 mixtures, with SF5CF3 molefractions ranging from 2× 10⁻⁴ to 1, were investigated in the pulsedTownsend experiment [CF2017b].
5.3.1 Probing electron attachment to SF5CF3
Very diluted mixtures of SF5CF3 with N2 and CO2 were used toprobe electron attachment to SF5CF3 and test the linear inversionmethod described in section 4.1.2. A reasonable estimate of theattachment cross section of SF5CF3 could be obtained, althoughnot as precise and detailed as the cross section measured in beamexperiments by Graupner et al [GGF+2008], which shows excellentagreement with the present swarm measurements. Figures 5.13(a)and (b) show the measured values of keff in very diluted SF5CF3/N2
and SF5CF3/CO2 mixtures, respectively. The lines are calculationsof keff with equation (4.55) using the attachment cross section σa
from Graupner et al.
5.3.2 SF5CF3/N2 and SF5CF3/CO2 mixturesThe effective ionization coefficient and electron drift velocity werealso obtained in a large number of SF5CF3/N2 mixtures and twoSF5CF3/CO2 mixtures. These results are shown in figures 5.14and 5.15.In pure SF5CF3, the spatial effective ionization coefficient αeff , calcu-lated as αeff = keff/we, shows excellent agreement with that measuredby Harrison in 1953 [HG1953] as shown in figure 5.16.
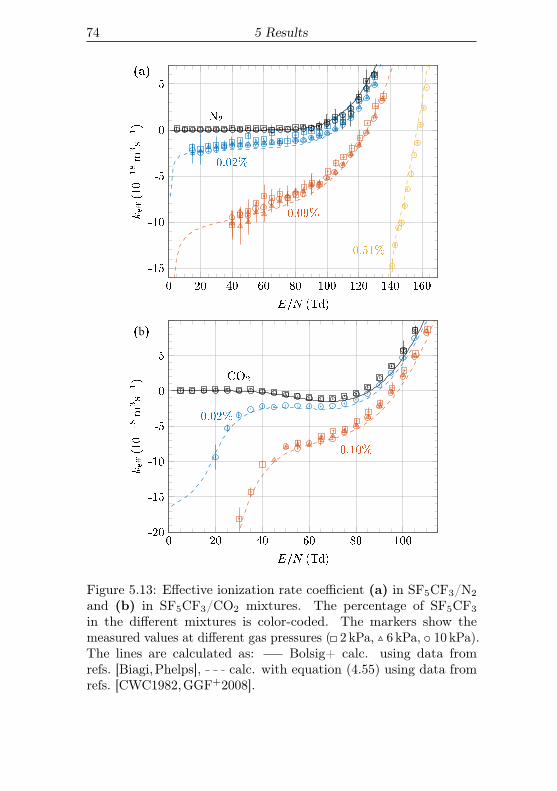
74 5 Results
0 20 40 60 80 100 120 140 160
-15
-10
-5
0
5
N2
0:02%
0:09%
0:51%
(a)
E=N (Td)
ke�(10�18m
3s�
1)
0 20 40 60 80 100-20
-15
-10
-5
0
5
CO2
0:02%
0:10%
(b)
E=N (Td)
ke�(10�18m
3s�
1)
Figure 5.13: Effective ionization rate coefficient (a) in SF5CF3/N2
and (b) in SF5CF3/CO2 mixtures. The percentage of SF5CF3
in the different mixtures is color-coded. The markers show themeasured values at different gas pressures ( 2 kPa, 6 kPa, 10 kPa).The lines are calculated as: Bolsig+ calc. using data fromrefs. [Biagi,Phelps], calc. with equation (4.55) using data fromrefs. [CWC1982,GGF+2008].
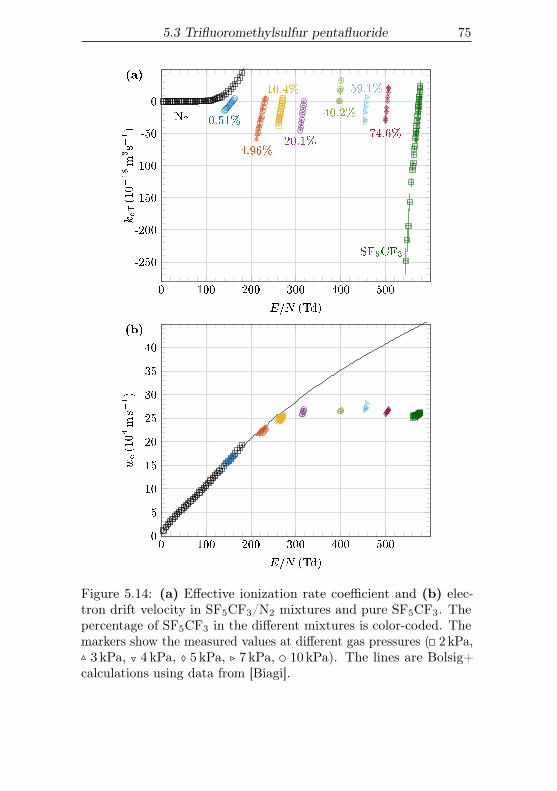
5.3 Trifluoromethylsulfur pentafluoride 75
0 100 200 300 400 500
-250
-200
-150
-100
-50
0
N2 0:51%
4:96%
10:4%
20:1%
40:2%
59:1%
74:6%
SF5CF3
(a)
E=N (Td)
ke�(10�18m
3s�
1)
0 100 200 300 400 5000
5
10
15
20
25
30
35
40
(b)
E=N (Td)
we(104ms�1)
Figure 5.14: (a) Effective ionization rate coefficient and (b) elec-tron drift velocity in SF5CF3/N2 mixtures and pure SF5CF3. Thepercentage of SF5CF3 in the different mixtures is color-coded. Themarkers show the measured values at different gas pressures ( 2 kPa,3 kPa, 4 kPa, 5 kPa, 7 kPa, 10 kPa). The lines are Bolsig+
calculations using data from [Biagi].
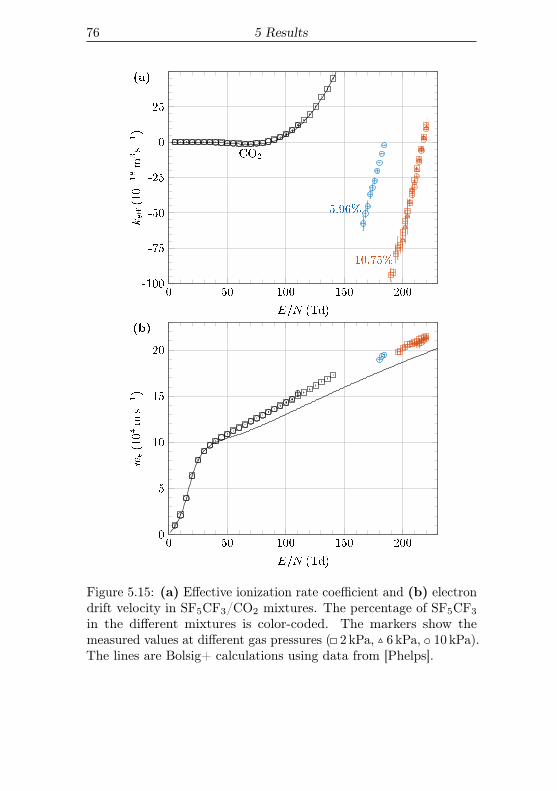
76 5 Results
0 50 100 150 200-100
-75
-50
-25
0
25
CO2
5:96%
10:75%
(a)
E=N (Td)
ke�(10�18m
3s�
1)
0 50 100 150 2000
5
10
15
20
(b)
E=N (Td)
we(104ms�1)
Figure 5.15: (a) Effective ionization rate coefficient and (b) electrondrift velocity in SF5CF3/CO2 mixtures. The percentage of SF5CF3
in the different mixtures is color-coded. The markers show themeasured values at different gas pressures ( 2 kPa, 6 kPa, 10 kPa).The lines are Bolsig+ calculations using data from [Phelps].
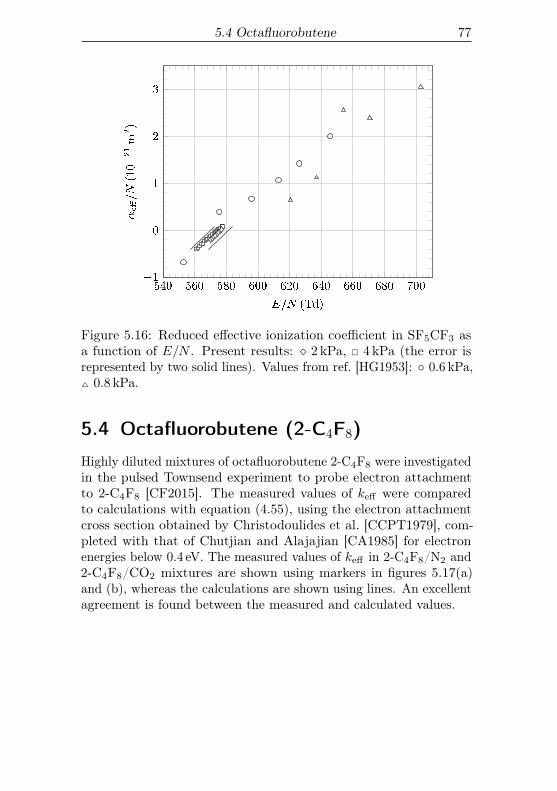
5.4 Octafluorobutene 77
540 560 580 600 620 640 660 680 700�1
0
1
2
3
E=N (Td)
�e�=N
(10�21m
2)
Figure 5.16: Reduced effective ionization coefficient in SF5CF3 asa function of E/N . Present results: � 2 kPa, � 4 kPa (the error isrepresented by two solid lines). Values from ref. [HG1953]: ◦ 0.6 kPa,4 0.8 kPa.
5.4 Octafluorobutene (2-C4F8)
Highly diluted mixtures of octafluorobutene 2-C4F8 were investigatedin the pulsed Townsend experiment to probe electron attachmentto 2-C4F8 [CF2015]. The measured values of keff were comparedto calculations with equation (4.55), using the electron attachmentcross section obtained by Christodoulides et al. [CCPT1979], com-pleted with that of Chutjian and Alajajian [CA1985] for electronenergies below 0.4 eV. The measured values of keff in 2-C4F8/N2 and2-C4F8/CO2 mixtures are shown using markers in figures 5.17(a)and (b), whereas the calculations are shown using lines. An excellentagreement is found between the measured and calculated values.
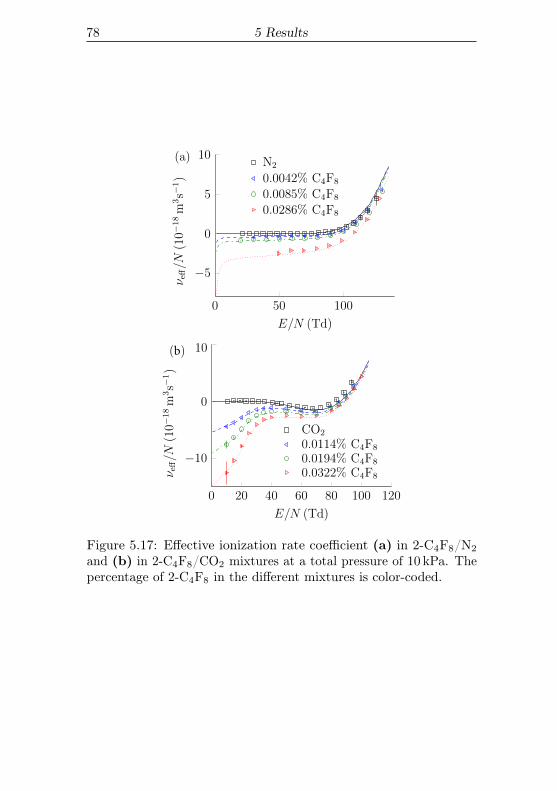
78 5 Results
0 50 100
−5
0
5
10(a) N2
0.0042% C4F8
0.0085% C4F8
0.0286% C4F8
E/N (Td)
ν eff/N
(10−
18m
3s−
1)
0 20 40 60 80 100 120
−10
0
(b) 10
CO2
0.0114% C4F8
0.0194% C4F8
0.0322% C4F8
E/N (Td)
ν eff/N
(10−
18m
3s−
1)
Figure 5.17: Effective ionization rate coefficient (a) in 2-C4F8/N2
and (b) in 2-C4F8/CO2 mixtures at a total pressure of 10 kPa. Thepercentage of 2-C4F8 in the different mixtures is color-coded.
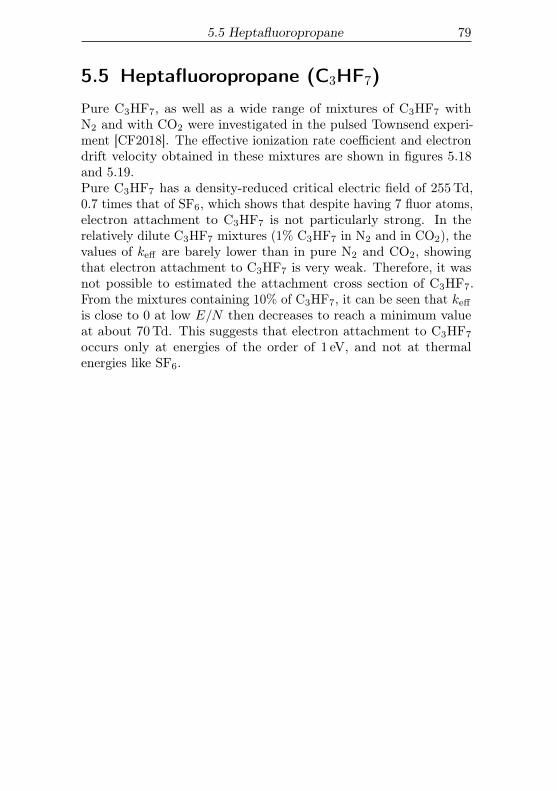
5.5 Heptafluoropropane 79
5.5 Heptafluoropropane (C3HF7)
Pure C3HF7, as well as a wide range of mixtures of C3HF7 withN2 and with CO2 were investigated in the pulsed Townsend experi-ment [CF2018]. The effective ionization rate coefficient and electrondrift velocity obtained in these mixtures are shown in figures 5.18and 5.19.Pure C3HF7 has a density-reduced critical electric field of 255Td,0.7 times that of SF6, which shows that despite having 7 fluor atoms,electron attachment to C3HF7 is not particularly strong. In therelatively dilute C3HF7 mixtures (1% C3HF7 in N2 and in CO2), thevalues of keff are barely lower than in pure N2 and CO2, showingthat electron attachment to C3HF7 is very weak. Therefore, it wasnot possible to estimated the attachment cross section of C3HF7.From the mixtures containing 10% of C3HF7, it can be seen that keff
is close to 0 at low E/N then decreases to reach a minimum valueat about 70Td. This suggests that electron attachment to C3HF7
occurs only at energies of the order of 1 eV, and not at thermalenergies like SF6.
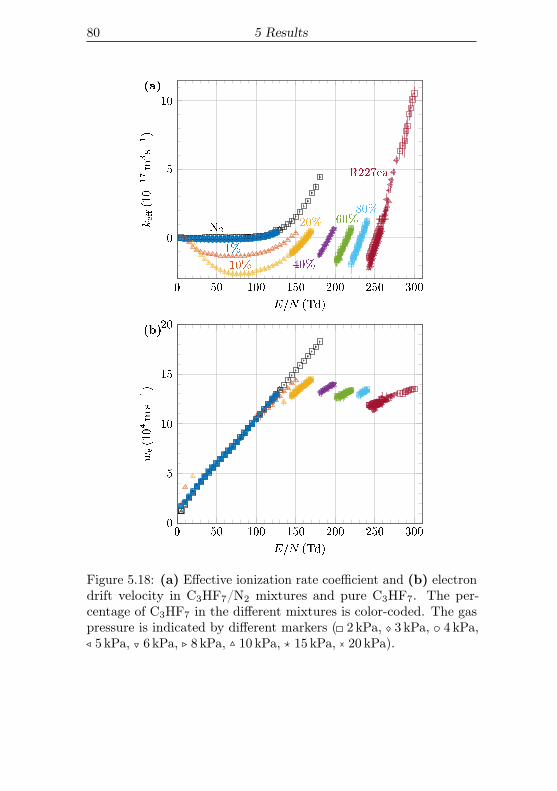
80 5 Results
0 50 100 150 200 250 300
0
5
10
N2
1%
10%
20%
40%
60%80%
R227ea
(a)
E=N (Td)
ke�(10�17m
3s�
1)
0 50 100 150 200 250 3000
5
10
15
20(b)
E=N (Td)
we(104ms�1)
Figure 5.18: (a) Effective ionization rate coefficient and (b) electrondrift velocity in C3HF7/N2 mixtures and pure C3HF7. The per-centage of C3HF7 in the different mixtures is color-coded. The gaspressure is indicated by different markers ( 2 kPa, 3 kPa, 4 kPa,5 kPa, 6 kPa, 8 kPa, 10 kPa, 15 kPa, 20 kPa).
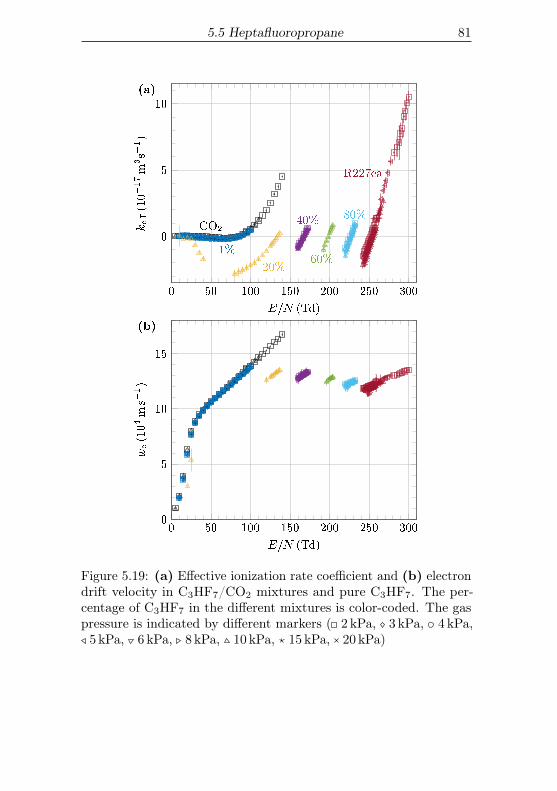
5.5 Heptafluoropropane 81
0 50 100 150 200 250 300
0
5
10
CO2
1%
20%
40%
60%
80%
R227ea
(a)
E=N (Td)
ke�(10�17m
3s�
1)
0 50 100 150 200 250 3000
5
10
15
(b)
E=N (Td)
we(104ms�1)
Figure 5.19: (a) Effective ionization rate coefficient and (b) electrondrift velocity in C3HF7/CO2 mixtures and pure C3HF7. The per-centage of C3HF7 in the different mixtures is color-coded. The gaspressure is indicated by different markers ( 2 kPa, 3 kPa, 4 kPa,5 kPa, 6 kPa, 8 kPa, 10 kPa, 15 kPa, 20 kPa)
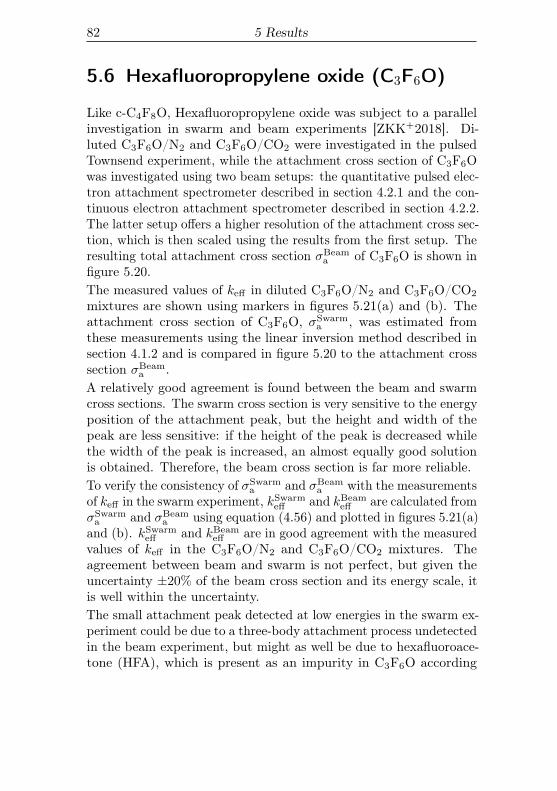
82 5 Results
5.6 Hexafluoropropylene oxide (C3F6O)
Like c-C4F8O, Hexafluoropropylene oxide was subject to a parallelinvestigation in swarm and beam experiments [ZKK+2018]. Di-luted C3F6O/N2 and C3F6O/CO2 were investigated in the pulsedTownsend experiment, while the attachment cross section of C3F6Owas investigated using two beam setups: the quantitative pulsed elec-tron attachment spectrometer described in section 4.2.1 and the con-tinuous electron attachment spectrometer described in section 4.2.2.The latter setup offers a higher resolution of the attachment cross sec-tion, which is then scaled using the results from the first setup. Theresulting total attachment cross section σBeam
a of C3F6O is shown infigure 5.20.The measured values of keff in diluted C3F6O/N2 and C3F6O/CO2
mixtures are shown using markers in figures 5.21(a) and (b). Theattachment cross section of C3F6O, σSwarm
a , was estimated fromthese measurements using the linear inversion method described insection 4.1.2 and is compared in figure 5.20 to the attachment crosssection σBeam
a .A relatively good agreement is found between the beam and swarmcross sections. The swarm cross section is very sensitive to the energyposition of the attachment peak, but the height and width of thepeak are less sensitive: if the height of the peak is decreased whilethe width of the peak is increased, an almost equally good solutionis obtained. Therefore, the beam cross section is far more reliable.To verify the consistency of σSwarm
a and σBeama with the measurements
of keff in the swarm experiment, kSwarmeff and kBeam
eff are calculated fromσSwarm
a and σBeama using equation (4.56) and plotted in figures 5.21(a)
and (b). kSwarmeff and kBeam
eff are in good agreement with the measuredvalues of keff in the C3F6O/N2 and C3F6O/CO2 mixtures. Theagreement between beam and swarm is not perfect, but given theuncertainty ±20% of the beam cross section and its energy scale, itis well within the uncertainty.The small attachment peak detected at low energies in the swarm ex-periment could be due to a three-body attachment process undetectedin the beam experiment, but might as well be due to hexafluoroace-tone (HFA), which is present as an impurity in C3F6O according
5.6 Hexafluoropropylene oxide 83
0 2 4 6 8 100
0:5
1
1:5
�Beam
�Swarm
" (eV)
�a(10�21m
2)
Figure 5.20: Total electron attachment cross section of HFPO fromthe beam experiment σBeam
a and from the swarm experiment σSwarma .
to the DuPont material datasheet. Electron attachment to HFAoccurs mostly at very low energies [IM2014], and could therefore beresponsible for the small atttachment peak observed near 0 eV.
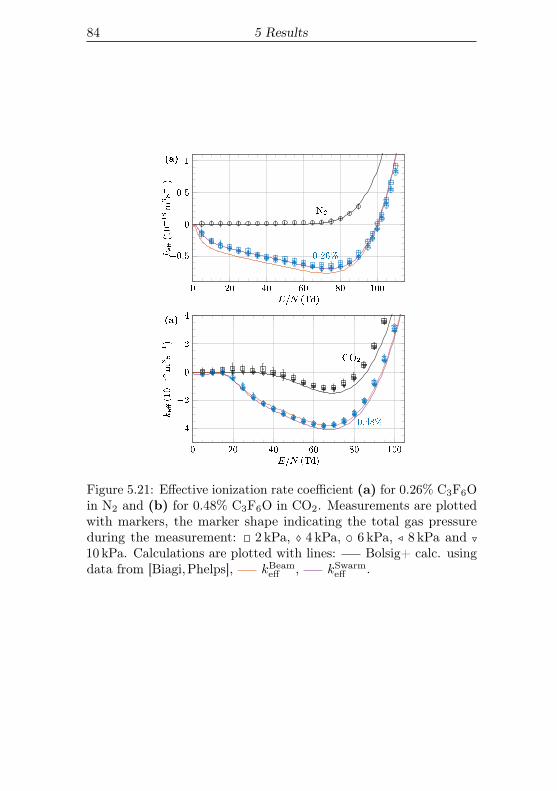
84 5 Results
0 20 40 60 80 100
�0:5
0
0:5
1
N2
0:26%
(a)
E=N (Td)
ke�(10�18m
3s�
1)
0 20 40 60 80 100
�4
�2
0
2
4
CO2
0:48%
(a)
E=N (Td)
ke�(10�18m
3s�
1)
Figure 5.21: Effective ionization rate coefficient (a) for 0.26% C3F6Oin N2 and (b) for 0.48% C3F6O in CO2. Measurements are plottedwith markers, the marker shape indicating the total gas pressureduring the measurement: 2 kPa, 4 kPa, 6 kPa, 8 kPa and10 kPa. Calculations are plotted with lines: Bolsig+ calc. usingdata from [Biagi,Phelps], kBeam
eff , kSwarmeff .
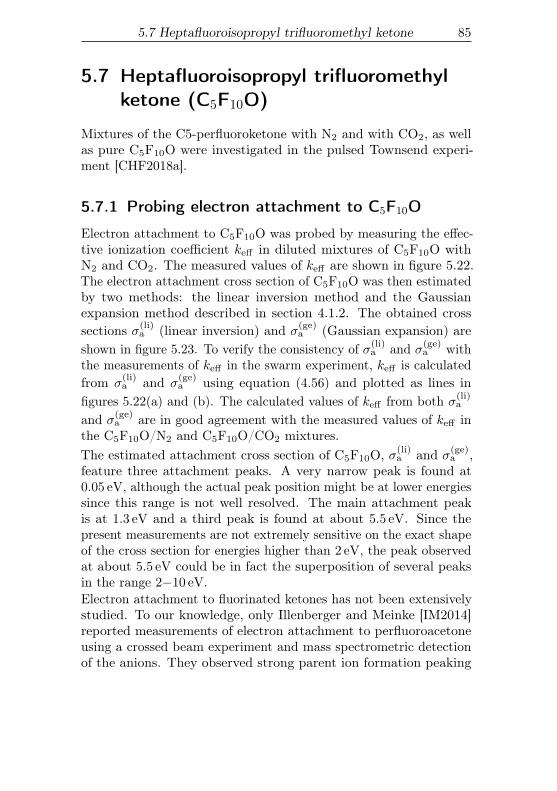
5.7 Heptafluoroisopropyl trifluoromethyl ketone 85
5.7 Heptafluoroisopropyl trifluoromethylketone (C5F10O)
Mixtures of the C5-perfluoroketone with N2 and with CO2, as wellas pure C5F10O were investigated in the pulsed Townsend experi-ment [CHF2018a].
5.7.1 Probing electron attachment to C5F10O
Electron attachment to C5F10O was probed by measuring the effec-tive ionization coefficient keff in diluted mixtures of C5F10O withN2 and CO2. The measured values of keff are shown in figure 5.22.The electron attachment cross section of C5F10O was then estimatedby two methods: the linear inversion method and the Gaussianexpansion method described in section 4.1.2. The obtained crosssections σ(li)
a (linear inversion) and σ(ge)a (Gaussian expansion) are
shown in figure 5.23. To verify the consistency of σ(li)a and σ(ge)
a withthe measurements of keff in the swarm experiment, keff is calculatedfrom σ
(li)a and σ
(ge)a using equation (4.56) and plotted as lines in
figures 5.22(a) and (b). The calculated values of keff from both σ(li)a
and σ(ge)a are in good agreement with the measured values of keff in
the C5F10O/N2 and C5F10O/CO2 mixtures.The estimated attachment cross section of C5F10O, σ(li)
a and σ(ge)a ,
feature three attachment peaks. A very narrow peak is found at0.05 eV, although the actual peak position might be at lower energiessince this range is not well resolved. The main attachment peakis at 1.3 eV and a third peak is found at about 5.5 eV. Since thepresent measurements are not extremely sensitive on the exact shapeof the cross section for energies higher than 2 eV, the peak observedat about 5.5 eV could be in fact the superposition of several peaksin the range 2−10 eV.Electron attachment to fluorinated ketones has not been extensivelystudied. To our knowledge, only Illenberger and Meinke [IM2014]reported measurements of electron attachment to perfluoroacetoneusing a crossed beam experiment and mass spectrometric detectionof the anions. They observed strong parent ion formation peaking
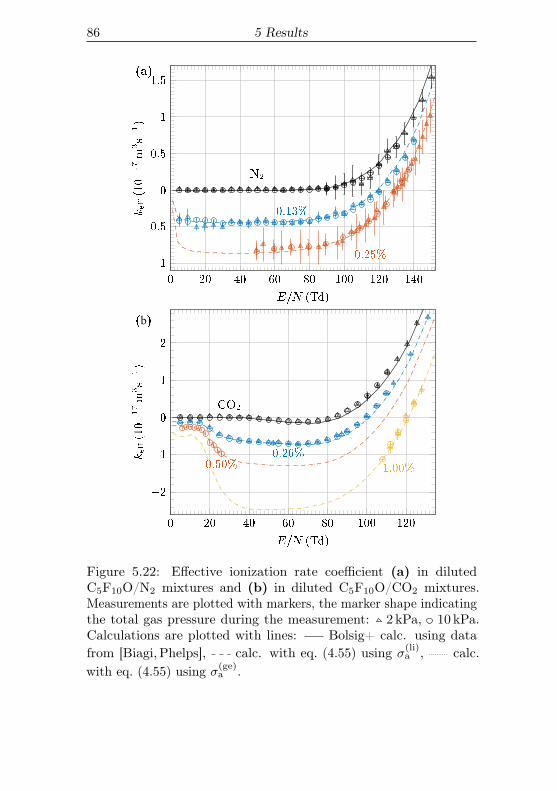
86 5 Results
0 20 40 60 80 100 120 140
�1
�0:5
0
0:5
1
1:5
N2
0:13%
0:25%
(a)
E=N (Td)
ke�(10�17m
3s�
1)
0 20 40 60 80 100 120
�2
�1
0
1
2
CO2
0:26%0:50% 1:00%
(b)
E=N (Td)
ke�(10�17m
3s�
1)
Figure 5.22: Effective ionization rate coefficient (a) in dilutedC5F10O/N2 mixtures and (b) in diluted C5F10O/CO2 mixtures.Measurements are plotted with markers, the marker shape indicatingthe total gas pressure during the measurement: 2 kPa, 10 kPa.Calculations are plotted with lines: Bolsig+ calc. using datafrom [Biagi, Phelps], calc. with eq. (4.55) using σ(li)
a , calc.with eq. (4.55) using σ(ge)
a .
5.7 Heptafluoroisopropyl trifluoromethyl ketone 87
10�2
10�1
100
101
10�22
10�21
10�20
10�19
10�18
10�17
C5F10O, �(li)a
C5F10O, �(ge)a
SF6, Biagi
" (eV)
�a(m
2)
Figure 5.23: Total electron attachment cross section of C5F10Oestimated with a linear inversion method (σ(li)
a ) and a three-termGaussian expansion (σ(ge)
a ).
towards 0 eV as well as multiple dissociative attachment peaks in therange of 2−12 eV. We observe a somewhat different picture for theperfluoroketone C5F10O. The effective ionization rate coefficient keff
in C5F10O/N2 and C5F10O/CO2 mixtures shown in figures 5.22(a)and (b) is lowest at intermediate E/N ratios, from about 30Td to80Td, which suggests that electron attachment to C5F10O occursmainly at electron energies above thermal. Accordingly, the estimatedelectron attachment cross section features only a small attachmentpeak at low energies possibly being parent ion attachment, and a mainattachment peak at 1.3 eV. We do observe substantial attachmentin the range 3−11 eV which could be the superposition of multipledissociative attachment peaks, similarly to perfluoroacetone.
88 5 Results
5.7.2 C5F10O/N2 and C5F10O/CO2 mixtures, andpure C5F10O
A wide range of mixtures of C5F10O with N2 and CO2 was alsoinvestigated. The effective ionization rate coefficient and electrondrift velocity in these mixtures are shown in figures 5.24 and 5.25.In pure C5F10O, additionally to keff , we and NDL, the ionizationand attachment rate coefficients ki and ka were obtained using theanalysis introduced in section 4.1.2. Figure 5.26 shows the ioniza-tion, attachment and effective ionization rate coefficients, as well asthe electron drift velocity and diffusion coefficient obtained in pureC5F10O. The results are independent of the gas pressure in the largepressure range covered, from 100Pa to 2 kPa. In particular, the factthat the obtained values of ki and ka are independent of the gaspressure implies that no electron detachment occurs in C5F10O, asequations (4.34) and (4.35) would otherwise fail.
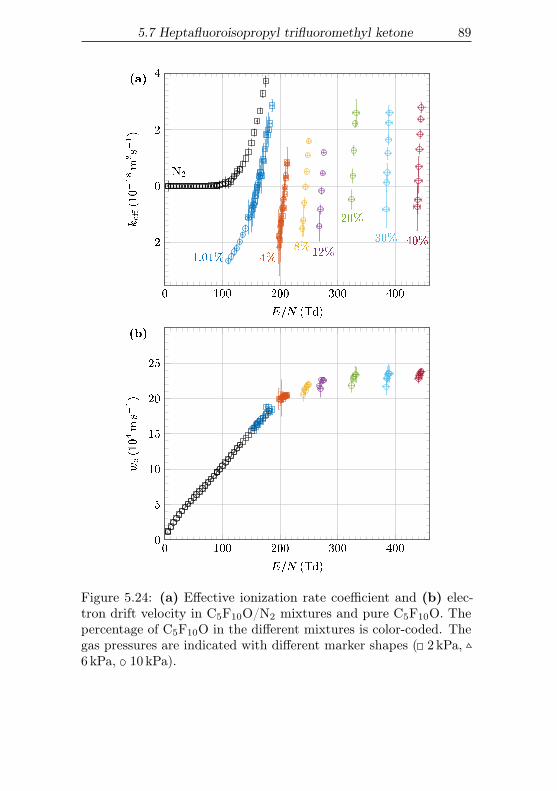
5.7 Heptafluoroisopropyl trifluoromethyl ketone 89
0 100 200 300 400
�2
0
2
4
N2
1:01% 4%8%
12%
20%
30% 40%
(a)
E=N (Td)
ke�(10�18m
3s�
1)
0 100 200 300 4000
5
10
15
20
25
(b)
E=N (Td)
we(104ms�1)
Figure 5.24: (a) Effective ionization rate coefficient and (b) elec-tron drift velocity in C5F10O/N2 mixtures and pure C5F10O. Thepercentage of C5F10O in the different mixtures is color-coded. Thegas pressures are indicated with different marker shapes ( 2 kPa,6 kPa, 10 kPa).
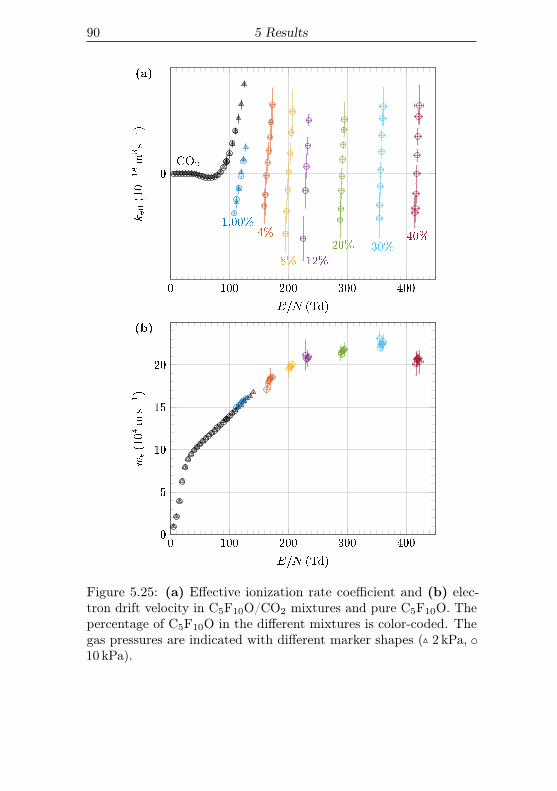
90 5 Results
0 100 200 300 400
00CO2
1:00%4%
8% 12%
20% 30%40%
(a)
E=N (Td)
ke�(10�18m
3s�
1)
0 100 200 300 4000
5
10
15
20
(b)
E=N (Td)
we(104ms�1)
Figure 5.25: (a) Effective ionization rate coefficient and (b) elec-tron drift velocity in C5F10O/CO2 mixtures and pure C5F10O. Thepercentage of C5F10O in the different mixtures is color-coded. Thegas pressures are indicated with different marker shapes ( 2 kPa,10 kPa).

5.7 Heptafluoroisopropyl trifluoromethyl ketone 91
0 200 400 600 800
�2
�1
0
1(a)
E=N (Td)
ke�(10�15m
3s�
1)
700 750 800 850 900
22
24
26
28
(b)
E=N (Td)
we(105ms�1)
700 750 800 850 9000
0:5
1
1:5
2(c)
E=N (Td)
NDL(1024m�1s�1)
700 750 800 850 900
1
2
3(d)
E=N (Td)
ki(10�15m
3s�
1)
700 750 800 850 900
1
2
3(e)
E=N (Td)
ka(10�15m
3s�
1)
Figure 5.26: (a) Effective ionization rate coefficient, (b) electrondrift velocity, (c) electron diffusion coefficient, (d) ionization ratecoefficient and (e) attachment rate coefficient as functions of E/Nin C5F10O, at different gas pressures ( 0.1 kPa, 0.2 kPa, 0.5 kPa,1 kPa, 1.5 kPa, 2 kPa).
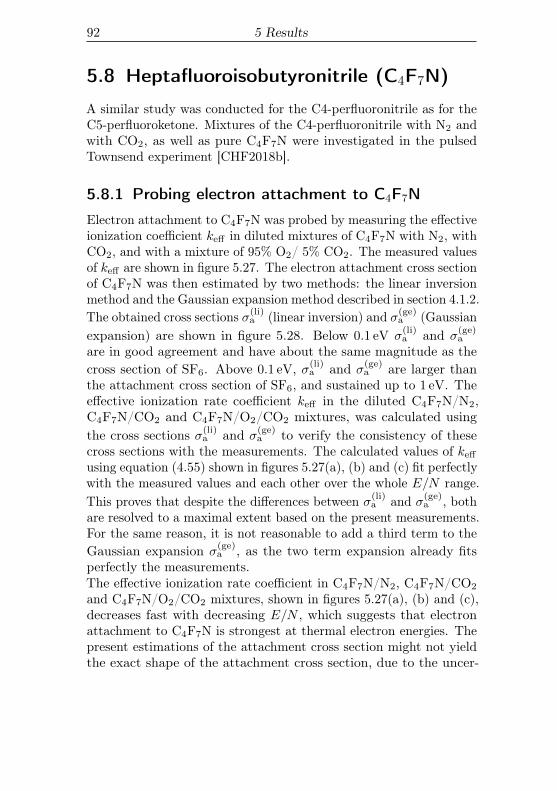
92 5 Results
5.8 Heptafluoroisobutyronitrile (C4F7N)
A similar study was conducted for the C4-perfluoronitrile as for theC5-perfluoroketone. Mixtures of the C4-perfluoronitrile with N2 andwith CO2, as well as pure C4F7N were investigated in the pulsedTownsend experiment [CHF2018b].
5.8.1 Probing electron attachment to C4F7N
Electron attachment to C4F7N was probed by measuring the effectiveionization coefficient keff in diluted mixtures of C4F7N with N2, withCO2, and with a mixture of 95% O2/ 5% CO2. The measured valuesof keff are shown in figure 5.27. The electron attachment cross sectionof C4F7N was then estimated by two methods: the linear inversionmethod and the Gaussian expansion method described in section 4.1.2.The obtained cross sections σ(li)
a (linear inversion) and σ(ge)a (Gaussian
expansion) are shown in figure 5.28. Below 0.1 eV σ(li)a and σ
(ge)a
are in good agreement and have about the same magnitude as thecross section of SF6. Above 0.1 eV, σ(li)
a and σ(ge)a are larger than
the attachment cross section of SF6, and sustained up to 1 eV. Theeffective ionization rate coefficient keff in the diluted C4F7N/N2,C4F7N/CO2 and C4F7N/O2/CO2 mixtures, was calculated usingthe cross sections σ(li)
a and σ(ge)a to verify the consistency of these
cross sections with the measurements. The calculated values of keff
using equation (4.55) shown in figures 5.27(a), (b) and (c) fit perfectlywith the measured values and each other over the whole E/N range.This proves that despite the differences between σ(li)
a and σ(ge)a , both
are resolved to a maximal extent based on the present measurements.For the same reason, it is not reasonable to add a third term to theGaussian expansion σ
(ge)a , as the two term expansion already fits
perfectly the measurements.The effective ionization rate coefficient in C4F7N/N2, C4F7N/CO2
and C4F7N/O2/CO2 mixtures, shown in figures 5.27(a), (b) and (c),decreases fast with decreasing E/N , which suggests that electronattachment to C4F7N is strongest at thermal electron energies. Thepresent estimations of the attachment cross section might not yieldthe exact shape of the attachment cross section, due to the uncer-
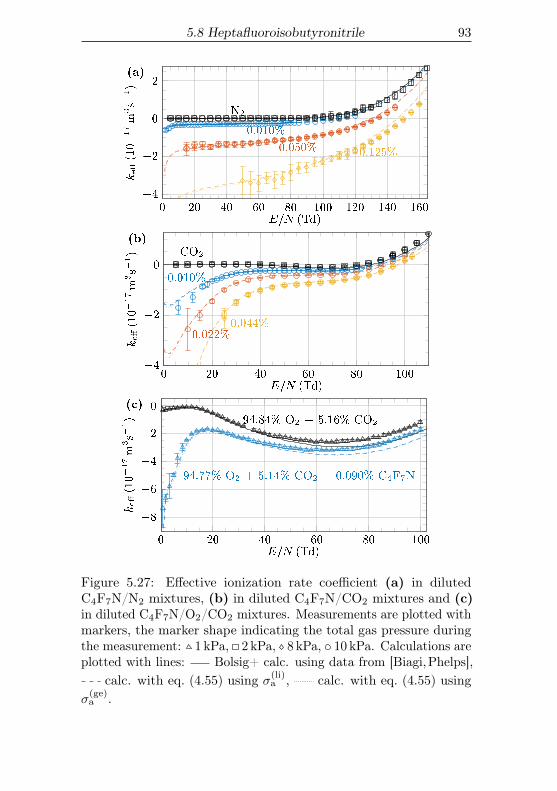
5.8 Heptafluoroisobutyronitrile 93
0 20 40 60 80 100 120 140 160
�4
�2
0
2
N2
0:010%
0:050% 0:125%
(a)
E=N (Td)
ke�(10�17m
3s�
1)
0 20 40 60 80 100�4
�2
0
CO2
0:010%
0:022%0:044%
(b)
E=N (Td)
ke�(10�17m
3s�
1)
0 20 40 60 80 100
�8
�6
�4
�2
0
94:84% O2 + 5:16% CO2
94:77% O2 + 5:14% CO2 + 0:090% C4F7N
(c)
E=N (Td)
ke�(10�17m
3s�
1)
Figure 5.27: Effective ionization rate coefficient (a) in dilutedC4F7N/N2 mixtures, (b) in diluted C4F7N/CO2 mixtures and (c)in diluted C4F7N/O2/CO2 mixtures. Measurements are plotted withmarkers, the marker shape indicating the total gas pressure duringthe measurement: 1 kPa, 2 kPa, 8 kPa, 10 kPa. Calculations areplotted with lines: Bolsig+ calc. using data from [Biagi,Phelps],
calc. with eq. (4.55) using σ(li)a , calc. with eq. (4.55) using
σ(ge)a .
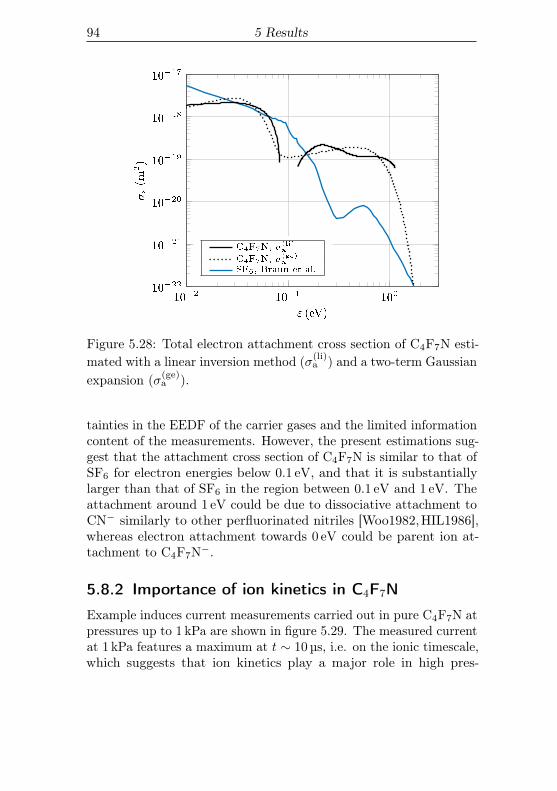
94 5 Results
10�2
10�1
100
10�22
10�21
10�20
10�19
10�18
10�17
C4F7N, �(li)a
C4F7N, �(ge)a
SF6, Braun et al.
" (eV)
�a(m
2)
Figure 5.28: Total electron attachment cross section of C4F7N esti-mated with a linear inversion method (σ(li)
a ) and a two-term Gaussianexpansion (σ(ge)
a ).
tainties in the EEDF of the carrier gases and the limited informationcontent of the measurements. However, the present estimations sug-gest that the attachment cross section of C4F7N is similar to that ofSF6 for electron energies below 0.1 eV, and that it is substantiallylarger than that of SF6 in the region between 0.1 eV and 1 eV. Theattachment around 1 eV could be due to dissociative attachment toCN− similarly to other perfluorinated nitriles [Woo1982,HIL1986],whereas electron attachment towards 0 eV could be parent ion at-tachment to C4F7N−.
5.8.2 Importance of ion kinetics in C4F7N
Example induces current measurements carried out in pure C4F7N atpressures up to 1 kPa are shown in figure 5.29. The measured currentat 1 kPa features a maximum at t ∼ 10 µs, i.e. on the ionic timescale,which suggests that ion kinetics play a major role in high pres-
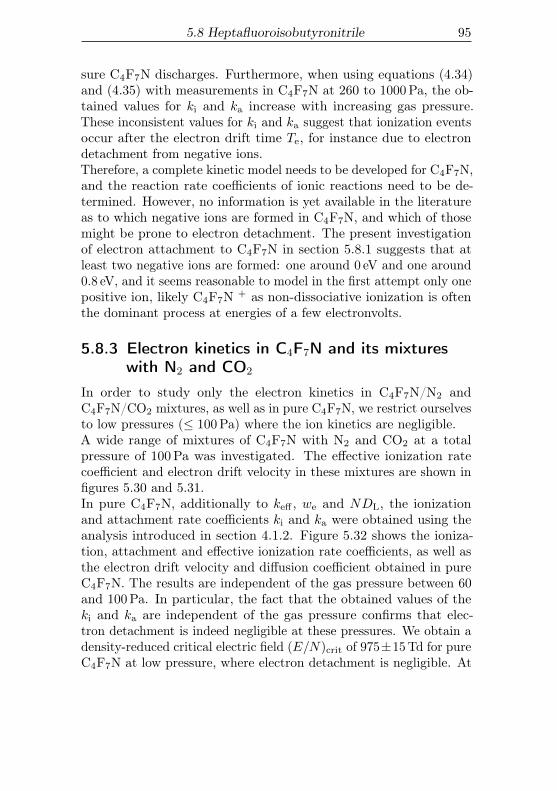
5.8 Heptafluoroisobutyronitrile 95
sure C4F7N discharges. Furthermore, when using equations (4.34)and (4.35) with measurements in C4F7N at 260 to 1000Pa, the ob-tained values for ki and ka increase with increasing gas pressure.These inconsistent values for ki and ka suggest that ionization eventsoccur after the electron drift time Te, for instance due to electrondetachment from negative ions.Therefore, a complete kinetic model needs to be developed for C4F7N,and the reaction rate coefficients of ionic reactions need to be de-termined. However, no information is yet available in the literatureas to which negative ions are formed in C4F7N, and which of thosemight be prone to electron detachment. The present investigationof electron attachment to C4F7N in section 5.8.1 suggests that atleast two negative ions are formed: one around 0 eV and one around0.8 eV, and it seems reasonable to model in the first attempt only onepositive ion, likely C4F7N + as non-dissociative ionization is oftenthe dominant process at energies of a few electronvolts.
5.8.3 Electron kinetics in C4F7N and its mixtureswith N2 and CO2
In order to study only the electron kinetics in C4F7N/N2 andC4F7N/CO2 mixtures, as well as in pure C4F7N, we restrict ourselvesto low pressures (≤ 100Pa) where the ion kinetics are negligible.A wide range of mixtures of C4F7N with N2 and CO2 at a totalpressure of 100Pa was investigated. The effective ionization ratecoefficient and electron drift velocity in these mixtures are shown infigures 5.30 and 5.31.In pure C4F7N, additionally to keff , we and NDL, the ionizationand attachment rate coefficients ki and ka were obtained using theanalysis introduced in section 4.1.2. Figure 5.32 shows the ioniza-tion, attachment and effective ionization rate coefficients, as well asthe electron drift velocity and diffusion coefficient obtained in pureC4F7N. The results are independent of the gas pressure between 60and 100Pa. In particular, the fact that the obtained values of theki and ka are independent of the gas pressure confirms that elec-tron detachment is indeed negligible at these pressures. We obtain adensity-reduced critical electric field (E/N)crit of 975±15Td for pureC4F7N at low pressure, where electron detachment is negligible. At
96 5 Results
0 50 100 150 200
0
0:2
0:4
0:6
0:8
1 1000Pa
740Pa
620Pa
510Pa
370Pa
260Pa
100Pa
(a)
t (ns)
I(a
.u.)
0 10 20 30 40 50 60 70
0
0:1
0:2
0:3
1000Pa
740Pa
620Pa
510Pa
370Pa
260Pa
100Pa
(b)
t (µs)
I(a
.u.)
Figure 5.29: Current versus time in pure C4F7N, at different pres-sures, for an electrode spacing of 25mm, and for a reduced electricfield E/N of 966Td, (a) on the electronic timescale and (b) on theionic timescale. The measurements are rescaled to have a similaramplitude at t = 0, the original amplitudes ranged from 5.5 µA at100Pa to 0.4 µA at 1000Pa.
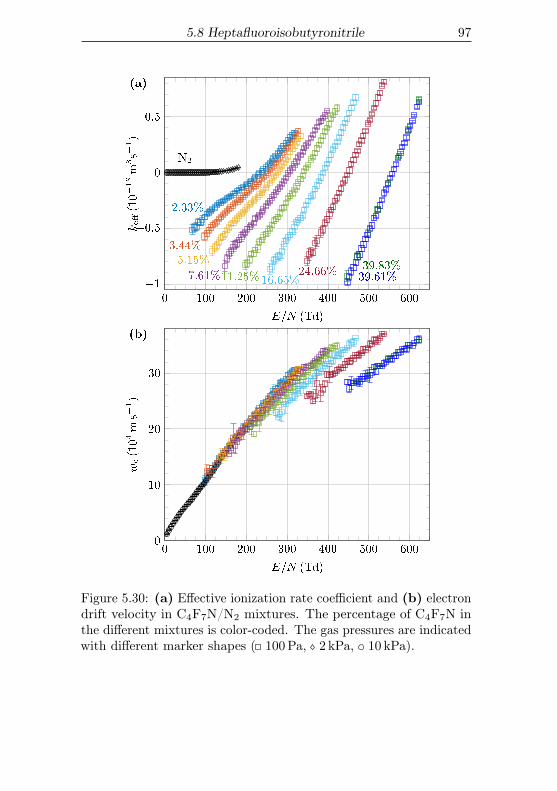
5.8 Heptafluoroisobutyronitrile 97
0 100 200 300 400 500 600
�1
�0:5
0
0:5
N2
2:33%
3:44%5:15%
7:61%11:25%16:65%24:66%
39:61%39:83%
(a)
E=N (Td)
ke�(10�18m
3s�
1)
0 100 200 300 400 500 6000
10
20
30
(b)
E=N (Td)
we(104ms�1)
Figure 5.30: (a) Effective ionization rate coefficient and (b) electrondrift velocity in C4F7N/N2 mixtures. The percentage of C4F7N inthe different mixtures is color-coded. The gas pressures are indicatedwith different marker shapes ( 100Pa, 2 kPa, 10 kPa).
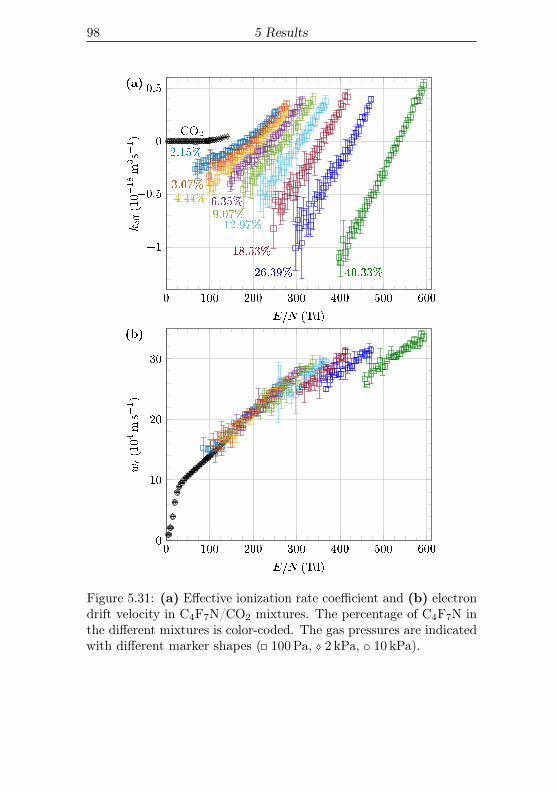
98 5 Results
0 100 200 300 400 500 600
�1
�0:5
0
0:5
CO2
2:15%
3:07%4:44% 6:35%
9:07%12:97%
18:53%
26:39% 40:33%
(a)
E=N (Td)
ke�(10�18m
3s�
1)
0 100 200 300 400 500 6000
10
20
30
(b)
E=N (Td)
we(104ms�1)
Figure 5.31: (a) Effective ionization rate coefficient and (b) electrondrift velocity in C4F7N/CO2 mixtures. The percentage of C4F7N inthe different mixtures is color-coded. The gas pressures are indicatedwith different marker shapes ( 100Pa, 2 kPa, 10 kPa).
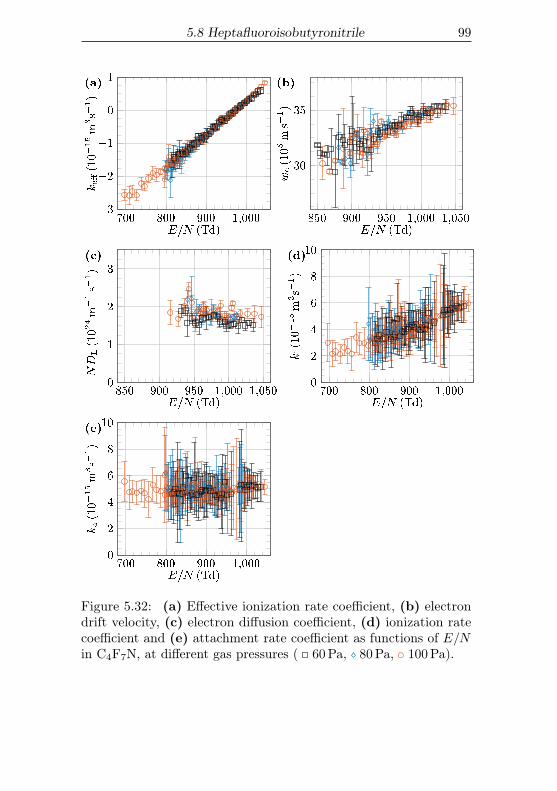
5.8 Heptafluoroisobutyronitrile 99
700 800 900 1;000�3
�2
�1
0
1(a)
E=N (Td)
ke�(10�15m
3s�
1)
850 900 950 1;000 1;050
30
35
(b)
E=N (Td)
we(105ms�1)
850 900 950 1;000 1;0500
1
2
3
(c)
E=N (Td)
NDL(1024m�1s�1)
700 800 900 1;0000
2
4
6
8
10(d)
E=N (Td)
ki(10�15m
3s�
1)
700 800 900 1;0000
2
4
6
8
10(e)
E=N (Td)
ka(10�15m
3s�
1)
Figure 5.32: (a) Effective ionization rate coefficient, (b) electrondrift velocity, (c) electron diffusion coefficient, (d) ionization ratecoefficient and (e) attachment rate coefficient as functions of E/Nin C4F7N, at different gas pressures ( 60Pa, 80Pa, 100Pa).

100 5 Results
higher pressures, ion kinetics may lead to different values of keff , andself-sustained discharges will occur at E/N < (E/N)crit. Therefore,the present values of (E/N)crit may not be directly used at highpressures.
6 Inter-comparison of thegases under study
In this chapter, the properties of the gases and gas mixtures un-der study are compared in regard to their performance for gaseouselectrical insulation. The electron attachment cross sections of thefluorinated gases are compared, and set in relation with the syner-gism observed in gas mixtures. The dependence of the results on thegas pressure and its consequences for high pressure applications arediscussed.
6.1 Electron attachment cross sections
Having a large electron attachment cross section is desirable forelectrical insulation gases. Therefore, the total attachment crosssections of the gases under study are compared in this section. Theattachment cross sections of the gases under study are shown infigure 6.1. Some of these cross sections were not obtained duringthe course of this thesis: The SF5CF3 cross section was obtained byGraupner et al. [GGF+2008]. The 2-C4F8 cross section was obtainedby Chutjian and Alajajian [CA1985] for the range below 0.4 eV andby Christodoulides et al. [CCPT1979] for the range above 0.4 eV. TheSF6 cross section was taken from the Biagi cross section set [Biagi],where in particular the low-energy part was obtained by Braun etal. [BMRH2009]. For C3F6O and SF5CF3, swarm cross sections wereobtained during this thesis (see [ZKK+2018] and [CF2017b]), butsince beam cross sections are available, the beam cross sections arepreferred in figure 6.1 because they are considered more reliable.The magnitude and energy range of these attachment cross sectionsare quite different. Among these gases, SF6, SF5CF3, 2-C4F8 andC4F7N all feature a large attachment cross section at low electron
101
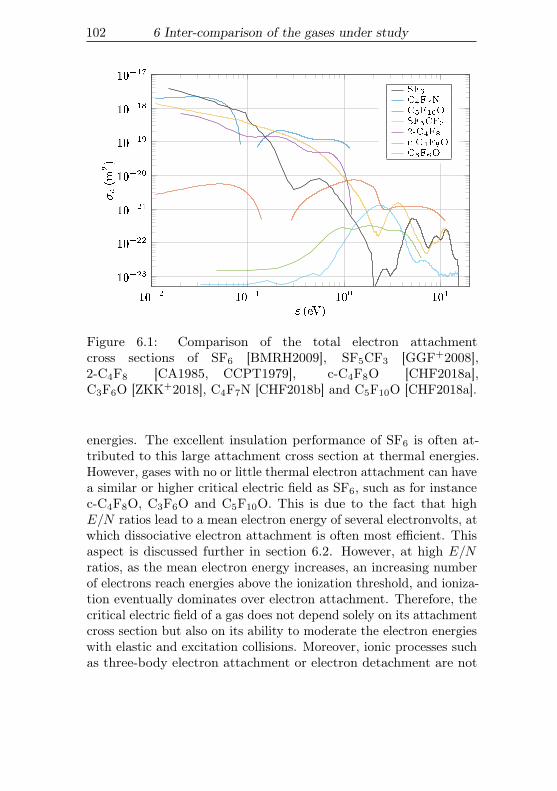
102 6 Inter-comparison of the gases under study
10�2
10�1
100
101
10�23
10�22
10�21
10�20
10�19
10�18
10�17
SF6
C4F7N
C5F10O
SF5CF3
2-C4F8
c-C4F8O
C3F6O
" (eV)
�a(m
2)
Figure 6.1: Comparison of the total electron attachmentcross sections of SF6 [BMRH2009], SF5CF3 [GGF+2008],2-C4F8 [CA1985, CCPT1979], c-C4F8O [CHF2018a],C3F6O [ZKK+2018], C4F7N [CHF2018b] and C5F10O [CHF2018a].
energies. The excellent insulation performance of SF6 is often at-tributed to this large attachment cross section at thermal energies.However, gases with no or little thermal electron attachment can havea similar or higher critical electric field as SF6, such as for instancec-C4F8O, C3F6O and C5F10O. This is due to the fact that highE/N ratios lead to a mean electron energy of several electronvolts, atwhich dissociative electron attachment is often most efficient. Thisaspect is discussed further in section 6.2. However, at high E/Nratios, as the mean electron energy increases, an increasing numberof electrons reach energies above the ionization threshold, and ioniza-tion eventually dominates over electron attachment. Therefore, thecritical electric field of a gas does not depend solely on its attachmentcross section but also on its ability to moderate the electron energieswith elastic and excitation collisions. Moreover, ionic processes suchas three-body electron attachment or electron detachment are not
6.2 Synergism in gas mixtures 103
accounted for in electron scattering cross sections and can signifi-cantly increase or decrease the critical electric field of a gas. Thesetwo processes are therefore discussed in section 6.3.
6.2 Synergism in gas mixtures
The density-reduced critical electric field (E/N)crit of a gas mixturecannot be predicted based solely on the (E/N)crit of the individualcomponents, because it depends largely on the electron energy distri-bution in the gas mixture. A gas mixture is said to have a synergywhen its (E/N)crit is larger than the sum of the (E/N)crit of its com-ponents weighted by their mole fractions in the mixture [CW1981].The synergy effect is thus beneficial for the insulation performanceof fluorinated gas mixtures. This effect can be observed by plottingsynergy curves, that is, plots of the (E/N)crit of a gas mixture asa function of the mole fraction of the electron attaching gas in thecarrier gas. The synergy curves of the gases under study with N2 ascarrier gas are shown in figures 6.2 and 6.3, and the same curves withCO2 as carrier gas are shown in figures 6.4 and 6.5. The markersshow values of (E/N)crit obtained with a pulsed Townsend experi-ment. In the case of SF6 these values were taken from the UNAMdatabase [UNAM], whereas for the other gases they were measuredas part of this thesis. The dashed lines are estimations of (E/N)crit
obtained with equation (4.56), and the relevance of these estimationsis discussed below.Insulating gas mixtures typically consist of a few percent of a fluori-nated electron-attaching gas in a carrier gas such as N2, CO2, O2, ora mixture of these. For low mole fractions of the electron-attachinggas, the existence of a synergy effect depends largely on the overlapbetween the electron attachment cross section of the attaching gasand the electron energy distribution function (EEDF) of the carriergas. This can be verified by convoluting (see equation (4.56)) theEEDF of the carrier gases with the attachment cross sections (fromfigure 6.1) of the attaching gases under study, in order to estimatethe effective ionization coefficient, and thus (E/N)crit, in the gasmixture. The (E/N)crit obtained from this estimation of k[mixture]
eff
is shown as a dashed line in figures 6.2 to 6.5, except for C3HF7
104 6 Inter-comparison of the gases under study
and C3H2F4 for which no electron attachment cross section σa isavailable. By comparing the measured and the calculated values of(E/N)crit in figures 6.3 to 6.5, it can be seen that this equation givesa quite good estimation of the synergy curves for low mole fractions(below a few percent) of fluorinated attaching gas.In figures 6.2 to 6.5 can be seen that mixtures containing C5F10O,C4F7N, SF5CF3 and 2-C4F8 (calculation only) have higher (E/N)crit
than SF6 mixtures, whereas mixtures containing C3H2F4, C3HF7,C3F6O (calculation only) and c-C4F8O (calculation only) have lower(E/N)crit. The cases of C3H2F4 and c-C4F8O are particular: thesegases have low (E/N)crit at low gas pressures, but (E/N)crit increaseswith increasing gas pressure due to three-body electron attachment.The calculations for c-C4F8O in figures 6.2 to 6.5 correspond to alow-pressure limit for (E/N)crit, where no three-body attachmentoccurs, because the beam attachment cross section [CFJ+2016] wasused for the calculation. The measured values for C3H2F4 mixtureswere obtained for a fixed total pressure of 10 kPa [CF2017a], at whichthree-body electron attachment is still not very high. Therefore, thevalues for c-C4F8O and C3H2F4 in figures 6.2-6.5 are underestimated.This aspect is discussed in section 6.3.1. The case of C4F7N is alsoparticular because the values of (E/N)crit from figures 6.2 to 6.5 wereobtained at low pressures (below 100Pa), where electron detachmentwas negligible [CHF2018b,HCF2019]. At higher pressures, electrondetachment will effectively cancel out part of the electron attachment,and this will result in lower (E/N)crit values. This aspect is discussedin section 6.3.2.The fact that equation (4.55) gives a good estimation of (E/N)crit
for low percentages of electron-attaching gas, indicates that the syn-ergism is largely described by the overlap between the EEDF and theattachment cross section. Thus, in order to obtain a large (E/N)crit
in a gas mixture with a particular carrier gas, the attachment crosssection of the fluorinated gas should be large at energies of a fewelectronvolts, i.e. at the peak of the electron energy distributionin the carrier gas at this large E/N . The density-reduced criticalelectric field of SF6 is (E/N)crit = 360Td. At this E/N ratio, theelectron energy distributions in N2, CO2 or SF6 peak at energiesbetween 2 to 5 eV. Therefore, an attachment cross section peakingat these energies is advantageous. As an example, figure 6.6(a) and
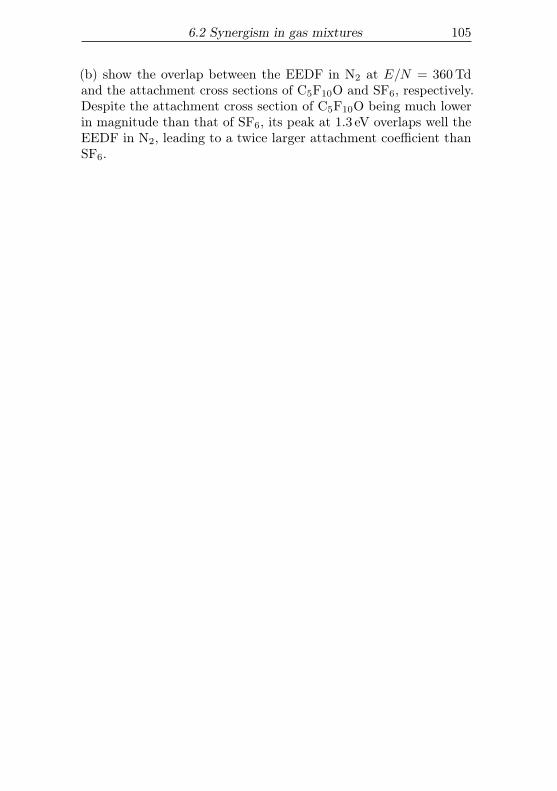
6.2 Synergism in gas mixtures 105
(b) show the overlap between the EEDF in N2 at E/N = 360Tdand the attachment cross sections of C5F10O and SF6, respectively.Despite the attachment cross section of C5F10O being much lowerin magnitude than that of SF6, its peak at 1.3 eV overlaps well theEEDF in N2, leading to a twice larger attachment coefficient thanSF6.
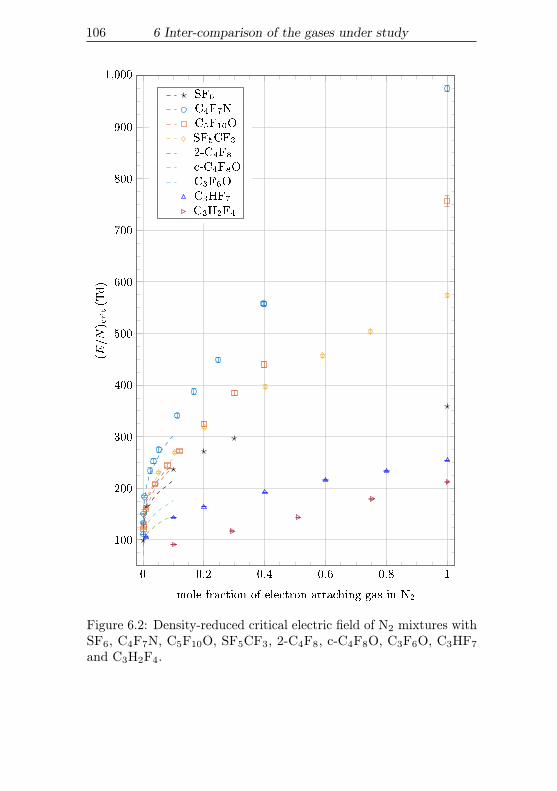
106 6 Inter-comparison of the gases under study
0 0:2 0:4 0:6 0:8 1
100
200
300
400
500
600
700
800
900
1;000
SF6
C4F7NC5F10OSF5CF3
2-C4F8
c-C4F8OC3F6OC3HF7
C3H2F4
mole fraction of electron attaching gas in N2
(E=N
) crit(Td)
Figure 6.2: Density-reduced critical electric field of N2 mixtures withSF6, C4F7N, C5F10O, SF5CF3, 2-C4F8, c-C4F8O, C3F6O, C3HF7
and C3H2F4.
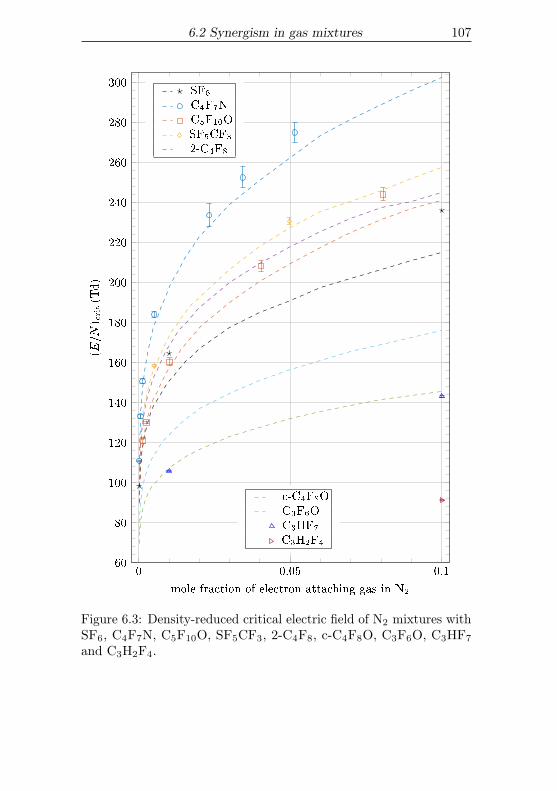
6.2 Synergism in gas mixtures 107
0 0.05 0.160
80
100
120
140
160
180
200
220
240
260
280
300SF6
C4F7NC5F10OSF5CF3
2-C4F8
c-C4F8OC3F6OC3HF7
C3H2F4
mole fraction of electron attaching gas in N2
(E=N
) crit(T
d)
Figure 6.3: Density-reduced critical electric field of N2 mixtures withSF6, C4F7N, C5F10O, SF5CF3, 2-C4F8, c-C4F8O, C3F6O, C3HF7
and C3H2F4.
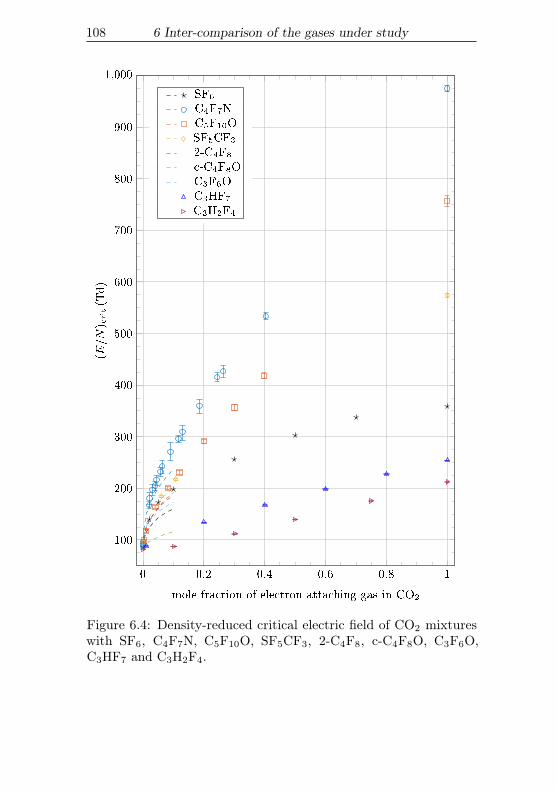
108 6 Inter-comparison of the gases under study
0 0:2 0:4 0:6 0:8 1
100
200
300
400
500
600
700
800
900
1;000
SF6
C4F7NC5F10OSF5CF3
2-C4F8
c-C4F8OC3F6OC3HF7
C3H2F4
mole fraction of electron attaching gas in CO2
(E=N
) crit(Td)
Figure 6.4: Density-reduced critical electric field of CO2 mixtureswith SF6, C4F7N, C5F10O, SF5CF3, 2-C4F8, c-C4F8O, C3F6O,C3HF7 and C3H2F4.
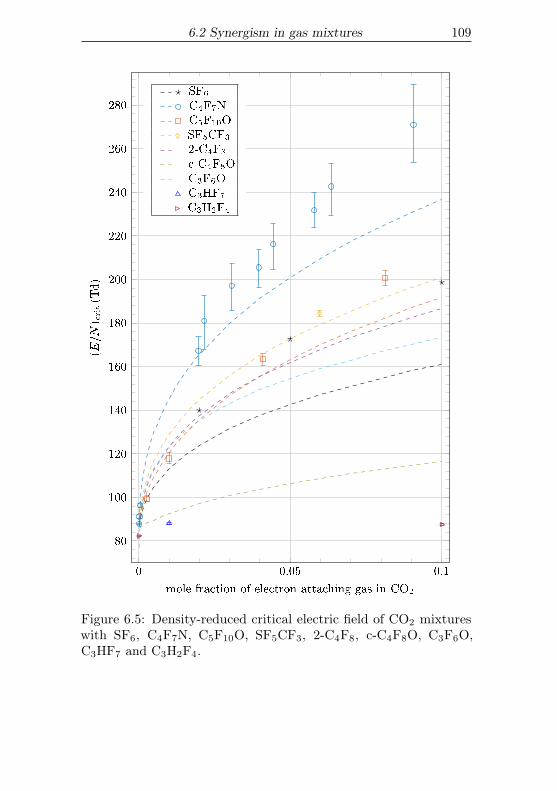
6.2 Synergism in gas mixtures 109
0 0.05 0.1
80
100
120
140
160
180
200
220
240
260
280SF6
C4F7NC5F10OSF5CF3
2-C4F8
c-C4F8OC3F6OC3HF7
C3H2F4
mole fraction of electron attaching gas in CO2
(E=N
) crit(T
d)
Figure 6.5: Density-reduced critical electric field of CO2 mixtureswith SF6, C4F7N, C5F10O, SF5CF3, 2-C4F8, c-C4F8O, C3F6O,C3HF7 and C3H2F4.
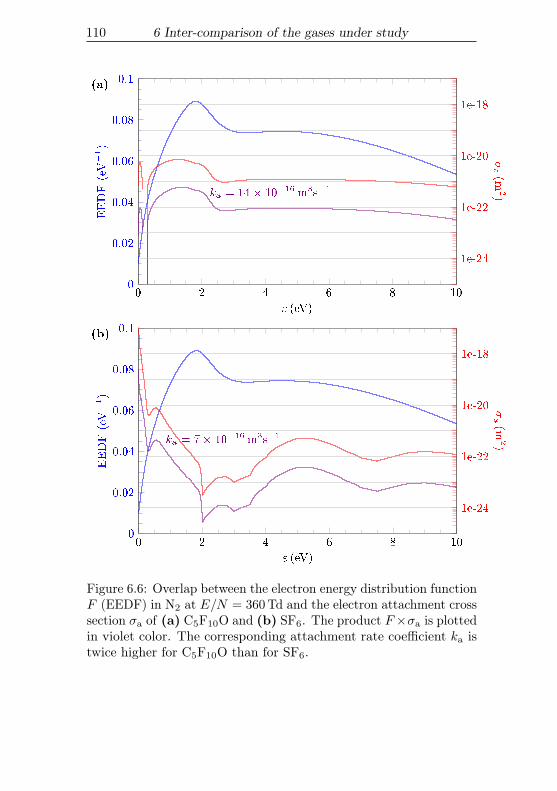
110 6 Inter-comparison of the gases under study
0 2 4 6 8 100
0.02
0.04
0.06
0.08
0.1(a)
" (eV)
EEDF(eV�1)
ka = 14� 10�16m3s�1
1e-24
1e-22
1e-20
1e-18
�a(m
2)
0 2 4 6 8 100
0.02
0.04
0.06
0.08
0.1(b)
" (eV)
EEDF(eV�1)
ka = 7� 10�16m3s�1
1e-24
1e-22
1e-20
1e-18
�a(m
2)
Figure 6.6: Overlap between the electron energy distribution functionF (EEDF) in N2 at E/N = 360Td and the electron attachment crosssection σa of (a) C5F10O and (b) SF6. The product F×σa is plottedin violet color. The corresponding attachment rate coefficient ka istwice higher for C5F10O than for SF6.
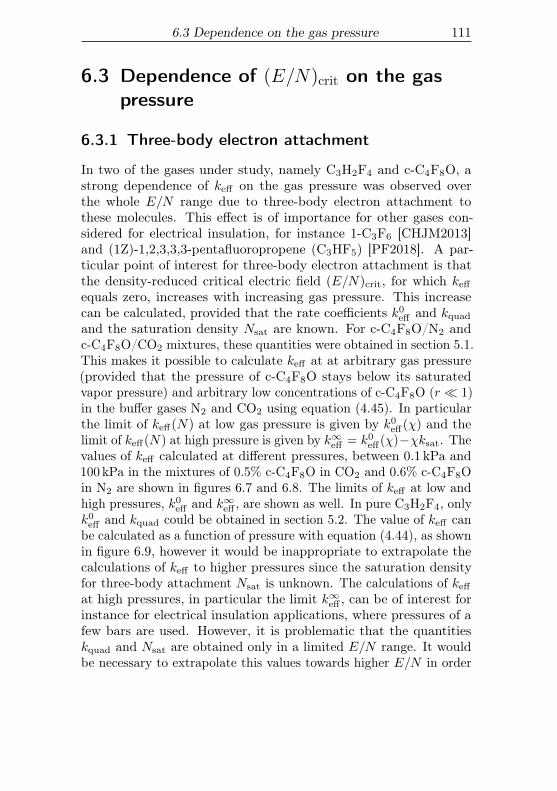
6.3 Dependence on the gas pressure 111
6.3 Dependence of (E/N)crit on the gaspressure
6.3.1 Three-body electron attachment
In two of the gases under study, namely C3H2F4 and c-C4F8O, astrong dependence of keff on the gas pressure was observed overthe whole E/N range due to three-body electron attachment tothese molecules. This effect is of importance for other gases con-sidered for electrical insulation, for instance 1-C3F6 [CHJM2013]and (1Z)-1,2,3,3,3-pentafluoropropene (C3HF5) [PF2018]. A par-ticular point of interest for three-body electron attachment is thatthe density-reduced critical electric field (E/N)crit, for which keff
equals zero, increases with increasing gas pressure. This increasecan be calculated, provided that the rate coefficients k0
eff and kquad
and the saturation density Nsat are known. For c-C4F8O/N2 andc-C4F8O/CO2 mixtures, these quantities were obtained in section 5.1.This makes it possible to calculate keff at at arbitrary gas pressure(provided that the pressure of c-C4F8O stays below its saturatedvapor pressure) and arbitrary low concentrations of c-C4F8O (r � 1)in the buffer gases N2 and CO2 using equation (4.45). In particularthe limit of keff(N) at low gas pressure is given by k0
eff(χ) and thelimit of keff(N) at high pressure is given by k∞eff = k0
eff(χ)−χksat. Thevalues of keff calculated at different pressures, between 0.1 kPa and100 kPa in the mixtures of 0.5% c-C4F8O in CO2 and 0.6% c-C4F8Oin N2 are shown in figures 6.7 and 6.8. The limits of keff at low andhigh pressures, k0
eff and k∞eff , are shown as well. In pure C3H2F4, onlyk0
eff and kquad could be obtained in section 5.2. The value of keff canbe calculated as a function of pressure with equation (4.44), as shownin figure 6.9, however it would be inappropriate to extrapolate thecalculations of keff to higher pressures since the saturation densityfor three-body attachment Nsat is unknown. The calculations of keff
at high pressures, in particular the limit k∞eff , can be of interest forinstance for electrical insulation applications, where pressures of afew bars are used. However, it is problematic that the quantitieskquad and Nsat are obtained only in a limited E/N range. It wouldbe necessary to extrapolate this values towards higher E/N in order
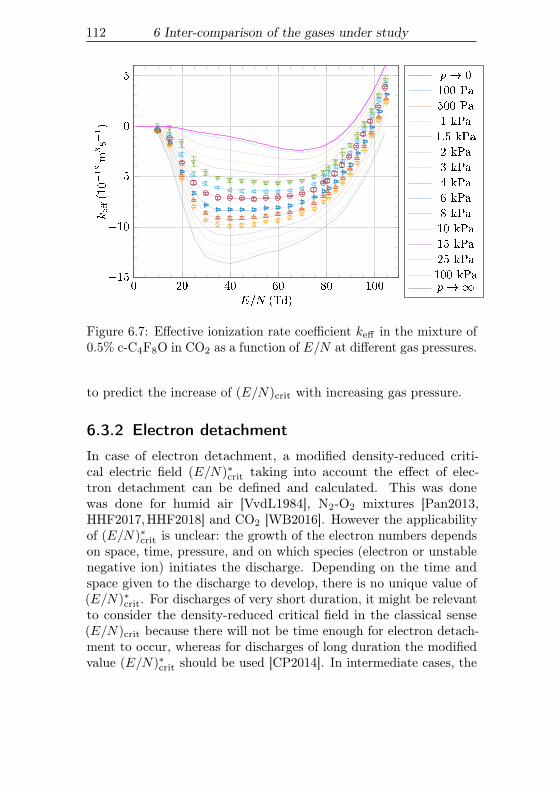
112 6 Inter-comparison of the gases under study
0 20 40 60 80 100�15
�10
�5
0
5
E=N (Td)
ke�(10�18m
3s�
1)
p! 0
100 Pa
500 Pa
1 kPa
1.5 kPa
2 kPa
3 kPa
4 kPa
6 kPa
8 kPa
10 kPa
15 kPa
25 kPa
100 kPap!1
Figure 6.7: Effective ionization rate coefficient keff in the mixture of0.5% c-C4F8O in CO2 as a function of E/N at different gas pressures.
to predict the increase of (E/N)crit with increasing gas pressure.
6.3.2 Electron detachment
In case of electron detachment, a modified density-reduced criti-cal electric field (E/N)∗crit taking into account the effect of elec-tron detachment can be defined and calculated. This was donewas done for humid air [VvdL1984], N2-O2 mixtures [Pan2013,HHF2017,HHF2018] and CO2 [WB2016]. However the applicabilityof (E/N)∗crit is unclear: the growth of the electron numbers dependson space, time, pressure, and on which species (electron or unstablenegative ion) initiates the discharge. Depending on the time andspace given to the discharge to develop, there is no unique value of(E/N)∗crit. For discharges of very short duration, it might be relevantto consider the density-reduced critical field in the classical sense(E/N)crit because there will not be time enough for electron detach-ment to occur, whereas for discharges of long duration the modifiedvalue (E/N)∗crit should be used [CP2014]. In intermediate cases, the
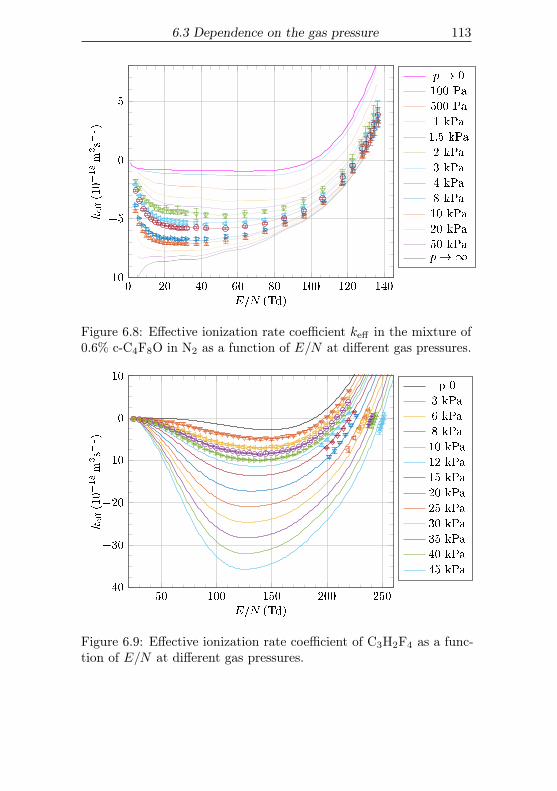
6.3 Dependence on the gas pressure 113
0 20 40 60 80 100 120 140�10
�5
0
5
E=N (Td)
ke�(10�18m
3s�
1)
p! 0
100 Pa
500 Pa
1 kPa
1.5 kPa
2 kPa
3 kPa
4 kPa
8 kPa
10 kPa
20 kPa
50 kPap!1
Figure 6.8: Effective ionization rate coefficient keff in the mixture of0.6% c-C4F8O in N2 as a function of E/N at different gas pressures.
50 100 150 200 250�40
�30
�20
�10
0
10
E=N (Td)
ke�(10�18m
3s�
1)
p 0
3 kPa
6 kPa
8 kPa
10 kPa
12 kPa
15 kPa
20 kPa
25 kPa
30 kPa
35 kPa
40 kPa
45 kPa
Figure 6.9: Effective ionization rate coefficient of C3H2F4 as a func-tion of E/N at different gas pressures.
114 6 Inter-comparison of the gases under study
density-reduced critical electric field is rather undefined, and it isadvisable to follow the spatio-temporal discharge development usinga simulation tool.The streamer criterion (see section 2.4) is not easily applicable in thecase of electron detachment, because it considers the production ofa certain number of electrons (for instance 108) locally, in the headof the electron avalanche, whose radius is determined by electrondiffusion [ME2006]. But in the case of electron detachment, thespatial spread of electrons in mostly caused by successive attachmentand detachment of the electrons, therefore, even if 108 electrons areproduced, the space charge electric field may be still low becausethese electrons occupy a too large volume. Therefore, if the de-tachment rate is not exceedingly high, it is possible that neglectingelectron detachment when calculating the streamer criterion stillgives accurate results.
6.4 Trade-off between electric strengthand minimum operating temperature
Since the critical electric field Ecrit of a gas scales (in most cases)linearly with the gas pressure, it is interesting to use elevated pres-sures for electrical insulation. The filling pressure of high voltageequipment is typically of 600 kPa at 20 ◦C, and the minimum oper-ating temperatures can be in the range of −40 ◦C to 0 ◦C, typically−25 ◦C. For medium voltage equipment the filling pressure is typi-cally of 130 kPa at 20 ◦C, and the minimum temperature is typicallyof −25 ◦C.In applications, the percentage of attaching gas that can be usedis limited by the saturated vapor pressure of the attaching gas.Therefore, it is beneficial for insulating gases to have high vaporpressures. Parametric equations to calculate the vapor pressure ofthe gases under study are given in appendix B. Figure 6.10 showsthe dew points of the gases under study as a function of their molefraction in a carrier gas (assuming no interaction with the carriergas, for instance N2), for the two technically relevant total pressuresof 600 kPa and 130 kPa, corresponding to high and medium voltage
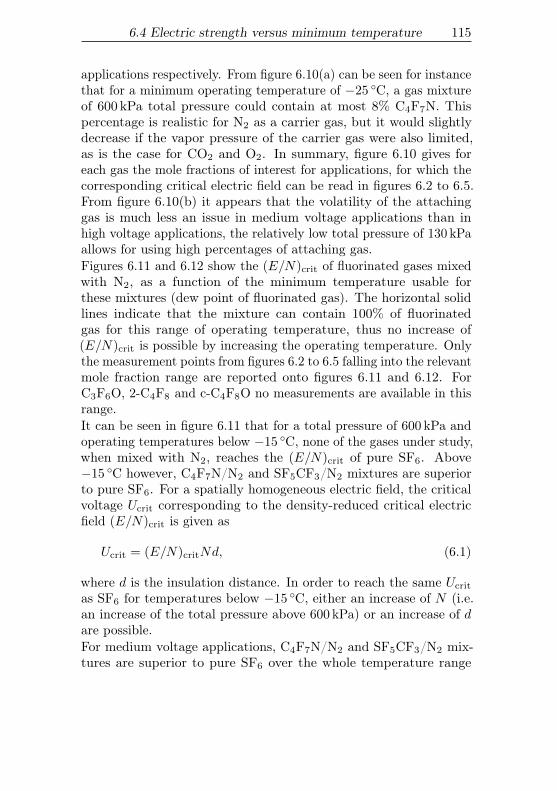
6.4 Electric strength versus minimum temperature 115
applications respectively. From figure 6.10(a) can be seen for instancethat for a minimum operating temperature of −25 ◦C, a gas mixtureof 600 kPa total pressure could contain at most 8% C4F7N. Thispercentage is realistic for N2 as a carrier gas, but it would slightlydecrease if the vapor pressure of the carrier gas were also limited,as is the case for CO2 and O2. In summary, figure 6.10 gives foreach gas the mole fractions of interest for applications, for which thecorresponding critical electric field can be read in figures 6.2 to 6.5.From figure 6.10(b) it appears that the volatility of the attachinggas is much less an issue in medium voltage applications than inhigh voltage applications, the relatively low total pressure of 130 kPaallows for using high percentages of attaching gas.Figures 6.11 and 6.12 show the (E/N)crit of fluorinated gases mixedwith N2, as a function of the minimum temperature usable forthese mixtures (dew point of fluorinated gas). The horizontal solidlines indicate that the mixture can contain 100% of fluorinatedgas for this range of operating temperature, thus no increase of(E/N)crit is possible by increasing the operating temperature. Onlythe measurement points from figures 6.2 to 6.5 falling into the relevantmole fraction range are reported onto figures 6.11 and 6.12. ForC3F6O, 2-C4F8 and c-C4F8O no measurements are available in thisrange.It can be seen in figure 6.11 that for a total pressure of 600 kPa andoperating temperatures below −15 ◦C, none of the gases under study,when mixed with N2, reaches the (E/N)crit of pure SF6. Above−15 ◦C however, C4F7N/N2 and SF5CF3/N2 mixtures are superiorto pure SF6. For a spatially homogeneous electric field, the criticalvoltage Ucrit corresponding to the density-reduced critical electricfield (E/N)crit is given as
Ucrit = (E/N)critNd, (6.1)
where d is the insulation distance. In order to reach the same Ucrit
as SF6 for temperatures below −15 ◦C, either an increase of N (i.e.an increase of the total pressure above 600 kPa) or an increase of dare possible.For medium voltage applications, C4F7N/N2 and SF5CF3/N2 mix-tures are superior to pure SF6 over the whole temperature range
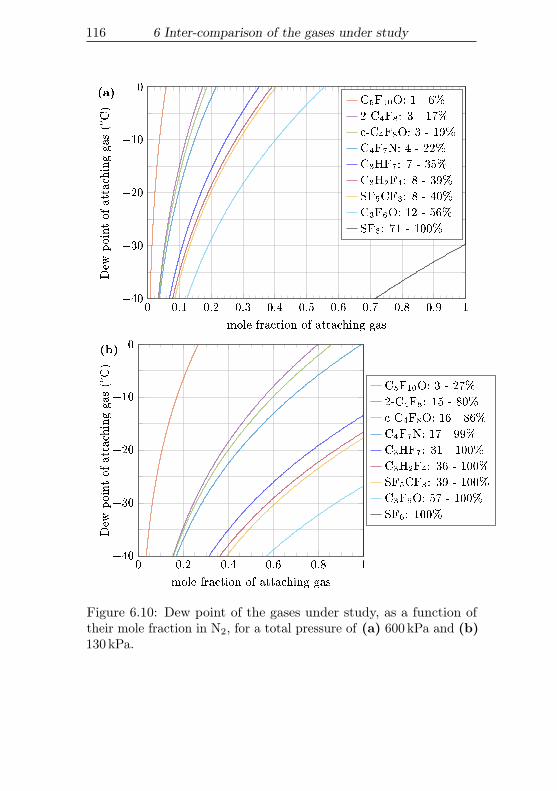
116 6 Inter-comparison of the gases under study
0 0.1 0.2 0.3 0.4 0.5 0.6 0.7 0.8 0.9 1�40
�30
�20
�10
0(a)
mole fraction of attaching gas
Dew
pointofattachinggas(�C)
C5F10O: 1 - 6%
2-C4F8: 3 - 17%
c-C4F8O: 3 - 19%
C4F7N: 4 - 22%
C3HF7: 7 - 35%
C3H2F4: 8 - 39%
SF5CF3: 8 - 40%
C3F6O: 12 - 56%
SF6: 71 - 100%
0 0:2 0:4 0:6 0:8 1�40
�30
�20
�10
0(b)
mole fraction of attaching gas
Dew
pointofattachinggas(�C)
C5F10O: 3 - 27%
2-C4F8: 15 - 80%
c-C4F8O: 16 - 86%
C4F7N: 17 - 99%
C3HF7: 31 - 100%
C3H2F4: 36 - 100%
SF5CF3: 39 - 100%
C3F6O: 57 - 100%
SF6: 100%
Figure 6.10: Dew point of the gases under study, as a function oftheir mole fraction in N2, for a total pressure of (a) 600 kPa and (b)130 kPa.
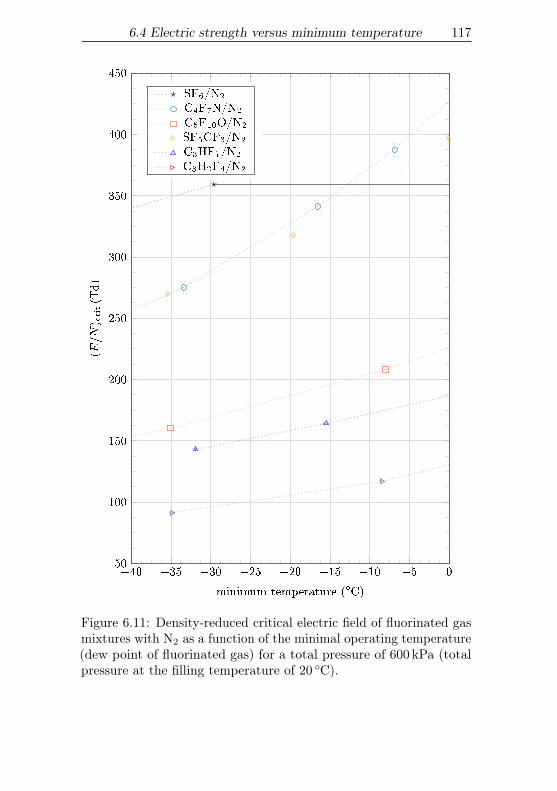
6.4 Electric strength versus minimum temperature 117
�40 �35 �30 �25 �20 �15 �10 �5 050
100
150
200
250
300
350
400
450
SF6/N2
C4F7N/N2
C5F10O/N2
SF5CF3/N2
C3HF7/N2
C3H2F4/N2
minimum temperature (�C)
(E=N
) crit(Td)
Figure 6.11: Density-reduced critical electric field of fluorinated gasmixtures with N2 as a function of the minimal operating temperature(dew point of fluorinated gas) for a total pressure of 600 kPa (totalpressure at the filling temperature of 20 ◦C).
118 6 Inter-comparison of the gases under study
�40 �35 �30 �25 �20 �15 �10 �5 0100
150
200
250
300
350
400
450
500
550
600
SF6/N2
C4F7N/N2
C5F10O/N2
SF5CF3/N2
C3HF7/N2
C3H2F4/N2
minimum temperature (�C)
(E=N
) crit(Td)
Figure 6.12: Density-reduced critical electric field of fluorinated gasmixtures with N2 as a function of the minimal operating temperature(dew point of fluorinated gas) for a total pressure of 130 kPa (totalpressure at the filling temperature of 20 ◦C).
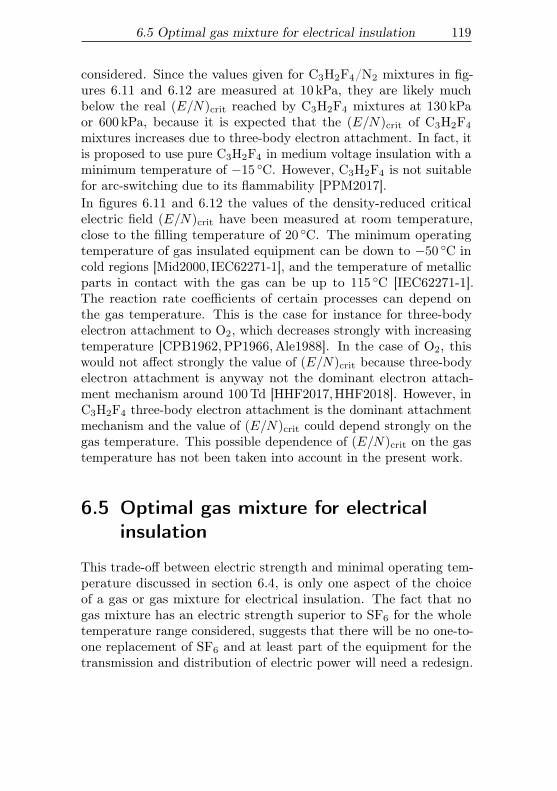
6.5 Optimal gas mixture for electrical insulation 119
considered. Since the values given for C3H2F4/N2 mixtures in fig-ures 6.11 and 6.12 are measured at 10 kPa, they are likely muchbelow the real (E/N)crit reached by C3H2F4 mixtures at 130 kPaor 600 kPa, because it is expected that the (E/N)crit of C3H2F4
mixtures increases due to three-body electron attachment. In fact, itis proposed to use pure C3H2F4 in medium voltage insulation with aminimum temperature of −15 ◦C. However, C3H2F4 is not suitablefor arc-switching due to its flammability [PPM2017].In figures 6.11 and 6.12 the values of the density-reduced criticalelectric field (E/N)crit have been measured at room temperature,close to the filling temperature of 20 ◦C. The minimum operatingtemperature of gas insulated equipment can be down to −50 ◦C incold regions [Mid2000, IEC62271-1], and the temperature of metallicparts in contact with the gas can be up to 115 ◦C [IEC62271-1].The reaction rate coefficients of certain processes can depend onthe gas temperature. This is the case for instance for three-bodyelectron attachment to O2, which decreases strongly with increasingtemperature [CPB1962,PP1966,Ale1988]. In the case of O2, thiswould not affect strongly the value of (E/N)crit because three-bodyelectron attachment is anyway not the dominant electron attach-ment mechanism around 100Td [HHF2017,HHF2018]. However, inC3H2F4 three-body electron attachment is the dominant attachmentmechanism and the value of (E/N)crit could depend strongly on thegas temperature. This possible dependence of (E/N)crit on the gastemperature has not been taken into account in the present work.
6.5 Optimal gas mixture for electricalinsulation
This trade-off between electric strength and minimal operating tem-perature discussed in section 6.4, is only one aspect of the choiceof a gas or gas mixture for electrical insulation. The fact that nogas mixture has an electric strength superior to SF6 for the wholetemperature range considered, suggests that there will be no one-to-one replacement of SF6 and at least part of the equipment for thetransmission and distribution of electric power will need a redesign.
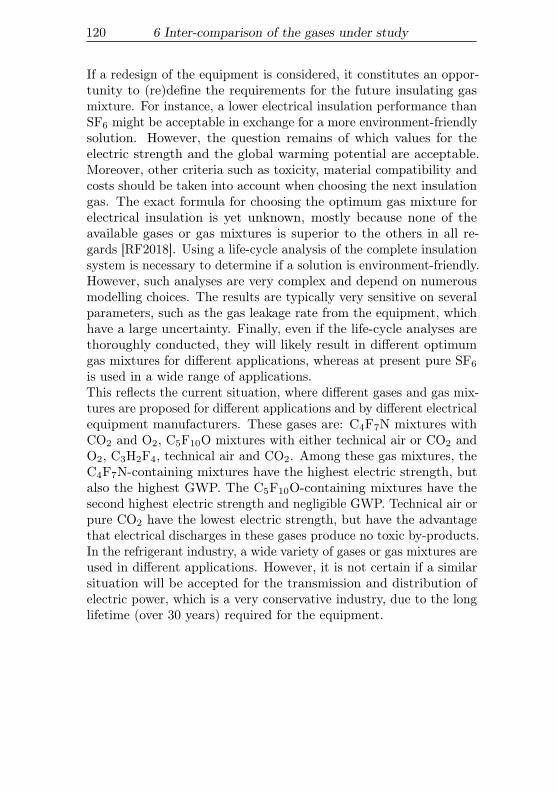
120 6 Inter-comparison of the gases under study
If a redesign of the equipment is considered, it constitutes an oppor-tunity to (re)define the requirements for the future insulating gasmixture. For instance, a lower electrical insulation performance thanSF6 might be acceptable in exchange for a more environment-friendlysolution. However, the question remains of which values for theelectric strength and the global warming potential are acceptable.Moreover, other criteria such as toxicity, material compatibility andcosts should be taken into account when choosing the next insulationgas. The exact formula for choosing the optimum gas mixture forelectrical insulation is yet unknown, mostly because none of theavailable gases or gas mixtures is superior to the others in all re-gards [RF2018]. Using a life-cycle analysis of the complete insulationsystem is necessary to determine if a solution is environment-friendly.However, such analyses are very complex and depend on numerousmodelling choices. The results are typically very sensitive on severalparameters, such as the gas leakage rate from the equipment, whichhave a large uncertainty. Finally, even if the life-cycle analyses arethoroughly conducted, they will likely result in different optimumgas mixtures for different applications, whereas at present pure SF6
is used in a wide range of applications.This reflects the current situation, where different gases and gas mix-tures are proposed for different applications and by different electricalequipment manufacturers. These gases are: C4F7N mixtures withCO2 and O2, C5F10O mixtures with either technical air or CO2 andO2, C3H2F4, technical air and CO2. Among these gas mixtures, theC4F7N-containing mixtures have the highest electric strength, butalso the highest GWP. The C5F10O-containing mixtures have thesecond highest electric strength and negligible GWP. Technical air orpure CO2 have the lowest electric strength, but have the advantagethat electrical discharges in these gases produce no toxic by-products.In the refrigerant industry, a wide variety of gases or gas mixtures areused in different applications. However, it is not certain if a similarsituation will be accepted for the transmission and distribution ofelectric power, which is a very conservative industry, due to the longlifetime (over 30 years) required for the equipment.

7 Conclusion and Outlook
A pulsed Townsend experiment has been used to obtain the electronand ion transport coefficients, reaction rate coefficients and electronattachment cross sections in eight fluorinated gases and in mixturesof these gases with either N2 and and CO2. These results are ofdirect interest for applications: mixtures of C4F7N with CO2 andO2 are used in electrical insulation under the name ’g3’, mixtures ofC5F10O with either synthetic air or with CO2 and O2 under the name’air+’, C3H2F4 and 2-C4F8 have also both been patented for use inelectrical insulation, C3H2F4 is of further interest for resistive platechambers (RPC), c-C4F8O for Cherenkov detectors, and C3F6O forplasma-assisted polymerization.Furthermore, experimental and analytic methods have been con-tributed. Problematic aspects of the pulsed Townsend experimentsuch as the charging current and the space charge have been identifiedand remedied. Analytic models for the analysis and interpretationof measurements have been reviewed in detail and further developed.In particular a new method for calculating the ionization and attach-ment coefficients is proposed, which will be useful in the analysis offuture gases.Challenges remain both on the experimental side and on the modellingside. On the experimental side, the most interesting improvementwould be the identification of the discharge products, in the firstline ions, but ultimately also neutrals, to lift the ambiguity in themeasurement interpretation. On the modelling side, verifying theapplicability of the streamer criterion for electron-detaching gaseswould be interesting. For this purpose, the avalanche to streamertransition could be studied, e.g. by coupling a fluid model or Monte-Carlo simulation with a Poisson solver. Even further, modellingthe streamer to leader transition in a fully analytic way would beimportant for calculating the breakdown voltage of gases and gasmixtures in inhomogeneous electric fields.
121

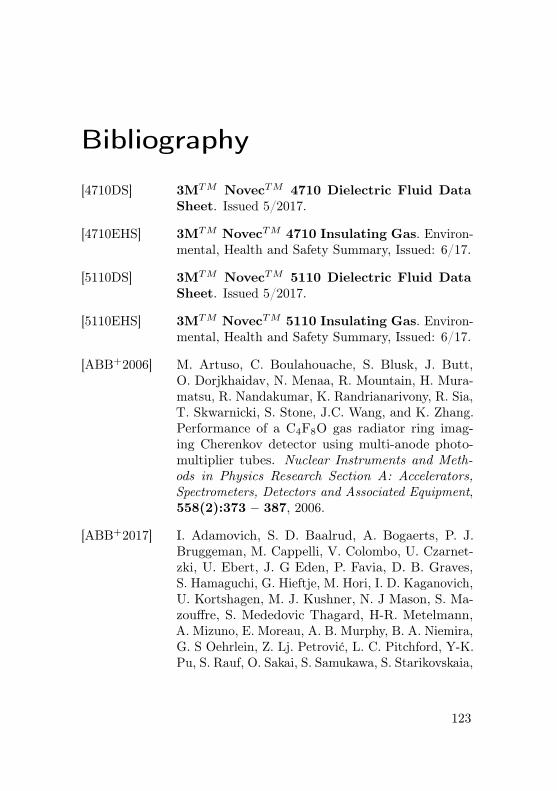
Bibliography
[4710DS] 3MTM NovecTM 4710 Dielectric Fluid DataSheet. Issued 5/2017.
[4710EHS] 3MTM NovecTM 4710 Insulating Gas. Environ-mental, Health and Safety Summary, Issued: 6/17.
[5110DS] 3MTM NovecTM 5110 Dielectric Fluid DataSheet. Issued 5/2017.
[5110EHS] 3MTM NovecTM 5110 Insulating Gas. Environ-mental, Health and Safety Summary, Issued: 6/17.
[ABB+2006] M. Artuso, C. Boulahouache, S. Blusk, J. Butt,O. Dorjkhaidav, N. Menaa, R. Mountain, H. Mura-matsu, R. Nandakumar, K. Randrianarivony, R. Sia,T. Skwarnicki, S. Stone, J.C. Wang, and K. Zhang.Performance of a C4F8O gas radiator ring imag-ing Cherenkov detector using multi-anode photo-multiplier tubes. Nuclear Instruments and Meth-ods in Physics Research Section A: Accelerators,Spectrometers, Detectors and Associated Equipment,558(2):373 – 387, 2006.
[ABB+2017] I. Adamovich, S. D. Baalrud, A. Bogaerts, P. J.Bruggeman, M. Cappelli, V. Colombo, U. Czarnet-zki, U. Ebert, J. G Eden, P. Favia, D. B. Graves,S. Hamaguchi, G. Hieftje, M. Hori, I. D. Kaganovich,U. Kortshagen, M. J. Kushner, N. J Mason, S. Ma-zouffre, S. Mededovic Thagard, H-R. Metelmann,A. Mizuno, E. Moreau, A. B. Murphy, B. A. Niemira,G. S Oehrlein, Z. Lj. Petrović, L. C. Pitchford, Y-K.Pu, S. Rauf, O. Sakai, S. Samukawa, S. Starikovskaia,
123
124 Bibliography
J. Tennyson, K Terashima, M. M. Turner, M. C. M.van de Sanden, and A. Vardelle. The 2017 plasmaroadmap: Low temperature plasma science andtechnology. Journal of Physics D: Applied Physics,50(32):323001, 2017.
[Ahe2011] E. Ahedo. Plasmas for space propulsion. PlasmaPhysics and Controlled Fusion, 53(12):124037,2011.
[Aka2010] R. Akasaka. An application of the extended cor-responding states model to thermodynamic prop-erty calculations for trans-1,3,3,3-tetrafluoropropene(HFO-1234ze(E)). International Journal of Refrig-eration, 33(5):907–914, 2010.
[Ale1988] N. L. Aleksandrov. Three-body electron attachmentto a molecule. Soviet Physics Uspekhi, 31(2):101,1988.
[All1982] W. P. Allis. Semidivergence of the legendre ex-pansion of the boltzmann equation. Phys. Rev. A,26:1704–1712, Sep 1982.
[Asc1985] T. Aschwanden. Die ermittlung physikalischerentladungsparameter in isoliergasen und isoliergas-gemischen mit einer verbesserten swarm-methode.Diss. ETH, 7931, 1985.
[BAN+2017] S. Blàzquez, M. Antinolo, O. J. Nielsen, J. Al-baladejo, and E. Jiménez. Reaction kinetics of(CF3)2CFCN with oh radicals as a function of tem-perature (278-358K): A good replacement for green-house SF6? Chemical Physics Letters, 687:297 –302, 2017.
[BDKZ1998] A. L. Beyerlein, D. D. DesMarteau, I. Kul, andG. Zhao. Properties of novel fluorinated compoundsand their mixtures as alternative refrigerants. FluidPhase Equilibria, 150-151:287–296, 1998.
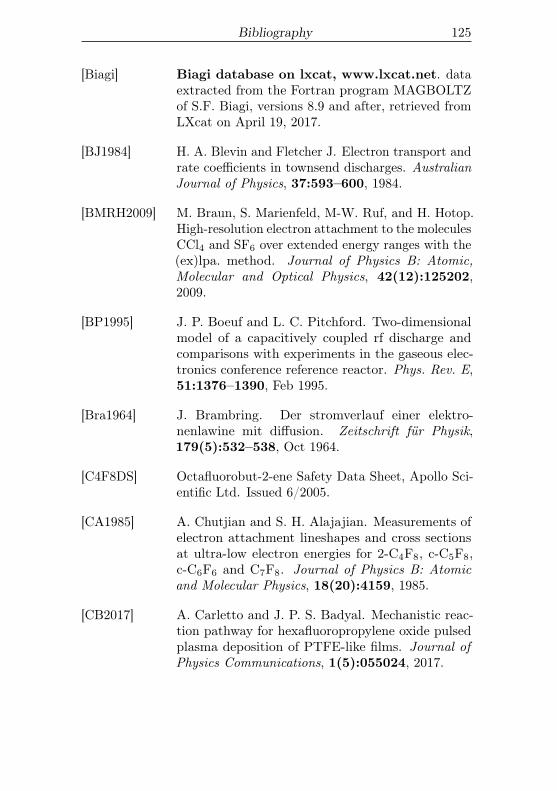
Bibliography 125
[Biagi] Biagi database on lxcat, www.lxcat.net. dataextracted from the Fortran program MAGBOLTZof S.F. Biagi, versions 8.9 and after, retrieved fromLXcat on April 19, 2017.
[BJ1984] H. A. Blevin and Fletcher J. Electron transport andrate coefficients in townsend discharges. AustralianJournal of Physics, 37:593–600, 1984.
[BMRH2009] M. Braun, S. Marienfeld, M-W. Ruf, and H. Hotop.High-resolution electron attachment to the moleculesCCl4 and SF6 over extended energy ranges with the(ex)lpa. method. Journal of Physics B: Atomic,Molecular and Optical Physics, 42(12):125202,2009.
[BP1995] J. P. Boeuf and L. C. Pitchford. Two-dimensionalmodel of a capacitively coupled rf discharge andcomparisons with experiments in the gaseous elec-tronics conference reference reactor. Phys. Rev. E,51:1376–1390, Feb 1995.
[Bra1964] J. Brambring. Der stromverlauf einer elektro-nenlawine mit diffusion. Zeitschrift für Physik,179(5):532–538, Oct 1964.
[C4F8DS] Octafluorobut-2-ene Safety Data Sheet, Apollo Sci-entific Ltd. Issued 6/2005.
[CA1985] A. Chutjian and S. H. Alajajian. Measurements ofelectron attachment lineshapes and cross sectionsat ultra-low electron energies for 2-C4F8, c-C5F8,c-C6F6 and C7F8. Journal of Physics B: Atomicand Molecular Physics, 18(20):4159, 1985.
[CB2017] A. Carletto and J. P. S. Badyal. Mechanistic reac-tion pathway for hexafluoropropylene oxide pulsedplasma deposition of PTFE-like films. Journal ofPhysics Communications, 1(5):055024, 2017.
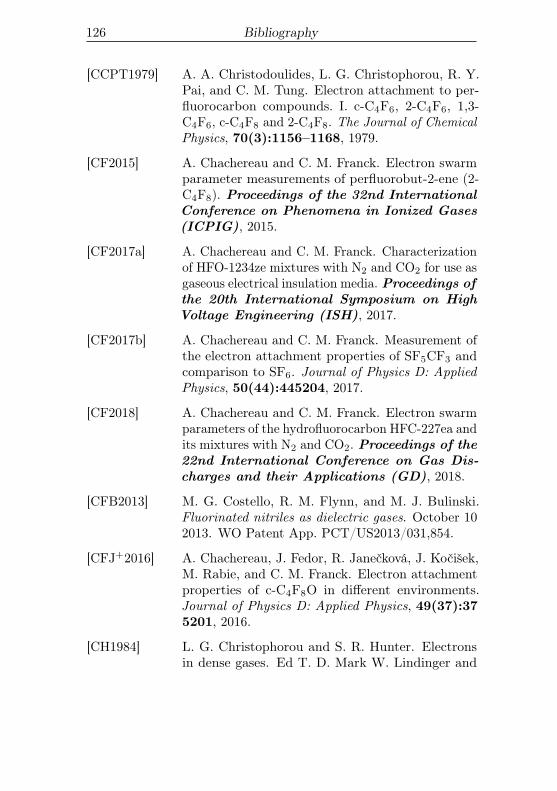
126 Bibliography
[CCPT1979] A. A. Christodoulides, L. G. Christophorou, R. Y.Pai, and C. M. Tung. Electron attachment to per-fluorocarbon compounds. I. c-C4F6, 2-C4F6, 1,3-C4F6, c-C4F8 and 2-C4F8. The Journal of ChemicalPhysics, 70(3):1156–1168, 1979.
[CF2015] A. Chachereau and C. M. Franck. Electron swarmparameter measurements of perfluorobut-2-ene (2-C4F8). Proceedings of the 32nd InternationalConference on Phenomena in Ionized Gases(ICPIG), 2015.
[CF2017a] A. Chachereau and C. M. Franck. Characterizationof HFO-1234ze mixtures with N2 and CO2 for use asgaseous electrical insulation media. Proceedings ofthe 20th International Symposium on HighVoltage Engineering (ISH), 2017.
[CF2017b] A. Chachereau and C. M. Franck. Measurement ofthe electron attachment properties of SF5CF3 andcomparison to SF6. Journal of Physics D: AppliedPhysics, 50(44):445204, 2017.
[CF2018] A. Chachereau and C. M. Franck. Electron swarmparameters of the hydrofluorocarbon HFC-227ea andits mixtures with N2 and CO2. Proceedings of the22nd International Conference on Gas Dis-charges and their Applications (GD), 2018.
[CFB2013] M. G. Costello, R. M. Flynn, and M. J. Bulinski.Fluorinated nitriles as dielectric gases. October 102013. WO Patent App. PCT/US2013/031,854.
[CFJ+2016] A. Chachereau, J. Fedor, R. Janečková, J. Kočišek,M. Rabie, and C. M. Franck. Electron attachmentproperties of c-C4F8O in different environments.Journal of Physics D: Applied Physics, 49(37):375201, 2016.
[CH1984] L. G. Christophorou and S. R. Hunter. Electronsin dense gases. Ed T. D. Mark W. Lindinger and
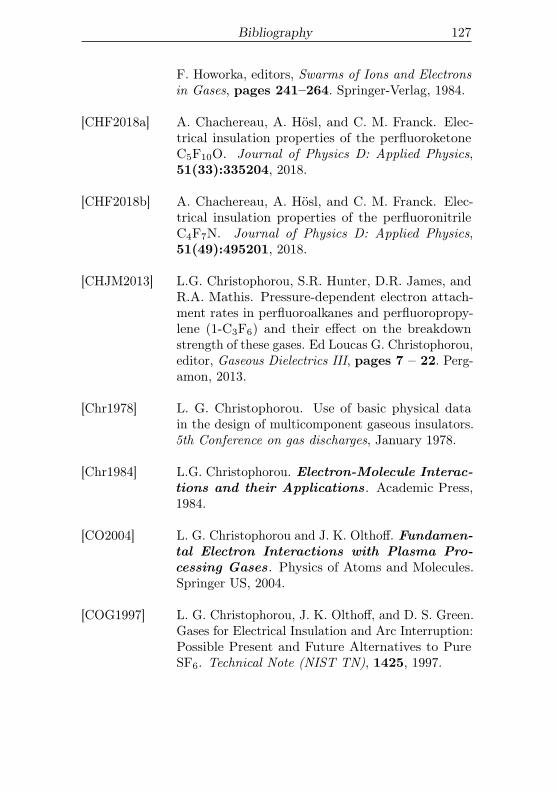
Bibliography 127
F. Howorka, editors, Swarms of Ions and Electronsin Gases, pages 241–264. Springer-Verlag, 1984.
[CHF2018a] A. Chachereau, A. Hösl, and C. M. Franck. Elec-trical insulation properties of the perfluoroketoneC5F10O. Journal of Physics D: Applied Physics,51(33):335204, 2018.
[CHF2018b] A. Chachereau, A. Hösl, and C. M. Franck. Elec-trical insulation properties of the perfluoronitrileC4F7N. Journal of Physics D: Applied Physics,51(49):495201, 2018.
[CHJM2013] L.G. Christophorou, S.R. Hunter, D.R. James, andR.A. Mathis. Pressure-dependent electron attach-ment rates in perfluoroalkanes and perfluoropropy-lene (1-C3F6) and their effect on the breakdownstrength of these gases. Ed Loucas G. Christophorou,editor, Gaseous Dielectrics III, pages 7 – 22. Perg-amon, 2013.
[Chr1978] L. G. Christophorou. Use of basic physical datain the design of multicomponent gaseous insulators.5th Conference on gas discharges, January 1978.
[Chr1984] L.G. Christophorou. Electron-Molecule Interac-tions and their Applications. Academic Press,1984.
[CO2004] L. G. Christophorou and J. K. Olthoff. Fundamen-tal Electron Interactions with Plasma Pro-cessing Gases. Physics of Atoms and Molecules.Springer US, 2004.
[COG1997] L. G. Christophorou, J. K. Olthoff, and D. S. Green.Gases for Electrical Insulation and Arc Interruption:Possible Present and Future Alternatives to PureSF6. Technical Note (NIST TN), 1425, 1997.
128 Bibliography
[CP2014] A. Chachereau and S. Pancheshnyi. Calculation ofthe effective ionization rate in air by considering elec-tron detachment from negative ions. IEEE Transac-tions on Plasma Science, 42(10):3328–3338, Oct2014.
[CPB1962] L. M. Chanin, A. V. Phelps, and M. A. Biondi. Mea-surements of the attachment of low-energy electronsto oxygen molecules. Phys. Rev., 128:219–230, Oct1962.
[CRF2016] A. Chachereau, M. Rabie, and C. M. Franck. Elec-tron swarm parameters of the hydrofluoroolefineHFO1234ze. Plasma Sources Science and Technol-ogy, 25(4):045005, 2016.
[CRSF1998] K. Rajeshwar C. R. Simpson, L. Mendicino andJ. M. Fenton, editors. Environmental Issues in theElectronics/Semiconductor Industries and Electro-chemicl/Photochemical Methods for Pollution Abate-ment, volume 98-5. The Electrochemical Society,1998.
[CW1981] P. J. Chantry and R. E Wootton. A. critique ofmethods for calculating the dielectric strength of gasmixtures. Journal of Applied Physics, 52(4):2731,1981.
[CWC1982] C. L. Chen, R. E. Wooton, and P. J. Chantry. Mea-sured attachment and ionization cross sections anddielectric strength of SF5CF3 and C3F6. Proceed-ings of the 7th International Conference on GasDischarges and their Applications, pages 321–324,1982.
[DBBC+2011] M. Dicko, G. Belaribi-Boukais, C. Coquelet,A. Valtz, F. Brahim Belaribi, P. Naidoo, andD. Ramjugernath. Experimental measurement of va-por pressures and densities at saturation of pure hex-afluoropropylene oxide: Modeling using a crossover
Bibliography 129
equation of state. Industrial & Engineering Chem-istry Research, 50(8):4761–4768, 2011.
[DPR+2017] C. Doiron, T. A. Paul, B. Radisavljevic, N. Ranjan,G. A. Di, and S. Scheel. Use of a linear octaflu-orobutene as a dielectric compound in an environ-mentally safe dielectric-insulation or arc-extinctionfluid. 2017. patent WO2017162578A1.
[DSC+2012] Z Donkó, J Schulze, U Czarnetzki, A Derzsi, P Hart-mann, I Korolov, and E Schüngel. Fundamentalinvestigations of capacitive radio frequency plasmas:simulations and experiments. Plasma Physics andControlled Fusion, 54(12):124003, 2012.
[DSZ+2001] Y. Y. Duan, L. Shi, M. S. Zhu, L. Z. Han,and C. Zhang. Thermodynamic properties of1,1,1,2,3,3,3-heptafluoropropane. International Jour-nal of Thermophysics, 22(5):1463–1474, 2001.
[DTF2012] D. A. Dahl, T. H. Teich, and C. M. Franck. Obtain-ing precise electron swarm parameters from a pulsedTownsend setup. Journal of Physics D: AppliedPhysics, 45(48):485201, 2012.
[DTM2016] T Diggelmann, D Tehlar, and P Müller. 170 kV pilotinstallation with a ketone based insulation gas withfirst experience from operation in the grid. Cigre,Paris, pages 105–113, 2016.
[Dut1975] J. Dutton. A survey of electron swarm data. Journalof Physical and Chemical Reference Data, 4(3):577–856, 1975.
[EC2006] Regulation (EC) No 842/2006 of the EuropeanParliament and of the Council of 17 May 2006 oncertain fluorinated greenhouse gases.
[ECHA] European Chemicals Agency (ECHA). ac-cessed on the 11th of August 2017.
130 Bibliography
[ESRL] Sulfur hexafluoride (SF6) hemisphericand global monthly means from theNOAA/ESRL halocarbons program. Na-tional Oceanic and Atmospheric Administration(NOAA) and Earth System Research Laboratory(ESRL).
[ETHZ] ETHZ database on lxcat, www.lxcat.net.
[EU2014] Regulation (EU) No 517/2014 of the EuropeanParliament and of the Council of 16 April 2014 onfluorinated greenhouse gases and repealing Regula-tion (EC) No 842/2006 Text with EEA. relevance.
[FBB+2013] J. Fowles, R. Boatman, J. Bootman, C. Lewis,D. Morgott, E. Rushton, J. van Rooij, and M. Ban-ton. A review of the toxicological and environmentalhazards and risks of tetrahydrofuran. Critical Re-views in Toxicology, 43(10):811–828, 2013.
[FDR+2013] C. M. Franck, D. A. Dahl, M. Rabie, P. Haefliger,and M. Koch. An efficient procedure to identify andquantify new molecules for insulating gas mixtures.Contributions to Plasma Physics, 54(1):3–13, 2013.
[FM200DS] DupontTM FM-200(R) Rire extinguishingagent, Properties, Uses, Storage and Han-dling. Issued 9/2009.
[FMA2008] J. Fedor, O. May, and M. Allan. Absolute crosssections for dissociative electron attachment to HCl,HBr, and their deuterated analogs. Phys. Rev. A,78:032701, Sep 2008.
[GAG2016] M. Grofulović, L. L. Alves, and V. Guerra. Electron-neutral scattering cross sections for CO2 : a com-plete and consistent set and an assessment of dis-sociation. Journal of Physics D: Applied Physics,49(39):395207, 2016.
Bibliography 131
[GBDP1983] J. W. Gallagher, E. C. Beaty, J. Dutton, and L. C.Pitchford. An annotated compilation and appraisalof electron swarm data in electronegative gases.Journal of Physical and Chemical Reference Data,12(1):109–152, 1983.
[GCM2016] R. Guida, M. Capeans, and B. Mandelli. Character-ization of RPC operation with new environmentalfriendly mixtures for LHC application and beyond.Journal of Instrumentation, 11(07):C07016, 2016.
[GDS2013] D. Gonzalez-Diaz and A. Sharma. Challenges for re-sistive gaseous detectors towards RPC2014. Journalof Instrumentation, 8(02):T02001, 2013.
[GGF+2008] K. Graupner, L.M. Graham, T.A. Field, C.A. May-hew, I.I. Fabrikant, T.M. Miller, M. Braun, M.-W. Ruf, and H. Hotop. Highly resolved absolutecross-sections for dissociative electron attachment toSF5CF3. International Journal of Mass Spectrome-try, 277(1-3):113 – 122, 2008.
[GVG+2007] M. J. Gallagher, N. Vaze, S. Gangoli, V. N. Vasilets,A. F. Gutsol, T. N. Milovanova, S. Anandan, D. M.Murasko, and A. A. Fridman. Rapid inactivation ofairborne bacteria using atmospheric pressure dielec-tric barrier grating discharge. IEEE Transactionson Plasma Science, 35(5):1501–1510, Oct 2007.
[GW2009] C. Guder and W. Wagner. A reference equationof state for the thermodynamic properties of sul-fur hexafluoride (SF6) for temperatures from themelting line to 625 K and pressures up to 150 MPa.Journal of Physical and Chemical Reference Data,38(1):33–94, 2009.
[Hag2016] G. J. M. Hagelaar. Coulomb collisions in the boltz-mann equation for electrons in low-temperature gasdischarge plasmas. Plasma Sources Science andTechnology, 25(1):015015, 2016.
132 Bibliography
[HC1974] L. G. H. Huxley and R. W. Crompton. The diffusionand drift of electrons in gases. Wiley series in plasmaphysics. Wiley, New York, 1974.
[HCC1987] S. R. Hunter, J. G. Carter, and L. G. Christophorou.Electron attachment and ionization processes in CF4,C2F6, C3F8, and n-C4F10. The Journal of ChemicalPhysics, 86(2):693–703, 1987.
[HCF2019] A. Hösl, A. Chachereau, and C. M. Franck. Identifi-cation of the discharge kinetics in the perfluoronitrileC4F7N with swarm and breakdown experiments. J.Phys. D: Appl. Phys., 2019. in preparation.
[HF2018] P. Häfliger and C. M. Franck. Detailed precisionand accuracy analysis of swarm parameters from aPulsed Townsend experiment. Review of ScientificInstruments, 89(2):023114, 2018.
[HFODS] Solstice ze Refrigerant (HFO-1234ze), Tech-nical Data Sheet. Issued 2/2017.
[HFPODS] DupontTM HFPO, Properties, Uses, Storage andHandling. Issued 1/2008.
[HG1953] Melvin A. Harrison and Ronald Geballe. Simulta-neous measurement of ionization and attachmentcoefficients. Phys. Rev., 91:1–7, Jul 1953.
[HHF2017] A. Hösl, P. Häfliger, and C. M. Franck. Measurementof ionization, attachment, detachment and chargetransfer rate coefficients in dry air around the criticalelectric field. Journal of Physics D: Applied Physics,50(48):485207, 2017.
[HHF2018] P. Haefliger, A. Hösl, and C. M. Franck. Experimen-tally derived rate coefficients for electron ionization,attachment and detachment as well as ion conver-sion in pure O2 and N2-O2 mixtures. Journal ofPhysics D: Applied Physics, 51(35):355201, 2018.
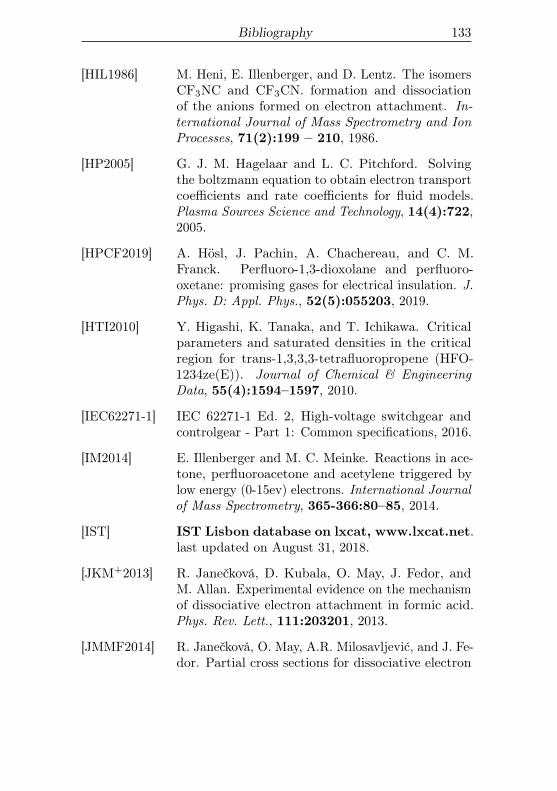
Bibliography 133
[HIL1986] M. Heni, E. Illenberger, and D. Lentz. The isomersCF3NC and CF3CN. formation and dissociationof the anions formed on electron attachment. In-ternational Journal of Mass Spectrometry and IonProcesses, 71(2):199 – 210, 1986.
[HP2005] G. J. M. Hagelaar and L. C. Pitchford. Solvingthe boltzmann equation to obtain electron transportcoefficients and rate coefficients for fluid models.Plasma Sources Science and Technology, 14(4):722,2005.
[HPCF2019] A. Hösl, J. Pachin, A. Chachereau, and C. M.Franck. Perfluoro-1,3-dioxolane and perfluoro-oxetane: promising gases for electrical insulation. J.Phys. D: Appl. Phys., 52(5):055203, 2019.
[HTI2010] Y. Higashi, K. Tanaka, and T. Ichikawa. Criticalparameters and saturated densities in the criticalregion for trans-1,3,3,3-tetrafluoropropene (HFO-1234ze(E)). Journal of Chemical & EngineeringData, 55(4):1594–1597, 2010.
[IEC62271-1] IEC 62271-1 Ed. 2, High-voltage switchgear andcontrolgear - Part 1: Common specifications, 2016.
[IM2014] E. Illenberger and M. C. Meinke. Reactions in ace-tone, perfluoroacetone and acetylene triggered bylow energy (0-15ev) electrons. International Journalof Mass Spectrometry, 365-366:80–85, 2014.
[IST] IST Lisbon database on lxcat, www.lxcat.net.last updated on August 31, 2018.
[JKM+2013] R. Janečková, D. Kubala, O. May, J. Fedor, andM. Allan. Experimental evidence on the mechanismof dissociative electron attachment in formic acid.Phys. Rev. Lett., 111:203201, 2013.
[JMMF2014] R. Janečková, O. May, A.R. Milosavljević, and J. Fe-dor. Partial cross sections for dissociative electron
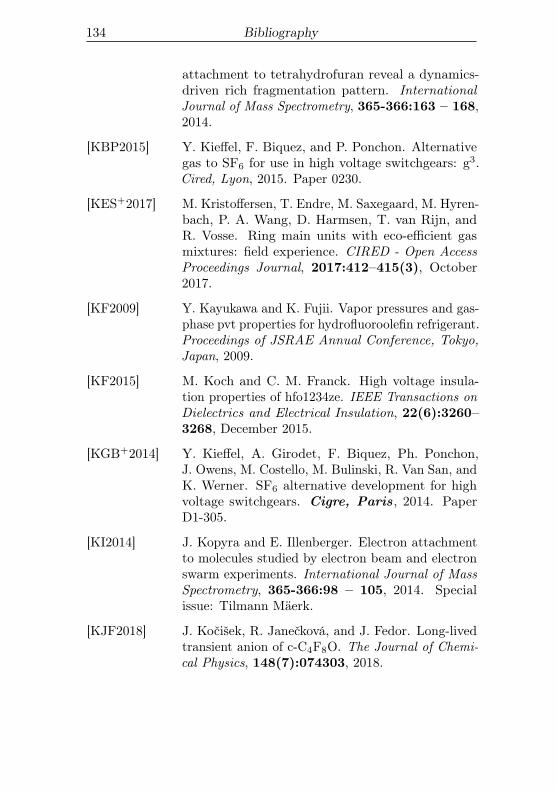
134 Bibliography
attachment to tetrahydrofuran reveal a dynamics-driven rich fragmentation pattern. InternationalJournal of Mass Spectrometry, 365-366:163 – 168,2014.
[KBP2015] Y. Kieffel, F. Biquez, and P. Ponchon. Alternativegas to SF6 for use in high voltage switchgears: g3.Cired, Lyon, 2015. Paper 0230.
[KES+2017] M. Kristoffersen, T. Endre, M. Saxegaard, M. Hyren-bach, P. A. Wang, D. Harmsen, T. van Rijn, andR. Vosse. Ring main units with eco-efficient gasmixtures: field experience. CIRED - Open AccessProceedings Journal, 2017:412–415(3), October2017.
[KF2009] Y. Kayukawa and K. Fujii. Vapor pressures and gas-phase pvt properties for hydrofluoroolefin refrigerant.Proceedings of JSRAE Annual Conference, Tokyo,Japan, 2009.
[KF2015] M. Koch and C. M. Franck. High voltage insula-tion properties of hfo1234ze. IEEE Transactions onDielectrics and Electrical Insulation, 22(6):3260–3268, December 2015.
[KGB+2014] Y. Kieffel, A. Girodet, F. Biquez, Ph. Ponchon,J. Owens, M. Costello, M. Bulinski, R. Van San, andK. Werner. SF6 alternative development for highvoltage switchgears. Cigre, Paris, 2014. PaperD1-305.
[KI2014] J. Kopyra and E. Illenberger. Electron attachmentto molecules studied by electron beam and electronswarm experiments. International Journal of MassSpectrometry, 365-366:98 – 105, 2014. Specialissue: Tilmann Mäerk.
[KJF2018] J. Kočišek, R. Janečková, and J. Fedor. Long-livedtransient anion of c-C4F8O. The Journal of Chemi-cal Physics, 148(7):074303, 2018.
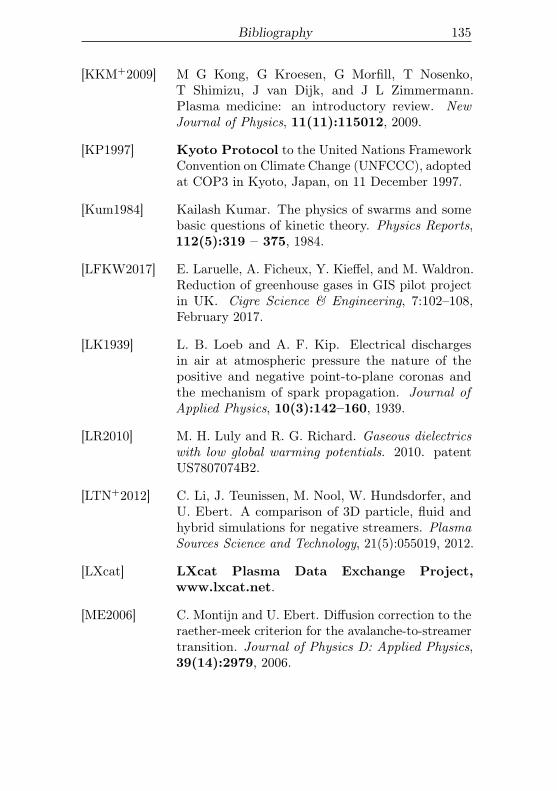
Bibliography 135
[KKM+2009] M G Kong, G Kroesen, G Morfill, T Nosenko,T Shimizu, J van Dijk, and J L Zimmermann.Plasma medicine: an introductory review. NewJournal of Physics, 11(11):115012, 2009.
[KP1997] Kyoto Protocol to the United Nations FrameworkConvention on Climate Change (UNFCCC), adoptedat COP3 in Kyoto, Japan, on 11 December 1997.
[Kum1984] Kailash Kumar. The physics of swarms and somebasic questions of kinetic theory. Physics Reports,112(5):319 – 375, 1984.
[LFKW2017] E. Laruelle, A. Ficheux, Y. Kieffel, and M. Waldron.Reduction of greenhouse gases in GIS pilot projectin UK. Cigre Science & Engineering, 7:102–108,February 2017.
[LK1939] L. B. Loeb and A. F. Kip. Electrical dischargesin air at atmospheric pressure the nature of thepositive and negative point-to-plane coronas andthe mechanism of spark propagation. Journal ofApplied Physics, 10(3):142–160, 1939.
[LR2010] M. H. Luly and R. G. Richard. Gaseous dielectricswith low global warming potentials. 2010. patentUS7807074B2.
[LTN+2012] C. Li, J. Teunissen, M. Nool, W. Hundsdorfer, andU. Ebert. A comparison of 3D particle, fluid andhybrid simulations for negative streamers. PlasmaSources Science and Technology, 21(5):055019, 2012.
[LXcat] LXcat Plasma Data Exchange Project,www.lxcat.net.
[ME2006] C. Montijn and U. Ebert. Diffusion correction to theraether-meek criterion for the avalanche-to-streamertransition. Journal of Physics D: Applied Physics,39(14):2979, 2006.
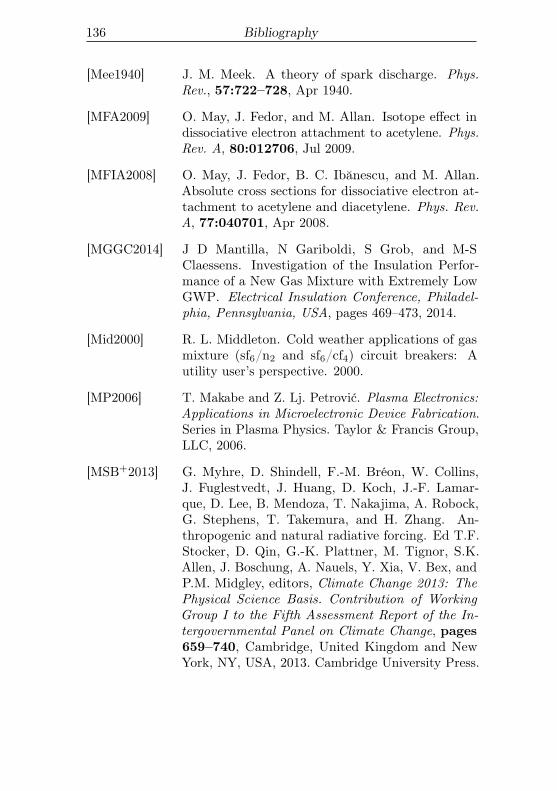
136 Bibliography
[Mee1940] J. M. Meek. A theory of spark discharge. Phys.Rev., 57:722–728, Apr 1940.
[MFA2009] O. May, J. Fedor, and M. Allan. Isotope effect indissociative electron attachment to acetylene. Phys.Rev. A, 80:012706, Jul 2009.
[MFIA2008] O. May, J. Fedor, B. C. Ibănescu, and M. Allan.Absolute cross sections for dissociative electron at-tachment to acetylene and diacetylene. Phys. Rev.A, 77:040701, Apr 2008.
[MGGC2014] J D Mantilla, N Gariboldi, S Grob, and M-SClaessens. Investigation of the Insulation Perfor-mance of a New Gas Mixture with Extremely LowGWP. Electrical Insulation Conference, Philadel-phia, Pennsylvania, USA, pages 469–473, 2014.
[Mid2000] R. L. Middleton. Cold weather applications of gasmixture (sf6/n2 and sf6/cf4) circuit breakers: Autility user’s perspective. 2000.
[MP2006] T. Makabe and Z. Lj. Petrović. Plasma Electronics:Applications in Microelectronic Device Fabrication.Series in Plasma Physics. Taylor & Francis Group,LLC, 2006.
[MSB+2013] G. Myhre, D. Shindell, F.-M. Bréon, W. Collins,J. Fuglestvedt, J. Huang, D. Koch, J.-F. Lamar-que, D. Lee, B. Mendoza, T. Nakajima, A. Robock,G. Stephens, T. Takemura, and H. Zhang. An-thropogenic and natural radiative forcing. Ed T.F.Stocker, D. Qin, G.-K. Plattner, M. Tignor, S.K.Allen, J. Boschung, A. Nauels, Y. Xia, V. Bex, andP.M. Midgley, editors, Climate Change 2013: ThePhysical Science Basis. Contribution of WorkingGroup I to the Fifth Assessment Report of the In-tergovernmental Panel on Climate Change, pages659–740, Cambridge, United Kingdom and NewYork, NY, USA, 2013. Cambridge University Press.
Bibliography 137
[MSC2014] Dielectric insulation medium. PatentUS8704095B2.
[MSS1985] H. Millauer, W. Schwertfeger, and G. Siegemund.Hexafluorpropenoxid - eine schlüsselverbindung derorganischen fluorchemie. Angewandte Chemie,97(3):164–182, 1985.
[MWF2017] T. J. Millar, C. Walsh, and T. A. Field. Negativeions in space. Chemical Reviews, 117(3):1765–1795, 2017.
[Nie1998] L. Niemeyer. A. systematic search for insulationgases and their environmental evaluation. GaseousDielectrics VIII, pages 459–464, 1998.
[NPC2018] D. Nalewajek, A. J. Poss, and C. L. Cantlon. Fu-migant compositions and methods based on hexaflu-oropropylene oxide (HFPO). March 2018. PatentWO/2018/057553.
[NUW1989] L. Niemeyer, L. Ullrich, and N. Wiegart. Themechanism of leader breakdown in electronegativegases. IEEE Transactions on Electrical Insulation,24(2):309–324, April 1989.
[PAB+2017] L. C. Pitchford, L. L. Alves, K. Bartschat, S. F.Biagi, M-C. Bordage, I. Bray, C. E. Brion, M. J.Brunger, L. Campbell, A. Chachereau, B. Chaud-hury, L. G. Christophorou, E. Carbone, N. A. Dy-atko, C. M. Franck, D. V. Fursa, R. K. Gangwar,V. Guerra, P. Haefliger, G. J. M. Hagelaar, A. Hösl,Y. Itikawa, I. V. Kochetov, R. P. McEachran, W. L.Morgan, A. P. Napartovich, V. Puech, M. Rabie,L. Sharma, R. Srivastava, A. D. Stauffer, J. Ten-nyson, J. de Urquijo, J. van Dijk, L. A. Viehland,M. C. Zammit, O. Zatsarinny, and S Panchesh-nyi. LXCat: an Open-Access, Web-Based Platformfor Data Needed for Modeling Low Temperature

138 Bibliography
Plasmas. Plasma Processes and Polymers, 14(1-2):1600098, 2017.
[Pan2013] S. Pancheshnyi. Effective ionization rate in nitrogen-oxygen mixtures. Journal of Physics D: AppliedPhysics, 46(15):155201, 2013.
[PBH+2012] L. Pitchford, M. C. Bordage, G. J. M. Hagelaar,S. Pancheshnyi, S. F. Biagi, Y. Itikawa, I. Kochetov,A. Napartovich, and A. V. Phelps. Comparisons ofsets of electron-neutral scattering cross sections andcalculated swarm parameters in O2. APS MeetingAbstracts, page PR1.088, October 2012.
[PDM+2009] Z. Lj. Petrović, S. Dujko, D. Marić, G. Malović, ŽNikitović, O. Šašić, J. Jovanović, V. Stojanović, andM Radmilović-Rađenović. Measurement and inter-pretation of swarm parameters and their applicationin plasma modelling. Journal of Physics D: AppliedPhysics, 42(19):194002, 2009.
[PF2018] J. Pachin and C. M. Franck. Measurements of theelectron swarm parameters of r1225ye(z) C3HF5 andits mixtures with N2 and CO2. Journal of PhysicsD: Applied Physics, 2018. in preparation.
[Phelps] Phelps database on lxcat, www.lxcat.net.data retrieved on June 27, 2014.
[Phi1988] E. Philippow. Taschenbuch Elektrotechnik. VEBVerlag Technik Berlin, 1988.
[PP1966] J. L. Pack and A. V. Phelps. Electron attachmentand detachment. i. pure o2 at low energy. The Jour-nal of Chemical Physics, 44(5):1870–1883, 1966.
[PP1985] A. V. Phelps and L. C. Pitchford. Anisotropic scat-tering of electrons by N2 and its effect on electrontransport. Phys. Rev. A, 31:2932–2949, May 1985.
Bibliography 139
[PPM2017] C. Preve, D. Piccoz, and R. Maladen. Application ofHFO1234ZEE in MV switchgear as SF6 alternativegas. CIRED, Open Access Proc. J., pages 42–45,2017.
[PSN+2002007] Z. Lj. Petrović, M. Šuvakov, Ž. Nikitović, S. Dujko,O. Šašić, J. Jovanović, G. Malovic, and V. Sto-janović. Kinetic phenomena in charged particletransport in gases, swarm parameters and cross sec-tion data. Plasma Sources Science and Technology,16(1):S1, 2007.
[Rae1939] H. Raether. Die entwicklung der elektronenlaw-ine in den funkenkanal. Zeitschrift für Physik,112(7):464–489, Jul 1939.
[Rae1964] H. Raether. Electron Avalanches and Breakdown inGases. Butterworth & Co Ltd., 1964.
[Raj2012] G. G. Raju. Gaseous electronics : tables, atoms,and molecules. CRC Press, 2012.
[Ram1939] S. Ramo. Currents induced by electron motion.Proceedings of the IRE, 27(9):584–585, Sept 1939.
[RCB1975] J. Rademacher, L. G. Christophorou, and R. P.Blaunstein. Electron attachment to sulphur diox-ide in high pressure gases. J. Chem. Soc., FaradayTrans. 2, 71:1212–1226, 1975.
[RF2015] M. Rabie and C. M. Franck. Computational screen-ing of new high voltage insulation gases with lowglobal warming potential. IEEE Transactions on Di-electrics and Electrical Insulation, 22(1):296–302,Feb 2015.
[RF2016] M. Rabie and C.M. Franck. METHES: A. montecarlo collision code for the simulation of electrontransport in low temperature plasmas. ComputerPhysics Communications, 203:268 – 277, 2016.
140 Bibliography
[RF2018] M. Rabie and C. M. Franck. Assessment of eco-friendly gases for electrical insulation to replace themost potent industrial greenhouse gas SF6. Environ.Sci. Technol., 52(2):369–380, 2018.
[RHCF2015] M. Rabie, P. Haefliger, A. Chachereau, and C. M.Franck. Obtaining electron attachment cross sec-tions by means of linear inversion of swarm parame-ters. J. Phys. D: Appl. Phys., 48(7):075201, 2015.
[RME+2017] E. A. Ray, F. L. Moore, J. W. Elkins, K. H. Rosenlof,J. C. Laube, T. Röckmann, D. R. Marsh, and A. E.Andrews. Quantification of the sf6 lifetime basedon mesospheric loss measured in the stratosphericpolar vortex. Journal of Geophysical Research: At-mospheres, 122(8):4626–4638, 2017.
[SAKA+2017] M. P. Sulbaek Andersen, M. Kyte, S. T. Andersen,C. J. Nielsen, and O. J. Nielsen. Atmospheric chem-istry of (CF3)2CFCN: A replacement compoundfor the most potent industrial greenhouse gas, SF6.Environmental Science & Technology, 51(3):1321–1329, 2017.
[SAP+2001] S. M. Starikovskaia, N. B. Anikin, S. V. Pancheshnyi,D. V. Zatsepin, and A. Yu Starikovskii. Pulsed break-down at high overvoltage: development, propagationand energy branching. Plasma Sources Science andTechnology, 10(2):344, 2001.
[SD2018] T. Sommerfeld and M. C. Davis. Ring-openingattachment as an explanation for the long lifetimeof the octafluorooxolane anion. The Journal ofChemical Physics, 149(8):084305, 2018.
[SF6DS] Safety data sheet, used sulphur hexafluoride,solvay. Revised 1/2018.
[Sho1938] W. Shockley. Currents to conductors induced by amoving point charge. Journal of Applied Physics,9(10):635–636, 1938.
Bibliography 141
[Siglo] Siglo database on lxcat, www.lxcat.net. dataretrieved on July 5, 2014.
[SNAGH1993] M. Salvi-Narkhede, J. L. Adcock, A. Gakh, andW. A. Van Hook. Vapor pressures, liquid mo-lar volumes, vapor non-ideality, and critical prop-erties of CF3OCF2CF2CF3, c-CF2CF2CF2CF2O,CF3OCF2OCF3, and CF3OCF2CF2H. The Journalof Chemical Thermodynamics, 25(5):643 – 647,1993.
[SNB2009] M. Seeger, L. Niemeyer, and M. Bujotzek. Leaderpropagation in uniform background fields inSF6. Journal of Physics D: Applied Physics,42(18):185205, 2009.
[SPA1999] M. Stepanović, Y. Pariat, and M. Allan. Dis-sociative electron attachment in cyclopentanone,γ-butyrolactone, ethylene carbonate and ethylenecarbonate-d4: Role of dipole-bound resonances. J.Chem. Phys., 110:11376, 1999.
[SRL+1995] H. C. Straub, P. Renault, B. G. Lindsay, K. A.Smith, and R. F. Stebbings. Absolute partial andtotal cross sections for electron-impact ionizationof argon from threshold to 1000 ev. Phys. Rev. A,52:1115–1124, Aug 1995.
[TDM+2015] D Tehlar, T Diggelmann, P Müller, R Buehler,N Ranjan, and C Doiron. Ketone based alterna-tive insulation medium in a 170 kV pilot installation.Cigre Colloquium Nagoya, Japan, pages 223–230,2015.
[TTH2010] K. Tanaka, G. Takahashi, and Y. Higashi. Mea-surements of the vapor pressures and pρt prop-erties for trans-1,3,3,3-tetrafluoropropene (HFO-1234ze(E)). Journal of Chemical & EngineeringData, 55(6):2169–2172, 2010.
142 Bibliography
[UNAM] UNAM database on lxcat, www.lxcat.net.data retrieved on January 27, 2017.
[VBM+2018] M. K. Vollmer, F. Bernard, B. Mitrevski, L. P.Steele, C. M. Trudinger, S. Reimann, R. L. Langen-felds, P. B. Krummel, P. J. Fraser, D. M. Etheridge,M. A. J. Curran, and J. B. Burkholder. Abundances,emissions, and loss processes of the long-lived and po-tent greenhouse gas octafluorooxolane (octafluorote-trahydrofuran, c-c4f8o) in the atmosphere. Atmo-spheric Chemistry and Physics Discussions, 2018:1–20, 2018.
[VKL+2017] M. Vass, I. Korolov, D. Loffhagen, N. Pinhão, andZ. Donkó. Electron transport parameters in CO2 :scanning drift tube measurements and kinetic com-putations. Plasma Sources Science and Technology,26(6):065007, 2017.
[VvdL1984] H. F. A. Verhaart and P. C. T. van der Laan. Theinfluence of water vapor on avalanches in air. Journalof Applied Physics, 55(9):3286–3292, 1984.
[WB2016] Weizong Wang and Annemie Bogaerts. Effectiveionisation coefficients and critical breakdown electricfield of co2 at elevated temperature: effect of excitedstates and ion kinetics. Plasma Sources Science andTechnology, 25(5):055025, 2016.
[Woo1982] R. E. Wooton. Gases superior to SF6 for insulationand interruption. EPRI EL-2620, Final Report,1982.
[WW1988] C. Wen and J. M. Wetzer. Electron avalanchesinfluenced by detachment and conversion pro-cesses. IEEE Transactions on Electrical Insulation,23(6):999–1008, Dec 1988.
[ZKK+2018] M. Zawadzki, D. Kollárová, J. Kočišek, J. Fedor,A. Chachereau, and C. M. Franck. Electron at-
Bibliography 143
tachment to hexafluoropropylene oxide (HFPO). J.Chem Phys., 149(20):204305, 2018.
[ZP1994] W. S. Zaengl and K. Petcharaks. Applicationof streamer breakdown criterion for inhomoge-neous fields in dry air and SF6. Ed Loucas G.Christophorou and David R. James, editors, GaseousDielectrics VII, pages 153–159, Boston, MA, 1994.Springer US.
[ZSFB2016] M. C. Zammit, J. S. Savage, D. V. Fursa, and I. Bray.Complete solution of electronic excitation and ioniza-tion in electron-hydrogen molecule scattering. Phys.Rev. Lett., 116:233201, Jun 2016.


Appendixes
A F-gas regulations
This appendix gives a time-line of the organizations, events andregulations leading to the effort to limit the emission of greenhousegases, in particular fluorinated gases, in the world, but also specificallyin Europe.In November 1988, the Intergovernmental Panel on Climate Change(IPCC) is created to assess the climate change. It reviews worldwideresearch, issues regular assessment reports and compiles specialreports and technical papers.In May 1992, the United Nations Framework Convention on Cli-mate Change (UNFCCC) is adopted. It provides the foundationfor multilateral action to combat climate change and its impacts onhumanity and ecosystems. It opens for signature in June 1992. Thegovernments that have ratified the UNFCCC - known as Parties tothe Convention - meet annually at the Conference of the Parties(COP) to take stock of their progress and continue talks on how bestto tackle climate change. The first COP takes place in April 1995 inBerlin.In December 1997, during the third COP, the Parties adopt theKyoto Protocol, the world’s first greenhouse gas (GHG) emissionsreduction treaty. It includes an obligation and individual legally-binding emission reduction targets for developed countries, as theyare responsible for the largest share of current and historical GHGemissions. The Kyoto Protocol enters into force in February 2005,and the Parties to the Kyoto Protocol meet annually at the CMP(in conjunction with the annual COP) to review its implementation.In May 2006, the European parliament and the council of theEuropean union adopted a regulation on fluorinated greenhousegases [EC2006], to contain, prevent and thereby reduce emissions of
145

146 Appendixes
the fluorinated greenhouse gases covered by the Kyoto Protocol. Itaddresses in particular the containment, use, recovery and destructionof these gases.In 2014, the IPCC released its Fifth Assessment Report (AR5), withits three Working Group (WG) reports and a synthesis report in 2014.The WG I is categorical in its conclusion: climate change is real andhuman activities are the main cause. The WG I estimates cumulativecarbon dioxide (CO2) emissions since pre-industrial times - (CO2
being the most abundant GHG that has resulted, in particular, fromburning fossil fuels) - and provide a CO2 budget for future emissionsto limit warming to less than 2 ◦C. About half of this CO2 budgetwas already emitted by 2011.In April 2014, the European parliament and the council of theEuropean union adopt a new F-gas regulation [EU2014] which aimsto improve the prevention of leaks from equipment containing F-gases and avoid altogether the use of F-gases where environmentallysuperior alternatives are cost-effective.In December 2015, the 196 parties attending the COP 21 adopt theParis Agreement, which enters into force on 4 November 2016. Theagreement calls for zero net anthropogenic greenhouse gas emissionsto be reached during the second half of the 21st century. Theagreement aims to keep the global temperature rise this century wellbelow 2 ◦C above pre-industrial levels. The parties will also "pursueefforts to" further limit the temperature increase to 1.5 ◦C, whichmight require to reach zero GHG emissions sometime between 2030and 2050. The agreement sets up a bottom-up system in which eachcountry sets its own goal - the nationally determined contribution -and presents plans to reach that objective.
B Saturated vapor pressure curves 147
B Saturated vapor pressure curves
B.1 Sulphur hexafluoride (SF6)
The fit of the vapor pressure curve of SF6 is taken from the work ofGudel and Wagner [GW2009], and has the form
p = pc exp
(T
Tc
(A1τ +A2τ
1.5 +A3τ2.5 +A4τ
4 +A5τ4.5))
, (B.1)
where τ = 1 − T/Tc, Tc = 318.7232K, pc = 3754.983 kPa and thefitting parameters are
A1 A2 A3 A4 A5
-7.09634642 1.676662 -2.3921599 5.86078302 -9.02978735
B.2 Octafluorooxolane (c-C4F8O)
The saturated vapor pressure of c-C4F8O was measured by Salvi-Narkhed et al. and fitted with [SNAGH1993]
p = exp
(A0 +
A1
T+A2T +A3 log(T )
), (B.2)
p is the pressure in Pascal and T the temperature in Kelvin, and thevalues of the fitting parameters are
A0 A1 A2 A3
133.633 -6016.20 0.028363 -19.2157
The corresponding value for the boiling point of c-C4F8O is Tb =−0.736 ◦C.
B.3 (1E)-1,3,3,3-tetrafluoropropene (C3H2F4)
The vapor pressure curve of C3H2F4 was parametrized by Akasaka [Aka2010]based on measurements by Kayukawa and Fujii [KF2009] and Tanakaet al. [TTH2010]. Akasaka fitted the measurements of the vapor
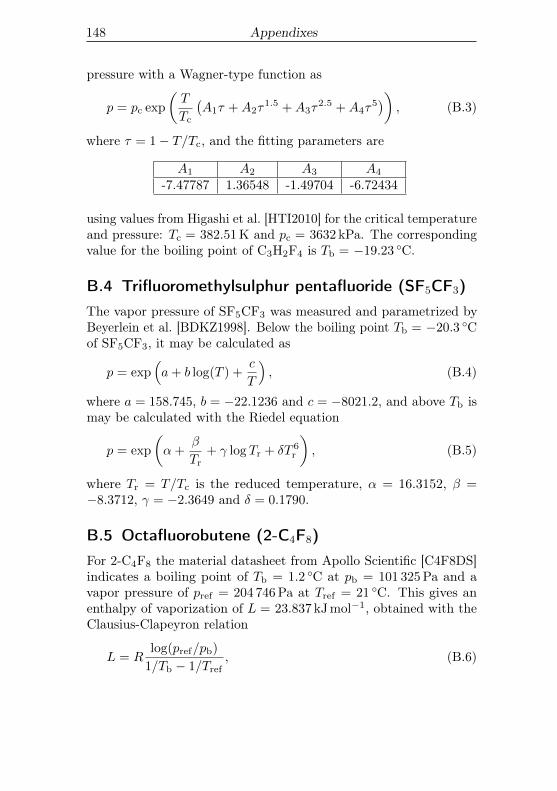
148 Appendixes
pressure with a Wagner-type function as
p = pc exp
(T
Tc
(A1τ +A2τ
1.5 +A3τ2.5 +A4τ
5))
, (B.3)
where τ = 1− T/Tc, and the fitting parameters are
A1 A2 A3 A4
-7.47787 1.36548 -1.49704 -6.72434
using values from Higashi et al. [HTI2010] for the critical temperatureand pressure: Tc = 382.51K and pc = 3632 kPa. The correspondingvalue for the boiling point of C3H2F4 is Tb = −19.23 ◦C.
B.4 Trifluoromethylsulphur pentafluoride (SF5CF3)The vapor pressure of SF5CF3 was measured and parametrized byBeyerlein et al. [BDKZ1998]. Below the boiling point Tb = −20.3 ◦Cof SF5CF3, it may be calculated as
p = exp(a+ b log(T ) +
c
T
), (B.4)
where a = 158.745, b = −22.1236 and c = −8021.2, and above Tb ismay be calculated with the Riedel equation
p = exp
(α+
β
Tr+ γ log Tr + δT 6
r
), (B.5)
where Tr = T/Tc is the reduced temperature, α = 16.3152, β =−8.3712, γ = −2.3649 and δ = 0.1790.
B.5 Octafluorobutene (2-C4F8)For 2-C4F8 the material datasheet from Apollo Scientific [C4F8DS]indicates a boiling point of Tb = 1.2 ◦C at pb = 101 325Pa and avapor pressure of pref = 204 746Pa at Tref = 21 ◦C. This gives anenthalpy of vaporization of L = 23.837 kJmol−1, obtained with theClausius-Clapeyron relation
L = Rlog(pref/pb)
1/Tb − 1/Tref, (B.6)
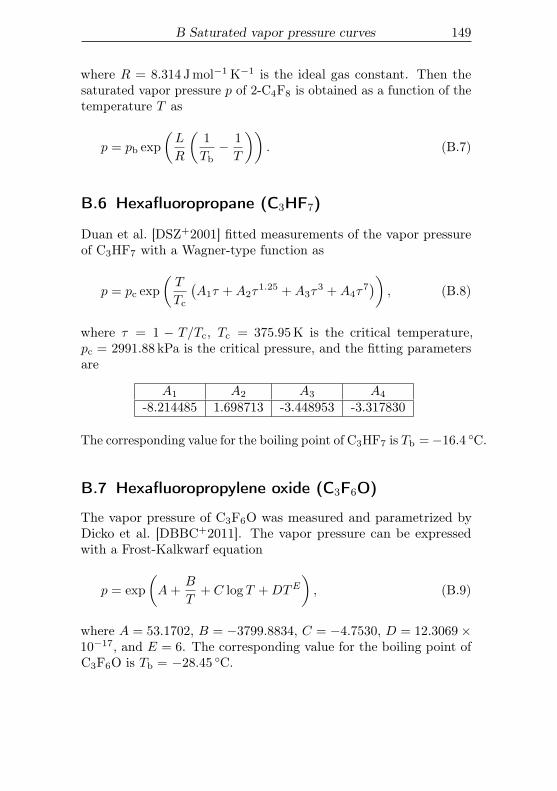
B Saturated vapor pressure curves 149
where R = 8.314 Jmol−1 K−1 is the ideal gas constant. Then thesaturated vapor pressure p of 2-C4F8 is obtained as a function of thetemperature T as
p = pb exp
(L
R
(1
Tb− 1
T
)). (B.7)
B.6 Hexafluoropropane (C3HF7)
Duan et al. [DSZ+2001] fitted measurements of the vapor pressureof C3HF7 with a Wagner-type function as
p = pc exp
(T
Tc
(A1τ +A2τ
1.25 +A3τ3 +A4τ
7))
, (B.8)
where τ = 1 − T/Tc, Tc = 375.95K is the critical temperature,pc = 2991.88 kPa is the critical pressure, and the fitting parametersare
A1 A2 A3 A4
-8.214485 1.698713 -3.448953 -3.317830
The corresponding value for the boiling point of C3HF7 is Tb =−16.4 ◦C.
B.7 Hexafluoropropylene oxide (C3F6O)
The vapor pressure of C3F6O was measured and parametrized byDicko et al. [DBBC+2011]. The vapor pressure can be expressedwith a Frost-Kalkwarf equation
p = exp
(A+
B
T+ C log T +DTE
), (B.9)
where A = 53.1702, B = −3799.8834, C = −4.7530, D = 12.3069×10⁻¹⁷, and E = 6. The corresponding value for the boiling point ofC3F6O is Tb = −28.45 ◦C.
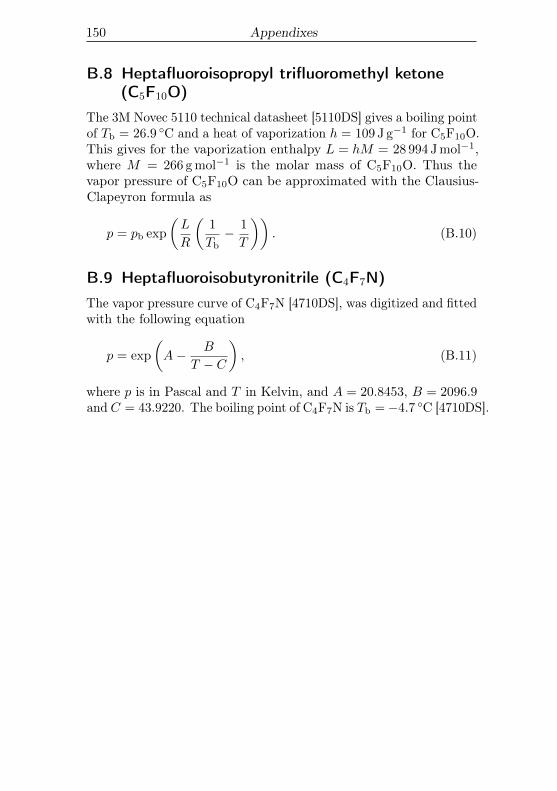
150 Appendixes
B.8 Heptafluoroisopropyl trifluoromethyl ketone(C5F10O)
The 3M Novec 5110 technical datasheet [5110DS] gives a boiling pointof Tb = 26.9 ◦C and a heat of vaporization h = 109 J g−1 for C5F10O.This gives for the vaporization enthalpy L = hM = 28 994 Jmol−1,where M = 266 gmol−1 is the molar mass of C5F10O. Thus thevapor pressure of C5F10O can be approximated with the Clausius-Clapeyron formula as
p = pb exp
(L
R
(1
Tb− 1
T
)). (B.10)
B.9 Heptafluoroisobutyronitrile (C4F7N)The vapor pressure curve of C4F7N [4710DS], was digitized and fittedwith the following equation
p = exp
(A− B
T − C
), (B.11)
where p is in Pascal and T in Kelvin, and A = 20.8453, B = 2096.9and C = 43.9220. The boiling point of C4F7N is Tb =−4.7 ◦C [4710DS].
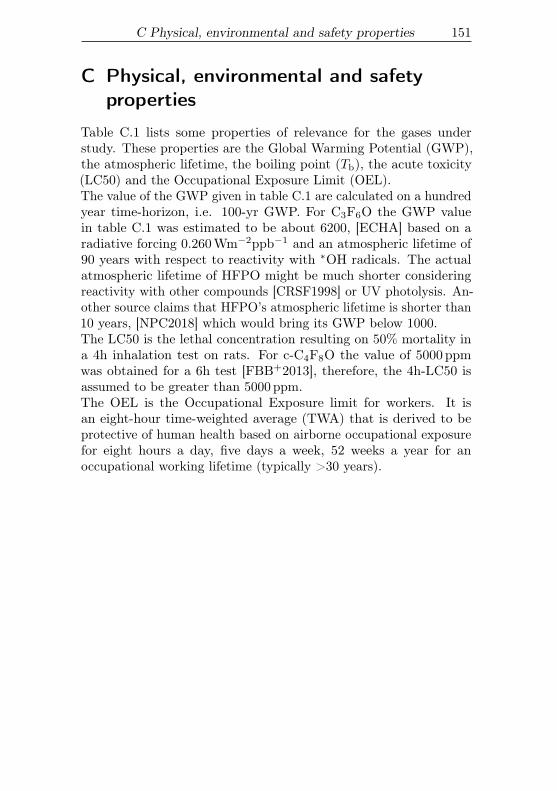
C Physical, environmental and safety properties 151
C Physical, environmental and safetyproperties
Table C.1 lists some properties of relevance for the gases understudy. These properties are the Global Warming Potential (GWP),the atmospheric lifetime, the boiling point (Tb), the acute toxicity(LC50) and the Occupational Exposure Limit (OEL).The value of the GWP given in table C.1 are calculated on a hundredyear time-horizon, i.e. 100-yr GWP. For C3F6O the GWP valuein table C.1 was estimated to be about 6200, [ECHA] based on aradiative forcing 0.260Wm−2ppb−1 and an atmospheric lifetime of90 years with respect to reactivity with ∗OH radicals. The actualatmospheric lifetime of HFPO might be much shorter consideringreactivity with other compounds [CRSF1998] or UV photolysis. An-other source claims that HFPO’s atmospheric lifetime is shorter than10 years, [NPC2018] which would bring its GWP below 1000.The LC50 is the lethal concentration resulting on 50% mortality ina 4h inhalation test on rats. For c-C4F8O the value of 5000ppmwas obtained for a 6h test [FBB+2013], therefore, the 4h-LC50 isassumed to be greater than 5000 ppm.The OEL is the Occupational Exposure limit for workers. It isan eight-hour time-weighted average (TWA) that is derived to beprotective of human health based on airborne occupational exposurefor eight hours a day, five days a week, 52 weeks a year for anoccupational working lifetime (typically >30 years).
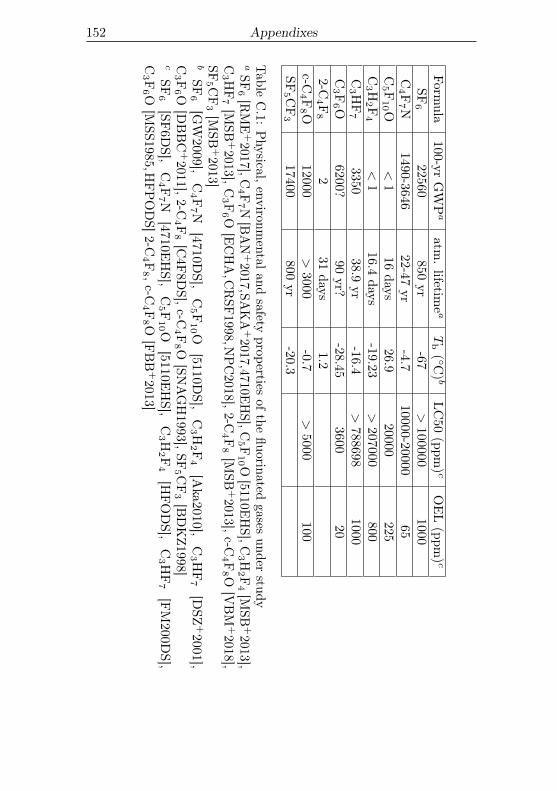
152 Appendixes
Formula
100-yrGW
Pa
atm.lifetim
ea
Tb( ◦C
)b
LC50
(ppm)c
OEL(ppm
)c
SF6
22560850
yr-67
>100000
1000C
4 F7 N
1490-364622-47
yr-4.7
10000-2000065
C5 F
10 O
<1
16days
26.920000
225C
3 H2 F
4<
116.4
days-19.23
>207000
800C
3 HF
73350
38.9yr
-16.4>
7886981000
C3 F
6 O6200?
90yr?
-28.453600
202-C
4 F8
231
days1.2
c-C4 F
8 O12000
>3000
-0.7>
5000100
SF5 C
F3
17400800
yr-20.3
Table
C.1:
Physical,environm
entalandsafety
propertiesof
thefluorinated
gasesunder
studyaSF
6[R
ME
+2017],C
4 F7 N
[BAN
+2017,SA
KA
+2017,4710E
HS],C
5 F10 O
[5110EHS],C
3 H2 F
4[M
SB+2013],
C3 H
F7[M
SB+2013],C
3 F6 O
[ECHA,C
RSF
1998,NPC2018],2-C
4 F8[M
SB+2013],c-C
4 F8 O
[VBM
+2018],
SF5 C
F3[M
SB+2013]
bSF
6[G
W2009],
C4 F
7 N[4710D
S],C
5 F10 O
[5110DS],
C3 H
2 F4
[Aka2010],
C3 H
F7
[DSZ
+2001],
C3 F
6 O[D
BBC
+2011],2-C
4 F8[C4F
8DS],c-C
4 F8 O
[SNAGH1993],SF
5 CF
3[BDKZ1998]
cSF
6[SF
6DS],
C4 F
7 N[4710E
HS],
C5 F
10 O
[5110EHS],
C3 H
2 F4
[HFODS],
C3 H
F7
[FM200D
S],C
3 F6 O
[MSS1985,H
FPODS]2-C
4 F8 ,c-C
4 F8 O
[FBB
+2013]