Removal of reactive gases at indoor surfaces: Combining mass transport and surface kinetics
12
Atmospheric Environment Vol. 27A, No. 13, pp. 2039 2050, 1993. 0004 6891/93 $6.00+0.00 Printed in Great Britain. ~ 1993 Pergamon Press Ltd REMOVAL OF REACTIVE GASES AT INDOOR SURFACES: COMBINING MASS TRANSPORT AND SURFACE KINETICS J. A. CANO-RUIZ, D. KONG, R. B. BALAS and W. W. Nazaaovv* Civil Engineering Department, University of California, Berkeley. CA 94720, U.S.A. (First received 4 September 1992 and in final fibrin 26 February 1993) Abstract---The rate of deposition of reactive gaseous pollutants onto indoor surfaces is examined, taking into account mass transport processes and the kinetics of gas surface interactions. A conceptual model for predicting indoor deposition velocities is proposed, and approximate analysis based on this model is used to obtain algebraic expressions for the deposition velocity of reactive gases under three model airflow conditions: (1) forced laminar convection parallel to a flat plate, 12) laminar natural convection flow along an isothermal vertical plate, and (3) homogeneous turbulence in an enclosure. Numerical simulations are used to refine the approximate analysis results and to predict reactive gas deposition under laminar natural convection flow in an enclosure. The kinetics of gas-surface interactions are modeled in terms of the reaction probability 7, defined as the fraction of pollutant molecular collisions with a surface that result in irreversible removal. Values of "~ for the reaction of ozone with surfaces are obtained from published reaction chamber and tube penetration experiments. For common indoor materials, values range from as low as O( 10 - 7) for glass and aluminium to O( 10- 5_ 10- 4) for materials such as bricks, concrete and latex paint. Our results indicate that ozone deposition occurs at the transport-limited rate when ?> ~3 × 10 4 for typical indoor air flow conditions, and that ozone deposition can be predicted by surface kinetics alone if y<-5×10 7. Key word index: Deposition, deposition velocity, indoor air quality, modeling, ozone, reaction probability. 1. INTRODUCTION and sizes, air flow configurations, pollutants of con- cern, and surface materials present in an indoor set- The interactions between pollutants and surfaces play ting, it is desirable to have a methodology that allows a very important role in the air quality within build- valid extrapolation of deposition velocity data from ings. From the standpoint of human health, surface one setting to another. The goal of this paper is to reactions are generally beneficial, since they reduce provide such a framework for the prediction of the airborne concentrations and therefore decrease deposition velocities of gaseous pollutants indoors. indoor inhalation exposures. On the other hand, these Previous analysis (Nazaroff and Cass, 1989) examined interactions may cause chemical damage to valuable the deposition velocities of particles and gases onto materials, such as microelectronic components and indoor surfaces for the case when surface uptake is works of art (Shaver et al., 1983; Weschler and rapid and the removal rate is limited entirely by mass Shields, 1991). transport. This work takes that analysis further, by Accurate prediction of these effects requires a good incorporating the effects of surface kinetics on depos- conceptual and quantitative understanding of the in- ition rates. teractions between indoor pollutants and surfaces. To lend specificity to the analysis, we will use ozone The rate of pollutant uptake by surfaces, both out- as an example species. In urban areas around the doors and indoors, has been commonly quantified world, ozone is frequently the pollutant responsible using deposition velocities. However, the deposition for the violation of health-based air quality standards. velocity of a pollutant is not an intrinsic property of For example, it is estimated that in 1987, 75 million that species, since it depends on the prevailing air flow people lived in U.S. counties that were out of compli- conditions and on the physicochemical interaction of ance with the National Ambient Air Quality Standard the pollutant with the surfaces present in each case. for ozone (U.S. Environmental Protection Agency, Consequently, deposition velocities obtained for 1989). Although indoor concentrations arelower than a pollutant in one setting are not universally applic- those outside, cumulative indoor ozone exposures can able outside of that setting. The problem of using be greater than those outdoors, since people spend correct deposition velocity values for the modeling of most of their time in buildings (Weschler et al., 1989). indoor pollutant concentrations is complicated by the For the most part, indoor ozone originates from entry paucity of indoor deposition velocity data. Given the of outdoor polluted air. Indoor ozone is removed by large number of possible combinations of room types reactions on indoor surfaces, which appear to follow first-order kinetics (Sabersky et al., 1973; Mueller * To whom correspondence should be addressed, et al., 1973), and by ventilation. Indoor ozone concert- 2039 AE(A) Z7:13-H
-
Upload
independent -
Category
Documents
-
view
4 -
download
0
Transcript of Removal of reactive gases at indoor surfaces: Combining mass transport and surface kinetics
Atmospheric Environment Vol. 27A, No. 13, pp. 2039 2050, 1993. 0004 6891/93 $6.00+0.00 Printed in Great Britain. ~ 1993 Pergamon Press Ltd
R EMOVAL OF REACTIVE GASES AT I N D O O R SURFACES: C O M B I N I N G MASS TRANSPORT AND SURFACE KINETICS
J. A. CANO-RUIZ, D. KONG, R. B. BALAS and W. W. N a z a a o v v *
Civil Engineering Department, University of California, Berkeley. CA 94720, U.S.A.
(First received 4 September 1992 and in final fibrin 26 February 1993)
Abstract---The rate of deposition of reactive gaseous pollutants onto indoor surfaces is examined, taking into account mass transport processes and the kinetics of gas surface interactions. A conceptual model for predicting indoor deposition velocities is proposed, and approximate analysis based on this model is used to obtain algebraic expressions for the deposition velocity of reactive gases under three model airflow conditions: (1) forced laminar convection parallel to a flat plate, 12) laminar natural convection flow along an isothermal vertical plate, and (3) homogeneous turbulence in an enclosure. Numerical simulations are used to refine the approximate analysis results and to predict reactive gas deposition under laminar natural convection flow in an enclosure. The kinetics of gas-surface interactions are modeled in terms of the reaction probability 7, defined as the fraction of pollutant molecular collisions with a surface that result in irreversible removal. Values of "~ for the reaction of ozone with surfaces are obtained from published reaction chamber and tube penetration experiments. For common indoor materials, values range from as low as O( 10 - 7) for glass and aluminium to O( 10- 5_ 10- 4) for materials such as bricks, concrete and latex paint. Our results indicate that ozone deposition occurs at the transport-limited rate when ?> ~3 × 10 4 for typical indoor air flow conditions, and that ozone deposition can be predicted by surface kinetics alone if y < - 5 × 1 0 7.
Key word index: Deposition, deposition velocity, indoor air quality, modeling, ozone, reaction probability.
1. INTRODUCTION and sizes, air flow configurations, pollutants of con- cern, and surface materials present in an indoor set-
The interactions between pollutants and surfaces play ting, it is desirable to have a methodology that allows a very important role in the air quality within build- valid extrapolation of deposition velocity data from ings. From the standpoint of human health, surface one setting to another. The goal of this paper is to reactions are generally beneficial, since they reduce provide such a framework for the prediction of the airborne concentrations and therefore decrease deposition velocities of gaseous pollutants indoors. indoor inhalation exposures. On the other hand, these Previous analysis (Nazaroff and Cass, 1989) examined interactions may cause chemical damage to valuable the deposition velocities of particles and gases onto materials, such as microelectronic components and indoor surfaces for the case when surface uptake is works of art (Shaver et al., 1983; Weschler and rapid and the removal rate is limited entirely by mass Shields, 1991). transport. This work takes that analysis further, by
Accurate prediction of these effects requires a good incorporating the effects of surface kinetics on depos- conceptual and quantitative understanding of the in- ition rates. teractions between indoor pollutants and surfaces. To lend specificity to the analysis, we will use ozone The rate of pollutant uptake by surfaces, both out- as an example species. In urban areas around the doors and indoors, has been commonly quantified world, ozone is frequently the pollutant responsible using deposition velocities. However, the deposition for the violation of health-based air quality standards. velocity of a pollutant is not an intrinsic property of For example, it is estimated that in 1987, 75 million that species, since it depends on the prevailing air flow people lived in U.S. counties that were out of compli- conditions and on the physicochemical interaction of ance with the National Ambient Air Quality Standard the pollutant with the surfaces present in each case. for ozone (U.S. Environmental Protection Agency, Consequently, deposition velocities obtained for 1989). Although indoor concentrations are lower than a pollutant in one setting are not universally applic- those outside, cumulative indoor ozone exposures can able outside of that setting. The problem of using be greater than those outdoors, since people spend correct deposition velocity values for the modeling of most of their time in buildings (Weschler et al., 1989). indoor pollutant concentrations is complicated by the For the most part, indoor ozone originates from entry paucity of indoor deposition velocity data. Given the of outdoor polluted air. Indoor ozone is removed by large number of possible combinations of room types reactions on indoor surfaces, which appear to follow
first-order kinetics (Sabersky et al., 1973; Mueller * To whom correspondence should be addressed, et al., 1973), and by ventilation. Indoor ozone concert-
2039 AE(A) Z7:13-H
2040 J.A. CANO-RuIz et al.
trations are determind by a balance between the entry or "sticking coefficient" (Stephens et al., 1986). The and removal rates. Accurate prediction of reaction at reaction probability between a pollutant and a surface indoor surfaces is critical for the assessment of indoor is defined here as the fraction of all pollutant molecule exposures to this pollutant. Although this paper fo- collisions with surfaces that result in irreversible re- cuses on ozone, the analysis approach and many of moval
the results can be directly applied to other gaseous pollutant removal rate
species. 7-- pollutant collision rate" (l)
This parameter may take values between 0 (no re- 2. BACKGROUND moval) and l (perfectly removing surface).
If both the flow configuration in a room and the The concept of deposition velocity is defined as the reaction probability of the pollutant with the room
net flux of pollutant to a unit area of surface (units: surfaces are known, quantitative prediction of the mass per area per time), normalized by a character- pollutant removal rate is possible, either by analytical istic airborne pollutant concentration (units: mass per or numerical methods. volume). This normalized flux has units of length per time, and thus is designated a "velocity", even though this does not represent a true rate of displacement. In 3. ANALYSIS
indoor settings, the characteristic pollutant concen- 3.1. Conceptual model tration is taken to be that in the core of the room.
The first step of our analysis consists of the formu- A critical evaluation of the use of this concept in lation of a conceptual model of deposition velocity modeling indoor air quality has been provided by
Nazaroff et al. (1993). that incorporates both mass transport mechanisms The rate of removal of gaseous species at indoor and surface uptake limitations. We will later use this
model to obtain analytical expressions for calculating surfaces depends on two sets of mechanisms. First, molecular diffusion and fluid-mechanical transport deposition velocities under idealized conditions. The mechanisms are responsible for pollutant delivery to following assumptions and simplifications constitute surfaces. Second, chemical or physical interactions the foundation of the model: ultimately occur to remove pollutants from air. Either 1. The distance between the core of the room of these processes may be rate-limiting. (where the pollutant concentration is uniform and has
Surfaces may in some circumstances be treated as a value C~) and the surface of interest is divided into perfectly absorbing (or reactive) with respect to a spe- discrete regions, and the main mechanism that con- cific pollutant, and in this case the rate of surface trois pollutant flux towards the surface is identified
within each region. uptake is adequately described by mass transport 2. Pollutant deposition occurs under quasi-steady considerations alone (Nazaroff and Cass, 1989). To
state conditions, so that although the core concentra- a first approximation, this description is valid for tion may vary with time, the flux adjusts rapidly submicron-sized particles and highly reactive gases.
However, not all gases are sufficiently reactive to be enough in response so that the deposition velocity at removed at indoor surfaces at the transport-limited a given surface location remains constant.
3. Concentration gradients in directions parallel to rate. For example, Wilson (1968) noted a seven-fold
surfaces are much smaller than concentration gradi- increase in the deposition velocity of SO2 in a test
ents in the normal direction. room when he painted its walls and floor with sodium
4. Surfaces are smooth. The effect of surface rough- carbonate. Simmons and Colbeck (1990) measured the decay of O3 on common building materials using ness is considered briefly in the discussion.
5. We consider the following transport and reac- an experimental chamber. They found increases tion mechanisms: ranging from 2-times (bricks) to about 40-times (glass) the original deposition velocities after spraying the (a) Molecular diffusion. This flux is given by Fick's surfaces with a potassium iodide solution, which is law of diffusion believed to act as a perfect sink for ozone. Other ~C chamber studies (e.g. Sabersky et al., 1973) have found JD = ~ ~--~ (2) order of magnitude differences in the deposition velo- city of reactive gases for different materials. These where JD is the species flux due to molecular diffusion findings, and the observation of aging effects (de- (mass per area per time), ~ is the species molecular screase in deposition velocity with time of exposure) diffusivity, C is the species concentration (mass per indicate that surface kinetics could play an important volume), and y denotes the coordinate normal to the role in the rate of removal of reactive gaseous pollu- surface. Note that JD>0 represents net flux toward tants indoors, the surface, whereas y increases with distance away
We will represent the kinetics of pollutant-surface from the surface. In the case of ozone in air, interactions using the concept of reaction probability ~ = 1.82 x 10⁻⁵ m 2 s - 1 (Williams and Grosjean, ),, also named "uptake coefficient" (Utter et al., 1992), 1990).
Mass transport and surface kinetics 2041
(b) Turbulent (eddy) diffusion. Under turbulent monly used to calculate deposition velocities out- flow conditions, the transport of momentum, energy doors (Seinfeld, 1985) and species is enhanced by the random motion of
tld-~[ra + rb + rs] -1. (81 eddies. The flux of species due to turbulent transport may be represented by an expression of a form similar In this representation, the deposition velocity is to equation (2), with the molecular diffusivity replaced viewed as the inverse of the sum of three resistances in by an eddy diffusivity De, which unlike the molecular series: the aerodynamic resistance ra, the boundary diffusivity is a function of the fluid motion and may layer resistance rb, and the surface transfer resistance vary with location r~. Pollutant flux becomes analogous to electrical flow
in circuits, with species concentration assuming the ~C
JT =De(y) Z - (3) role of electrical potential as the driving force. c y To represent the indoor deposition velocity in
where JT is the species flux toward the surface due to a similar form, start with its definition, cast in inverse turbulent diffusion. The total flux due to molecular form and turbulent diffusion is obtained by adding equa- 1 C~ tions (2) and (3). Several models have been proposed - - = - - (9) for De. A simple form is based on Prandtl's mixing va J
length expression near a wall (Corner and Pendle- where J represents the total species flux to the surface bury, 1951) by any mechanism.
De=Key 2 (4) The core concentration may be expressed as the sum of the pollutant concentration in air at the sur-
with Ke=kgdu/dy, where k0 is von Kfirmfin's con- face and the incremental variation of concentration stant (usually taken as 0.4), and du/dy is the gradient from the surface to the core of the room of the mean velocity parallel to the wall. Other investi- c~ gators (e.g. Friedlander, 1977) have suggested different f values for the exponent in equation (4). Crump and C,,~=C,+ ,1 dC. (101 Seinfeld (1981) used the following expression for De in c, their analysis of aerosol deposition in a turbulently We can now express the elements in the right-hand mixed vessel: side of equation (10) in terms of the dominant
De=Key ' . (5) transport mechanisms identified in each region of space. The surface concentration is obtained from
ExperimentaJ data are largely consistent with values equation (6) of m in the range 2-3 (Chen et al., 1992). Js
(c) Surface uptake. The flux of pollutant to the wall C~ = (11 ) is ultimately equal to the rate of molecular collisions ~ ( v ) with the wall, as predicted by the molecular theory of 4 gases, multiplied by the reaction probability
and the integral can be evaluated by substituting the appropriate expressions relating flux to concentration
J~='f Cs (6) increments in each region of space. This procedure is illustrated in the following examples.
where Js is the net flux of species to the surface. C, is Example 1. Consider laminar flow parallel to the pollutant concentration in air adjacent to the a wall. We will assume that, within the velocity surface (strictly speaking, C~ is the pollutant concen- boundary layer, the dominant pollutant transport tration at a distance of 22/3 from the surface, where mechanism in the direction normal to the wall is 2 is the mean molecular free path and has a value of molecular diffusion. A concentration boundary layer 6.5 x 10 -s m at 293 K and 1 atm). The parameter (v ) of thickness ~5 c will exist, in which the pollutant con- is the pollutant's Boltzmann velocity, given by centration will vary from Cs at the wall to C~, the
[-8 k T~ 1/2 concentration in the free stream. Using equation (2) to (v ) =[~mm j (7) evaluate the integral in equation (10) yields
where k is the Boltzmann constant (1.38× 10 -23 c~ ,L J K - l), T is the absolute air temperature, and mis the fdC~Jof~. (121 mass of an individual pollutant molecule. For 03 (T=293 K), ( v ) = 3 . 6 0 × 104cms -1. Note that c, o this is about six orders of magnitude larger than Strictly, the lower limit of integration should be typical indoor ozone deposition velocities (around y = 22/3 instead of y = 0, but since ~.,~ 6~, we can make 0.04 cm s-~). this approximation without loss of accuracy. After
These elements may be incorporated into math- solving the integral and combining equations (9) ematical expressions of a form inspired by that corn- through (12), and recalling that because of the quasi-
2042 J.A. CANO-RUIZ et al.
steady state assumption J =JD=Js, we obtain inates all other terms, and va may be approximated by
1 I 6c ( v ) ~ d ~ + ~ . (13) Vd'~y 4 (18)
Y 4 On the other hand, as y approaches unity, surface Example 2. Consider homogeneously turbulent resistance becomes negligible, and va approaches the
flow in an enclosure. This case is based on the model transport-limited value. In general, for the case of formulated by Corner and Pendlebury (1951), as reactive gaseous species modified by Crump and Seinfeld (1981). We will as- -1 sume that: (a) there is a boundary layer 6, adjacent to I~ ,+y ~ ] each surface within which the main air motion is Vd= -- - - (19) parallel to the surface; (b) the pollutant concentration is uniform outside the boundary layer, and (c) the
eddy diffusion coefficient within the boundary layer where v, is the transport-limited deposition velocity. may be represented by equation (5). We can use equation (19) to obtain estimates of
We could proceed as in Example 1, evaluating the y for a variety of pollutant-surface combinations from incremental concentration integral from the wall to published data, provided that both the actual and the the outer edge of the concentration boundary layer transport-limited deposition velocities are reported
c~ 6o under identical flow conditions. A note of caution: so
f dC = J N + ~-oym- (14) far we have not distinguished between the local depos- ition velocity Vd(X), and the mean (area-averaged)
c, o deposition velocity ~ . Equation (19) is strictly applic- The right-hand side of equation (14) is difficult to able for the evaluation of the local deposition velocity,
solve analytically for arbitrary values of the exponent and is valid for the estimation of mean deposition m. Instead, we will divide the boundary layer into two velocities only if the local deposition velocity is a very regions, according to the dominant transport mech- weak function of location on the surface. anism within each. The transition between molecular Often transport-limited deposition velocities are and eddy diffusion dominance occurs when not reported, but reasonable values may be estimated
= Key m, at a distance from the wall given by and used for the purpose of obtaining reaction prob- = / ,~ \ l /m( ~--'-] abilities, as long as there are order of magnitude
6t \ K e ] " (15) differences between the actual deposition velocities observed and the estimated transport-limited values.
With this simplification, equation (14) becomes Table 1 lists ozone reaction probability data obtained from the application of equation (19) to several experi-
c~ F~, ~o -1 f [ ! d y /' dy / ~, ] mental data sets reporting ozone decay in chambers.
dC ~J ~ + | K ~ ] . (16, Another method for determining reaction probabil- c, ities is based on penetration measurements in fully
developed laminar tube flow (McMurry and Stolzen- Proceeding as in Example 1, the following expression burg, 1987). The ratio of outlet to inlet average species for deposition velocity is obtained concentrations is measured, and this ratio is then
1 1 6, 1 [ 1 1 ] related to the reaction probability of the pollutant va (v ) + ~ + ( m - 1) Ke 6~-- x 6~- 1 • (17) species with the tube walls through equations derived
Y 4 from heat and mass transfer theory. The penetration ratio is given by
This conceptual deposition velocity model can be C used with other functional forms of turbulent trans- - - = e x p ( - 2 Sho~) (20)
port, provided that a mathematical relationship can Co be specified between pollutant flux and concentration where gradients. ~ L
- (21) 4Urn r2
3.2. Determination of reaction probabilities 59 1
A critical parameter in the evaluation of deposition 1 2~0 + 2S 1 velocities, according to the method presented here, is Sho'~i /'48"X 1 ~ 2S (22) the value of the reaction probability. It is apparent + ~ ) ~ from the functional form of the deposition velocity relationships presented in the previous section that if S =y(V)ro. (23) y is sufficiently small, then the surface resistance dom- 4
Mass transport and surface kinetics 2043
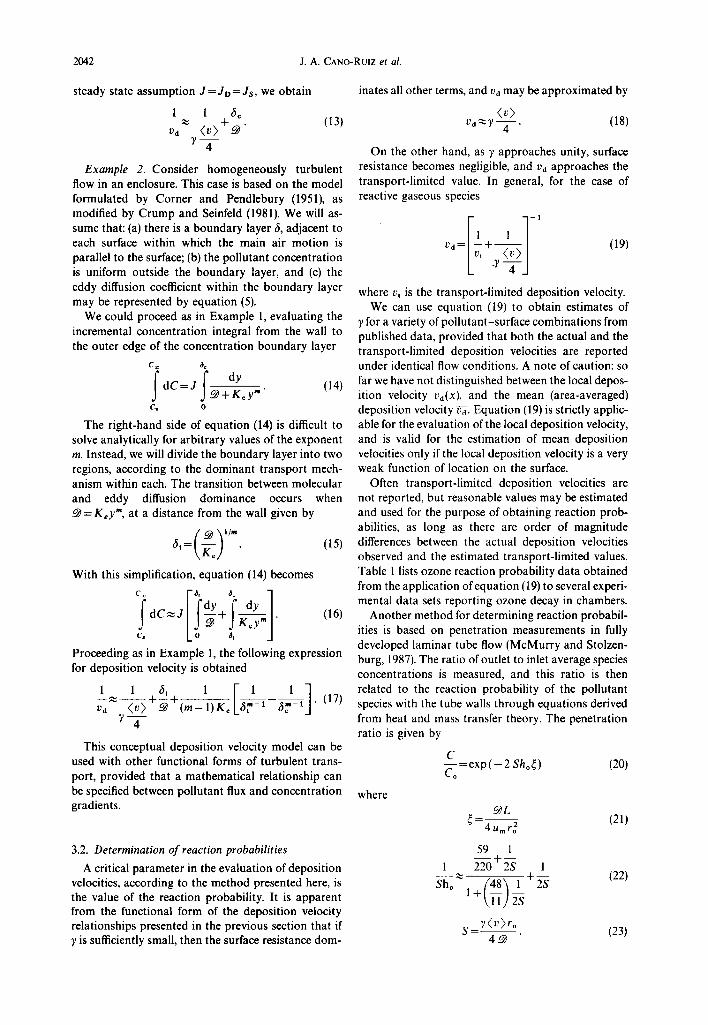
Table 1. Ozone reaction probabilities from chamber decay experiments
Reference Material t,d(cms 1), vt(cms l ) t y ,
Simmons and Colbeck, 1990~ FEP Teflon 0.005 1.5 5.5 × l0 7 Dirty glass 0.026 1.37 2.9 × l0 6 Clean glass 0.048 1.37 5.5 × l0 6 Gray tiles (new) 0.31 3.45 3.8 x l0 ~ 5 Red tiles (new) 0.32 1.49 4.5 x l0 5 Gravel 0.39 3.45 4.8 x 10 5 Concrete slab 0.58 3.13 7.9 x 10 5 Outdoor concrete 0.32 1.59 4.4 x 10 s Bricks (new) 1.03 2.13 2.2 x 10 -4 Old bricks 1.22 3.13 2.2 x 10 4
Sutton et al., 1976~ Polyethylene sheet 8% rel. humidity 0.006 0.4 7 × 10 - 7
70% rel. humidity 0.012 0.4 1.4 x 10 6
Sabersky et al., 1973 II Cotton muslin 0.1094).015 0.1 > 2 x 10⁻⁴-1.9 × 10 - 6
Lamb's wool 0.106-0.004 0.1 > 2 x 10 4~,,6 × 10 ~ Neoprene 0.0974).015 0.1 > 2 × 10 -4 1.9 × 10 - 6
Plywood 0.0304).005 0.1 4.7 × 10 -6 5,8 × 10 -7 Nylon 0.0324).0005 0.1 5.1 × 10 6 5,5 x 10 8 Polyethylene sheet 0.024-0.010 0.1 3.5 × 10 6 1.2 × 10 6 Linen 0.0094).005 0.1 1.1 × 1 0 - 6 6.3 x 10 - 7
Lucite 0.0064).0005 0.1 7.0 × 10 7 5.5 x 10 a Aluminium 0.0014).0005 0.1 1.1 x 10 7 5.5 x 10 s Plate glass 0.0014).0005 0.1 1.1 x 10 7 5.5 x 10 s
Mueller et al., 1973 Aluminiumtl 5% rel. humidity 0.00044 0.1 4.9 × 10 - s 40 50% r,h. 0.0(O4).0012 O.l 7 . 0 × 10 - 7 1.3 × 10 -7 87% rel. humidity 0.0176 0.1 2.4 × 10 6
Stainless steel** 0.0154).008 0.4 1.7 × 10 - 6 9 x 10 -~
Cox and Penkett, 1922"f-t" Aluminium 32% tel. humidity 0.00698 0.19 7.7 × 10- 8 83% rel. humidity 0.00206 0.19 2.3 × 10 7
* Where two values are reported, the first corresponds to unexposed material, and the second to conditions after a prolonged exposure to ozone (aging effect).
1" Values in italics are estimates. :~ Measured in a 125 g FEP Teflon box, mixed by FEP Teflon stirrers on opposite sides of the box. The box had one
completely open side (the bottom) and was placed onto the surface to be examined. Transport-limited deposition velocities correspond to materials coated with potassium iodide.
§ Measured in a 28 m 3 polyethylene lined room. A small circulating fan was used to provide mixing. II Measured in a 2.40 m 3 test chamber constructed from acrylic lucite sheets. Test samples covered one of the chamber
walls. ¶ Measured in a 2.17 m 3 aluminium test chamber. ** Measured in a 14.9 m 3 stainless steel test room with 8.5 m a min - 1 internal air circulation.
Measured in a 220 # chamber with 4 aluminium walls and 1 glass wall, stirred by a small fan. The transport-limited deposition velocity corresponds to that of 212pb.
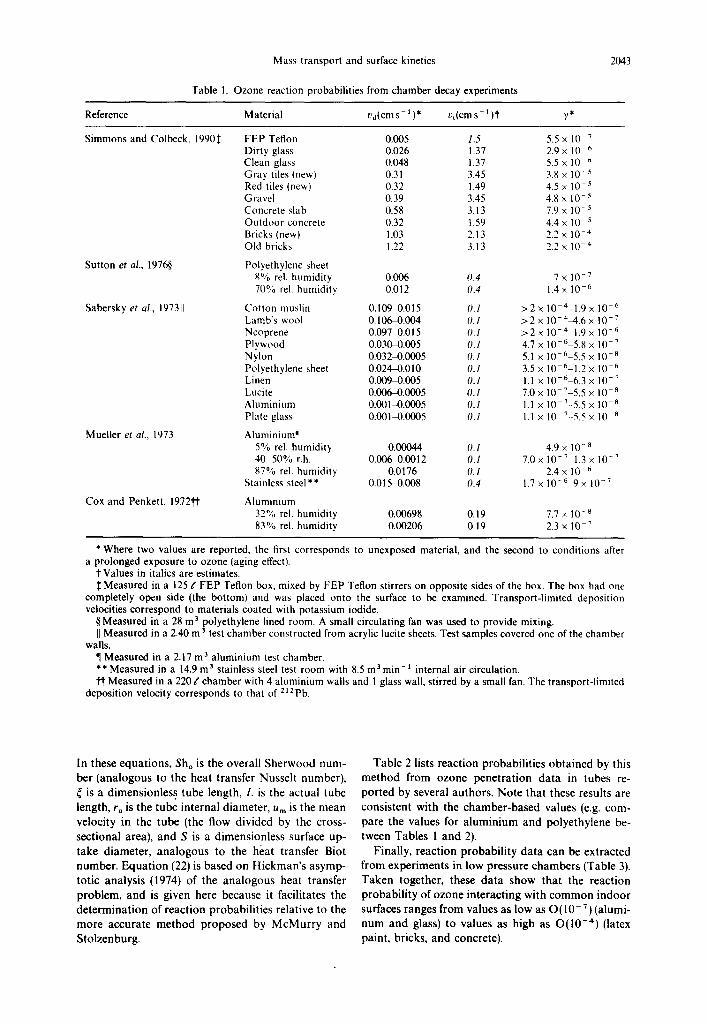
In t he se e q u a t i o n s , Sho is the overa l l S h e r w o o d n u m - T a b l e 2 lists r eac t ion p robab i l i t i e s o b t a i n e d by th is
ber ( a n a l o g o u s to the hea t t r ans fe r N u s s e l t n u m b e r ) , m e t h o d f rom o z o n e p e n e t r a t i o n d a t a in t ubes re-
is a d i m e n s i o n l e s s t ube length , L is the ac tua l tube p o r t e d by severa l a u t h o r s . N o t e t h a t these resu l t s are
length , ro is the t ube in t e rna l d i ame t e r , Um is the m e a n cons i s t en t wi th the c h a m b e r - b a s e d va lues (e.g. c o m -
ve loc i ty in the t ube ( the f low d iv ided by the c ross - pa re the va lues for a l u m i n i u m a n d p o l y e t h y l e n e be-
sec t iona l area), a n d S is a d i m e n s i o n l e s s sur face up- tween T a b l e s 1 a n d 2).
t ake d i ame te r , a n a l o g o u s to the hea t t r ans fe r Biot Final ly , r e ac t i on p robab i l i t y d a t a c a n be ex t r ac t ed n u m b e r . E q u a t i o n (22) is b a s e d on H i c k m a n ' s a s y m p - f rom e x p e r i m e n t s in low p r e s s u r e c h a m b e r s (Table 3).
to t ic ana lys i s (1974) o f the a n a l o g o u s hea t t r ans fe r T a k e n toge the r , t hese d a t a s h o w t h a t the r eac t ion
p r o b l e m , a n d is g iven here because it faci l i tates the p r o b a b i l i t y o f o z o n e in t e r ac t i ng wi th c o m m o n i n d o o r
d e t e r m i n a t i o n o f r eac t ion p robab i l i t i e s re la t ive to the sur faces r a n g e s f rom va lues as low as O ( 1 0 - 7) (a lumi-
m o r e a c c u r a t e m e t h o d p r o p o s e d by M c M u r r y a n d n u m a n d glass) to va lue s as h igh as O ( 1 0 -4 ) (latex
S to l zenburg . pa in t , br icks, a n d concrete) .
2044 J.A. CANO-RUIz et al.
Table 2. Ozone reaction probabilities from tube penetration experiments
Reference Material y*
Altshuller and Wartburg, 1961 Teflon 2 x 10 -s Glass 2x 10 -7 <1 × 10 -8 Stainless steel (304) >3 x 10⁻⁶-<2 x l0 s Stainless steel (316) 8 x 10⁻⁶-1 x 10 -7 Aluminum > 1.3 x l0 -6- 1.3 x 10 -7 Polyethylene 1.7 x l0 -6 8 x 10 -7 PVC (Nalgon) 5 x 10⁻⁶-8 x 10 7 PVC (Tygon) {2-5) x l0 -6
Cohen et al., 1968 Glass < 1.6 x 10 -7 Silicon rubber 1 x l0 -s Polyethylene 3 x l0 -6 Nylon 1.7 × l0 7 PVC 3 x 10⁻⁶-1.2 x l0 -6
Ryan et al., 1992 Glass < 1 x 10 -6 Latex paint
9% rel. humidity 3 × l0 -6 50% tel. humidity 1.2 x 10⁻⁵-5 x 10 -6 91% rel. humidity 8 x 10 -s
* Where two values are reported, the first corresponds to unexposed material, and the second to conditions after a prolonged exposure to ozone (aging effect).
Table 3. Ozone reaction probabilities from low-pressure chamber experiments
Reference Material ~, *
Stephens et al., 1986 Ground charcoal 2.0 x 10⁻³-4.0 x 10 -5 Tkalich et al., 1984 Quartz 7.0 x 10 -11
Stainless steel 3.5 x 10⁻⁵-4.0 x 10 - 9
• Where two values are reported, the first corresponds to unexposed material, and the second to conditions after a prolonged exposure to ozone (aging effect).
3.3. Appl ica t ion to indoor a i r f l o w s energy (in the case of na tura l convection), and poilu-
Al though air mot ion in indoor envi ronments is tant species, expressed in dimensionless form. The generally complex and near-surface air flow condi- following assumpt ions were employed: steady state or t ions are not thoroughly unders tood, useful insights quasi-s teady state condit ions, incompressible fluid ex- into the problem of pol lu tan t removal by indoor sur- cept in the buoyancy term of the m o m e n t u m equa- faces may be gained by analyzing idealized flow con- tion, and no homogeneous produc t ion or decay of ditions. We examine four cases, representat ive of the species. The bounda ry condi t ions for the s imulat ions l imiting condi t ions tha t may be found in rooms: were these: no-slip at solid surfaces, ei ther cons tant (1) forced laminar flow parallel to a fiat plate, tempera ture or no heat flux at the surfaces, and con- (2) na tura l convect ion laminar flow along a vertical s tant velocity, tempera ture and species concent ra t ion isothermal plate, (3) laminar na tura l convect ion flow in the bulk of the fluid. At a distance of 22/3 away in an enclosure, and (4) homogeneously tu rbulen t flow from the surface, pol lu tant diffusive flux equals the in an enclosure. In the following subsections, approx- surface uptake flux. imate mathemat ica l expressions are derived for com- An existing, experimental ly validated laminar con- put ing deposi t ion velocities for cases 1, 2 and 4, using vection air model (Gadgil, 1980; Bauman et al., 1983) bounda ry layer theory and the conceptual model de- was applied to numerical ly simulate the convect ion scribed previously. Detai led numerical s imulat ions air flow. A finite-difference numerical method using are used to improve the precision of the approximate the P a t a n k a r - S p a l d i n g differencing scheme was used. mathemat ica l expressions obtained, and to examine The solut ion a lgor i thm used iterative under-relax- deposi t ion under the more complex flow pat terns of at ion of a discretized form of the governing equat ions na tura l convect ion flow in an enclosure, to approach the solution of the air flow fields. Once
The numerical scheme solves the differential equa- the laminar convect ion flow fields were predicted, t ions governing conservat ion of mass, momentum, concent ra t ion profiles were computed by numerical ly
Mass transport and surface kinetics 2045
solving the pollutant advection-diffusion equation. The average deposition velocity to a plate of length Deposition velocities were computed from the species L is given by concentration profiles. A similar approach was pre- 1
viously used to simulate the deposition of radon decay v-~ = L ~0 v,l(x) dx. (30) products onto indoor surfaces (Brager et al., 199k
Brager and Revzan, 1991; Nazaroff et al., 1992). Solving the integral we obtain 3.3.1. Forced laminar fiow parallel to a smooth, fiat
plate. The plate is considered in isolation, and is 2vdL) assumed to extend without bound from the leading t . = d ~ [R-- ln( l +R) ] (31)
edge in the direction of free stream air flow. The air where v,(L) is the local transport-limited deposition
velocity and pollutant concentration are assumed to velocity, evaluated at x = L
be constant outside a thin boundary layer. Air and
surface temperature differences are assumed to be v t (L j=O.332~Sc t /3Re~/2 (32) small enough that buoyancy effects on the momentum L of air may be ignored.
The local deposition velocity vd(x)is approximately and R = vs/v,(L). If R ~ 1 equation (31) reduces the given by equation ~13), which may be modified to transport-limited mean deposition velocity (Bejan, yield 1984, Ch. 9)
G cj va(x)~ vs6c(x) (24) Fd=O.664-- Scl/3 Re~/2 . (33)
1 4 - - - L @
On the other hand, if R,~ 1, then In (1 + R ) ~ R - R2/2 where v~ is the surface uptake velocity, given by " and equation (31) reduces to ~ v s
_ _ ( v ) (34) (v) (25) ~ 7 4 G = 7 4
The problem is reduced to finding 6c as a function We are now in a position to evaluate the critical of distance along the plate. Scale analysis (Bejan, values of 7 for 0 3 under forced laminar flow condi- 1984) can be used to predict the order of magnitude tions, that is, the values of y beyond which equations of 6~ t33) and (34) may be used without loss of accuracy.
6¢(x )~x Sc-1/3Re~ 1/2 (26) For representative indoor conditions, we take U~ as 0.1 ms -x, and L as 1 m. Substitution into equation
In this equation, x is the distance along the plate [32) yields vt(L)=4.62 x 10 -2 cms-L We also know (x=0 at the leading edge), S c = v / ~ is the Schmidt that (v) for ozone is 3.6 x 10⁴ cms-~, which gives number (0.82 for 03 in air at 293K), and v~=9.0x1037cms-L According to the definition, Re,,= U~xv 1 is the local Reynolds number, where R is then approximately equal to 2 x 1057. Equation /d~ is the free stream air velocity, and v is the kine- (31)is approximated within 5% by the mass transport matic viscosity of air (1.5 x 10 -5 m e s - t at 293 K). limit when R >89, and by the surface-uptake limit
To obtain the proportionality constant for equa- when R<0.07. The corresponding critical values of tion (26) we will use results from the solution to this 7 are 4.6 x 10⁻⁴ and 3.6 x 10- 7. If U~ were 0.01 m s- problem under transport-limited conditions, which instead of 0.1 m s - k then v,(L) would be can be obtained from a similarity solution to the 1.46 x 10 -2 cms -a and the critical values of y would analogous heat transfer problem, first obtained by be a factor of 3 lower. Polhausen in 1912. The Polhausen solution (Bejan, We also used our numerical scheme to predict the 1984; p. 51) in combination with the analogy between rate of ozone deposition from forced convection flow heat and mass transfer (Bejan, 1984, Ch. 9; Incropera with free stream velocity U~ =0.1 m s-~ onto a plate and DeWitt, 1990; Nazaroff and Cass, 1989) yields with a length L= 2 m. The computational domain for
Sh~=0.332 Sc 1/3 Relx/2 (Sc>0.5) (27) this simulation was taken as 2 m x 0.2 m, and a non- uniform 31 x29 grid was used. Much finer spacing
where Sh~ = x vt(x)2 - ~ is the Sherwood number, and was defined near the surface to enable accurate pre- the transport-limited local deposition velocity v,(x) is dictions: spacing in the y direction (transverse to the approximately equal to ~/6¢(x). This equation may flow) varied between 4.3 x 10 -s m (22/3) next to the be solved for the concentration boundary layer thick- surface to 0.02 m at the outer edge of the computa- ness to obtain tional domain.
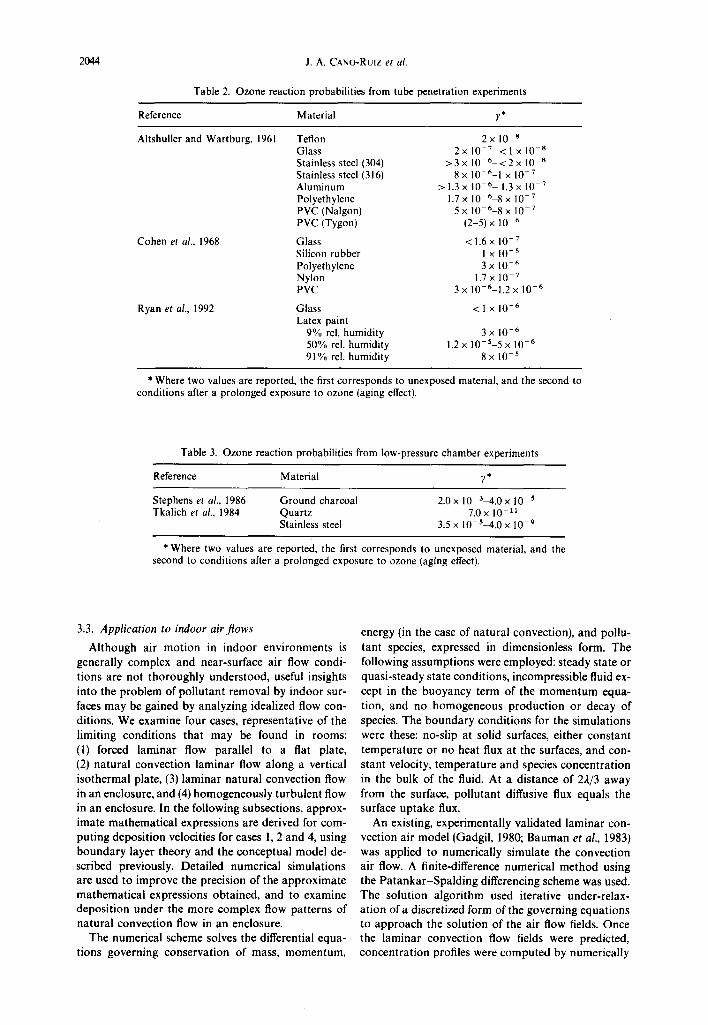
6~(x) ~ 3.0 x Sc-~/3 Re~ ~/2 (28) The results of the numerical simulations are shown in Fig. 1 along with the approximate analytical pre-
which is the result needed for substitution into equa- dictions of equation 131). The two approaches agree tion (241 very well, within 1.5%, demonstrating that the ana-
Us Vd(X)-~] +3V~X S c - 1 / 3 R e x U 2 ~ -1" (29) lytical expressions are an appropriate substitute for the more complex numerical analysis. This important
2046 J.A. CANO-RUIZ et al.
-1 ........ i ........ i ........ i ........ I ........ J ........ i ........ I ....... a sion, over the diffusivity range appropriate to most b~ ]0 fi ~ o ~ ~ gases of interest in indoor air quality (5 x 10 -6 to
~ 3 x 10 -~ m2s -1, cf. Nazaroff and Cass, 1989) i>.~ lO .2 ~, - -- 09'(0) = 0.50 Le °'463 (37)
"~ 1°3 where Le=~/~ is the Lewis number (1.2 for 03 at "~ = - 293 K). Substitution of equation (37) into equation r~ 10 -4 - - analytical o 7, (35) yields ?~ o numerical
........ I ........ I ' 1 3 t ( x ) : O . 5 0 ~ t e ° ' 4 6 3 ( ~ ) 1/4 . . . . . . . ( 3 8 ) 8 "'l ' " ' ' l ~ I ' ' l ' H'"l X
16 6 10- 4 10 -2 1 .0
reaction probability, 7 Finally, we proceed as we did before and set v t ( x ) ~ / f c ( x ) to obtain the result
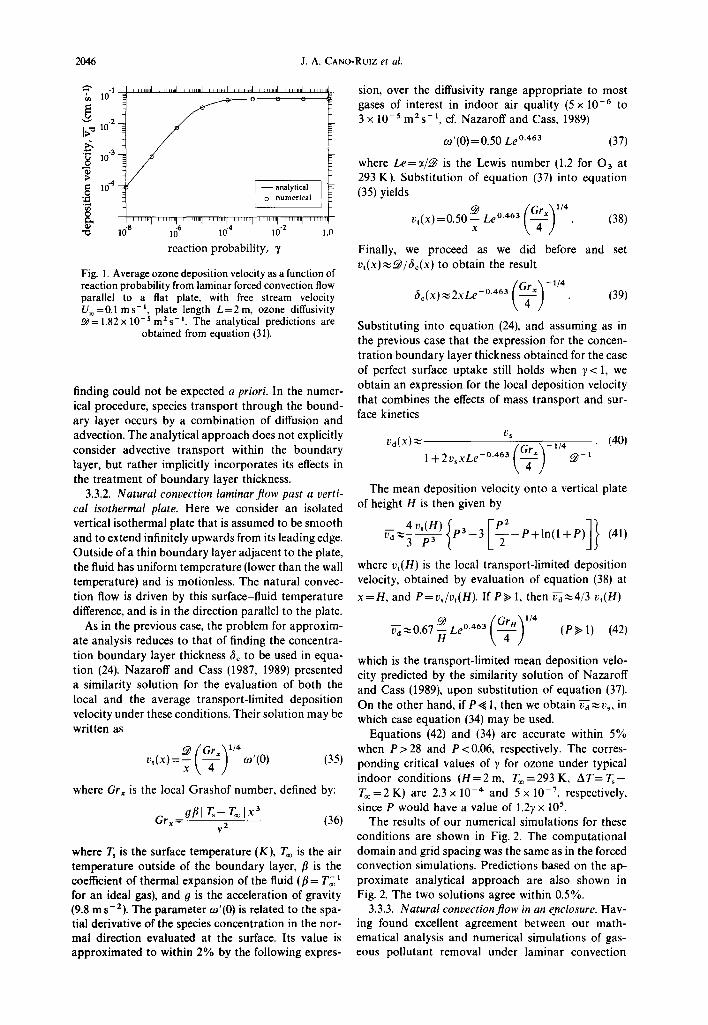
Fig. I. Average ozone deposition velocity as a function of reaction probability from laminar forced convection flow ( ~ ) - 1/,*. parallel to a fiat plate, with free stream velocity 6c(x) "~2xLe-°463 (39) U~=0.1 ms -1, plate length L=2m, ozone diffusivity 9 = 1.82 × 10 -s m2s -1. The analytical predictions are Substituting into equation (24), and assuming as in
obtained from equation (31). the previous case that the expression for the concen-
tration boundary layer thickness obtained for the case of perfect surface uptake still holds when )' < 1, we obtain an expression for the local deposition velocity finding could not be expected a priori. In the numer-
ical procedure, species transport through the bound- that combines the effects of mass transport and sur- ary layer occurs by a combination of diffusion and face kinetics
advection. The analytical approach does not explicitly vd(x) ~ vs (40) consider advective transport within the boundary (__~,)-1/4 layer, but rather implicitly incorporates its effects in 1 + 2vsxLe-O.,6a \ ' + / ~-i the treatment of boundary layer thickness.
3.3.2. Natural convection laminar flow past a verti- The mean deposition velocity onto a vertical plate cal isothermal plate. Here we consider an isolated of height H is then given by
vertical isothermal plate that is assumed to be smooth b-~d ~ ~ ~ ~ Pa--3[--~-P+In(I+P)]}P 2 (41) and to extend infinitely upwards from its leading edge. Outside of a thin boundary layer adjacent to the plate, the fluid has uniform temperature (lower than the wall where v,(H) is the local transport-limited deposition temperature) and is motionless. The natural convec- velocity, obtained by evaluation of equation (38) at tion flow is driven by this surface-fluid temperature x=H, and P=vs/vt(H). If P~> 1, then ~ 4 / 3 vt(H) difference, and is in the direction parallel to the plate.
As in the previous case, the problem for approxim- Fa~O.67~LeO.463(_~) ~/4 ate analysis reduces to that of finding the concentra- H (P,> 1) (42)
tion boundary layer thickness 6c to be used in equa- which is the transport-limited mean deposition velo- tion (24). Nazaroff and Cass (1987, 1989) presented city predicted by the similarity solution of Nazaroff a similarity solution for the evaluation of both the and Cass (1989), upon substitution of equation (37). local and the average transport-limited deposition On the other hand, if P,~ 1, then we obtain ~ v s , in velocity under these conditions. Their solution may be which case equation (34) may be used.
written as Equations (42) and (34) are accurate within 5% w en <006 res ctivo,y corvus
v t ( X ) = x L ~ ) o9'(0) (35) ponding critical values of )' for ozone under typical indoor conditions ( H = 2 m, T~ =293 K, AT= ~ -
where Gr~ is the local Grashof number, defined by: T~ =2 K) are 2.3 x 10 -4 and 5 x 10 -7, respectively,
gill T~--T~o I x3 since P would have a value of 1.2), x 105. Gr~= v2 (36) The results of our numerical simulations for these
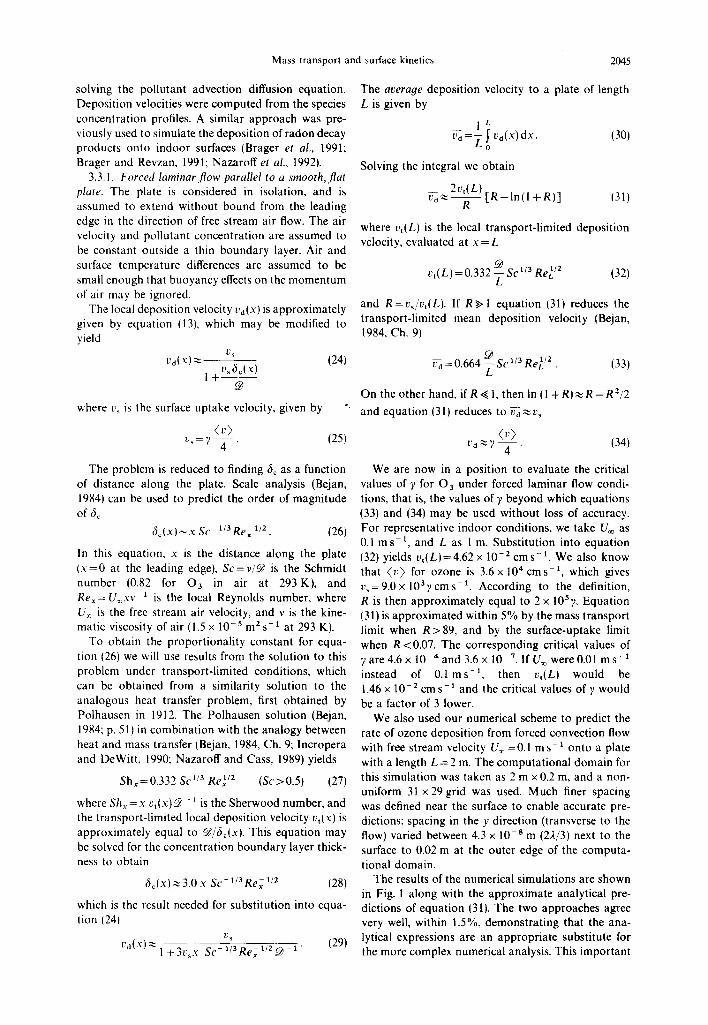
conditions are shown in Fig. 2. The computational where T~ is the surface temperature (K), T~o is the air domain and grid spacing was the same as in the forced temperature outside of the boundary layer, fl is the convection simulations. Predictions based on the ap- coefficient of thermal expansion of the fluid (fl=T~ 1 proximate analytical approach are also shown in for an ideal gas), and g is the acceleration of gravity Fig. 2. The two solutions agree within 0.5%. (9.8 ms-2) . The parameter co'(0) is related to the spa- 3.3.3. Natural convection flow in an enclosure. Hav- tial derivative of the species concentration in the nor- ing found excellent agreement between our math- mal direction evaluated at the surface. Its value is ematical analysis and numerical simulations of gas- approximated to within 2% by the following expres- eous pollutant removal under laminar convection
Mass transport and surface kinetics 2047
1.0 ........ t ........ t ........ ~ ........ ~ ........ ~ ........ ~ ........ t ....... i A d i a b a t i c
' - o o o
_3: : x . "~ 10 -
- - analyt ical ] 10.4- n . . . . teal C o r e L
. . . . . . . . ' . . . . . . . . ' 7 - ' . . . . . . . ' - x .. . . . . . ' . . . . . . . . . . . . . . . ' . . . . . . . Tel ~z lO 10 10 10- 1.0
l react ion probabi l i ty , y ,9
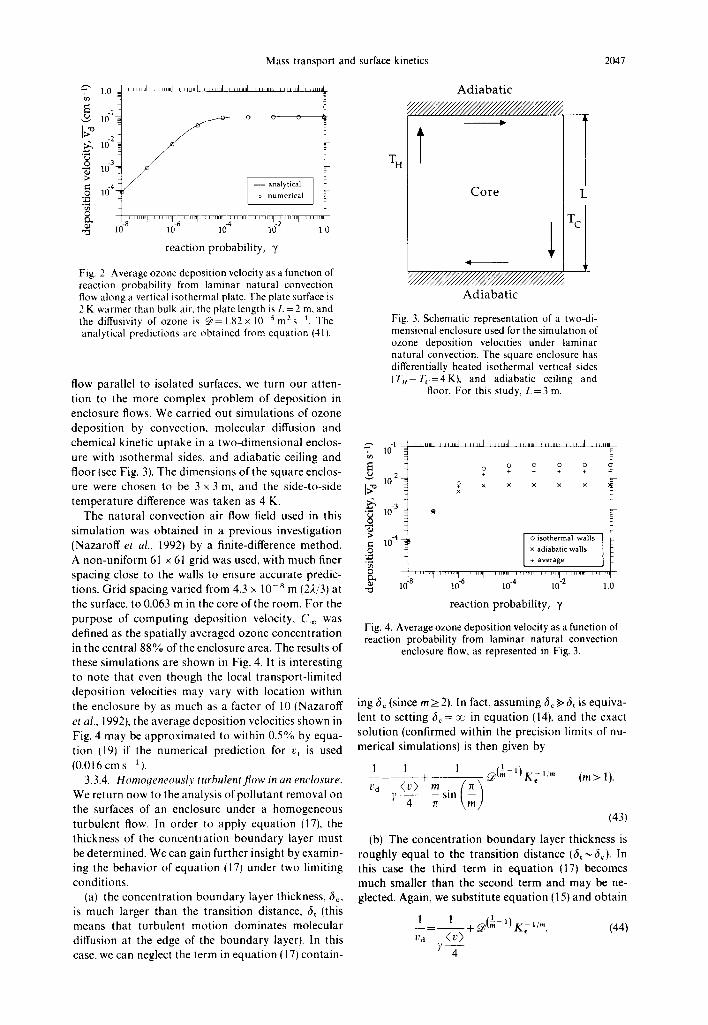
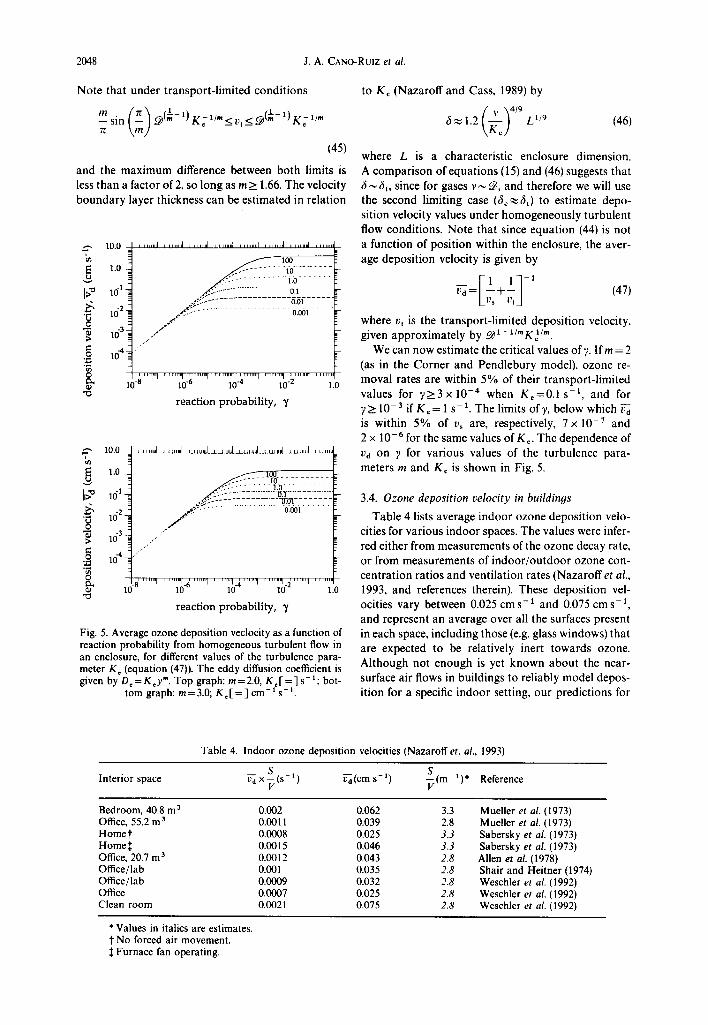
Fig. 2. Average ozone deposition velocity as a function of reaction probability from laminar natural convection Y/ / / / / / / / / / / / / / / / / / / / / / / ' / / / ' / / / / / ' / / / / / /~ flow along a vertical isothermal plate. The plate surface is A d i a b a t i c 2 K warmer than bulk air, the plate length is L = 2 m, and the diffusivity of ozone is @ = 1.82 × 10 5 m 2 s t. The Fig. 3. Schematic representation of a two-di- analytical predictions are obtained from equation (41). mensional enclosure used for the simulation of
ozone deposition velocities under laminar natural convection. The square enclosure has differentially heated isothermal vertical sides
flow paral le l to i sola ted surfaces, we tu rn ou r a t t en- ( T , - T c = 4 K), and adiabatic ceiling and floor. For this study, L = 3 m.
t ion to the m o r e complex p r o b l e m of depos i t i on in enc losure flows. We car r ied ou t s imu la t i ons of o z o n e depos i t i on by convec t ion , mo lecu l a r diffusion and chemica l k ine t ic u p t a k e in a t w o - d i m e n s i o n a l enclos- ,--, -1 . . . . . . . . I . . . . . . . . I . . . . . . . . I . . . . . . . . I . . . . . . . . I . . . . . . . . [ . . . . . . . . I . . . . . . . i
ure wi th i s o t h e r m a l sides, and ad i aba t i c ceil ing a n d ~ t0 E +o +o + o + o +o
f loor (see Fig. 3). T h e d i m e n s i o n s of the squa re enclos- v 10-2
ure were chosen to be 3 × 3 m, and the s ide- to-s ide ]>'~ 2 x × ,< × x × 7-
t e m p e r a t u r e difference was t a k e n as 4 K. ~" T h e n a t u r a l c o n v e c t i o n air flow field used in this "~ 1°-3 *
s i m u l a t i o n was o b t a i n e d in a p rev ious inves t iga t ion (Naza ro f f et al., 1992) by a f ini te-difference m e t h o d . ~ 10-4 ×°is°thadiabatic . . . . wallsl walls [
A n o n - u n i f o r m 61 x 61 gr id was used, with m u c h finer :'~ + average I spac ing close to the walls to ensu re accura te predic- ~ ........ I ........ i ........ I ........ 1 ........ I ........ I ........ i .......
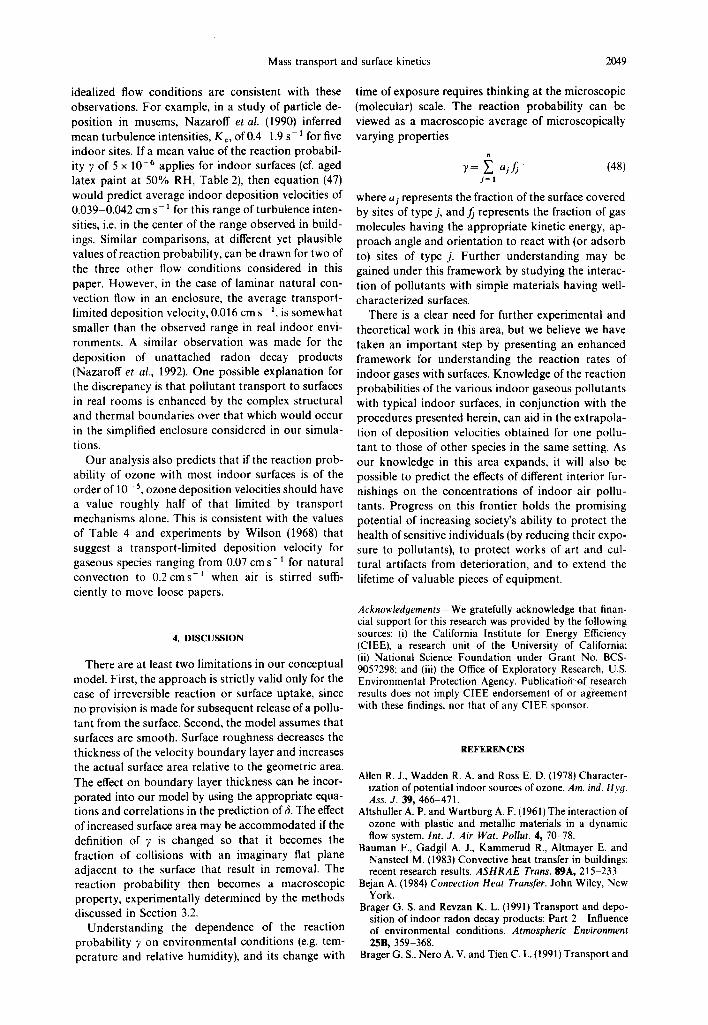
10 -8 10- 6 10 -4 10 -2 1.0 t ions. G r i d spac ing var ied f rom 4.3 × 10 ~s m (22/3) at "~ the surface, to 0.063 m in the core of the room. F o r the react ion probabi l i ty , ~' p u r p o s e of c o m p u t i n g depos i t i on velocity, C ~ was def ined as the spat ia l ly ave raged ozone c o n c e n t r a t i o n Fig. 4. Average ozone deposition velocity as a function of
reaction probability from laminar natural convection in the cen t ra l 8 8 % of the enc losure area. The resul ts of enclosure flow, as represented in Fig. 3. these s i mu l a t i o n s are s h o w n in Fig. 4. It is in te res t ing to no te t ha t even t h o u g h the local t r a n s p o r t - l i m i t e d depos i t i on velocit ies m a y vary wi th loca t ion wi th in the enc losure by' as m u c h as a fac tor of 10 (Naza ro f f ing 6~ (since m > 2). In fact, a s s u m i n g 6 ¢ ~ 6, is equ iva- et al., 1992), the ave rage depos i t i on velocit ies s h o w n in lent to se t t ing 6~ = o o in e q u a t i o n (14), a n d the exact
so lu t ion (conf i rmed wi th in the prec is ion l imits of nu- Fig. 4 m a y be a p p r o x i m a t e d to wi th in 0 .5% by equa- t ion (19) if the numer ica l p red ic t ion for ~ is used mer ica l s imula t ions ) is t hen given by
(0.016 cm s - 1) - 1 1 1 ~! 1~ 1 . ,
- (,<, ~," ' K ; ; 3.3.4. Homo qeneously turbulent flow in an enclosure. ( v ) + m (m > 1 ). We re tu rn n o w to the analys is o f p o l l u t a n t r em ova l on Vd 3 . . . . sin t ) the surfaces of an enc losure u n d e r a h o m o g e n e o u s 4 n m t u r b u l e n t flow. In o rde r to app ly e q u a t i o n (17), the (43)
th ickness of the c o n c e n t r a t i o n b o u n d a r y layer m u s t (b) The c o n c e n t r a t i o n b o u n d a r y layer th ickness is be de t e rmined . We can gain fu r ther ins ight by exam in - rough ly equa l to the t r a n s i t i o n d i s t ance ( 6 , ~ 6~). In ing the b e h a v i o r of e q u a t i o n (17) u n d e r two l imi t ing th is case the th i rd t e rm in e q u a t i o n (17) b e c o m e s cond i t ions , m u c h smal le r t h a n the second t e rm a n d m a y be ne-
(a) the c o n c e n t r a t i o n b o u n d a r y layer th ickness , 6~, glected. Again , we subs t i tu t e e q u a t i o n (15) and o b t a i n is m u c h larger t h a n the t r a n s i t i o n dis tance , 6, ( this
__ 1 1 m e a n s tha t t u r b u l e n t m o t i o n d o m i n a t e s mo lecu l a r 1 1 t-c..~, (~ )K~ ll~. (44) diffusion at the edge of the b o u n d a r y layer). In this Vd (V) case, we can neglect the t e rm in e q u a t i o n (17) c o n t a i n - 4
2048 J.A. CANO-RuIZ et al.
Note that under transport-limited conditions to Ke (Nazaroff and Cass, 1989) by
- s i n ~ e(~-')K:X/"<_v,<_eff'-X)KgX/" a . ~ 1.2 ~ E ) L 1/9 (46)
(45) where L is a characteristic enclosure dimension. and the maximum difference between both limits is A comparison of equations (15) and (46) suggests that less than a factor of 2, so long as m > 1.66. The velocity 3 ~ 6t, since for gases v ~ 9 , and therefore we will use boundary layer thickness can be estimated in relation the second limiting case (6¢ ~6t) to estimate depo-
sition velocity values under homogeneously turbulent flow conditions. Note that since equation (44) is not
,-, t0.0 ....... ~ ........ ~ ........ ~ ........ J ........ ~ ........ ~ ........ ~ ....... J a function of position within the enclosure, the aver- b, ~ a00 age deposition velocity is given by
1.0 ~!.i_i_ii..~:°o~7~77 v : " " F ] (47) 1~ '~ 10 "1 , ~ . . . . . . . . . . . . . . . . . . . . . . . o: i .............. ~ ~ d = L _ I _ L - 1
.:.:.; . . . . . . . . . . . . . . . . . . ~.~r . . . . . . _ /v~ Vtd ~" 16 2 / ~ " ............................... 0:~i . . . . . ~- '~ where v, is the transport-limited deposition velocity, "~ t6 s : / r given approximately by ~ * - x / " K TM . ..'" -= - - ¢ .
=o t04- ~- We can now estimate the critical values of 7. If rn = 2 i~ (as in the Corner and Pendlebury model), ozone re-
ra ' ..... ~'~-~'"'" ..... ~'~-~'"""' ..... ~'~.~'"""l ..... 1'.0 moval rates are within 5°/0 of their transport-limited "~ values for 7>_3x 10 -4 when K~=0.1 s - l , and for
reaction probability, "/ y > 10 -3 if K, = 1 s - t. The limits of),, below which
is within 5% of v~ are, respectively, 7 x 10 - 7 and 2 x 10 -6 for the same values of K¢. The dependence of
10.0 ~ Vd on ~ for various values of the turbulence para-
1 ' ° 1 ~ E ~ ~ i ~ i I meters m and K~ is shown in Fig. 5.
1~ 101 3.4. O z o n e depos i t i on ve loc i t y in bu i ld inys
10 .2 Table 4 lists average indoor ozone deposition velo- -~ 163.~ .......... .- ~_ cities for various indoor spaces. The values were infer-
red either from measurements of the ozone decay rate,
=° 104~i ~ or from measurements of indoor/outdoor ozone c O n - c e n t r a t i o n ratios and ventilation rates (Nazaroff et al., :=
. . . . . . . ~ . . . . . . . . i . g . . . . . . . i . . . . . . . . i , ; . . . . . . . . i . . . . . . . . i . ~ . . . . . . . i . . . . . . .
lO -° to TM lO" 16" 1.o 1993, and references therein). These deposition vel- reaction probability, "/ ocities vary between 0.025 cm s- ~ and 0.075 cm s- x,
and represent an average over all the surfaces present Fig. 5. Average ozone deposition veclocity as a function of in each space, including those (e.g. glass windows) that reaction probability from homogeneous turbulent flow in are expected to be relatively inert towards ozone. an enclosure, for different values of the turbulence para- Although not enough is yet known about the near- meter K, (equation (47)). The eddy diffusion coefficient is given by O~ = K , y ' . Top graph: m = 2.0, K , [ = ] s-a; bot- surface air flows in buildings to reliably model depos-
tom graph: m=3.0; K , [ = ] cm -~ s-L ition for a specific indoor setting, our predictions for
Table 4. Indoor ozone deposition velocities (Nazaroff et. al., 1993)
S i , Interior space ~ x S(s - t) ~(cm s-l) ~ ( m - ) Reference
Bedroom, 40.8 m 3 0.002 0.062 3.3 Mueller et al. (1973) Office, 55.2 m 3 0.0011 0.039 2.8 Mueller et al. (1973) Homer 0.0008 0.025 3.3 Sabersky et al. (1973) Homes 0.0015 0.046 3.3 Sabersky et al. (1973) Office, 20.7 m 3 0.0012 0.043 2.8 Allen et al. (1978) Office/lab 0.001 0.035 2.8 Shair and Heitner (1974) Office/lab 0.0009 0.032 2.8 Weschler et al. (1992) Office 0.0007 0.025 2.8 Weschler et al. (1992) Clean room 0.0021 0.075 2.8 Weschler et al. (1992)
* Values in italics are estimates. t No forced air movement. :1: Furnace fan operating.
Mass transport and surface kinetics 2049
idealized flow conditions are consistent with these time of exposure requires thinking at the microscopic observations. For example, in a study of particle de- (molecular) scale. The reaction probability can be position in musems, Nazaroff et al. (1990) inferred viewed as a macroscopic average of microscopically mean turbulence intensities, Ke, of 0.4-1.9 s- 1 for five varying properties indoor sites. If a mean value of the reaction probabil- ity y of 5 x 10 -6 applies for indoor surfaces (cf. aged 7= ~ ajfj (48) latex paint at 50% RH, Table 2), then equation (47) j=l would predict average indoor deposition velocities of where a~ represents the fraction of the surface covered 0.039-0.042 cm s- 1 for this range of turbulence inten- by sites of type j, and f~ represents the fraction of gas sities, i.e. in the center of the range observed in build- molecules having the appropriate kinetic energy, ap- ings. Similar comparisons, at different yet plausible proach angle and orientation to react with (or adsorb values of reaction probability, can be drawn for two of to) sites of type j. Further understanding may be the three other flow conditions considered in this gained under this framework by studying the interac- paper. However, in the case of laminar natural con- tion of pollutants with simple materials having well- vection flow in an enclosure, the average transport- characterized surfaces. limited deposition velocity, 0.016 cm s- 1, is somewhat There is a clear need for further experimental and smaller than the observed range in real indoor envi- theoretical work in this area, but we believe we have ronments. A similar observation was made for the taken an important step by presenting an enhanced deposition of unattached radon decay products framework for understanding the reaction rates of (Nazaroff et al., 1992). One possible explanation for indoor gases with surfaces. Knowledge of the reaction the discrepancy is that pollutant transport to surfaces probabilities of the various indoor gaseous pollutants in real rooms is enhanced by the complex structural with typical indoor surfaces, in conjunction with the and thermal boundaries over that which would occur procedures presented herein, can aid in the extrapola- in the simplified enclosure considered in our simula- tion of deposition velocities obtained for one pollu- tions, tant to those of other species in the same setting. As
Our analysis also predicts that if the reaction prob- our knowledge in this area expands, it will also be ability of ozone with most indoor surfaces is of the possible to predict the effects of different interior fur- order of 10- 5, ozone deposition velocities should have nishings on the concentrations of indoor air poilu- a value roughly half of that limited by transport tants. Progress on this frontier holds the promising mechanisms alone. This is consistent with the values potential of increasing society's ability to protect the of Table 4 and experiments by Wilson (1968) that health of sensitive individuals (by reducing their expo- suggest a transport-limited deposition velocity for sure to pollutants), to protect works of art and cul- gaseous species ranging from 0.07 cm s- 1 for natural tural artifacts from deterioration, and to extend the convection to 0.2 cms -1 when air is stirred suffi- lifetime of valuable pieces of equipment. ciently to move loose papers.
Acknowledgements--We gratefully acknowledge that finan- cial support for this research was provided by the following
4. DISCUSSION sources: (i) the California Institute for Energy Efficiency (CIEE), a research unit of the University of California; (ii) National Science Foundation under Grant No. BCS-
There are at least two limitations in our conceptual 9057298; and (iii) the Office of Exploratory Research, U.S. model. First, the approach is strictly valid only for the Environmental Protection Agency. Publication~of research case of irreversible reaction or surface uptake, since results does not imply CIEE endorsement of or agreement no provision is made for subsequent release of a poilu- with these findings, nor that of any C1EE sponsor.
tant from the surface. Second, the model assumes that surfaces are smooth. Surface roughness decreases the thickness of the velocity boundary layer and increases REFERENCES the actual surface area relative to the geometric area. The effect on boundary layer thickness can be incor- Allen R. J., Wadden R. A. and Ross E. D. (1978) Character-
ization of potential indoor sources of ozone. Am. ind. Hyg. porated into our model by using the appropriate equa- Ass. d. 39, 466-471. tions and correlations in the prediction of 5. The effect Altshuller A. P. and Wartburg A. F. (1961) The interaction of of increased surface area may be accommodated if the ozone with plastic and metallic materials in a dynamic definition of 7 is changed so that it becomes the flow system. Int. J. Air War. Pollut. 4, 70-78.
Bauman F., Gadgil A. J., Kammerud R., Altmayer E. and fraction of collisions with an imaginary fiat plane Nansteel M. (1983) Convective heat transfer in buildings: adjacent to the surface that result in removal. The recent research results. ASHRAE Trans. 89A, 215-233. reaction probability then becomes a macroscopic Bejan A. (1984) Convection Heat Transfer. John Wiley, New property, experimentally determined by the methods York. discussed in Section 3.2. Brager G. S. and Revzan K. L. (1991) Transport and depo-
sition of indoor radon decay products: Part 2--Influence Understanding the dependence of the reaction of environmental conditions. Atmospheric Environment
probability V on environmental conditions (e.g. tem- 25B, 359-368. perature and relative humidity), and its change with Brager G. S., Nero A. V. and Tien C. L. (1991) Transport and
2050 J.A. CANO-RUIZ et al.
deposition of indoor radon decay products: Part Society for Testing and Materials, Philadelphia, PA (in 1--Model development and validation. Atmospheric Envi- press). ronment 25B, 343-358. Ryan P.B., Koutrakis P., Bamford S. and Reiss R. (1992)
Chen B. T., Yeh H. C. and Cheng Y. S. (1992) Evaluation of Ozone reactive chemistry in indoor microcnvironments: an environmental reaction chamber. Aerosol Sci. Technol. effects on exposure. In Tropospheric Ozone & the Environ- 17, 9-24. ment 1I: Effects, Modeling and Control. Air and Waste
Cohen 1. C., Smith A. F. and Wood R. (1968) A field method Management Association, Pittsburgh, PA. for the determination of ozone in the presence of nitrogen Sabersky R. H., Sinema D. A. and Shair F. H. (1973) Concen- dioxide. Analyst 93, 507-517. trations, decay rates, and removal of ozone and their
Corner J. and Pendlebury E. D. (1951) The coagulation and relation to establishing clean indoor air. Envir. Sci. Tech- deposition of a stirred aerosol. Proc. phys. Soc. !164, nol. 7, 347-353. 645-654. Seinfeld J. H. (1985) Atmospheric Chemistry and Physics of
Cox R. A. and Penkett S. A. (1972) Effect of relative humidity Air Pollution, pp. 639-641. John Wiley, New York. on the disappearance of ozone and sulfur dioxide in con- Shair F. H. and Heitner K. L. (1974) Theoretical model for tained systems. Atmospheric Environment 6, 365-368. relating indoor pollutant concentrations to those outside.
Crump J. G. and Seinfeld J. H. (1981) Turbulent deposition Envir. Sci. Technol. 8, 444-451. and gravitational sedimentation of an aerosol in a vessel of Shaver C. L., Cass G. R. and Druzik J. R. (1983) Ozone and arbitrary shape. J. Aerosol Sci. 12, 405-415. the deterioration of works of art. Envir. Sci. Technol. 17,
Gadgil A. J. (1980) On convective heat transfer in building 748-752. energy analysis. Ph.D. dissertation, Department of Phys- Simmons A. and Colbeck I. (1990) Resistance of various ics, University of California, Berkeley. building materials to ozone deposition. Envir. Technol. 11,
Hickman H. J. (1974) An asymptotic study of the Nus- 973-978. selt-Graetz problem. Part 1: Large x behavior. J. Heat Stephens S., Rossi M. J. and Golden D. M. (1986) The Transfer 96, 354-358. heterogeneous reaction of ozone on carbonaceous surfa-
lncropera F. P. and DeWitt D. P. (1990) Fundamentals of ces. Int. J. chem. Kinet. 18, 1133-1149. Heat and Mass Transfer, pp. 355-364. John Wiley, New Sutton D. J., Nodolf K. M. and Makino K. K. (1976) Pre- York. dicting ozone concentrations in residential structures.
Friedlander S. K. (1977) Smoke, Dust and Haze. John Wiley, ASHRAE J. 18, 21-26. New York. Tkalich V. S., Klimovskii A. O. and Lisachenko A. A. (1984)
McMurry P. H. and Stolzenburg M. R. (1987) Mass accom- Heterogeneous reaction of ozone: experimental unit and modation coefficients from penetration measurements in procedure. Kinet. Catal. 25, 942-948. laminar tube flow. Atmospheric Environment 21, U.S. Environmental Protection Agency (1989) National air 1231-1234. quality and emissions trends report, 1987. Office of Air
Mueller F. X., Loeb L, and Mapes W. H. (1973) Decomposi- Quality Planning and Standards, EPA-450/4-89-001, Re- tion rates of ozone in living areas. Envir. Sci. Technol. 7, search Triangle Park, NC. 342-346. Utter R. G., Burkholder J. B., Howard C. J. and Ravi-
Nazaroff W. W. and Cass G. R. (1987) Particle deposition shankara A. R. (1992) Measurement of the mass accom- from a natural convection flow onto a vertical isothermal modation coefficient of ozone on aqueous surfaces. J. flat plate. J. Aerosol Sci. 18, 445-455. phys. Chem. 96, 4973-4979.
Nazaroff W. W. and Cass G. R. (1989) Mass-transport as- Weschler C. J. and Shields H. C. (1991) The impact of pects of pollutant removal at indoor surfaces. Envir. Int. ventilation and indoor air quality on electronic equip- 15, 567-584. ment. ASHRAE Trans. 97, 455-463.
NazaroffW. W., Ligocki M. P., Ma T. and Cass G. R. (1990) Weschler C. J., Shields H. C. and Naik D. V. (1989) Indoor Particle deposition in museums: Comparison of modeling ozone exposures. JA PCA 39, 1562-1568. and measurement results. Aerosol Sci. Technol. 13, Weschler C. J., Shields H. C. and Naik D. V. (1992) Indoor 332-348. ozone: recent findings. In Tropospheric Ozone & the Envi-
NazaroffW. W., Kong D. and Gadgil A. J. (1992) Numerical ronment If: Effects, Modeling and Control. Air and Waste investigations of the deposition of unattached 2~Spo and Management Association, Pittsburgh, PA. 2t2pb from natural convection enclosure flow. J. Aerosol Williams E. L. II and Grosjean D. (1990) Removal ofatmos- Sci. 23, 339-352. pheric oxidants with annular denuders. Envir. Sci. Technol.
Nazaroff W. W., Gadgil A. J. and Weschler C. J. (1993) 24, 811-814. Critique of the use of deposition velocity in modeling Wilson M. J. G. (1968) Indoor air pollution. Proc. R. Soc indoor air quality. In Modeling Indoor Air Quality and London, Ser. A 307, 215-221. Exposure (edited by Nagda N. L.). STP 1205, American