re-thinking the role of talent management in a firm's ... - CORE
Upload
khangminh22Category
view
3download
0
1
Thin Capitalization Rules,
Firm’s Financing Decision, and
Corporate Tax Avoidance in Developing Country:
Evidence from Indonesia
Supervisor : dr. J. Pierk Student name : Zaina Student no. : 445330

2
ABSTRACT
The purpose of this thesis is to investigate the effect of the implementation of thin
capitalization rule on firm’s financing decision and corporate tax avoidance in developing
country settings. Based on the samples of 301 publicly listed Indonesian firms over the
2013-2016 period (1204 firm-year observations), using difference in difference approach,
the regression results indicate that the implementation of thin capitalization rule affects only
High DER (Debt to Equity Ratio) companies financing decision, but does not affect Low
DER (Debt to Equity Ratio) firms financing decision. Regarding tax avoidance level, the
implementation of the thin capitalization rule is found to be affecting Low DER firms
effective tax rate negatively and significantly. This indicates that after the implementation
of the rule, Low DER firms have a decreasing effective tax rate compared to the control
group. Finally, the additional regression result shows that after the implementation of the
thin capitalization rule, High DER firms which are multinationals have a lower debt level,
while multinationals Low DER firms have a higher debt level. However, the result is
insignificant. Related to tax avoidance level, both treatment groups show negative and
insignificant result even though already interacted with multinationals.
Keywords: thin capitalization, firm’s financing decision, corporate tax avoidance.

3
Table of Contents 1. Introduction ......................................................................................................................... 4 2. Theoretical Background ..................................................................................................... 8
2.1 Tax Avoidance ............................................................................................................................. 8 2.1.1. What is Tax Avoidance? ....................................................................................................... 8
2.2 Thin Capitalization, Capital Structure, and Financing Decision ........................................... 9 2.2.1 Thin Capitalization Definition ............................................................................................... 9 2.2.2 Taxation and Capital Structure Theory .................................................................................. 9
2.3 Thin Capitalization Strategy and Tax Avoidance .................................................................. 11 2.4 The Indonesian Background .................................................................................................... 13
2.4.1 Indonesian Corporate Tax System ....................................................................................... 13 2.4.2 Indonesian Thin Capitalization Rule .................................................................................... 14
3. Prior Research into Thin Capitalization, Financing Decision, and Tax Avoidance ... 16 3.1 Thin Capitalization Strategy and Corporate Tax Avoidance Studies .................................. 16
3.1.1 Thin Capitalization Studies in Developed Country ............................................................. 16 3.1.2 Thin Capitalization Studies in Developing Country ............................................................ 17
3.2 Thin Capitalization Rule Effectivity Studies .......................................................................... 17
4. Hypothesis Development .................................................................................................. 19 4.1 Thin Capitalization Rule and Firm’s Financing Decision ..................................................... 19 4.2 Thin Capitalization Rule and Corporate Tax Avoidance ...................................................... 20
5. Research Design ................................................................................................................ 22 5.1 Dependent Variables ................................................................................................................. 22
5.1.1 Firm’s Financing Decisions ................................................................................................. 22 5.1.2 Corporate Tax Avoidance .................................................................................................... 22
5.2 Independent Variables .............................................................................................................. 23 5.2.1 Thin Capitalization Rule Implementation ............................................................................ 23
5.3 Control Variables ...................................................................................................................... 23 5.3.1 Control Variables for Firm’s Financing Decisions .............................................................. 23 5.3.2 Control Variables for Corporate Tax Avoidance ................................................................. 25
5.4 Difference in Difference Approach .......................................................................................... 26 5.4.1 Regression Formula ............................................................................................................. 27
5.5 Sample Selection and Data Source ........................................................................................... 27
6. Empirical Result & Analysis ............................................................................................ 30 6.1 Descriptive Statistics ................................................................................................................. 30 6.2 Regression Result ....................................................................................................................... 34
6.2.1 The Effect of Thin Capitalization Rule on Firm’s Financing Decision ............................... 34 6.2.2 The Effect of Thin Capitalization Rule on Corporate Tax Avoidance ................................ 39
6.3 Additional Analysis ................................................................................................................... 43
7. Conclusion .......................................................................................................................... 48 8. References .......................................................................................................................... 51 9. Appendix ............................................................................................................................ 57
4
1. Introduction
Until now, tax avoidance is still one of the important issues in the global economy
that almost every country still struggles to fight (Turner, 2017). The article states that
according to research by the IMF, tax avoidance by multinational companies cost
governments $600 billion a year. There are two ways of avoiding tax: tax avoidance and tax
evasion. Tax avoidance refers to the activity of legitimate use of legal loopholes and tax
allowances in order to minimize the amount of tax liability, whereas tax evasion refers to
illegal tax reductions (Gravelle, 2015). There are many practices performed by companies
in order to reduce the amount of their taxes, one of them is to structure their financing plan
by increasing debt instead of equity. The incentive to use more debt financing compared to
equity financing relates to the tax-deductibility nature of interest expense (Egger et al.,
2014).
Thin capitalization strategy allows firms to structure its capital by increasing debt
instead of equity (OECD, 2012). The bigger the proportion of debt, the more interest
expense the company should have to pay, thus the less taxable income since interest expense
is tax-deductible. Moreover, thin capitalization strategy also might help multinational
companies to finance its business by using intercompany loans. The parent which located
in lower tax rate jurisdictions can provide loans to its subsidiary which located in the host
country with higher tax rate jurisdictions. Consequently, the subsidiary can have a lower tax
liability since the borrowing cost is tax-deductible. Therefore, many countries try to
counteract the negative effect of thin capitalization strategy by issuing thin capitalization
rule which restricts the tax-deductibility of interest expense above a certain debt level.
Meanwhile, developing countries are still having dilemma regarding the issuance of
thin capitalization rule. On one side, the government intends to raise investment growth by
providing many financing options and attracting foreign direct investment into the country
to improve the nation’s economic development. On the other side, taxation is the most
important source of government revenue, as it provides the largest contribution to
government revenue. Therefore, in order to be able to finance its public sectors to build
better infrastructures to develop the country, the government also needs to increase its tax
revenue. The issuance of thin capitalization rules is intended to save potential tax revenue
by minimizing the probability of tax avoidance from using interest tax shield through
excessive debt-financing. However, limiting interest deductibility to a certain debt level in
5
thin capitalization rule might also mean as limiting firms financing options which may harm
investment growth.
Related to the abovementioned dilemma, many developing countries still do not have
or have but not yet implemented the thin capitalization rule. Moreover, some countries have
a tight rule and some have a less strict rule. For example, China has thin capitalization rule
which limits the deductibility of interest expense to a maximum Debt-to-Equity Ratio
(DER) 5:1 for financial institutions, and 2:1 for other entities (McKee, 2009). Brazil also
limits its Debt-to-Equity Ratio (DER) to not exceed 2:1 for its thin capitalization rule
(Deloitte, 2010). Taiwan limits Debt-to-Equity Ratio (DER) for 3:1 (Deloitte, 2017). In
South East Asia, Brunei, Thailand, and Laos do not have thin capitalization rule, while
Malaysia has a thin capitalization rule, but its implementation is currently being deferred
until 2018 due to investment reasons. The government of Malaysia wants to protect foreign
investment in the country. Meanwhile, after being deferred with the same reason for 30
years, Indonesia has reintroduced and lowered its thin capitalization rule from a DER of 3:1
in the old rule to 4:1 in the new rule. Debt-to-Equity Ratio (DER) is measured as total debt
divided by total shareholders’ equity. This ratio indicates the proportion of debt financing
relative to equity financing in a company’s capital structure.
From the tax authority perspective, attracting new investor by not having or have but
lessening or not properly implementing the thin capitalization rule may harm the
government potential tax revenue. It will give more flexibility to the companies to finance
their capital structure by loan rather than equity in order to have a lower tax liability. The
objective of this thesis is to investigate whether there is any relation between the
implementation of thin capitalization rule on firms financing decision and corporate tax
avoidance in developing countries. This thesis will take settings of Indonesian firms as one
of developing countries in South East Asia which has just reintroduced its thin capitalization
rule recently. Thus, this thesis attempts to answer the following research question:
RQ: Does the new thin capitalization rule influence Indonesian firms financing decision and
corporate tax avoidance level?
As mentioned in an article in telegraph.co.uk, according to a recent survey in 2015 by
CXC Global, a contractor management specialist, Indonesia has been identified as one of
10 most aggressive countries in the pursuit of tax evaders, of the 51 countries signed up in
OECD agreement to the automatic exchange of tax information in 2015 (Steed, 2015). To

6
support its effort in fighting tax avoidance, Indonesia also had just reintroduced its thin
capitalization rule in 2015. Originally, Indonesia’s Ministry of Finance (MOF) has first
introduced its thin capitalization rule in 1984 which prohibited the deductibility of
borrowing costs for corporate income tax purposes if the Debt-to-Equity Ratio (DER)
exceeded 3:1 (MOF, 1984). However, in 1985 the government decided to defer the
application of this thin capitalization rule to undefined time due to investment reason. At
that time, Indonesia still struggled to increase its economic development. 30 years later, in
September 2015, the government finally re-introduced the new thin capitalization rule
which implemented in the following year. However, the new rule sets the limit of Debt-to-
Equity Ratio (DER) to not exceed 4:1 for the amount of borrowing costs that allowed to be
deductible from taxable income, which means this will allow more debt in financing
structure compared to the previous rule (MOF, 2015). The lessening of the new thin
capitalization rule is also due to investment concerns. The government believes that if the
thin capitalization rule is too tight, it will slow down the economic development since firms
will have limited choices in choosing their source of financing. From tax authority
perspective, the decision to lower the maximum allowed debt level may harm potential tax
revenues which should be a concern too for the government, since Indonesia tax to GDP
ratio is around 11%, which is still below the world average rate of 15.22% according to data
from the World Bank in 2015. However, from taxpayer’s perspective, the previous rule may
seem to be idle or even did not exist since the implementation was deferred since 30 years
ago. Before 2015, taxpayers or firms might free from choosing whatever financing options
which benefited them and did not pay attention or even did not realized that this 1984 thin
capitalization rule existed. However, after the implementation of the new rule 2015
taxpayers’ flexibility in choosing financing methods will be limited.
This research analyzes Indonesian firms financing behavior regarding the utilization
of thin capitalization strategy after the new thin capitalization rule implemented, and how is
the implication to corporate tax avoidance level. Specifically, first, this thesis observes if
there is any change in firms financing decision regarding the use of debt-financing in the
capital structure after the new rule implemented. Second, this thesis investigates the effect
of the rule on the corporate tax avoidance level. Thus, the result obtained can reflect the
behavior of firms in Indonesia related to the use of thin capitalization as a tax-planning
strategy, and the effectivity of the new thin capitalization rule in minimizing tax avoidance
after being applied.
7
Using difference in difference approach on 301 publicly listed Indonesian firms (1204
firm-year observations), the regression results show that the implementation of thin
capitalization rule only affects High Debt-to-Equity Ratio (DER) companies’ decision to
use debt financing method, but does not affect Low Debt-to-Equity Ratio (DER) companies.
This thesis also finds that the implementation of thin capitalization rule has no effect on the
effective tax rate of firms with High DER. In contrast, results show that Low DER
companies are found to have decreasing effective tax rate after the new rule implemented.
The result of this thesis contributes to the corporate tax planning literature by
examining the tax-planning behavior of firms in developing country regarding the utilization
of thin capitalization strategy as a tax avoidance practice. Also, this thesis aims to help
answering dilemma in developing countries regarding the importance of implementation of
thin capitalization rule. Moreover, this thesis is also expected to give relevance specifically
to the Indonesian tax authority regarding the effectivity of the new thin capitalization rule
in minimizing the probability of tax avoidance. In addition, this thesis also hopefully can
help the investors to increase their insights related to thin capitalization structure in tax
planning strategy.
The structure of this thesis will be divided into 7 parts. Section 1 presents the research
question, motivation, as well as the contribution from this research. Section 2 explores
theoretical background related to the research question. Section 3 presents several prior
research which supports the theoretical background. Section 4 discusses the research design,
explanations of variables used, as well as the regression model. Section 5 explains data
acquired and samples selection for the tests. Section 6 discusses the result of the tests as
well as the empirical analysis. And last but not least, section 7 concludes the result of the
analysis and provides limitations as well as suggestions for further research.

8
2. Theoretical Background
2.1 Tax Avoidance
2.1.1 What is Tax Avoidance?
Nowadays, tax avoidance is considered a worldwide problem that should be faced
by almost all tax system. Despite the importance of tax in generating revenue for the
government, a relatively high tax rate may create enough motivations for taxpayers to
pay less tax. Tax avoidance can be broadly defined as the reduction of explicit taxes
(Hanlon and Heitzman, 2010). The act of avoiding tax can involve two actions: tax
avoidance and tax evasion. Although the purpose of those actions is the same which is
to reduce the tax burden, actually tax avoidance and tax evasion have a different
concept. The essential difference is that while tax evasion is an illegal one, tax
avoidance still takes place within the confines of the fiscal law (Van Dijck, 2016).
OECD defined tax avoidance as “a term that is generally used to describe the
arrangement of taxpayer’s affairs that is intended to reduce his tax liability and that
although the arrangement could be strictly legal, it is usually in contradiction with the
intent of the law it purports to follow.” As defined by Black’s Law Dictionary, the
practice of tax avoidance involves the attempt to minimize the amount of tax liability
through employing legal means, usually by taking advantage of weaknesses or
ambiguities in the tax law. Even though the actions involved are legal, the results of
the actions are still considered improper.
Tax evasion is usually associated with a criminal offense which consists of willful
and conscious non-compliance with the law of a tax jurisdiction (United Nations, 2011).
It usually involved an action by which taxpayer tries to escape legal obligations by
fraudulent and other illegal means. According to UN, some common examples of tax
evasion include the failure to notify the tax authority regarding the existence in the
country when it is actually involved in taxable activities; the failure to report the full
amount of income; the failure to report items or sources of taxable income profits or
gain when there is an obligation to provide such information or if the tax authorities
have made a request to provide such information.
However, the borderline between evasion and avoidance sometimes are difficult
to define due to the subjectivity of the interpretation and implementation of tax
avoidance. In addition, the difference in criminal laws between countries makes it
9
difficult to define the degree of criminality of a certain behavior. Some behavior can
be considered criminal in one country, while it is not in another country.
In order to not breaking the law, but still neglect to pay a high amount of taxes
many people and corporations choose tax avoidance over tax evasion. They could
minimize their tax burden while still comply with the law. Since evasion is illegal there
are penalties associated with it depending on the authority in which the evasion takes
place. However, since the purpose of this thesis is to examine the use of legal loopholes
in the tax regulation to minimize tax burden by using thin capitalization strategy,
therefore this thesis will not provide a more detailed explanation about tax evasion,
instead it will focus on the ‘legal’ tax avoidance.
2.2 Thin Capitalization, Capital Structure, and Financing Decisions
2.2.1 Thin Capitalization Definition
Thin capitalization refers to a condition when a company is financed through an
extensive level of debt relative to equity. OECD (2012) defines thin capitalization as
the strategy of a company to structure their financing with relatively high level of debt
instead of equity, which sometimes referred to as ‘highly leveraged’. High level of debt
caused the company to pay a high amount of interest expenses. Since the tax regulation
typically allows interest expenses to be tax-deductible, the income of the company that
is subject to taxation can be lowered. As a consequence, by using this strategy
company’s tax burden will also be reduced. Before jumping further to explore thin
capitalization strategy, this thesis would like to explain more about the theory behind
thin capitalization strategy.
2.2.2 Taxation and Capital Structure Theory
A large number of studies have examined the effects of taxes on corporate
decisions. Majority of these studies found that taxes influence a wide range of corporate
financial decisions such as financing policy or investment policy. Feld et al. (2013)
found that the choices of capital structure are positively affected by taxes. Tax rates are
shown to be correlated with corporate capital structure choices, which suggests that
firms may increase value through optimal debt choice. Graham (1996) found that

10
marginal corporate tax rate influenced the debt policies of US firms. Alworth and
Arachi (2001), Kunieda et al. (2011), Hartmann-Wendels et al. (2012) and Sinha and
Bansal (2013) also found a positive relation between firm-specific marginal tax rates
on company debt policy, for Italian, Japanese, German, and Indian firms, respectively.
The following are some well-known theories related to tax and capital structure:
a) Modigliani-Miller Theorem II (1963).
Their first paper which widely known as Modigliani-Miller Irrelevance Theorem
(1958) hypothesized that, in perfect market (where they assumed there are no taxes,
no bankruptcy cost), it does not matter what capital structure a company uses to
finance its operations, instead what matters the most is the ability of the firm in
creating profit and the risk of its underlying assets. However, in the real world, taxes
and bankruptcy cost do significantly affect firm value. So in their subsequent paper
(1963), Modigliani and Miller relaxed the assumption that there are no corporate
taxes. The tax law typically allows firms to deduct interest payment, while
dividends to stockholders are not deductible. In Modigliani and Miller (1963),
results showed that when corporate income is taxed and interest from debts are tax-
deductible, using debt financing can increase more firm value rather than funding
the business entirely with equity. In other words, firms with greater proportion of
debt are more valuable because of the interest tax shield (Brigham & Ehrhardt,
2011).
b) The Trade-off Theory of Leverage
The trade-off theory addressed the idea that firms will choose how much debt
finance to use by balancing the costs and benefits of that decision (Babberich, 2009;
Brigham & Erhardt, 2011; Shahar et al. 2015). Firms will choose to leverage within
a capital structure up until the optimal capital structure is reached, since they have
to trade off the benefits of favourable tax treatment from debt financing against
higher interest rates and bankruptcy costs. The optimal level of leverage is achieved
when marginal tax shelter benefit equals the marginal bankruptcy and agency costs
associated with debt. The theory recognizes that since interest expense is tax
deductible, issuing bonds will be more preferable in order to reduce company’s tax
liability, while paying dividends on equity will give no tax benefit to the company.
However, increasing debt also increases the risk of bankruptcy to a company.
11
Therefore, trade-off theory suggested a mix of debt and equity financing to offset
the increasing financial risk to a company.
c) Pecking Order Theory
Pecking Order Theory was first introduced by Gordon Donaldson in 1961 and then
modified by Myers and Majluf in 1984. Pecking order theory suggested that
companies prioritize their source of financing started from internal financing using
retained earnings. Then, if external financing is required, firms will start by issuing
the safest security. They will begin with debt with the least financial risk, then goes
to debt with higher risk, then hybrid security such as convertible bonds, and lastly
by issuing preferred stock equity and common stock as a last resort. This hierarchy
is based on the order of the least financing cost that should be incurred by the
company.
However, in the real world, there are companies which do not use the hierarchy as
explained in Pecking Order Theory while choosing its financing decision. Prior
research by Singh and Hamid (1992) and Singh (1995) found that firms in
developing countries prefer equity financing to debt financing. This finding is
contrasts with pecking order theory which suggested that firms will choose to issue
debt first rather than equity when external financing is required.
2.3 Thin Capitalization Strategy and Tax Avoidance Planning
As explained by the capital structure theory above, from the company’s tax-
purpose-related perspective, debt financing is seen as a more attractive financing
decision compared to equity financing. In debt financing, a company with high level of
debts incur high interest expenses which are tax-deductible according to the tax law.
The higher tax-deductible items, the lower pretax income, thus the lower tax burden. In
equity financing, company which issue stocks give dividends to shareholders. Not only
will be taxed for the profit that the company creates, but the shareholders will also be
taxed for the dividends they received. Similarly, the creditor or shareholders in debt
financing (if it is an intercompany loan) will also be taxed for interest income they
received. What makes it different is that by using debt financing, at least company can
have more tax benefit by using interest expense to minimize tax liability from their
profit. Thus, the tax burden for the company will be lower compared to when they use
12
full equity financing where there is no interest expense as a tax-deductible item for
pretax income. This creates an incentive for tax planning strategy by corporations in
order to minimize the amount of tax burden by using interest tax shield, which known
as thin capitalization strategy.
Laconick & O’Sullivan (2000, p.987) on Gajewski (2012) showed evidence
which gives highlights on the thin capitalization phenomenon. They found that more
and more companies operating in the European and international markets funded its
operation by seeking external financing sources in the capital market or by taking out
bank loans. Also on Gajewski (2012), Overesch & Wamser (2010, p.569) addressed
that tax advantage arising from debt financing is perceivable not only on the domestic
level, where the shareholder and the financed company are residents of the same
country with the same tax-jurisdictions, but also on the international level, where these
entities are residents of two different tax jurisdictions.
Moreover, firms can use tax-rate differentials between two tax-jurisdictions in
order to perceive tax benefit from this kind of financing strategy. Webber (2010)
suggests that thin capitalization is often used by multinational entities (MNEs) when
initiating business overseas where there are tax rates differences. MNEs usually form a
local subsidiary to conduct business. Thus, when an investment in a higher-tax
jurisdiction is financed by intercompany debt from a lower-tax jurisdiction, then the
profit will be shifted to the country which imposed lower taxes. Therefore, the
subsidiary can have lower taxable income due to its higher amount of tax-deductible
item from debt financing since it is located in a higher-tax jurisdiction, while the MNEs
as the parent (or the creditor which received interest income) will incur lower tax
expense from that income since it is located in a lower-tax jurisdiction. Overall, the
MNE can minimize its tax burden without incurring additional trade expenses.
This is consistent with prior research which supported that international tax
differentials have an impact in multinational’s financing structure in a way that is
consistent with overall tax minimization (Haufler, and Runkel, 2008). Therefore, this
can shed light that tax-related aspects are the main reasons companies frequently
adopted debt financing method. All in all, thin capitalization can be perceived as an
instance of tax avoidance which classified as choosing financing option that resulted in
the least tax burden.
13
The fact that excessive debt financing might cause an erosion of income subject
to taxation since interest expenses are tax-deductible urges the government of many
countries to impose tax regulations limiting this financing method by issuing thin
capitalization rule. Thin capitalization rules limit firm’s Debt-to-Equity Ratio (DER) to
control highly leveraged financing structures. This will, in turn, limit the tax
deductibility of interest expense a firm can recognize to a certain point or ratio. Firms
can only deduct interest expense from its income if its debt level does not exceed the
maximum allowed limit according to the thin capitalization rule. However, banks,
insurance companies, and other financial industries in their operation usually rely more
significantly on debt than non-financial services firms, such as manufacturing and retail
industries. As a consequence, financial services firms have higher DER ratio compared
to other industries. Therefore, some countries usually establish separate thin
capitalization policies for these firms.
On his research about the role of financial development in causing differences in
thin capitalization rules between countries, Mardan (2016) found that a host country has
two stages in designing thin capitalization rule. First, the country decides the type of
thin capitalization rule, and on the next stage, decides about the tightness of the rule.
The result of his analysis shows that, as the financial development of a country increases,
tax deductibility for internal interest payments become tighter, on average. On the other
words, countries which are financially less-developed implement more generous thin
capitalization rules. Mardan (2016) stated that one reason could be due to the limited
access to external financing sources causing firms to use internal sources to finance
investment.
2.4 The Indonesian Background
2.4.1 Indonesian corporate tax system
Similar to other developing countries, one of the major tax revenue sources in
Indonesia is the corporate income tax which comprise of ±53.33% of the total tax
revenue (Ministry of Finance, 2017). Indonesian corporate income tax is ruled by Law
No. 7 of 1983 regarding Income Tax as amended by Law No. 36 of 2008. Indonesian
applicable standard corporate income tax rate is 25% for the fiscal year 2010 onward.
The basis of corporate taxation in Indonesia is resident companies which are taxed on
14
worldwide income, while nonresident companies are taxed only on income derived
from operations in Indonesia, including income generated from the permanent
establishment in the country. Taxable income is defined as computable income less tax-
deductible items. Dividends which are received by a resident company are considered
as ordinary income. Interest incurred in the ordinary course of business is tax-
deductible as long as the related loan is used for business purposes. To limit interest
deduction from debt financing activity, Indonesian fiscal authorities issued thin
capitalization rule.
2.4.2 Indonesian Thin Capitalization Rule
Historically, Indonesian thin capitalization rule originally issued by Ministry of
Finance (MOF) on October 1984 under ministerial decree number 1002/KMK.04/1984,
which stipulated a debt-to-equity ratio (DER) of 3:1 as a limit of interest expense
deduction for income tax calculation purposes. However, within 6 months, on March
1985 the MOF issued another decree number 254/KMK.04/1985 which postponed the
implementation of the previous thin capitalization rule with a consideration that the
regulation could harm investment growth in Indonesia.
After 30 years of postponement, finally, Indonesian MOF reintroduced the new
thin capitalization rule on 9 September 2015 through Minister of Finance Regulation
Number 169/PMK.010/2015 titled “Determination of Company’s Debt and Equity
Ratio for Income Tax Calculation Purpose,” which provides detailed guidance on the
scope of related parties, definitions of debt and equity, a prescribed threshold for the
debt-to-equity ratio (DER), and other compliance requirements. This regulation is
effective from the fiscal year 2016.
PMK-169 sets the amount of borrowing costs that are tax-deductible to not exceed
the maximum debt-to-equity ratio (DER) of 4:1 (except for certain sectors). Therefore,
if firm’s DER exceeds the 4:1 threshold, any borrowing costs on debt that exceed the
ratio will be non-deductible for income tax calculation. This rule applies to both related
and third-party debt, whether obtained domestically or from foreign sources. Debts are
including both short term and long term debt, as well as interest-bearing trade payables.
While equity includes shareholder’s equity, share premiums, retained earnings, and
non-interest bearing loans from related parties. Furthermore, the regulation emphasizes

15
that the entire borrowing costs will be prohibited to be deducted from income tax
calculation if the taxpayers have zero or negative equity balance.
The maximum threshold of DER 4:1 under PMK-169 is applicable to all
taxpayers established or domiciled in Indonesia, except for certain entities that are
subject to special rules, which are:
1. Banks
2. Financing institutions
3. Insurance and reinsurance companies
4. Mining, oil, and gas enterprises that are subject to production-sharing agreements
and contracts of work, or coal contracts of work, that specifically include a
provision on the debt-to-equity ratio;
5. Companies subject to final income tax
6. Infrastructure companies.
The intention of Indonesian tax authorities with respect to the issuance of PMK-
169 is to tackle tax avoidance by limiting the tax base erosion from the using of interest
tax shield by excessive debt-financing activities. The government expects that by
issuing this new thin capitalization rule, Indonesian tax authorities potentially will be
able to collect more tax from companies whose debt-to-equity ratios exceed the
prescribed limit, thus increasing government tax revenue.
16
3. Prior Research into Thin Capitalization, Financing Decision, and Tax
Avoidance
This chapter will provide literature review associated with the relation between thin
capitalization, firm’s financing decision, and corporate tax avoidance. First, this thesis
will discuss some findings in previous research regarding the utilization of thin
capitalization as means of corporate tax avoidance strategy in developed countries as
well as developing countries. Secondly, this thesis will continue with some findings in
the existing literature related to the effectivity of thin capitalization rules to control the
use of debt financing.
3.1 Thin Capitalization Strategy and Corporate Tax Avoidance Studies
3.1.1 Thin Capitalization Studies in Developed Countries
Prior research by Slemrod (2001) and Rego (2003) find that US firms with higher
level of leverage have lower Effective Tax Rate (ETR) due to the use of interest
deductions to reduce taxable income. This is in line with the findings of Beuselinck et
al., (2005), Graham and Tucker (2006), and Dyreng et al., (2008), which found that US
firms that are successful on long-term tax-avoidance have significantly higher debt
instead of equity in their capital structure composition. Shackelford & Shelvin (2001)
also found that the excessive use of debt financing in the form of thin capitalization by
subsidiary firms which located in higher tax rate jurisdiction create an important
international corporate tax avoidance technique which performed by multinational
firms.
Taylor & Richardson (2012) investigates the international corporate tax
avoidance practices of 203 publicly listed Australian firms over the period 2006-2009.
Their research found that the utilization of thin capitalization and transfer pricing are
the main drivers of tax avoidance, and thus may be considered as the most important
tax-planning tools for firms to carry out international tax avoidance, while income
shifting and tax haven utilization are less important.
17
3.1.2 Thin Capitalization Studies in Developing Countries
A study by Ogundajo & Onakoya (2016) who investigates the influence of
corporate tax planning on financial performance of manufacturing firms listed in
Nigerian Stock Exchange from the period 2005-2014 found that aggressive tax planning
strategies such as thin capitalization, tax law incentives and other tax planning strategies
which taking benefit of loopholes in the tax regulations have not been fully utilized by
Nigerian firms. Results show that most of the Nigerian firms are mainly financed by
equity, thus they do not use excessive debt financing in order to have tax shield benefits
from the deductibility of interest. They found that majority of Nigerian firms still have
not enough understanding regarding thin capitalization as a tax-minimization strategy
and do not employ the service of tax consultants in order to help them utilizing tax
benefit from loopholes of the tax law.
Rohaya et. al (2010) examines the corporate tax planning of Malaysian listed
companies during official assessment system and self-assessment system around period
1993-2006. The results found that lower Effective Tax Rates (ETRs) are significantly
related to highly leveraged companies, greater investment in fixed assets and lower
investment in inventory. ETR was negatively associated with leverage during both tax
systems. The result of this study suggested that highly leveraged companies can take
advantage from the deductibility of interest expenses to reduce their taxable income.
3.2 Thin Capitalization Rule Effectivity Studies
Almendros & Mira (2016) examine the impact of the Spanish new thin
capitalization rule in 2012 on financing decision of Spanish listed firms. They identified
companies that in theory would have been affected by the new rule and compare their
financing behavior to a group of companies that were not affected. Using difference and
difference approach, they found that there are differences between debt policy of
potentially affected firms and their non-affected counterparts, with a negative and
statistically significant treatment effect. Their empirical evidence supported the
existence of a tax reform effect, where companies affected by the rule reduce their
leverage more than companies that are not affected. There appears to be a clear effect
on the debt policy of Spanish listed companies due to the application of the new thin
capitalization rule in 2012.
18
Buettner et. al (2006) investigates the role of thin capitalization rule on
multinationals’ capital structure and investment decision by analyzing German
multinationals in 24 countries between period 1996-2004. They found that thin
capitalization rules are effective in limiting debt-financing. Overesch and Wamser
(2010) also investigate the effectiveness of thin capitalization rule on tax-planning
behavior based on German investment data. They confirm a significant impact of tax-
rate differentials on the use of intercompany debt. The result suggested that thin
capitalization rule (TCR) significantly reduced internal borrowing, hence it can be
concluded that tax-planning behaviour via internal finance is effectively limited by
TCR.
Blouin et. al (2013) examine the impact of thin capitalization rules on the capital
structure of foreign affiliates of US multinationals between 1982-2004. They find that
thin capitalization rules affect multinational firm’s capital structure significantly.
Furthermore, they find that the implementation of thin capitalization rule creates
aggregate firm effects: on one side it can reduce the firm’s aggregate interest expense,
but on the other side it might lower firm valuation. They conclude that implementation
of thin capitalization rule not only influence the capital structure within multinational
firms, but it also has impact on the firm’s market valuation.
Although most prior studies found that thin capitalization rules can minimize tax
avoidance by reducing excessive debt financing, some studies also provide evidence that
thin capitalization rules are not always effective in curbing tax avoidance. Babberich
(2009) studied whether the introduction of Dutch thin capitalization rule in 2004 would
have an impact on multinational firms’ capital structure and investment decisions. He
found that firms did react with a significant reduction of internal debt ratio. However,
firms reduced their internal debt ratios by increasing their equity levels and not by
reducing their excessive internal debt levels. Hence, it can be concluded that the Dutch
thin capitalization rule did reduce internal debt ratios, but was not effective in curbing
tax planning via intra-firm financing.
19
4. Hypotheses Development
From the capital structure theory explained in the previous chapter, it can be seen that
taxation has an effect on firm’s capital structure. The higher proportion of debt in capital
structure, the more tax benefit a firm can achieve. From tax authority’s perspective, this
excessive debt financing may harm potential government tax revenue since firms might use
this strategy to avoid tax. Therefore, the government issue thin capitalization rule in order
to minimize this tax planning strategy.
Proper implementation of thin capitalization rule should limit the ability of firms to
engage in corporate tax avoidance. Indonesia originally issued its first thin capitalization
rule in 1984. However, as the implementation of the regulation is deferred it can be assumed
that firms do not aware or even do not know that there is a restriction regarding maximum
debt allowed related to interest deductibility of taxable income before, until the new thin
capitalization rule has reintroduced in 2015.
Therefore, in order to see the impact of the new thin capitalization rule on Indonesian
corporate tax avoidance, I will see the implications from two steps of analysis. First, I will
test the effect of thin capitalization rule on firms financing decision after the implementation
of the new rule. Second, I will see how effective the new thin capitalization rule in
minimizing tax avoidance. Furthermore, in order to see the behaviour of Indonesian firms
in taking advantage of loopholes in the tax regulation, I will divide the sample firms which
might potentially be affected by the new thin capitalization rule into two parts: firms with
Low Debt-to-Equity Ratio (far below the maximum allowed ratio), and firms with High
Debt-to-Equity Ratio (far above the maximum allowed ratio).
4.1 Thin Capitalization Rule and Firm’s Financing Decision
Lowering the thin capitalization rule might give more flexibilities to the companies
to choose debt financing to minimize their tax liability. Even so, since the previous rule
implementation is deferred since 30 years ago, it can be assumed that firms mostly do not
know that this rule actually exists until the new one came up. Thus, it can be expected that
the new thin capitalization rule implemented in Indonesia will decrease the propensity of
companies engage in tax avoidance through thin capitalization strategy. Therefore, in this
thesis, I expect that firms with Debt-to-Equity Ratio (DER) above the limit will reduce its
debt level in order to comply with the new thin capitalization rule. In addition, considering
20
the nature of the firms mostly is to pay tax as lower as possible, I also expect that firms
with DER far below the limit provided by the new rule will take advantage of the legal
loopholes by increasing DER up to the maximum allowed. Thus, these firms can enjoy the
tax benefit while still in comply with the law.
The logic behind the assumption that Low DER companies will increase their debt
level after the implementation of the rule is because previously they have a lower debt
level or choose equity financing more than debt financing, which is found to be more
common in developing countries (Ogundajo & Onakoya, 2016; Singh & Hamid, 1992;
Singh, 1995; Mardan, 2016). The reason could be because they find that equity financing
is more beneficial for them; due to the limited access to external financing; or because they
still have not enough understanding regarding the benefit of debt financing in tax-
minimization strategy. Therefore, the issuance of the new thin capitalization rule might
also become an alarm for these firms who do not realized yet that they can use interest tax
shield to avoid tax. Moreover, this can be a trigger for these Low DER firms who have not
utilized thin capitalization strategy to increase debt level to take advantage of the legal
loopholes. Based on the trade-off theory of leverage, these Low DER firms will increase
debt as long as it is still safe within the maximum level and as long as the marginal cost
from debt financing do not exceed the marginal tax benefit arising from it. Therefore, I
propose the following hypothesis:
H1a: After the new thin capitalization rule implemented, firms with high DER will
decrease their debt level to reach the maximum DER allowed by the rule.
H1b: After the new thin capitalization rule implemented, firms with low DER will
increase their debt level to reach the maximum DER allowed by the rule.
4.2 Thin Capitalization Rule and Corporate Tax Avoidance
The higher the level of debt, the higher interest the firm have to pay, thus the lower
the taxable income and the lower the tax liability. A firm with DER exceeded the thin
capitalization rule can be categorized as a thinly capitalized company. I expect that
company which thinly capitalized have the propensity to engage more in corporate tax
avoidance. The proper implementation of thin capitalization rule is expected to have an
impact in reducing corporate tax avoidance related to the utilization of interest tax shield
associated with debt financing as tax planning strategy. Consequently, I expect that the
new thin capitalization rule implemented in Indonesia will have an influence on corporate
tax avoidance level in the country. Since firms with low debt to equity ratio might increase

21
its debt up until reaching the maximum limit allowed, it can be expected that those firms
will use interest tax shield associated with debt financing to minimize its tax liability as
long as it is still safe within the law. In contrast, as the new thin capitalization rule
implemented, high debt to equity ratio firms are expected to lower their debt position in
order to comply with the law. Therefore, I expect that high debt to equity ratio firms will
have an increasing tax burden since their flexibility in using interest tax shield is now
limited. Thus, I propose the following hypothesis regarding the implementation of the new
thin capitalization rule:
H2a: After the new thin capitalization rule implemented, firms with High DER will have
a decrease in corporate tax avoidance level (higher ETR)
H2b: After the new thin capitalization rule implemented, firms with Low DER will have
an increase in corporate tax avoidance level (lower ETR)

22
5. Research Design
5.1 Dependent Variables
5.1.1 Financing Decisions
To measure how the implementation of new thin capitalization rule affect firm’s
financial decision on using debt financing in the capital structure, this thesis will use proxy
firm’s debt level as measured with total leverage ratio, following Blouin et al (2013). Total
leverage is measured as total debt divided by total assets. As explained in Indonesian thin
capitalization rule PMK-169, interest deductibility is limited by a certain debt-to-equity
ratio level, where debt is defined as total debt including short-term debt, long-term debt,
as well as interest-bearing trade payables. If a firm has debt-to-equity ratio above the
maximum limit allowed, thus the borrowing costs related to the excess debt will not be
tax-deductible. Thus, it is assumed that after the new rule implemented there will be
changes in firms’ debt level that reflected in leverage ratio which indicates companies
financing decision regarding the use of debt financing strategy in order to comply with the
law.
5.1.2 Corporate Tax Avoidance
Measuring corporate tax avoidance in accounting research has always been
problematic since data from company tax return is not directly observable due to its
confidential characteristics (Hanlon and Heitzman, 2010). Thus, most accounting research
usually utilize proxy measures obtained from data which are available in the financial
statements. The most widely used proxy for measuring corporate tax avoidance is effective
tax rates (ETR). ETR is measured as income tax expense divided by pre-tax accounting
income (GAAP earnings). ETR measures the ability of a corporation to reduce its tax
liability relative to its pre-tax accounting income. Therefore, ETR may reflect the relative
tax burden across firms.
There are some consistent findings across ETR studies related to the associations
between ETR and some certain firm characteristics. Stickney and McGee (1982) analyze
the possible causes of corporate tax burden differences and found that capital intensity,
leverage, and natural resource activities create variation in ETRs across firms. Gupta and

23
Newberry (1997) examine other determinants of variation in ETRs using panel data and
conclude that ETRs are systematically related to a firm’s capital structure, asset mix, and
return on assets. Mills, Erickson, and Maydew (1998) also find a negative relation between
ETR and leverage as well as between ETR and capital intensity.
GAAP ETR uses total income tax expenses which include both current and deferred
tax expenses. To control for deferred tax expenses, GAAP ETR can be converted into
Current ETR by including current tax expense only in the numerator (Hanlon and Shevlin,
2002; Chen et al, 2012; Cheng et al. 2012). Current ETR measured as current tax expense
divided by pre-tax accounting income. Current ETR are based on company’s current
income tax obligation which are adjusted for the effect of income tax transfer between
different periods, for example deferred tax expense. To measure how the change in debt
level following the implementation of new thin capitalization rule might affect company’s
tax liability in current period, it can be reflected in company’s current tax expense.
However, due to limited data availability in Compustat regarding current tax expense from
Indonesian sample companies, this thesis will use the GAAP ETR since it is more publicly
available and most often used in prior research.
5.2 Independent Variable
5.2.1 Thin Capitalization Rule Implementation
To measure whether financing decision and tax avoidance level is affected by the
implementation of thin capitalization rule, the effect has to be operationalized. The effect
of thin capitalization rule will be measured with a dummy variable, which equals 1 for
firms that are more likely to be affected by the rule, and 0 for firms that are less likely to
be affected by the rule. To measure whether the firms are considered affected or not, this
thesis uses DER limit provided by PMK-169, which is 4:1. More detail on the grouping of
this sample firms will be explained in the research model section.
5.3 Control Variables
5.3.1 Control Variables for Financing Decisions
This research includes some control variables in the first regression to control for
other factors that are likely to influence the measurement of dependent variable financing
decision. The first control variable that will be used for testing the first hypothesis is
probability of bankruptcy (RISK), following Almendros & Mira (2016), Mackie-Mason
24
(1990) and Graham (1996). The trade-off theory of capital structure assumed that debt
financing decision, besides affected by tax, also influenced by bankruptcy cost.
Therefore, if the probability of bankruptcy is high, then the expected bankruptcy cost is
also higher, which induced firms to lower debt ratio. Probability of bankruptcy (RISK)
in this thesis is measured using Altman Z-Score as total assets divided by the sum of 3.3
times EBIT, 1.0 times sales, 1.4 times retained earnings and 1.2 times working capital.
The second control variable is Tangibility (TANG). The trade-off theory assumed
that debt financing decision might also influenced by agency cost of debt. Tangible assets
are important to businesses since they can reflect the company’s worth. Asides from
being used to provide product and services to meet its objective and goals, firms can also
use tangible assets as a collateral for loans. Thus, if higher tangibility ratio implies a
lower probability of bankruptcy, then it may lead to higher debt ratios. Tangible assets
are any assets that can be identified and have physical form including current assets, such
as inventory; and fixed assets, such as machinery, property, plant, and equipment.
Tangibility is calculated as percentage of tangible assets over total assets (Almendros &
Mira, 2016).
The third control variable is Size (SIZE). This thesis uses firm size to control for
the effect of company size on debt financing decision. It is assumed that bankruptcy
probability of larger firms is lower due to their widely diversified business and
sophisticated accounting system. Therefore, it is expected that larger firms will have
higher debt ratios. Size is measured as natural logarithm of total assets. This is in line
with Almendros & Mira (2016).
The fourth control variable is Profitability (PROF). Profitability controls for the
effect of company’s operating performance. Since profitable companies generate more
cash than less profitable firms for a given leverage level, they have a lower probability
of default and a lower expected bankruptcy costs. Therefore, following Almendros &
Mira (2016) it is expected that more profitable companies will have more flexibility to
use debt financing. Profitability measured as ROA which is pre-tax profit divided by total
assets.
The last control variable is Multinational Operations (multi). Multinational is a
dummy variable which equals to 1 if the company have at least one foreign incorporated
subsidiaries, otherwise is zero. It is expected that multinational companies have more
flexibility to use thin capitalization strategy by taking advantage from tax differentials
25
between two tax jurisdictions through intercompany loan (Webber, 2010). Therefore,
multinationals are expected to have more probability to use debt financing.
5.3.2 Control Variables for Corporate Tax Avoidance
Next, to control for other factors that might influence dependent variable corporate
tax avoidance, this thesis will also include some following control variables in the
analysis. The first control variable which may relate to tax avoidance is Capital Intensity
(CINT). Capital Intensity controls for high capital intensive firms (Stickney & McGee,
1982; Taylor & Richardson, 2012). According to Taylor & Richardson (2012), CINT is
negatively associated with ETRs due to accelerated depreciation charges based on asset
lives. This is to control for non-debt tax shield that can be provided by depreciation
expense. CINT is measured as net property, plant, and equipment divided by lagged total
asset.
The second control variable is Inventory Intensity (INVINT). Inventory Intensity
is included as control variables for high inventory intensive firms (Stickney & McGee,
1982; Taylor & Richardson, 2012). Inventory intensive firms are considered to be less
tax avoidant, so INVINT is expected to be positively associated with ETRs. INVINT is
measured as inventory divided by lagged total assets. Rohaya et al. (2010) also found
that ETR was positively associated with inventory intensity, which indicated that
inventory-intensive company faced higher ETR. The reason is that inventory-intensive
companies did not have tax shields like capital-intensive companies that could enjoy tax
benefit from depreciation charges.
The third control variable is company size (SIZE). This second test will also use
firm size to control for the effect of company size in measuring corporate tax avoidance
level. Since it is expected that larger firms will have higher debt ratios, thus it may also
lead to flexibility in avoiding tax using interest tax shield. Size is measured as natural
logarithm of total assets. This was in line with Taylor & Richardson (2012).
The fourth control variable is company profitability (PROF). Profitability also used
again in this second test to control for companies operating performance. Profitability
will be measured using ROA, which calculated as pre-tax income divided by total assets.
There are mixed findings regarding the relation between profitability and ETRs. Rego
(2013) find that companies with greater pre-tax income have lower ETRs, while Taylor
& Richardson (2012) find positive relation between ROA and ETRs.

26
Finally, the last control variable which may affect corporate tax avoidance level is
multinational operations (multi). Multinational is a dummy variable, which equals to 1 if
the company have at least one foreign incorporated subsidiaries, otherwise is zero. It is
expected that multinational companies are negatively associated with ETRs., since
multinationals has the opportunity to use the advantage from tax differentials between
two different tax jurisdictions. This is in line with prior research by Taylor et al. (2015);
Taylor and Richardson (2012); Rego (2003); and Mills and Newberry (2004).
5.4 Difference in Difference Approach
This thesis will use difference in difference approach to look for the effect of
exogenous changes in the tax policy, and to analyse how companies react to those changes.
Difference in difference approach is typically used to estimate the effect of a specific
treatment or policy by comparing the changes in outcomes overtime between a population
that is affected by the policy (the treatment group) and a population that is not (the control
group).
The treatment group is designed by identifying those companies that are likely to be
affected by the new thin-capitalization rule, which is the group of companies with DER
far above and far below the maximum allowed DER according to the rule. It is assumed
that companies with DER far below the limit will take advantage of the legal loopholes by
increasing their DER up until reaching the safe haven point. In contrast, companies with
DER far above the limit are assumed to decrease their DER down until being within the
safe haven point, in order to comply with the law.
For the control group, this thesis will include the companies that are less likely to be
affected by the new rule, which is the group of companies with DER around the limit 4:1.
Since the company’s DER is already around the maximum limit, thus it can be assumed
that the implementation of the new rule will not encourage them to change their debt
position. Therefore, the classification relates to the following:
- First Treatment Group (TREATED1) consists of firms with DER between 0 – 3.7:1
- Second Treatment Group (TREATED2) consists of firms with DER above 4.3:1
- A company is assigned to Control Group if its DER is between 3.7:1 – 4.3:1

27
5.4.1 Regression Formula
To test for the effect of thin capitalization rule on debt financing decision as reflected
in hypothesis 1a and 1b this research uses this regression model below:
!"#$%& = (%&+*+,-.$%& + */$0"1$"!1%& + *3$0"1$"!2%&
+ *5,-.$$0"1$"!1%& + *6,-.$$0"1$"!2%& +*809.:%&
+ *;$1<=%& + *>.9?"%& +*@,0-A%& + *+BCDEFG%& + H%&
The coefficient of interest of hypothesis 1a and 1b are *5and *6, which describes the
change of company debt level in treatment groups after the implementation of the thin
capitalization rule.
To test for the effect to tax avoidance level after implementation of the new rule in
hypothesis 2a and 2b, this research follows this regression model:
=11,"$0%& = (%&+*+,-.$%& + */$0"1$"!1%& + *3$0"1$"!2%&
+ *5,-.$$0"1$"!1%& + *6,-.$$0"1$"!2%& + *8I9<$%&
+ *;9<J9<$%& + *>.9?"%& +*@,0-A%& + *+BCDEFG%& + H%&
where the coefficient of interest for hypothesis 2a and 2b are *5and *6,which reflect the
effect of the thin capitalization rule on treatment groups tax avoidance level after the
implementation. The list of variable descriptions will be explained in Appendix A of this
thesis.
5.5 Sample Selection and Data Source
The sample of this thesis comprised of Indonesian firms that are publicly listed in
Indonesian Stock Exchange over the 2013 – 2016 period. Publicly listed companies are
chosen due to the availability of data which are needed to calculate dependent and
explanatory variables. The sample period selected in this thesis is 1 year after
implementation and 3 years prior to the implementation. Since the new thin capitalization
rule is applied starting from the year 2016, therefore the availability of post-
implementation-rule data is limited to until 2016 fiscal year report. Moreover, to obtain
the trend of debt and tax level of the firms before the new rule applied, this thesis chose
sample period 3 years before implementation. All variables are obtained from the financial
statement data available in Compustat Global through WRDS, except for multinationality
variables. Data related multinationality is hand collected from company’s annual report

28
which available in Indonesian Stock Exchange website. There are some criteria applied in
selecting sample firms:
(1) Consecutive financial data should be available for the 2013-2016 period;
(2) Firms must active and have a continuous listing on Indonesian Stock Exchange over
the 2013-2016 period.
(3) Following the thin capitalization rule exemptions from PMK-169/2015, firms related
with these industries are excluded from the sample selection: banks; financial service
institutions; insurance and reinsurance companies; infrastructure industries; oil, gas,
and mining industries.
(4) Observations with duplicates and missing data are dropped from the sample
Using Compustat Global, financial data required from all the active companies
located in Indonesia are downloaded from the period 2012-2016. An overview of this
sample selection process can be found in Table 1. Financial year 2012 is included since it
is needed to account for lagged total assets in 2013. Next, firms that are classified in
industry exemption based on Indonesian thin capitalization rule (PMK-169) are excluded
from the sample selection. This thesis used 6 digit GIC code to identify firm’s industry
classification. From the amount of 2606 initial firm-year observations downloaded, after
excluding firms from industry exemptions, firms with duplicates data, firms with missing
data, and firm data from the year 2012, a total 1204 firm-year observations can be
achieved. Next, the classification of treatment and control group needed for the difference-
in-difference test are based on company debt to equity ratio. From the 1204 observations,
45 are classified as having a High DER (TREATMENT GROUP1), and 1148 are classified
as having a Low DER (TREATMENT GROUP2).

29
Table 1 Sample Selection Process
Initial Number of obtained firms (2012-2016) 2606 Industry exemption based on PMK 169 Energy Companies 35 Oil & Gas Companies 185 Mining Companies 85 Banks 215 Finance Companies 80 Securities Companies 80 Insurance Companies 79 Real Estate Companies 200
Transportation & Infrastructure Companies 35
Utility Companies 5
Total firm-year from excluded industries 999
Duplicates Data 3 Firm data from year 2012 (used only to count for lag total assets) 367 Firms with missing data 33 Final Samples of Observation 1204 Control Group 11 Treatment Group 1 45 Treatment Group 2 1148
30
6. Empirical Results & Analysis
6.1 Descriptive Statistics
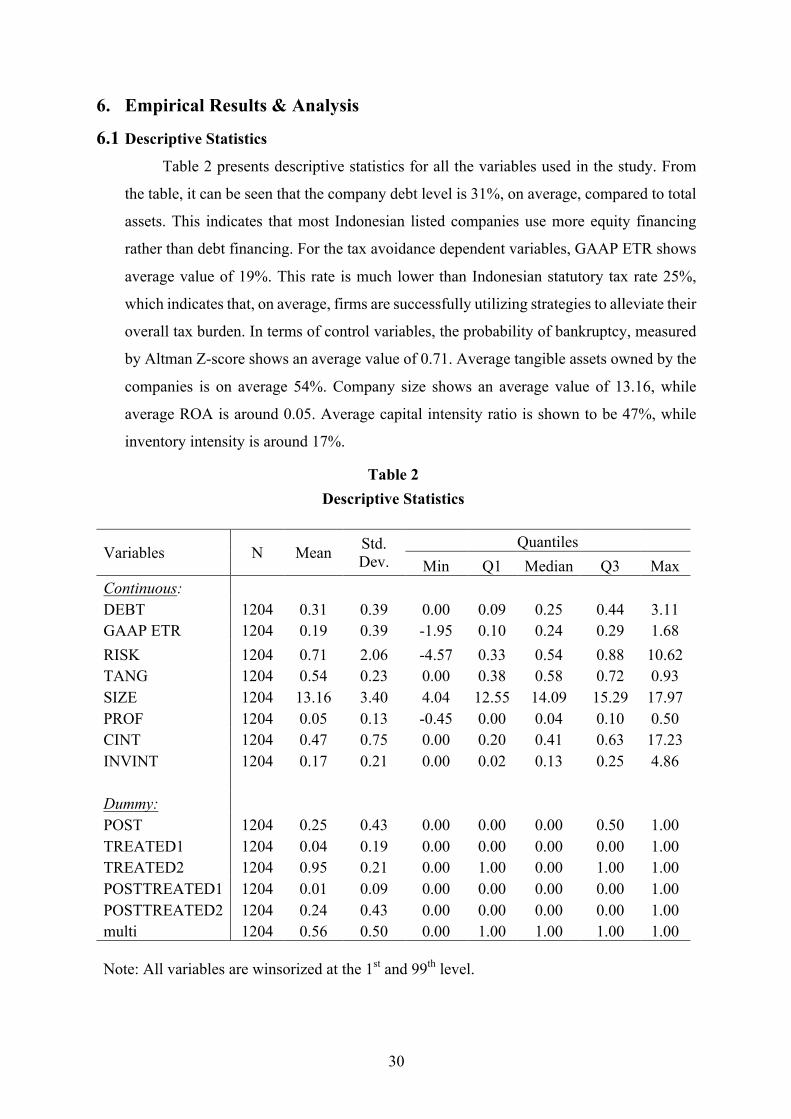
Table 2 presents descriptive statistics for all the variables used in the study. From
the table, it can be seen that the company debt level is 31%, on average, compared to total
assets. This indicates that most Indonesian listed companies use more equity financing
rather than debt financing. For the tax avoidance dependent variables, GAAP ETR shows
average value of 19%. This rate is much lower than Indonesian statutory tax rate 25%,
which indicates that, on average, firms are successfully utilizing strategies to alleviate their
overall tax burden. In terms of control variables, the probability of bankruptcy, measured
by Altman Z-score shows an average value of 0.71. Average tangible assets owned by the
companies is on average 54%. Company size shows an average value of 13.16, while
average ROA is around 0.05. Average capital intensity ratio is shown to be 47%, while
inventory intensity is around 17%.
Table 2 Descriptive Statistics
Variables N Mean Std. Dev.
Quantiles Min Q1 Median Q3 Max
Continuous: DEBT 1204 0.31 0.39 0.00 0.09 0.25 0.44 3.11 GAAP ETR 1204 0.19 0.39 -1.95 0.10 0.24 0.29 1.68 RISK 1204 0.71 2.06 -4.57 0.33 0.54 0.88 10.62 TANG 1204 0.54 0.23 0.00 0.38 0.58 0.72 0.93 SIZE 1204 13.16 3.40 4.04 12.55 14.09 15.29 17.97 PROF 1204 0.05 0.13 -0.45 0.00 0.04 0.10 0.50 CINT 1204 0.47 0.75 0.00 0.20 0.41 0.63 17.23 INVINT 1204 0.17 0.21 0.00 0.02 0.13 0.25 4.86 Dummy: POST 1204 0.25 0.43 0.00 0.00 0.00 0.50 1.00 TREATED1 1204 0.04 0.19 0.00 0.00 0.00 0.00 1.00 TREATED2 1204 0.95 0.21 0.00 1.00 0.00 1.00 1.00 POSTTREATED1 1204 0.01 0.09 0.00 0.00 0.00 0.00 1.00 POSTTREATED2 1204 0.24 0.43 0.00 0.00 0.00 0.00 1.00 multi 1204 0.56 0.50 0.00 1.00 1.00 1.00 1.00 Note: All variables are winsorized at the 1st and 99th level.
31
Table 3 Panel A shows the Pearson correlations between dependent variable DEBT,
and all the explanatory variables related. The correlation reflects a linear relation between
the variables. Variable TREATED1 is positive and significantly correlated with DEBT
level, as well as TREATED2 which is negative and significantly correlated with DEBT
level. Those indicate that before implementation of the rule, high DER firms
(TREATED1) has a positive relation with DEBT, while low DER firms (TREATED2) has
a negative relation with DEBT. Variable POSTTREATED1 is also positive and
significantly related to DEBT. This contradicts the expectation in hypothesis 1. Hypothesis
1 expects that POSTTREATED1 has a negative relation with DEBT, since it is assumed
that high DER companies will reduce its debt level after the implementation of the rule.
Variable TANG shows a positive and significant correlation with DEBT, while SIZE and
profitability shows a negative and significant correlation with DEBT.
Table 3 Panel B illustrates the correlation between GAAPETR and all the
explanatory variables. Of all the explanatory variables, only POSTTREATED2 and PROF
that demonstrates a significant amount. POSTTREATED2 is negative and significantly
related to GAAPETR. This supports hypothesis 2b which suggests that low DER firms
will have a lower effective tax rate after the implementation of the rule. Among the control
variables, PROF has a positively significant correlation with GAAPETR. This support the
assumptions that more profitable firms pay higher tax since the pretax income is also
higher.

32
Table 3 Pearson Correlation Matrix
Panel A Correlation Matrix for Hypothesis 1
Variables DEBT POST TREATED1 TREATED2 POST
TREATED1 POST
TREATED2 RISK TANG SIZE PROF multi DEBT 1.0000 POST 0.0051 1.0000 TREATED1 0.1746* -0.0126 1.0000 TREATED2 -0.1933* 0.0000 -0.8922* 1.0000 POST TREATED1 0.0758* 0.1585* 0.4644* -0.4144* 1.0000 POST TREATED2 -0.0178 0.9690* -0.1102* 0.1236* -0.0512 1.0000 RISK -0.0492 0.0424 -0.0242 0.0349 -0.0360 0.0507 1.0000 TANG 0.1036* 0.0071 -0.0014 0.0326 -0.0001 0.0103 0.0472 1.0000
SIZE -0.1161* 0.0192 -0.0900* 0.0591* -0.0203 0.0216 0.1164* -
0.1469* 1.0000
PROF -0.3327* -0.0552 -0.1287* 0.1201* -0.0766* -0.0407 -0.0137 -
0.0940* 0.1567* 1.0000
multi 0.0366 -0.0029 -0.0033 0.0126 0.0067 -0.0073 -
0.0866* 0.0668* -0.0195 0.0723* 1.0000 *Significant at 5%, two-tailed.

33
Table 3 (continued.) Pearson Correlation Matrix
Panel B Correlation Matrix for Hypothesis 2
GAAP
ETR POST TREATED1 TREATED2
POST TREATED
1
POST TREATED
2 CINT INVINT SIZE PROF multi GAAPETR 1.0000 POST -0.0629 1.0000 TREATED1 -0.0553 -0.0126 1.0000 TREATED2 0.0465 0.0000 -0.8922* 1.0000 POST TREATED1 -0.0201 0.1585* 0.4644* -0.4144* 1.0000 POST TREATED2 -0.0631* 0.9690* -0.1102* 0.1236* -0.0512 1.0000 CINT 0.0048 0.0132 -0.0015 0.0134 -0.0007 0.0164 1.0000 INVINT 0.0563 -0.0537 0.0046 -0.0036 -0.0351 -0.0500 0.0177 1.0000 SIZE 0.0459 0.0192 -0.0900* 0.0591* -0.0203 0.0216 0.0002 0.0076 1.0000 PROF 0.1319* -0.0552 -0.1287* 0.1201* -0.0766* -0.0407 -0.0428 0.1145* 0.1567* 1.0000 multi -0.0255 -0.0029 -0.0033 0.0126 0.0067 -0.0073 -0.0795* 0.0734* -0.0195 0.0723* 1.0000 *Significant at 5%, two-tailed.

34
6.2 Regression Result
6.2.1 The effect of implementation of thin capitalization rule on Financing Decision
Table 4 shows the result of the regression for the first hypothesis. The first column
measures the effect of implementation of thin capitalization rule on company financing
decision which measured by debt level after being applied for all sample firms regardless
the classification of control and treatment groups. Variable POST captures the difference
between pre and post thin capitalization rule implementation for all sample firms. The
positive coefficient in variable POST shows that on average, overall company debt level
is increased the year after the implementation of the rule. However, since the result is
insignificant thus it cannot be concluded that the overall change in debt level is due to the
effect of implementation of the rule.
The second column reflects the effect of thin capitalization rule implementation after
distinguishing the sample firms by high DER firms (TREATED1), low DER firms
(TREATED2), and the control group. The treatment variables (TREATED1 and
TREATED2) describe the mean difference between the treatment groups and the control
group before the rule applied. The first treatment variable (TREATED1) shows a positive
relation with DEBT. This means that, on average, high DER firms have debt level 4.6%
higher than the control group before the new rule applied. However, the result is
insignificant. The second treatment group (TREATED2) shows a negatively significant
relation with DEBT. This reflects that low DER firms have 33.2% lower debt level
compared to the control group before the new rule implemented. Next, the variable
POSTTREATED1 and POSTTREATED2 captures the effect of implementation of the
thin capitalization rule after being applied on firms with high DER and low DER compared
to the control group, respectively. From Table 4, it can be seen that after the
implementation of the rule firms with high DER will decrease their debt level around
15.1% compared to the control group. Moreover, firms with low DER will also lower their
debt level around 9.4% after the new rule implemented, compared to the control group.
The result is significant for both variable POSTTREATED1 and POSTTREATED2. This
suggests that the implementation of the rule affects both high DER and low DER
companies to lower their debt level.
In order to provide a more accurate result, the third regression added control
variables which might also affect the dependent variable DEBT. In the third regression,
35
the TREATED2 group still shows a negatively significant amount of 33.4% which is
slightly lower than in the second regression. This means that on average, after controlling
for other factors, the low DER firms has 33.4% debt level lower than the control group in
the preceding years before the new rule implemented. POSTTREATED1 shows a
negatively significant relation with DEBT with the coefficient -0.181. This means that
compared to the control group, high DER companies will reduce their debt level around
18.1% after the implementation of the rule. On the other hand, even though
POSTTREATED2 shows the same negative coefficient as the second regression, but the
result is become insignificant. This suggests that the decrease of debt level in low DER
companies after the rule applied is due to another cause other than the effect of the
implementation of thin capitalization rule. Therefore, hypothesis 1a can be accepted since
high DER companies will have a decreasing debt level after the implementation period,
while hypothesis 1b can be rejected since low DER companies shows no increase in debt
level after the implementation period.
The first control variable RISK shows a significantly negative amount of -0.007. It
means that probability of bankruptcy has a negative relation with company debt level. The
higher the probability of bankruptcy, the lower the company debt level. As the risk of
bankruptcy increase, the solvency risk is also increase. Solvency risk is the risk when a
company is not capable to pay its maturing debt. Thus when the risk of bankruptcy is high,
company will decrease its debt level. Moreover, creditor will also refuse to provide debt
to the company with high bankruptcy risk in order to avoid loss. Related to the trade-off
theory of leverage explained in section 2, this result also gives insight that companies will
choose debt financing method up until marginal tax benefit from debt financing equals to
marginal bankruptcy cost. If adding more debt means adding solvency risk to the
companies, then lowering debt level will be more beneficial for companies with high
bankruptcy risk. This result is in line with the prior research that cost of bankruptcy has
negative relation with debt financing decision (Almendros and Mira, 2016; Mackie-
Mason, 1990; Graham, 1996).
The second control variable, tangibility (TANG), measures the agency cost of debt
which influence company decision to use debt financing. It is expected that the more
tangible assets owned by the company, the higher the debt level. A higher ratio of tangible
assets besides reflecting a company’s business worth and a lower probability of
bankruptcy, tangible assets can also be used as a collateral for loan. Table 4 shows a
positively significant amount of tangibility with coefficient of 0.107. It means that as the
36
amount of tangible assets increases, the company debt level increase by 10.7%. This is
also in line with prior research by Almendros & Mira (2016) which suggest that tangibility
has positive relation with debt level.
The third control variable SIZE shows a negative relation between company size and
debt level. In other words, the bigger the company, the lower the debt level. However,
since the value is insignificant, thus it can be implied that company size has no effect on
company debt level. Profitability (PROF) is a variable that controls for the effect of
company’s performance on company’s decision to use debt financing. Table 4 shows that
company profitability has a negatively significant coefficient in relation to debt level. This
result is in contrast with Almendros & Mira (2016) which suggested that company with
high performance will have lower bankruptcy risk, which in turn give more flexibility to
use debt financing. However, according to Pecking Order Theory, it suggests that company
follows a specific order in financing decision. First, company will use internal financing,
and follows by external financing if it is required. The negatively significant result from
table 4 suggests that the higher the profitability, the lower the debt level. The reason could
be that since the profitability of the company is higher, thus the company is able to finance
its operations using internal financing from its retained earnings rather than using external
financing.
From table 4, multinational company (multi) has a positively significant amount.
This suggests that if a company is classified as multinationals, the company might have
more flexibility using debt financing. This provides insight that multinational company
have more flexibility of borrowing loan from different countries since its operations are
widely spread around the world. This result is in line with Webber (2010).
The regression model without including control variables has an adjusted R2 0.050,
which means that the independent variable only able to explain 5% of the variation of the
dependent variable, which is relatively low. Furthermore, after including the control
variables, the adjusted R2 increased to the level of 0.148. This means that the explanatory
power of the model in explaining how the independent variables captures the change in
company debt level is 14.8%.
All in all, according to the results provided in Table 4, it can be concluded that the
implementation of thin capitalization rule in 2016 has an effect on Indonesian publicly
listed companies with High DER in choosing financing method. The results from both
models with and without control variables provide significant evidence that High DER
companies tend to lower their debt level after the implementation of the thin capitalization
37
rule in 2016, compared to the control group. The reason could be that High DER
companies want to comply with the rule since their level of DER ratio has exceeded the
maximum limit allowed by the rule if they want to use the interest tax shield benefit.
Therefore, hypothesis 1a can be accepted.
On the other hand, the inconsistency of significance in variable POSTTREATED2
on both model with and without control variables provide weak evidence that the
implementation of the rule has an effect on low DER companies’ debt level. Therefore,
hypothesis 1b cannot be accepted. The negative relation showed by the coefficient might
be caused by other unexplained factors which are not included in the model. Seeing that
the proportion of low DER companies in overall sample firms is much higher than high
DER companies, it can be inferred that Indonesian publicly listed firms are mostly funded
by equity financing rather than debt financing. Therefore, the change in policy regarding
thin capitalization strategy will not give much impact to these low DER firms, since it
seems that they have not utilize the interest tax shield benefit from using debt financing
yet. The other reason could be because the implementation of the rule is relatively new.
The rule was issued in 2015 and the implementation was started in 2016. Therefore, the
financial data available which can be analysed regarding the effect of the policy change is
limited to only from the year 2016. In addition, the company decision regarding the change
of financing method usually takes a meticulous consideration which may require more
time. Including more sample period after implementation in the following year might help
to reflect the effect of change in the policy more accurately.

38
Table 4 Regression Result for Financing Decision
All Firms Test
Tests without
control variables Tests with control
variables DEBT DEBT DEBT Coefficient Coefficient Coefficient
Variable [p-value] [p-value] [p-value]
POST 0.014 0.111 0.101 [0.662] [0.006]*** [0.116]
TREATED1 0.046 -0.041 [0.153] [0.492]
TREATED2 -0.332 -0.334 [0.000]*** [0.000]***
POSTTREATED1 -0.151 -0.181 [0.040]** [0.081]*
POSTTREATED2 -0.094 -0.105 [0.043]** [0.123]
RISK -0.007 [0.041]**
TANG 0.107 [0.038]**
SIZE -0.005 [0.263]
PROF -0.939 [0.000]***
multi 0.043 [0.071]*
Constant 0.303 0.609 0.630 [0.000]*** [0.000]*** [0.000]***
N-observations 1204 1204 1204 R-squared 0.024 0.062 0.163 Adj. R-squared 0.015 0.050 0.148 Industry Fixed Effect Yes Yes Yes Year Fixed Effect Yes Yes Yes
*, **, *** indicates significance at 0.10, 0.05, 0.01 levels, respectively Table 4 presents the results from an OLS regression of the application of thin capitalization rule using DEBT as dependent variable. Variable definitions are given in Appendix A.
39
6.2.2 The effect of implementation of thin capitalization rule on Corporate Tax Avoidance
Next, this thesis tests for the effect of implementation of thin capitalization rule into
corporate tax avoidance level which measured by GAAP ETR. The result of this test can
be found in Table 5. Hypothesis 2a and 2b in this thesis expected that after the
implementation of the new rule firms with high DER (POSTTREATED1) will have an
increasing ETR, while low DER firms (POSTTREATED2) will have a decreasing ETR.
First, this thesis will test the effect of implementation of thin capitalization rule to
all firms before and after the rule applied. Variable POST from the first column in Table
5 shows negative coefficient, which means that on average all firms will have a lower ETR
after the rule applied. This result is indeed contrast to the purpose of the implementation
of the rule which is to reduce tax avoidance level. However, since the result is insignificant
therefore I will not take any conclusion regarding the effect of implementation of the thin
capitalization rule in corporate tax avoidance level based on this model solely.
As shown on the next columns in Table 5, in both tests which excludes and includes
control variables, it can be seen that variable POST provides a positively significant value.
Variable POST here captures the aggregate factors that would cause change in ETR in the
absence of thin capitalization rule implementation. The coefficient shows the expected
mean of change in outcome before to after implementation of the rule among the control
group. Result shows that there is a positive and significant relation between variable POST
and GAAP ETR. This means that in the absence of thin capitalization rule implementation,
GAAP ETR will still increase. In other words, it can also mean that the control group has
a positive ETR compare to the treatment groups.
In both tests without control variables and with control variables, variable
POSTTREATED1 shows a negative but insignificant coefficient. The negative coefficient
means that after the implementation of the rule the average ETR of High DER firms will
decrease around 22.7% and 20.1% compared to the control group in test without control
variables and with control variables, respectively. However, since the result is insignificant
thus it cannot be inferred that this decrease in ETR is due to the effect of implementation
of the thin capitalization rule. It can also be seen from the previous test with debt level in
Table 4 that High DER firms will indeed decrease their debt level after implementation
period, thus ideally this matter will lead to increasing ETR for High DER firms. In contrast,
Table 5 shows that the ETR of High DER companies is negative after the implementation
period. Thus, it can be concluded that the implementation of the thin capitalization rule
40
has no effect on corporate tax avoidance level of High DER firms. Therefore, hypothesis
2a cannot be accepted.
Variable POSTTREATED2 shows a negative and significant coefficient at 95%
confidence level. As already explained before in hypothesis development, firms with low
DER are expected to have a decreasing ETR compared to the control group after the
implementation of the new rule. It is assumed that firms with low DER will increase its
debt level to take advantage of the legal loopholes until reaching the maximum limit of
DER based on the rule. Therefore, the tax liability can be minimized through interest tax
shield. The negative coefficient of POSTTREATED2 in Table 5 which remains significant
in both tests with and without control variables show that after the implementation, firms
with low DER will have a decreasing ETR compared to the control group. Therefore,
hypothesis 2b can be accepted.
In addition, this matter is interesting because recalling the result of the first
hypothesis in Table 4, it can be seen that low DER companies tend to lower its debt level
after the implementation of the rule. Ideally, when a low DER company decreases its debt
level, its effective tax rate should be increased since the company capability to use interest
tax shield which already low (because of low DER) became lower. However, the result
from Table 5 implied that the ETR of low DER companies in the period after
implementation is lower than the control group. Even though hypothesis 2b can be
accepted, but these two contrasting result related to the use of debt financing and the
outcome of ETR after implementation period show weak evidence that the lower ETR is
due to the use of thin capitalization strategy by low DER firms through increasing debt
financing. The lower ETR after the implementation period could be the implication of
using another practice of tax avoidance strategy other than thin capitalization.
Regarding control variables, the coefficient of capital intensity (CINT) in Table 5
shows that there is a positive relation between capital intensive firms and ETR. This is in
contrast with what already expected that firms with high capital intensity will have a lower
ETR since capital intensive firms can use depreciable assets as a non-debt-tax shield to
reduce tax liability, as depreciation expense is also one of the tax-deductible items. In line
with the predicted sign, inventory intensive firms (INVINT) has a positive relation with
ETR. As expected, since inventory intensive firms do not have as much flexibility as
capital intensive firms to use non-debt-tax shield from depreciable assets, therefore
inventory intensive firms has a positive association with ETR. From Table 5, it can be seen
that even though both coefficient provide the same positive correlation to ETR, the

41
coefficient of CINT is smaller compared to INVINT. While high inventory intensive firms
result in 8.2% increase of ETR, high capital intensive firms only provide 0.2% increase of
ETR. In other words, inventory intensive firms have more contributions in predicting
positive ETR compared to capital intensive firms. However, the result of both predictors
are insignificant. Thus, I cannot draw any conclusion regarding the relation of both capital
intensity and inventory intensity to ETR.
Control variable SIZE has a positive but insignificant value. It means that company
size has no significant effect on company ETR. Control variable profitability (PROF)
provides a positive coefficient which is highly significant. This means that profitable firms
has a positive association with ETR. The more profitable the company the higher the tax
burden, since the pre-tax income will also higher. This result is similar with the findings
in Taylor and Richardson (2012) which suggests that ROA has a positive relation with
ETR.
The last control variable multinational (multi) provides a negative but insignificant
value. The negative coefficient indicates that there is a tendency of multinational company
to have a lower ETR, as they can use tax advantage from transactions between different
tax jurisdictions. However, since the result is insignificant therefore the relation between
multinational and company ETR in this model cannot be predicted accurately.
Furthermore, the adjusted R2 for this GAAPETR model is 0.006 and 0.020 for test
without controls variables and test with control variables, respectively. This means that the
capability of this model to explain the variance of ETR to predict corporate tax avoidance
level is relatively low. There might be some other correlated variables that are not captured
by the model which may affect the company ETR. In addition, the relatively small sample
size and narrow sample period might also influence the low value of adjusted R2 in this
model. Specifically, because the rule has just been issued in 2015 then the financial data
after the year of implementation that can be obtained is limited to only from the year 2016.
Therefore, the effect that can be captured from the implementation of the rule is also
limited.

42
Table 5 Regression Result for Corporate Tax Avoidance
All Firms Test Tests without
control variables Tests with
control variables GAAP ETR GAAP ETR GAAP ETR Cofficient Cofficient Coefficient
Variable [p-value] [p-value] [p-value]
POST -0.048 0.252 0.252
[0.139] [0.048]** [0.061]* TREATED1 - 0.061 - 0.032
[0.654] [0.814] TREATED2 0.065 0.063
[0.459] [0.481] POSTTREATED1 - 0.227 - 0.201
[0.383] [0.440] POSTTREATED2 - 0.308 - 0.295
[0.017]** [0.030]** CINT 0.002
[0.874] INVINT 0.082
[0.133] SIZE 0.002
[0.557] PROF 0.371
[0.000]*** multi - 0.027
[0.235] Constant 0.149 0.091 0.045
[0.001]*** [0.354] [0.703]
Observations 1204 1204 1204 R-squared 0.014 0.018 0.036 Adj. R-squared 0.005 0.006 0.020 Industry Fixed Effect Yes Yes Yes Year Fixed Effect Yes Yes Yes
*, **, *** indicates significance at 0.10, 0.05, 0.01 levels, respectively Table 5 presents the results from an OLS regression of the implementation of thin capitalization rule using GAAP ETR as dependent variable. Variable definitions are given in Appendix A.
43
6.3 Additional Analysis
Webber (2010) suggests that thin capitalization strategy is often used by
multinational companies to minimize tax burden using tax rate differentials between two
different tax jurisdictions. When multinational companies have subsidiary which located
in higher tax jurisdictions which financed by intercompany debt from the parent located
in lower tax jurisdictions, then the profit can be shifted into the country which imposed
lower tax. This way, by using intercompany debt, the subsidiary in higher-tax jurisdictions
can reduce its taxable income due to the deductibility of interest expense associated with
debt financing. Thus, the subsidiary can have a lower tax liability. Moreover, the interest
paid to the parent located in lower tax jurisdictions which recognized as interest income
are imposed to lower tax rate. Therefore, these two conditions will lead to lower tax
payable to the authority.
In the first regression model regarding the effect of the implementation of the thin
capitalization rule on company debt level, multinationality variable provides positive and
significant amount. This means that multinational companies tend to have more
preferences in using debt financing method. In the second regression related to the thin
capitalization rule effect on corporate tax avoidance level, it can be seen that multinationals
provide negative relation with company ETR. This means that multinationals have a lower
effective tax rate compared to non-multinational companies. However, the second
regression provide insignificant p-value for multinationals. Thus, this thesis would like to
conduct an additional analysis to consider the interaction effects of multinationality to the
treatment groups to determine if the implementation of thin capitalization rule has an
impact on financing decision and corporate tax avoidance level of treatment companies
which are multinationals. After interacting variable multinationality (multi) and both
treatment groups, the regression model for both tests can be modified as follows:
!"#$%& = (%&+*+,-.$%& + */012$3$4"5$"!1%& + *7012$3$4"5$"!2%&+ *9,-.$012$3$4"5$"!1%& + *:,-.$012$3$4"5$"!2%& +*<43.=%&+ *>$5?@%& + *A.3B"%& +*C,4-D%& + E%&
@55,"$4%& = (%&+*+,-.$%& + */012$3$4"5$"!1%& + *7012$3$4"5$"!2%&+ *9,-.$012$3$4"5$"!1%& + *:,-.$012$3$4"5$"!2%& + *<F3?$%&+ *>3?G3?$%& + *A.3B"%& +*C,4-D%& + E%&
44
Table 6 shows the additional analysis results regarding the effect of implementation
of thin capitalization rule on multinational treatment groups. MULTITREATED1 in both
tests provide a positive and significant value. This shows that multinational high DER
companies have a relatively high debt level before the implementation of the rule,
compared to the control group. Control variables RISK, TANG, and PROF remains
significant with the same sign of coefficient value as the main regression in Table 4.
In both tests without and with control variables, variable POSTMULTITREATED1
provides negative coefficient. This means that after implementation of thin capitalization
rule, multinational High DER companies will decrease their debt level compared to the
control group. Variable POSTMULTITREATED2 provides positive coefficient in both
tests. It can be inferred that after implementation of the rule, multinational Low DER
companies will increase their level of debt compared to the control group. In general, these
results are in line with my first hypotheses where High DER companies are expected to
decrease their debt level and Low DER companies are expected to increase their debt level
after the implementation of the rule. As High DER companies are willing to comply with
the rule, thus they decrease the company debt level. For Low DER companies, since they
still far below the limit, they will increase their debt level up until reach to the limit to take
advantage of the interest tax shield from debt financing as long as it is still safe within the
rule. Being multinationals add more benefit for the company to take advantage of tax
differentials between two tax jurisdictions. Thus, including multinationality as a
moderating variable in the treatment groups will add more evidence to the hypotheses.
However, unfortunately these results are still insignificant. Therefore, the evidence is still
not enough to corroborate that the change in debt level in both treatment groups are due to
the effect of the implementation of the rule. Providing more sample firms and sample
period post-implementation in the future research may provide a more accurate result in
analyzing the effect of this tax policy change on company debt level.
Table 7 explained the additional analysis regression result for the effect of
implementation of thin capitalization rule on corporate tax avoidance level on
multinational treatment groups. After interacting multinationality into both treatment
groups, result shows that both multinational treatment groups will have a lower effective
tax rate after the new rule implemented. For High DER companies, the results are the same
with the main regression in Table 4 where multinationals are not included as a moderating

45
variable. Multinational High DER companies provide a lower ETR compared to the
control groups after the implementation period, and the result is statistically insignificant.
This implied that thin capitalization rule implementation has no effect on multinational
High DER companies corporate tax avoidance level. Although they might decrease their
debt level after the implementation of the rule, but this does not result in a lower ETR. The
reason could be that they use another tax avoidance strategy to lower their tax liability
other than thin capitalization strategy.
For low DER multinational companies, it makes sense that they have a lower ETR,
as they might use thin capitalization strategy to minimize its tax burden as long as it is still
within the safe haven limit. However, since the result is insignificant, this result cannot be
concluded as the effect of implementation of thin capitalization rule on multinational
treatment groups either.
The relatively low adjusted R2 0.022 suggested that the model does not capture the
relation between independent and dependent variable really well. For future research, it is
suggested that the researcher use more variables related to the factors affecting corporate
tax avoidance level, and to use bigger sample size and longer post-sample period.
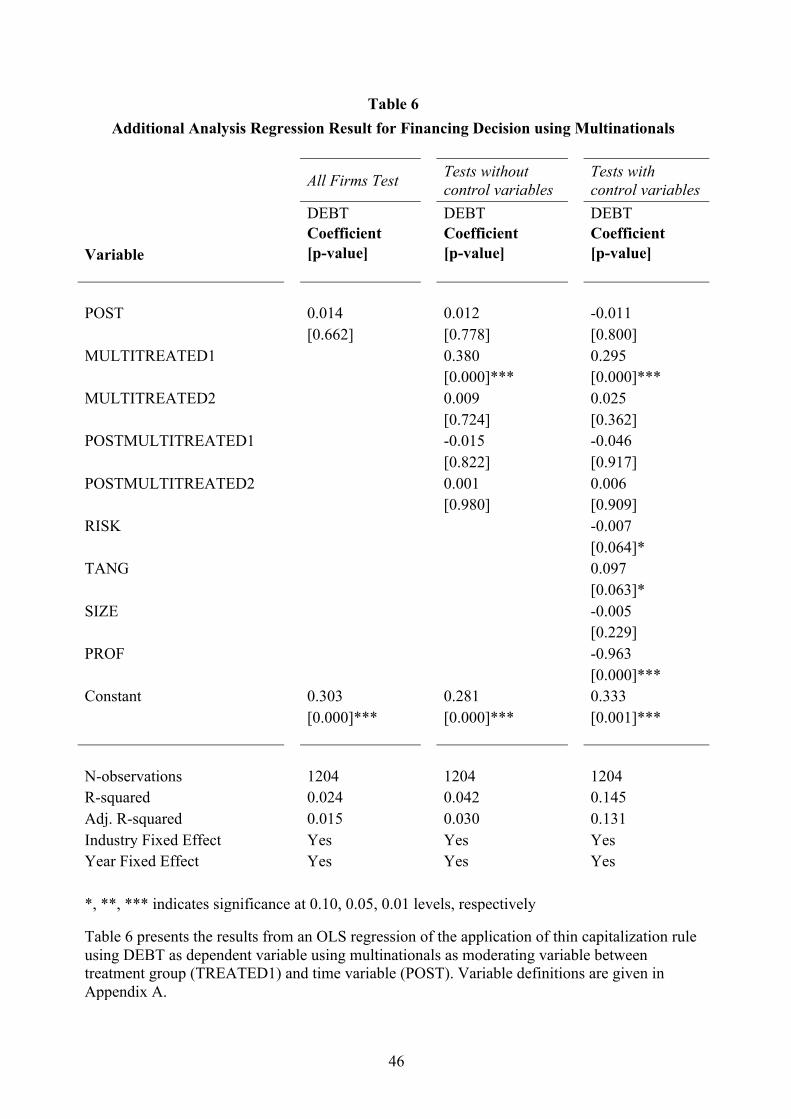
46
Table 6 Additional Analysis Regression Result for Financing Decision using Multinationals
All Firms Test
Tests without control variables
Tests with control variables
DEBT DEBT DEBT
Variable Coefficient Coefficient Coefficient [p-value] [p-value] [p-value]
POST 0.014 0.012 -0.011 [0.662] [0.778] [0.800] MULTITREATED1 0.380 0.295 [0.000]*** [0.000]*** MULTITREATED2 0.009 0.025 [0.724] [0.362] POSTMULTITREATED1 -0.015 -0.046 [0.822] [0.917] POSTMULTITREATED2 0.001 0.006 [0.980] [0.909] RISK -0.007 [0.064]* TANG 0.097 [0.063]* SIZE -0.005 [0.229] PROF -0.963 [0.000]*** Constant 0.303 0.281 0.333 [0.000]*** [0.000]*** [0.001]*** N-observations 1204 1204 1204 R-squared 0.024 0.042 0.145 Adj. R-squared 0.015 0.030 0.131 Industry Fixed Effect Yes Yes Yes Year Fixed Effect Yes Yes Yes *, **, *** indicates significance at 0.10, 0.05, 0.01 levels, respectively
Table 6 presents the results from an OLS regression of the application of thin capitalization rule using DEBT as dependent variable using multinationals as moderating variable between treatment group (TREATED1) and time variable (POST). Variable definitions are given in Appendix A.

47
Table 7
Additional Analysis Regression Result for Corporate Tax Avoidance Level using Multinationals
All Firms Test
Tests without control variables
Tests with control variables
GAAP ETR GAAP ETR GAAP ETR
Variable Coefficient Coefficient Coefficient [p-value] [p-value] [p-value]
POST -0.048 -0.020 -0.006 [0.139] [0.649] [0.891] MULTITREATED1 -0.163 -0.139 [0.205] [0.279] MULTITREATED2 -0.002 -0.009 [0.946] [0.709] POSTMULTITREATED1 -0.203 -0.181 [0.353] [0.402] POSTMULTITREATED2 -0.045 -0.048 [0.419] [0.385] CINT 0.001 [0.894] INVINT 0.082 [0.122] SIZE 0.002 [0.566] PROF 0.366 [0.000]*** Constant 0.149 0.158 0.096 [0.001]*** [0.001]*** [0.204] Observations 1204 1204 1204 R-squared 0.014 0.021 0.038 Adj. R-squared 0.005 0.009 0.022 Industry Fixed Effect Yes Yes Yes Year Fixed Effect Yes Yes Yes *, **, *** indicates significance at 0.10, 0.05, 0.01 levels, respectively
Table 7 presents the results from an OLS regression of the implementation of thin capitalization rule using GAAP ETR as dependent variable using multinationals as a moderating variable in treatment group variable. Variable definitions are given in Appendix A.
48
7. Conclusions
The purpose of this thesis is to investigate the effect of Indonesian new thin
capitalization rule on company financing decision to use debt financing and also the effect
on corporate tax avoidance level. This thesis observes financial data from Indonesian listed
companies from the year 2013 through the year 2016, which is three years before and one
year after the implementation of the rule.
The first regression result shows that the implementation of the thin capitalization
rule only affects High DER companies’ decision but does not affect Low DER companies’
decision in using debt financing method. High DER companies are found to have
decreasing debt level after the implementation period, since they might want to comply
with the rule. The findings only support the alternative hypothesis 1a, but not hypothesis
1b. Therefore, it can be concluded that Low DER companies’ financing decision whether
to use debt financing method or not is not affected by the implementation of the thin
capitalization rule. The reason could be because most of Indonesian listed companies still
prefer equity financing to debt financing. This is reflected in the grouping of treatment and
control groups, which comprises of only 45 observations which have a high debt-to-equity
ratio, while 1148 observations show a low debt-to-equity ratio. As a result, a restriction in
thin capitalization strategy does not give much implication for the low DER companies
since they are not engaged much in thin capitalization practice to reduce tax. The
decreasing debt level in Low DER companies could be due to other reasons other than
complying with the new rule. Providing a longer post-implementation period probably will
give a different result, as switching from equity to debt financing requires more time to
analyze the cost and benefit arising from the switch in financing method.
With regards of the effect of thin capitalization rule implementation on corporate tax
avoidance level, the second regression result supports only the alternative hypothesis 2b.
The corporate tax avoidance level of High DER companies is found to be not affected by
the implementation of the new thin capitalization rule. In contrast, Low DER companies
are found to have a lower ETR after the year of implementation of the rule. However, since
the result regarding corporate tax avoidance level is in contrast with the related result with
company debt level, therefore I cannot conclude that the decreasing ETR or the increasing
in tax avoidance level in Low DER firms after the implementation of the rule is due to the
49
utilization of thin capitalization strategy. The results of the additional analysis also found
that both multinational High DER and Low DER companies show a decreasing ETR after
implementation of the thin capitalization rule, although the result is insignificant. All in
all, the results of this study suggest that the implementation of thin capitalization rule is
found to be not effective yet to curb tax avoidance level in Indonesian publicly listed
companies. The reason could be because of unexplained variables that might also affect
corporate tax avoidance level, for example another tax planning strategy other than thin
capitalization, or also because of limited time period post-implementation which is only 1
year after.
This study contributes to the corporate tax planning literatures by analyzing how thin
capitalization rule restricts companies to use more debt financing method to engage in
corporate tax avoidance while minimizing tax liability. The result of this study reflects
firm behavior in developing country regarding the use of thin capitalization strategy in
avoiding tax. The finding of this study add insights to existing literatures regarding firm
behavior in developing country which shows that most of publicly listed firms in Indonesia
still prefer more equity financing to debt financing. This supports the findings of
developing country studies by Ogundaja & Onakoya (2016) which found that Nigerian
firms are mainly financed by equity and do not use excessive debt financing to use interest-
tax-shield benefit.
In regards to reduce dilemma in developing country whether to issue thin
capitalization rule or to increase investment growth, this study may also give insights
related to the reason why Indonesian authority issued a less strict rule compared to the
previously issued rule in 1984. After distinguishing high DER firms and low DER firms
from overall sample firms, the reason why Indonesian authority provides a less strict rule
can be found reasonable. On one side, the implementation of the thin capitalization rule is
intended to reduce the use of excessive debt financing as a corporate tax avoidance
strategy. This might be aimed to those companies who have High DER. On the other side,
the implementation of the thin capitalization rule might alarm the Low DER companies
who previously were not engaged in thin capitalization strategy that they still have a
chance to use debt financing method if they want to minimize their tax liability as long as
it is still below the maximum limit. Although from tax perspective this might harm
potential tax revenue, but looking from the investment perspective this rule might also

50
increase investment activity by Low DER companies. Therefore, while protecting the tax
base, the government can also still increase investment activities.
This research is subject to several limitations. First, the post period implementation
is only one year. Being issued in 2015, the new Indonesian thin capitalization rule is
applied in 2016. Therefore, the available financial data that can be obtained to analyzed
the effect of the change in the tax policy is limited. On the other hand, the company
decision to change financing method usually requires rigorous analysis which needs longer
time. Therefore, it is hard to measure the variation of company debt level based on one
year after effect of the implementation of the rule. Second, the calculation of total debt in
this thesis only consist of total short-term debt and total long-term debt, while in PMK-
169 total debt is also includes interest-bearing trade payables. The data which can be
obtained from Compustat Global only consist of total current debt and total long-term debt.
Data related to interest bearing trade payables are not provided in Compustat Global.
Therefore, it is excluded in calculating total debt in measuring the variables. Third, this
thesis only used financial data to measure the dependent variables debt level and corporate
tax avoidance. This could also be the reason why the explanatory power of the model to
explain the variation in dependent variables are relatively low.
For future research, it is suggested to use post-sample period two or three year after
implementation to provide a clearer trend of the effect in policy change. Moreover,
regarding the measurement of the variables, it would be more accurate if the measurement
also includes interest bearing trade payables to measure total debt. Thus, the analysis can
provide a more precise result. Regarding the variables used, future research might include
other variables which may affect debt level and corporate tax avoidance level. Related to
tax avoidance level, future research may include measurements other than from financial
data, such as corporate governance variables since it is also widely used in studies
investigating tax avoidance level. In addition, it is also suggested to measure the effectivity
of the implementation of thin capitalization rule in one country by comparing the effect in
the country which apply thin capitalization rule as a treatment group and other country
which do not apply thin capitalization rule as a control group.
51
References
Almendros, J.A.C., & Mira, F.S. (2016). The effect of taxes on the debt policy of Spanish listed
companies. Journal of the Spanish Economic Association, 7, 359-391.
Alworth, J., & Arachi, G. (2001). The effect of taxes on corporate financing decisions:
Evidence from a panel of Italian firms. International Tax Public Finance, 8, 353–376.
Babberich, N.P.M. (2009). The thin capitalization rules and multinationals financing and
investment decision: Evidence from Dutch legislation. (Master’s thesis). Erasmus
Universiteit Rotterdam, Rotterdam.
Beuselinck, C., Bysschaert, A., & Deloof, M. (2005). Business groups, taxes, and earnings
management. European Accounting Association Congress.
Blouin, J., Huizinga, H., Leaven, L., & Nicodeme, G. (2013). Thin capitalization rules and
multinational firm capital structure. Taxation Papers Working Paper, N.42.
Brigham, E. F., & Ehrhardt M. C. (2011). Financial management: Theory and practice (13 Ed.).
South-Western: South Western CENGAGE Learning.
Buettner, T., Overesch, M., Schreiber, U., & Wamser, G. (2006). The impact of thin-
capitalization rules on multinational’s financing and investment decisions. Centre for
European Economic Research, 06-068.
Committee of Experts on International Cooperation in Tax Matters. (2011). Revision of the
Manual for the Negotiation of Bilateral Tax Treaties. United Nations: Seventh Session.
Deloitte. (2010). Brazil Tax Alert. Retrieved from: http://mobile.deloitte-tax-
news.de/steuern/internationales-steuerrecht/files/uis-brazil-tax-alert-15062010.pdf
Deloitte. (2016). Indonesian Tax Guide. Retrieved from:
https://www2.deloitte.com/id/en/pages/tax/articles/indonesian-tax-guide-2016.html
Deloitte. (2017). International Tax Taiwan Highlights 2017. Retrieved from:
https://www2.deloitte.com/content/dam/Deloitte/global/Documents/Tax/dttl-tax-
taiwanhighlights-2017.pdf
52
Desai, M.A., Foley, C. F., & Hines, J.R. (2006). Do tax havens divert economic activity?
Economics Letters, 90, 219-224.
Dharmapala, D., & Hines, J. R. (2009). Which firms become tax havens? Journal of Public
Economics, 93, 1058-1068.
Directorate General of Taxes. (2015). Annual Report 2015. Jakarta: Ministry of Finance.
Dyreng, S.D., Hanlon, M., & Maydew, E.L. (2008). Long-run corporate tax avoidance. The
accounting Review, 83, 61-82.
Egger, P., Keuschnigg, C., Merlo, V., & Wamser, G. (2014). Corporate taxes and internal
borrowing within multinational firms. National Bureau of Economic Research.
Feld, L., Heckemeyer, J., & Overesch. (2013). Capital structure choice and company taxation:
A meta-study. Journal of Banking & Finance, 37(8), 2850-2866.
Gajewski, D. (2012). Tax-related and economic consequences of selecting the method of debt
financing of companies with regard to thin capitalization in OECD member countries.
Contemporary Economics Journal, 7.
Graham, J. R. (1996). Debt and the marginal tax rate. Journal of Financial Economics, 41, 41–
74.
Graham, J.R, & Tucker, A. (2006). Tax shelter and corporate debt policy. Journal of Financial
Economics, 81: 563-594.
Gravelle, J.G. (2009). Tax havens: International tax avoidance and evasion. Congressional
Research Service, Report for US Congress.
Gupta, S., & Newberry, K. (1997). Determinants of the variability in corporate effective tax
rates: Evidence from longitudinal data. Journal of Accounting and Public Policy, 16, 1-
34.
Hanlon, M., & Heitzman, S. (2010). A review of tax research. Journal of Accounting and
Economics, 50, 127-178.
Hartmann-Wendels, T., Stein, I., Stöter, A. (2012). Tax incentives and capital structure choice:
evidence from Germany. (Discussion Paper). Deutsche Bundesbank.
53
Haufler, A., & Runkel, M. (2008). Multinational’s capital structures, thin capitalization rules’,
and corporate tax competition. (Working Paper). European Tax Policy Forum.
Kunieda, S., Takahata, J., Yada, H. (2011). Japanese firms’ debt policy and tax policy.
(Discussion Paper). Tokyo: Hitotsubashi University.
Lazonick, W., & O’Sullivan, M. (2000). Maximising shareholder value, a new ideology for
corporate governance. Economy and Society, 29(1), 13-35.
Mackie-Mason, J.K. (1990). Do taxes affect corporate financing decisions? Journal Finance,
45(5), 1471-1493.
Mardan, M. (2016). Why countries differ in thin capitalization rules: the role of financial
development. European Economic Review, 91, 1-14.
McKee, M. (2009). Preventing excessive debt: China’s developing thin capitalization regime.
Tax Notes International, 54 (13), 1123.
Mills, L. F., & Newberry, K. J. (2004). Do foreign multinationals’ tax incentives influence
their US income reporting and debt policy? National Tax Journal, 57(1), 89-107.
Minister of Finance of Republic of Indonesia. (2015). Peraturan Menteri Keuangan Republik
Indonesia No 169/PMK.010/2015 tentang Penentuan Besarnya Perbandingan Antara
Utang dan Modal Perusahaan Untuk Keperluan Penghitungan Pajak Penghasilan.
Jakarta: Ministry of Finance of the Republic of Indonesia.
Minister of Finance of Republic of Indonesia. (1984). Keputusan Menteri Keuangan Republik
Indonesia Nomor 1002/KMK.04/1984. Jakarta: Ministry of Finance of the Republic of
Indonesia.
Minister of Finance of Republic of Indonesia. (2015). Annual Report 2015. Jakarta: Ministry
of Finance of the Republic of Indonesia.
Modigliani, F., & Miller, M. H. (1963). Corporate income taxes and the cost of capital: a
correction. American Economic Review, 53(2), 433–443.
Myers, S.C. (1984). The capital structure puzzle. Journal Finance, 39, 575–592.

54
Ogundajo, G. O., & Onakoya, A. B. (2016). Tax planning and financial performance of
Nigerian manufacturing companies. International Journal of Advanced Academic
Research, 2, 2488-9849.
Organization for Economic Cooperation and Development (OECD). (2006). The OECD’s
Project on Harmful Tax Practices: 2006 Update on Progress in Member Countries.
Retrieved from: http://www.oecd.org/dataoecd/1/17/37446434.pdf.
Organisation for Economic Cooperation and Development (OECD). (2012). Thin
Capitalisation Legislation: A background paper for country tax administration. Retrieved
from: http://www.oecd.org/
Overesch, M., & Wamser, G. (2010). Corporate tax planning and thin-capitalization rules:
evidence from a quasi-experiment. Applied Economics, 42(5), 563-573.
Rego, S. O. (2003). Tax-avoidance activities of US multinational corporations. Contemporary
Accounting Research, 20(4), 805-833.
Richardson, G., & Lanis, R. (2007). Determinants of the variability in corporate effective tax
rate and tax reform: evidence from Australia. Journal of Accounting and Public Policy,
26(6), 689-704.
Rohaya, M. N., Fadzillah N.S.M., & Mastuki, N.A. (2010). Corporate tax planning: A study
on corporate effective tax rates of Malaysian listed companies. International Journal of
Trade, Economics, and Finance, 1, 2010-023X.
Shackelford, D., & Shelvin, T. (2001). Empirical tax research in accounting. Journal of
Accounting and Economics, 31, 321-387.
Shahar, W.H.S., Shahar, W.H.S., Bahari, N.F., Ahmad N.W., Fisal, S., & Rafdi, N.J. (2015).
A review of capital structure theories: Trade-off theory, pecking order theory, and market
timing theory. Proceeding of the 2nd International Conference on Management and
Muamalah 2015. e-ISBN: 978-967-0850-25-2.
Singh, A., & Hamid, J. (1992). Corporate financial structures in developing countries. IFC
Technical Paper No.1, Washington D.C: IFC.
Singh, A. (1995). Corporate financial patterns in industrializing economics: A comparative
study. IFC Technical Paper No.2, Washington D.C: IFC.

55
Sinha, P., & Bansal, V. (2013). Capital structure puzzle: the interrelationship between leverage,
taxes and other micro economic factors. (MPRA Paper No. 49878). University Library
of Munich, Germany.
Slemrod, J. (2001). A general model of the behaviour response to taxation. International Tax
and Public Finance, 8(2), 119-128.
Steed, A. (2015, October 13). Revealed: the 10 countries toughest on tax evaders. The
Telegraph. Retrieved from: http://www.telegraph.co.uk/finance/personalfinance/expat-
money/11927295/Revealed-the-10-countries-toughest-on-tax-evaders.html
Stickney, C., & McGee, V. (1982). Effective corporate tax rates - the effect of size, capital
intensity, leverage, and other factors. Journal of Accounting and Public Policy, 1, 125–
152.
Tandean, V.A, & Winnie. (2016). The effect of good corporate governance on tax avoidance:
An empirical study on manufacturing companies listed in IDX period 2010-2013. Asian
Journal of Accounting Research, 1, 28-38.
Tax Avoidance. In Black Law’s Dictionary (2nd Ed). Retrieved from:
http://thelawdictionary.org/tax-avoidance/
Taylor, G., & Richardson, G. (2012). International corporate tax avoidance practices: evidence
from Australian Firms. The International Journal of Accounting, 47, 469-496.
Taylor, G., Richardson, G., & Lanis, R. (2015). Multinationality, tax havens, intangible assets,
and transfer pricing aggressiveness: an empirical analysis. Journal of International
Accounting Research, 14(1), 25-57.
Turner, G. (2017, July 3). Will the G20 ever end the global problem of tax avoidance and tax
evasion? Tax Justice Network. Retrieved from:
http://www.taxjustice.net/2017/07/03/will-g20-ever-end-global-problem-tax-avoidance-
tax-evasion/
Wamser, G. (2014). The impact of TCR on external debt usage – a propensity score matching
approach. Oxford Bulletin of Economics and Statistics, 76(5), 764-781.
Webber, S. (2010). Thin capitalization and interest deduction regulations. Copenhagen
Research Group on International Taxation, 8.

56
Wilson, R.J. (2009). An examination of corporate tax shelter participations. The Accounting
Review, 84, 969-999.
Van Dijck, S. (2016). Corporate tax avoidance and justice. (Master Thesis). Erasmus
Universiteit Rotterdam, Rotterdam.

57
Appendix A Variable Descriptions
Variable Name Variable Descriptions
DEBT
Debt Level (Total Debt divided by total assets)
GAAPETR
Effective Tax Rate (Income Tax Expense divided by pretax income)
POST
Dummy for the year 2016 (post implementation of the new thin capitalization rule)
TREATED1 Dummy for companies with High DER
TREATED2 Dummy for companies with Low DER
POSTTREATED1
Measurement of the effect of thin capitalization rule on High DER companies
POSTTREATED2
Measurement of the effect of thin capitalization rule on Low DER companies
RISK
Probability of bankruptcy (Total assets divided by sum of 3.3 times EBIT, 1.0 times sales, 1.4 times retained earnings, and 1.2 times working capital)
TANG
Tangibility (Tangible Assets divided by total assets)
SIZE
Company size (Natural logarithm of total assets)
PROF
Profitability (ROA = pretax income divided by total assets)
CINT
Capital Intensity (Net Property, Plant, and Equipment divided by lagged total assets)
INVINT
Inventory Intensity (Total Inventory divided by lagged total assets)
multi
Dummy for multinational company
MULTITREATED1
Interaction effect of Multinational High DER Companies
MULTITREATED2
Interaction effect of Multinational Low DER Companies
POSTMULTITREATED1
Measurement of the effect of thin capitalization rule on multinational high DER companies
POSTMULTITREATED2
Measurement of the effect of thin capitalization rule on multinational low DER companies
Copyright © 2022 FDOKUMEN