Thesis submitted to the Université de la Réunion - Thèses
189
Thesis submitted to the Université de la Réunion for award of Doctor of Philosophy in Sciences speciality in bioinformatics New computational approaches for investigating the impact of mutations on the transglucosylation activity of sucrose phosphorylase enzyme Mahesh VELUSAMY Thesis to be presented on 18 th December 2018 in front of the jury composed of Mme Isabelle ANDRE, Directeur de Recherche CNRS, INSA de TOULOUSE, Rapporteur M. Manuel DAUCHEZ, Professeur, Université de Reims Champagne Ardennes, Rapporteur M. Richard DANIELLOU, Professeur, Université d'Orléans, Examinateur M. Yves-Henri SANEJOUAND, Directeur de Recherche CNRS, Université de Nantes, Examinateur Mme Irène MAFFUCCI, Maître de Conférences, Université de Technologie de Compiègne, Examinateur Mme Corinne MIRAL, Maître de Conférences HDR, Université de Nantes, Examinateur M. Frédéric CADET, Professeur, Université de La Réunion, Co-directeur de thèse M. Bernard OFFMANN, Professeur, Université de Nantes, Directeur de thèse
-
Upload
khangminh22 -
Category
Documents
-
view
4 -
download
0
Transcript of Thesis submitted to the Université de la Réunion - Thèses

Thesis submitted to the Université de la Réunion
for award of Doctor of Philosophy in Sciences
speciality in bioinformatics
New computational approaches for investigating theimpact of mutations on the transglucosylation activity of
sucrose phosphorylase enzyme
Mahesh VELUSAMY
Thesis to be presented on 18th December 2018 in front of the jury composed ofMme Isabelle ANDRE, Directeur de Recherche CNRS, INSA de TOULOUSE, RapporteurM. Manuel DAUCHEZ, Professeur, Université de Reims Champagne Ardennes, RapporteurM. Richard DANIELLOU, Professeur, Université d'Orléans, ExaminateurM. Yves-Henri SANEJOUAND, Directeur de Recherche CNRS, Université de Nantes, ExaminateurMme Irène MAFFUCCI, Maître de Conférences, Université de Technologie de Compiègne, ExaminateurMme Corinne MIRAL, Maître de Conférences HDR, Université de Nantes, ExaminateurM. Frédéric CADET, Professeur, Université de La Réunion, Co-directeur de thèseM. Bernard OFFMANN, Professeur, Université de Nantes, Directeur de thèse


ெ�்்ந்ி ிைு்ூுத் ெ�்யாம் ெ�்த உதி்ுை�யகு்
�ானகு்ஆ்ற் அிு.
-ிு�்ு�்
ுதி் அ்ப் ுுக், எனு த்ைத ே�ு�ாி, தா் க்ூி, அ்ண் ு்ு்ுமா்,
த்ைக பா்பா, ஆ்தா ுு�்மா், ீனா, அ்ண் �்ுக், ெபிய்பா, ெபிய்மா ம்ு்
உுுைணயா் இு்த அைண்ு ந்ப்கு்ு ் எனு மனமா்்த ந்ி.
இ்த ஆ்�ி்ைக ுுைம அை3�த்ு ுுுத்்காரண், எனு ஆ்�ி்ைக இய்ுன்
ேபராிிய் ெப்னா்் ஆஃ்ேம். ப்ே�ு துண்கி் நா் மனதாு், ெபாுளாதார
அளிு் க்3்ி் இு்தேபாு, என்ு இ்ெனாு த்ைதயாகே� இு்ு எ்ைன
பா்்ு்ெகா்3ா். ுி்பாக, எனு ூ்றா் ஆ்ு இுிி், அ�்்ு எ்�ளே�ா
தி்ப்3 க3ைமக் ம்ு் ிர்ிைனக் இு்தாு், அைத்ெபாு்பு்தாு, அ�்
என்ு ெ�்த ெபாுளாதார உதி, ப்கைB்கழக பிு ம்ு் இதர ி்�ாக �்ப்த்ப்3
உதிகு்ு எ்ன ைகமா்ு ெகாு்தாு் ஈ3ாகாு. ேபராிிய் ஃிரெ3ி் ேக3்
ம்ு் ேபராிிய் ிி் �ா்3் ஆிேயாரு இைண ேம்பா்ை�்ு் எ் உளமா்்த
ந்ி.
ேபராிிய். ய்்- ெH்ி �ேனு�்ு அ�்கேள உ்குை3ய ிிி ு்3ள�ா்ுத்,
ேமாெ3்ேB் �்ப்த்ப்3 ு்ியமான பி்ுைரக் ம்ு் எ்ுுய ஆ்ு க்ுைர
எுு�த்கான உ்குை3ய அைன்ு ஊ்கமான �ா்்ைதகு்ு் ி்க ந்ி. 3ா்3்.
ிி் அ்னா்் ம்ு் ிேயான் Hாஃ்ேம் ஆிய இு�ு்ு் ுேராேம்்
�்ப்த்ப்3 உ்குை3ய உதி்ு ி்க ந்ி. 3ா்3். ்ெ3பாேன ே3ேB்ே�யா
அ�்கேளஉ்குை3ய ிுிு ெதாி்ு்ப �்ப்த்ப்3 உதிகு்ு ந்ி.
எ் ுதBா் ஆ்ி், ீூியி் த்ு் ��ி ம்ு் இதர ு்ியமான ��ிகைள ெ�்ு
த்த ு்ு்�ாி ுு்ப்தா்க், ேநாெய்ி மிி் ம்ு் ேபராிிய் பாிி்
கா்ெ3ிய் ஆிேயாு்ு எ் ிர் தா்்த ந்ி. ேமு், ிூிய் நா்கி் என்ு
மற்க ுியாத ிைனுகைள ெகாு்த ந்ப்க் ேமகBா்கா, அினா், ே�ாு, ேம்்,
மு்கா, ெக்், அேராரா, ூி, ேUா, மி், ிைர் அ்ணா, எி, எ்ினா, ிி, அிBா,
ராUா், அண்யா ம்ு் அி் ீூிய் தி் ெ�ா்தகு்ு் எ்ேBாு்ு் எ்
மனமா்்த ந்ி. ுி்பா ெ�்ி் அ்ணா, ு்தி அ்ி, Uனி ு்ி ம்ு் Hிதா,
உ்குை3ய அளி்Bா அ்ு ம்ு் அ்கைர்ு ெரா்ப ந்ி.
Page 3 of 188

பாி்B த்ுறு்ு ீு ுு்ு, அ்த நா்கைள இிதாகு், மற்குியாத
துண்களாகு் மா்ுன த்ே�் த்ி, பாBா அ்ணா, ி்ப்், �ி, ெபி்்
அைன�்கு்ு் எ் மனமா்்த ந்ி. ிிஎ்ி பாி் ஆ்�க �க ஊிய்கு்ு்,
ுி்பாக ேபராிிய். ேக்தி் எ்்ே�ெப்் அ�்கி் மாுB் ு்ப்கைள் ப்ிய
பயு்ள அிுைரகு்ு் ம்ு் ிு. ிூெப்் அ�்கி் ெதாி்ு்ப ெதா3்பான
உதி்ு் எ் மனமா்்த ந்ி.
எ்ேனா3, நா்ே3் நா்கைள ெபா்னான துண்களாக மா்ியி் ெபு் ப்ு
�ி்ப�்க் ெபனா்் ே3ி், ேUாக், 3ா்3். ஐயனா் ெ�்ிே�் ம்ு் மாுி.
ுி்பாக, ெபனா்் ே3ி், ேUாH் ெH்ி்் ஆிய இு�ி் ெதாி்ுைற
ீிிBான ப்கி்ு ம்ு் உு�க்பு்ுத் ெதா3்ுை3ய அிுைரக் எனு ுைன�்
பி்ி் ுிுகி் ெபிய ப்ு �ி்ிறு. இு�ு்ுேம எனு மனமா்்த ந்ி.
எ்ுை3ய ஆ்ிB்ைத �ி பா்்த எ் ேதாிக் ிிகா, ிேனகா ம்ு் ுரி
அைன�ு்ு் ந்ி. இ�்கேளாு, எ் ேமB அ்கைற ம்ு் அளி்Bா அ்ு கா்ிய
தாரி, ி்ரா்கா, எி், ிஃப், ்�ா் ம்ு் இமாு்ு் எ்ுை3ய மணமாண்்த
ந்ி. இைத தி்்ு, எ்ுை3ய பி்ி மாண�்கி் எ்ே\ா �ைB பய்பா்ி்்கான
ப்கி்ி்ு மனமா்்த ந்ி.
3ா்3். ெHௌ3ா ெப்ெH்ி-ேமா்ராி, ேபராிிய். பாிி் ிேளயி ம்ு் 3ா்3்.
யெ�ா்ி் ே�ரு் இு�ு்ு், உ்குை3ய அளி்Bா அ்ி்ு் ம்ு் எ்ீு
ெகா்3 தி்ப்3 அ்கைர்ு் ி்க ந்ி.
ஆர்பகாB்ி், எ் ிறைம ீு ந்ி்ைகை�்ு, எ்ைனஇ்த ுைன�் ப்3்பி்ு்ு
பி்ுைர்த ேபராிிய் ிெரெ3ி் ேக3், ேபராிிய். எ். யி்றா, ிு. ேகா்்்ி்
ுணீB் ம்ு் 3ா்3். ி்ிய் ஆிேயாு்ு எ் மனமா்்த ந்ி. எ்ுை3ய
ுதBா் ஆ்ி், ுத் ஒு மாத காB் எ்ிு ஆ்ு ூ3்ி் இு்ு ே�ைB ெ�்ய
அுமி்த ேபராிிய். எ். ீி�ா�் அ�்கு்ு எ் மனமா்்த ந்ி. எ்ுை3ய
மி்ுி்க ூ்த மாண�் ு�ரா் ம்ு் இதர எ்ிு �க ந்ப்கு்கி் உதி்ு்
எ் ந்ி. எ்ுை3ய ிெ3் ேதாிக் ெ�்ி, ிேBாினா, ீி ம்ு் ுமருு
அ�்கி் ஆ்ு க்ுைர ுு்கம �ிபா்்த் ம்ு் ெ�்்ந்ி ூுத் ஆ்ிB்
மா்ற்ி்கான ப்கி்ி்ு, எ் மனமா்்த ந்ி. எனு நB் ிு்ிக் அ்ு்Bா,
ேமாக், கேண், க்ண், ஆ்்ி, கUா, ிி, ே�ாு, ுு, ப்ி, க்ூி ந்ப்க்
ம்ு் அைன்ு ஆ்�க ந்ப்கி் ஊ்க்ி்ு், அ்ி்ு் எ் மனமா்்த
ந்ிிைனஇ்த மி்்ியான துண்ி் ெதிி்ு ெகா்ிேற்.
- மேக் ே�ு�ாி
Page 4 of 188

AcknowledgementsAssistance given by those who ne’er received our aid,
Is debt by gift of heaven and earth but poorly paid
-Thiruvalluvar
First and foremost, I would like to extend my sincere gratitude to lord murugan, my family for
holding my hands through things that make me nervous and for all the shoves when I needed them.
They include my father Velusamy, my mother Kasthuri, my brother Muthukumar, my sister Pappa,
my grandmother Kuruvammal, Meena, my brother Shanmugaraj, Periyappa and Periyamma.
I am also deeply indebted to my advisor, Professor Bernard Offmann who was the pillar of support
through the toughest emotional and financial times of my Doctoral studies. His amazing guidance
and care as an academic father were instrumental in motivating me towards success and without
him this thesis would not have been possible. I would also like to extend my gratitude to Professor
Frederic Cadet and Asst. Prof. Philippe Charton for their co-supervision. I have learnt so much from
the three of them, and not just in terms of academics.
I would like to thank my thesis committee members Professor Yves-henri Sanejouand and
Professor. Catherine Etchebest for giving moral support, valuable suggestions and immense ideas
helped me to improve my research day by day. Also, my special thanks to Professor Richard
Daniellou, Mme Irène Maffucci, Mme Corinne Miral for accepting to be part of my jury members.
I offer my profound gratitude to thank Professors Manuel Dauchez and Isabelle Andre for taking
their precious time to review my thesis. Also, my special thanks to our collaborator Professor Tom
Desmet and his student Dr. Tom Verhaeghe, whose thesis work served as basics for mine. Dr.
Philippe Arnaud and Dr. Lionel Hoffmann cannot thank you enough for all the insightful
contributions and wonderful help with GROMACS. My special thanks to Dr. Stephane Téletchea
for his many technical advices.
My thesis project took me to several places, one and the initial being Region La Reunion. I would
like to thank the entire Mr. Muthuswami and family, Noelly Madeleine and Professor Fabrice
Gardebien, with my accommodation and housing in La Reunion. I also cherish the wonderful
support and happy memories, that I had with my friends Avinash, Somasekar, Mekala, Max,
Marushka, Gaile, Aurora, Julie, Joana, Marine, Brice, Eddy, Elvina, Vigna, Akila, Anamya. A
Page 5 of 188

special mention to my siblings and friends from the AFIR Reunion Tamil community, brother
Senthil, sister Sundari, kids Janani and Haritha for the abounding love and care they shared on me.
My sincere gratitude goes to brothers Tharvesh, Bala, Gilbert, Sasidhar and Felix, who helped with
my accommodation in Paris and gave me many happy memories. My heartfelt thanks to all the
colleagues at DSIMB, Paris, especially Mr. Hubert, who provided many technical helps.
I wholeheartedly appreciate all the contribution of Benoit in helping me in with dissertation and his
guidance in parameterization work. I am also eternally grateful to Johann, Iyanar for sharing their
wisdom with me and providing priceless technical advices during the final year of my Ph.D. in
Nantes. Especially, my heartfelt thanks to Johann for his help in parameterization and plotting
puckering states. I am also greatly indebted to the help rendered by my friends Sneha, Surbhi and
Lipika who shared an important part of my joys and sorrows in Nantes and helped me with my
communication and proofreading of my thesis. Many thanks to my friends Maruthi, Dharani,
Sitraka, Enys, Typhaine, Chao, Alka, Harsh, Deepak and Iman who showered their love and
affection on me. I am also obliged to appreciate the help of the internship students for helping me
with the ENZO. I would like to say a very warm thank you to Dr. Houda Benhelli-Mokrani,
Professor Fabrice Fleury, Dr. Yvonnick Cheraud and all the members of UFIP for all your
graciousness and kindness towards me.
My personal thanks to Professor Yathindra Narayanarao, Mr. Goldsmith Kunaseelan and Dr. Lilian
Olivieri who pushed me towards this opportunity and had played a pivotal role in shaping my
educational career. I would also like to express my sincere gratitude to Professor Srinivasan
Narayanan who provided me the opportunity to work in the MBU research unit for a month and my
senior Yuvaraj and MBU colleagues who greatly supported me there. Many thanks to my friends
Selvi, Philomina and Kumaraguru who helped communicate this dissertation better. Finally, I would
like to sincerely thank all my well-wishers, Abdhulla, Mohan, Ganesh, Kannan, Aarthy, Kaja,
Nivetha, Sonu, Guru, Jeevitha, IST, my school, college and research group friends for their
inspiration, motivation and encouragement throughout my doctoral studies.
-Mahesh Velusamy
Page 6 of 188

This work was supported by the Conseil Reginal de La Reunion in the form of grant to Mahesh
VELUSAMY Tier N° D2014029434, Allocations Régionales de Recherche de Doctorate-session
2014. Further, I would like to thank for the computational resources provided by Université de
Nantes, CNRS UMR 6286, UFIP, 2 rue de la Houssinière, 44322 Nantes Cedex 3, France.,
Université de La Réunion, INSERM UMR-S 1134, DSIMB, 15 Avenue René Cassin, La
Reunion, France., Université Paris Diderot, INSERM UMR-S 1134, DSIMB, 6 rue Alexandre
Cabanel, 75739 Paris, France.
Page 7 of 188

அ்்பி்ிேற் ...
எ் ெப்ேறா், �ேகாதர், �ேகாதி, ுு�்மா் ஆ்தா, ீனா
ேபராிிய். எ். ய்ி்ிரா, ேபராிிய். ெப்னா்் Hாஃ்மா்
எ் ந்ப்க் ம்ு் உறின்க்
ெத்�்தா் ஆகா ெதிு் ுய்ித்
ெம்�ு்த் ூி து்.-ிு�்ு�்
To…
my Parents, Broher, Siser, kuruvammal grandma, Meena
Prof. N. Yahindra, Prof. Bernard Ofmann
my riends and relaives
hough fae-divine should make your labour vain;Efort its labour's sure reward wil gain.
-hiruvaluvar
Page 8 of 188

Table of Contents
Synopsis.............................................................................................................................................18Synopsis in English........................................................................................................................18 Synopsis in French........................................................................................................................21
Chapter 1 Literature review............................................................................................................231. GLYCOSYLATION: From Conventional Methods To Enzymatic Synthesis...........................23
1.1 Carbohydrates, Glycosides, and Glycoconjugates..............................................................231.2 Chemical synthesis of glycosides........................................................................................241.3 CAZymes: Carbohydrate-Active enZymes.........................................................................26
2. SUCROSE PHOSPHORYLASE...............................................................................................272.1 Classification Scheme.........................................................................................................272.2 General properties...............................................................................................................282.3 Crystal structure of SP and their associated reaction mechanism.......................................282.4 Conformational changes during sucrose conversion...........................................................322.5 Interest of sucrose phosphorylases......................................................................................35
3. GENERAL OBJECTIVES OF THESIS....................................................................................374. TOWARDS ENZyme Optimization (ENZO)............................................................................39
4.1 Selection of essential residues and design of a smart library..............................................404.2 Generating libraries of mutated sequences.........................................................................434.3 Modelling of variants and validation of models.................................................................444.4 Molecular dynamic simulations of mutant models.............................................................464.4.1 Calculation of electronic properties.................................................................................474.4.2 Carbohydrate force fields and employed software for simulations.................................484.5 Molecular docking of mutant models.................................................................................48
Chapter 2 Parameterization Of The Glucosylated Aspartate Residue And Their Successive Applications.......................................................................................................................................50
ABSTRACT...................................................................................................................................511. INTRODUCTION.....................................................................................................................522. MATERIALS AND METHODS...............................................................................................56
2.1. Construction of the glucosylated aspartate (DGC) residue................................................562.2. ESP partial atomic charge calculation................................................................................572.3. Derivation of DGC parameters using CGenFF following implementation in both MODELLER and GROMACS.................................................................................................572.4. Additional refinements on the problematic dihedral phases..............................................582.5. Obtention of DGC parameters using GLYCAM06 forcefield and implementation in GROMACS...............................................................................................................................592.6. Obtention of DGC forcefield parameters using GAFF for the AMBER ff99sb-ILDN and implementation in GROMACS.................................................................................................602.7. Benchmarking of the modified CHARMM22 forcefield extended with DGC parameters within MODELLER..................................................................................................................602.8. Benchmarking of the AMBER ff99sb-ILDN forcefield extended with the DGC force fieldparameters within GROMACS.................................................................................................612.9. Cremer-Pople puckering and binding site analysis............................................................62
3. RESULTS AND DISCUSSION................................................................................................633.1. Parameters of DGC residue................................................................................................633.2. Cremer-Pople puckering reference plot.............................................................................643.3. Refined dihedral phase.......................................................................................................653.4. The predicted conformations of two unknown covalent intermediate forms....................653.5. The results of benchmarking force field parameters through MODELLER......................67
Page 9 of 188

3.6. Molecular dynamics of DGC embedded structures...........................................................703.6.1. Results of CHARMM36 parameters...............................................................................713.6.2. Results of a general AMBER forcefield (GAFF) parameters alone...............................723.6.3. Results of mixed (GAFF and GLYCAM-06) parameters...............................................733.6.4. Results of GLYCAM-06 parameters along with glucosyl-threonine analogs.................74
4. CONCLUSIONS.......................................................................................................................775. SUPPLEMENTARY INFORMATION.....................................................................................78
Chapter 3 Rational explanation for observed transglucosylation regio-selectivity patterns of variants sucrose phosphorylase: perspectives for engineering rare sugars................................89
Abstract..........................................................................................................................................901. Introduction................................................................................................................................912. MATERIALS AND METHODS...............................................................................................94
2.1 Dataset of sucrose phosphoryalse variants..........................................................................942.2 Modelling of sucrose phosphorylase variants.....................................................................942.3 Benchmarking the role of environment...............................................................................952.4 Modelling of sucrose phosphorylase variants.....................................................................962.5 Supplementary experiments of mutate modeling................................................................972.6 Modeling of sucrose phosphorylase variants using automated comparative modeling usingautomodel..................................................................................................................................982.7 Molecular docking of sucrose phosphorylase variants against glucose..............................992.8 Construction of sucrose phosphorylase database and identification of reference product binding poses.............................................................................................................................992.9 Statistical analysis for productive orientations.................................................................100
3 Results.......................................................................................................................................1013.1 The glucosylated form of aspartate residue......................................................................1013.2 The preferred optimization region for sampling variants.................................................1013.3 Validation of mutate models and sampling assessment....................................................1023.4 Molecular docking results and sucrose phosphoryalse database......................................1033.5 Regioselectivity analysis of mutate models and the respective docking poses................1063.6 Validation of automodels and sampling assessment.........................................................1093.7. Regioselectivity analysis of automodels and the respective docking poses.....................110
4. Discussion................................................................................................................................1126. Supplementary informations....................................................................................................114
Chapter 4 ENZO: An Automated Computational Tool For Engineering Sucrose Phosphorylase Enzyme And Their Homologues..........................................................................125
ABSTRACT.................................................................................................................................1261. INTRODUCTION...................................................................................................................127
1.1 ENZO: An overview of the pipeline.................................................................................1291.2 ENZOWP1: Mutagenesis schemes for generating mutant sequence................................1301.3 ENZOWP2: Modeling of the 3D protein structures of the variants and its wild type sequence..................................................................................................................................1331.4 ENZOWP3: Energy minimizations of the 3D models......................................................1341.5 ENZOWP4A/B: Molecular docking of ligands in a protein structure model...................1351.6 ENZO: The web interface.................................................................................................135
2. MATERIALS...........................................................................................................................1372.1 Listing of the work packages inputs.................................................................................1372.2 Required softwares and hardware.....................................................................................1382.3 Equipment: setup...............................................................................................................139
3. PROCEDURE..........................................................................................................................1403.1 Accessing to the ENZO web interface..............................................................................1403.2 Generate a mutants library................................................................................................1413.3 Modelling of variants and their respective wild type structures.......................................142
Page 10 of 188

3.4 Energy minimization / molecular dynamics simulations of the mutant models...............1433.5 Molecular docking of acceptors in the minimized/non-minimized models......................144
4. TROUBLESHOOTING...........................................................................................................1445. TIMING...................................................................................................................................1456. ANTICIPATED RESULTS......................................................................................................1467. SUPPLEMENTARY INFORMATIONS.................................................................................147
Chapter 5 Conclusion and future perspectives............................................................................1511. DISCUSSION AND CONCLUSIONS...................................................................................1512. EXPLORATION OF THE SUCROSE PHOSPHORYLASE MUTATIONAL LANDSCAPE FOR ENGINEERING APPLICATIONS.....................................................................................153
2.1 Construction of smart library of variants..........................................................................1552.1.1 Selection of starting structure........................................................................................1552.1.2 Annotation of sucrose phosphorylase structure..............................................................1562.1.3 Identification of hot spot residues following filtration..................................................1592.1.4 Towards smart library based on stability and experimental data...................................1622.2 Generation of 3D models of smart library following characterization of individual mutantsusing molecular docking.........................................................................................................165
3. FUTURE PERSPECTIVES.....................................................................................................168References........................................................................................................................................171
Page 11 of 188

List of TablesChapter 1Table 1: Classification schemes for sucrose phosphorylases.............................................................27Table 2: List of interactions between highly conserved residues and the glucosyl moiety of sucrose phosphorylase of Bifidobacterium adolescentis.................................................................................31Table 3: The list of mutants that alter the selectivity of BaSP towards kojibiose and nigerose production...........................................................................................................................................37Table 4: Comparison of the three classical different enzyme engineering approaches......................40Table 5: List of available computational tools for smart library design.............................................41Table 6: The four different protein engineering strategies of Hotspots Wizard for the identification of hotspot residues..............................................................................................................................41Table 7: Comparison of methods employed for quantum mechanic calculations..............................46Chapter 2Table 1: Benchmarking results of DGC forcefield parameters using MODELLER..........................68Table 2: Distribution of individual puckering states of glucosyl moiety covalently linked to Asp nucleophile residue during MD simulations.......................................................................................70Table S1: List of the three tested MODELLER parameter sets.........................................................78Table S2: List of CGenFF parameters along with penalty score and the type of parameters............78Table S3: The list of DGC residue atom numbers, atom names, atom types and their respective ESP partial atomic charges.........................................................................................................................80Table S4: The list of four known covalent intermediate structures from glycoside hydrolase family 13 with ß-D-Glucose substrate covalently linked to a nucleophile Asp residue................................81Chapter 3Table 1: The list of mutants that alter the selectivity of BaSP towards kojibiose and nigerose production...........................................................................................................................................93Table 2. The statistics for number of models generated through the Mutate model method along with details of mutants and wild type.................................................................................................97Table 3: The statistics for number of models generated through the Automodel method along with details of used soft sphere restraint weights, mutants and wild type..................................................98Table 4: Global analysis of binding modes of α/β-D-Glucose acceptors based on mutate model...107Table 5: Global analysis of binding modes of α/β-D-methylglucosides based on mutate model....107Table 6: The detailed analysis of binding modes of α/β-D-Glucose acceptors based on mutate model ...................................................................................................................................108Table 7: Global analysis of binding modes of α/β-D-Glucose acceptors based on automodel........111Table 8: Global analysis of binding modes of α/β-D-methylglucosides based on automodel.........112Table 9: The detailed analysis of binding modes of α/β-D-Glucose acceptorbased on automodel..........................................................................................................................112Table 10: The detailed analysis of binding modes of α/β-D-Glucose acceptors based on automodel and mutate model..............................................................................................................................113Table S1: The list of tested mutants and their associated total number models and docking poses with respect to α/β-D-Glucose acceptors..........................................................................................116Table S2: The list of tested mutants and their associated total number models and docking poses with respect to α/β-D-methylglucosydase acceptors........................................................................117Table S3: Classical DOPE SCORE analysis for productive orientation with respect to β-D-Glucose acceptor.............................................................................................................................................117Table S4: The frequency of productive binding poses based on RMSD with respect to β-D-Glucose acceptor.............................................................................................................................................118Table S5: The frequency, Average (Avg) and Standard deviation (STD) of productive poses based on highest binding energy with respect to β-D-Glucose acceptor....................................................120Table S6: The frequency of productive binding poses based on top rank pose with respect to β-D-Glucose acceptor...............................................................................................................................121
Page 12 of 188

Table S7: Comparison of puckering states (1S3,4C1, B36) counts across the models of 11 different experiments based soft sphere restraint weight................................................................................122Table S8: The distribution of RMSD at soft sphere weight 10 with respect to the wild types 2gdv_A and 5c8b............................................................................................................................................125Table S9: The list of tested mutants and their associated total number models and docking poses with respect to α/β-D-Glucose acceptors..........................................................................................125Table S10: The list of tested mutants and their associated total number models and docking poses with respect to α/β-D-methylglucosidase acceptors.........................................................................126Chapter 4Table 1: ENZO pipeline example files, modeller libraries and modified forcefield that are incorporated with DGC residue........................................................................................................140Table 2: The list of trouble shooting from the case studies..............................................................146Chapter 5Table 1: The list of available 3D structures of sucrose phosphorylase from Bifidobacterium adolescentis where 1R7A and 2GDV is wild-type active form and 2GDU is inactive mutant form.........................................................................................................................157Table 2: Comparison of four different engineering strategies of HotspotWizard to identify potential the mutable positions and design library..........................................................................................158Table 3: The list of initial functional hot spots.................................................................................161Table 4: The list of 20 positions from the initial 39 functional hot spots (FUH) following three filtrations...........................................................................................................................................162Table 5: The details of stability criteria’s along with the range of ΔΔG values and the correspondingnumber of mutants associated..........................................................................................................165
Page 13 of 188

List of Figures
Chapter 1Figure 1: Examples of monosaccharides (A), disaccharides (B) and polysaccharides (C)................24Figure 2: (A) Conversion of glucose to methyl glucoside in Fischer glycosidation using (TMS-CL) trimethylsilyl chloride as the catalyst. (B) Synthesis of alkyl or aryl O-glycosides in Koenigs-Knorr glycosidation reaction upon substituting the glycosyl halides by alcohol or phenols in the presence of heavy metals or Lewis acids..........................................................................................................25Figure 3: Illustration of four different types of CAZymes owing to their respective reactions with sucrose................................................................................................................................................26Figure 4: Structure of bacterial sucrose phosphorylases....................................................................29Figure 5: Schematic representation of the main structural rearrangements observed in sucrose phosphorylase from Bifidobacterium adolescentis (BaSP) during sucrose conversion.....................33Figure 6: The homologues and mutant version of sucrose phosphorylase structures........................35Figure 7: Possible transglucosylation products of sucrose phosphorylases when glucose is used as acceptor...............................................................................................................................................36Figure 8: Overview of the different approaches used to reach the objectives of the thesis...............39Figure 9: Typical scheme followed for the study of protein-carbohydrate complexes using moleculardynamics simulation...........................................................................................................................46Chapter 2Figure 1: The role of glucosylated aspartate residue (termed as DGC) in the reaction mechanism catalyzed by sucrose phosphorylase. .................................................................................................52Figure 2: (i) The structural representation of the sucrose phosphorylase reaction (left) and (ii) their consecutive structural rearrangements (top right) along with the list of comparative structures (iii) (bottom right)......................................................................................................................................54Figure 3: Illustration of the protocol used in parameterization and implementation of DGC residue using CHARMM22 (a), GAFF (b), GLYCAM (c) and CHARMM36 (d)............................................56Figure 4: Comparison of native (blue) and constrained (green) conformations of DGC residues.. .58Figure 5: The representation of DGC residue...................................................................................63Figure 6: Reference Cremer-Pople puckering plots...........................................................................64Figure 7: Comparison of four selective structure and their key interactions. (A) Corresponds to the superimposition of 1s46_A (white) and 2gdv_A (green)....................................................................66Figure 8: The distribution of individual puckering states and their respective energy spots on Cremer-Pople puckering chart...........................................................................................................69Figure 9: Analysis of puckering states of glucosyl moiety covalently linked to Asp during MD simulations.(CHARMM36)................................................................................................................71Figure 10: Analysis of puckering states of glucosyl moiety covalently linked to Asp during MD simulations.(GAFF)............................................................................................................................72Figure 11: Analysis of puckering states of glucosyl moiety covalently linked to Asp during MD simulations.( GAFF and GLYCAM-06).............................................................................................73Figure 12: Analysis of puckering states of glucosyl moiety covalently linked to Asp during MD simulations.(GLYCAM-06 + glucosyl-threonine analogs)................................................................75Figure 13: Interactions observed in MD snapshots key for determining the puckering states of the covalently-linked glucosyl moiety......................................................................................................76Figure 14: The graphical representation of distance variations of two important interactions with respect to three selective puckering states.........................................................................................77Figure S15: The distributions of dihedral values using 100 models at two different phases 0.00 (A) and 109.4 (B)......................................................................................................................................82Figure S16: Multiple structure alignment of four known covalent intermediate binding sites of glycoside hydrolase 13 family.............................................................................................................82Figure S17: The presence of HBONDS and van der waals interactions associated between all the individual binding site residues and ß-D-Glucose of four covalent intermediate structures.............83
Page 14 of 188

Figure S18: The presence of HBONDS associated with water molecules, binding site residues and ß-D-Glucose of four covalent intermediate structures.......................................................................84Figure S19: The equilibrations (NVT, NPT), radius of gyration and Root Mean Square Deviation of DGC incorporated covalent intermediate structures over 500-ps, 1ns and 100ns molecular dynamics simulation using CHARMM36 parameters........................................................................85Figure S20: The graphical representation of the stability of system at equilibration (NVT and NPT) and the equilibrations (NVT, NPT), radius of gyration and Root Mean Square Deviation of DGC incorporated covalent intermediate structures over 500-ps, 1ns and 100ns molecular dynamics simulation using GAFF parameters...................................................................................................86Figure S21: The equilibrations (NVT, NPT), radius of gyration and Root Mean Square Deviation of DGC incorporated covalent intermediate structures over 500-ps, 1ns and 100ns molecular dynamics simulation using combination of both GLYCAM and GAFF parameters..........................87Figure S22: The equilibrations (NVT, NPT), radius of gyration and Root Mean Square Deviation of DGC incorporated covalent intermediate structures over 500-ps, 1ns and 100ns molecular dynamicssimulation using GLYCAM06 parameters.........................................................................................88Chapter 3Figure 1: Overview of the three different phases of our methodological approach used in this study................................................................................................................................94Figure 2: Representation of single DGC residue.............................................................................101Figure 3: Comparison of different different optimization environment in the context of replicating Tyr344 repositioning (on top) and sampling size based on RMSD distribution (bottom)................102Figure 4: Comparison of three different protocol used in the sampling of selective SP variants....103Figure 5: The reference productive poses for α-D-glucose and β-D-glucose acceptors..................105Figure 6: Towards the implementation of global optimization in mutate models............................108Figure S7: The distribution of RMSD and DOPE SCORE of mutate models and their respective wild types. The distribution shown for all the kojibiose and nigerose selectivity mutants with the number of 100 models......................................................................................................................114Figure S8: The reference productive poses for α-D-Methylglucosidase and β-D-Methylglucosidase acceptors...........................................................................................................................................117Figure S9: Docking of β-D-glucose in to the double optimized mutant (Q345F) model shows the consequence of losing minimal distance between His234-DGC192(O2). It leads to form narrow binding site and doesn’t allows the glucose acceptor inside the pocket...........................................120Figure S10: The distribution of puckering states (1S3,4C1, B36) based on the Cremer-Pople puckering energy plot (shown only for software restraint weight 10). (Cyan: 1S3; Red: 4C1; Yellow:B36 which is identical puckering state of 1S3)................................................................................121Figure S11: The distribution of RMSD (with respect to Model no1) and DOPE SCORE at soft sphere weight 10...............................................................................................................................121Figure S12: Distance scheme (in ranges) for regioselectivity analysis on mutate models...............123Figure S13: Distance scheme (in ranges) for regioselectivity analysis for automodel method.......124Chapter 4Figure 1: The list of available modules of the ENZO web application. (DGC: Glucosylated covalentaspartate residue; STD: standard aspartate residue; WP: Work Packages)...................................128Figure 2: The home page of the ENZO web interface.....................................................................136Figure 3: Graphical representation of the ENZO............................................................................136Figure 4: Example of job submission page of a given work package..............................................137Figure 5: Overview of the ENZO architecture and the external directories containing the MODELLER (A) and GROMACS (B) libraries which have been modified to accommodate the parameters of the glucosyl-aspartate (DGC) residue......................................................................140Figure 6: Example access to the outputs from the job submission page (A) or from the general user workspace page (B)..........................................................................................................................142Figure S7: Example of input submission for the mutagenesis scheme protocols.............................147
Page 15 of 188

Figure S8: Example of input submission forms of ENZOWP2A (A), ENZOWP2B (B), ENZOWP2C (C) (the inputs were uploaded from local system)............................................................................148Figure S9: Example of input submission forms of ENZOWP2A (A), ENZOWP2B (B), ENZOWP2C (C) (the inputs were redirected output from previous packages)......................................................149Figure S10: Example input submission (redirected output from previous packages) forms of ENZOWP3 (A), ENZOWP4A (B) and ENZOWP4B (C)...................................................................150Chapter 5Figure 1: Comparison of sucrose phosphorylase structures from Bifidobacterium adolescentis basedon superimposition (A) and RMSD deviation based on multiple structure alignment (B)..............156Figure 2: Graphical representation of protein engineering strategies namely functional hot spots (A), stability hot spots corresponding to sequence conservation (B) and correlated hotspots (C). (SC: sequence conservation)............................................................................................................158Figure 3: The identified catalytic pocket (left) and tunnel (right) using Hotspot Wizard3.0...........158Figure 4: Cross validation of identified 24 hot spots with experimental data..................................163Figure 5: The over view of mutant library after the three filtrations steps and stability prediction.165Figure 6: Specific activities of selective positions which are experimentally shown to have less activity for sucrose and Glucose-1-phosphate71...............................................................................166Figure 7: The comparison of docking results of sucrose compounds (rigid and flexible) against wild type (1R7A) and mutant version (2GDU) of SP using AutoDockVina and Vina-Carb...................167Figure 8: The future pipeline for regioselectivity prediction............................................................168
Page 16 of 188

List of Schemes
Chapter 1Scheme 1: The type of carbohydrates along with few examples........................................................23Scheme 2: Schematic representation of sucrose phosphorylase double displacement reaction mechanism..........................................................................................................................................30Chapter 2Scheme 1: Large panel of rare disaccharide sugars associated with sucrose phosphorylase transglucosylation function using glucose acceptors.........................................................................92Scheme 2: Illustration of statistical schemes for identify the productive docking poses.................100Chapter 3Scheme 1: A workflow of ENZO pipeline for engineering sucrose phosphorylase enzyme as well as general protein mutation, structure and functional associated studies.............................................129Scheme 2: Example usage of the scanning (A) and the site saturation mutagenesis (B).................130Scheme 3: Examples of usage of the random mutagenesis functionality with respect to the use of a user-defined mutation rate (Cii) or a default random seed (Ci).......................................................131Scheme 4: Examples of usage of the site directed (D) and combinatorial mutagenesis (E) functionalities...................................................................................................................................132Chapter 5Scheme 1: Overview of the modelling pipeline used to engineer the regioselectivity of sucrose phosphorylases.................................................................................................................................154
Page 17 of 188

Synopsis
Synopsis in EnglishTo date, the applications of carbohydrates for the industrial exploitation is enormous because of
their abundance in nature with versatile group of organic compounds. They are widely used in
various industries such as food (low-calorie sweeteners, prebiotics), cosmetics (sulfated
polysaccharides from seaweeds), pharmaceuticals (building blocks for anti-cancer and anti-viral
drugs), bio-degradable packaging materials (PLA-polylactide from the renewable resources such as
starch and sugar), textiles and paper etc. Conjugating carbohydrates to another molecule also
commonly used for improve its stability, solubility and bioavailability. However, the advances in
commercial exploitation of interesting carbohydrates and glycosylated compounds are hindered by
their insufficient amount in nature. Therefore, an efficient alternative synthesis technologies that use
readily available starting materials with less expensive are highly desirable.
In that respect, compared to other commonly used traditional chemical technologies (Koenigs-knorr
reactions, Fischer glycosidation etc.). Enzyme-mediated synthesis of glycosylated compounds is a
better alternative and eco-efficient because of their regio- and stereospecificity. In accordance,
sucrose phosphorylase (EC 2.4.1.7) enzyme is one of the most interesting biocatalyst for exploiting
industrial applications due to its unique transglucosylation function with broad acceptor specificity
and its sucrose utilization as a donor substrate. However, the use of sucrose phosphorylase is
hampered by its poor specificity or selectivity towards any alternative acceptors. Afore concerns
have been improved by the combination of insilico and in vitro techniques. There are no efficient
computational strategies available to enhance the existing protocols by directly incorporating
covalent glucosylated aspartate residue in the computational theoretical structures.
The derivation of non-standard amino acid residue forcefield parameters is often a cumbersome task
to perform prior to computational modeling and simulations. Thus, the successful addition of a new
residue type in forcefield libraries is undoubtedly necessary for further computational studies of
proteins carrying such modified residues. In Chapter 2, we present our strategy to derive the force
field parameters of the glucosylated aspartate residue (DGC) as observed in the crystal structure of
the sucrose phosphorylase enzyme from Bifidobacterium adolescentis. Accordingly, we
parametrized the DGC residue for both CHARMM and AMBER ff99sb-ILDN force fields and
implemented these parameters within MODELLER and GROMACS respectively. Subsequently,
we have also shown that our parameters were efficient in terms of reproducing the models as in
crystal structures using modeller and MD simulations.
Page 18 of 188
In Chapter 3, we have applied our modified forcefield and parameters to provide a rational
explanation on the observed switch of transglucosylation regioselectivity of some recently reported
sucrose phosphorylase variants. Towards the end, we built models of selective variants that were
shown to change the regioselectivity of the enzyme towards rare sugars such as kojibiose and
nigerose production. All the models were built in covalent intermediate form using both mutate
model and automodel methods in combination with different optimization protocols. Subsequently,
molecular docking studies were conducted on the wild type enzyme and the respective variants
against both α/β-D-glucose to predict the preferred orientation of the acceptors in the +1 site. The
preferred orientations of α/β-D-glucose in this +1 site were compared and we have shown that our
studied variants indeed displayed a preferred binding mode for the acceptor that could explain the
selectivity for maltose, kojibiose and nigerose production.
Subsequently in Chapter 4, an automated web application called ENZO is presented for the Glyco-
enzymology community with the list of packages incorporated with DGC residue. By which one
can create a plethora mutant library for sucrose phosphorylase enzyme from a given FASTA file
(WP1) and perform a set of experiments on them. These involve modeling of variants (WP2),
energy minimization (WP3) and molecular docking (WP4A/B) of mutant models. It is noteworthy
that ENZO modules have been designed to work with both standard aspartate (D) residue as well as
modified glucosylated aspartate residue (DGC). As a viable outcome, a step-by-step guidance
according to the standardized protocol (Chapter 3) is presented for the community to screen the
putative mutants of sucrose phosphorylase using ENZO. Further, we envisage that this can be also
be useful to a broader community working in the field of protein engineering.
Lastly, in Chapter 5, we employed our ENZO web tool to conduct large-scale mutagenesis
experiments to gain in-depth insights on how mutations impaired sucrose binding, alter binding
modes of the α and β anomers of glucose or methyl-glucoside, hence alter regioselectivity. In this
regard, we have also tried to incorporate external tools such as HotspotWizard, FoldX respectively
for selecting hotspot residues and predicting (de)stabilizing mutations to design pertinent libraries
of variants for use in ENZO. Further, the results of respective works are considered in larger
framework and future prospects in the existing field of glycobiology are discussed.in in-depth
insights on how mutations impaired sucrose binding, alter binding modes of the α and β anomers of
glucose or methyl-glucoside, hence alter regioselectivity. In this regard, we have also tried to
incorporate external tools such as HotspotWizard, FoldX respectively for selecting hotspot residues
and predicting (de)stabilizing mutations to design pertinent libraries of variants for use in ENZO.
Further, the results of respective works are considered in larger framework and future prospects in
the existing field of glycobiology are discussed.in in-depth insights on how mutations impaired
Page 19 of 188

sucrose binding, alter binding modes of the α and β anomers of glucose or methyl-glucoside, hence
alter regioselectivity. In this regard, we have also tried to incorporate external tools such as
HotspotWizard, FoldX respectively for selecting hotspot residues and predicting (de)stabilizing
mutations to design pertinent libraries of variants for use in ENZO. Further, the results of respective
works are considered in larger framework and future prospects in the existing field of glycobiology
are discussed.
Page 20 of 188

Synopsis in French
De nos jours, l’application des glucides pour l’exploitation industrielle est considérable, car ceux-ci
sont abondants dans la nature et possèdent une variété de groupes de composés organiques. Ils sont
largement utilisés dans des industries variées, telles que l’agroalimentaire (sucrants à faible calorie,
prébiotiques), la cosmétique (polysaccharides sulfatés extraits d’algue), la pharmaceutique
(élaboration de médicaments anti-cancer et anti-virale), des matériaux d’emballage bio-dégradable
(PLA-polylactide extrait de ressources renouvelables telles que l’amidon et le sucre), le textile, le
papier, etc. Très souvent, les glucides sont combinés à d’autres molécules pour améliorer leur
stabilité, leur solubilité et leur bio disponibilité. Cependant, les avancées dans l’exploitation
commerciale des glucides et de composés glycosylés d’intérêts sont limitées par leur quantité
insuffisante dans la nature. Par conséquent, une technologie de synthèse alternative efficace,
utilisant un matériau de départ facile à obtenir et à prix rentable, est hautement désirable.
A cet effet, comparées aux autres technologies chimiques traditionnelles (Réaction de Koenigs-
knorr, Glycosylation de Fischer, etc.), la synthèse à médiation enzymatique de composés glycosylés
est une meilleure alternative et possède aussi une éco efficacité à cause de leur régio- et
stéréospécificité. Ainsi, l’enzyme de la sucrose phosphorylase (EC 2.4.1.7) est, grâce à sa fonction
de transglucosylation unique avec de multiples accepteurs spécifiques et aussi son utilisation du
sucrose comme donneur de substrat, l’un des biocatalyseurs le plus intéressant pour être appliqué en
industrie. Cependant, l’utilisation de la sucrose phosphorylase est limitée par sa faible activité et sa
faible stabilité envers d’autres accepteurs alternatifs. Récemment, ce problème a pu être amélioré, et
ce en combinant les techniques in silico et in vitro. Il n’y a pas de stratégie informatique efficace et
disponible pour améliorer les protocoles déjà existant dans le but d’incorporer directement les
résidus aspartate glycosylés, de manière covalente, dans les structures théoriques informatiques.
La dérivation de paramètre du champ de forces d’acide aminé non standard est souvent une lourde
tâche afin d’effectuer les modélisations et simulations informatiques. Ainsi, l’addition réussie d’un
nouveau type de résidu dans les bibliothèques de champ de forces est sans aucun doute nécessaire
pour faire des études informatiques plus approfondis de protéines contenant ces résidus modifiés.
Dans le chapitre 2, nous présentons notre stratégie pour dériver les paramètres du champ de forces
du résidu aspartate glycosylé (DGC), comme observé dans une structure cristallographique de
l’enzyme sucrose phosphorylase chez Bifodobacterium adolescentis. Par conséquent, nous avons
paramétré le résidu DGC pour les deux champs de forces CHARMM et AMBER ff99sb_ILDN et
avons incorporé ces paramètres respectivement dans MODELLER et GROMACS. Par la suite, nous
Page 21 of 188
avons également montré que nos paramètres étaient efficaces en termes de répétabilité, comme dans
la structure cristallographique, en utilisant les modélisateurs et les simulations MD.
Dans le chapitre 3, nous avons appliqué notre champ de forces modifié et ses paramètres pour
fournir une explication rationnelle sur le switch observé de la régiosélectivité de la
transglucosylation de sucrose phosphorylase variantes récemment signalés. Vers la fin, nous avons
construit des modèles de variants sélectionnés qui ont montré un changement dans la
régiosélectivité d’enzymes envers des sucres rares comme la kojibiose et la nigerose. Tous les
modèles ont été construit sur des formes covalentes intermédiaires en utilisant à la fois un modèle
mutant et des méthodes de modèles automatisés en combinaison avec différents protocoles
d’optimisation. Ainsi, les études de docking moléculaire ont été mené sur une enzyme sauvage et
sur ses variants respectifs, dirigés contre α/β-D-glucose afin de stimuler l’entrée dans son accepteur
en son site +1. Les orientations préférentielles des α/β-D-glucose dans le site +1 ont été comparé et
en effet, nous avons montré que tous les variants étudiés ont montré un mode de liaison préférentiel
avec l’accepteur, ce qui pourrait expliquer la sélectivité pour la production de maltose, de kojibiose
et de negeriose.
Par la suite, au chapitre 4, un site internet automatisé, appelé ENZO, est présenté avec la liste des
packages incorporée avec le résidu DGC, pour la communauté des glycoenzymologistes. Ainsi, peut
se créer une bibliothèque abondante de mutants pour le sucrose phosphorylase obtenu à partir d’une
séquence FASTA (WP1) et s’effectuer une série d’expérience sur eux. Cela implique des
modélisations des variants (WP2), la conservation d’énergie (WP3) et le docking moléculaire
(WP4A/B) des modèles mutants. Il est intéressant de savoir que les modules ENZO ont été élaboré
pour fonctionner avec à la fois un résidu aspartate standard et un résidu asparatyl glycosylé (DGC).
Comme résultat viable, un protocole standardisé décrivant pas à pas les étapes (Chapter 3) est
présenté à la communauté pour cribler les mutants putatifs de sucrose phosphorylase en utilisant
ENZO. De plus, nous envisageons que cela puisse être également utile pour une communauté plus
large travaillant dans l’ingénierie des protéines. Enfin, dans le chapitre 5, nous avons utilisé notre
outil web ENZO pour entreprendre des expériences de mutagénèse à grande échelle dans le but de
mieux comprendre comment les mutations altèrent la liaison au sucrose, modifient les modes de
liaison des anomères α et β du glucose ou de glucosides méthylés, changeant ainsi la
régiosélectivité. A cet effet, nous avons aussi essayé d’incorporer des outils externes tels que
HotspotWizard et FlodX afin de choisir respectivement des résidus sensibles et prédire des
mutations (de)stabilisantes pour élaborer des bibliothèques pertinentes de variants dans l’utilisation
d’ENZO. Pour finir, nous discutons des résultats des travaux pour un cadre plus large et de futures
perspectives dans le domaine existant de la glycobiologie.
Page 22 of 188

Chapter 1Literature review
1. GLYCOSYLATION: From Conventional Methods To Enzymatic Synthesis
1.1 Carbohydrates, Glycosides, and Glycoconjugates
Carbohydrates are also known as sugars and consist of aldehydes and ketones with multiple
hydroxyl groups. They are further classified as monosaccharides, disaccharides, oligosaccharides,
and polysaccharides (Scheme 1). Monosaccharides are the simplest form of sugars that usually
contains three to seven carbon atoms. A monosaccharide classically adopts either a linear or ring-
shaped structure (Figure 1A). Di- or oligosaccharides consist of 2-10 monosaccharide units linked
by glycosidic bonds upon condensation. Sucrose, lactose and maltose are the most common
disaccharides which are composed of two monomeric units connected by a glycosidic bond (Figure
1B). Similarly, inulin and cyclodextrins are some of the best-known examples of oligosaccharides.
Polysaccharides are made out of more than 10 monosaccharide units and are also known as glycans.
They exist in homo/hetero forms of monosaccharides and can form either branched (e.g., starch,
glycogen) or unbranched (e.g., cellulose in Figure 1C) structures1. A glycosidic bond is a type of
covalent bond that can also link monosaccharides or oligosaccharides to non-sugar groups
(aglycones) to form glycosides1. Similarly, carbohydrate molecules that are chemically linked to
other compounds such as proteins or lipids called glycoconjugates2.
Scheme 1: The type of carbohydrates along with few examples.
Glycosides and glycoconjugates are abundantly available on earth. They are involved in a range of
functions. For instance, oligosaccharides can perform as signaling molecules in plants (e.g.,
oligosaccharins) while they can also trigger the immune system in animals (e.g., human milk
oligosaccharides)3,4. Polysaccharides are well known to act as an energy source (e.g., amylose) or as
structural components such as cellulose and chitin5. Glycoconjugates are described to constitute
Page 23 of 188

various recognition motifs such as the blood group determinants or to provide surfactant properties
(e.g., rhamnolipids or sophorolipids)6. Besides, linking sugar moieties can alter activity of their
respective aglycones: glycosylation is known to alter the spectrum of the activity of antibiotic7 and
in the case of naringin, it affects the bitterness of grapefruits8.
Figure 1: Examples of monosaccharides (A), disaccharides (B) and polysaccharides (C).
1.2 Chemical synthesis of glycosides
The above examples demonstrate that the synthesis of glycosidic compounds is of significance for
the pharmaceutical, cosmetics and food industries. Glycosides are classically synthesized using
conventional chemical techniques. The widely used Fischer glycosidation involves a reaction
Page 24 of 188

between an aldose/ketose and an alcohol in the presence of an acid catalyst (Figure 2A). In the
extensively used Koenigs-Knorr method (on of the oldest protocol, used since from 1901),
alkyl/aryl O-glycosides are synthesized in the presence of heavy metals or Lewis acids following
the substitution of glycosyl halides by alcohol/phenols (Figure 2B). In general, glycosyl chlorides
and bromides are used in the Koenigs-Knorr reaction. Only recently were iodides used as glycosyl
donors. Apart from these methods, there are also many other glycosidation reactions that make use
of different donor substrates such as glycosyl acetates, glycosyl trichloroacetimidates, and
thioglycosides9–13.
Figure 2: (A) Conversion of glucose to methyl glucoside in Fischer glycosidation using (TMS-CL)
trimethylsilyl chloride as the catalyst. (B) Synthesis of alkyl or aryl O-glycosides in Koenigs-Knorr
glycosidation reaction upon substituting the glycosyl halides by alcohol or phenols in the presence
of heavy metals or Lewis acids.
However, achieving selective formation of a glycosidic bond using the above methods is still an
uphill walk with many drawbacks. For instance, preparation of glycosyl halides in Koenigs-Knorr
reaction require severe conditions (e.g., thermally not stable) and also experience with hydrolysis.
Besides, the co-activators used in Koenigs-Knorr method is often toxic and explosive. On the other
hand, the reliability of protection strategies involved in other synthetic pathways are also very poor
and consist of multistep protocol resulting in overall low yields with a lot of waste13–22.
Page 25 of 188

1.3 CAZymes: Carbohydrate-Active enZymes
Enzymes that display activity towards formation or breakdown of glycosidic bonds are collectively
called "Carbohydrate-Active enZymes" (CAZymes). Different enzymes are at play behind the
chemical reactions that breakdown glycosidic bonds: hydrolysis is performed by glycoside
hydrolases, phosphorolysis by glycoside phosphorolases, redox reactions by lytic polysaccharide
mono-oxygenases and beta-elimination by polysaccharide lyases23. On the other hand,
glycosyltransferases and transglycosidases are the enzymes usually found behind the formation of
glycosidic bonds24.
Figure 3: Illustration of four different types of CAZymes owing to their respective reactions withsucrose.
Synthesis of sucrose by sucrose synthase (GT) which can be further converted into amylose byamylosucrase, a transglycosidase (TG) or converted to either glucose-1-phosphate by sucrosephosphorylase (GP) or glucose by sucrose hydrolase (GH).
In general, these CAZymes are known to catalyze glycosyl transfers and are classified into four
different categories25 (see Figure 3). First, a large number of glycosylation reactions in nature is
exploited by glycosyltransferases (GTs) that commonly use nucleotide-activated sugars as glycosyl
donor. Similarly, synthesis of saccharides by transglycosidases (TGs) consist of the transfer of
glycone moieties between carbohydrate chains. On the other hand, Glycoside Hydrolases (GHs)
and Glycosyl Phosphorylases (GPs) catalyze the degradation of glycosidic bonds using the acceptor
substrates water and inorganic phosphate respectively. With respect to synthetic applications,
Page 26 of 188

CAZymes are reputed to be as an efficient as the chemical synthetic reactions mentioned above and
even sometimes a better alternative. Indeed, it has been shown that by the use of appropriate
enzymes, glycosylation reactions generated up to five times less waste and up to fifteen times
higher space-time yield, accordingly improving the eco-efficiency tremendously26,27. In that respect,
sucrose phosphorylase (SP) is probably one of the most interesting class of biocatalysts for
industrial applications28. In this thesis, we have considered SP’s as a study model. This class of
enzyme is further described in the following sections.
2. SUCROSE PHOSPHORYLASE
2.1 Classification Scheme
Sucrose phosphorylase (SP) is a class of bacterial enzymes that plays a crucial role in sucrose
metabolism and is notoriously known for reversibly catalysing the phosphorolysis of sucrose:
sucrose + phosphate = D-fructose + α-D-glucose-1-phosphate29,30. This reaction leads to the
production of essential glucose moieties from sucrose. According to the classification of IUBMB
and enzyme commission, SP belongs to the class of transferases and particularly to the
glycosyltransferases/hexosyltransferases subgroup that catalyze the transfer of hexosyl groups. It
comes under the enzyme number EC 2.4.1.731.
Table 1: Classification schemes for sucrose phosphorylases
IUBMB and Enzyme commission* CAZy database#
EC 2.4.1.7 Enzyme entry GH13 Family (Glycoside hydrolase)
EC 2 Class (Transferases) GH13-18 Subfamily
EC 2.4 Subclass (glycosyltransferases)
EC 2.4.1 Sub-subclass (Transfer hexosyl group)*IUBMB International Union of Biochemistry and Molecular biology; #CAZy: Carbohydrate-ActiveenZymes
It is placed in the CAZy database in the retaining glycoside hydrolase family 13 (GH13) also known
as α-amylases family23,32. This family mainly contains α-amylases but is also associated with a
specific group of enzymes that use sucrose as substrate or catalyze transglucosylation reactions
from amylose. Because of its large size, GH13 family is divided into subfamilies on the basis of
their sequence and functional similarities. Sucrose phosphorylases narrow down to a distinctive
subfamily named GH13_1832. The classification of SP’s is summarized in Table 1.
2.2 General properties
In early 1940s, an intracellular enzyme SP was independently discovered in Leuconostoc
mesenteroides33–37 and Pleomonas/Pseudomonas saccharophila by Kagan (1942) and Doudorff
Page 27 of 188

(1943) teams30 respectively. Subsequently, it was found in many other microorganisms such as
Streptococcus mutants38–40, Bifidobacterium adolescentis41, Bifidobacterium longum42, Lactobacillus
acidophilus43,44, and in the meta-genomes analyses of sucrose-rich environments45. In the above-
mentioned species, most of them contained a ~400-500AA functional monomer or dimer that
catalyze an equilibrium reaction with an equilibrium constant Keq of about 5.6 at 30°C, pH 7.046.
SP’s can thus be utilized for both assembly and breakdown of sucrose. In vivo, the enzyme has a
catabolic role in the cell because of the higher concentration of phosphate compared to glucose-1-
phosphate28. Besides, since the phosphorolysis reaction catalyzed by SP’s does not require ATP and
yields products that can be directly be used in glycolysis, it can be viewed as an energy-saving
cellular process29. The optimal temperatures (30-37°C) and pH (6.0-7.5) of bacterial SP’s reflect the
growth conditions of their hosts exception made of SP from Bifidobacterium adolescentis which has
an optimal temperature of 58°C47.
2.3 Crystal structure of SP and their associated reaction mechanism
Sucrose phosphorylases are 54-60 kDa enzymes comprised of 480-504 residues48,49. As shown
biochemically, they are generally monomeric while sucrose phosphorylase from Bifidobacterium
adolescentis (BaSP) is homodimeric41. The only SP three-dimensional structures solved by X-ray
crystallography available to date are that of BaSP50. The wild-type (PDB 1R7A and 2GDV)
enzyme as well as two mutated forms (PDB 2GDU and 5C8B) all crystallize in its homodimeric
form. Each chain is characterized by four domains named A, B, B' and C (Figure 4A). Domain A
forms the major part of the monomeric structure and is characterized by a (β/α)8-barrel fold that
constitutes the catalytic domain. Subsequently, the architecture of the catalytic site is maintained by
loops from domains B and B’ which additionally contains two short antiparallel β-sheets/α-helices
and coil regions respectively. The corresponding loops also play a role in substrate specificity.
Dimer interactions occur mainly at the level of the B domain. Domain B’ controls the size of the
substrate access tunnel and oligosaccharide binding50. The three domains A, B and B’ are common
to all GH13 enzymes whereas the domain C is unique to sucrose active members. This domain
contains typically 5 stranded antiparallel β-sheets and play a crucial role in the stabilization of the
catalytic domain and facilitate substrate binding51–53. However, the function of this domain remains
obscure in sucrose phosphorylase. Interestingly, in one of the four crystal structures of the native
enzyme (PDB 2dgv), one of the two chains features the covalent glycosyl-enzyme intermediate
(chain A in Figure 4B) while the other features non-covalent (chain B in Figure 4C) forms. It
reflects the general mechanism of the enzyme. Indeed, enzymes from the glycosyl hydrolase family
13 undergo a double-displacement reaction mechanism via the formation of covalent glucosyl-
enzyme intermediate54.
Page 28 of 188

Figure 4: Structure of bacterial sucrose phosphorylases.
Shown in (A) is the overall three-dimensional structure of sucrose phosphorylase fromBifidobacterium adolescentis (PDB 1R7A) featuring its constitutive domain organization. In (B) isshown the catalytic site displaying the covalent glucosyl-enzyme intermediate as observed in chainA of PDB 2GDV and in (C) the catalytic site of the non-covalent form of the enzyme bound toglucose, the product resulting of the hydrolysis of the sucrose substrate. Catalytic residues (D192and E232) are shown in green sticks, conserved residues among sucrose-active enzymes in yellowsticks, and glucosyl moiety as white ball/stick.
SP also follows the same reaction mechanism (see Scheme 2)55. The reaction is initiated by the
concomitant nucleophilic attack of the anomeric carbon of the glucosyl moiety and protonation of
the oxygen of the glycosidic linkage. The nucleophilic attack is performed by a conserved aspartic
acid (identified as Asp192 in BaSP) while the protonation is carried out by a conserved general
acid/base catalyst or proton donor (Glu232 in BaSP)23,55. This leads to the formation of the
covalently linked glucosyl-enzyme intermediate and release of fructose. Subsequently, in presence
of excess inorganic phosphate as substrate acceptor and following some conformational changes in
the acceptor site, glucose is transferred on the phosphate moiety and release of glucose-1-phosphate
occurs. Owing to the mechanism and presence of competing water in the acceptor site, hydrolysis
occurs as a side reaction but at low level (1-5%)43. This indicates that the catalytic site of SP’s has
been optimized during evolution to maintain a low level of hydrolytic activity.
Page 29 of 188

Scheme 2: Schematic representation of sucrose phosphorylase double displacement reactionmechanism.
In red is shown the covalent glucosyl-enzyme intermediate with an aspartate residue covalentlylinked to glucose via a glycosidic bond.
The above-mentioned mechanism and the identification of residues central in the mechanism were
confirmed by the obtention of a structure of BaSP featuring the covalent glucosyl-enzyme
intermediate55 and following site-directed mutagenesis studies. Mutation of Asp192 to alanine
resulted in the loss of wild-type function56,57. Apart from the catalytic residues, there are other
conserved residues (Figure 4B and C) that were determined to be crucial for the reaction
mechanism as well as in the maintenance of binding site architecture. For instance, Asp290 is one
such residue and is known for its "transition state stabilization" role and its contribution in the
catalytic triad50,51,55,58. Besides, two highly conserved phenylalanine residues (Phe53 and Phe156) in
the donor site of BaSP are crucial as they respectively serve as a hydrophobic platform and allow
the formation of a hydrophobic sandwich59–61. They contribute for the strong electrostatic cation-Π
interaction that stabilizes by 15 kJ/mol the oxocarbenium-ion-like transition state. Mutation of these
aromatic residues reduces the catalytic activity three fold and increases KM for sucrose. Apart from
Page 30 of 188

those, residues that favor substrate binding are His88, Arg190, Asp50, Arg399, Ala193, and Leu341
for glucosyl moiety62 (see Table 2), Tyr196, Asp342, Gln345, Ala193, and Leu341 for the fructosyl
part63 and Arg135 and Tyr344 for phosphate acceptor63.
Table 2: List of sucrose phosphorylase interactions. Shown between highly conserved residues andthe glucosyl moiety in both the covalent glucosyl-enzyme intermediate (Figure 4B) and non-covalent (Figure 4C) form of sucrose phosphorylase of Bifidobacterium adolescentis. All the given interactions are according to PDB structure 2gdv.
Conserved residues
Substrate (β-D-glucose) interactions
Glucosyl intermediate (PDB: 2gdv chain A)
Product β-D-glucose(PDB: 2gdv chain B)
HBOND distance (Å) distance (Å)
Asp50OD2-O4 2.7 2.7
His88NE2-O6 3.0 2.9
Arg190NH2-O2 3.0 2.9
Asp192OD1-O1 - 2.5
Asp192OD2-O6 2.7 2.8
Glu232OE1-O2 2.9 -
Glu232OE2-O1 - 3.1
His289NE2-O2 3.1 2.9
His289NE2-O3 - 2.9
Asp290OD1-O3 2.8 2.7
Asp290OD2-O2 2.7 2.7
Arg399NH1-O3 3.3 3.3
Arg399NH1-O4 3.0 -
Arg135NH2-O4 - 3.4
HYDROPHOBIC distance (Å) distance (Å)
Leu341CD1 3.9 -
Ala193CB-O1 - 4.5
Ala193CB-C6 5.1
OTHERS
Phe156-C1/C6 hydrophobic/Π interaction
Phe53-C3/C4/C6 hydrophobic/Π interaction
Phe53 stacking interaction with glucosyl ring
Phe53 cation-pi interaction with oxocarbenium-ion-like transition state
2.4 Conformational changes during sucrose conversion
It has been shown that SP undergoes significant structural changes during the conversion of
sucrose55. These structural rearrangements are delimitated by five distinct conformations (A to
E) among which four were experimentally determined across three different x-ray crystal
Page 31 of 188

structures50,55. The first conformation A corresponds to the apoenzyme as featured in chain A of
PDB 1r7a (Figure 5A)50. The structure contains two highly conserved catalytic residues namely
Asp192 and Glu232 which are respectively the nucleophile and general acid/base catalysts23,55.
Besides these catalytic residues, there are three other important residues namely Asp342, Arg135
and Tyr344 that play a crucial role on the subsequent structural changes55. Note that those residues
were initially placed inside and outside of the binding site and are located in the loops A (residues
336-345) and B (residues 130-140). The second conformation B corresponds to the structure of the
enzyme complexed with its sucrose substrate with the glucose displaying a native chair 4C1
conformation (Figure 5B). This conformation is observed in chain A of PDB 2GDU and was
obtained owing to the inactivation of the enzyme by mutating the acid/base catalytic residue Glu232
into glutamine55. According to the reaction mechanism mentioned above, the sucrose molecule in
conformation B undergoes simultaneous protonation of glycosidic bond oxygen and nucleophilic
attack on the anomeric carbon of glucosyl moiety. This subsequently leads to conformation C with
the formation of the covalently linked enzyme-substrate intermediate following fructose exit
(Figure 5C). Crystallographers have indeed recently captured the conformation of the glucosyl-
enzyme intermediate as seen in chain A of PDB 2GDV wild-type. Interestingly, the glucosyl moiety
covalently linked to the aspartate was found to have high energy distorted conformation (skew boat1S3 puckering)55. However, there is not enough data available yet to understand the course of
conformational distortion from native chair (4C1) conformation to skew boat (1S3) conformation.
The reasons for the stability of this distorted conformation is not clear but it was envisaged that
water bridges and a network of hydrogen bonds around the glucosyl moiety might be the major
contributors64. This could be crossed check through in-silico studies. The above three conformations
(A to C) notably share similar binding site architectures where the loops A and B are held together
by the hydrogen bonding between residues Pro134 and Leu34355. Subsequent to the covalent
intermediate formation, significant structural rearrangements, more specifically on loops A and B
are observed. These are mainly due to the loss of above-mentioned hydrogen bonding in
conformations D and E concomitant respectively with the binding of an acceptor molecule (Figure
5D) and with the hydrolysis of the glucosyl-enzyme intermediate leading to the formation of the
product (Figure 5E)55. Conformation D is hypothesized while Conformation E is exemplified by
chain B of PDB 2GDV (Figure 5E)55.
Page 32 of 188
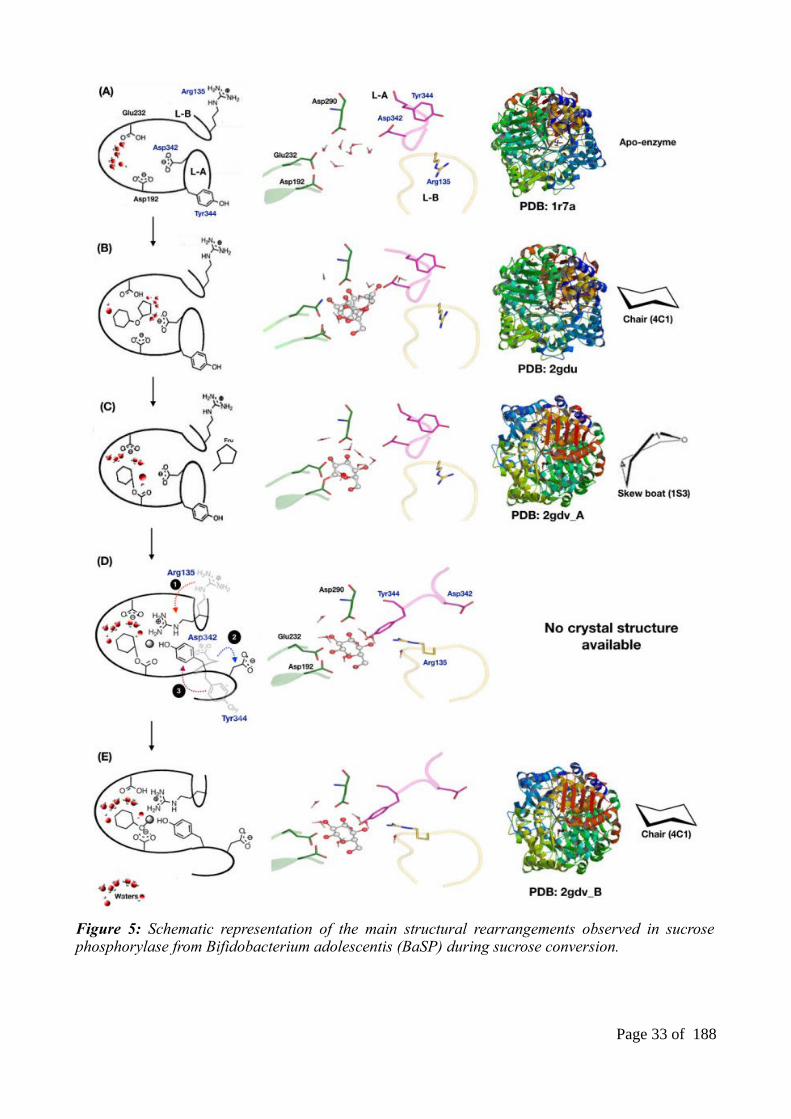
Figure 5: Schematic representation of the main structural rearrangements observed in sucrosephosphorylase from Bifidobacterium adolescentis (BaSP) during sucrose conversion.
Page 33 of 188

These structural changes are supposed to go through 5 more or less distinct structural statestermed as conformations (A) to (E). Conformation (A) corresponds to the inactive apoenzyme asobserved in the PDB structure 1r7a (A). Asp192 is the nucleophile, Glu232 is the general acid/baseand Asp342 stabilizes the transition state. Water molecules are present in the catalytic cavity.Subsequent binding of sucrose substrate in the catalytic site as observed in PDB structure 2gducorresponds to conformation (B) with the glucose moiety adopting a chair (4C1) conformation.Conformation (C), as seen in chain A of the PDB structure 2gdv, corresponds to the covalentglucosyl-enzyme intermediate formed following cleavage of the glycosidic bond and the exit offructose. The glucosyl moiety covalently linked to the nucleophile is distinctively in the skewed 1S3
conformation. Noteworthily, water molecules are involved in stabilization of the glucosyl-intermediate structure. It was hypothesized55 that, concomitant to the binding of an acceptormolecule, a major structural rearrangement occur involving the coordinated movements of loop A(L-A) outward and loop B (L-B) inward the catalytic pocket leading to conformation (D). Whetherthis rearrangement is involved in the facilitation by the positively charge Arg135 of the entry of thenative negatively charge phosphate acceptor and its subsequent stabilization in a productivebinding mode in the catalytic site is not clear because of lack of structural data. What is moreevident from the experimental data is that this rearrangement ultimately favors the liberation of theend product in the last step of the reaction because it widens the entry of the catalytic site as seen inconformation (E). This is evident from the analysis of chain B of PDB structure 2gdv whichcontains the end product of hydrolysis, β-D-glucose, that is noteworthily in the more stable 4C1
conformation. Water molecules and inorganic phosphate are shown in red and grey spheresrespectively. Similarly loops A (L-A) and B (L-B) are shown in magenta and yellow colors. All thecatalytic residues are shown in green color whereas the substrates represented in ball and stick.
The latter features the product of hydrolysis, a ß-D-glucose in its stable native chair conformation.
Both conformations D and E provide an entirely different binding site environment with altered +2
charge and where loop A is pushed away from loop B by 2Å. In addition to that, the relocation of
three residues from loop A and loopB were observed as shown in Figure 5D. The residue Asp342
was replaced by Tyr344, and simultaneously, the residue Arg135 was also gyrated towards the
donor binding site. However, it is still a puzzle what causes the movements of acceptor loops in this
particular conformation D for which no crystallographic data is available yet. From these data, one
very interesting question remains to be addressed: which among the conformations C and D favors
the entry of acceptor substrates and subsequent release of the product from the active site?
Noteworthily, the entrance the catalytic site in conformation C is found to be too narrow to allow
the release of the product55. In order to address these questions, efficient protocol for modeling
covalent glucosyl-enzyme intermediate is in demand. This is one of the main aspects developed in
this thesis and will be discussed in the subsequent chapters.
More recently, the crystal structure of the Q345F mutant of BaSP (PDB 5c8b) complexed with β-D-
glucose (end product of hydrolysis) was obtained65. This mutant is documented to be less active
than the native enzyme but interestingly displayed distinct structural features. Indeed the glucose
binding environment is very different from that observed in the wild-type enzyme (Figure 6Ei)65.
The glucose moiety is nevertheless in the stable chair (4C1) conformation as PDB 2gdv.
Noteworthily, there is a crystal structure of another member of GH13 family from the amylosucrase
Page 34 of 188

subfamily (PDB 1s46). Chain A of this structure shows the enzyme in its covalent-intermediate
form with its aspartate nucleophile covalently linked to glucose and superimpose very well with
conformation C of BaSP (Figure 5C). However, the glucosyl moiety is in the chair (4C1)
conformation while in BaSP, it was found to adopt a skewed 1S3 conformation (Figure 6Ci) 55,66.
Figure 6: The homologues and mutant version of sucrose phosphorylase structures.
The mutant version (Q345F) of sucrose phosphorylase structure (PDB: 5c8b) complexed with β-D-glucose product bound form following hydrolysis (Ei). The most relevant covalent intermediatestructure (PDB: 1s46) from amylosucrase in native chair (4C1) conformation comparison to2gdv_A (Ci).
2.5 Interest of sucrose phosphorylases
Nowadays, sucrose phosphorylases have gained much attention in the industry and are viewed as
promising biocatalysts for synthetic purposes, in particular for the production of useful glycosides.
One of the main reason behind this is that sucrose phosphorylases can use sucrose as donor
substrate for transglycosylation reactions following a double displacement mechanism with
retention of configuration (Figure 7). The interest of utilizing sucrose is that the energy liberated
when the glycosidic bond is broken is about 90% equivalent to that of their nucleotide-activated
sugars counterparts67. Besides, sucrose is a cheap glucosyl donor that can be obtained from
renewable resources while other disaccharide phosphorylases stand in contrast in that respect. For
Page 35 of 188

instance, they cannot use sucrose as a donor for the glycosylation but instead can only use glucose-
1-phosphate as a donor owing to their single displacement mechanism68.
Figure 7: Possible transglucosylation products of sucrose phosphorylases when glucose is used asacceptor.
Similarly to the scheme shown in Figure 5, sucrose first binds to the enzyme (conformation B)leading to the formation of the covalent glycosyl-enzyme intermediate (conformation C) that isstabilized by some water molecules (red spheres). If glucose is in enough quantities,transglucosylation can happen. The various possible disaccharides that can be produced areshown. The control of the regioselectivity of transglucosylation is at stake for the production of rarepre-biotic disaccharides like kojibiose or nigerose
Moreover, disaccharide phosphorylases suffer a major drawback: its equilibrium constant range
from 3 to 5 towards synthesis and, under equimolar conditions between donor and acceptor, yield
exceeding more 60% are difficultly obtained69,70. Apart from the usage of the donor substrate,
sucrose phosphorylases are also regarded as attractive catalysts for their exceptional broad acceptor
specificity71. Doudoroff and colleagues in 1944 showed that SP’s can glucosylate L-sorbose. Since
then, many more studies have confirmed this great potential48,72,73. Indeed, although hydrolysis is the
main reaction catalyzed by sucrose phosphorylases, these enzymes can also importantly be applied
as a transglucosylase in vitro. For example, as shown in Figure 7, when presented with alternative
Page 36 of 188

carbohydrate acceptors such as glucose, SP’s can form a large panel of products like trehalose,
maltose, isomaltose and the rare pre-biotic rare sugars kojibiose and nigerose74–76. In the later
example, synthesis of rare sugars from cheap sucrose substrate is limited by the lack of
regioselectivity of the transglucosylation reaction. It is thus at stake to find efficient regioselective
alternatives. The wild-type (WT) sucrose phosphorylase from Bifidobacterium adolescentis (BaSP)
displays a mixed regioselectivity and produced 64% of maltose and 36% of kojibiose and a yield of
nearly 100% (expressed as a percentage of sucrose conversion) after 48h incubation at 37°C (Table
3). In a recent study, one of our collaborators, Tom Desmet, applied a semi-rational approach to
improve BaSP selectivity towards kojibiose production77. Similarly, M Kraus et al engineered the
selectivity of BaSP for nigerose using a structure-based design approach78. Both teams published the
list of mutants that improved BaSP regioselectivity (Table 3). The double mutants L341I/Q345S our
L341I/Q345N displayed a selectivity of nearly 95% in favor of kojibiose with however a 2 or 3-fold
decrease in enzyme activity.
Table 3: The list of mutants that alter the selectivity of BaSP towards kojibiose and nigeroseproduction.
Selectivity (% of product)
WILD TYPE(WT)
L341IL341IQ345S
L341IQ345N
L341IY344AQ345N
Q345F
%of kojibiose 36 79 94 95 95.7 4.5
% of maltose 64 21 6 5 4.3 27.3
% of nigerose - - - - - 68.2
Activity (U. mg-1)
0.15 0.37 0.10 0.05 0.06 Not Avail
3. GENERAL OBJECTIVES OF THESIS
All the work contained in this thesis revolves around investigating the impact of mutations on the
transglucosylation activity of sucrose phosphorylase. More specifically, we aimed at understanding
how mutations impact its regioselectivity when multiply hydroxylated acceptors like glucose are
used. In that respect, we used the Bifidobacterium adolescentis sucrose phosphorylase (BaSP)
and its transglucosylation activity on glucose acceptor as a study model. Relying on the
knowledge of the reaction mechanism and available structural data, and using computational
approaches, we attempted to rationally explain the experimentally observed regioselectivities
of the wild-type BaSP and some of its highly selective mutants. With such a knowledge, we
envisioned that we could develop a computational canvas for accurately predicting how any
mutation could affect the regioselectivity of BaSP and more generally of any SP or retaining
glycosyl hydrolase displaying a double displacement mechanism. We also aimed to provide further
Page 37 of 188

proof of concept of our approach by experimentally testing new BaSP variants with novel predicted
regioselectivities.
The rational behind our approach relies on a prior hypothesis about how regioselectivity of BaSP
could be explained. We hypothesized that the preferred orientation(s) of the glucose acceptor
in the acceptor site upon binding to the covalent glycosyl-enzyme intermediate determine(s)
its regioselectivity. However, no structural data are available to date to sustain this hypothesis. We
also hypothesized that impaired rate of enzyme activity can be explained in part by the
destabilization of the binding of sucrose substrate in the apoenzyme.
To test theses hypotheses and achieve our general objectives, we aimed at obtaining informative
structural data at atomic level. Towards this end, we implemented a computational approach
using standard methods like molecular modeling, molecular dynamics (MD) simulations, and
molecular docking. We also relied on the development of new tools to implement this approach.
The first operational objective of this thesis was to obtain meaningful atomic models of the
covalent glucosyl-enzyme intermediate of WT BaSP and its variants. We performed the
parametrization of the glucosylated aspartate residue (further termed as DGC) using both
CHARMM and AMBER-ff99SB-ILDN force fields for implementation in MODELLER and
GROMACS respectively. We proposed a validation scheme for measuring the accuracy of the
modeling and simulation of the glucosyl moiety. This consisted in evaluating how well the force
fields parameters were able to reproduce the observed puckering conformations of the glucosyl
moiety in two different experimentally determined covalent glucosyl-enzyme intermediates.
Using these atomic models, the second operational objective was to develop a scheme to assess
the preferred orientations of glucose acceptor upon binding to the covalent glycosyl-enzyme
intermediate. We conducted molecular docking studies on ensemble of models of wild-type
enzyme and their respective variants using both α- and β-D-glucose to predict the preferred
orientation of the acceptors in the +1 site. We finally assessed the statistics of the productive
binding modes of α/β-D-glucose molecule in this +1 site with respect maltose, kojibiose, and
nigerose production77,78.
We were motivated to standardize and automatize our above described scheme in view of its
application for ENZyme Optimization. This constituted our fourth operational objective. We
henceforth developed ENZO, an automated web application specifically for the Glyco-Enzymology
community that standardizes, via the incorporation of the glucosylated-aspartate (DGC) residue in
molecular models, the modeling of libraries of variants of SP in their covalent glycosyl-enzyme
form. We wanted to develop a series of handy tools within ENZO that can automatically create
Page 38 of 188

large mutant libraries starting from a simple FASTA file of the WT sequence and subsequently
perform molecular modeling of the variants followed by molecular docking on ensemble of models.
In the end, we wanted to provide a step-by-step protocol for the community to screen the potential
mutants of sucrose phosphorylase using ENZO.
Lastly, as fifth operational objective, we aimed at exploiting our ENZO web tool to conduct large-
scale mutagenesis experiments to gain in-depth insights on how mutations impaired sucrose
binding, alter binding modes of the α and β anomers of glucose or methyl-glucoside, hence alter
regioselectivity. In that respect, we envisaged the concomitant use of external tools for selecting
hotspot residues and predicting (de)stabilizing mutations to design pertinent libraries of variants for
use in ENZO.
4. TOWARDS ENZyme Optimization (ENZO)
Nowadays, enzymes are widely used as attractive biocatalysts for various industrial purposes and
also considered a credible alternative to the conventional chemical catalysts due to their eco-
efficiency26. However, natural enzymes often exist with insufficient features for industrial
exploitation such as the lack of specificity, reduced activity, low stability with respect to pH or
temperature variations, and low catalytic efficiency.
Figure 8: Overview of the different approaches used to reach the objectives of the thesis.
(SF/SC: structural flexibility and sequence consensus; D/N/B: deleterious/neutral/beneficialmutations respectively)
Page 39 of 188

For example, the selectivity of native sucrose phosphorylase towards synthesis of some glycosides
(e.g., kojibiose) is usually low77. Therefore, methods for improving the activity, specificity and
stability of an enzyme are at stake for creating successful industrial biocatalysts. The methods
behind the general approach used throughout this work, summarized in Figure 8, will be discussed
into more details in the subsequent sections.
4.1 Selection of essential residues and design of a smart library
The classical enzyme engineering strategies that have been extensively applied in the industry over
the years can be categorized as rational design, semi-rational design and directed evolution (see
Table 4). Directed evolution owns a high successful rate and does not require any structure data to
investigate the impact of mutation on protein function79. The desired properties of the target
enzyme/protein is achieved upon performing iterative rounds of random mutagenesis following
screening and selection of best hits80. The process mimics darwinian evolution. Noteworthily, the
seminal work of Prof Frances Arnold from Caltech on directed evolution was rewarded by a shared
Nobel prize in Chemistry in 2018. However, directed evolution requires the generation of very large
mutant libraries and high-throughput screening methods to analyse them. Hence it is costly and time
consuming to analyse libraries that contain millions of variants. In order to overcome this issue, the
focus has shifted towards semi-rational design that usually use smart libraries which are smaller in
size and covers important regions of the target proteins. These smart libraries, in turn reduce the
time and screening effort and leads to higher chance of finding improved variants81. The crucial step
for the success of the latter method is the ability to choose essential/hotspot residues whose
substitution will make the greatest impact on the desired properties of target enzyme82. These
functionally relevant regions are commonly identified using standard approaches like multiple
sequence or structural comparison83,84.
Table 4: Comparison of the three classical different enzyme engineering approaches.
Rational design Semi-rational design Directed evolution
Require both structure and functional data
High-Throughput screening technology not required
Consider the occurrence of several point mutations in some regions
Having either structure or functional data is sufficient
Use of High-Throughput screening can be an advantage but not mandatory
Consider both saturation and synergistic mutations simultaneously at the local region
Structure and functional data not required
High-Throughput screening technology is required
Consider the distribution of random mutations over the gene
A list of different online tools implementing these approaches is provided in Table 5. These tools
allow the identification of key residue positions and provide suggestions for what amino acid to
Page 40 of 188

replace on the respective positions. Further, they can be used for various purposes such as
identification of hotspot positions for engineering catalytic properties or thermostability and the
design of the diversity of the respective libraries. Besides those mentioned in Table 5, hotspots
residues can also be identified using standalone tools like SELECTON, JET, IPRO, RCA, and
FamClash85–89.
Table 5: List of available computational tools for smart library design ((partially adopted from90)
Computational tool Aim URL
HotSpot Wizard101,102 C, S, E https://loschmidt.chemi.muni.cz/hotspotwizard/
CAVER112 C, S http://www.caver.cz/
MolAxis120 C, S http://bioinfo3d.cs.tau.ac.il/MolAxis/
MOLE121 C, S http://mole.upol.cz/online/
PoPMuSiC122 S, E http://babylone.ulb.ac.be/popmusic/
FoldX123 S, E http://foldx.crg.es/
LigPlot+124 C http://www.ebi.ac.uk/thornton-srv/software/LigPlus/
metaPocket125 C http://projects.biotec.tu-dresden.de/metapocket/
PDBePISA91 C http://www.ebi.ac.uk/msd-srv/prot_int/pistart.html
Pocket-Finder92,93 C http://www.modelling.leeds.ac.uk/pocketfinder/
PoseView94 C http://poseview.zbh.uni-hamburg.de/
Q-SiteFinder92 C http://www.modelling.leeds.ac.uk/qsitefinder/
SITEHOUND95 C http://scbx.mssm.edu/sitehound/sitehound-web/Input.html
3D-SURFER96 C http://dragon.bio.purdue.edu/3d-surfer/
CASTp97 C http://cast.engr.uic.edu/
FPOCKET98 C http://fpocket.sourceforge.net/,https://github.com/Discngine/fpocket
AA-Calculator99 D http://guinevere.otago.ac.nz/cgi-bin/aef/AA-Calculator.pl
CASTER100 D http://www.kofo.mpg.de/en/research/organic-synthesis/
GLUE103 D http://guinevere.otago.ac.nz/cgi-bin/aef/glue.pl
CLUE-IT99 C http://guinevere.otago.ac.nz/cgi-bin/aef/glue-IT.pl
3DM104 E http://3dmcsis.systemsbiology.nl/
ConSurf105 E http://consurf.tau.ac.il/
ConSurf-DB106 E http://consurfdb.tau.ac.il/
CUPSAT107 E http://cupsat.tu-bs.de/
Dmutant108 E http://sparks.informatics.iupui.edu/hzhou/mutation. h tml
Evolutionary Trace109 E http://mammoth.bcm.tmc.edu/ETserver.html
Evolutionary Trace Database110
E http://mammoth.bcm.tmc.edu/cgi-bin/report_maker_lstraceServerResults.pl?identifier=reports
Page 41 of 188

HSSP111 E http://swift.cmbi.ru.nl/gv/hssp/
I-Mutant113 E http://folding.uib.es/i-mutant/i-mutant2.0.html
MBLOSUM114 E http://apps.cbu.uib.no/mblosum/
PANTHER115 E http://www.pantherdb.org/tools/csnpScoreForm.jsp
PROVEAN116 E http://provean.jcvi.org/
Scorecons117 E http://www.ebi.ac.uk/thornton-srv/databases/cgi-bin/valdarscorecons_server.pl
SIFT118 E http://sift.jcvi.org/
WebLogo119 E http://weblogo.berkeley.edu/
B-FITTER100 S http://www.kofo.mpg.de/en/research/organic-synthesis/
NOTE: (C: Identification of hotspots for engineering catalytic properties; D: Design of librarydiversity; E: Evolution of hotspots and design amino acid sets; S: Identification of hotspots forengineering thermostability)
Some of the above-mentioned approaches combine both sequence and structure information
especially in the case stability predictions and also they often carried out with prior training on a
dataset derived from the well known thermodynamic database ProTherm126. The improved
efficiency of directed evolution experiments can be achieved by identifying meaningful mutations
as well as addressing the linking of sequence or structure to function or activity127. In that respect,
HotSpot Wizard 3.0 is a notable web server that integrates sequence, structural and evolutionary
information to identify hotspots and design smart libraries. Further, these smart libraries can be used
to target enzyme properties such as stability, catalytic activity, substrate specificity, and
enantioselectivity101. Moreover, it supports inputs in the form of both sequence and structure and
can even use modeled structures102. Considering all these features, in this thesis, we privileged the
use of HotSpot Wizard v3.0. Additional data were obtained from literature and manual curation of
key residues by using interactive tools (e.g., PLIP84) and databases. The workflow of HotSpot
Wizard consists of four different phases according to the type of input sequence or not. In phase 1, it
searches the availability of either experimentally determined structures or computationally modeled
structures for a given protein sequence and in case of absence, it constructs a homology model
using different tools for the respective sequence.
Table 6: The four different protein engineering strategies of Hotspots Wizard for the identification of hotspot residues.
Engineering strategies Definition
Functional hotspots Identify residues forming a catalytic pocket or an access tunnel which are not directly involved in the catalysis. The thus identified residues are ranked in the following four different level of mutability rate: 6-9 (High), 4-6 (moderate), 4-6 (unreliable) and 0-4 (Low)
Correlated hotspots Identify correlated positions by consensus approach where it considers at least one of the residue from the pair that has mutability equal to or higher than 4.
Page 42 of 188

Stability hotspots (SF) Identify the most flexible residues, i.e., residues with highest b-factor in the querystructure: assign hotspots based on all the residues with high relative flexibility (top 25 % of residues with the highest B-factor values).
Further, it also gives information about the secondary structure, residue relative accessible surface area, residue ranking based on the residue average B-factor andrelative flexibility.
Stability hotspots (SC) Identify positions which are in the set of sequence frequently occupied by the same amino acid residue and at the same time this frequent residue not present at this position in the query protein position.
It is dealing with two different approaches where the default approach (majority approach) is applied when the input has 50% of conservative residue, and in the case of below 50% of conservative residue, it is frequency ratio approach.
NOTE: Stability hotspots (SF: structural flexibility and SC: Sequence consensus)
The annotation of the modeled structure or given PDB structure is then carried out in phase 2.
Hotspots Wizard itself uses several online prediction tools and databases which help for exploring
the mutational landscape. Later in phase 3, four different protein engineering strategies mentioned
in Table 6 are used for the identification of suitable hotspots which are likely to improve the
targeted enzyme properties. In the last phase, Hotspots Wizard helps to designs a smart library by
suggesting suitable substitutions and appropriate degenerate codons for each selected hotspot. In
this thesis work, the henceforth designed library is completed with mutant positions derived from
both literature and manual curation.
4.2 Generating libraries of mutated sequences
As mentioned previously, the linking of sequence, structure, and functional data is one of the crucial
steps for the success of protein engineering techniques. The knowledge of crystal structure of a
protein, the generation mutants and their characterization are essential components for studying this
triangular relationship. Exact enzymatic mechanisms are often elucidated upon analyzing the
mutation of critical residues. Since 1978, it is possible to mutate the amino acids in a protein at any
interesting predetermined positions by the method called site-directed mutagenesis128. It can be
performed at the level of a single site (point mutations, insertions or deletions) or of multiple
sites129. Combinatorial mutagenesis and random mutagenesis can also be used for introducing a
combination of and random mutations respectively. Random mutagenesis was popularized with the
advent of error-prone PCR (epPCR)130,131. The mutational bias favoring specific substitutions and
the inability to transfer two successive nucleotides in codons are the main limitations of epPCR132.
Recent bioinformatics tools along with specific mutagenesis kit helped to decrease the bias
issue99,133,134. Another approach is saturation mutagenesis which is part of random mutagenesis
method but in which a single or set of codons is randomized to generate the diversity of variants
that contain all possible amino acids at the specified position100. For all these methods, the number
Page 43 of 188

of variants to be screened to cover a reasonable part of the sequence space increases geometrically
with the number of targeted positions.
Scanning mutagenesis is one of the most common methods used for scanning user’s residues of
interest. In general, compared to other residues, alanine is the most acceptable residue for scanning
(high probability to reveal hotspots135) due to its ability to retain the beta carbon and its tendency of
forming alpha helices while it can also occur in beta sheets. Alternatively, scanning using glycine,
cysteine, or proline residues can also be used to identify functionally important sites135. However,
mutating using cysteine and proline residues is not encouraged due to their conformational
flexibility, specific chemistry and the unique ring shape respectively. When a glycine or a proline is
introduced by mutagenesis, a point of flexibility, a bend or a kink may be introduced within the
protein backbone or protein secondary structure. Similarly, mutating side chains with larger more
constrained/polar/hydrophobic and differently charged atoms may also cause drastic changes in
structures.
Once mutants are constructed, it is at stake to estimate the impact of mutations on the stability of
the 3D structure. The tool FoldX is appropriate for that purpose. It calculates the change in stability
of a protein defined by the change in free energy (∆ΔG) between the wild-type structure and mutant
structure expressed in kcal/mol. A mutation that increases the free energy with respect to wild-type
(ΔΔG>0 kcal/mol) is considered to destabilize the structure, while a mutation that decreases the free
energy (ΔΔG<0 kcal/mol) is considered to stabilize the structure. The prediction of stability is
executed with using the BuildModel and RepairPDB functions of FoldX123.
Page 44 of 188
4.3 Modelling of variants and validation of models
The number of crystal structures available in the protein data bank (PDB)136 and the sequence
diversity that is covered is limited with respect to the number and diversity of protein sequences
available in sequence databases. Computational techniques are available to attempt to fulfill the gap
between the sequence and structure spaces. Indeed, models at atomic level of proteins with
unknown structures can be built commonly following three different approaches. One consists in
abinitio calculations that try to fold a protein chain either from scratch or from the assembly of
small unrelated fragments into its native structure using solely the laws of physics. This is
commonly used when no proteins in PDB shares more than 10-15% with the query. Another
approach proceeds by fold recognition or threading which build models from known existing
templates of full domains and is usually applied when templates share less than 30% of identity
with the query. The third approach, known as comparative modeling and also termed as homology
modeling, is performed when template structures from homologous proteins with >30% identity
with respect to the query are available.
In this thesis, we have only used comparative/homology modeling as our work primarily focus on
the modeling mutants of proteins with known structures. How homology modeling proceeds is
further detailed hereafter. It primarily requires the amino acid sequence of the target protein and
both the sequence(s) and the structure(s) at atomic level of protein(s) homologous to the target. The
latter are termed as the templates. Sequence information of a target protein can classically be
retrieved from a the well-known Universal Protein Resource database (UNIPROT137) or the non-
redundant protein sequence (nr) database. The template structures can be manually identified by
running BLASTP (protein-protein blast) against non-redundant protein sequence (nr) database
sequence data of proteins available in the PDB. The scoring function of BLAST uses a substitution
matrix to estimate the quality of sequence alignment138,139: typically BLOck SUbstitution Matrix
(BLOSUM62) is commonly used. The assessment takes into account different parameters namely
(i) the percentage of identity between the target and the templates (usually, homology modeling
requires minimum of 30% to construct reasonable models140), and (ii) the query coverage. Tools for
the automated search of good templates are usually provided by homology modeling softwares or
meta servers. latter steps can also be automated using for homology modelling is a feature available
in Modeller141: in that respect, routines such as build.py (build templates by searching target against
pdb_95.pir database), compare.py (comparison of templates) and align2d.py (alignment between a
target protein and a selected template) are commonly used.
There is a wide range of online and standalone tools for homology modeling that have been
developed in recent years and that are publicly available. Among them are the tools like Modeller,
Page 45 of 188

Rosetta, SWISS-MODEL Robetta, PHYRE2 and I-Tasser, Pcons, IntFold, IMP, HHPred, RaptorX
and Sparks-X142–153. In this thesis, we exclusively used Modeller for the following reasons: first, it is
considered one of the most robust tools with rapid speed and reasonable accuracy when provided
with good templates. Second, all the functions of Modeller were originally written in Python
language and further allows the users to modify the existing functions as well as implement new
routines. Third, it is provided with rich amount of documentation and examples, especially when it
comes to adding new restraints and parametrization of non-standard residues. Finally, Modeller can
be installed locally and is highly flexible for automation. Besides, Modeller provides sets of useful
modules for our work, among which a module called "mutate model" which is specifically made for
introducing single point mutation given a user residue position. “Mutate model” procedure includes
optimization by conjugate gradient and refinement using some MD154. Our work which involved
modeling of variants of BaSP which has a known structure, solely made use of the protocols
implemented in Modeller.
Once a mutant model is constructed, it is important to validate its quality. In that respect, we can
cite three widely used tools: PROCHECK, WHAT_CHECK and MolProbity155–157. These tools
calculate the percentage of residues in allowed/disallowed regions, generate the quality parameters
of the whole structure as well as individual residues respectively. PROCHECK can also be used for
analysis of protein backbone torsion angles using the Ramachandran diagram. The detailed reports
of WHAT_CHECK consist of secondary structure checks, coordinate problems, unexpected atoms,
B-factor, occupancy checks, nomenclature related problems, geometric checks, torsion-related
checks, bump checks, packing, accessibility, threading, water, ion, and hydrogen bond-related
checks. Similarly, MolProbity provides the details of the number of poor rotamers, Ramachandran
outliers, favored Ramachandran conformations, bad bonds and bad angles in the protein. Besides,
the quality and the diversity of models can be assessed within Modeller by the standard DOPE
(Discrete Optimized Protein Energy) method in combination with its MOLPDF score and by
examining the distribution of the RMSD values between the models and with respect to the
template. The best model can be chosen by using either DOPE or MOLPDF. However, the DOPE
score is suggested to be best among them158. Besides, the puckering states of glucosyl moiety of
sucrose phosphorylase models are computed based on the Cremer-Pople puckering method159.
4.4 Molecular dynamic simulations of mutant models
Molecular dynamics (MD) simulations are commonly used to provide insights into the structural
and functional properties of a protein model by simulating the movement of its atoms over time in a
given environment. When it comes to the study of protein-carbohydrate complexes by MD
simulations likewise it was done in this thesis, one classically needs to address three main
Page 46 of 188

requirements as shown in Figure 9. At first level, the pre-requisite is to gain knowledge of the
structural properties of the carbohydrate moieties. This is classically achieve using QM methods
which include calculation of force constants, charges, and electronic related features160–162. Usually,
the atomic motions within proteins and their cognate ligands are studied using principles of
Newton’s law of motion which model internal and external forces.
Figure 9: Typical scheme followed for the study of protein-carbohydrate complexes usingmolecular dynamics simulation.
It starts with the calculation of electronic properties (atomic charges) and force constants (1),followed by the parameterization and generation of initial approximations such as bond angles,dihedrals, and improper dihedrals (2) and execution of MD simulations using specialized softwarethat can used the associated parameters within their forcefields (3) (QM: ab-initio quantummechanical calculations; *: methods used in our work)
Potential energy functions also known as force fields are employed to describe the interactions
between the particles. Hence, it is crucial to develop forcefield parameters (charges, bonds, angles,
dihedrals, and improper dihedrals) prior to carrying out any computational study using MD
simulations. The specific forcefields for carbohydrate studies (Figure 9 stage 2) will be discussed
below. The third requirement relates to the availability of MD software to study carbohydrates in
both free (conformational analysis, puckering analysis and dynamic properties in solution) and
bound form (e.g., binding pose, interactions).
4.4.1 Calculation of electronic properties
As mentioned above, there are many methods available to calculate the electronic properties such as
ab-initio quantum (QM) calculations, Quantum Monte Carlo (QMC), Density Functional theory
(DFT) and various semi-empirical methods163–167. Among those, our work considered the DFT
Page 47 of 188

method. It is commonly used for deriving the properties of the molecule based on the determination
of their electron density. As an approximation, the total energy of the system is derived from the
total electron density instead of the wave function. Three types of methods are typically used: local
density (LD) approximation, gradient corrected (GC) and hybrid methods. The former method as
implemented in B3LYP is one of the most commonly used methods by computational chemistry
practitioners. A brief comparison between DFT-based methods and other available methods is given
in Table 7.
Table 7: Comparison of methods employed for quantum mechanic calculations (QM: Quantum calculations; QMC: Quantum Monte Carlo; DFT: Density Functional theory)
Method Features Advantages Limitations
QM It helps in investigating the molecular properties and defined chemical reactions.
Experimental details are not required.
Instead, it uses only electronic properties of the individual atoms and does not
Suffer from high computational cost upon using a larger system consisting of receptor-ligand or molecules with more than hundreds of atoms.
QMC This method explicitly correlates wave functions and evaluates integrals numerically by using MonteCarlo integration
Very time consuming and most accurate method.
Ignore the limitations of HartreeFock (HF) method (resulted energy is usually higher than theexact one)
Most of the QMC results are not numerically exact
the applicability is limited to a fairly small set of models
DFT Another QM method where the total energy is related to the total electron density instead of the wave function
Widely used due to their high accuracy plus requires less amount of computational source
DFT methods such as B3LYP/6-31G(d) are widely considered tobe a standard model
Determining the most appropriate method for particularapplications is a challenging task.
It does not correctly treat the exchange interactions.
semi-empiricalmethods
Calculations employed in this method is based on Hartree Fock (HF) assumptions, but the parametersor numbers are fitted with experimental data
Compared to ab-initio and velocity of the calculations, it is lower computational cost
Related to the lack of experimental data for particular systems
4.4.2 Carbohydrate force fields and employed software for simulations
Over the years, many forcefields have been developed specifically to study carbohydrates such as
GLYCAM-06, CHARMM36, GROMOS53A6GLYC, and OPLS-AA-SEI160,168–170. In this thesis,
however, we only used the first two force fields and GAFF (General Amber Force Field).
GLYCAM06 is mainly made to deal with carbohydrates and supports the largest group of
carbohydrates including complex sugars like iduronic acid and acetylated amino sugars. Further, it
is compatible with the AMBER force fields series. GLYCAM06 takes into account α/β anomeric
configurations, L and D enantiomeric forms and all possible torsions of the glycosidic linkage. On
the contrary, CHARMM36 supports a limited collection of carbohydrates and also lacks the
parameters for the L-enantiomeric forms. An extension of CHARMM all-atom additive bio
Page 48 of 188

molecular force field supports monosaccharide derivatives and their covalent bonding with proteins
(e.g., via O and N linkages respectively towards serine/threonine and asparagine)171. The general
amber force field (GAFF172) was initially made for simulations that deal with molecules complexed
with drugs and other small molecules. However, since it is inherited from the family of AMBER
force field (designed for biomolecules such as proteins, DNA, RNA, Carbohydrates), it was
employed for comparison with the latter two force fields. In this thesis, all the energy minimization
and simulations were carried out using GROMACS. Since no force field was specifically developed
for the glucosyl moiety in skew boat conformation, the parameters for the respective residue was
implemented in GROMACS using all three mentioned force fields, GLYCAM06, CHARMM36,
and GAFF.
4.5 Molecular docking of mutant models
Molecular docking is a widely used method namely in the field of pharmaceutical drug design.
Here, in this work, it is used to measure the impact of mutations on binding preferences of the co-
substrate of the enzyme and check how it further affects their coupling regioselectivity.
Accordingly, three different docking protocols were used in this thesis: these are AutoDock4.2,
Autodock VINA, and Vina Carb which are detailed below173–175.
Autodock is one of the widely used freeware molecular docking programs which consists of two
main components: one is for docking of the ligand to a set of grids describing the target protein
(AutoDock) and the other is for pre-calculation of those grids (AutoGrid). It uses a combination of
algorithms (Lamarckian genetic method, simulated annealing and traditional genetic algorithm) for
conformational search (with respect to the ligand). Subsequently, the evaluation of the binding
energy and putative binding poses are done by a grid base method. Besides, a semi-empirical
function is applied for ranking docking poses. The binding free energy is computed by the potential
energy difference of (protein and ligand complex in the bound form) and (protein and ligand
complex in the unbound form). Version 4 of Autodock is very adaptable with many utilities and
functions. It is also flexible for automation and also allows external software for analysis. It also
supports flexible docking.
An alternative to Autodock is AutoDock VINA (the acronym stands for Vina Is Not Autodock). It is
also a widely used free software for docking calculations. However, it differs from AUTODOCK
mainly by its hybrid scoring function (Broyden-Fletcher-Goldfarb-Shanno algorithm) used for the
conformational search. Another essential difference is the type of input files especially GRID
configuration files. It allows the user to edit the number of binding conformation to unlimited
numbers by modifying the num_modes arguments in the source code. Further, it calculates the grid
Page 49 of 188

charges internally, and the setting up of the docking is facilitated. Addition of charges depends on
user’s method and not by the program. In that respect, it is reputably known that accurate charge
calculations can lead to better docking results. Importantly, VINA uses threading which makes it
faster compared to its previous version. However, both VINA and AutoDock failed to compute
accurate glycosidic dihedrals upon docking (flexible) with di/oligosaccharide compounds such as
sucrose. This problem was addressed in the updated version called Vina-Carb with improve
glycosidic angles. Except from this point, all functions in Vina-Carb are similar to AutoDock Vina.
Page 50 of 188

Chapter 2Parameterization Of The Glucosylated
Aspartate Residue And Their SuccessiveApplications
Part of this chapter yet to submit in “Journal of Chemical Theory and Computation”:Mahesh Velusamy§,†,‡, Benoit David†, Johann Hendrickx†, Philippe Arnaud†, Lionel Hoffmann†,Yves-Henri Sanejouand†, Catherine Etchebest§, Frédéric Cadet§‡ and Bernard Offmann†
(2018) Parameterization Of The Glucosylated Aspartate Residue And Their Successive Applications
Page 51 of 188

ABSTRACT
The derivation of non-standard amino acid residue force field parameters is often a cumbersome
task to perform prior to computational modeling and simulations. Thus, the successful addition of a
new residue type in force field libraries is undoubtedly necessary for further computational studies
of proteins carrying such modified residues. Herein, we present a simple and efficient strategy to
derive the force field parameters of the glucosylated aspartate residue (DGC) as observed in the
crystal structure of the covalent intermediate of the sucrose phosphorylase enzyme from
Bifidobacterium adolescentis. On account of its phosphorolysis and its transglycosylation activities,
this enzyme is a promising biocatalyst for the synthesis of phosphorylated sugars as well as
glycoconjugates. To conduct further computational studies on this enzyme in its covalent
intermediate, we parameterized the DGC residue for both CHARMM and AMBER ff99sb-ILDN
force fields and implemented these parameters within MODELLER and GROMACS respectively.
The first step of parameterization workflow consisted in ab-initio calculation of the DGC atomic
partial charges. In a second step, the force constant parameters were derived by using different
available software and tools. We then successfully implemented this new residue type that showed
to reproduce the models like crystal structure and successful simulations. This work opens new
perspectives for both homology modelling and molecular dynamics (MD) simulations of
glucosylated forms of sucrose phosphorylase homologues and to get better understanding of its
catalytic mechanism. It will open new avenues for novel applications in the field of chemosynthesis
of original chemicals like rare disaccharides or other glycoconjugates.
Page 52 of 188

1. INTRODUCTION
Sucrose phosphorylase (SP, EC 2.4.1.7) is globally accepted as an essential enzyme in both
metabolism of sucrose and regulation of metabolic intermediates in prokaryotes. It is categorized in
the class of hexosyltransferases and belongs to the member of the glycoside hydrolase GH family
13176. As illustrated in Figure 1, it is known to catalyze the reversible phosphorolysis of sucrose into
α-D-glucose-1-phosphate and D-fructose via a double displacement mechanism i.e retaining
anomeric configuration of glucosyl moiety as in donor54,177–179.
On top is shown the glucosylated aspartate residue in ball and sticks representation. The glucosemoiety BGC (from donor substrate sucrose) involved in these reactions is first covalently linked tothe catalytic nucleophile residue (Asp-D) prior to transfer on to natural acceptors like phosphate(P) in the case of phosphorolysis or on another glucose (GLC) in the case of transglycosylationreaction or on water (hydrolysis)
It has been structurally revealed that during this sucrose conversion, sucrose phosphorylase from
Bifidobacterium adolescentis (BaSP) undergoes crucial structural changes in five different
conformations (conf) as shown in Figure 255. The conf A corresponds to the apoenzyme form
(PDB: 1r7a) where it has two fully conserved catalytic residues (Asp192 and Glu232) acting as
Page 53 of 188
Figure 1: The role of glucosylated aspartate residue (termed as DGC) in the reaction mechanismcatalyzed by sucrose phosphorylase. .

nucleophilic attack and general acid/base catalyst respectively50. Besides those catalytic residues,
the location of following three residues Arg135, Asp342 and Tyr344 from loop A (residues 336-345) and
B (residues 130-140) has major influence on the subsequent structural changes55. Later, in the conf
B (PDB: 2gdu), the substrate sucrose molecule interact with catalytic residues of apoenzyme
whereby the glucosyl moiety is in native chair conformation (4C1). Consequently, that induces the
reaction by simultaneous protonation of glycosidic bond oxygen and nucleophilic attack on the
anomeric carbon of glucosyl moiety which further leads to the formation of covalently linked
enzyme-substrate intermediate and the fructose exit as (PDB: 2gdv_A) conf C. The covalently
linked glucosyl moiety undergoes high energy puckering distortion (from chair 4C1 to skew boat 1S3)
to cleave off fructose55. In contrast, the most relevant covalent intermediate comparison with conf C
is that of amylosucrase (PDB: 1s46) which exists in 4C1 conformation (Ci in Figure 2(iii))55,66.
After the formation of the covalent intermediate, important structural rearrangements on loops A
and B were captured as seen in Figure 2(ii). Initially, these loops are held together by hydrogen
bonds (between Pro134 and Leu343) in both substrate-bound and covalent intermediate complexes.
Then, during the hydrolysis of glucosyl-enzyme intermediate (conf D with no available crystal
structure) and the formation of glucose (4C1) product complex (conf E, PDB: 2gdv_B), this
interaction vanishes due to the large movements on loop A as shown in Figure 2(ii). As a
consequent of this loss of interaction, loop A is pushed away from loop B by 2Å and adopts an
entirely different active site environment with altered +2 charge. In addition, the replacement of
Asp342 residue by Tyr344 and the gyration of Arg135 towards the active site were observed in both
loops A and B respectively55. Apart from these five forms, one more conformation (Ei in Figure
(2iii)) has been solved for a mutated version (Q345F) of BaSP complexed with β-D-glucose (PDB:
5c8b), the product of hydrolysis. In this form, the structure exists with an absolutely different
binding site environment compared to that of the WT enzyme (PDB: 2gdv chain B). But, the
conformation of glucosyl moiety in the product remains in native chair (4C1) conformation as
similar to its wild type65. Apart from these specific structural rearrangements, sucrose phosphorylase
is distinctively interesting owing to the donor substrate and its exceptional broad acceptor
specificity71. For example as shown in Figure 1, although the hydrolysis is the main reaction
catalyzed by sucrose phosphorylases, these enzymes can also importantly be applied as a
transglucosylases in vitro when presented with alternative carbohydrate acceptors such as glucose to
form a large panel of products like maltose, kojibiose, trehalose and nigerose33,75,76. Alternative
acceptor substrates such as phosphate can also be used to produce phosphorylated sugars179,180.
Hence, it is considered as a promising biocatalyst for producing activated sugars and
glycoconjugates43.
Page 54 of 188

(A) corresponds to an inactive apoenzyme (PDB:1r7a). (B) corresponds to the enzyme bound to thesubstrate sucrose, with the glucosyl moiety in 4C1 conformation (PDB: 2gdu). The glucosyl enzymeintermediate is formed following the fructose exit in (C) whereby the glucosyl moiety distinctivelyswitch from 4C1 to 1S3 conformation (PDB:2gdv_A). Later (D), the covalent intermediate enzymeinteracts with either the acceptor, phosphate or water, and leads to the formation of the product β-D-glucose (E) which is in 4C1 conformation (PDB: 2gdv_B). The important structuralrearrangements from conf C to D are highlighted in (ii) with a large movement of loops A and B. Incomparison to 2gdv_A, the covalent intermediate structure from amylosucrase has its glucosylmoiety in 4C1 conformation (PDB: 1s46) and is shown in Fig. 2(iii-Ci). In comparison to theconformational states given in (i-D) and (i-E) of the wild-type BaSP, the corresponding states ofmutant Q345F (PDB: 5c8B)are provided respectively given in (iii-Di) and (iii-Ei). The watermolecules and phosphates are shown in red and grey spheres respectively. Similarly loops A and Bare shown in magenta and yellow colors. All the catalytic catalytic residues are shown in greencolor whereas the substrates are represented in balls and sticks. * symbol for conf C, Ci, D and Di
Page 55 of 188
Figure 2: (i) The structural representation of the sucrose phosphorylase reaction (left) and (ii) theirconsecutive structural rearrangements (top right) along with the list of comparative structures (iii)(bottom right).

indicates the availability of crystal structures whereas *? indicates no availability of crystalstructures. This figure was partially adapted from55.
Moreover, it is highly interesting because of the following points. (1) As shown in Figure 2(i) and
(ii), it is still a puzzle for what causes the movements of acceptor loops in conf D. (2) Among the
conformations D and E (Figure 2(i)), it is still unclear which one favors the entry and exit of
acceptor substrates. (3) It is important to confirm the reasons for the stability of the distorted
conformation observed in glucosyl moiety of 2gdv_A in (conf C in Figure 2(i)). 4) To reproduce
the known covalent intermediate conformations (conf C and Ci in Figure 2(i) and (ii)), we need a
valid modeling protocol that can subsequently be applied t to produce theoretical models of
unknown glucosyl intermediate conformations (conf D and Di in Figure 2(i) and (ii)).
Unravelling these can be very useful to understand more in depth the mechanism of SP and help the
community to explore new alternative acceptor substrates. Hence, performing combination of
homology modelling, MD simulations and in-silico docking analysis of the putative acceptor
molecules on the active site of the covalent glucosyl-enzyme intermediates can lead to such better
understanding. However, the relevancy of this approach depends on the accuracy of the input
models and the forcefields applied in the corresponding techniques. In that respect, the glucosylated
catalytic aspartate has to be fully parametrized in the force field of interest used in the modelling
and simulation procedures. However, the available force fields parameters for proteins are usually
limited to standard amino acids.181–184 Therefore, new parameters for the glucosylated aspartate
residue must be derived for further computational studies of sucrose phosphorylase covalent
intermediates. Non-standard amino acid residues parameters are generally derived using ab-initio
(QM) calculations185. Because of their complexity and the time they require, non-experts cannot
easily perform such computations. As an alternative, a non-standard amino acid residue can also be
parametrized using several online tools as well as force field repositories185–187.
This work describes a quick implementation of force field parameters for the glucosylated aspartate
(DGC) residue in both CHARMM and AMBER ff99SB-ILDN force fields for further use in
MODELLER and GROMACS programs respectively183,184. The derivation as well as the
implementation of the corresponding parameters are described in details in the Materials and
Methods section. Conformational analyses of glucosylated sucrose phosphorylase models generated
in MODELLER and GROMACS were undertaken to validate the use of these parameters in these
programs. These analyses have shown that these parameters as well as our implementation protocol
can be applied for homology modeling and MD simulation. Some caveats and limitations of the
parametrization strategy used in this work are finally discussed.
Page 56 of 188

2. MATERIALS AND METHODS
The protocol used for the derivation of the DGC residue parameters and their implementation in
both AMBER ff99sb-ILDN and CHARMM forcefields is summarized in Figure 3. The
modifications of the corresponding forcefields in MODELLER and GROMACS was designed
based on the instructions given in the manuals of these respective programs183,184.
The protocol consists of three steps which is common to methods a, b, c and d. Step 1 is theconstruction of DGC and threonine glucosylated (TGC) residues using Pymol and GLYCAMcarbohydrate builder. Step 2 is the generation of DGC initial approximations, parameters andcharges using different tools. Step 3 is the implementation of DGC residue in the respectivelibraries.
2.1. Construction of the glucosylated aspartate (DGC) residue
In first step, a PDB file encoding a single DGC residue was generated using the Pymol software,
Version 1.8.4 (Schrödinger, LLC)188. The initial coordinates of the covalently linked glucosylated
aspartate residue was retrieved from the crystal structure of glucosyl-enzyme intermediate form of
sucrose phosphorylase from Bifidobacterium adolescentis (pdb 2gdv_A)55. Although it is linked to
Page 57 of 188
Figure 3: Illustration of the protocol used in parameterization and implementation of DGC residueusing CHARMM22 (a), GAFF (b), GLYCAM (c) and CHARMM36 (d).

the catalytic aspartate named as Asp192 in the original structure, the glucosyl moiety is identified as
a distinct ligand named as BGC in the crystal structure (residue number 700). Since the
glucosylated aspartate has to be considered as a single residue, both aspartate and glucosyl moieties
were merged into a single (non-standard) amino acid residue which was further referred as DGC as
shown in Figure 1. Hydrogens were added to the DGC residue using the PyMOL command h_add
and the final residue was saved as a PDB file. This file was further used as an input to derive all the
DGC force field parameters as described below.
2.2. ESP partial atomic charge calculation
The geometry of the constructed DGC residue was fully optimized by ab-initio calculations using
Gaussian 09 (revision D.01) program and the DFT method at the B3LYP/6-31G(d) level. Atomic
charges were computed with the Merz-Kollman algorithm for charge fitting to electrostatic surface
potentials (ESP)189,190.
2.3. Derivation of DGC parameters using CGenFF following implementation inboth MODELLER and GROMACS
The DGC residue force constant parameters were derived using CHARMM General Force Field
(CGenFF) parachem web server (https://cgenff.paramchem.org/)191,192. It was done by providing the
single DGC residue to the CGenFF in PDB format with all hydrogens and subsequently converted
to mol2 file internally by Open Babel 2.3.0. Further, the intermediary mol2 file was resubmitted
with careful inspection on its connectivity and bond order errors. In addition, the input option
“Include parameters that are already in CGenFF” was enabled to retain the existing CGenFF
parameters corresponding to Asp and glucosyl moieties191,192. As a result, toppar stream file in (.str)
format was generated, from which the rtf card entries were added to the existing
modlib/top_heav.lib file preceded with the following line “RESI DGC 0.000”. Since most of the
CGenFF calculated charges had a high penalty score (ranges between 10 to 50) it was replaced by
our QM charges186,187. Also, all the hydrogen entries were removed since MODELLER considers
only heavy atoms by default. Some of the missing internal coordinates (IC) associated with
dihedrals and improper of DGC were carefully added to the topology file using β-D-glucose
analogs from “top_all36_carb.rtf”186,187. Subsequently, the remaining BOND, ANGLES, DIHR and
IMPR details of DGC were added to the “modlib/par.lib” using param card entries of stream file.
Following the addition of topology and parameters in the respective libraries, all the new atom types
were added to the modlib libraries (top_heav.lib, radii.lib, radii14.lib and solv.lib) to overcome
name conflict issue. Then as a final step, the new residue DGC was referred in MODELLER by
adding subsequent three (DGC) and one letter (O) codes to the restyp.lib file. The former
implementation was also latter transferred into GROMACS. To do that, both CGenFF derived
Page 58 of 188

topologies and parameters were converted into GROMACS format and units (itp, prm and top files)
using the python script cgenff_charmm2gmx.py186,187. These initial topology and parameter details
were further carefully added to the corresponding modified CHARMM36 force field files
(aminoacids.rtp, ffbonded.itp and ffnonbonded.itp) with new atom types (atomtypes.atp). Then,
modifications on aminoacids.hdb, residuetypes.dat and xlateat.dat files were done by using the same
protocol as described below.
2.4. Additional refinements on the problematic dihedral phases
All the parameters for β-D-glucose provided in CGenFF web server were in particular in the native
chair (4C1) conformation. Hence, it is transparent that applying those parameters for modelling can
solely favor the former conformation. So, in order to overcome this bias of actual parameters
(SET1) towards 4C1, another two set of parameters (SET2 and 3) were introduced for comparison
(Table S1).
The native form of DGC residue from amylosucrase (PDB: 1s46) is shown in native (chair 4C1)conformation along with the respective CGenFF parameters in dotted box (top). Similarly, thesedetails are also shown for the constrained and distorted (skew boat 1S3) form of DGC from thecrystal structure of covalent intermediate of SP (PDB: 2gdv_A). The corresponding dihedralvalues of both native (-170.3°) and constrained (-109.4°) DGC residues are represented in dottedsemi circle (manually measured using Pymol). The representation of yellow dot circle correspondsto the high penalty dihedral of native chair form. The important shifted O5 atom which isresponsible for the twisted skew boat conformation is shown in white circle.
Page 59 of 188
Figure 4: Comparison of native (blue) and constrained (green) conformations of DGC residues.
By contrast to the SET1, the two new parameters incorporated 5 additional improper dihedral
analogies as it is crucial to maintain the puckering planarity of glucosyl moiety. These
supplementary parameters were further replaced by the measured improper values comparatively
derived from both the native (chair 4C1) and distorted (skew boat 1S3) DGC residues55,66. In addition
to the previous integration, one more dihedral (OD2-C1-O5-C5) parameter was added to SET3
following the refinement of its phase value. This integration was done for two main reasons. (1) As
shown in (Table S2 in supplementary informations), the corresponding entry was one of the less
reliable among the following two parameters OBG5-CG31-OG30-CC and OG30-CG31-OBG5-
CG31 that are associated with high penalty scores of 45 and 11.1 respectively186,187. (2) More over,
the twisted dihedral angle (OD2-C1-O5-C5) shown in Figure 4 was found as root for the skew boat
(1S3) conformation in 2gdv_A. So, as per the CGenFF protocol, the respective dihedral entry
“OG30-CG31-OBG5-CG31” phase was further refined using some in house statistical
validations,186,193. To accomplish that, random values were selected from the actual dihedral value
between -109.4 to 109.4 and standardized by homology modeling. For the standardization, all the
dihedral values from the random list including the standard phase (0.00) were substituted one by
one in place of problematic dihedral parameter phase (OD2-C1-O5-C5 1.000 3 ?) and 100 models
were generated for each value. Then, the respective distorted dihedral values were distributed
among 100 models to find suitable phase values that were close to the global minima at dihedral -
109.4° (Figure 4).
2.5. Obtention of DGC parameters using GLYCAM06 forcefield andimplementation in GROMACS
The force constant parameters for both isolated aspartate and glucosyl moiety of the DGC residue
can be respectively obtained from the AMBER and the GLYCAM force fields160,184. However,
although it is currently possible to parametrize glycosylated amino acids such as amides and
alcohols using the GLYCAM web server (http://glycam.org/), force field parameters encoding
covalent linkages between glucose and acidic amino acids are currently not publicly available in
GLYCAM160. In order to tackle this limitation, we selected the GLYCAM force field parameters for
the covalent linkage of the glucosyl-threonin and use them by analogy for the DGC residue. The
creation of the topology file containing the force field parameters for the glucosyl-threonin was
performed using the glycoprotein builder of the GLYCAM web server. ACPYPE 6 was used to
convert the AMBER topology (.prm) file generated by GLYCAM into a GROMACS topology
(.top) file194. The files aminoacids.rtp, atomtypes.atp, ffbonded.itp, ffnonbonded.itp, and
aminoacids.hdb associated with the AMBER ff99SB-ILDN force field were accordingly modified
in order to implement the DGC residue in it. This procedure was carried out according to the
Page 60 of 188

instructions provided in the manual184. New atom types specifying the atoms of the DGC residue
were designed and added to the atomtypes.atp force field file in order to avoid potential conflict
with exiting atom types in the original AMBER ff99SB-ILDN force field. The atomic point charges
previously calculated ab-initio were added to the aminoacids.rtp file. The new residue DGC was
added to the residuetypes.dat file with the specification “DGC Protein”. The line “protein-cterm O2
OXT” in the xlateat.dat file was commented in order to prevent the GROMACS from considering
the O2 oxygen of the glucosyl moiety as the sp2 oxygen of the C-terminal carboxyl group.
2.6. Obtention of DGC forcefield parameters using GAFF for the AMBERff99sb-ILDN and implementation in GROMACS
By contrast to the section 2.5, we also derived DGC residue force constant parameters by using
General Amber Force Field (GAFF)172,195. It was done by updating both ffbonded.itp and
ffnonbonded.itp files with GAFF parameters. To do that, the initial approximation of DGC residue
topology file (DGC_GMX.itp) in GROMACS format were generated using ACPYPE 6 program by
applying our own input charges (-c user) in neutral state (-n 0) with the specification of GAFF
parameters (-a gaff)194. The bonds, angles and dihedrals sections of this topology file were extracted
and transferred into the appropriate section of ffbonded.itp/ffnonbonded.itp force field files with
existing GLYCAM atom types. Since the bonded/non bonded parameters were updated with
GLYCAM atom types, we retained the rest of files (aminoacids.rtp, atomtypes.atp, aminoacids.hdb,
residuetypes.dat and xlateat.dat) from section 2.5 and used it without any further modifications.
2.7. Benchmarking of the modified CHARMM22 forcefield extended with DGCparameters within MODELLER
In order to validate the DGC parameters, the validation protocol was setup to reproduce the
conformations of two known covalent intermediates corresponding to the C and Ci conformations
(Figure 2(i) and (ii)). Upon the successful replication, the same protocol was subsequently applied
to predict the 3D structures of the remaining two unknown covalent intermediate conformations D
and Di (Figure 2(i) and (iii)). To accomplish this, the respective structures and their sequence were
downloaded from PDB and UNIPROT databases respectively137,196. More precisely, the known
intermediate structures respectively from sucrose phosphorylase (PDB: 2gdv_A) and amylosucrase
(PDB: 1s46) were selected as templates for conformations C and Ci respectively55,66. In contrast,
the following non-covalent form of sucrose phosphorylases such as 2gdv_B and 5c8b were chosen
for conformations D and Di respectively55. Then, the DGC residues were transferred to all the four
selected templates in both 4C1 and 1S3 conformations in order to assess if the parameters were biased
towards either of the conformations of DGC. The fusion of DGC residue was done by replacing the
template coordinates of respective Asp residue to target three letter “DGC” and similarly the
corresponding single letter “D” in sequences changed to O. Subsequently, the alignment was
Page 61 of 188
performed between the target sequence against template structure and served them as an input to the
comparative modeling protocol within MODELLER version 9.18183. For each template, 250 models
were starting from both 4C1 and 1S3 conformations. From these 500 models, the top 100 (20%)
models based on their molpdf scores were chosen and subjected to a statistical analysis of their
puckering state using an in-house python scripts. At the end, the frequency of 4C1 and 1S3 puckering
counts among the top models were used to validate the accuracy of the parameters by showing the
reproducibility of original conformations observed in the template structures.
2.8. Benchmarking of the AMBER ff99sb-ILDN forcefield extended with theDGC force field parameters within GROMACS
All the MD simulations of covalent intermediates of sucrose phosphorylase were carried out using
the version 5.1.2. of the GROMACS software184. All the initial covalent intermediate structures
along with DGC residue were prepared using the same protocol described in section 2.7 above.
According to the mechanism and the binding site environment of each SP complexes (Figure 2(i),
(ii) & (iii)), all the initial starting conformations were kept in skew boat (1S3) conformation except
for 1s46 (4C1). Then the protonation state of titrable residues was automatically assigned by the
pdb2gmx module of the GROMACS. For this, we used the modified forcefields (CHARMM-36
using CGenFF parameter SET3 and AMBER ff99sb-ILDN forcefield embedded with DGC
forcefield parameters of GLYCAM alone, GAFF alone or a combination of those). In these
modified forcefield, fusion of the GLYCAM and GAFF force field parameters were done by
assigning GLYCAM parameters for glucosyl moiety and GAFF for the angles involved in
glucosidic linkage. Since all the force constant values for all the angles involved in glycosidic
linkage were taken from glucosyl-threonin analogies, we just replaced them by GAFF parameters to
check the consequence on stability of DGC residue. Then, since AMBER ff99SB-ILDN force field
uses by default dihedral angles of type 9, all dihedral angles specified in the topology file generated
by pdb2gmx have been assigned to type 9 by the program. However, the GLYCAM and GAFF
force fields provide parameters for dihedral angles of type 3 (Rickaert-Bellemans dihedral angles).
As the glucosyl moiety of the DGC residue was parametrized using both GLYCAM and GAFF
force fields, the next step consisted in changing the type of all dihedral angles involving atoms from
the glucosyl moiety in the aspartyl-glucosyl-aspartate linkage from type 9 to type 3. Regarding
improper dihedral angles involved in the glucosyl-aspartate linkage, these were assigned to type 4.
The protein was then solvated in an octahedral box filled with the standard TIP3P water molecules.
To respect the minimum image convention, a distance of 1 nm was applied between the protein and
the edge of the box. Counter ions were added in order to neutralize the net charge of the protein.
Harmonic restraints were applied by using a force constant of 2000 kJ/mol/nm2 during all stages.
The system was finally relaxed through 50000 steps of energy minimization using the steepest
Page 62 of 188

descent algorithm. Prior to the final simulation, constant volume-temperature (NVT) and constant
pressure-temperature (NPT) equilibration steps for 1 ns and 10 ns respectively were conducted to
equilibrate the solvent around the protein. The simulation was performed for 100 ns. All these
equilibration and simulation steps were repeated with the combinations of all the modified
forcefield parameters. The simulation trajectories were saved for every 100 ps and by analogy with
the homology modeling, the stability of the glucosyl ring puckering was assessed using the Cremer-
Pople methodology. Subsequently, the distribution of puckering states across the time (every
100 ps) was analyzed and counted to validate the accuracy of these parameters.
2.9. Cremer-Pople puckering and binding site analysis
As mentioned above, the complementary analysis of the glucosyl ring puckering was performed to
check the accuracy of DGC force field parameters by comparison to the original conformations. To
do this, a global reference Cremer-Pople puckering plot was generated for 100 non-covalent β-D-
glucose (BGC) available in PDB using Cremer-Pople methodology using in-house python scripts159.
The global list of BGC ligands were downloaded from the PDB with higher resolution (cutoff <=
1.8 Å) including 5c8b, 1s46, 2gdv_A and 2gdv_B55,65,66. Additionally, the puckering states of
individual MD snapshots at every 100 ps up to 100ns were captured and consecutively their
conformational itineraries were plotted. These transition itineraries along with the frequency of
individual puckering states were further used to assess the reproducibility of DGC parameters by
explicitly quantifying the amount of observed puckering states 1S3 and 4C1 in the respective
conformations (C) and (Ci) (Figure 2). Since there is no crystal structures available for
conformations (D) and (Di) (Figure 2), it is difficult to assesses the reproducibility of DGC
parameters for the same. Hence, we decided to make our own hypothesis about the possible
conformations for these two unknown covalent intermediate forms based on binding site analysis.
To do that, we have selected their wild type structure 2gdv chainA along with three more covalent
intermediate structures (Table S4 in supplementary informations) to explain the reason for its
unique distorted puckering conformation and its consequences in conformations (D) and (Di).
Among the three known covalent intermediates, we have selected the covalent intermediate
structure from amylosucrase (1s46 chain A) for comparison as its share the same primary sucrose
substrate and hydrolysis is likewise a minor side reaction55. The interactions between the binding
site residues and the ligand (BGC) atoms were derived using Protein-Ligand Interaction Profiler
(PLIP)84. The interactions across four structures were further manually inspected using PyMOL188.
Page 63 of 188

3. RESULTS AND DISCUSSION
3.1. Parameters of DGC residue
The new forcefield parameters, topology files and modified libraries for both forcefields are given
in Supporting Information (DGC.ZIP).
Shown with atom number (A), atom names (B), and their respective calculated ESP partial atomiccharges (C). In addition, the atom types for modified AMBER ff99sb-ILDN forcefield extended withGLYCAM and GAFF parameters are shown in (D). Similarly, atom types for modified CHARMM36(GROMACS) and 22 (MODELLER) forcefields are show in (E) and (F) respectively.
Page 64 of 188
Figure 5: The representation of DGC residue

3.2. Cremer-Pople puckering reference plot
As mentioned above in section2.9, the reference Cremer-Pople puckering plot was generated by
analyzing high resolution PDB structures including 5c8b, 1s46 and 2gdv_B. Our analysis shows
that 92% of the ß-D-glucose (BGC) were observed in chair (4C1) conformation (Figure 6a and 6b).
In contrast, in 2gdv_A, glucose covalently linked to Asp192 was found to be in a skew boat
conformation (Figure 6c). Irrespective to the type of BGC ligand, covalent or non-covalent, our
reference plot clearly reveals that the chair (4C1) puckering state is globally favored whereas 2gdv_A
exceptionally favors a non-native skew boat conformation. This observations was taken into
account to assess the accuracy of our parameters. This was evaluated based on their ability to
replicate the observed conformations in both models and trajectories after comparative modeling
and MD simulations respectively.
(a) The puckering states of free β-D-glucose (BGC) ligands in higher resolution PDB structuresincluding 2gdv_B, 5c8b are shown. (b) Shown is the puckering state for covalently linked DGC inamylosucrase (PDB: 1s46). Both of these plots clearly show that most of the free (BGC) andcovalent (DGC) ligands exists in 4C1 puckering conformation. On the other hand as in (c) theglucosyl moiety in 2gdv_A exceptionally adopts a 1S3 sugar puckering state.
Page 65 of 188
Figure 6: Reference Cremer-Pople puckering plots.

3.3. Refined dihedral phase
In order to define the suitable phase for the problematic dihedral parameter OD2-C1-O5-C5, the
distributions of dihedral values were plotted using 100 models at different phases (from -109.4 to
109.4) including the standard (0.00). Among all, the global minima was achieved at phase 109.4
(dotted line box of Figure S15B in supplementary informations) and found to be more stable over
the dihedral value (-109.4°) responsible for the distorted glucosyl ring (skew boat 1S3) in 2gdv_A.
In contrast, while applying standard phase 0.00 the global minima was achieved around -170.3°
(dotted line box of Figure S15A in supplementary informations) instead of -109.4°. Hence, our
assumptions were confirmed: applying the following dihedral (OD2-C1-O5-C5) with default phase
(0.00) in modeling can lead to bias towards 4C1 conformation models. So, we took only refined
phase (109.4) and further served as parameter SET3 in MODELLER along with 5 IMPR.
3.4. The predicted conformations of two unknown covalent intermediate forms
As mentioned earlier, the binding site environment of four covalent intermediate structures such as
1s46, 2gdv, 3wy2 and 4wlc were compared on chain A alone. The manual structural alignments
along with details of important interactions with distances across all four selected structures are
given in (Figure S16-S18 in supplementary informations). As mentioned earlier, the interaction
details associated with 2gdv and 1s46 alone were chosen to explain the possible reasons about
2gdv_A unique distorted skew boat conformation for its covalently-linked glucosyl moiety. When
comparing these two selective structures, 2gdv_A doesn’t have Tyr residue equal to Tyr147 of 1s46
but have instead Phe53 on the respective position. Thus, it is clear from Figure 7A and B that
absence of Tyr residue on position 53 consecutively leads to the loss of crucial C-H..pi interaction
(between the glucosyl moiety of BGC and the ring of Phe53) in 2gdv_A following the loss of
hydrogen bond between Arg190 and Phe53. So, we speculate that absence of this interaction along
with other two important HBONDS losses (between Gln160 and Asp50 residues towards O6 of
BGC700) including the absence of no equal water bridge (between HOH1292 and O5 atom of BGC700)
leads to destabilization of the glucosyl moiety in 2gdv and provides larger mobility to the
O2,O4,O5 atoms to move downwards. Further, the following strong hydrogen bonds Glu232-O2,
HOH1268-O4, HOH1206-O5 observed in 2gdv (chain A) are strong stabilizing factor for the distorted
skew boat conformation of its glucosyl moiety. In addition, the presence of following residues in
2gdv chain A Glu232,His234,Gln345 strongly interacts with water molecules (Glu232 with HOH892,
HOH1036, HOH1125; H234 with HOH892; Gln345 with HOH1036) and creates a stable environment for
water bridges. Interestingly Glu232, His234, Gln345 residues are not observed in 1s46 which clearly
implies that presence of these residues along with water bridges plays a major role on the
stabilization of glucosyl moiety in skew boat conformation. To sum up, the presence of Tyr147 and
Page 66 of 188

HOH1292 in 1s46 makes the favorable active site environment for its glucosyl moiety to form native
chair (4C1) conformation whereas in 2gdv_A the presence of Phe53 in place of Tyr147, Glu232, His234,
Gln345 and water molecules (HOH892, HOH1036, HOH1125 and HOH1206) makes the environment stable
for glucosyl moiety to stay in high energy distorted skew boat conformation (1S3). Considering the
presence of above listed residues in 2gdv chain B, we expect the inheritance of same 1S3 puckering
state in conformation (D).
shown are their key interaction differences which are responsible for the observed 4C1 conformationin 1s46_A namely. These key differences (C-H..pi interaction and water bridges) tare explicitlyshown in yellow rings and white spheres. Similarly, the key interactions that is responsible for 1S3
conformation in 2gdv_A are shown in (B) along with comparison to 1s46. The key interactions arehighlighted by green arrows and their absence in 1s46 are represented by red cross marks. (C)Shown is the representation of loop A movement, rearrangement of Arg135, Asp342 and Tyr344 residuesand the key interactions responsible for 1S3 conformation stability. (D) Shown is the representationof loop shift and the disturbed key interactions that are responsible for skew boat conformation.
Page 67 of 188
Figure 7: Comparison of four selective structure and their key interactions. (A) Corresponds to thesuperimposition of 1s46_A (white) and 2gdv_A (green).

The water molecules are represented in white, red and magenta spheres in A, B, C and Drespectively. All the key residues are shown by arrows with respective colors of structures. The redcrossed marks are shown to indicate the absence of key interactions.
In addition, we also speculate that as a consequence of differences in loop conformations, the
entirely new active site architecture with two additional water molecules (HOH1372 and HOH1515)
and the relocation of Arg135, Asp342 and Tyr344 residues from loops A and B (Figure 7C) is expected
to provide additional stability to the conformation (D) and keep its glucosyl moiety to stay solely
at 1S3 puckering state. Moving on to conformation (Di), it is expected to have equal proportion of
both 4C1 and 1S3 puckering states. Indeed as shown in Figure 7D, though it has no C-H..pi
interaction, it has no key interactions to stabilize the 1S3 puckering state as observed in its previous
conformations C and Di. All the key interactions, mainly those are associated with Arg135,Tyr344 and
Gln345, were disturbed by the drastic shift on loop B following the introduction of single mutant
(Q345F) on loopA. Hence, we speculate the possible puckering state for this conformation (Di)
highly depends on the level of loop shift and the interaction between Arg135 and O4 atom of BGC.
It can be either 1S3 or 4C1 conformations. So according to our hypothesis, we expect our DGC
parameters to produce majority of (1S3) puckering state for conformation (D) whereas in
conformation (Di) it is expected to have equal proportion of 1S3 and 4C1.
3.5. The results of benchmarking force field parameters through MODELLER
Models are successfully generated using all three set of parameters. They were consecutively
assessed to measure the impact of parameters on the conformation of glucosyl moiety of the DGC
residue. As mentioned above, the assessments were carried out by counting the number of observed
(OBPS) and expected puckering states (EXPS), namely the 4C1 and 1S3 states. The occurrences of
individual puckering states along with their energy spots on Cremer-Pople chart are given in Figure
8 for all the three parameters. Also, the overall frequency for both the OBPS and EXPS are
summarized in (Table 1) for all the four structures with respect to three sets of parameters. The
overall frequency for both the OBPS and EXPS are also summarized in Table 1 for all the four
structures with respect to three sets of parameters. The puckering counts of both the default
CGenFF parameters (SET1) or the one extended with the additional improper dihedrals (SET2) are
found to be bias towards producing models with 4C1 puckering state. Indeed, it was expected as both
of them were originally meant for reproducing ß-D-glucose in native chair conformation. These
numbers in SET1 and SET2 were also found to be well correlated with the reference Cremer-Pople
puckering plot (Figure 6a and b). In contrast, the SET3 parameters successfully reproduced the
crystal conformations as expected for both 2gdv_A and 1s46_A in large numbers with 55% of 1S3
and 53% 4C1 respectively. Moreover, these numbers were interestingly inherited from both the DGC
Page 68 of 188

residue templates in chair and skew boat forms. For example among the total of 53% (4C1) 1s46
models, 40% of them were retained from its original conformation template (4C1) and the rest of
13% models were obtained from the distorted form (1S3) of template. A similar pattern of results
were obtained for 2gdv_A (SET3) where the total of 55% models accounted with both 4C1 (10%)
and 1S3 (45%) which clearly demonstrate the accuracy of parameter in terms of reproducibility as
well as transferability of puckering states from one structure to another. As already stated above,
the notable conformational changes on loops (A and B) and the relocation of following residues
Arg135, Asp342 and Tyr344 as expectedly, play an important role on the stabilization of glucosyl moiety
in 2gdv_B and retain the puckering state of its previous conformation (C). Our prediction is clearly
supported by the puckering counts obtained in 2gdv_B.model using SET3 parameters with majority
(71%) of models in 1S3 forms. Similarly, the impact of Q345F mutation in conformation Ei (Figure
2(iii)) and their subsequent effects on its active site environment are clearly explained by the almost
equal counts of 1S3 (47%) and 4C1 (40%) puckering states for the 5c8b-based models generated using
SET3. This clearly supports our prediction that the expected conformation in this case can be either1S3 and 4C1.
Table 1: Benchmarking results of DGC forcefield parameters using MODELLER.
SET1 corresponds to the default CGenFF parameter. SET2 parameter is similar to SET1 withadditional 5 IMPR dihedrals that define the puckering planarity of glucosyl moiety of DGCresidues. Notably, these IMPR values were derived from the native DGC residue from PDB 1s46.Finally, SET3 combines all the parameters together: the defaults, 5 additional IMPR dihedraltaken from distorted DGC residue of SP (PDB 2gdv_A) and the 1 dihedral (OD2-C1-O5-C5) withrefined phase.
PARAMETERS 2gdv_A (*1S3) 1s46_A (*4C1) 2gdv_B.model (*?) 5c8b.model (*?)
SET1(Default CGenFF
parameters)
□1S3 -2
1S3 -2 ■ 4C1 -64
4C1 -64 □1S3 -6
1S3 -6 □1S3 -12
1S3 -124C1 -0 1S3 -0 4C1 -14 4C1 -0
4C1 -544C1 -54
1S3 -11S3 -1
4C1 -144C1 -14
4C1 -454C1 -44
1S3 -0 4C1 -0 1S3 -0 1S3 -1
SET2 (Plus 5 IMPR
derived in nativechair form)
□1S3-1
1S3 -1 ■ 4C1-98
4C1 -98 □1S3-0
1S3 -0 □1S3-3
1S3 -04C1 -0 1S3 -0 4C1 -0 4C1 -3
4C1-984C1 -50
1S3-01S3 -0
4C1-844C1 -11
4C1-894C1 -47
1S3 -48 4C1 -0 1S3 -73 1S3 -42
SET3 (Plus 5 IMPR
derived in skew boat form)
(Plus 1 refinedDIHR 109.4)
■ 1S3-55
1S3 -45 ■ 4C1-53
4C1 -40 ■ 1S3-71
1S3 -71 ■ 1S3-47
1S3 -374C1 -10 1S3 -13 4C1 -0 4C1 -10
4C1-35
4C1 -321S3-26
1S3 -224C1-3
4C1 -24C1-40
4C1 -33
1S3 -3 4C1 -4 1S3 -1 1S3 -7
(1S3: corresponds to the distorted skew boat conformation; 4C1: corresponds to the native chairconformation; ■: the occurrence puckering states that resembles the observed puckering states; □:the occurrence puckering states that failed to replicate the expected puckering states;* the startingconformation is known *?: the starting conformation is not known)
Page 69 of 188

(A) Corresponds to the distribution of all the individual puckering states (top) as well as theCremer-Pople puckering chart (bottom) for 2gdv_A models. The similar informations are shown for1s46_A (B), 2gdv_B based models (C) and 5c8b_B based models (D) with respect to three set ofparameters (S1, S2 and S3). In all the cases, the puckering states 1S3 and 4C1 are explicitly shown incyan and red colors respectively.
Page 70 of 188
Figure 8: The distribution of individual puckering states and their respective energy spots onCremer-Pople puckering chart.
So considering these data, we conclude that SET3 works well it displayed good parameter
transferability and reproducibility of the crystal conformations. Subsequently, we attempted to
confirm these patterns via MD simulations to add more confidence level the chosen parameters.
3.6. Molecular dynamics of DGC embedded structures
For the purpose of validating DGC parameters and to explain the list of facts mentioned in the
section 1, four individual molecular dynamic simulations (100ns) were performed on four selective
structures using four modified DGC force field parameters. The temperature, density RMSD and
radius of gyration (Figures S19-S22 in supplementary information) profiles revealed that, overall,
our structures were stable throughout the simulations.
Table 2: Distribution of individual puckering states of glucosyl moiety covalently linked to Asp nucleophile residue during MD simulations. It shows the counts for all four types of models we generated and for all four tested force fields.
PARAMETERS 2gdv_ A (*1S3/B36 ) 1s46_A (*4C1) 2gdv_B (*?) 5c8b_B(*?)
CHARMM 36(converted fromCGenFF SET3
parameters)
□1S3 -0B36
-04C1 -977
□1S3 -0B36
-04C1 -358
□1S3 -0B36
-04C1 -947
□1S3 -0B36
-04C1 -980
GAFF alone
Uͧ1S3 -2
B36 -387
4C1 -6
Uͧ4C1 -31S3 -0
B36 -75
Uͧ1S3 -18B36
-484C1 -10
Uͧ1S3 -73
B36 -362
4C1 -2
Mixed parameters ofGAFF (Linkage) and
GLYCAM-06(Glucosyl moiety)
□1S3 -0B36
-04C1 -997
■ 1S3 -0B36
-04C1 -998
□1S3 -5
B36 -146
4C1 -672
□1S3 -0
B36 -19
4C1 -412
GLYCAM-06 alone(Linkage glucosyl-threonin analog)
■ 1S3 -342B36
-3924C1 -240
■ 4C1 -985
1S3 -0B36
-0
■ 1S3 -220B36
-7304C1 -15
■ 1S3 -39
B36 -462
4C1 -455
(1S3: corresponds to the distorted skew boat conformation; B36: almost identical conformation to1S3; 4C1: corresponds to the native chair conformation; ■: Majority of puckering states thatresembles the observed/expected puckering states; □: Majority of puckering states that failed toreplicate the observed/expected puckering states;* the starting conformation is known *?: thestarting conformation is not known; O
u: successful to our unique expectation that linkageparameters of GAFF managed to capture either 1S3 or its almost identical conformation B
36).
Similarly to validation scheme used after modeling using Modeller, we checked the ability of our
parameters to retain the native crystallographic conformations for the glucosyl moiety during MD
simulations. Notably, the puckering counts of both B36 and 1S3 were considered as same as they
commonly share identical skew boat conformation with very slight energy difference197. The overall
distribution of individual puckering states are given in Table 2 for all the four selective structures
with respect to four modified forcefield. These will be discussed below one by one in details.
Page 71 of 188

3.6.1. Results of CHARMM36 parameters
After the successful validation of CGenFF parameters SET3 in Modeller, we decided to check its
performance in GROMACS. To do that, MD simulations were successfully performed using four
selective structures following the conversion of former CGenFF (SET3) parameters into
GROMACS format. Subsequently, we validated the accuracy of the parameters by comparing to the
results obtained to those obtained using Modeller. Unfortunately, the converted CGenFF parameters
failed to reproduce neither crystal conformations (1S3/B36 for 2gdv_A and 4C1 for1s46_A) nor
predicted unknown conformations in 2gdv_b and 5c8b_B. Instead, as shown in (Table2
CHARMM36 alone and Figure 9) the puckering counts and their respective itineraries were solely
biased to 4C1 conformations in all the four selective structures 2gdv_A (97.7%), 1s46_A (35.8%),
94.7% (2gdv_B) and 98% (5c8b_B)..
Shown are the individual puckering states generated using CHARMM36 parameters for the DGCresidue (A) Corresponds to the itineraries (top) and the distribution (middle) of all the individualpuckering states of 2gdv_A along with their energy spot on Cremer-Pople puckering chart (bottom).The similar informations are shown for 1s46_A (B), 2gdv_B (C) and 5c8b_B (D). All the puckeringstates are shown in grey color except for 1S3 (cyan), B36 (yellow) and 4C1 (red).
Page 72 of 188
Figure 9: Analysis of puckering states of glucosyl moiety covalently linked to Asp during MDsimulations.(CHARMM36)

However in contrast to Modeller, it is clear that setting the dihedral phase to a non-zero or non -180
value, makes the parameters completely non-transferable. Strictly it should not be done. Setting any
mathematical value in terms of phase seems to leads to unpredictable results without having any
physical meaning like what was observed in 1s46_A. The home taking message for us from these
results is that performance of modified dihedral phases in Modeller and GROMACS are different.
Modeller does not care about the dihedral phase and treated as external restraints where as
GROMACS, it leads to loss of transferability
3.6.2. Results of a general AMBER forcefield (GAFF) parameters alone
Though GAFF is primarily made for proteins and nucleic acids, the simulations using modification
of former forcefield embedded with GAFF parameters were performed in order check the behavior
parameters involved in the linkage connecting the glucosyl moiety and Asp in the DGC residue.
Shown are the individual puckering states generated using GAFF (General Amber Force Field)parameters alone for the DGC residue. (A) Shown are the itineraries (top) and the distribution(middle) of all the individual puckering states of 2gdv_A along with their energy spot on Cremer-Pople puckering chart (bottom). The similar information are shown for 1s46_A (B), 2gdv_B (C)and 5c8b_B (D). All the puckering states are shown in grey color except for 1S3 (cyan), B36 (yellow)and 4C1 (red).
Page 73 of 188
Figure 10: Analysis of puckering states of glucosyl moiety covalently linked to Asp during MDsimulations.(GAFF)
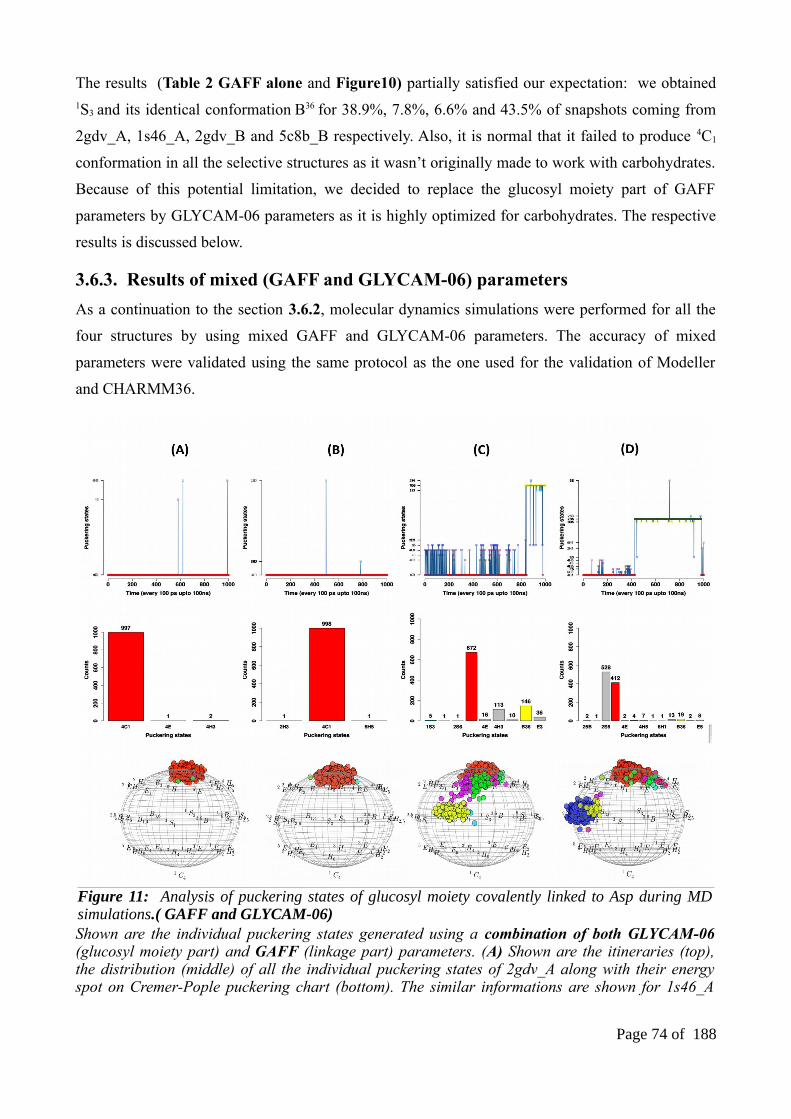
The results (Table 2 GAFF alone and Figure10) partially satisfied our expectation: we obtained1S3 and its identical conformation B36 for 38.9%, 7.8%, 6.6% and 43.5% of snapshots coming from
2gdv_A, 1s46_A, 2gdv_B and 5c8b_B respectively. Also, it is normal that it failed to produce 4C1
conformation in all the selective structures as it wasn’t originally made to work with carbohydrates.
Because of this potential limitation, we decided to replace the glucosyl moiety part of GAFF
parameters by GLYCAM-06 parameters as it is highly optimized for carbohydrates. The respective
results is discussed below.
3.6.3. Results of mixed (GAFF and GLYCAM-06) parameters
As a continuation to the section 3.6.2, molecular dynamics simulations were performed for all the
four structures by using mixed GAFF and GLYCAM-06 parameters. The accuracy of mixed
parameters were validated using the same protocol as the one used for the validation of Modeller
and CHARMM36.
Shown are the individual puckering states generated using a combination of both GLYCAM-06(glucosyl moiety part) and GAFF (linkage part) parameters. (A) Shown are the itineraries (top),the distribution (middle) of all the individual puckering states of 2gdv_A along with their energyspot on Cremer-Pople puckering chart (bottom). The similar informations are shown for 1s46_A
Page 74 of 188
Figure 11: Analysis of puckering states of glucosyl moiety covalently linked to Asp during MDsimulations.( GAFF and GLYCAM-06)

(B), 2gdv_B (C) and 5c8b_B (D). All the puckering states are shown in grey color except for 1S3
(cyan), B36 (yellow) and 4C1 (red).
From the puckering counts (Table2 mixed parameters of GAFF and GLYCAM-06), it is clear
that mixed parameters manage to increase the 1S3 and B36 conformations in 2gdv_B from
6.6% to 19% and retains some of B36 alone in 5c8b_B (1.9%). But, unfortunately it fails to
reproduce crystal conformation of 2gdv_A (0%). Instead, the predicted conformations were
totally biased to 4C1 conformations in 2gdv_A(99.7%) 2gdv_B (67.2%) and 5c8b_N
(41.2%).These results along with their itineraries (Figure 11) clearly explains that mixed
parameters are highly influenced by GLYCAM-06 parameters and expressed the demand for
alternative linkage parameters. Thus, we decided to replace the corresponding covalent linkage
parameters by glucose-threonine analogs generated using GLYCAM-06 parameters. The respective
results is further below
3.6.4. Results of GLYCAM-06 parameters along with glucosyl-threonine analogs
Here the linkage part of previous version was replaced by glucosyl threonine analogs. The
simulations on the four selective structures were analyzed. From the puckering counts (Table2
GLYCAM-06 alone for 2gdv_A and 1s46_A), it is clear that compared to other parameters,
GLYCAM-06 alone seems to be a better choice to fairly reproduce the crystal conformations with
majority of 1S3+B36 (73.4%) conformation for 2gdv_A and a high percentage of 4C1 (98.5%) for
1s46_A. Besides the puckering counts, the itineraries shown in Figure 12A and B (top) reveals that
both skewed boat (1S3+B36) and chair (4C1) puckering states are the stable conformations as observed
in the crystal structures 2gdv_A and 1s46_A respectively. Thus, GLYCAM-06 parameters along
with glucosyl-threonin analogs are accurate enough to reproduce the crystal conformations without
biasing to neither 4C1 nor 1S3 conformations.
Apart from replicating original conformations, the GLYCAM-06 parameters were also found to be
well correlated with the predicted conformations of other two unknown covalent intermediates
2gdv_B and 5c8b_B. From the puckering counts shown in Table 2, as expected, the 2gdv_B
conformation favors 1S3+B36 conformations (95%) while 5c8b_B has mixed preference for 1S3+B36
(50.1%) and 4C1 (45.5%) conformations. Their respective trajectories as seen in Figure 12C and D
(top), clearly explain the impacts of both loop conformational change and loop shift on the
conformational stability of the covalently linked glucosyl moiety. In order to confirm this point into
more details, we decided to explore the interactions associated with a list of three residues that are
associated with the conformational change of loops and loop shift of 2gdv_B and 5c8b_b
respectively. In that respect, we have chosen the top superimposed snapshots from the three
Page 75 of 188

selective puckering states (1S3, B36 and 4C1) and identified some key interactions that are expected to
have major role on maintaining the stability of DGC residue. The residue Asp342 alone does not seem
to have any impact in both 2gdv_B and 5c8b_B as it locates far from the glucosyl moiety of DGC
residue and from the substrate binding site. But, as shown in Figure 13, the strong hydrogen bonds
(3.8Å and 3.4Å) in 2gdv_B between Arg135(NH1/NH2)-DGC192(O4) favors the both 1S3 and its
almost identical B36 conformation. A large distance (4.3Å) for this interaction leads to 4C1
conformation.
Shown are the individual puckering states generated using GLYCAM-06 parameters.(A) Shown arethe itineraries (top), the distribution (middle) of all the individual puckering states of 2gdv_A alongwith their energy spot on Cremer-Pople puckering chart (bottom). The similar informations areshown for 1s46_A (B), 2gdv_B (C) and 5c8b_B (D). All the puckering states are shown in greycolor except for 1S3 (cyan), B36 (yellow) and 4C1 (red)
Hence, it is clear that movement of Arg135 residue towards binding site plays a major role in
stabilizing 1S3 puckering conformation. To add additional support to this point, we have calculated
the distance of Arg135(NH2)-DGC192(O4) across 1000 snapshots every 100 ps and plotted the
average distance for all the three selective puckering states (Figure 14). This again strongly
supports that the presence of strong interaction (<4Å) between Arg135 and DGC favors either 1S3
(cyan) or B36 (yellow) whereas a weak interaction (>4Å) favors 4C1 conformation (red box).
Page 76 of 188
Figure 12: Analysis of puckering states of glucosyl moiety covalently linked to Asp during MDsimulations.(GLYCAM-06 + glucosyl-threonine analogs)

The focus is on the residues from loops A and B. (A) Shown are the key interactions observed insnapshots taken from 2gdv_B. This model shows the consequence of conformational changes ofloops (A and B) and the relocation of three residues Arg135, Asp342 and Tyr344. Similarly, (B) explainsthe impact of loop shift following Q345F mutation in 5c8B. The interaction between the glucosylmoiety and loops A and B is loosened.
Another important finding from the 2gdv_B model is that the interaction between Pro134(O) and
Tyr344(OH) is critical for maintaining the key interaction between Arg135(NH2) and DGC192(O4). As
shown in Figure 13, it is clear that the Arg135(NH2)-DGC192(O4) interaction is highly disturbed
(4.3Å) upon losing the interaction between Pro134(O) and Tyr344(OH) (5.3Å). Indeed, as shown in
Figure 14 A and B, all the 4C1 conformations (shown in red box) in the 2gdv_B model were
obtained when this distance was above 6Å. The 1S3 and B36 conformations were obtained when this
distance was maintained within 5.3Å. The loss of interaction between Pro134(O) and Tyr344(OH)
hence destabilizes the 1S3 conformation. This is strongly corroborated by the analysis of the 1000
snapshots from the 5c8b_B model (Figure 14C and 14D). The loss of interaction between Pro134(O)
and Tyr344(OH) (Figure 11C) leads to shift in loop B which consecutively disturb the key
interaction between Arg135 and DGC192(O4).
As stated earlier, the single mutation in 5c8b_B on position 345 (from Q to F), strongly induced the
shift on loopB (Figure 13B) and leads to destabilization of 1S3 conformation. However, our results
suggests that the level of shift on Tyr344 and its strength of interaction with Pro134 decides the
conformation of DGC residue. Hence, supports the fact that the covalently-linked glucosyl moiety
Page 77 of 188
Figure 13: Interactions observed in MD snapshots key for determining the puckering states of the covalently-linked glucosyl moiety.
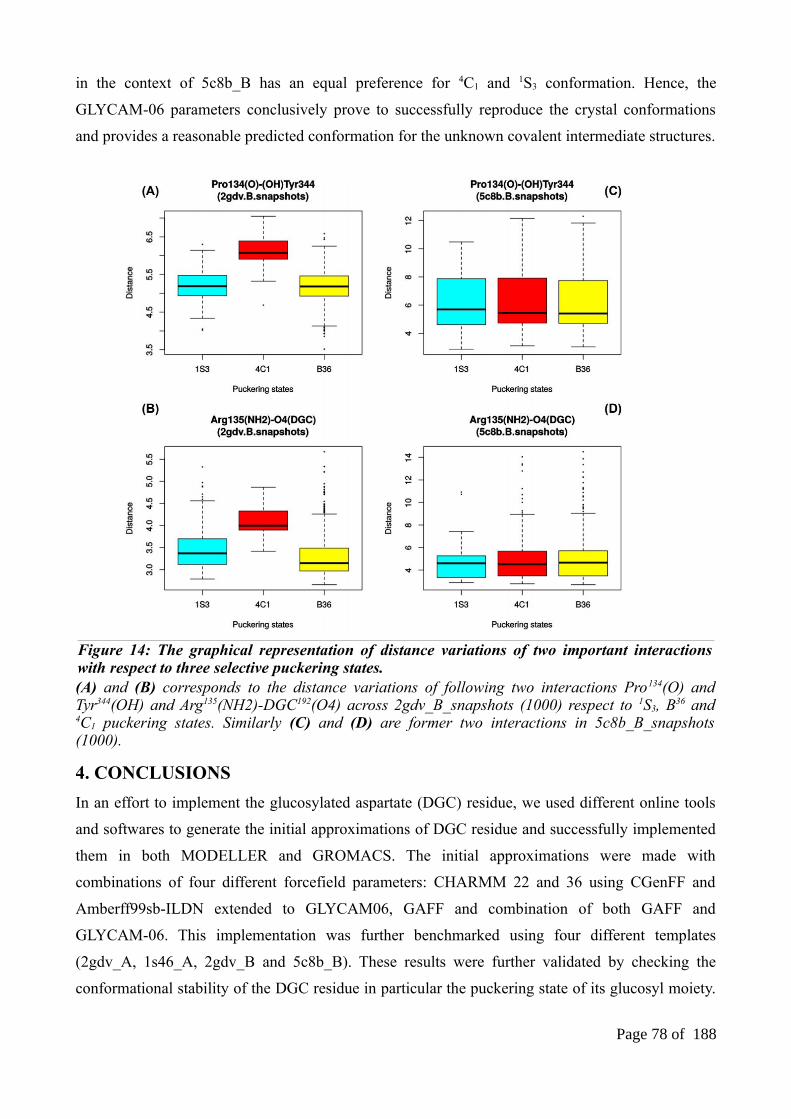
in the context of 5c8b_B has an equal preference for 4C1 and 1S3 conformation. Hence, the
GLYCAM-06 parameters conclusively prove to successfully reproduce the crystal conformations
and provides a reasonable predicted conformation for the unknown covalent intermediate structures.
(A) and (B) corresponds to the distance variations of following two interactions Pro134(O) andTyr344(OH) and Arg135(NH2)-DGC192(O4) across 2gdv_B_snapshots (1000) respect to 1S3, B36 and4C1 puckering states. Similarly (C) and (D) are former two interactions in 5c8b_B_snapshots(1000).
4. CONCLUSIONS
In an effort to implement the glucosylated aspartate (DGC) residue, we used different online tools
and softwares to generate the initial approximations of DGC residue and successfully implemented
them in both MODELLER and GROMACS. The initial approximations were made with
combinations of four different forcefield parameters: CHARMM 22 and 36 using CGenFF and
Amberff99sb-ILDN extended to GLYCAM06, GAFF and combination of both GAFF and
GLYCAM-06. This implementation was further benchmarked using four different templates
(2gdv_A, 1s46_A, 2gdv_B and 5c8b_B). These results were further validated by checking the
conformational stability of the DGC residue in particular the puckering state of its glucosyl moiety.
Page 78 of 188
Figure 14: The graphical representation of distance variations of two important interactionswith respect to three selective puckering states.

From our Modeller validation results, we suggest users choose any one of the parameter set among
the list that we mentioned in section 2.4 based on their objective as follows: (a) One can chose
either SET1 method or SET2 parameters to restrict Modeller to generate models with DGC residue
in native chair (4C1) conformation. (b) On the other hand, user can use SET3 parameters to explore
the DGC in other puckering conformations. We strongly advice users to chose SET3 parameters in
order to build biologically meaningful models of the DGC residue and to have better sampling
conformations in terms of puckering state of DGC residue. Similarly, we strongly propose users to
chose GLYCAM-06 parameters along with glucose-threonine analogs to study covalent
intermediates as it shows promising performance compared to other three mentioned parameters.
Interestingly, the results of our simulations using GLYCAM-06 forcefield parameters revealed the
impact of Q345F mutant in 5c8b_B on the loops conformations. We would like to carry out longer
simulations (in microseconds) ton 2gdv_A covalent-intermediate in order to see if there are events
leading to conformational changes in loops. We believe this might provide further insights about the
structure-function relationship of sucrose phosphorylases in general.
5. SUPPLEMENTARY INFORMATION
Table S1: List of the three tested MODELLER parameter sets.
S.NOAtom names FC
(Kpsi)Multiplicity
Phases (psi0)
i j k l SET1 SET2 SET3
1 OD2 C1 O5 C5 1.0000 3 0.00 0.00 109.40
2 *C1 C2 O5 OD2 62.0000 0 nil -34.25 -11.10
3 *C2 C1 C3 O2 62.0000 0 nil -34.40 -33.95
4 *C3 C2 C4 O3 62.0000 0 nil 29.60 34.00
5 *C4 C3 C5 O4 62.0000 0 nil -32.80 -34.00
6 *C5 C4 C6 O5 62.0000 0 nil -34.30 -31.10
NOTE: The SET1 parameters were originally derived using CGenFF without glucosyl moietyassociated improper’s and one problematic dihedral (OD2,C1,O5,C5) with weak penalty score(see also Table S2). SET2 parameters are similar to SET1 but have five more IMPR dihedralscorresponding to glucosyl moiety of DGC residue. These additional five parameters were filled withstandard force constant (62.0000) and multiplicity (0). All of their phase columns were manuallyincorporated with the respective Pymol measured improper values using the native (chair 4C1)conformation of DGC residue (pdb 1s46). By contrast, in SET3 all these 5 IMPR including 1dihedral phases (OD2,C1,O5,C5) were taken and embedded from distorted DGC residue (skewboat 1S3) (pdb 2gdv_A).
Table S2: List of CGenFF parameters along with penalty score and the type of parameters.
i j k l FC Multiplicity Phase PENALTY
BONDS
CG31 OBG5 - - 360.00 - 1.4150 4
CG31 CG31 - - 222.50 - 1.5000 EXISTING
Page 79 of 188
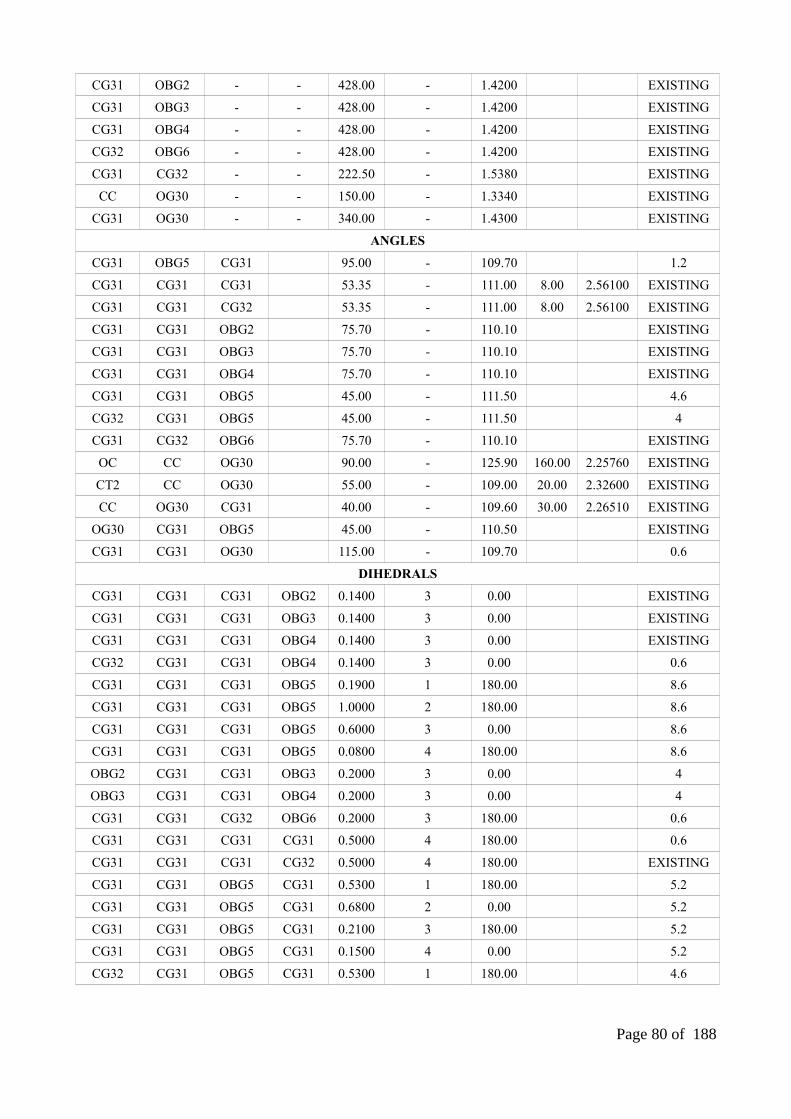
CG31 OBG2 - - 428.00 - 1.4200 EXISTING
CG31 OBG3 - - 428.00 - 1.4200 EXISTING
CG31 OBG4 - - 428.00 - 1.4200 EXISTING
CG32 OBG6 - - 428.00 - 1.4200 EXISTING
CG31 CG32 - - 222.50 - 1.5380 EXISTING
CC OG30 - - 150.00 - 1.3340 EXISTING
CG31 OG30 - - 340.00 - 1.4300 EXISTING
ANGLES
CG31 OBG5 CG31 95.00 - 109.70 1.2
CG31 CG31 CG31 53.35 - 111.00 8.00 2.56100 EXISTING
CG31 CG31 CG32 53.35 - 111.00 8.00 2.56100 EXISTING
CG31 CG31 OBG2 75.70 - 110.10 EXISTING
CG31 CG31 OBG3 75.70 - 110.10 EXISTING
CG31 CG31 OBG4 75.70 - 110.10 EXISTING
CG31 CG31 OBG5 45.00 - 111.50 4.6
CG32 CG31 OBG5 45.00 - 111.50 4
CG31 CG32 OBG6 75.70 - 110.10 EXISTING
OC CC OG30 90.00 - 125.90 160.00 2.25760 EXISTING
CT2 CC OG30 55.00 - 109.00 20.00 2.32600 EXISTING
CC OG30 CG31 40.00 - 109.60 30.00 2.26510 EXISTING
OG30 CG31 OBG5 45.00 - 110.50 EXISTING
CG31 CG31 OG30 115.00 - 109.70 0.6
DIHEDRALS
CG31 CG31 CG31 OBG2 0.1400 3 0.00 EXISTING
CG31 CG31 CG31 OBG3 0.1400 3 0.00 EXISTING
CG31 CG31 CG31 OBG4 0.1400 3 0.00 EXISTING
CG32 CG31 CG31 OBG4 0.1400 3 0.00 0.6
CG31 CG31 CG31 OBG5 0.1900 1 180.00 8.6
CG31 CG31 CG31 OBG5 1.0000 2 180.00 8.6
CG31 CG31 CG31 OBG5 0.6000 3 0.00 8.6
CG31 CG31 CG31 OBG5 0.0800 4 180.00 8.6
OBG2 CG31 CG31 OBG3 0.2000 3 0.00 4
OBG3 CG31 CG31 OBG4 0.2000 3 0.00 4
CG31 CG31 CG32 OBG6 0.2000 3 180.00 0.6
CG31 CG31 CG31 CG31 0.5000 4 180.00 0.6
CG31 CG31 CG31 CG32 0.5000 4 180.00 EXISTING
CG31 CG31 OBG5 CG31 0.5300 1 180.00 5.2
CG31 CG31 OBG5 CG31 0.6800 2 0.00 5.2
CG31 CG31 OBG5 CG31 0.2100 3 180.00 5.2
CG31 CG31 OBG5 CG31 0.1500 4 0.00 5.2
CG32 CG31 OBG5 CG31 0.5300 1 180.00 4.6
Page 80 of 188

CG32 CG31 OBG5 CG31 0.6800 2 0.00 4.6
CG32 CG31 OBG5 CG31 0.2100 3 180.00 4.6
CG32 CG31 OBG5 CG31 0.1500 4 0.00 4.6
OBG4 CG31 CG31 OBG5 0.2000 3 0.00 12
OBG2 CG31 CG31 OBG5 0.2000 3 0.00 12
OBG5 CG31 CG32 OBG6 0.1950 3 0.00 11.5
OG30 CC CT2 CT1 0.5300 2 180.00 0.6
CT2 CC OG30 CG31 2.0500 2 180.00 EXISTING
OC CC OG30 CG31 0.9650 1 180.00 EXISTING
OC CC OG30 CG31 3.8500 2 180.00 EXISTING
CG31 CG31 CG31 OG30 0.2000 3 180.00 4.6
OG30 CG31 CG31 OBG2 0.2000 3 0.00 5
CG31 CG31 OG30 CC 0.7000 1 180.00 0.6
OBG5 CG31 OG30 CC 0.7000 1 180.00 45
OG30 CG31 OBG5 CG31 1.0000 3 180.00 11.1
IMPROPER DIHEDRALS
CG CB OD1 OD2 62.0000 0 0.00 EXISTING
NOTE: Penalty score is used to assesses the accuracy of parameters where the guarantee is gradedby range of scores and recommends some prior validation. In such a way, the penalty score between0-10 does not need any further validation whereas in the score ranges from 10 to 50 and higherthan 50 needs some basic and strong validations respectively. Existing: parameters that alreadyexist in CGenFF.
Table S3: The list of DGC residue atom numbers, atom names, atom types and their respective ESPpartial atomic charges (Gaussian 09 program using the DFT method).
ATOM TYPES A and B: corresponds to modified CHARMM22 and 36 forcefields in MODELLERand GROMACS respectively using CGENFF parameters; ATOM TYPES C: corresponds tomodified Amberff99sb-ILDN forcefield using GLYCAM06, GAFF and combination of both GAFFand GLYCAM06 parameters)
ATOM NO ATOM NAMEATOM TYPES
ESP CHARGESA B C
1 HO1 - HA2 HC 0.156398
2 HO5 - HA2 HC 0.139604
3 HO6 - H H 0.383658
4 CB CT2 CT2A CT -0.395818
5 HO1 - HO6 H90 0.430239
6 N NH1 NH1 N -0.980233
7 OD1 OC OC O2 -0.456482
8 O6 OBG6 OBG6 O9h -0.600623
9 CG CC CC C 0.675898
10 HO4 - H91 H91 0.067879
11 HO3 - H91 H91 0.085951
12 HO2 - - - 0.381537
Page 81 of 188

13 CA CT1 CT1 CT 0.351527
14 O3 OBG3 OBG3 O9h -0.645005
15 OD2 OG30 OC O2 -0.570066
16 O O O O -0.392397
17 HO9 - H90 H90 0.433176
18 HO3 - HB1 H1 -0.041457
19 C4 CG31 CG31 Cg 0.023487
20 H10 - H90 H90 0.443566
21 C2 CG31 CG31 Cg 0.001339
22 C C C C 0.375315
23 C6 CG32 CG32 Cg 0.170606
24 HO6 - H92 H91 -0.026515
25 O4 OBG4 OBG4 O9h -0.642193
26 C3 CG31 CG31 Cg 0.372186
27 C1 CG31 CG31 Cg 0.640433
28 HO8 - H90 H90 0.419801
29 HO2 - H92 H91 0.049484
30 O2 OBG2 OBG2 O9h -0.591371
31 C5 CG31 CG31 Cg 0.085744
32 HO4 - - - 0.004348
33 O5 OBG5 Os Os -0.452623
34 HO7 - H91 H92 -0.023478
35 HO3 - H91 H91 0.039493
36 HO5 - H91 H91 0.086591
Table S1: The list of four known covalent intermediate structures from glycoside hydrolase family 13 with ß-D-Glucose substrate covalently linked to a nucleophile Asp residue.
PDB Enzyme Classification Organism Form Substrate state
2gdv_A Sucrosephosphorolase
Transferase Bifidobacteriumadolescentis
Glucosylintermediate
β-D-Glcp-(1-4)-Asp192 1S3
1s46_A Amylosucrase Transferase Neisseriapolysaccharea
Glucosylintermediate
β-D-Glcp-(1-4)-Asp286 4C1
3wy2_A Alphaglucosidase
Hydrolase Halomonassp.h11
Glucosylintermediate
β-D-Glcp-(1-4)-Asp202 4C1
4wlc_A Dextranglucosidase
Hydrolase Streptococcusmutans serotype
Glucosylintermediate
β-D-Glcp-(1-4)-Asp194 4C1
Page 82 of 188

Figure S15: The distributions of dihedral values using 100 models at two different phases 0.00 (A) and 109.4 (B)(The global minima of both the phases were highlighted in the dotted line box)
Page 83 of 188
Figure S16: Multiple structure alignment of four known covalent intermediate binding sites ofglycoside hydrolase 13 family.

(red; absent, green; present, grey; unique)
Page 84 of 188
Figure S17: The presence of HBONDS and van der waals interactions associated between all theindividual binding site residues and ß-D-Glucose of four covalent intermediate structures.

(red; absent, green; present, grey; unique)
Page 85 of 188
Figure S18: The presence of HBONDS associated with water molecules, binding site residues andß-D-Glucose of four covalent intermediate structures

Page 86 of 188
Figure S19: The equilibrations (NVT, NPT), radius of gyration and Root Mean Square Deviationof DGC incorporated covalent intermediate structures over 500-ps, 1ns and 100ns moleculardynamics simulation using CHARMM36 parameters.

Page 87 of 188
Figure S20: The graphical representation of the stability of system at equilibration (NVT andNPT) and the equilibrations (NVT, NPT), radius of gyration and Root Mean Square Deviation ofDGC incorporated covalent intermediate structures over 500-ps, 1ns and 100ns moleculardynamics simulation using GAFF parameters.

Page 88 of 188
Figure S21: The equilibrations (NVT, NPT), radius of gyration and Root Mean Square Deviationof DGC incorporated covalent intermediate structures over 500-ps, 1ns and 100ns moleculardynamics simulation using combination of both GLYCAM and GAFF parameters.

Figure S22: The equilibrations (NVT, NPT), radius of gyration and Root Mean Square Deviation ofDGC incorporated covalent intermediate structures over 500-ps, 1ns and 100ns moleculardynamics simulation using GLYCAM06 parameters.
As an exception to the simulation of 2gdv_A using GLYCAM06-alone, the time of equilibration NVTand NPT phases were extended to 1ns and 10ns respectively as the temperature and density of thesystem were not stabilized at 500 ps and 1ns respectively. A similar situation was also encounteredfor the NPT phase of 1s46 (GLYCAM06 alone): it was hence extended to 2ns to achieve stability.
Page 89 of 188
Chapter 3Rational explanation for observed
transglucosylation regio-selectivitypatterns of variants sucrose
phosphorylase: perspectives forengineering rare sugars
Part of this chapter yet to submit in “proceedings of the national academy of sciences”: Mahesh Velusamy1,2,3,Johann Hendrickx1,Tom Verhaeghe4,Yves-Henri Sanejouand1,Catherine Etchebest3,Frédéric Cadet2,3,Tom Desmet4 and Bernard Offmann1 (2018). Rational explanation for observed transglucosylation regio-selectivity patterns of variants sucrose phosphorylase: perspectives for engineering rare sugars.
Page 90 of 188
AbstractSucrose phosphorylase (SP) enzyme, EC 2.4.1.7, is a member of the glycoside hydrolase GH family
13 and is known to catalyse the reversible phosphorolysis of sucrose into α-D-glucose-1-phosphate
and D-fructose. It can also importantly be applied as a transglucosylase in vitro when presented
with alternative acceptor substrates like glucose to regioselectively form products like maltose and
rare disaccharides such as kojibiose and nigerose. We were motivated to provide a rational
explanation on the observed switch of regioselectivity of transglucosylation of some recently
reported sucrose phosphorylase variants. Towards this end, and owing to its double displacement
mechanism, we built 3D models of sucrose phosphorylase variants in their covalent glucosyl-
enzyme intermediate form using our newly parametrised glucosyl-aspartate residue coupled to
standard molecular modeling and optimization protocols. Subsequently, molecular docking studies
were conducted against both α/β-D-glucose to simulate the entry of this acceptor in the +1 site. The
preferred orientations of α/β-D-glucose in this site were compared across variants of the enzyme.
Our results indeed showed that some variants had a preferred binding mode for the acceptor while
others had mixed preferred orientations and that these preferences matches the experimentally
observed regioselectivities. Thus, this provides a rational explanation for the switched selectivity
found upon mutations and opens interesting perspectives for the engineering of SP for production of
rare sugars and original products with controlled glycosylation patterns. Our paper also provides a
general computational-based methodology useful in the field Glyco-enzymology engineering.
Page 91 of 188

1. IntroductionCarbohydrates, more commonly sugars, are generally perceived in the general public as source of
high calories and linked to metabolic disorders like diabetes and obesity 198,199. However, aside from
their reputation as being a source of energy, their other crucial and beneficial roles in biology is
largely unknown in the general public. For instance, a complex forms of carbohydrate fibers can aid
in digestion200, serve as precursors for pre-biotics and can regulate diabetes198,199. Noteworthily,
when attached to other aglycone molecules to form glyco-conjugates, they can tweak their stability,
solubility and bioavailability7,201,202. Thus, since few decades now, carbohydrates and glyco-
conjugates have gain considerable interests research and in food, cosmetics and pharmaceutical
industries198,199,203. However, their scarcity in nature hampers their commercial exploitation and
further development. Hence, the urge for alternatives have motivated search of novel synthetic
techniques that utilizes inexpensive materials. In that respect, Koenig-Knorr reaction and Fischer
glycosidation are some of the classically used chemical glycosidation methods9–11,204. However,
these chemical methods implements laborious, multi-steps, low yield protocols requiring
sophisticated (de)protections strategies. They also generate problematic wastes. Alternate methods
for glycosylation based on the use of enzymes are very promising in that respect199,204. Though
synthetic glyco-enzymes are generally specific for their substrates, they often display substrate
promiscuity.
In terms of synthetic activity, some glyco-enzymes are characterized by specific glycosylation
patterns or narrow regioselectivities while others are less regioselective26,27. Out of the wealth of
known synthetic glyco-enzymes, bacterial sucrose phosphorylases (SP’s) have drawn much
attention during the last decade. They indeed can transfer glucosyl moieties from sucrose to a wide
range of hydroxyl containing acceptor molecules owing to their transglucosylation activity179 and a
double displacement mechanism with retention of the initial anomeric configuration of the donor.
They are also attractive enzyme because they use as glucose donor sucrose that is cheap and can be
easily obtained from renewable resources. In that respect, sucrose phosphorylase from
Bifidobacterium adolescentis (BaSP) has attracted much attention since its transglucosylation
activity is not negligible, it is thermostable (58°C) and can be readily produced using protein
recombinant technologies. BaSP was shown to be able, in-vitro, to transfer glucose onto other
glucose moiety when donor sucrose and glucose acceptor are in equimolar conditions. The wild-
type BaSP enzyme generates two transglucosylation products in unequal proportions: maltose, a
common disaccharide and kojibiose, a rare disaccharide that is a pre-biotic. Other variants of BaSP
form alternate glycosylation patterns i.e have alternate regioselectivities and hence generate
different glycosides33,75,76,180. All the theoretical possible disaccharides that could result from the
coupling of two glucose entities by a linkages are listed in Scheme 1 below. Thus, BaSP and more
Page 92 of 188

generally, SP’s are regarded as promising biocatalysts for synthesis of phosphorylated sugars and
glycoconjugates43.
Scheme 1: Large panel of rare disaccharide sugars associated with sucrose phosphorylase
transglucosylation function using glucose acceptors.
Though SP’s can produce rare sugars from low-cost substrate like sucrose, their synthetic capacity
is hampered with the lack of selectivity77. The wild-type (WT) sucrose phosphorylase from
Bifidobacterium adolescentis (BaSP) displays a mixed regioselectivity and produced 64% of
maltose and 36% of kojibiose and a yield of nearly 100% (expressed as a percentage of sucrose
conversion) after 48h incubation at 37°C (Table 3). It is difficult to separate these two products. It is
hence at stake to find efficient solutions to overcome this issue. In a recent study, one of our
collaborators, Tom Desmet, applied a semi-rational approach to improve BaSP selectivity towards
kojibiose production77. Similarly, M Kraus et al engineered the selectivity of BaSP for nigerose
using a structure-based design approach78. Both teams published the list of mutants that altered
BaSP regioselectivity significantly (Table 1). These mutants, remarkably, alter the regio-selectivity
of transglucosylation on glucose acceptor from (α1, 4) to (α1, 2) and (α/1, 3)77,78. We were highly
motivated to provide a rational explanation for how these mutations altered the regioselectivity of
BaSP. We hypothesized that regioselectivity depends on the preferred orientations of glucose
acceptor upon binding to the covalent glucosyl-enzyme intermediate in the +1 (acceptor) site. In
order to check this hypothesis, we explored a computational approach to obtain atomic details of the
binding poses of α- or β-D-glucose in the +1 site of the glucosyl-enzyme intermediate form of the
enzyme. In our approach, we had to model variants of BaSP with a glucosyl moiety covalently
Page 93 of 188
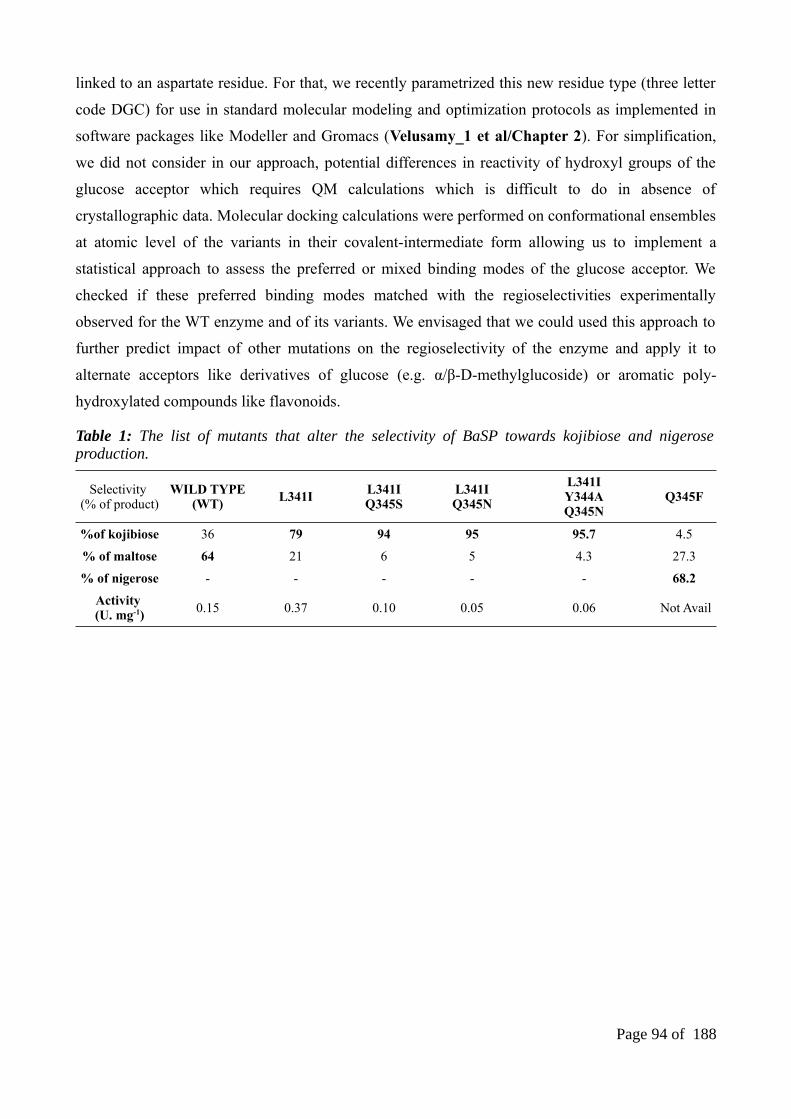
linked to an aspartate residue. For that, we recently parametrized this new residue type (three letter
code DGC) for use in standard molecular modeling and optimization protocols as implemented in
software packages like Modeller and Gromacs (Velusamy_1 et al/Chapter 2). For simplification,
we did not consider in our approach, potential differences in reactivity of hydroxyl groups of the
glucose acceptor which requires QM calculations which is difficult to do in absence of
crystallographic data. Molecular docking calculations were performed on conformational ensembles
at atomic level of the variants in their covalent-intermediate form allowing us to implement a
statistical approach to assess the preferred or mixed binding modes of the glucose acceptor. We
checked if these preferred binding modes matched with the regioselectivities experimentally
observed for the WT enzyme and of its variants. We envisaged that we could used this approach to
further predict impact of other mutations on the regioselectivity of the enzyme and apply it to
alternate acceptors like derivatives of glucose (e.g. α/β-D-methylglucoside) or aromatic poly-
hydroxylated compounds like flavonoids.
Table 1: The list of mutants that alter the selectivity of BaSP towards kojibiose and nigeroseproduction.
Selectivity (% of product)
WILD TYPE(WT)
L341IL341IQ345S
L341IQ345N
L341IY344AQ345N
Q345F
%of kojibiose 36 79 94 95 95.7 4.5
% of maltose 64 21 6 5 4.3 27.3
% of nigerose - - - - - 68.2
Activity (U. mg-1)
0.15 0.37 0.10 0.05 0.06 Not Avail
Page 94 of 188

2. MATERIALS AND METHODSOur methodological approach involves three different phases as summarized in Figure 1 and further
detailed below.
The purpose was to come with a rational explanation of the observed regioselectivity for variants ofBaSP. Phase I consists of the modeling at atomic level of glucosyl-enzyme intermediates of selectedsucrose phosphorylase variants and their assessment. Phase II involves molecular docking of α-and β-D-glucose onto these models and their subsequent analysis to build a database of dockingposes. In Phase III, the docking poses are filtered to identify and quantitate docking poses that areproductive
2.1 Dataset of sucrose phosphoryalse variants
Regioselectivity of variants of sucrose phosphorylase from Bifidobacterium adolescentis (BaSP)
were taken from already published data77,78. More specifically, data regarding the single mutant
L341I, the double mutants L341I/Q345N and L341I/Q345S, and the triple mutant
L341I/Y344A/Q345N were obtained from a protein engineering study aimed at finding variants for
improved production of kojibiose77. Data regarding the single mutant Q345F were obtained from a
study focused on engineering BaSP for nigerose production. Structural details for the WT enzyme
and the Q345F mutant were also obtained from the literature (see below)55,205.
2.2 Modelling of sucrose phosphorylase variants
An essential component of our methodological approach is the obtention of reliable models of
mutated versions of the enzyme with its nucleophile residue covalently linked to a glucosyl moiety.
Noteworthily, a crystal structure of BaSP (PDB: 2gdv chain A) contains such a covalently modified
Page 95 of 188
Figure 1: Overview of the three different phases of our methodological approach used in thisstudy..

residue (Asp192)55. However, the coordinates of this covalently linked aspartate residue was
deposited as a two distinct residues, Asp192 and the glucosyl moiety BGC700. Since the
glucosylated aspartate has to be considered as a single residue, both aspartate and glucosyl moieties
were merged into a single (non-standard) amino acid residue which was further referred as DGC.
The fusion into a single DGC residue was manually done by using Pymol software, Version 1.8.4188.
This DGC residue was transferred to the Q345F variant of BaSP (PDB: 5c8b Chain B) and models
of other variants of the enzyme. All the DGC force field parameters were derived as described
previously (Velusamy_1 et al/Chapter 2). Briefly, geometry and charges were calculated using
semi-empirical approaches and force constant using CHARMM General Force Field (CGenFF)
parachem web server (https://cgenff.paramchem.org/). Additional refinements on problematic
dihedral phases were required.
The initial template structure used for the modelling of all BaSP variants was that if its WT (PDB
2gdv, chain A). The impact of studied mutations on the structure is not known except for the Q345F
for which a crystal structure is available (PDB 5c8b). This structure shows that the mutation
presumably induced a major loop shift65,78 (see chapter 1 for detailed comparison between 5c8b)
with the repositioning of Tyr344 towards the inside of the catalytic site. Modelling such structural
rearrangements may reveal challenging. The key aspect is the ability to model the short and mid-
range structural perturbations provoked by the mutations. Three protocols were benchmarked for
their ability to reproduce the observed loop shift upon mutation of Gln345 into Phe starting from
the WT structure (PDB 2gdv_A) as template. These protocols are further described below. The one
that modelled best the loop shift was further retained for modelling of the other studied mutations.
The first protocol consisted in using the “mutate model” method implemented in Modeller154. We
modified the default optimization protocol within mutate model by extending the size of
optimization region to 7 Å around the mutated residue with fixed environment 7 Å. A random
deviation of 4 Å for the positioning of the atoms within this range was used. The glycosylated-
aspartate residue (DGC) during the optimisation was kept rigid in order to retain its original
puckering state of (1S3) as in the 2gdv_A structure while the surrounding residues were allowed to
move. Indeed, owing to the random deviation parameter used in the optimization protocol, this
DGC residue is expected to get disturbed.
2.3 Benchmarking the role of environment
As our main is to reproduce the impact of mutants towards regioselectivity, the conformational
space of variants should be sampled very well. But, either comparative modeling of variants or non-
Page 96 of 188

variants in modeller by default uses only the distance restraints coming from the template-target
alignments. Hence, the movement of atoms are restricted as they are restrained to their position in
the template which might leads to difficulties in assessing the impact of mutation as well as promote
poor conformational sampling of variants. In order to overcome this issue, we have used three
different protocol (discussed below) to relax the restraints around the mutant residue with different
environments. Hence, the size of environment in the context of reproducing the observed mutational
impacts of known crystal structures were assessed. For this purpose, we tried to capture the
experimentally observed repositioning of Tyr344 and the induced loop shifts from the mutated
version of (Q345F) SP product bound form structure (PDB: 5c8b chain B). To do that, a single
point mutation (Q → F) on position 345 was introduced on the DGC incorporated 2gdv structures
using mutate model and automodel methods. Subsequently, the consequences were observed on the
two loops (residues 336-344 and 132-137) with respect to the environments (4.5 Å, 6 Å and 8 Å)
used in the original mutate model protocol where as in automodel whole structure were
considered154,183,206.
2.4 Modelling of sucrose phosphorylase variants
As mentioned before, the comparative modelling using automodel in MODELLER only satisfies
the restraints in the given 3D space and it has no concern on the impact of mutation around the
mutated residues183,206. To overcome this obstacle, we have used mutate model as one among the
three protocol to produce better conformational sampling of variants. However, mutate model also
originally made to move only the mutated residue as same as that movement of atoms in
comparative modelling limited by distance restraints. Hence, we modified the default optimization
protocol where we extended the size of optimization region around the mutated residue with fixed
environment 7 Å (according to benchmarking optimization environment) along with a combination
of default random deviation 4 Å. In addition, the flexibility of DGC residue during the optimization
kept rigid as its original puckering state of (1S3) was expected to get disturb by random deviation
parameter. Since the mutate model method originally made for modeling single point mutation, the
wild type models were generated by mutating it to it s original residue i.e. incase of generating wild
type model for Q345F, “Q” residue on position 345 mutated to “Q” itself like “Q345Q” (limitations
of this detailed in supplementary experiments of mutate modeling). In contrast comparative
modeling, the mutate model takes only the details of mutation and their respective target structures
for performing mutation. Hence, we started our experiment directly with sucrose phosphorylase
structures (2gdv_A and 5c8b) that are complex with DGC residue and the list of mutation details.
Concerning the better sampling of variants, 100 models were generated for all the five mutants and
their respective wild type. As shown in Table 2, the individual 100 models were generated for both
mutants and their respective wild types which amounting to total of 1000 models. The models were
Page 97 of 188

further validated by checking the sampling of neighbour residues around the mutated residue. It was
further docking calculations and statistical analysis of productive pose.
Table 2: The statistics for number of models generated through the Mutate model method along
with details of mutants and wild type.
Mutants Wild typeRegionsize (Å)
Rand dev(Å)
Individual N° of models
Total N° ofmodels
Q345F Q345Q 7 4 100+100 200
L341I L341L 7 4 100+100 200
L341IQ345S L341LQ345Q.S 7 4 100+100 200
L341IQ345N L341LQ345Q.N 7 4 100+100 200
L341IY344AQ345N L341LY344YQ345Q 7 4 100+100 200
500+500 1000
Note: the N° of experiments consist of optimization region size (ranges from 7Å) combined with 1default random deviations 4Å.
2.5 Supplementary experiments of mutate modeling
In reference to the previous section, we envisaged that applying same region size around the
mutated and their respective wild type residue might promotes different set of wild type models
instead of one common to all the mutants, and thus it is not useful when comparing to the WT
experimental data. In order to find alternative way, the optimization region size and the refinement
step were benchmarked in two different ways: 1. the whole structure was optimized with random
deviation 0.001 Å following single refinement, 2. the global structure was optimized with random
deviation 0.001 following initial refinement on local region (4.5 Å) and random deviation (4 Å). It
was validated based on set of criteria. First, the optimization should not affect the important
interactions (stacking between Phe53-DGC192 and His234-NE2-DGC192-O2) that is believed to
have important role for the stability of SP active site. Secondly, the best protocol expected to
capture the important shift on Tyr344 and Tyr96 upon on single mutation (Q345F). Third, the
original puckering conformation of DGC residue should not affected by the optimization. Finally,
the docking of respective models against β-D-glucose able to find preferred Nigerose orientation as
observed in 5c8b with top pose and highest DeltaG78. At the end of the day, the decision of
choosing region size (local or global) and the no of refinement steps were made upon having
anyone protocol that satisfied all the mentioned criteria. In addition, the possibility of including
water molecules to the model were benchmarked as it plays major role on maintaining the
architecture of SP active site and the conformation of DGC residue55.
Page 98 of 188

2.6 Modeling of sucrose phosphorylase variants using automated comparativemodeling using automodel
In comparison to mutate model and produce one single wild type for all the selective variants,
modeling of variants also repeated with automodel method as it by default select all toms for the
optimization. In which, the limitation of comparative modeling (see above) was solved by relaxing
the restraints of resulted models as in mutate model protocol. The relaxation was done by adjusting
the weight of soft sphere restraints i.e. env.schedule_scale = physical.values(default=5.0,
soft_sphere=10). In the given example, the index number 5.0 at default indicates that tweak the
weightage only for soft sphere restraints207. In contrast to mutate model, the modeling was done
following target and template alignment step. Prior to alignment step, the DGC residue was
implemented to both template and variants sequence by replacing the letter “D” in to “O” on
position 192. Then, the alignment was performed between the DGC incorporated structures against
sequences of variants that embedded with residue “O”. The resulting alignment was further served
as for comparative modeling with automodel class. Both modelling and alignment was done by
using MODELLER 9.18183. As shown in Table 3, the modeling was performed with 10 different
weights of soft sphere restraints (ranges from 0 to 10) to explore the best cutoff for making better
conformational sampling.
Table 3: The statistics for number of models generated through the Automodel method along withdetails of used soft sphere restraint weights, mutants and wild type.
Mutants / Wild type
Weightssoft_sphere=(N)
N° of experiments
N° of models N° of total models
Wild type 0,1,2,3,4,5,6,7,8,9,10 11 100 1100
Q345F 0,1,2,3,4,5,6,7,8,9,10 11 100 1100
L341I 0,1,2,3,4,5,6,7,8,9,10 11 100 1100
L341IQ345S 0,1,2,3,4,5,6,7,8,9,10 11 100 1100
L341IQ345N 0,1,2,3,4,5,6,7,8,9,10 11 100 1100
L341IY344AQ345N 0,1,2,3,4,5,6,7,8,9,10 11 100 1100
Total 66 100 6600
Note: the N° of experiments consist of 11 different size of soft sphere restraint weights
The total of 6600 models were generated for all the 11 different weights where 100 models were
individually generated for all the five mutants including wild type (Table 3). The number of models
were maintained in 100 mainly to generate ensemble of variants conformations and for the same
reason the DGC residue was also treated flexible. At the end, the one soft sphere weight that able to
retained the conformation of DGC and gives better sampling of variants were selected for further
docking and regioselectively analysis. The accuracy of models and the sampling of conformational
space were validated respectively based on the distribution of DOPE SCORE and RMSD (backbone
Page 99 of 188

respect to the top model). In addition, the puckering state of DGC residue in automodels were
validated and compared to original conformation of 2gdv_A using in-house python scripts159.
2.7 Molecular docking of sucrose phosphorylase variants against glucose
As stated before, the preferred orientation of glucose acceptor in +1 site dictates the regioselectivity
and the product formation. So, in order to identify the relationship between the mechanism of
change in the glucose orientation and the resulting affinities towards Maltose/Kojibiose/Nigerose all
the five selective variants along with their wild type models in covalent intermediate form were
docked against β-D-glucose at donor site. All the docking were carried out with fixed receptor and
flexible ligands. For comparison, we repeated the same docking protocol using α-D-glucose as well.
Besides these two acceptors, we also extended the docking using other alternative acceptors. i.e. we
used α/β-D-methylglucosides as an acceptors to show that these two anomers of methyl glucosides
have different binding mode preference with different predicted regioselectivity. The ligands (α/β-
D-glucose and α/β-D-methylglucosides) were built in PDB format using carbohydrate builder
module of GLYCAM server160. Those PDB ligands were further converted in to PDBQT format
upon adding polar hydrogens, gasteiger charges and setting the torsions of the ligand to most active
torsion atoms. Similarly, the receptor also prepared in PDBQT format for all the variants and wild
type models in covalent intermediate form. All the docking inputs were prepared in autodock/vina
plugin and docking was carried out by AutoDock Vina using default parameters except number of
modes, exhaustiveness and energy range which was respectively increased to 100, 100 and 12174,208.
Prior to the docking the grid box was configured from the centre of glucosyl moiety of DGC residue
with the set of search space dimension (size-x= 22.50Å, size-y= 22.50Å, size-z=22.50Å), default
grid spacing (0.375Å) and coordinates of the center (center-x=26.74Å, center-y=59.41Å, center-z=-
37.44=60Å). Broyden-Fletcher-Goldfarb-Shanno algorithm was used for the conformational search.
2.8 Construction of sucrose phosphorylase database and identification ofreference product binding poses
Subsequent to the docking experiments, the docking poses were extracted and for each pose the
primary distance between the -OH groups of acceptors and C1 atom of glucosyl moiety attached to
DGC192. In addition, the distance of -OH groups of acceptors with respective to Glu232, Asp342,
Tyr196 and Arg135 (only for 5c8b) were calculated. The calculated distances were further stored in
to databases along with its Pose number, Model number, Binding energy and the respective DOPE
SCORE of the receptor models. Further, this distance database along with productive pose proposed
by Verhaeghe et al, 2016 were used to filtered the reference productive poses77. In which, the
Verhaeghe et al proposed schemes were used mainly to extract the productive orientations Maltose
(α/β-(1-4)) and Kojibiose (α/β-(1-2)) of glucosyl intermediate form of 2gdv_A structure. At the
Page 100 of 188

same time, the rest of Nigerose (α/β-(1-3)) productive references of both glucosyl intermediate
conformation (2gdv_A) and product form (5c8b_b) were solely derived based on our distance
scheme. The filtration of reference productive orientations were performed using in-house python
scripts and set of MySQL queries. Once, we had the reference poses in hand it was further used for
calculating RMSD for each docking poses and subsequently added the sucrose phosphorylase
database.
2.9 Statistical analysis for productive orientations
Following the construction of library of docking poses, set of statistical analysis were performed
across the ensemble of conformations to identify the productive docking poses that are compatible
towards Maltose, Kojibiose, Nigerose. As shown in Scheme 2, the productive poses were screened
based on the five set of statistical analysis involves: (A). Frequency of top ranking poses, (B).
Frequency of poses that satisfies the distance criteria, (C). Poses with Best DOPE SCORE
following the distance criteria (-OH groups and C1), (D). Least RMSD respect to the reference
poses following the distance criteria (-OH groups and C1), and (E). Frequency of poses that has
highest and least STD/AVG binding energy. All these five experiments were performed across all
the selective mutants and wild type poses using in-house MySQL queries.
In (A), it starts from extracting top ranking poses from all the variants and mutant models anddecision of productive orientations are given to highest frequency. (B) is also similar to the formerone but it considers only the poses that satisfies our distance criteria given in (Supplementaryinformation Figure S1). Both (C) and (D) follows same protocol where it consider the poses thathas best dope score and RMSD respectively with satisfied distance criteria between -OH groupsand C1 atom of DGC192. Notably, in both the methods the decision can be extended to othercriteria (Pose no, BE, RMSD) upon having two poses sharing same Dope score/RMSD anddistance. In (E), the productive orientation is decided based on the frequency of highest and leastSTD/AVG binding energy poses.
Page 101 of 188
Scheme 2: Illustration of statistical schemes for identify the productive docking poses.
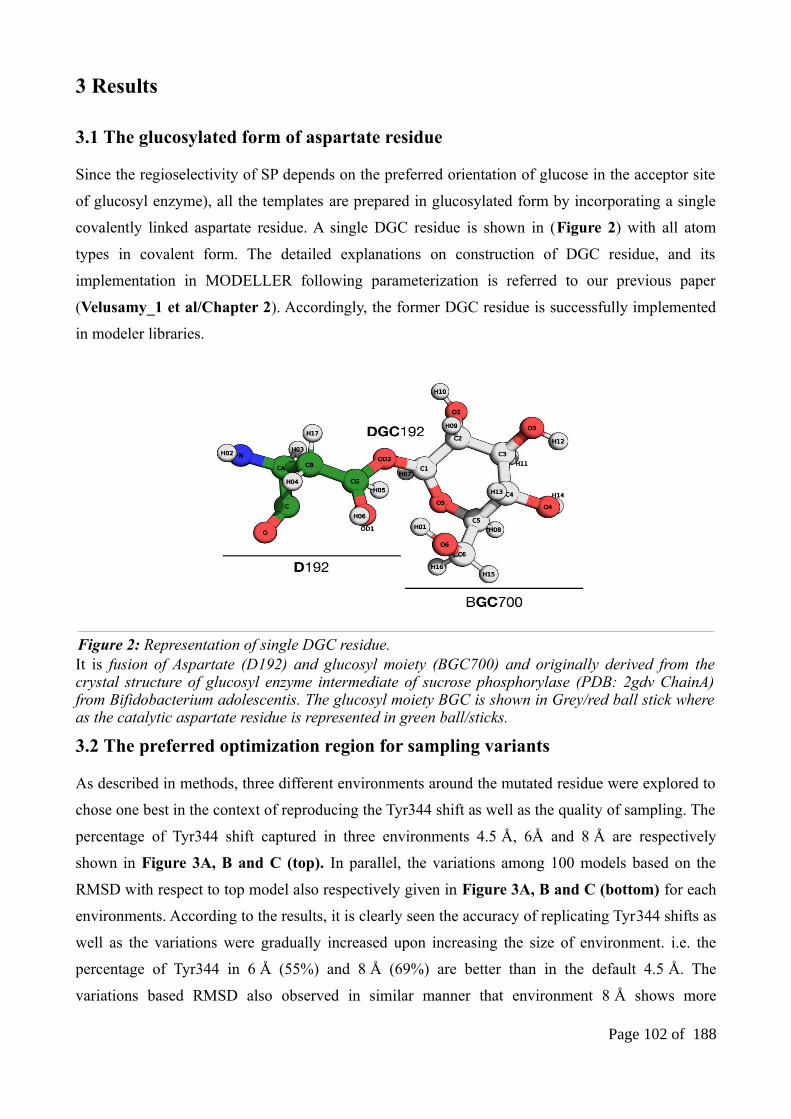
3 Results
3.1 The glucosylated form of aspartate residue
Since the regioselectivity of SP depends on the preferred orientation of glucose in the acceptor site
of glucosyl enzyme), all the templates are prepared in glucosylated form by incorporating a single
covalently linked aspartate residue. A single DGC residue is shown in (Figure 2) with all atom
types in covalent form. The detailed explanations on construction of DGC residue, and its
implementation in MODELLER following parameterization is referred to our previous paper
(Velusamy_1 et al/Chapter 2). Accordingly, the former DGC residue is successfully implemented
in modeler libraries.
It is fusion of Aspartate (D192) and glucosyl moiety (BGC700) and originally derived from thecrystal structure of glucosyl enzyme intermediate of sucrose phosphorylase (PDB: 2gdv ChainA)from Bifidobacterium adolescentis. The glucosyl moiety BGC is shown in Grey/red ball stick whereas the catalytic aspartate residue is represented in green ball/sticks.
3.2 The preferred optimization region for sampling variants
As described in methods, three different environments around the mutated residue were explored to
chose one best in the context of reproducing the Tyr344 shift as well as the quality of sampling. The
percentage of Tyr344 shift captured in three environments 4.5 Å, 6Å and 8 Å are respectively
shown in Figure 3A, B and C (top). In parallel, the variations among 100 models based on the
RMSD with respect to top model also respectively given in Figure 3A, B and C (bottom) for each
environments. According to the results, it is clearly seen the accuracy of replicating Tyr344 shifts as
well as the variations were gradually increased upon increasing the size of environment. i.e. the
percentage of Tyr344 in 6 Å (55%) and 8 Å (69%) are better than in the default 4.5 Å. The
variations based RMSD also observed in similar manner that environment 8 Å shows more
Page 102 of 188
Figure 2: Representation of single DGC residue.

variations (0-0.36) compare to 6Å (0-0.06) and 4.5 Å (0-0.07). Hence, we decided to keep our
optimization region around the mutated residue with larger size 8 Å but considering the future
modeling of triple mutants and more than that might leads to poor models (benchmark on this
given below). So, in order to avoid that further we kept the size (7 Å) in between 6 Å and 8 Å as it
can’t be neither too small nor large. In addition to this, the comparison results of same experiments
using automodel is shown in Figure 3D. From which it is clear that though it has better sampling
(variation of 0-0.55), it fails to replicate the Tyr344 in major number. These results clearly shows
that mutate model with larger optimization environment is better option both in terms of predicting
the impact of mutation on the neighbour residues as well as sampling variants. According to these
observations mutate models that was generated using the regional optimization 7 Å were carried out
for further docking and regioselectivity analysis.
The percentage of Tyr344 shift as well as their respective sampling sizes obtained through 4.5Å, 6Åand 8Å using mutate model methods in are given in (A) (B) and (C) respectively. In comparison, thesimilar details generated using automodel method is given in (D).
3.3 Validation of mutate models and sampling assessment
Since our main purpose is to generate ensemble conformations of mutants, all the mutate models
were assessed by looking at their conformational sampling along with standard assessment scores.
The distinction of RMSD and DOPE SCORE for all the five individual mutants are shown in
supplementary informations Figure S7. From which, it is clear that all the mutant models are
Page 103 of 188
Figure 3: Comparison of different different optimization environment in the context ofreplicating Tyr344 repositioning (on top) and sampling size based on RMSD distribution(bottom).

reasonably well sampled with wider variations in the limited environment. Mean while the folding
of whole structure also maintained with average of ~65K DOPE SCORE in all the models. The
conformational sampling of all the five selective mutants along with their wild types are shown in
Figure 4A. Comparing to all the mutants, the better sampling is achieved for L341IQ345S and its
wild type with an average of 1.25 RMSD deviation. Also, by seeing the overall RMSD distribution,
the size of sampling varies according to the type of mutants and residues but globally all the
mutants are reasonably sampled with better DOPE SCORE.
The conformational sampling of mutants and their respective wild types are shown in (A). In whichall the are optimized under the circumstance of 7 Å optimization region around the mutate residuesalong with the randomization of atoms (4 Å) within this distance. The same regional optimizationapplied for both wild type and mutants. In contrast to the mutate model protocol, the whole modelswere subjected to optimization in automodel protocol (B) along with soft sphere restraints weight10. In the (C) protocol, all the mutants are sampled using regional optimization using mutate modelprotocol while wild-type that are common to all the mutant is subjected to global optimization usingautomodel method.
3.4 Molecular docking results and sucrose phosphoryalse database
The set of statistical schemes (see methods) are used to assess the docking results and further
regioselectivity analysis. Hence, all the docking poses and their associated details (Pose rankings,
Binding energy, DOPE SCORE) were stored in to our database called sucrose phosphorylase. The
Page 104 of 188
Figure 4: Comparison of three different protocol used in the sampling of selective SP variants.

number of models and docking poses entries details are shown in supplementary informations
Table S1. In addition, the details of RMSD and distances of important interactions were added to
the existing database. To do that set of reference poses for Maltose, Kojibiose and Nigerose
products were defined for both α-D-Glucose and β-D-Glucose acceptors. As mentioned before, the
reference pose for Maltose (Figure 5 A and D) and Kojibiose (Figure 5 B and E) from covalent
glucosyl-enzyme intermediate (2gdv_A) and the important associated interactions were defined
based on the productive poses and interactions (of Verhaeghe et al 2016)77. Accordingly, the list of
interactions were taken in to the account for all the poses as follows: 1. the hydrogen bonding
distances from the acid/base catalyst (Glu232) and -OH groups, 2. the -OH groups close to the
anomeric carbon of donor substrate (DGC192-C1/-OH), and 3. hydrogen bonding distances
between -OH groups and Asp342. Similarly, the productive pose of Nigerose and its key
interactions were inherited from the M Kraus et al 201678. In accordance with the hydrogen bonding
between O1/O6 groups and OH of Tyr196 (accommodate more space for C6 group in Q345F
mutant whereas in wild type enzyme it makes steric clash and leads to no Nigerose) was taken into
the account for Nigerose forms as shown in Figure 5 C and F. In addition to this, the interaction
between -OH groups and Arg135 from loop B (132-137) also considered as an another key
interaction for Nigerose form. But the interactions associated with Arg135 considered only in the
models of Q345F and its wild types (Figure 5E and L) as it forms interactions to the +1 site only in
this product bound conformation upon rearrangement of loop B. Subsequently, the reference
Maltose and Kojibiose orientations in Q345F and its wild-type models were defined with the list of
hydrogen bonding interactions between -OH groups and DGC192(C1)/Glu232/Tyr196/Arg135.
Notably, here in Q345F models none of the interactions associated with Asp342 were not
considered as it moves far away from the +site upon loop movements. These respective orientations
for both α and β forms are shown in (Figure 5 G and H) and (Figure 5 J and K) respectively. The
similar protocol was applied for screening the productive poses of α-D-Methylglucosidase and β-D-
Methylglucosidase acceptors. The reference poses for the same along with the key distances are
shown in supplementary informations Figure S8 (A-K), and the respective model and docking
pose entries in sucrose phosphorylase databases are shown in supplementary informations Table
S2. Further regioselectivity analysis were performed on this database of ensemble conformations is
discussed below.
Page 105 of 188

The poses on top corresponds to the docking of α-D-glucose (A, B, C) and β-D-glucose (D, E, F)into the covalent glucosyl-enzyme intermediate (2gdv_A) of the kojibiose selective mutants and wildtypes. Similarly, the poses of (G, H, I) and (J, K, L) respectively corresponds to the docking of α-D-glucose and β-D-glucose in to the Q345F mutants and its wild type models based on 5c8b structure.The prepared orientations towards Maltose (O4-C1), Kojibiose (O2-C1), Nigerose (O3-C1)products are highlighted in yellow circles while the rest of -OH groups are shown in white circles.Also the distances associated with O1, O2, O3, O4 and O6 are respectively colored in grey, ocean
Page 106 of 188
Figure 5: The reference productive poses for α-D-glucose and β-D-glucose acceptors

blue, blueberry, black and brown colors. (Green: receptors; white ball/sticks: glucose acceptor andglucosyl moiety of DGC192 residue; covalent residue: DGC192; general acid/base: Asp232).
3.5 Regioselectivity analysis of mutate models and the respective docking poses
In order to provide rational explanations for the observed regioselectivity set of statistical analysis
were performed. The earlier analysis was performed only on the ensemble of β-D-Glucose docking
poses based on classical DOPE SCORE, RMSD, Binding energy and top ranking pose. The
respective results are given in supplementary informations Table S3-S6. But none of these analysis
were able to shows the preference for neither kojibiose nor Nigerose productions as observed in
Verhaeghe et al 2016 and M Kraus et al 2016 respectively77,78. So, consequently the same analysis
were carried out based on distance scheme (as mentioned in methods) where we defined the set of
distances in range (supplementary informations Figure S12) for calculating the frequency of
productive (Maltose, Kojibiose and Nigerose) poses. The frequency of product poses were
calculated for both α/β-D-Glucose acceptors and the respective result is shown globally for binding
modes of both acceptors (Table 4).
Table 4: Global analysis of binding modes of α/β-D-Glucose acceptors based on mutate model
Mutants/WTO4
(Maltose %)O2
(Kojibiose%)O3
(Nigerose%)
WILD 54.2■ 30.3 15.4
L341I 39.2 50.9■ 9.8
L341IQ345S 33.3 43.6■ 22.9
L341IQ345N 40.4 49.4■ 10.1
L341IY344AQ345N 27.4 53.2■ 19.3
Q345F 31.6 0.2% 68.1■
Note: the product binding modes are given in percentage; (■) Preferred binding modes accordingto observed selectivity
Table 5: Global analysis of binding modes of α/β-D-methylglucosides based on mutate model
α-D-methylglucoside β-D-methylglucoside
Mutants/WTO4
(Maltose %)O2
(Kojibiose %)O3
(Nigerose %)O4
(Maltose %)O2
(Kojibiose %)O3
(Nigerose %)
WILD 17.5 47.9 † 34.5 69.1 † 17.1 13.7
L341I 2.8 50.0 † 47.1 59.7 † 11.9 28.2
L341IQ345S 13.7 62.8 † 23.8 51.9 † 24.5 23.5
L341IQ345N 25.0 46.1 † 28.8 58.5 † 21.2 20.2
L341IY344AQ345N 17.6 54.1 † 28.2 50.6 † 27.2 22.0
Q345F 35.6 1.1 63.2 † 18.1 0.0 81.8 †
Note: the product binding modes are given in percentage; (†) Preferred binding modes according toour predictions
Page 107 of 188
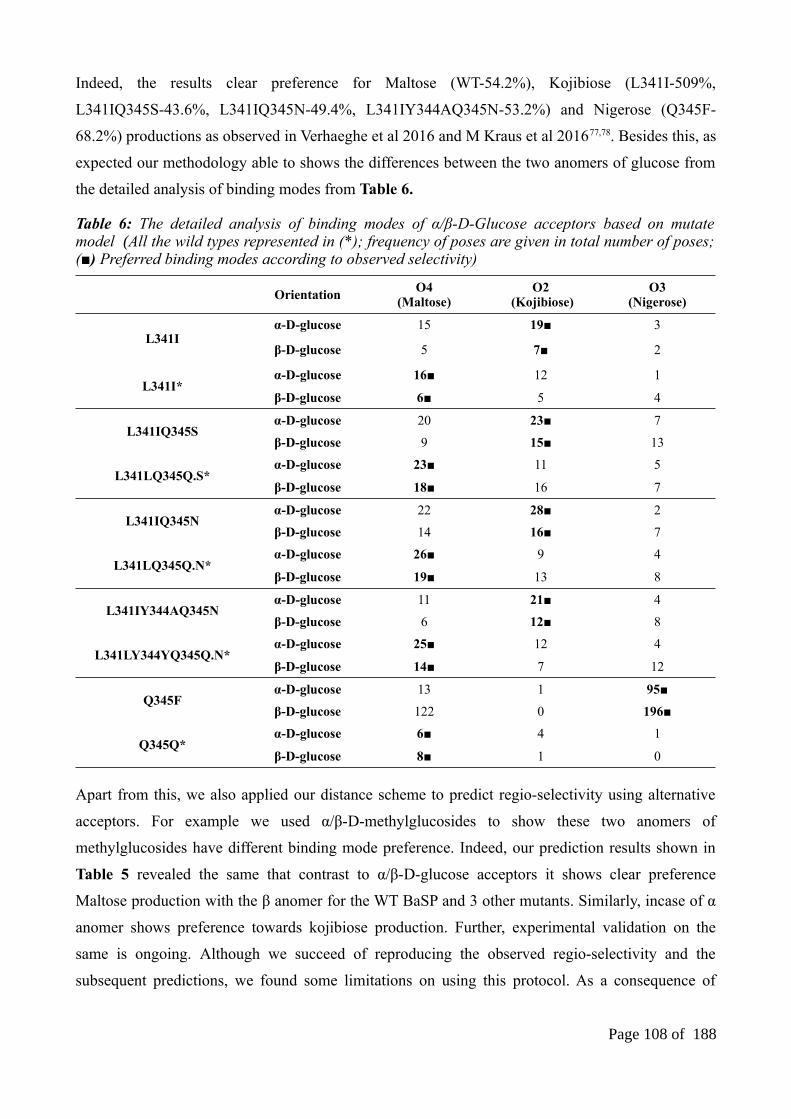
Indeed, the results clear preference for Maltose (WT-54.2%), Kojibiose (L341I-509%,
L341IQ345S-43.6%, L341IQ345N-49.4%, L341IY344AQ345N-53.2%) and Nigerose (Q345F-
68.2%) productions as observed in Verhaeghe et al 2016 and M Kraus et al 201677,78. Besides this, as
expected our methodology able to shows the differences between the two anomers of glucose from
the detailed analysis of binding modes from Table 6.
Table 6: The detailed analysis of binding modes of α/β-D-Glucose acceptors based on mutatemodel (All the wild types represented in (*); frequency of poses are given in total number of poses;(■) Preferred binding modes according to observed selectivity)
OrientationO4
(Maltose)O2
(Kojibiose)O3
(Nigerose)
L341Iα-D-glucose 15 19■ 3
β-D-glucose 5 7■ 2
L341I*α-D-glucose 16■ 12 1
β-D-glucose 6■ 5 4
L341IQ345Sα-D-glucose 20 23■ 7
β-D-glucose 9 15■ 13
L341LQ345Q.S*α-D-glucose 23■ 11 5
β-D-glucose 18■ 16 7
L341IQ345Nα-D-glucose 22 28■ 2
β-D-glucose 14 16■ 7
L341LQ345Q.N*α-D-glucose 26■ 9 4
β-D-glucose 19■ 13 8
L341IY344AQ345Nα-D-glucose 11 21■ 4
β-D-glucose 6 12■ 8
L341LY344YQ345Q.N*α-D-glucose 25■ 12 4
β-D-glucose 14■ 7 12
Q345Fα-D-glucose 13 1 95■
β-D-glucose 122 0 196■
Q345Q*α-D-glucose 6■ 4 1
β-D-glucose 8■ 1 0
Apart from this, we also applied our distance scheme to predict regio-selectivity using alternative
acceptors. For example we used α/β-D-methylglucosides to show these two anomers of
methylglucosides have different binding mode preference. Indeed, our prediction results shown in
Table 5 revealed the same that contrast to α/β-D-glucose acceptors it shows clear preference
Maltose production with the β anomer for the WT BaSP and 3 other mutants. Similarly, incase of α
anomer shows preference towards kojibiose production. Further, experimental validation on the
same is ongoing. Although we succeed of reproducing the observed regio-selectivity and the
subsequent predictions, we found some limitations on using this protocol. As a consequence of
Page 108 of 188

applying same regional optimization for both wild type and mutants, we get five different set of
wild types (L341L, L34LQ345Q.S/N, L341LY344YQ345Q and Q345Q) with respect to
optimization environment. Also the same reason leads to different number of total binding modes
for as shown in Table 6.
Hence, we tried to perform optimization on whole structure by which we can have one single wild-
type as well as similar optimization protocol for both wild type and mutants. To accomplish that as
mentioned in methods, modelling was performed on 2gdv_B structure following Q345F single
point mutation and global optimization with 0.0001Å of cap atom shift (parameter that limits the
atomic shifts along one axis). Though we were able to succeed with the modelling and better
sampling, the optimization on global structure leads to destabilization of binding site as well as
failed to replicate the Tyr344 shift. For example, as shown in Figure 6 (1) the architecture of
binding site was disturbed with the loss of following two important interactions: 1. CH..Pi
interaction between Phe53 and glucosyl moiety of DGC residue and 2. the minimal distance (6.4Å)
between His234 and the glucosyl moiety of DGC residue was curtailed to clash (3.5Å). in order to
solve this further we added 9 water molecules to the global optimization as it found to be
responsible for the stability of binding site as well as the conformation of DGC residue55.
The global optimization of mutate models without water molecules and the respective effects onbinding site residues are shown in (1). In which, emphasized the loss of three important interactions
Page 109 of 188
Figure 6: Towards the implementation of global optimization in mutate models.

such as CH..Pi interaction between the glucosyl moiety of DGC residue and Phe53, loss minimaldistance between His234 and DGC residue and no repositioning of Tyr344. Similarly, the effect ofglobal optimization on water bridges are shown in (2). Further, the two consecutive local andcombination of local and global optimizations are respectively shown in (3) and (4) where only theaccurate models from local optimization were subjected to global optimization. Also shown theassociated effects of water bridge, Phe53, His234 and Tyr344. (Green: 5c8b structure; Blue: singlepoint mutant (Q345F) models of 2gdv_B; White sticks: Phe53, His234, Tyr344 and DGC residuesof models and the respective residues corresponds to 5c8b is represented in Green color; Redspheres: Water molecules)
However, it doesn’t help to solve the issue instead as shown in Figure 6 (2) the hydrogen bonding
bridges between water molecules were disturbed by the optimization. To fix this issue, further the
modelling was repeated with double optimization where the initial optimization was performed on
local environment (4.5 Å) around 345 position with 9 water molecules. By which, we were
successfully able to predict the impact of mutation on the environment (50% Tyr344 shift) without
disturbing binding site as well as water bridges (Figure 6(3)). Subsequently, models with Tyr344
shifts were subjected to global optimization using same protocol and this time as shown in Figure 6
(4) we were successfully retained the Tyr344 shift, water bridges (most of them), CH..Pi interaction
between Phe53 and DGC ring moiety. However, we were unable to retain the puckering
conformation of DGC residue as well as the minimal distance between His234 and DGC (O2) atom
that leads to narrow binding site and prevents the accommodation of glucose acceptors on the site
(supplementary informations figure S9). After all this unsuccessful attempts, the list of average
restraints associated with Phe53 and His234 residues were introduced to maintain the binding site
but still it was unsuccessful. Hence, finally we made an alternative protocol using automodel (see
methods) to generate ensemble of variants and wild type models. Also, these wild type models were
combined with mutate models. The detailed explanations on these results are discussed below.
3.6 Validation of automodels and sampling assessment
Similar to the validation of mutate models, the conformational sampling and quality of automodels
were assessed using frequency of RMSD and DOPE SCORE respectively. In addition, the
puckering state of DGC residue also benchmarked as it was treated flexible during the optimisation.
We performed all these three validations together on 6600 models to chose one best optimisation
protocol with respect to soft sphere restraints weight. Accordingly, the protocol with soft sphere
weight 10 was able to reproduce the conformation of DGC residue as observed in crystal structure
(2gdv_A) as well as the predicted Q345F mutant conformation (according to Velusamy_1 et
al/Chapter 1, the mutant form shares the equal amount of 4C1 and sum of 1S3+B36 puckering states).
The respective puckering counts comparison with remaining 10 experiments is shown in
supplementary informations table S7. Also, the relevant energy details are represented through
Page 110 of 188

Cremer-Pople puckering plot in Supplementary informations figure S10. Apart from retaining the
original conformation, our protocol able to produce better sampling as shown in Figure 4B with
wider variations with respect to model number 1 (Supplementary informations figure 11) and wild
type models (Supplementary informations table S8). At the same time, the distribution of DOPE
SCORE in Supplementary informations table S7 shows that the geometry of models doesn’t
affected by global optimization.
3.7. Regioselectivity analysis of automodels and the respective docking poses
Considering all the validations above, all the automodels generated through global optimization
with soft sphere weight 10 were subjected to molecular docking against α/β-D-Glucose/ α/β-D-
Methylglucosidase acceptors. The respective docking results were further converted to distance
databases (Supplementary informations table S9-S10) and repeated the same statistical analysis of
productive pose based on distance scheme (Supplementary informations Figure S13).
Table 7: Global analysis of binding modes of α/β-D-Glucose acceptors based on automodel (theproduct binding modes are given in percentage; (■) Preferred binding modes according to observedselectivity)
Mutants/WTO4
(Maltose %)O2
(Kojibiose%)O3
(Nigerose%)
WILD 45.4■ 42.0 12.5
L341I 44.0 49.3■ 6.6
L341IQ345S 31.3 53.4■ 15.11
L341IQ345N 39.2 46.7■ 14.0
L341IY344AQ345N 32.1 48.2■ 19.5
Q345F 12.9 3.7 83.3■
Table 8: Global analysis of binding modes of α/β-D-methylglucosides based on automodel (theproduct binding modes are given in percentage; (†) Preferred binding modes according to ourpredictions)
α-D-methylglucoside β-D-methylglucoside
Mutants/WTO4
(Maltose %)O2
(Kojibiose %)O3
(Nigerose %)O4
(Maltose %)O2
(Kojibiose %)O3
(Nigerose %)
WILD 8.6 48.2 † 43.1 68.6 † 13.7 17.6
L341I 12.7 60.0 † 27.2 64.5 † 12.9 22.5
L341IQ345S 3.2 55.7 † 40.9 44.8 † 18.3 36.7
L341IQ345N 8.8 64.5 † 26.5 52.4 † 16.3 31.1
L341IY344AQ345N 3.0 74.2 † 22.7 50.0† 17.3 32.6
Q345F 27.2 9.0 63.6 † 8.0 1.3 90.6†
Indeed, we were successfully able to reproduce the experimental regioselectively as well as the
predicted productive binding modes of alternative acceptors α/β-D-methylglucosides. The
Page 111 of 188

associated results are shown in Table 7 and 8 which respectively shows the mixed regio-selectivity
(45.4% of Maltose in WT; 49.3%, 53.4%, 46.7%, 48.2% of kojibiose in the mutants L341I,
L341IQ345S, L341IQ345N, L341IY344AQ345N respectively; 83.3% of Nigerose Q345F) for
glucose acceptors and reveals the different binding mode preference in using α/β-D-
methylglucosides acceptors.
Table 9: The detailed analysis of binding modes of α/β-D-Glucose acceptors based on automodel
OrientationO4
(Maltose)O2
(Kojibiose)O3
(Nigerose)
WILD TYPEα-D-glucose 16■ 15 6
β-D-glucose 24■ 22 5
L341Iα-D-glucose 14 16■ 2
β-D-glucose 19 21■ 3
L341IQ345Sα-D-glucose 14 16■ 5
β-D-glucose 13 30■ 8
L341IQ345Nα-D-glucose 18 23■ 8
β-D-glucose 24 27■ 7
L341IY344AQ345Nα-D-glucose 11 18■ 5
β-D-glucose 17 24■ 12
Q345Fα-D-glucose 3 1 73■
β-D-glucose 4 1 38■
Note: All the wild types represented in (*); frequency of poses are given in total number of poses;(■) Preferred binding modes according to observed selectivity
Table 10: The detailed analysis of binding modes of α/β-D-Glucose acceptors based on automodel and mutate model
OrientationO4
(Maltose)O2
(Kojibiose)O3
(Nigerose)
WILD TYPEα-D-glucose 16■ 15 6
β-D-glucose 24■ 22 5
L341Iα-D-glucose 15 19■ 3
β-D-glucose 5 7■ 2
L341IQ345Sα-D-glucose 20 23■ 7
β-D-glucose 9 15■ 13
L341IQ345Nα-D-glucose 22 28■ 2
β-D-glucose 14 16■ 7
L341IY344AQ345Nα-D-glucose 11 21■ 4
β-D-glucose 6 12■ 8
Q345Fα-D-glucose 13 1 95■
β-D-glucose 122 0 196■
Note: All the wild types represented in (*); frequency of poses are given in total number of poses;(■) Preferred binding modes according to observed selectivity
Page 112 of 188

More over, our latest protocol using automodel and combination of both (as shown in Figure 4C
wild type of automodel and mutate models) able to show the binding mode differences between two
anomers of glucose with one single wild type unlike in mutate model method. The respective results
are shown in Table 9 and 10 and hence the rational explanations for observed regioselectively was
successfully provided with three different protocols.
4. DiscussionDue to the exponential application of glucosylated compounds in industry, it was vastly explored
by chemical techniques to outcompete its scarcity in nature. However, most of the attempts through
chemical synthesis regarded as an inefficient, time consuming and leads to low yield. Hence, the
enzyme biocatalyst came into the light to meet the demand where one among them is sucrose
phosphorylase considered as an interesting candidate because of it unique transglucosylation
function. Of this note, it can able to produce list of rare disaccharides upon transferring the enzyme
glucosyl moieties to the acceptor. However it falls in lack of selectivity and subsequently there are
many attempts were explored to overcome the issue. Indeed, our collaborator Tom and the other
team from M Kraus group succeeded on this aspect and respectively altered the selectivity for
Kojibiose and Nigerose by applying protein engineering combined with semi rational mutagenesis
and structure based design. This motivated us to explore additional mutants as well as some
alternative acceptors.
In this work, we applied computational modelling, docking approaches and statistical analysis to
build an efficient protocol that provides rational explanations of observed regioselectivity. Indeed,
our protocol displays the preferred orientations according to our hypothesis (see above) as well as
shown the reasonable predictions for alternative acceptors. To accomplish this we have notably
implemented the covalently linked aspartate residue (DGC as in Figure 2) in modeller libraries
according to the protocol based on our recent work (Velusamy et al). Subsequently, it was applied
to model variants using both mutate model and automodel methods employed with rigid and
flexible DGC residue respectively. Of note three different modelling protocols were remarkably
explored in order to have better conformational sampling of variants and wild type. Accordingly,
the sampling was benchmarked with three different optimization size as shown in (Figure 4) in
following order: (A). Regional optimization (7 Å) around the mutate residue along with random
deviation (4 Å) was applied in mutate models and their respective wild types. (B). All the
automodels (mutants and their respective one single wild type) were subjected to global
Page 113 of 188

optimization along with soft sphere weight 10. Combination of both mutate model (for mutants
alone) and automodel (for wild type alone) were employed as protocol (C). Consequently, these
three different protocols were assed based on the sampling, quality of models and the reproducibly
of observed mutational change (Q345F) as observed in crystal structure 5c8b.
According to modeller validation results, mutate model with region size 7 Å (depends on the
mutation size but preferably from 6 Å to 8 Å) displayed better sampling along with higher
percentage of reproducibility in terms of Tyr344 shift (see Figure 3A). However, it has drawback
upon increasing the optimization size beyond 8 Å in such way it disrupts binding site as well as
inaccurate repacking of original residue (see Figure 6). On the other hand, we successfully
sampled the variants and the respective single wild type on global size but still the accuracy of
repacking is same as mutate model (see Figure 3B). Considering the mentioned flaws of repacking
and sampling, we implemented third protocol with combination of both automodel and mutate
model. In which, the models of mutants were prepared by using mutate model method combined
with regional optimization (7 Å) and random deviation (4 Å) to solve the repacking issue as well as
to maintain better sampling. Further, the global wild type models were prepared using automodel to
have one common wild type for all mutants with the reasonable sampling (see Figure 3B). All the
validated models (of both mutate model and automodel) successfully docked against α/β-D-Glucose
and α/β-D-methylglucosidase acceptors. Subsequently, the docking informations were stored into
database and performed set of statistical analysis on the same. Initially, the statistical analysis of
productive pose were performed based on the frequency of poses associated with set of parameters
(see above). Later, the same analysis was performed based on the set of distance scheme (see
above) and successfully predicted the preferred orientation according to observed regioselectivity as
well as the predicted selectivity for alternate acceptors. The experimental validation of predicted
regioselectivity for α/β-D-methylglucosides is ongoing and also we are currently repeating our
protocol using sucrose as acceptor as well as list of new mutants.
Page 114 of 188

6. Supplementary informations
Page 115 of 188
Figure S7: The distribution of RMSD and DOPE SCORE of mutate models and their respectivewild types. The distribution shown for all the kojibiose and nigerose selectivity mutants with thenumber of 100 models.

Table S1: The list of tested mutants and their associated total number models and docking poses with respect to α/β-D-Glucose acceptors (mutate model method)
MUTANTS/WTModels
(α-D-Glucose)Models
(β-D-Glucose)Docking poses(α-D-Glucose)
Docking poses (β-D-Glucose)
L341I 100 100 8265 7953
L341IQ345S 100 100 8195 7989
L341IQ345N 100 100 8079 7979
L341IY344AQ345N 100 100 8156 7960
Q345F 100 100 8716 8414
L341L* 100 100 8249 8050
L341LQ345Q.S* 100 100 8092 8012
L341LQ345Q.N* 100 100 8122 7928
L341LY344YQ345Q* 100 100 8055 7911
Q345Q* 100 100 8177 8090
TOTAL 1000 1000 82106 80286
Note: All the wild types are represented in (*)
Table S2: The list of tested mutants and their associated total number models and docking poses with respect to α/β-D-methylglucosydase acceptors (mutate model method)
MUTANTS/WTModels
(α-D-MethylGlc)Models
(β-D-MethylGlc)Docking poses
(α-D-MethylGlc)Docking poses
(β-D-MethylGlc)
L341I 100 100 8070 8163
L341IQ345S 100 100 7936 7924
L341IQ345N 100 100 8029 7961
L341IY344AQ345N 100 100 8025 8090
Q345F 100 100 8481 8232
L341L* 100 100 8117 8167
L341LQ345Q.S* 100 100 8096 8015
L341LQ345Q.N* 100 100 8108 8005
L341LY344YQ345Q* 100 100 8060 7948
Q345Q* 100 100 8176 8326
TOTAL 1000 1000 81098 80831
Note: All the wild types are represented in (*)
Page 116 of 188

Table S3: Classical DOPE SCORE analysis for productive orientation with respect to β-D-Glucose acceptor.
Mutant/WT Mod. N° Pos. N° O2_C1 O3_C1 O4_C1 DOPE DeltaG
L341I 96 1 3.6■ 6.1 8.3 -65451.9 -5.60
L341IQ345S 75 1 NULL NULL NULL -65368.8 -5.60
L341IQ345N 86 1 6.3 3.6■ 3.7 -65339.0 -6.40
L341IY344AQ345N 80 1 3.5■ 6.3 8.2 -65125.4 -6.50
Q345F 25 1 5.7 3.9■ 4.3 -61873.8 -6.00
L341L* 40 1 3.6■ 6.0 8.3 -65457.2 -6.00
L341LQ345Q.S* 86 1 6.2 3.5■ 3.8 -65309.8 -6.20
L341LQ345Q.N* 86 1 6.2 3.5■ 3.8 -65309.8 -6.20
L341LY344YQ345Q.N* 8 1 6.5 3.7■ 3.7 -65296.8 -5.70
Q345Q* 97 1 6.6 3.7■ 3.5 -65386.5 -6.00
Note: All the wild types represented in (*); (■) same as observed selectivity; (■) not same asobserved selectivity.
Table S4: The frequency of productive binding poses based on RMSD with respect to β-D-Glucose acceptor.
Mutant/WT Frequency of Kojibiose Frequency of Nigerose Frequency of Maltose
L341I 65■ 53 60L341IQ345S 97■ 67 80L341IQ345N 93■ 51 70
L341IY344AQ345N 77■ 48 55Q345F 0 76■ 6L341L* 63 64 72■
L341LQ345Q.S* 77 64 85■L341LQ345Q.N* 75 62 88■
L341LY344YQ345Q.N* 76 61 84■Q345Q* 9 1 5■
Note: All the wild types represented in (*); frequency of poses are given in percentage; (■) same asobserved selectivity; (■) not same as observed selectivity.
Page 117 of 188

The poses on top corresponds to the docking of α-D-Methylglucosidase (A, B, C) and β-D-Methylglucosidase (D, E, F) into the covalent glucosyl-enzyme intermediate (2gdv_A) of thekojibiose selective mutants and wild types. Similarly, the poses of (G, H, I) and (J, K, L)respectively corresponds to the docking of α-D-Methylglucosidase and β-D-Methylglucosidase in tothe Q345F mutants and its wild type models based on 5c8b structure. The prepared orientationstowards Maltose (O4-C1), Kojibiose (O2-C1), Nigerose (O3-C1) products are highlighted in yellow
Page 118 of 188
Figure S8: The reference productive poses for α-D-Methylglucosidase and β-D-Methylglucosidaseacceptors.

circles while the rest of -OH groups are shown in white circles. Also the distances associated withO1, O2, O3, O4 and O6 are respectively colored in grey, ocean blue, blueberry, black and browncolors. (Green: receptors; white ball/sticks: glucose acceptor and glucosyl moiety of DGC192residue; covalent residue: DGC192; general acid/base: Asp232).
Table S5: The frequency, Average (Avg) and Standard deviation (STD) of productive poses based onhighest binding energy with respect to β-D-Glucose acceptor.
Frequency Average Standard deviation
Mutant/WT Koj Nig Mal Koj Nig Mal Koj Nig Mal
L341I 19.6 38.5 41.7■ -5.94 -6.19 -6.18■ 0.23 0.18 0.17
L341IQ345S 32.7 31.9 35.3■ -5.86 -5.95 -5.96■ 0.27 0.26 0.24
L341IQ345N 20.3 35.7 43.9■ -5.76 -5.94■ -5.93 0.17 0.17 0.18
L341IY344AQ345N 41.3■ 27.1 31.5 -5.86 -6.10■ -5.99 0.23 0.23 0.27
Q345F 21.9 37.4 40.6■ -5.86 -6.22■ -6.16 0.22 0.13 0.23
L341L* 26.8 38.2■ 34.9 -5.93 -6.06■ -6.06 0.30 0.24 0.21
L341LQ345Q.S* 28.1 39.0■ 32.8 -5.95 -6.06■ -6.06 0.29 0.24 0.20
L341LQ345Q.N* 27.2 37.6■ 35.2 -5.88 -6.10■ -6.06 0.18 0.23 0.25
L341LY344YQ345Q.N* 34.8 49.6■ 15.4 -5.89 -5.92■ -5.90 0.07 0.08 0.08
Q345Q* 28.4 37.8■ 33.6 -5.92 -6.13■ -6.12 0.19 0.11 0.10
Note: All the wild types represented in (*); frequency of poses are given in percentage (%); (■)same as observed selectivity; (■) not same as observed selectivity.
Table S6: The frequency of productive binding poses based on top rank pose with respect to β-D-Glucose acceptor.
Mutant/WT Frequency of Kojibiose Frequency of Nigerose Frequency of Maltose
L341I 26.7 0 73.2■
L341IQ345S 38.1 1.3 60.5■
L341IQ345N 36.3 5.4 58.1■
L341IY344AQ345N 58.9■ 3.5 37.5
Q345F 54.7■ 0 45.2
L341L* 36.1 0 63.8■
L341LQ345Q.S* 50.0■ 1.5 48.4
L341LQ345Q.N* 49.2■ 1.5 49.2
L341LY344YQ345Q.N* 43.4 0 56.5■
Q345Q* 34.0 0 65.9■
Note: All the wild types represented in (*); frequency of poses are given in percentage; (■) same asobserved selectivity; (■) not same as observed selectivity
Page 119 of 188

Table S7: Comparison of puckering states (1S3,4C1, B36) counts across the models of 11 different experiments based soft sphere restraint weight.
Soft sphere 0 Soft sphere 11S3
4C1 B36 1S34C1 B36
WILD 21 38■ 28 25 29■ 21
L341I 21 44■ 25 31■ 29 24
L341IQ345S 28 32■ 32 35■ 27 24
L341IQ345N 19 43■ 26 29■ 23 26
L341IY344AQ345N 19 35■ 31 34■ 22 21
Q345F 18 46≠ 21 20■ 30≠ 27
Soft sphere 2 Soft sphere 31S3
4C1 B36 1S34C1 B36
WILD 37■ 12 26 33■ 28 12
L341I 30■ 23 22 34■ 20 21
L341IQ345S 25 27■ 20 25 28■ 20
L341IQ345N 31■ 22 14 28■ 23 20
L341IY344AQ345N 40■ 16 22 27■ 21 21
Q345F 28 33≠ 21 16 30≠ 35
Soft sphere 4 Soft sphere 51S3
4C1 B36 1S34C1 B36
WILD 26■ 19 25 36■ 19 24
L341I 26■ 19 25 30■ 19 20
L341IQ345S 27■ 21 14 33■ 20 18
L341IQ345N 24■ 17 21 26■ 25 20
L341IY344AQ345N 29■ 23 21 24■ 23 25
Q345F 27 30≠ 21 18 35≠ 23
Soft sphere 6 Soft sphere 71S3
4C1 B36 1S34C1 B36
WILD 15 23■ 21 33■ 18 21
L341I 33■ 23 18 28■ 20 16
L341IQ345S 33■ 18 19 29■ 25 21
L341IQ345N 31■ 20 14 32■ 15 23
L341IY344AQ345N 35■ 20 21 30 30■ 14
Q345F 22 34≠ 20 30 24≠ 21
Soft sphere 8 Soft sphere 91S3
4C1 B36 1S34C1 B36
WILD 24 28■ 14 24■ 22 30
L341I 39■ 17 22 23■ 21 30
L341IQ345S 33■ 27 10 30■ 19 12
L341IQ345N 40■ 15 17 35■ 29 13
L341IY344AQ345N 28■ 17 18 18 33■ 18
Page 120 of 188

Q345F 23 30 ≠ 23 20 25 ≠ 25
Soft sphere 101S3
4C1 B36
WILD 24■ 25 25■
L341I 29■ 24 17
L341IQ345S 27■ 24 14
L341IQ345N 29■ 24 16
L341IY344AQ345N 24■ 18 11
Q345F 24 41 18
Note: (■) according to crystal structure conformation (1S3 puckering state); (■) different fromcrystal structure conformation; () according to our prediction (Velusamy et al), the frequency of4C1 and sum of (1S3+B36) is equal; (≠) according to our prediction (Velusamy et al), the frequency of4C1 and sum of (1S3+B36) is not equal; 4C1 native chair conformation; B36 identical conformation of 1S3
Page 121 of 188
Figure S9: Docking of β-D-glucose in to the double optimized mutant (Q345F) model shows theconsequence of losing minimal distance between His234-DGC192(O2). It leads to form narrowbinding site and doesn’t allows the glucose acceptor inside the pocket.

Page 122 of 188
Figure S10: The distribution of puckering states (1S3,4C1, B36) based on the Cremer-Poplepuckering energy plot (shown only for software restraint weight 10). (Cyan: 1S3; Red: 4C1;Yellow: B36 which is identical puckering state of 1S3)
Figure S11: The distribution of RMSD (with respect to Model no1) and DOPE SCORE at softsphere weight 10.

Table S8: The distribution of RMSD at soft sphere weight 10 with respect to the wild types 2gdv_A and 5c8b
MUTANTS/WT RMS min RMS max
WILD 1.011 1.174L341I 1.035 1.195
L341IQ345S 1.030 1.191L341IQ345N 0.991 1.142
L341IY344AQ345N 1.007 1.265Q345F 1.038 1.230
Table S9: The list of tested mutants and their associated total number models and docking poses with respect to α/β-D-Glucose acceptors (automodel method)
MUTANTS/WTModels
(α-D-Glucose)Models
(β-D-Glucose)Docking poses(α-D-Glucose)
Docking poses (β-D-Glucose)
WILD TYPE 100 100 8132 8036
L341I 100 100 8216 8216
L341IQ345S 100 100 8307 8236
L341IQ345N 100 100 8270 8084
L341IY344AQ345N 100 100 8244 8125
Q345F 100 100 8974 8864
TOTAL 600 600 50143 49561
Table S10: The list of tested mutants and their associated total number models and docking poses with respect to α/β-D-methylglucosidase acceptors (automodel method)
MUTANTS/WTModels
(α-D-MethylGlc)Models
(β-D-MethylGlc)Docking poses
(α-D-MethylGlc)Docking poses
(β-D-MethylGlc)
WILD TYPE 100 100 7943 8170
L341I 100 100 8000 8294
L341IQ345S 100 100 8048 8184
L341IQ345N 100 100 8026 8133
L341IY344AQ345N 100 100 8006 8138
Q345F 100 100 8746 8841
TOTAL 600 600 48769 49760
Page 123 of 188
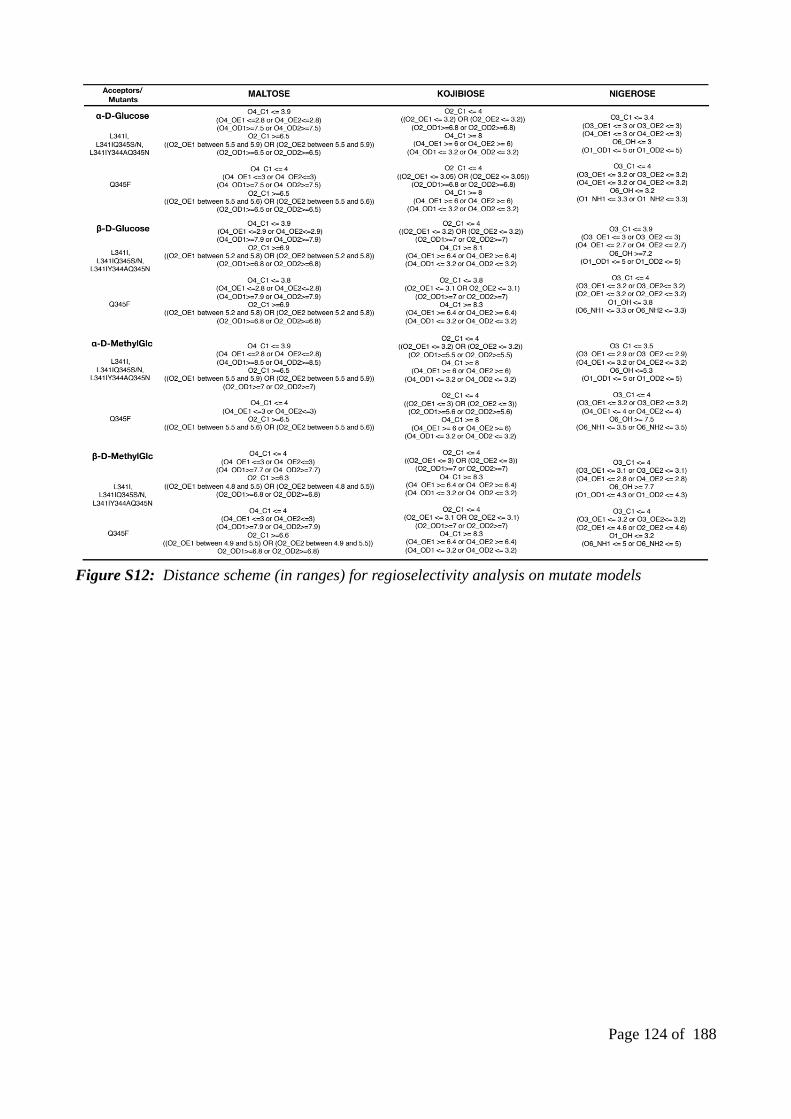
Figure S12: Distance scheme (in ranges) for regioselectivity analysis on mutate models
Page 124 of 188

Page 125 of 188
Figure S13: Distance scheme (in ranges) for regioselectivity analysis for automodel method

Chapter 4ENZO: An Automated Computational
Tool For Engineering SucrosePhosphorylase Enzyme And Their
Homologues
Part of this chapter yet to submit in “proceedings of the national academy of sciences”:Mahesh Velusamy1,2,3, Xavier Garnier1, Damien Chaveau1, Enora Gaschet1, Alexandre Bonomo1, Marinna Gaudin1, Frédéric Cadet2,3 and Bernard Offmann1 (2018). ENZO: An Automated Computational Tool For Engineering Sucrose Phosphorylase Enzyme And Their Homologues
Page 126 of 188

ABSTRACT
Considering its ability to catalyse the synthesis of oligosaccharides from a cheap donor substrate,
the sucrose phosphorylase (SP) of Bifidobacterium adolescentis is a promising biocatalyst for
various industrial applications. However, the use of this retaining glucosidase for synthesis is
hampered due to its poor transglucosylase activity and the low stability of the generated
oligosaccharides products. Though these concerns have been partially addressed by the combination
of computational and experimental techniques, further improvement of these properties is still
needed in order to use this biocatalyst for large scale industrial synthesis. Further computer aided
engineering of SP would however require the accurate modelling of its structure at the key step of
its catalytic cycle when the catalytic nucleophilic aspartate residue is glucosylated. Unfortunately,
there is currently no efficient computational strategy available yet to accurately model the
glycosylated catalytic nucleophilic residue of retaining glycosidases despite its importance in the
catalytic mechanism of these enzymes. To address this issue, we present ENZO, an automated web
application which is specifically dedicated to the modelling of the glucosyl-aspartate covalent
intermediate of SP and its homologues and can also be used for the modelling of any retaining
glucosidase that has an aspartate as catalytic nucleophile. This tool can also be employed as an
automated modelling workflow to create a large library of enzyme mutants models from a given
FASTA sequence. This workflow includes several modules that can be successively used to perform
homology modelling of protein structures, geometry optimization of the resulting models by energy
minimization as well as the molecular docking of potential acceptor substrates in a user-defined
binding site in the protein models. ENZO is not exclusively limited to the modelling of glycosyl-
aspartate intermediates and can also be applied for the modelling of enzymes in complex with a
given ligand. A step-by-step guidance of the program usage is thoroughly detailed through examples
using standardized protocols which where successfully employed to model the conformations of
two disaccharides products, namely kojibiose and nigerose, in accordance with previous published
experimental results. Overall, ENZO can be applied to screen for potential promising mutations
aiming at improving the properties of SP Bifidobacterium adolescentis but also to understand the
impact of mutations with respect to any structural and activity changes inferred by experimental
data.
Page 127 of 188

1. INTRODUCTION
In recent years, oligosaccharides have been widely used in many industrial applications and thus are
of great interest for commercial exploitation26,198,200,203,209,210. However, the availability of such
compounds in nature is often very limited and the current chemical synthesis technologies also
suffer from many drawbacks9–11,199,204 which hamper their use for large scale synthesis of
oligosaccharides. Accordingly, an alternative and efficient way of producing oligosaccharide could
be the use of glycoside phosphorylases such as sucrose phosphorylase211.
Sucrose phosphorylase (SP) is an enzyme classified as glycosyltransferases [EC 2.4.1.7] and
belongs to the Glycoside hydrolase family 13 (GH13)176. In living cells, it catalyses the reversible
phosphorolysis of sucrose in to α-D-Glucose following a double displacement
mechanism212 involving the formation of a covalent glucosyl-enzyme intermediate. Our particular
interest for this enzyme stems from its transglucosylase activity which can be harnessed for the
synthesis of oligosaccharides from sucrose, a cheap and widely available substrate. SP has already
been proven as an attractive biocatalyst for producing rare sugars and glycoconjugates28 while
employed with alternative substrates such as glucose or non-carbohydrate molecules. Unfortunately,
the transglucosylase activity of this enzyme is in many cases unable to surpass the undesirable
hydrolytic activity43,213. In that respect, various recent experiments have been employed to improve
the transglucosylase activity of SP, its stability, and its specificity towards alternative acceptors. For
instance, a significant improvement of the thermostability of SP has been observed by the
combination of semi-rational mutagenesis, formation of cross-linked enzyme aggregate (CLEA)
and immobilization on sepa beads46,47,214,215. Molecular imprinting technique (iCLEA) has also been
employed to alter the acceptor specificity of SP216. Besides, a significant improvement of the
regioselectivity of wild type BiSP towards Kojibiose and Nigerose using semi-rational mutagenesis,
low throughput screening and structure-based design77,78 has also been shown in other studies.
However, the availability of computational tools and approaches to assist these engineering
protocols is still limited since there is up to now no efficient way to model the structure of these
enzymes at the key step of their catalytic cycle that precedes the transglucosylation reaction. The
structural state of these enzymes at this step, also called glucosyl-enzyme covalent intermediate, is
characterized by the glucosylation of the nucleophilic aspartate residue. Unfortunately, the absence
of force field parameters for this glucosylated residue in the literature is a hindrance for further
molecular modelling studies of this intermediate. Thus there is a high motivation to parametrize the
glycosylated aspartate residue (three letter code “DGC” or one letter code “O”) and subsequently
incorporate these parameters in the libraries of various molecular modelling programs such as
MODELLER183, Autodock and GROMACS184 for further structural modelling and molecular
Page 128 of 188
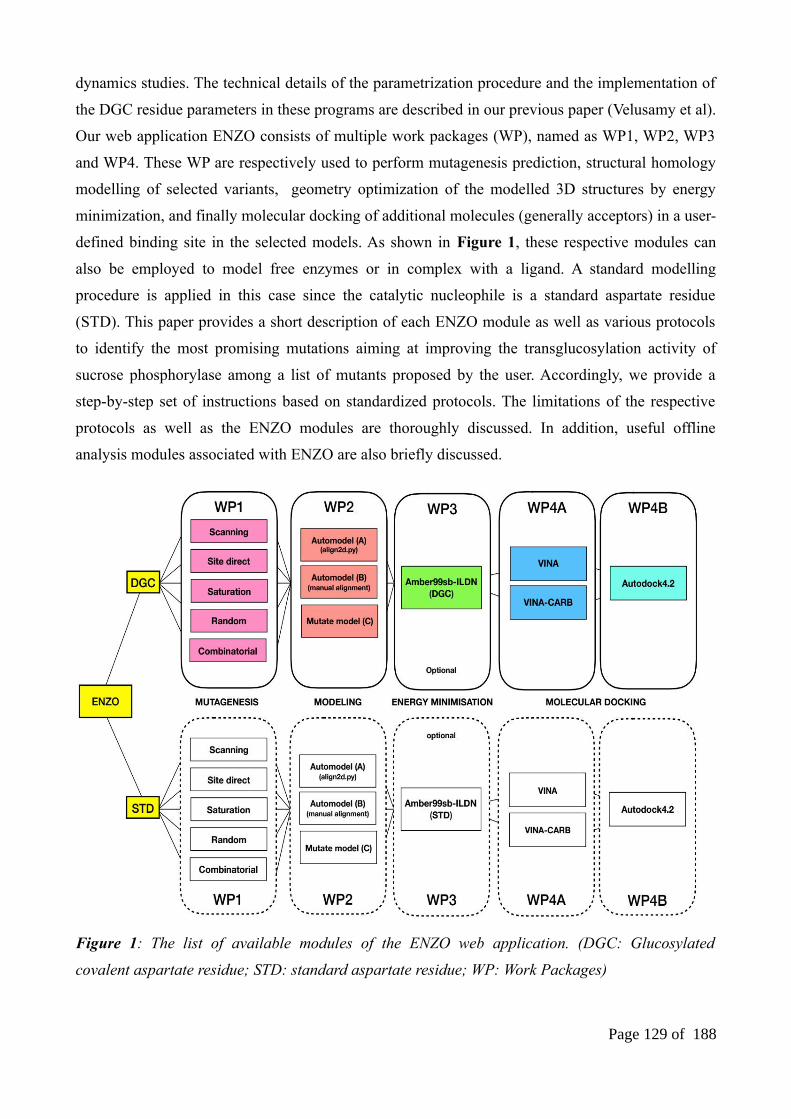
dynamics studies. The technical details of the parametrization procedure and the implementation of
the DGC residue parameters in these programs are described in our previous paper (Velusamy et al).
Our web application ENZO consists of multiple work packages (WP), named as WP1, WP2, WP3
and WP4. These WP are respectively used to perform mutagenesis prediction, structural homology
modelling of selected variants, geometry optimization of the modelled 3D structures by energy
minimization, and finally molecular docking of additional molecules (generally acceptors) in a user-
defined binding site in the selected models. As shown in Figure 1, these respective modules can
also be employed to model free enzymes or in complex with a ligand. A standard modelling
procedure is applied in this case since the catalytic nucleophile is a standard aspartate residue
(STD). This paper provides a short description of each ENZO module as well as various protocols
to identify the most promising mutations aiming at improving the transglucosylation activity of
sucrose phosphorylase among a list of mutants proposed by the user. Accordingly, we provide a
step-by-step set of instructions based on standardized protocols. The limitations of the respective
protocols as well as the ENZO modules are thoroughly discussed. In addition, useful offline
analysis modules associated with ENZO are also briefly discussed.
Figure 1: The list of available modules of the ENZO web application. (DGC: Glucosylated
covalent aspartate residue; STD: standard aspartate residue; WP: Work Packages)
Page 129 of 188
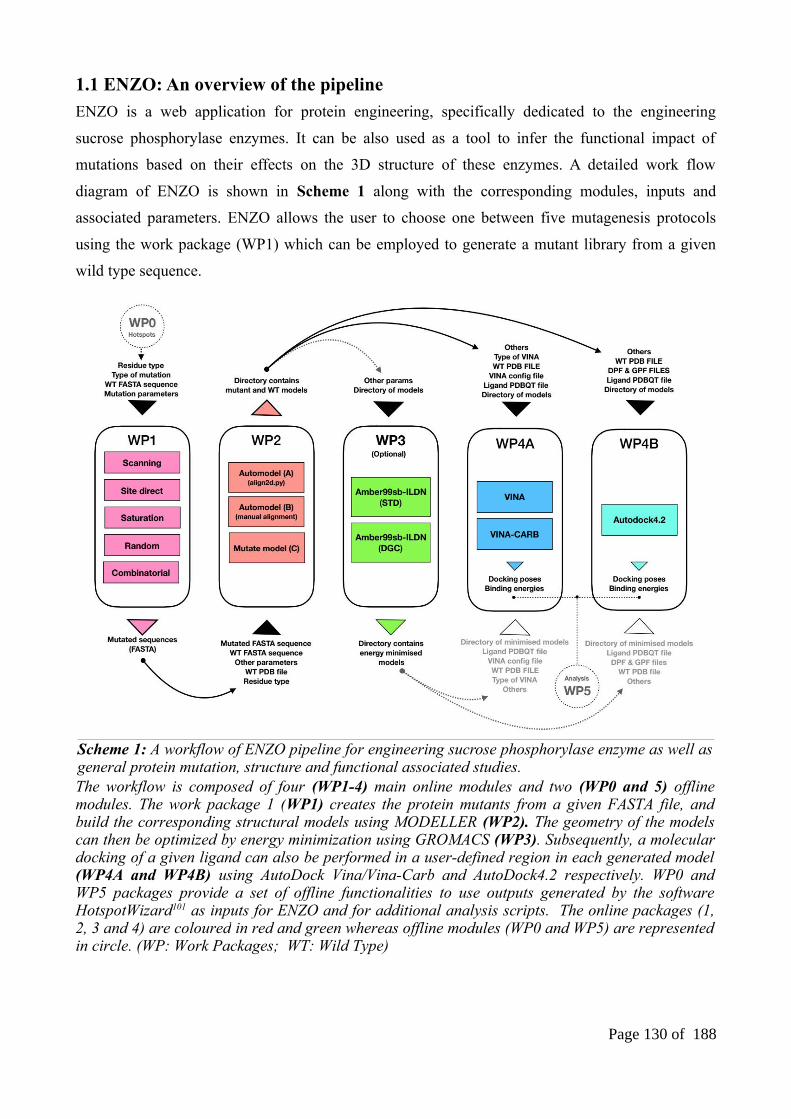
1.1 ENZO: An overview of the pipeline
ENZO is a web application for protein engineering, specifically dedicated to the engineering
sucrose phosphorylase enzymes. It can be also used as a tool to infer the functional impact of
mutations based on their effects on the 3D structure of these enzymes. A detailed work flow
diagram of ENZO is shown in Scheme 1 along with the corresponding modules, inputs and
associated parameters. ENZO allows the user to choose one between five mutagenesis protocols
using the work package (WP1) which can be employed to generate a mutant library from a given
wild type sequence.
The workflow is composed of four (WP1-4) main online modules and two (WP0 and 5) offlinemodules. The work package 1 (WP1) creates the protein mutants from a given FASTA file, andbuild the corresponding structural models using MODELLER (WP2). The geometry of the modelscan then be optimized by energy minimization using GROMACS (WP3). Subsequently, a moleculardocking of a given ligand can also be performed in a user-defined region in each generated model(WP4A and WP4B) using AutoDock Vina/Vina-Carb and AutoDock4.2 respectively. WP0 andWP5 packages provide a set of offline functionalities to use outputs generated by the softwareHotspotWizard101 as inputs for ENZO and for additional analysis scripts. The online packages (1,2, 3 and 4) are coloured in red and green whereas offline modules (WP0 and WP5) are representedin circle. (WP: Work Packages; WT: Wild Type)
Page 130 of 188
Scheme 1: A workflow of ENZO pipeline for engineering sucrose phosphorylase enzyme as well asgeneral protein mutation, structure and functional associated studies.

1.2 ENZOWP1: Mutagenesis schemes for generating mutant sequence
This work package generates mutated sequences from a given wild type protein FASTA sequence
that has a 3D structure available in the PDB. It takes the user input sequence along with the nature
of the catalytic nucleophile residue (glucosylated or not), and the selected mutagenesis protocol out
of five possibilities. A description of the WP1 is detailed in the Scheme 2 and as well as examples
of subsequent outputs generated from each mutagenesis protocol. In vitro, the contribution of
specific residues to the function and stability of given protein has been commonly assessed by the
famous technique called alanine scanning217. In order to perform the same scanning in silico, we
have implemented a scheme called scanning mutagenesis. It reads the whole target sequence
residue by residue position and subsequently replaces them by user mentioned residue as shown in
Scheme 2A. The substitution of selected residues by others residues is also possible. The
mutagenesis scanning can also be performed in a user-defined region of a given protein sequence by
specifying the first and the last mutated residues in the selected region. In addition to the scanning
mutagenesis, a saturation mutagenesis protocol has also been implemented in ENZO. This method
performs a saturation mutagenesis on selected position in a given protein sequence. A description of
this functionality in the Scheme 2B.
These two functionalities applied to the mutagenesis of the a decoy protein in APO (non-covalent)or glucosylated (covalent) form. The pattern “ENSO” or “ENSD” represents a user-selectedpeptide in the protein sequence, assuming that the catalytic nucleophilic aspartate residue is thefourth residue in this selection. The one letter code O or D is used to specify the state of thecatalytic nucleophilic aspartate which can be either glucosylated (letter O) or not (letter D). Bydefault, a position identified by the letter O will not be subjected to mutagenesis.
A: the tag “Scan” corresponds to the user-defined residue that will substitutes all residues of theselected sequence within the position range defined by the tags “Spos” and “Epos”.
B: As an example, 1 / 1,2,3 indicates that the position 1 will be saturated while all other residueswithin the selection 1-3 will remain unchanged. “..AA+1” indicates a round of mutagenesis by aspecific amino acid residue out 19 possible and “..Pos+1” indicates the position increment alongthe sequence.
Page 131 of 188
Scheme 2: Example usage of the scanning (A) and the site saturation mutagenesis (B).

Random mutagenesis is an efficient and widely used technique in protein engineering to elucidate
structural/functional relationships of proteins as well as to engineer their properties218. Error prone
PCR is one of the most commonly used technique for creating random library of protein variants
from a given parental sequence218,219. A mutagenesis algorithm inspired by this method has been
implemented in the random mutagenesis scheme of ENZO. The corresponding algorithm scans
each position in the selected sequence and decides to mutate or not the residue at this position based
on a default (Scheme 3Ci) or a user-defined mutation rate (Scheme 3Cii). Upon completion of the
algorithm, an ensemble of mutated sequences is generated. The maximum number of mutants to
generate can be limited by the parameter “library size”. A detailed description of the random
mutagenesis workflow is provided in Scheme 3.
Scheme 3: Examples of usage of the random mutagenesis functionality with respect to the use of auser-defined mutation rate (Cii) or a default random seed (Ci).
The pattern “ENSO” or “ENSD” represents a user-selected peptide in a given protein sequence,assuming that the catalytic nucleophilic aspartate residue in the fourth residue in this selection. Theone letter code O or D is used to specify the state of the catalytic nucleophilic aspartate which canbe either glucosylated (letter O, covalent modelling) or not (letter D, standard or “non-covalent”modelling). By default, a position identified by the letter O will not be subjected to mutagenesis.The tag “Pos” indicates the positions subjected to mutagenesis in the selected sequence. The tag“Res” corresponds to the list of permitted substitutions for each mutated position, whereas the tag“MutRate” indicates the mutation rate associated to each of these positions. Based on the value ofthe decision variable (random seed or position-dependent mutation rate), the algorithm decides foreach position if a mutation will be performed (YES) or not (NO). If the decision is positive for agiven position, the corresponding parental residue will then be randomly mutated into one residue
Page 132 of 188

selected from the list of all permitted residues associated to this specific position. If the decision isnegative, the current position will be skipped and the next position will be inquired.
Site directed mutagenesis is an another commonly used protein engineering method which aims at
introducing a specific mutation at a given position in a protein sequence. In that respect, a
single/multiple point mutagenesis functionality has been implemented in ENZO and is illustrated
in Scheme 4D. This functionality allows the user to introduce one or multiple mutation(s) chosen
from a list of permitted substitutions (defined by the user) into a given protein sequence. A
Combinatorial mutagenesis functionality has also been implemented to introduce all possible
combinations of single or multiple points mutations chosen from a list of permitted substitutions in
a given protein sequence (Scheme 4E).
Scheme 4: Examples of usage of the site directed (D) and combinatorial mutagenesis (E)functionalities.
The pattern “ENSO” or “ENSD” represents a user-selected peptide in a given protein sequence,assuming that the catalytic nucleophilic aspartate residue in the fourth residue in this selection. Theone letter code O or D is used to specify the state of the catalytic nucleophilic aspartate which canbe either glucosylated (letter O, covalent modelling) or not (letter D, standard or “non-covalent”modelling). By default, a position identified by the letter O will not be subjected to mutagenesis.The tag “S.Pos” and “Mul.pos” respectively indicate the list of single and multiple substitutionsthat can be introduced in the selected sequence.
In addition to the glucosyl-aspartate residue (DGC/O), the corresponding algorithm also supports
the presence of ligand(s) as well as water molecules which will be respectively indicated as “ .”,
“w”207 in the HETATM section of the PDB file. Likewise, the mutagenesis of the corresponding
positions are disabled by default. When an input sequence has missing residues at the N-terminus
(starting by a residue number different than 1), it is recommended add the letter “A” at each missing
Page 133 of 188

position in the sequence in order to make the sequence numbering start at 1. For instance, the
sequence of the PDB ID 3O26 starts from 12, hence the user is recommended to add 11 “A” before
the starting position.
1.3 ENZOWP2: Modeling of the 3D protein structures of the variants and its
wild type sequence
This work package uses Modeller to carry out the modelling of the 3D structure of an input protein
sequence and its corresponding variants using by homology with a template sequence having a
known 3D structure in the PDB. To use this module, one must submit the following input files:
1. A text file listing the type of non-standard residues that have to be considered in the resulting
models. As an example, if the final model(s) shall include a glucosyl-aspartate residue, a glucose as
a ligand and a selection of water molecules taken from the PDB file of the template sequence, then
the respective terms: ‘DGC’, ‘BGC’, and ‘HOH’ have to be listed in this file. The corresponding
residues will be accordingly specified in the target sequence by the respective one-letter code: O”,
“.”, and “w”. 2. The PDB file of the template sequence (as a single chain), 3. A FASTA file
containing the sequence of the template protein, 4. A FASTA file containing the sequences of the
mutants of the target protein (generated in WP1), 5. A flat file specifying the maximum number of
models to generate for each mutant.
As mentioned, one of the main goal of ENZO is to help the user to predict the potential impact of
mutations on a protein structure and function. In order to achieve the accurate modelling of a given
protein structure, its corresponding conformational space should be thoroughly sampled. In that
respect, the default modelling procedure in MODELLER does not overcome this issue since it uses
the distance restraints coming from the template-target sequence alignments by default. Therefore
it produces a homogenous conformational sampling leading to the generation of homology
models183. In order to solve this issue, two different optimization protocols were implemented.
These protocols, respectively named global/local relaxation protocols (implemented in the work
package WP2), optimize the default MODELLER distance restraints in order to refine either a
whole model (WP2A and B) or a selected region of a model (WP2C).
Accordingly, the global relaxation protocol can be applied on a given 3D structure model by setting
the parameter Soft sphere restraints weight to a non-null specific value (the default value being 10,
see Velusamy_2 et al/Chapter 3)207. The local relaxation protocol can be applied to optimize the
geometry of a given ensemble of residues in a model. This protocol is particularly useful to
accommodate the position of residues side chains to the presence of a mutation introduced in their
vicinity. The parameters region size and random deviation parameters have to be set to a non-null
Page 134 of 188

value in order to use this protocol. They are by default standardized to the values of 7 and
4 Å154 respectively. A recent study has shown that the use of the default local relaxation protocol on
an ensemble of conformationally similar 3D models generated by ENZO (refer to Velusamy_2 et al/
Chapter 3) was able to successfully introduce a significant conformational diversity. The user
should also note that although any introduced glucosyl-asparate residue will be treated as flexible in
all modelling procedure related to both WP2A and B, where as in WP2C will consider this residue
as rigid. Altogether, the modules A, B, and C implemented in the WP2 are designed in such way so
that they can simultaneously generate an ensemble of conformationally diverse 3D models from a
given list of protein sequences (including both the wild type and mutants) with a minimum of 100
models per sequence.
Also among these three modules, the modules WP2 A and B are almost similar except the way it
performs alignment step between target and mutated sequence. Accordingly WP2A uses default
alignment.py whereas in WP2B it does it manually and during the alignment step both the module
can effectively handle the unusual starting positions as mentioned above. The specification of
disulphide bridges and covalent linkages has been automated in WP2A and B modules by using the
special_patches parameter (by default empty) whereas this is not needed for the WP2C154,207. In
order to speed-up the calculations, the parameter Parallelize allows the user to run all modelling
steps in WP2 in parallel by the use of of defined number of CPUs. This is controlled by the option
number of CPU (default 8).
1.4 ENZOWP3: Energy minimizations of the 3D models.
This module is an optional (by highly recommended) step in the ENZO pipeline. It relaxes the
geometry of any selected model generated by ENZOWP2 using GROMACS184. The required
topology and coordinate files used for the minimization procedure are automatically prepared using
the pdb2gmx module of the GROMACS package. This preparation module uses a specific force
field depending if the user chooses to perform a standard modelling procedure (using the standard
Amber99sb-ILDN.ff) or to model a glycosyl-aspartate covalent intermediate (using
Amber99sbildn-velusamy-dgc.ff). Prior to the minimization, the 3D model is solvated in a cubic
box of standard TIP3P water molecules and the net charge of the resulting system is further
equilibrated by the addition of counter ions. The validation of Amber99sbildn-velusamy-dgc.ff
force field is refereed to Velusamy_1 et el/Chapter 2. In addition to all inputs mentioned in
Scheme1 WP3, the minimization procedure also requires the user to supply a suitable mdp
parameter file (containing the parameters related to the energy minimization algorithm), a trajectory
input file (containing the ID of the group of atoms that will be written to the output) and genion
Page 135 of 188

input file (contains the ID of the group of atoms that will be replaced by ions molecule).
Subsequently, the minimized outputs can be further directly used for molecular dynamics
simulation.
1.5 ENZOWP4A/B: Molecular docking of ligands in a protein structure model
This module allows the user to perform the docking of specific ligands on a user-defined region in a
given protein homology model generated in the WP2 and optionally minimized using the WP3. This
module consists of two subroutines (WP4A and W4B) interfacing with the software Autodock Vina
and Autodock4.2)173,174respectively. These two software relying on different methodologies and
scoring functions, the implementation of these two subroutines allows the user to choose between
one of these two methods to perform docking calculation174. In accordance to our standardized
protocol (Velusamy_2 et el/Chapter 3) and work of Trott et al174, the use of AutoDock Vina would
be generally recommended for most docking calculations. The WP4A also provides an interface to
the molecular docking software Vina-Carb. The use of this software would be highly recommended
for any docking of oligosaccharides as it has been proved to be very efficient in handling the
flexibility of glycosidic linkage angles220. In order to run a docking calculation, the user has to
provide a list of necessary input files in a single directory, which generally includes: a protein
structure (usually modelled using the WP2 and energy minimized using the WP3), a configuration
file specifying the parameters related to the docking calculation, and the PDBQT file of the
corresponding ligand. Upon completion of both subroutines, a CSV formatted file listing the
energies (in kcal/mol) related to each docking pose is generated. A ranking algorithm for the
qualitative assessment of the docking results will be developed in a fifth work package soon. In-
house scripts for the analysis of docked carbohydrate ligands conformations can be provided upon
requests.
1.6 ENZO: The web interface
The web interface allows the use of ENZO without any prior knowledge of UNIX or a scripting
language. It consists in a pipeline that efficiently schedule all the backend functionalities, data
storage, user registration and authentication with a simple administrator interface. Since all the
backend functionalities of ENZO have been entirely coded using the Python scripting language, the
interface was subsequently developed using python based front end Django1.11. along with HTML
and CSS to make it more communicative, interactive and redefinable. The home page of the
respective interface is shown in Figure 2.
Page 136 of 188

Figure 2: The home page of the ENZO web interface
ENZO allows users to create their own account and provides an independent workspace for every
individual user with a limited space and authentications. The corresponding user workspace, along
with some basic details from all active modules as shown in (Figure 3 top left).
Shown user login page (top left) along with important updates and the corresponding (My)jobsmanagement page (bottom) associated with all the inputs and outputs details. The (top right) panelis corresponds to the site administrator page (only accessible to special users)
Once, the users get their own workspace activated, they have access to all the four main work
packages (WP1,2,3,4) as well as to all corresponding modules associated to each work packages
(e.g. A, B, C) and their corresponding job submission forms as shown in Figure 4. In addition,
Page 137 of 188
Figure 3: Graphical representation of the ENZO

users are allowed to access to a personal jobs management page (Figure 3 bottom) on which they
can download and delete any data generated by ENZO and manually redirect the previous job
outputs to the subsequent work packages of their interest. Moreover, ENZO provides a very
convenient and site administrator page (Figure3 top right) on which special users can manage the
jobs and the activities of all others users as updating and manipulating the available work packages.
Figure 4: Example of job submission page of a given work package.
2. MATERIALS
2.1 Listing of the work packages inputs
ENZOWP1: A FASTA file of a given protein sequence which can contain a glucosylated (O) or
standard (D) catalytic aspartate residue (see Table1 for examples)
ENZOWP2: A PDB file of a given protein (in complex with a ligand or not) having more than 30%
of sequence identity with the respective target sequence of interest. In addition, the library (.lib)
files that contains force field parameters related to the non-standard glucosyl-aspartate residue are
also required for the modelling of the covalent intermediate (see Table1 for examples)
ENZOWP3: An input PDB file of a given protein model, the input file for the GROMACS genioin
module, the trajectory input file, the mdp parameter file and the modified amber99sbildn-velusamy-
dgc.ff force field directory. (see Table1 for examples)
ENZOWP4A: A PDB file of a given protein model, the PDBQT file of given ligand, the docking
parameter files of AUTODOCK4.2 and/or Vina/Vina-Carb configuration files (see Table1 for
examples)
Page 138 of 188
ENZOWP4B: A PDB file of a given protein model, the PDBQT file of given ligand, docking
parameters (.dpf) file and the grid parameter (.gpf) files. (see Table1 for examples)
2.2 Required softwares and hardware
• A Linux/Macintosh based system access to the internet connection and a web browser
• ENZO version 2.0 (downloaded link will be available soon)
• Python version 2.7 (https://www.python.org.downloads/)
• Python modules: Docopt (pip install docopt through virtualenv)
• Django1.11 (pip install django==1.11 through virtualenv)
• Modeller/9.18 (https://salilab.org/modeller/download_installation.html)
• Gromacs/2016.3 (ftp://ftp.gromacs.org/pub/gromacs/gromacs-2016.3.tar.gz)
• mgltools/1.5.6 (http://mgltools.scripps.edu/downloads)
• mustang protein alignment server (http://lcb.infotech.monash.edu.au/mustang/ )
• Autodock Vina (http://vina.scripps.edu/download.html)
• Vina-Carb (http://glycam.org/docs/othertoolsservice/downloads/downloads-software/)
• Autodock softwares (http://autodock.scripps.edu/downloads/autodock-registration/autodock-
4-2-download-page/)
• Pymol/1.8.4.0 and above (https://pymol.org/2/)
• virtualenv (https://gist.github.com/Geoyi/d9fab4f609e9f75941946be45000632b)
Table 1: ENZO pipeline example files, modeller libraries and modified forcefield that areincorporated with DGC residue
File or directory Description
/ENZOV2.0/ENZO/ENZO/WORK_PACKAGES/SCRIPTS/*.py* Python scripts for all the online and offline modules
ENZO-2.0/ENZO/ENZO/FILE/Example_inputs_V2/2GDVA/*WT.fasta* ENZO-2.0/ENZO/ENZO/FILE/Example_inputs_V2/2GDVB/*WT.fasta* ENZO-2.0/ENZO/ENZO/FILE/Example_inputs_V2/5C8B/*WT.fasta*
example WT sequences FASTA files, respectively homologous to the chain A, the chain B of the crystal structures 2gdv and 5c8b
ENZO-2.0/ENZO/ENZO/FILE/Example_inputs_V2/Mutagenesis_sample_inputs/
Example of input files for the mutagenesis schemes
Page 139 of 188

ENZO-2.0/ENZO/ENZO/FILE/Example_inputs_V2/2GDVA/*.pdb* ENZO-2.0/ENZO/ENZO/FILE/Example_inputs_V2/2GDVB/*.pdb* ENZO-2.0/ENZO/ENZO/FILE/Example_inputs_V2/5C8B/*.pdb*
Template PDB structures (here the chain A and B of the PDB 2gdv and the chain B of the PDB 5c8b) used for the modelling of the FASTA sequences of interest
ENZO-2.0/ENZO/ENZO/FILE/modlib_dgc_velusamy/*.lib* MODELLER library files implementing the parameters for the glycosyl-aspartate residue: par.lib, radii.lib, radii14.lib, restyp.lib, solv.lib, top_heav.lib
ENZO-2.0/ENZO/ENZO/FILE/ModifiedFF/amber99sbildn-velusamy-
dgc.ff
Modified AMBER force filed directory implementing the parameters for the glycosyl-aspartate residue
ENZO-2.0/ENZO/ENZO/FILE/ModifiedFF/2*default*.txt ENZO-2.0/ENZO/ENZO/FILE/ModifiedFF/2*default*.mdp
The default mdp parameter files and genionand trajectory input file used for the minimization module
ENZO-2.0/ENZO/ENZO/FILE/Example_inputs_V2/2GDVA/2GDA.pdb ENZO-2.0/ENZO/ENZO/FILE/Example_inputs_V2/2GDVB/2GDB.pdb
ENZO-2.0/ENZO/ENZO/FILE/Example_inputs_V2/5C8B/5C8B.pdb
Examples of protein receptor files which were modelled after the chain A/B of PDB template 2gdv and the chain B of 5c8b
ENZO-2.0/ENZO/ENZO/FILE/Example_inputs_V2/2GDVA/*config*.txt ENZO-2.0/ENZO/ENZO/FILE/Example_inputs_V2/2GDVB/*config*.txt
ENZO-2.0/ENZO/ENZO/FILE/Example_inputs_V2/5C8B/*config*.txt
Example of Vina/Vina-Carb configuration files for each protein receptor file mentioned above
ENZO-2.0/ENZO/ENZO/FILE/Example_inputs_V2/*GLC_dock*.dpf ENZO-2.0/ENZO/ENZO/FILE/Example_inputs_V2/*GLC_dock*.gpf
Example of docking and grid parameter files for the docking of α/ß-D-Glucose ligands in the protein receptors mentioned above
ENZO-2.0/ENZO/ENZO/FILE/Example_inputs_V2/*GLC*.pdbqt Example of ligand files (here α/ß-D-Glucose)
2.3 Equipment: setup
Installation of the softwares and launching of the ENZO web interface:
1. Download and install the virtualenv using the command: pip install virtualenv. Alternatively,
CONDA can also be used instead of pip. Mac users can download it using brew.
2. Create a new environment (with a name of your choice) inside the ~/ENZO-2.0/ENZO/
directory as shown in Figure 5A. For example: virtualenv VIRTUALENV uses the module
virtualenv to creates a new environment associated with the name VIRTUALENV
3. Activate the VIRTUALENV environment using source VIRTUALENV/bin/activate
4. Install the python modules Docopt and Django along with their required dependencies. Also,
make sure that all the required softwares (MODELLER, GROMACS, MGLTools and
AutoDock4.2/Vina/Vina-Carb) are installed.
5. Change the directory to ENZO (Figure 5A) and run python manage.py runserver to
execute the run server. Upon execution, you will be prompted with the message indicated in
(Figure 5A) along with the server http address.
Page 140 of 188

6. Open this http address in web browser to execute ENZO. You will be then redirect to the
ENZO login page as shown in Figure 2.
Primary inputs and libraries: Since ENZO has been implemented with the primary aim to model
the covalent intermediate of the sucrose phosphorylase and its homologues, any target protein
sequence that will be modelled as a covalent intermediate has to possess an aspartate residue as
catalytic nucleophile. Accordingly, the letter “D” specifying this residue in the target sequence has
to be replaced by the letter “O”. Once a sequence having a 3D structure available in the PDB and
showing homology to the target sequence has been found, the glucosyl-aspartate residue also has to
be modelled in the corresponding PDB structure of a selected template sequence. These preliminary
steps are thoroughly described in Velusamy_1 et el/Chapter 2. In addition, the MODELLER and
GROMACS force fields libraries containing the parameters related to the glucosyl-aspartate residue
should be placed in specific directories as shown in Figure 4B and C respectively.
Figure 5: Overview of the ENZO architecture and the external directories containing the
MODELLER (A) and GROMACS (B) libraries which have been modified to accommodate the
parameters of the glucosyl-aspartate (DGC) residue.
3. PROCEDURE
All steps described below are assumed to be run in a virtual environment (virtualenv) and in the
working directory ENZO2.0/ENZO/ENZO/ (Figure 5A).
3.1 Accessing to the ENZO web interface
1. Go to the ENZO home page through the http address provided by Django (as an example
http:/127.0.0.1:8000/) after the execution of the command python manage.py run server
(Figure 5A).
2. Request a new user account by sending an e-mail to: [email protected])
Page 141 of 188

3. Logon your own workspace following the details received per mail and now you are ready
to use ENZO with a limited amount of disk and authentications. You can access to a given
work package by clicking on the corresponding work packages button (see Figure 4)
3.2 Generate a mutants library
4. Click on the work package Mutagenesis (Figure4).
5. Choose the type of catalytic nucleophile residue (a standard aspartate or a glucosyl-
aspartate) that will be considered for all sequences in the library.
6. Import your wild type FASTA file by uploading it via Browse file. NOTE: Shall the input
sequence contain a glucosyl-aspartate residue, a ligands or any water molecules, it is then
required to mention them in the sequence using the respective one-letter code: (O), (.) and
(w). When an input sequence has missing residues at the N-terminus (starting by a residue
number different than 1), the user should not forget to add the letter “A” at each missing
position in the sequence in order to make the sequence numbering start at 1 (see
ENZOWP1).
7. Choose your mutagenesis schemes which suits your objective (see ENZOWP1).
8. To perform a Scanning mutagenesis, the user must supply any of the 20 amino acids (using
the corresponding one-letter code) along with a range (e.g. start:”1” and end:“6”) of position
that will be subjected to mutagenesis. To perform a Site saturation or Combinatorial
mutagenesis, a list of positions have to be provided and should be separated by comma
multiple positions are targeted. As an example, a mutation can be specified as “A1T” (single
mutation) or “A1T, S2T, T345N” (multiple mutations separated by commas). If single and
multiple mutations are performed within a same sequence, they should be separated by
carriage return. To perform a Random mutagenesis, the input should contain the position of
the residue(s) of interest, a string of selected amino acids to randomize, the mutation rate
(optional), and the number of sequences to generate (library size). An example of input
could be 1; ELK,0.5 (mutation of the position 1, by any residue chosen between E, L, K
using a mutation rate of 0.5) or 1;ELK (no mutation rate). Incase of mutation rate is
optional, user must give any value between 0-1 in the default mutation frequency; provide
choice of your number for number of output sequences. See Table 1 and Supplementary
informations Figure S7 for example of input files and submission forms of mutagenesis
schemes.
Page 142 of 188

9. Upon job completion, the user will be redirected to the output page (Figure 6A) on which
the generated FASTA sequence can be downloaded/deleted or redirected to the work
packages 2A, 2B and 2C. The user personal workspace (My jobs page) can be accessed by
clicking on the button My jobs in submission page (see Figure 6A) or alternatively in the
top right navigation panel (see Figure 3). The user can further access the outputs by
navigating the corresponding work packages.
Figure 6: Example access to the outputs from the job submission page (A) or from the general user
workspace page (B).
3.3 Modelling of variants and their respective wild type structures
10. Select any one of the modeling work packages from the below list by navigating (▼) Work
Packages with respect to your objective (see above ENZOWP2 for more details).
(WP2A: standard MODELLER homology modelling which can be used for modelling both
mutants sequence generated by the WP1 and ensemble of sequence homologs; WP2B:
homology modelling limited to the modelling of mutants sequence generated by the WP1
alone; WP2C; uses mutate model method along with the relaxation protocols to refine the
geometry of the final models)
11. Select the type of catalytic aspartate residue to model (standard aspartate or glucosyl-
aspartate) in the final models.
12. Upload the input sequence file (containing wild type and mutants sequences) and make sure
that the catalytic aspartate residue has the correct residue type (D or O) in the wild type
sequence (see STEP 6 for more details).
NOTE: It’s not mandatory to do the steps 11 and 12, if the outputs were redirected from the
previous work package WP1.
13. Upload a template protein structure, Shall the user model a glucosylated covalent
intermediate, it is then required that the catalytic nucleophilic aspartate should be replaced
Page 143 of 188

by a glucosyl-aspartate (specified by the three-letter code DGC in the PDB file) residue
before continuing and follow the protocol mentioned in STEP 14.
The next step describes the modelling of the glucosyl-aspartate residue in the crystal
structure that will be used as a template for the homology modelling of the target sequences
redirected from the WP1.
14. The modelling of the glucosyl-aspartate residue will be done using the PyMOL software. As
a first step, launch the PyMOL Graphical User Interface (GUI) and upload your structure of
interest as well as the PDB file of the single glucosyl-aspartate residue (DGC) provided in
the example directory. Then align the backbone atoms of the DGC residue with the
corresponding atoms of the standard catalytic aspartate residue in the template structure by
using the command pair-fit of PyMOL. Save the DGC residue as a PDB file and close the
PyMOL GUI. Open both PDB files of the structure of interest and the DGC residue in a text
editor and replace the ATOM section of the catalytic aspartate residue in the structure of
interest by the corresponding ATOM section of the DGC residue in order to successfully
introduce the glucosyl-aspartate residue into the structure of interest. Open the new PDB file
of the structure of interest in PyMOL and check that every residue in the whole structure
belongs to the same chain ID: A. Before closing PyMOL, save it again in order to
automatically renumber the atoms in the final PDB structure.
15. Provide the remaining parameters (See examples in Supplementary informations Figure S8
and S9) and enter submit.
NOTE: the user can also ensure an enhanced conformational sampling during the modelling
procedure of the variants by setting soft-sphere restraint weight=10 for WP2A and B and
region size=7 for mutate model (WP3), according to the protocol referred in Velusamy et
al/chapter 3
16. Upon job completion, the user can download/delete or redirect the outputs to either WP3 or
WP4A/B.
3.4 Energy minimization / molecular dynamics simulations of the mutant models
17. The WP3 takes the redirected outputs from the modelling work package WP2A/B/C as
primary input.
18. Provide all the necessary input files (See Supplementary informations Figure S10) and
specify the number of CPU to use for the minimization.
Page 144 of 188

NOTE: A provided set of input files for the minimization algorithm can be used as default
or customised by the user.
19. Submit all the inputs and repeat the STEP 9 and 15 upon completion of the minimisation
procedure. NOTE: the user can download the minimised models and further use them to
perform molecular dynamics following our recent standardised protocol (Velusamy_1 et
al/chapter 2) which was successfully applied to the modelling of the glucosyl-aspartate
intermediate of two sucrose phosphorylase enzymes.
3.5 Molecular docking of acceptors in the minimized/non-minimized models
20. This package takes the redirected outputs from either WP2 or WP3 as primary input. (See
examples in Supplementary informations Figure S10)
21. Select a favourite docking software (Vina and Vina-Carb) NOTE: We highly suggest to use
Vina-Carb whenever the ligands is an oligosaccharides.
22. Upload the PDB file of the model of interest and the PDBQT file of the ligand.
23. Upload the Vina/Vina-Carb configuration files. If Autodock4.2 is used (WP4B), then upload
the docking and grid parameter files (refer Velusamy_2 et al/chapter 3 for preparing
configuration files for Vina/Vina-Carb)
24. Provide the number of CPU to use (max 8) and an email address and submit.
25. Download the output directory which contains the docked complexes and the poses of
binding energies (in CSV format). These outputs can further be used to support experimental
studies on regioselectivity of the user’s enzyme of interest. We have recently standardize the
efficient protocol by reproducing the observed regioselectivity of selective mutants of the
sucrose phosphorylase of Bifidobacterium adolescentis (BaSP) and confirmed the
experimental results of Verhaeghe et al and M Kraus et al77,78. The corresponding
computational protocol (Velusamy_2 et al/chapter 3) and scripts which were used to derive
these results can be provided upon requesting and will be soon implemented in the
ENZOWP5.
4. TROUBLESHOOTING
Table 2: The list of troubleshooting from the case studies
Step Issue Possible reasons solution
1 ImportError: No module named docopt
The python module Docopt is not installed Install docopt using pip install docopt
Page 145 of 188

ImportError: No module named modeller.automodel
Usually this error indicates a problem with the Python path/Modeller might be not installed
see Supplementary informations Solution S7 or install modeller
ImportError: No module named django
The Python module django is not installed Install django using pip install django==1.11
Error: That port is already in use.
Due to the exist running port Use different port by running python manage.py runserver 8001 or kill the previous port by sudo fuser -k 8000/tcp; For Mac users: sudo lsof -t -i tcp:8000 | xargs kill -9
8 Your sequence contain non standard residue
Presence of non-standard residues in the input WT FASTA sequence
Correct the input sequence
Parameter field is wrong. You can only give mutations like “S1T, A154D”/May be you have given wrong amino acids
This error occur during site direct and combinatorial mutagenesis due to a wrong input format.
use the correct input format. see Supplementary informations Figure S7
Give another input/output name
Can occur when two jobs have the same output name
Use the different output name
15 _375E> Unknown residue type “DGC” found at position 192
The DGC residue is not specified in the restyp.lib file of MODELLER
See above Primary inputs and libraries
_375E> No residue “DGC”found in WT structure
The DGC was not incorporated in the WT structure PDB file
Redo the STEP 14 accordingly
_291E>Sequence difference between alignment and pdb:
Input WT sequence might have unusual startingpositions
See above STEP 6 and section ENZ0WP1
No residue found at “x” position
This also might be the consequence of generating mutants with unusual starting positions
See above STEP 6 and section ENZ0WP1
19 Residue ‘DGC’ not found in the topology database
Absence of modified force field “Amber99sbildn-dgc-velusamy” in GROMACS/share/top/ folder
See above Primary inputs and libraries
20 ImportError: No module named MolKit
Python interpreter can't find appropriate packages from MGLTools
Follow this link http://mgltools.scripps.edu/documentation/faq/ImportError
Prepare_*.py not found in the location “¬/Utilities24/
Wrong locations of python binary files of AutoDockTools
Please go to the folder ENZO-2.0/ENZO/ENZO/WORK_PACKAGES/SCRIPT/ENZOWP4A/B.pyand provide the correct path for all the *prepare*.py scripts
Mustang not found Wrong path for mustang protein alignment server/ mustang not installed
Install mustang protein alignmentserver on your local system and make it global via (.bashrc)
Configuration file parse error: multiple_occurrences
Configuration file might contains duplicate entries of arguments
Make sure there is no multiple entries in configuration file
5. TIMING
The complete protocol of ENZO pipeline takes at most 12 h to complete when 8 CPU
are used for single input sequence. In which, the execution time of mutagenesis
Page 146 of 188

experiments using ENZOWP1 module depends on the size of input and library
(random mutagenesis scheme alone). The approximative running time for generating
200 models of single mutated sequence (100) including its wild type (100) using
ENZOWP2 module has been estimated to 1h 05 with the respective times of 30 min,
26min, and 9 min for the WP2A, WP2B, and WP2C subroutines. Using the
ENZOWP3 module, a total running time of 7h 30 was required for the energy
minimization of 100 solvated protein models of 77339 atoms each using 50000
minimization steps. The docking of glucose acceptor in the corresponding minimized
structures using the WP4A/WP4B subroutines took about 3h 30 to 4h to complete
using Vina/Vina-Carb and AutoDock4.2 respectively. Note that the corresponding
calculations can be speeded-up thanks to the implementation of multithreading in
most ENZO work packages (except WP1 and WP4B) which allows the use of a
higher number of CPU.
6. ANTICIPATED RESULTS
The user will be notified by e-mail upon job completion of each module. Overall, the corresponding
outputs generated for each module are stored in My jobs along with the size of the output, job status
and the details of associated inputs (see example at Figure 3 and 6). The user can then download,
delete and redirect these outputs for further analysis. The main outputs generated are the following:
ENZ0WP1: Directory containing all mutant sequences in FASTA format, ENZ0WP2A/B/C:
Directory containing the homology models of selected variant/wt sequences in PDB format along
with a CSV file reporting three important scores (DOPE, MOL PDF, GA341) which indicate the
overall quality of the generated models, ENZ0WP3: Directory containing all energy minimised
models, non-standard force field directories and other important files related to the energy
minimisation procedure. ENZ0WP4A/B: Directory containing the structures of the protein-ligand
complexes generated using molecular docking in PDB format and their respective binding energies
reported in CSV file. The details of each input and output files are shown in Scheme1.
Page 147 of 188

7. SUPPLEMENTARY INFORMATIONS
Figure S7: Example of input submission for the mutagenesis scheme protocols
if [-z $PYTHONPATH ]then export PYTHONPATH="~/modeller/lib/x86_64-intel8/python2.5/:~/modeller/modlib/"else export PYTHONPATH="${PYTHONPATH}:~/modeller/lib/x86_64-intel8/python2.5:~/modeller/modlib/"fi
if [-z $LD_LIBRARY_PATH]then export LD_LIBRARY_PATH="~/modeller/lib/x86_64-intel8"else export LD_LIBRARY_PATH="${LD_LIBRARY_PATH}:~/modeller/lib/x86_64-intel8"fi
Solution S1: Possible solution for the error message “no module named modeller.automodel” which consists in exporting the appropriate PYTHONPATH and LD_LIBRARY_PATH environment variables.
Page 148 of 188

Page 149 of 188
Figure S8: Example of input submission forms of ENZOWP2A (A), ENZOWP2B (B), ENZOWP2C(C) (the inputs were uploaded from local system)

Page 150 of 188
Figure S9: Example of input submission forms of ENZOWP2A (A), ENZOWP2B (B), ENZOWP2C(C) (the inputs were redirected output from previous packages)

Page 151 of 188
Figure S10: Example input submission (redirected output from previous packages) forms ofENZOWP3 (A), ENZOWP4A (B) and ENZOWP4B (C).

Chapter 5Conclusion and future perspectives
1. DISCUSSION AND CONCLUSIONS
This thesis work is aimed to develop new computational tools and approaches to address the impact
of mutation on retaining glucosidases. Accordingly, the main objective aimed at providing a rational
explanation for the altered enzymatic activities of selective variants of the sucrose phosphorylase of
Bifidobacterium adolescentis. With respect to the general mechanism of retaining glucosidases, a
model of the glucosylated covalent intermediate of this enzyme was constructed. The accurate
modelling of this structure required the parametrization of the glucosyl-aspartate residue followed
by the implementation of the corresponding force fields parameters in both MODELLER and
GROMACS softwares for further use in homology modelling and MD simulations. Subsequently, a
modelling approach was developed and applied to investigate the impact of specific mutations on
the binding mode of a co-substrate which has been shown to influence the regioselectivity of the
final products. The respective results are discussed in this section along with the key findings and
future perspectives of the thesis.
The sucrose phosphorylase studied in this work was selected due to its industrial and medicinal
interest. Due to its transglucosylation activity, this enzyme can be harnessed as an attractive
biocatalyst for the synthesis of glucosylated compounds. Despite its ability to produce a large panel
of rare disaccharides, it suffers nonetheless from inadequate selectivity. Though many successfull
engineering strategies have been attempted to overcome the latter issue, no predictive
computational study have attempted so far. One of the main limitation to the use of molecular
modelling for the study of these enzymes is the lack of adequate force field parameters which are
required in many computational approaches. Up to now, the literature has never reported any force
field parameters for the modelling of the glucosyl-enzyme intermediate of retaining glucosidases.
Given the importance of this structural intermediate in the catalytic mechanism of this enzyme, the
parameterization of glucosyl-aspartate residue prior to any computational studies is really important
In order to address this issue, we leveraged the source of available online tools and softwares to
generate approximative force field parameters for the glucosyl-aspartate residue. The software
CGenFF was used to derive adequate force field parameters compatible with both CHARMM 22
and CHARMM 36 force fields for subsequent use in MODELLER whereas the Antechamber
Page 152 of 188

program and the GLYCAM server were employed in combination with the force field Amberff99sb-
ILDN to generate hybrid force field parameters for subsequent use in GROMACS.
Further, the glucosyl-aspartate residue (implemented as DGC) parameters were successfully
validated based on the hypothesis that the accuracy of the force field parameters derived for this
non-standard residue can be evaluated based on their ability to reproduce the observed puckering
state of the glucosyl moiety in crystal structures (2gdv_A and 1s46_A) and models (2gdv_B and
5c8b_B) respectively. Accordingly, a set of two force field parameters for the glucosyl-aspartate
residue was derived by analogy with existing parameters from the CHARMM 22 and GLYCAM-06
force fields. The subsequent use of these parameters for the modelling of the glucosyl-aspartate
covalent intermediates of two sucrose phosphorylases in validated this hypothesis. In addition, the
simulations through GLYCAM-06 forcefield parameters were able to reveal the impact of
conformational changes as well as the effect of loop shifts respectively observed during sucrose
conversion and introduction of Q345F mutant. Overall, this work opens new perspectives for both
homology modelling and molecular dynamics (MD) simulations of glucosylated forms of sucrose
phosphorylase homologues and to get better understanding of its catalytic mechanism.
This thesis work also unraveled the molecular basis of the SP regioselectivity towards two valuable
products, respectively towards Kojibiose and Nigerose. The development of a modelling workflow
integrating new force field parameters was applied to the accurate modelling of the glucosyl-
enzyme intermediate of SP in complex with α/β-methyl-glucosides acceptors. The models inferred
that the regioselectivity of the final product would depend on the initial orientation of the acceptor
substrate. This work also shows that specific mutations, known for their impact on SP
regioselectivity, greatly influenced the orientation of the acceptor substrate therefore providing a
rational explanation for the altered regioselectivity of the corresponding mutants.
A geometry optimization module has been implemented in the modelling workflow in order to
improve the quality of the generated models. This module includes a local and a global geometry
relaxation protocol which can be respectively used for adjusting the geometry of the glucosyl-
enzyme models upon introduction of mutations or to increase the conformational sampling for the
modelling of an ensemble of conformers. These optimization procedures have been tested for the
modelling of the structural impact of the Q345F mutation on the 3D structure of SP. This work has
shown that both the local and global geometry relaxation protocol generated a broader
conformational sampling.
This comparative modelling study has also highlighted the greater ability of the local relaxation
protocol to reproduce the local structural rearrangements provoked by the Q345F mutation and
observed by comparing the crystal structures of the wild type and the respective mutant. However,
Page 153 of 188

the respective protocol resulted in different set of wild type models instead of one, since they were
optimized with different region size. Subsequently, the corresponding wild type models were
observed different binding affinities. On the other hand, though the use of global geometry
relaxation procedure result in better sampling which suffers from a poor side chains repacking in
the final models. In order to overcome both respective side chains repacking and different binding
affinities of wild type, a hybrid method combining both the local and global geometry relaxation
protocols has been implemented in the workflow for the respective modelling of mutants and wild
type 3D structure of SP. At the end, both the issue was solved by successfully reproducing the
repacking of Q345F mutation and producing one single wild type respectively by local and global
optimization.
Subsequently, an automated web application called ENZO has been developed in order to port this
modelling workflow to the community. This web application is specifically dedicated to the
modelling of 3D structures of glucosyl-aspartate catalytic intermediates of glucosidases. The overall
modelling procedure includes a combination of four modules which are respectively used to
perform homology modelling, energy minimization of the resulting models and docking of putative
co-substrate in the final model. ENZO can be used as a high-throughput tool to model a large
mutant library from the sequence of a given homologue of any structurally characterized
glucosidases reported in the PDB. Moreover, a set of in-house statistical analysis scripts along with
external tools have also implemented in ENZO in order to predict the impact of mutations on the
stability of a given protein structure The integration of these complementary tools in ENZO allows
the user to further improve the accuracy of the modelling procedure. Finally, a set of protocols
specifically dedicated to the modelling of sucrose phosphorylases variants has also been provided
for each module of the ENZO pipeline. These protocols have been standardized for the efficient
screening of promising mutations aiming at improving the properties of sucrose phosphorylases so
that this modelling workflow can be directly applied as a predictive tool to guide further
mutagenesis experiments on these enzymes. It will open new avenues for novel applications in the
field of chemosynthesis of original chemicals like rare disaccharides or other glycoconjugates.
2. EXPLORATION OF THE SUCROSE PHOSPHORYLASE MUTATIONAL
LANDSCAPE FOR ENGINEERING APPLICATIONS
As an application of ENZO, we wanted to apply a standardized modelling protocol of ENZO to
engineer the regioselectivity with other acceptors. For this purpose, a new pipeline was developed
to identify the potential mutants of sucrose phosphorylase (SP) to improve the regioselectivity
towards kojibiose and nigerose products. The corresponding pipeline consist of three main steps:
Page 154 of 188

Firstly, the construction of SP variants library following different rounds of screening. Secondly, the
generation of 3D models for the mutants library where the models were prepared in covalent
intermediate form. Finally, the characterization of individual mutants to understand their impact on
the binding preference of a co-substrate of the enzyme and their subsequent influence to the
coupling regioselectivity. The corresponding final step was carried out by using combination of
molecular docking and set of in-house statistics analysis tools. Note that this pipeline also served
with an external tools such as HotspotWizard V3.0 and FoldX used for design smart library and
stability prediction respectively102,123. The overall pipeline is shown in scheme 1 and the associated
results are discussed in this section.
Scheme 1: Overview of the modelling pipeline used to engineer the regioselectivity of sucrosephosphorylases.
It starts with the construction of a “smart” mutant library in step 1 using the web server HotspotWizard V3.0102, in combination with the manual curation of published data. The mutagenesishotspots are then selected based on four different protein engineering strategies, either focusing onso-called: functional hotspots (FUH), stability hotspots based on structure flexibility (SFH) or onsequence conservation (SCH), or correlated hotspots (COH). The use of a given strategy is basedon specific selection parameters which include: the minimal amino acid frequency (MAF), theprobability tolerance of the mutational landscape (MLPOT), the use of sequence consensus (SC)and correlated positions. Upon selection of a given hotspot mutagenesis strategy, a mutant librarycan be generated by the use of one over five different mutagenesis schemes (SCAN: scanning, SAT:
Page 155 of 188

saturation, SD: site-directed or RAND: random). A selection of mutant sequences based on theirpredicted structural stability is further performed by FoldX123 in order to help the identification ofsequences showing a high probability to fold into a stable structure. The 3D structure of theselected protein sequences are then modeled by homology to one or several structurallycharacterized protein homologues using MODELLER in step 2. The modelling protocol is furtherrefined by the use of one out of the local, global, or hybrid geometry optimization algorithms154,183
mentioned earlier. Subsequently, energy minimization of the mutant models are carried out byENZO3 using either a modified force filed (amber99sbildn-dgc-vel.ff) for the modelling of glucosyl-aspartate residues (DGC) or a standard forcefield (amber99sb-ildn.f) for the modelling of freeenzymes or in complex with a given substrate. In step 3, molecular docking of additional ligands inthe resulting 3D models as well as additional statistical analysis of the interactions can be furtherconducted using either AutoDockVina or Vina-Carb softwares174,175.
2.1 Construction of smart library of variants
Traditionally, the directed evolution experiments are used in industry for screening of large protein
sequence libraries. This in turn investigates the mutational landscape and its effect on the protein
function. This approach is therefore considered the most efficient method to develop tailor made
enzymes using rounds of random mutagenesis. However, this application can be restrictive due to
its laborious and costly screening of large libraries79,81,221,222. Thus creating a smaller and better
quality libraries could prove to be an effective to improve the efficiency of directed evolution
experiments. Such libraries are termed as “smart libraries” which are usually created by performing
mutagenesis on a set of essential residues (hot spots) that are most likely to affect the desire
property of target protein79–81,221,222. In the current work, we managed to produce smart libraries for
our target protein using combinations of tools HotSpotWizard v3.0 along literature and manual
curation of key residues. The manual part of study was done by using Pymol v1.8, PLIP and Jena
librarys84,188,223.
2.1.1 Selection of starting structure
As stated before, there are only three crystal structures available for sucrose phosphorylase of
Bifidobacterium adolescentis in PDB database. Each of which represents the apoenzyme form,
sucrose bound form and glucosylated-enzyme intermediate (Figure 1A). A small description of
these forms have been in Table1.
Table 1: The list of available 3D structures of sucrose phosphorylase of Bifidobacteriumadolescentis where 1R7A and 2GDV is wild-type active form and 2GDU is inactive mutant form.
Pdb id Type of structure Enzyme form
1R7A Wild type Active
2GDV_A Wild type Active in glycosylated-enzyme intermediate form(Reacted with sucrose and D192 covalently bond to glucose in chain A)
2GDV_B Wild type Active in free phosphate bound form
2GDU Mutant In active (Catalytic residue Glu232 mutated to Gln232)
Page 156 of 188

Further, the results of multiple structure alignment in Figure 1A shows that these three structures
are highly superimposable and the corresponding RMSD deviation is illustrated in Figure 1B. We
used 2GDV chain A as a starting structure for our further experiments since its glucosylated-enzyme
intermediate form has been hypothesized to be an enzyme active form for transglucosylation (see
chapter 1 for more detail)55.
Figure 1: Comparison of sucrose phosphorylase structures from Bifidobacterium adolescentisbased on superimposition (A) and RMSD deviation based on multiple structure alignment (B).
2.1.2 Annotation of sucrose phosphorylase structure
In the view of designing an in silico mutagenesis experiment, it is important to study the protein
sequence of interest and identifying potential mutable hot spots. Moreover, at the end of the day, the
selected hot spots need to address the link between protein sequence, structure and function. There
are several computational tools available that can help deduce the same. In our case, as stated before
HotspotWizard V3.0 was used to identify the hot spots and design of smart libraries as since it
integrates sequence, structural and evolutionary information to do the same. In which, the hot spots
identified using four different protein engineering strategies and selection modes that have been
described in Table 2. The resulting libraries generated using HotspotWizard can be further used for
engineering protein stability, catalytic activity, substrate specificity and enantioselectivity.
Page 157 of 188

Table 2: Comparison of four different engineering strategies of HotspotWizard to identify the potential the mutable hot spots and to design smart libraries.
Engineering strategies Definition and Target function
Functional hot spots (FUH) Identify residues forming catalytic pocket or access tunnel which are notdirectly involved in the catalysis and not critical in protein function (Figure2A). The respective identified residues are ranked in the following fourdifferent level of mutability rate: 6-9 (High), 4-6 (moderate), 4-6(unreliable) and 0-4 (Low) target: Activity, substrate specificity and selectivity
Stability hot spots (SFH) corresponding to structure flexibility
Identify the most flexible residues. (I.E) residues with highest b-factor in the query structure. In which, hot spots are assigned when all residues with the high relative flexibility (top 25 % of residues with the highest B-factor).
Further, it also give information about secondary structure, residue relativeaccessible surface area, residue ranking based on the residue average B-factor and relative flexibility.target: Stability
Stability hot spots (SCH) corresponding to sequence conservation
Identify positions which are in the set of sequence frequently occupied by the same amino acid residue and at the same time this frequent residue not present at this position in the query protein position (Figure 2B).
It is deal with two different approach where the default approach (majority approach) is applied when the input has 50% of conservative residue and in the case of below 50% of conservative residue it is frequency ratio approach.target: Stability
Correlated hot spots (COH) Identify correlated positions by consensus approach where it consider atleast one of the residue from the pair that has mutability equal to or higherthan 4. (Figure 2C)target: Activity, substrate specificity and stability
As stated before, we used 2gdv (chain A) structure to identify the potential hot spots to predict the
transglucosylation activity of SP since it represents the glucosylated-enzyme intermediate form. The
protein annotation was started with the identification of catalytic residues. However, no catalytic
residues were identified by HotspotWizard. So, a list of 9 residues (D50, F53, H88, R190, D192,
E232, H289, D290, R399) was manually curated using the results from Jena library (database of
biological macromolecules223). Upon providing this list to HotspotWizard, we got a list of 30
pockets and 1 tunnel with a length of 11.2Å. Further, the 9 residues were used to narrow down and
select the catalytic pocket (pocket 1) from the list of pockets generated earlier. The chosen catalytic
pocket have been illustrated in Figure 2.
Page 158 of 188

Figure 2: Graphical representation of protein engineering strategies namely functional hot spots(A), stability hot spots corresponding to sequence conservation (B) and correlated hotspots (C).(SC: sequence conservation)
Figure 3: The identified catalytic pocket (left) and tunnel (right) using Hotspot Wizard3.0.
Page 159 of 188

The identified catalytic pocket is globular in shape with a volume of 780 (Å3) which is definedbased on the location of catalytic residues and relevance score (pocket score/the highest score*100)given by fpocket tool. One tunnel with a length of 11.2 Å was also identified which all representedin the grey zone. (catalytic pocket: residues that are corresponds to green spheres is part of thecatalytic pocket where as red sphere is vice-versa; Tunnel: residues that are shown in white coloris part of the tunnel where as green is vice-versa)
2.1.3 Identification of hot spot residues following filtration
When the objective is to identify hot spots, the optimal strategy could be depends on the property
being targeted. For instance, while targeting catalytic properties (activity, specificity and
stereoselectivity), residues that drive the substrate binding or product release can be targeted. In
accordance to that detection of binding pockets or access tunnels can facilitate in identification of
such residues. In our case, we have focused on identification of functional hot spots, to enhance the
regioselectivity of sucrose phosphorylase towards kojibiose and nigerose products.
Table 3: The list of initial functional hot spots based on the eight different combinations.
FUNCTIONAL HOT SPOTS
Position Residues Mutability Non_essential Tunnel Catalytic pocket Counts
335 Gly HIGH ✓ ☓ ✓ 1
133 Arg MODERATE ✓ ✓ ✓
341 Leu MODERATE ✓ ✓ ✓
233 Val MODERATE ✓ ✓ ✓ 4
342 Asp MODERATE ✓ ✓ ✓
340 Asn MODERATE ✓ ☓ ✓
204 Ser MODERATE ✓ ☓ ✓
195 Gly MODERATE ✓ ☓ ✓ 5
139 Pro MODERATE ✓ ☓ ✓
131 Ile MODERATE ✓ ☓ ✓
235 Ser MODERATE ✓ ✓ ☓
343 Leu MODERATE ✓ ✓ ☓
136 Pro MODERATE ✓ ✓ ☓ 4
295 Ile MODERATE ✓ ✓ ☓
132 Tyr LOW ✓ ✓ ✓
134 Pro LOW ✓ ✓ ✓
135 Arg LOW ✓ ✓ ✓
156 Phe LOW ✓ ✓ ✓
193 Ala LOW ✓ ✓ ✓ 9
196 Tyr LOW ✓ ✓ ✓
206 Phe LOW ✓ ✓ ✓
234 His LOW ✓ ✓ ✓
345 Gln LOW ✓ ✓ ✓
344 Tyr LOW ✓ ✓ ☓ 1
153 Trp LOW ✓ ☓ ✓
160 Gln LOW ✓ ☓ ✓
Page 160 of 188

155 Ser LOW ✓ ☓ ✓
199 Lys LOW ✓ ☓ ✓ 7
205 Cys LOW ✓ ☓ ✓
207 Met LOW ✓ ☓ ✓
347 Asn LOW ✓ ☓ ✓
50 Asp LOW ☓ ☓ ✓
53 Phe LOW ☓ ☓ ✓
192 Asp LOW ☓ ☓ ✓
232 Glu LOW ☓ ✓ ✓
290 Asp LOW ☓ ✓ ✓ 8
399 Arg LOW ☓ ☓ ✓
88 His LOW ☓ ☓ ✓
289 His LOW ☓ ☓ ✓
39
Accordingly, a list of 39 functional hot spots was identified using HotspotWizard analysis (Table 3
above) and which are further categorized on the basis of following combinations of criteria’s:
1. Highly mutability rate with mutable grade above 6 to 9 -1 position
2. Moderate mutability rate + hits located in catalytic pocket and tunnel - 4 positions
3. Moderate mutability rate + hits located in catalytic pocket alone - 5 positions
4. Moderate mutability rate + hits located in tunnel alone - 4 positions
5. Low mutability rate + hits located in catalytic pocket and tunnel - 9 positions
6. Low mutability rate + hits located in catalytic pocket alone - 7 positions
7. Low mutability rate + hits located in tunnel alone - 1 position
8. Low mutability rate + Non-essential residues mostly located in catalytic pocket and a few
from tunnel - 8 positions
Besides functional hotspots, we have also identified the additional hot spots associated with other
three engineering properties, namely SFH, SCH and COH (see Table 2 above). These are chosen,
since they are also majorly contribute to the stability as well as catalytic properties. The respective
counts are shown below:
1. SFH with high relative flexibility -125 hits
2. SCH based on majority and frequencies ratio approach - 41 hits
3. COH with mutability rate 6 - 25 unique positions from 13 pairs
Page 161 of 188

In addition to all of the above, 12 experimental mutants were considered from the works of Tom
and M kraus which were termed and used as an Experimental Data (ED)77,205. Subsequently, the
initial 39 hot spots were narrowed down in to 20 positions using the following filtration steps:
1. Initially all the residues common for SFH, SCH and COH and present in both catalytic
pocket and tunnel were filtered.
2. From the list above, all the residues within 15Å around the fructose were screened
3. The list was further reduced by considering residues present 10Å from fructose and in
congregation with experimental data.
The final list contains 20 hot spots are summarized in Table 4 above and additional 4 residues
chosen manually (His289, Asp290, Gly291 and Arg399) after rigorous observation of the structure.
These 20 hot spots along with 4 residues were then subjected to design in-silico mutagenesis
experiments by using site saturation mutagenesis scheme (ENZO1). This pipeline generated a total
of 456 mutants corresponding to 19 substitutions for each ht spot residue, i.e, 24*19.
Table 4: The list of 20 hot spots after the three filtrations of initial 39 functional hot spots (FUH).
In STEP1: selected all the residues that are common in the list of stability hot spots- structureflexibility (SFH), stability hot spots-sequence consensus (SCH), correlated hot spots (COH) andthe residues located in the catalytic pocket and/or in tunnel region. In STEP2: selected all theresidues that are within 15Å from the fructose. In STEP3: selected all the residues that are within10 Å from the fructose including some residues which are common in the list of hot spots (SFH,SCH and COH) and experimental data (ED).
FILTRATION STEPS
FUH ED SFH SCH COH STEP1 STEP2 STEP3
335* 332 395 449 200 335 COH, Pocket 335 335
133 59 179 94 154 150 Pocket&Tunnel 133
341 341 341 180 169 275 282 SSH, ED, Pocket&Tunnel 341 341
233 233 213 216 226 233 323 SCH, ED, Pocket&Tunnel 233 233
342 342 396 62 504 271 123 ED, pocket&Tunnel 342 342
340 340 486 200 178 138 SSH, Pocket 340 340
204 276 328 331 22 338 Pocket 204
195 247 336 221 264 158 Pocket 195 195
139 392 471 63 35 194 Pocket 139
131 92 245 474 393 329 Pocket 131
235 16 389 307 452 179 Tunnel 235 235
343 343 343 70 106 222 225 SSH, ED, Tunnel 343 343
136 489 466 394 331 137 Tunnel 136
295 391 299 390 295 248 SCH and tunnel 295 295
132 132 132 318 217 314 173 SSH, ED, Pocket&Tunnel 132 132
Page 162 of 188

134 134 488 338 107 362 150 ED, pocket&Tunnel 134 134
135 135 135 337 224 197 282 SSH, ED, Pocket&Tunnel 135 135
156 109 485 219 185 323 Pocket&Tunnel 156 156
193 193 476 167 220 320 123 ED, Pocket &Tunnel 193 193
196 196 227 73 104 360 138 ED, Pocket &Tunnel 196 196
206 147 76 444 165 338 Pocket&Tunnel 206
234 234 320 475 393 310 158 ED, Pocket &Tunnel 234 234
345 345 181 148 305 397 194 ED, Pocket &Tunnel 345 345
344 344 344 317 301 210 329 SSH, ED & Tunnel 344 344
153 487 20 105 434 Pocket
160 267 492 448 382 Pocket 160
155 316 311 303 155 SCH&Pocket 155 155
199 309 171 302 63 Pocket
205 225 413 304 19 Pocket 205
207 443 269 447 297 207 COH, Pocket 207 207
347 314 246 445 110 Pocket
50 329 248 446 348
53 310 168 184 181
192 182 185 60 367
232 490 469 339 161
290 472 308 183 374
399 101 312 468 236
88 228 222 327 450
289 473 108 172 44
166 69 223 363
102 103 300 215
313 306
39 12 125 41 25 31 28 20
2.1.4 Towards smart library based on stability and experimental data
In continuation to the section above, the total of 456 mutants obtained from in silico mutagenesis
experiment were further filtered based on their affect on the stability of protein structure and the
factors shown in Figure 4. Wherein, the stability of the structure was predicted by using FoldX.
Here, the change in the stability of protein is defined by the change in free energy ((∆ΔG) between
the wild-type and mutant structure expressed in kcal/mol. The more negative the difference, the
more it is considered stabilizing. A mutation that increases the free energy of the structure with
respect to wild type (ΔΔG>0 kcal/mol) is considered to have destabilized the structure, while a
mutation that decreases the free energy (ΔΔG<0 kcal/mol) is considered to stabilize the structure.
Page 163 of 188

The prediction of stability was done by using following two commands in FoldX:
1. RepairPDB:
i.e, FoldX --command=RepairPDB pdb=2GDV.pdb
2. BuildModel:
i.e, FoldX command=BuildModel --pdb=Repair_2GDV.pdb mutant file=individual_list.txt.
Figure 4: Cross validation of identified 24 hot spots with experimental data
Cross validation of 24 hot spots with the affinity for natural acceptors on fructose and phosphatebinding modes71,224, location of residues and sequence conservation (FBM: Fructose Binding Mode;PBM: Phosphate Binding Mode)
The stabilized structures were compartmentalized on the basis of a set of cut off values which
illustrates the effects of mutations on the stability of the structure. The corresponding stability
criteria’s along with cut off ranges (ΔΔG value) and their respective resulted mutants are shown in
Table 5 along with descriptive view in Figure 5. Further we cross validated the chosen 24 positions
by comparing it to experimental data available from the work of Verhaeghe et al71,224. In their
Page 164 of 188

respective work, they did a comparison of acceptor site of SP from Bifidobacterium adolescentis
with other enzymes that act on sucrose such as amylosucrase and sucrose hydrolase.
Table 5: The details of stability criteria’s along with the range of ΔΔG values and thecorresponding number of mutants associated.
Stability criteria Range of ΔΔG value (kcal/mol) Number of mutants
Highly stabilizing ΔΔG < −1.84 5
Stabilizing −1.84 ≤ ΔΔG < −0.92 20
Slightly stabilizing −0.92 ≤ ΔΔG < −0.46 21
Neutral −0.46 <ΔΔG ≤ +0.46 95
Highly destabilizing ΔΔG > +1.84 184
Destabilizing +0.92 < ΔΔG ≤ +1.84 77
Slightly destabilizing +0.46 <ΔΔG ≤ +0.92 54
total 456
All of these enzymes differ by the acceptors (AH: amylose; SH: water; SP: phosphate) which they
recruit for the reactions. In their work, they determined a set of potential mutants that contribute to
the enzyme’s specificity by mutating residues from acceptor site to alanine. Indeed, a list of
interesting mutants (Tyr132, Pro134, Arg135, Tyr196, Val233, His234, Asp342, Tyr344 and
Gln345) were available from their work that have been shown to lead to loss of affinity of SP to
bind with fructose and/or phosphate. On comparing our list of 24 hot spots with their work, we
found that all of the 9 residues from Verhaeghe et al work71,224 were categorized as ‘highly
conserved’ in our list. Thus, proving to be highly beneficial for SP activity and loss of function on
mutation. The binding affinity of loop A (336-345) and loop B (130-140) shifts according to
fructose and phosphate binding modes. i.e, Arg135 and Asp342.
This clearly shows that the conformational change of loops A and B switching from ‘fructose
binding mode’ to ‘phosphate binding mode’ highly influence the binding of either fructose or
phosphate. Hence, choosing residues from this region need to be more cautious. Accordingly, the
residues Tyr132 and Asp342 were found to have strong affinity towards fructose binding which was
drastically reduced more than 10 fold of times) upon removing their their side chains224. Also, any
action on the Tyr132 residue likely to affect the interaction of Tyr196 (usually found to have
hydrophobic interaction with C1 atom of fructose). In that respect, we further exclude these two
resides from the current list of 24 hotspots. In addition to that, we also dropped His234 since it was
highlighted as most drafting affect of all mutations upon its removal and the reason for the same is
still unclear224. Subsequently, the residue Ala193 also removed from the list as it is found very close
Page 165 of 188

to the catalytic residue Asp19255. Finally, the previous 24 positions were narrowed down to 20 after
the removal of Tyr32, Ala192, Tyr196 and His234.
2.2 Generation of 3D models of smart library following characterization of individual mutants using molecular docking
In order to identify the promising mutants with more specificity towards either kojibiose or nigerose
formation, the modelling following docking calculations were decided to perform on the list of 380
mutants (20 selective positions *19 AA) using 2gdv Chain A as a starting structure (glycosyl
enzyme intermediate form). However we envisaged that conducting modeling and docking
experiments on large dataset (here 380 mutants) is time consuming and meaningless. Hence, we
decided to filter out some mutants that own poor activity towards sucrose binding, since they are
expected to affect the formation of glucosyl enzyme-intermediate (active BaSP form of
transglucosylation). In order to accomplish that, a standard protocol was developed by reproducing
the activities (low affinity towards sucrose binding) of experimentally observed mutants as shown
in Figure 6.
Page 166 of 188
Figure 5: The over view of mutant library after the three filtrations steps and stability prediction.

• All the four mutants (Tyr132, Arg135, His234 and Gln345) that are associated with lower
affinity towards sucrose binding were subjected for modelling (ENZO2A) using the pdb
1R7A (apoenzyme form) as a template structure.
• 200 models were generated for each mutants (100) along with its wild type (100)
Subsequently, molecular docking experiments of all the 800 models (4 mutants * 200 models)
against sucrose were planned by using the docking programs AutoDockVina and Vina-Carb.
However, we were not sure about accuracy of above docking programs on handing glycosidic bond
angles of sucrose acceptor. In order to confirm this point, a small docking experiment was
performed with the wild type apoenzyme (PDB: 1R7A) and mutant version (PDB: 2GDU) of BaSP
structures against sucrose using both AutoDockVina and Vina-Carb programs. In which, the sucrose
compound treated in both rigid and flexible forms.
Figure 6: Specific activities of selective positions which are experimentally shown to have less
activity for sucrose and Glucose-1-phosphate71.
Subsequently, the conformation of sucrose docked poses were retraced with the crystal structure
orientation. The corresponding results showed that both algorithms were able to retain the original
conformation when the sucrose was treated as rigid. Unfortunately, both programs failed to retain
Page 167 of 188

the hydroxyl groups upon treating sucrose compound in flexible form. Moreover, the binding
energies between the native like predicted poses (rigid) and flexible docked poses were readily high
(min -3 times). The respective results are shown in Figure 7.
Figure 7: The comparison of docking results of sucrose compounds (rigid and flexible) againstwild type (1R7A) and mutant version (2GDU) of SP using AutoDockVina and Vina-Carb.
Considering these latter observations, we have concluded that simulation of activity of sucrose
compound in the acceptor site using AutoDockVina or Vina-Carb won’t be accurate. In order to
overcome this issue, we further wanted to conduct docking experiments with combination of three
different protocols as follows:
• Flexible side chain except catalytic residue + flexible ligands
• Flexible side chain except catalytic residues + fixed ligands
• Flexible side chain except catalytic residues and some other important residue +
flexible/fixed ligands.
The latter protocols might be time-consuming, but we envisage that it can be improved by limiting
the list of flexible residues using proper selection criteria. If this doesn’t work, we then plan to
generate an ensemble of sucrose conformations and chooses one best orientation for further docking
experiments. Apart from these protocols, we have already tried to predict the regioselectivity of
Page 168 of 188

Pro134, His234 and Tyr132 using docking with a fixed binding site residues and flexible ligand.
The regioselectivity was estimated based on the frequency of poses (one closer to the target sucrose
compound with various RMSD cut off ranges). In which, all the hydroxyl atoms from the sucrose
docked poses were excluded during the RMSD calculation. Instead, only the main atoms of
glucosyl and/or fructose moiety or atoms of both were separately considered. However, it was
unable to reproduce the activity of Tyr132, Pro134 and His234 (data have not been shown here). We
are further working on this aspect with the proposed pipeline as shown in Figure 8.
Figure 8: The future pipeline for regioselectivity prediction.
3. FUTURE PERSPECTIVES
With reference to the achievement of the thesis mentioned above, we have discussed some of the
main limitations and cavities associated. Listed below are the possible methods and approaches to
overcome those limitations, and these will be explained in detail one by one, chapter-wise.
Regarding Chapter 2, though our computational modelling and simulation studies were
successfully correlated with the hypothesis (see above), still there are some important questions
below need to be addressed.
• What are all the factors that stimulate the conformational change during the switch of
fructose binding mode to phosphate binding mode?
• What is the role of water molecules on the stability of distorted puckering state,
conformational change of loops and relocation of catalytic residues?
Page 169 of 188

• What are all the consequence of single point mutation Q345F on the loops (A and B) of
5C8B_B model?
• What is the possible puckering states which can be observed on crystal structures 2gdv
chainA, 2gdv chainB, 1s46 chain A and 5c8b chain B during the course of 100 nanoseconds
simulations?
Providing successful explanation for all the above questions would definitely help in understanding
the mechanism of sucrose phosphorylase. Moreover, it will give a clear idea about the appropriate
BaSP structures and use of water molecules for the future docking experiments. Indeed, there are
many possibilities available for addressing the solution for above questions:
1. Running longer time (in micro seconds) simulation with specific set of analysis,
2. Calculating the residence time of water and
3. Generating replicates of the simulations.
Regarding rational explanations given in Chapter3, it would be more impactful to the future
regioselectivity predictions, when the same protocol also repeated using observed sucrose binding
activities and using 2gdv chain B as a starting structure for molecular modelling. Because, the
present protocol were standardized solely based on the selective mutants (shown to improve the
regioselectivity towards kojibiose and nigerose products) and performed all calculations using
glycosylated intermediate structure.
On the other hand, conformational sampling of variants was broadly explored in Chapter 3 using
three different optimization protocols. However, all the three protocols need additional
improvements in terms of producing quality sampling and accurate repacking of mutated residue.
In accordance, it is really important to work on this aspects to improve the existing protocol or
completely introducing alternative protocol is highly desirable. In that respect, generating
conformational sampling through molecular dynamic simulations could be a possible alternative
and it is highly recommended.
Following the important question raised in the thesis panel, the validated protocol in Chapter 3 will
be repeated with sucrose phosphorylase models in dimer form as it could be the biological form in
BaSP. Though, the functional unit is documented to be the homo dimer and no literature does not
mention if their biological form is also the dimer.
Then, concerning Chapter4, there are many functions need to be improved on ENZO to make it
more user friendly. In that respect, the input submission in modules ENZO3 and 4 from a local
Page 170 of 188

machine placed in top of the limitations list. Similarly, the details of jobs and its execution time
provided by ENZO is often incorrect which should be solved else it will be hard to trace the
appropriate output files. Another limitation is that ENZO failed to send emails in the beginning of
the calculation and no job status are provided. Working on the above limitations as future
perspectives and solving them would be fruitful for users. On the other hand, deletion of files from
the jobs page often leads to laborious task since ENZO doesn’t allow users to delete multiple jobs at
one time. So, it is highly recommended to modify this latter option would makes the deleting jobs
easier. Apart from these limitations, some of the new functions mentioned below are planned to
implement in the present ENZO:
• Implementation of new function in ENZO1 that takes HotSpotWizard outputs and
automatically converts into ENZO input format for all five mutagenesis schemes.
• The combination of mutate model (for modelling of mutants alone) + automodel (modeling
wild type models alone) will be implemented in ENZO2 as the fourth module
• In order to perform conformational sampling of variants through molecular dynamics
simulations, the respective equilibration and MD production steps will be added to the
existing ENZO3 automation protocol.
• In order to speed up the molecular docking calculations using AutoDock Vina, the parallel
version of respective program called VINALC will be added to the existing ENZO4A.
• A set of analysis scripts such as calculating distance and RMSD of docked compounds
against target acceptor will be added as new module ENZO5.
• A website of ENZO with specific URL address will be be launched.
Further, ENZO will have application in engineering regioselectivity with other acceptors which
needs an additional refinement on the docking protocol for oligosaccharides. For that purpose, we
will work on the proposed pipeline mentioned above in Figure 8. Then, we also extend ENZO to
study homologues of sucrose phosphorylase. Of final note, we believe that the contribution of an
improved version of ENZO with the above-mentioned elements will have a lasting impact in the
field of chemosynthesis of original chemicals like rare disaccharides or other glycoconjugates in the
forthcoming years.
Page 171 of 188

References1. Bhagavan, N. V. & Ha, C.-E. in Essentials of Medical Biochemistry (2011).
doi:10.1016/B978-0-12-095461-2.00008-4
2. Christiansen, C. in Geriatric Physical Therapy (2012). doi:10.1016/B978-0-323-02948-3.00022-5
3. Côté, F. & Hahn, M. G. Oligosaccharins: structures and signal transduction. Plant Mol. Biol. (1994). doi:10.1007/BF00016481
4. Newburg, D. S., Ruiz-Palacios, G. M. & Morrow, A. L. HUMAN MILK GLYCANS PROTECT INFANTS AGAINST ENTERIC PATHOGENS. Annu. Rev. Nutr. (2005). doi:10.1146/annurev.nutr.25.050304.092553
5. Stern, R. & Jedrzejas, M. J. Carbohydrate polymers at the Center of life’s origins: The importance of molecular processivity. Chem. Rev. (2008). doi:10.1021/cr078240l
6. Geys, R., Soetaert, W. & Van Bogaert, I. Biotechnological opportunities in biosurfactant production. Current Opinion in Biotechnology (2014). doi:10.1016/j.copbio.2014.06.002
7. Křen, V. & Řezanka, T. Sweet antibiotics - The role of glycosidic residues in antibiotic and antitumor activity and their randomization. FEMS Microbiology Reviews (2008). doi:10.1111/j.1574-6976.2008.00124.x
8. Ribeiro, M. H. Naringinases: Occurrence, characteristics, and applications. Applied
Microbiology and Biotechnology (2011). doi:10.1007/s00253-011-3176-8
9. Wallace, J. E. & Schroeder, L. R. Koenigs–Knorr reactions. Part 1. Effects of a 2-O-acetyl substituent, the promoter, and the alcohol concentration on the stereoselectivity of reactions of 1,2-cis-glucopyranosyl bromide. J. Chem. Soc., Perkin Trans. 1 (1976). doi:10.1039/P19760001938
10. Wallace, J. E. & Schroeder, L. R. Koenigs–Knorr reactions. Part II. A mechanistic study of mercury( II ) cyanide-promoted reactions of 2,3,4,6-tetra-O-methyl-α- D -glucopyranosyl bromide with cyclohexanol in benzene–nitromethane. J. Chem. Soc., Perkin Trans. 2 (1976). doi:10.1039/P29760001632
11. Wallace, J. E. & Schroeder, L. R. Koenigs-Knorr reactions. Part 3. Mechanistic study of mercury(II) cyanide promoted reactions of 2-O-acetyl-3,4,6-tri-O-methyl-α-D-glucopyranosyl bromide with cyclohexanol in benzene-nitromethane. J. Chem. Soc. Perkin
Trans. 2 (1977). doi:10.1039/P29770000795
12. Agard, N. J. Chemical approaches to glycobiology. ACS Symp. Ser. 990, 251–271 (2008).
13. Kürti, László; Czakó, B. of Named Reactions in Organic Synthesis. (2005).
14. Hayes, M. R. & Pietruszka, J. Synthesis of glycosides by glycosynthases. Molecules 22, (2017).
Page 172 of 188

15. Nicolaou, K. C. & Mitchell, H. J. Adventures in carbohydrate chemistry: new synthetic technologies, chemical synthesis, molecular design, and chemical biology. Angew. Chem.,
Int. Ed. (2001). doi:10.1002/1521-3773(20010504)40:9<1576::AID-ANIE15760>3.0.CO;2-G
16. Douglas, N. L., Ley, S. V., Lücking, U. & Warriner, S. L. Tuning glycoside reactivity: New tool for efficient oligosaccharide synthesis. J. Chem. Soc. Perkin Trans. 1 (1998). doi:10.1039/a705275h
17. Grice, P., Ley, S. V., Pietruszka, J., Priepke, H. W. M. & Walther, E. P. E. Tuning the Reactivity of Glycosides: Efficient One-pot Oligosaccharide Synthesis. Synlett 7, 781–784 (1995).
18. Green, L. et al. One-pot synthesis of tetra- and pentasaccharides from monomeric building blocks using the principles of orthogonality and reactivity tuning. Synlett (1997). doi:10.1055/s-1997-765
19. Chen, Y. et al. Improved synthesis of 1-O-acyl-β-D-glucopyranose tetraacetates. Molecules 22, 1–11 (2017).
20. Conrow, R. B. & Bernstein, S. Steroid Conjugates. VI.1aAn Improved Koenigs-Knorr Synthesis of Aryl Glucuronides Using Cadmium Carbonate, a New and Effective Catalyst11b. J. Org. Chem. (1971). doi:10.1021/jo00806a001
21. Lemieux, R. U., Hendriks, K. B., Stick, R. V. & James, K. Halide Ion Catalyzed Glycosidation Reactions. Syntheses of α-Linked Disaccharides. J. Am. Chem. Soc. (1975). doi:10.1021/ja00847a032
22. Ackermann, I. E., Banthorpe, D. V., Fordham, W. D., Kinder, J. P. & Poots, I. Preparation of New Terpenyl β D Glucopyranosides by a Modified Königs Knorr Procedure. ‐ ‐ ‐ Liebigs Ann.
der Chemie 1989, 79–81 (1989).
23. Lombard, V., Golaconda Ramulu, H., Drula, E., Coutinho, P. M. & Henrissat, B. The carbohydrate-active enzymes database (CAZy) in 2013. Nucleic Acids Res. (2014). doi:10.1093/nar/gkt1178
24. Crout, D. H. G. & Vic, G. Glycosidases and glycosyl transferases in glycoside and oligosaccharide synthesis. Curr. Opin. Chem. Biol. 2, 98–111 (1998).
25. Lairson, L. L. & Withers, S. G. Mechanistic analogies amongst carbohydrate modifying enzymes. Chemical Communications 10, 2243–2248 (2004).
26. De Roode, B. M., Franssen, M. C. R., Van Der Padt, A. & Boom, R. M. Perspectives for the Industrial Enzymatic Production of Glycosides. Biotechnology Progress (2003). doi:10.1021/bp030038q
27. Van Rantwijk, F., Woudenberg-Van Oosterom, M. & Sheldon, R. A. Glycosidase-catalysed synthesis of alkyl glycosides. Journal of Molecular Catalysis - B Enzymatic (1999). doi:10.1016/S1381-1177(99)00042-9
Page 173 of 188

28. Goedl, C., Sawangwan, T., Wildberger, P. & Nidetzky, B. Sucrose phosphorylase: A powerfultransglucosylation catalyst for synthesis of α-D-glucosides as industrial fine chemicals. Biocatal. Biotransformation (2010). doi:10.3109/10242420903411595
29. Reid, S. J. & Abratt, V. R. Sucrose utilisation in bacteria: Genetic organisation and regulation. Appl. Microbiol. Biotechnol. 67, 312–321 (2005).
30. Library, W. L. Studies on the. 351–362 (1943).
31. Moss, G. P. Recommendations of the Nomenclature Committee of the International Union of Biochemistry and Molecular Biology on the Nomenclature and Classification of Enzymes by the Reactions they Catalyse. Enzyme Nomenclature.
http://www.chem.qmul.ac.uk/iubmb/enzyme/ (2012).
32. Stam, M. R., Danchin, E. G. J., Rancurel, C., Coutinho, P. M. & Henrissat, B. Dividing the large glycoside hydrolase family 13 into subfamilies: Towards improved functional annotations of α-amylase-related proteins. Protein Eng. Des. Sel. (2006). doi:10.1093/protein/gzl044
33. Lee, J.-H. et al. Molecular cloning of a gene encoding the sucrose phosphorylase from Leuconostoc mesenteroides B-1149 and the expression in Escherichia coli. Enzyme Microb.
Technol. 39, 612–620 (2006).
34. Koga, T. et al. Purification and some properties of sucrose phosphorylase from Leuconostoc mesenteroides. Agric. Biol. Chem. (1991). doi:10.1080/00021369.1991.10870859
35. Kawasaki, H., Nakamura, N., Ohmori, M., Amari, K. & Sakai, T. Screening for Bacteria Producing Sucrose Phosphorylase and Characterization of the Enzymes. Biosci. Biotechnol.
Biochem. (1996). doi:10.1271/bbb.60.319
36. Goedl, C., Schwarz, A., Minani, A. & Nidetzky, B. Recombinant sucrose phosphorylase fromLeuconostoc mesenteroides: Characterization, kinetic studies of transglucosylation, and application of immobilised enzyme for production of α-d-glucose 1-phosphate. J. Biotechnol.
(2007). doi:10.1016/j.jbiotec.2006.11.019
37. Lee, J. H. et al. Cloning and expression of the sucrose phosphorylase gene from Leuconostocmesenteroides in Escherichia coli. Biotechnol. Lett. (2008). doi:10.1007/s10529-007-9608-y
38. Ferretti, J. J., Huang, T. T. & Russell, R. B. Sequence analysis of the glucosyltransferase A gene (gtfA) from Streptococcus mutans Ingbritt. Infect. Immun. (1988).
39. Robeson, J. P., Barletta, R. G. & Curtiss, R. Expression of a Streptococcus mutans glucosyltransferase gene in Escherichia coli. J. Bacteriol. 153, 211–221 (1983).
40. Russell, R. R. B., Mukasa, H., Shimamura, A. & Ferretti, J. J. Streptococcus mutans gtfA gene specifies sucrose phosphorylase. Infect. Immun. (1988).
41. Van Den Broek, L. A. M. et al. Physico-chemical and transglucosylation properties of recombinant sucrose phosphorylase from Bifidobacterium adolescentis DSM20083. Appl.
Microbiol. Biotechnol. (2004). doi:10.1007/s00253-003-1534-x
Page 174 of 188

42. Choi, H. C. et al. Development of new assay for sucrose phosphorylase and its application to the characterization of Bifidobacterium longum SJ32 sucrose phosphorylase. Food Sci.
Biotechnol. (2011). doi:10.1007/s10068-011-0071-0
43. Aerts, D. et al. Transglucosylation potential of six sucrose phosphorylases toward different classes of acceptors. Carbohydr. Res. 346, 1860–1867 (2011).
44. Aerts, D., Verhaeghe, T., De Mey, M., Desmet, T. & Soetaert, W. A constitutive expression system for high-throughput screening. Eng. Life Sci. (2011). doi:10.1002/elsc.201000065
45. Du, L. et al. A novel sucrose phosphorylase from the metagenomes of sucrose-rich environment: Isolation and characterization. World J. Microbiol. Biotechnol. (2012). doi:10.1007/s11274-012-1098-y
46. Cerdobbel, A., De Winter, K., Desmet, T. & Soetaert, W. Sucrose phosphorylase as cross-linked enzyme aggregate: Improved thermal stability for industrial applications. Biotechnol.
J. (2010). doi:10.1002/biot.201000202
47. Cerdobbel, A., Desmet, T., De Winter, K., Maertens, J. & Soetaert, W. Increasing the thermostability of sucrose phosphorylase by multipoint covalent immobilization. J.
Biotechnol. (2010). doi:10.1016/j.jbiotec.2010.07.029
48. Goedl, C., Sawangwan, T., Wildberger, P. & Nidetzky, B. Sucrose phosphorylase: A powerfultransglucosylation catalyst for synthesis of α-D-glucosides as industrial fine chemicals. Biocatal. Biotransformation 28, 10–21 (2010).
49. Aerts, D. et al. Consensus engineering of sucrose phosphorylase: The outcome reflects the sequence input. Biotechnol. Bioeng. (2013). doi:10.1002/bit.24940
50. Sprogøe, D. et al. Crystal Structure of Sucrose Phosphorylase from Bifidobacterium adolescentis. Biochemistry (2004). doi:10.1021/bi0356395
51. MacGregor, E. A., Janeček, Š. & Svensson, B. Relationship of sequence and structure to specificity in the α-amylase family of enzymes. Biochimica et Biophysica Acta - Protein
Structure and Molecular Enzymology 1546, 1–20 (2001).
52. Ramasubbu, N., Paloth, V., Luo, Y., Brayer, G. D. & Levine, M. J. Structure of Human Salivary α-Amylase at 1.6 Å Resolution: Implications for its Role in the Oral Cavity. Acta
Crystallogr. Sect. D Biol. Crystallogr. (1996). doi:10.1107/S0907444995014119
53. Janecek, S., Svensson, B. & Henrissat, B. Domain evolution in the alpha-amylase family. J.
Mol. Evol. (1997).
54. KOSHLAND, D. E. STEREOCHEMISTRY AND THE MECHANISM OF ENZYMATIC REACTIONS. Biol. Rev. (1953). doi:10.1111/j.1469-185X.1953.tb01386.x
55. Mirza, O. et al. Structural rearrangements of sucrose phosphorylase from Bifidobacterium adolescentis during sucrose conversion. J. Biol. Chem. 281, 35576–35584 (2006).
56. Schwarz, A., Brecker, L. & Nidetzky, B. Acid–base catalysis in Leuconostoc mesenteroides sucrose phosphorylase probed by site-directed mutagenesis and detailed kinetic comparison
Page 175 of 188

of wild-type and Glu 237 →Gln mutant enzymes. Biochem. J. (2007). doi:10.1042/BJ20070042
57. Schwarz, A. & Nidetzky, B. Asp-196 → Ala mutant of Leuconostoc mesenteroides sucrose phosphorylase exhibits altered stereochemical course and kinetic mechanism of glucosyl transfer to and from phosphate. FEBS Lett. (2006). doi:10.1016/j.febslet.2006.06.020
58. Mueller, M. & Nidetzky, B. The role of Asp-295 in the catalytic mechanism of Leuconostoc mesenteroides sucrose phosphorylase probed with site-directed mutagenesis. FEBS Lett. (2007). doi:10.1016/j.febslet.2007.02.060
59. Desmet, T. & Soetaert, W. Enzymatic glycosyl transfer: Mechanisms and applications. Biocatal. Biotransformation (2011). doi:10.3109/10242422.2010.548557
60. Wildberger, P., Luley-Goedl, C. & Nidetzky, B. Aromatic interactions at the catalytic subsite of sucrose phosphorylase: Their roles in enzymatic glucosyl transfer probed with Phe52 → Ala and Phe52 → Asn mutants. FEBS Lett. 585, 499–504 (2011).
61. Nerinckx, W., Desmet, T. & Claeyssens, M. A hydrophobic platform as a mechanistically relevant transition state stabilising factor appears to be present in the active centre of all glycoside hydrolases. FEBS Lett. 538, 1–7 (2003).
62. Wildberger, P., Todea, A. & Nidetzky, B. Probing enzymesubstrate interactions at the catalytic subsite of Leuconostoc mesenteroides sucrose phosphorylase with site-directed mutagenesis: The roles of Asp49and Arg395. Biocatal. Biotransformation (2012). doi:10.3109/10242422.2012.674720
63. Mueller, M. & Nidetzky, B. Dissecting differential binding of fructose and phosphate as leaving group/nucleophile of glucosyl transfer catalyzed by sucrose phosphorylase. FEBS
Lett. 581, 3814–3818 (2007).
64. Spiwok, V., Králová, B. & Tvaroška, I. Modelling of β-d-glucopyranose ring distortion in different force fields: a metadynamics study. Carbohydr. Res. (2010). doi:10.1016/j.carres.2009.12.011
65. Kraus, M., Grimm, C. & Seibel, J. Redesign of the Active Site of Sucrose Phosphorylase through a Clash-Induced Cascade of Loop Shifts. ChemBioChem 17, 33–36 (2016).
66. Jensen, M. H. et al. Crystal Structure of the Covalent Intermediate of Amylosucrase from Neisseria polysaccharea. Biochemistry (2004). doi:10.1021/bi0357762
67. Science, P. No Title.
68. Desmet, T. & Soetaert, W. Broadening the synthetic potential of disaccharide phosphorylases through enzyme engineering. Process Biochemistry 47, 11–17 (2012).
69. Nidetzky, B., Eis, C. & Albert, M. Role of non-covalent enzyme-substrate interactions in the reaction catalysed by cellobiose phosphorylase from Cellulomonas uda. Biocatal.
Biotransform. 659, 649–659 (2000).
Page 176 of 188

70. EIS, C. & NIDETZKY, B. Characterization of trehalose phosphorylase from Schizophyllum commune. Biochem. J. 341, 385 (1999).
71. Verhaeghe, T., Diricks, M., Aerts, D., Soetaert, W. & Desmet, T. Mapping the acceptor site ofsucrose phosphorylase from Bifidobacterium adolescentis by alanine scanning. J. Mol. Catal.
B Enzym. (2013). doi:10.1016/j.molcatb.2013.06.014
72. Rat, T. H. E. W. The Wistar Rat. Anzccart 6, 4–7 (1993).
73. Dore, H. H. ’ 1 . barker. 0–3 (1894).
74. Lee, J.-H. et al. Molecular cloning of a gene encoding the sucrose phosphorylase from Leuconostoc mesenteroides B-1149 and the expression in Escherichia coli. Enzyme Microb.
Technol. (2006). doi:10.1016/j.enzmictec.2005.11.008
75. Goldberg, R. N., Tewari, Y. B. & Ahluwalia, J. C. Thermodynamics of the hydrolysis of sucrose. J. Biol. Chem. 264, 9901–9904 (1989).
76. Kitao, S. & Sekine, H. α-D-Glucosyl Transfer to Phenolic Compounds by Sucrose Phosphorylase from Leuconostoc mesenteroides and Production of α-Arbutin. Biosci.
Biotechnol. Biochem. 58, 38–42 (1994).
77. Verhaeghe, T. et al. Converting bulk sugars into prebiotics: Semi-rational design of a transglucosylase with controlled selectivity. Chem. Commun. (2016). doi:10.1039/c5cc09940d
78. Kraus, M., Görl, J., Timm, M. & Seibel, J. Synthesis of the rare disaccharide nigerose by structure-based design of a phosphorylase mutant with altered regioselectivity. Chem.
Commun. 52, 4625–4627 (2016).
79. Cheng, F., Zhu, L. & Schwaneberg, U. Directed evolution 2.0: Improving and deciphering enzyme properties. Chemical Communications (2015). doi:10.1039/c5cc01594d
80. Romero, P. A. & Arnold, F. H. Exploring protein fitness landscapes by directed evolution. Nature Reviews Molecular Cell Biology (2009). doi:10.1038/nrm2805
81. Lutz, S. Beyond directed evolution-semi-rational protein engineering and design. Current
Opinion in Biotechnology (2010). doi:10.1016/j.copbio.2010.08.011
82. Cheng, Z. et al. Identification of key residues modulating the stereoselectivity of nitrile hydratase toward rac-mandelonitrile by semi-rational engineering. Biotechnol. Bioeng. (2018). doi:10.1002/bit.26484
83. Pei, J. Multiple protein sequence alignment. Curr. Opin. Struct. Biol. 18, 382–386 (2008).
84. Salentin, S., Schreiber, S., Haupt, V. J., Adasme, M. F. & Schroeder, M. PLIP: Fully automated protein-ligand interaction profiler. Nucleic Acids Res. (2015). doi:10.1093/nar/gkv315
85. Stern, A. et al. Selecton 2007: Advanced models for detecting positive and purifying selection using a Bayesian inference approach. Nucleic Acids Res. (2007). doi:10.1093/nar/gkm382
Page 177 of 188

86. Engelen, S., Trojan, L. A., Sacquin-Mora, S., Lavery, R. & Carbone, A. Joint evolutionary trees: A large-scale method to predict protein interfaces based on sequence sampling. PLoS
Comput. Biol. (2009). doi:10.1371/journal.pcbi.1000267
87. Saraf, M. C. et al. IPRO: An iterative computational protein library redesign and optimization procedure. Biophys. J. (2006). doi:10.1529/biophysj.105.079277
88. Saraf, M. C., Moore, G. L. & Maranas, C. D. Using multiple sequence correlation analysis to characterize functionally important protein regions. Protein Eng. Des. Sel. (2003). doi:10.1093/protein/gzg053
89. Saraf, M. C., Horswill, A. R., Benkovic, S. J. & Maranas, C. D. FamClash: A method for ranking the activity of engineered enzymes. Proc. Natl. Acad. Sci. (2004). doi:10.1073/pnas.0400065101
90. Arnold, F. H. & Georgiou, G. Directed Evolution Library Creation. 231, (2003).
91. Krissinel, E. & Henrick, K. Inference of Macromolecular Assemblies from Crystalline State. J. Mol. Biol. (2007). doi:10.1016/j.jmb.2007.05.022
92. Laurie, A. T. R. & Jackson, R. M. Q-SiteFinder: An energy-based method for the prediction of protein-ligand binding sites. Bioinformatics (2005). doi:10.1093/bioinformatics/bti315
93. Hendlich, M., Rippmann, F. & Barnickel, G. LIGSITE: Automatic and efficient detection of potential small molecule-binding sites in proteins. J. Mol. Graph. Model. (1997). doi:10.1016/S1093-3263(98)00002-3
94. Stierand, K. & Rarey, M. Drawing the PDB: Protein-Ligand Complexes in Two Dimensions. ACS Med. Chem. Lett. (2010). doi:10.1021/ml100164p
95. Hernandez, M., Ghersi, D. & Sanchez, R. SITEHOUND-web: A server for ligand binding site identification in protein structures. Nucleic Acids Res. (2009). doi:10.1093/nar/gkp281
96. La, D. et al. 3D-SURFER: Software for high-throughput protein surface comparison and analysis. Bioinformatics (2009). doi:10.1093/bioinformatics/btp542
97. Dundas, J. et al. CASTp: Computed atlas of surface topography of proteins with structural and topographical mapping of functionally annotated residues. Nucleic Acids Res. (2006). doi:10.1093/nar/gkl282
98. Schmidtke, P., Le Guilloux, V., Maupetit, J. & Tufféry, P. fpocket: Online tools for protein ensemble pocket detection and tracking. Nucleic Acids Res. (2010). doi:10.1093/nar/gkq383
99. Firth, A. E. & Patrick, W. M. GLUE-IT and PEDEL-AA: new programmes for analyzing protein diversity in randomized libraries. Nucleic Acids Res. (2008). doi:10.1093/nar/gkn226
100. Reetz, M. T. & Carballeira, J. D. Iterative saturation mutagenesis (ISM) for rapid directed evolution of functional enzymes. Nat. Protoc. (2007). doi:10.1038/nprot.2007.72
101. Bendl, J. et al. HotSpot Wizard 2.0: automated design of site-specific mutations and smart libraries in protein engineering. Nucleic Acids Res. (2016). doi:10.1093/nar/gkw416
Page 178 of 188

102. Sumbalova, L., Stourac, J., Martinek, T., Bednar, D. & Damborsky, J. HotSpot Wizard 3.0: Web server for automated design of mutations and smart libraries based on sequence input information. Nucleic Acids Res. (2018). doi:10.1093/nar/gky417
103. Firth, A. E. & Patrick, W. M. Statistics of protein library construction. Bioinformatics (2005).doi:10.1093/bioinformatics/bti516
104. Kuipers, R. K. et al. 3DM: Systematic analysis of heterogeneous superfamily data to discover protein functionalities. Proteins Struct. Funct. Bioinforma. (2010). doi:10.1002/prot.22725
105. Ashkenazy, H., Erez, E., Martz, E., Pupko, T. & Ben-Tal, N. ConSurf 2010: Calculating evolutionary conservation in sequence and structure of proteins and nucleic acids. Nucleic
Acids Res. (2010). doi:10.1093/nar/gkq399
106. Goldenberg, O., Erez, E., Nimrod, G. & Ben-Tal, N. The ConSurf-DB: Pre-calculated evolutionary conservation profiles of protein structures. Nucleic Acids Res. (2009). doi:10.1093/nar/gkn822
107. Parthiban, V., Gromiha, M. M. & Schomburg, D. CUPSAT: Prediction of protein stability upon point mutations. Nucleic Acids Res. (2006). doi:10.1093/nar/gkl190
108. Zhou, H. & Zhou, Y. Distance-scaled, finite ideal-gas reference state improves structure-derived potentials of mean force for structure selection and stability prediction. Protein Sci. 11, 2714–2726 (2009).
109. Mihalek, I., Reš, I. & Lichtarge, O. A Family of Evolution-Entropy Hybrid Methods for Ranking Protein Residues by Importance. J. Mol. Biol. (2004). doi:10.1016/j.jmb.2003.12.078
110. Morgan, D. H., Kristensen, D. M., Mittelman, D. & Lichtarge, O. ET viewer: An application for predicting and visualizing functional sites in protein structures. Bioinformatics 22, 2049–2050 (2006).
111. Joosten, R. P. et al. A series of PDB related databases for everyday needs. Nucleic Acids Res. (2011). doi:10.1093/nar/gkq1105
112. Chovancova, E. et al. CAVER 3.0: A Tool for the Analysis of Transport Pathways in Dynamic Protein Structures. PLoS Comput. Biol. (2012). doi:10.1371/journal.pcbi.1002708
113. Capriotti, E., Fariselli, P. & Casadio, R. I-Mutant2.0: Predicting stability changes upon mutation from the protein sequence or structure. Nucleic Acids Res. (2005). doi:10.1093/nar/gki375
114. Ma, B. G. & Berezovsky, I. N. The mblosum: A server for deriving mutation targets and position-specific substitution rates. J. Biomol. Struct. Dyn. (2010). doi:10.1080/07391102.2010.10507370
115. Thomas, P. D. et al. PANTHER: A library of protein families and subfamilies indexed by function. Genome Res. (2003). doi:10.1101/gr.772403
Page 179 of 188

116. Choi, Y., Sims, G. E., Murphy, S., Miller, J. R. & Chan, A. P. Predicting the Functional Effectof Amino Acid Substitutions and Indels. PLoS One (2012). doi:10.1371/journal.pone.0046688
117. Valdar, W. S. J. Scoring residue conservation. Proteins Struct. Funct. Genet. (2002). doi:10.1002/prot.10146
118. Ng, P. C. & Henikoff, S. SIFT: Predicting amino acid changes that affect protein function. Nucleic Acids Res. (2003). doi:10.1093/nar/gkg509
119. Crooks, G. E., Hon, G., Chandonia, J. M. & Brenner, S. E. WebLogo: A sequence logo generator. Genome Res. 14, 1188–1190 (2004).
120. Yaffe, E., Fishelovitch, D., Wolfson, H. J., Halperin, D. & Nussinov, R. MolAxis: Efficient and accurate identification of channels in macromolecules. Proteins Struct. Funct. Genet. (2008). doi:10.1002/prot.22052
121. Pravda, L. et al. MOLEonline: A web-based tool for analyzing channels, tunnels and pores (2018 update). Nucleic Acids Res. (2018). doi:10.1093/nar/gky309
122. Dehouck, Y., Kwasigroch, J. M., Gilis, D. & Rooman, M. PoPMuSiC 2.1: A web server for the estimation of protein stability changes upon mutation and sequence optimality. BMC
Bioinformatics (2011). doi:10.1186/1471-2105-12-151
123. Schymkowitz, J. et al. The FoldX web server: An online force field. Nucleic Acids Res. (2005). doi:10.1093/nar/gki387
124. Laskowski, R. A. & Swindells, M. B. LigPlot+: Multiple ligand-protein interaction diagrams for drug discovery. J. Chem. Inf. Model. (2011). doi:10.1021/ci200227u
125. Huang, B. MetaPocket: A Meta Approach to Improve Protein Ligand Binding Site Prediction.Omi. A J. Integr. Biol. (2009). doi:10.1089/omi.2009.0045
126. Bava, K. A. ProTherm, version 4.0: thermodynamic database for proteins and mutants. Nucleic Acids Res. (2004). doi:10.1093/nar/gkh082
127. Damborsky, J. & Brezovsky, J. Computational tools for designing and engineering biocatalysts. 26–34 (2009). doi:10.1016/j.cbpa.2009.02.021
128. Brannigan, J. A. & Wilkinson, A. J. Protein engineering 20 years on. Nature Reviews
Molecular Cell Biology 3, 964–970 (2002).
129. Hsieh, P. C. & Vaisvila, R. Protein engineering: Single or multiple site-directed mutagenesis. Methods Mol. Biol. (2013). doi:10.1007/978-1-62703-293-3_13
130. Cline, J. PCR fidelity of pfu DNA polymerase and other thermostable DNA polymerases. Nucleic Acids Res. (1996). doi:10.1093/nar/24.18.3546
131. Eckert, K. A. & Kunkel, T. A. High fidelity DNA synthesis by the Thermus aquaticus DNA polymerase. Nucleic Acids Res. (1990). doi:10.1093/nar/18.13.3739
Page 180 of 188

132. Wong, T. S., Roccatano, D., Zacharias, M. & Schwaneberg, U. A statistical analysis of random mutagenesis methods used for directed protein evolution. J. Mol. Biol. (2006). doi:10.1016/j.jmb.2005.10.082
133. Hanson-Manful, P. & Patrick, W. M. Construction and analysis of randomized protein-encoding libraries using error-prone PCR. Methods Mol. Biol. (2013). doi:10.1007/978-1-62703-354-1-15
134. Verma, R., Schwaneberg, U. & Roccatano, D. MAP2.03D: A sequence/structure based serverfor protein engineering. ACS Synth. Biol. 1, 139–150 (2012).
135. Bromberg, Y. & Rost, B. Comprehensive in silico mutagenesis highlights functionally important residues in proteins. in Bioinformatics (2008). doi:10.1093/bioinformatics/btn268
136. Depot, L. RCSB Protein Data Bank. Bioinformatics (2005). doi:10.1002/0471250953.bi0109s20
137. Pundir, S., Martin, M. J. & O’Donovan, C. UniProt Protein Knowledgebase. Methods Mol.
Biol. 1558, 41–55 (2017).
138. BLAST. BLAST Basic Local Alignment Search Tool. Blast Program Selection Guide (2013).doi:10.1016/j.ddmod.2011.07.002
139. Altschul, S. F. et al. Gapped BLAST and PSI-BLAST: A new generation of protein database search programs. Nucleic Acids Research (1997). doi:10.1093/nar/25.17.3389
140. Lam, S. D., Das, S., Sillitoe, I. & Orengo, C. An overview of comparative modelling and resources dedicated to large-scale modelling of genome sequences. Acta Crystallographica
Section D: Structural Biology (2017). doi:10.1107/S2059798317008920
141. Šali, A. MODELLER A Program for Protein Structure Modeling. Comp. protein Model. by
Satisf. Spat. restraints. 779–815 (1993). doi:10.1006/jmbi.1993.1626
142. Webb, B. & Sali, A. in Methods in Molecular Biology (2017). doi:10.1007/978-1-4939-7231-9_4
143. Song, Y. et al. High-resolution comparative modeling with RosettaCM. Structure (2013). doi:10.1016/j.str.2013.08.005
144. Berkel, C., Mauricio, A. M., Schoenfelder, E. & Sandler, I. N. Putting the Pieces Together: An Integrated Model of Program Implementation. Prev. Sci. (2011). doi:10.1007/s11121-010-0186-1
145. Hildebrand, A., Remmert, M., Biegert, A. & S??ding, J. Fast and accurate automatic structureprediction with HHpred. Proteins Struct. Funct. Bioinforma. (2009). doi:10.1002/prot.22499
146. Källberg, M. et al. Template-based protein structure modeling using the RaptorX web server. Nat. Protoc. (2012). doi:10.1038/nprot.2012.085
147. Yang, Y., Faraggi, E., Zhao, H. & Zhou, Y. Improving protein fold recognition and template-based modeling by employing probabilistic-based matching between predicted one-
Page 181 of 188

dimensional structural properties of query and corresponding native properties of templates. Bioinformatics (2011). doi:10.1093/bioinformatics/btr350
148. Biasini, M. et al. SWISS-MODEL: Modelling protein tertiary and quaternary structure using evolutionary information. Nucleic Acids Res. (2014). doi:10.1093/nar/gku340
149. Kim, D. E., Chivian, D. & Baker, D. Protein structure prediction and analysis using the Robetta server. Nucleic Acids Res. (2004). doi:10.1093/nar/gkh468
150. Kelley, L. A., Mezulis, S., Yates, C. M., Wass, M. N. & Sternberg, M. J. E. The Phyre2 web portal for protein modeling, prediction and analysis. Nat. Protoc. (2015). doi:10.1038/nprot.2015.053
151. Yang, J. et al. The I-TASSER Suite: protein structure and function prediction. Nat. Methods (2014). doi:10.1038/nmeth.3213
152. Larsson, P., Skwark, M. J., Wallner, B. & Elofsson, A. Improved predictions by Pcons.net using multiple templates. Bioinformatics (2011). doi:10.1093/bioinformatics/btq664
153. McGuffin, L. J., Atkins, J. D., Salehe, B. R., Shuid, A. N. & Roche, D. B. IntFOLD: An integrated server for modelling protein structures and functions from amino acid sequences. Nucleic Acids Res. (2015). doi:10.1093/nar/gkv236
154. Feyfant, E., Sali, A. & Fiser, A. Modeling mutations in protein structures. Protein Sci. (2007).doi:10.1110/ps.072855507
155. Laskowski, R. A., MacArthur, M. W., Moss, D. S. & Thornton, J. M. PROCHECK: a program to check the stereochemical quality of protein structures. J. Appl. Crystallogr. (1993). doi:10.1107/S0021889892009944
156. Hooft, R. W. W., Vriend, G., Sander, C. & Abola, E. E. Errors in protein structures [3]. Nature (1996). doi:10.1038/381272a0
157. Chen, V. B. et al. MolProbity: All-atom structure validation for macromolecular crystallography. Acta Crystallogr. Sect. D Biol. Crystallogr. (2010). doi:10.1107/S0907444909042073
158. Shen, M. & Sali, A. Statistical potential for assessment and prediction of protein structures. Protein Sci. (2006). doi:10.1110/ps.062416606
159. Cremer, D. & Pople, J. A. A General Definition of Ring Puckering Coordinates. J. Am.
Chem. Soc. (1975). doi:10.1021/ja00839a011
160. Kirschner, K. N. et al. GLYCAM06: a generalizable biomolecular force field. Carbohydrates.J. Comput. Chem. 29, 622–655 (2008).
161. Guvench, O., Hatcher, E., Venable, R. M., Pastor, R. W. & MacKerell, A. D. CHARMM Additive All-Atom Force Field for Glycosidic Linkages between Hexopyranoses. J. Chem.
Theory Comput. 5, 2353–2370 (2009).
162. Lins, R. D. & Hünenberger, P. H. A new GROMOS force field for hexopyranose-based carbohydrates. J. Comput. Chem. (2005). doi:10.1002/jcc.20275
Page 182 of 188

163. Schrödinger, E. An undulatory theory of the mechanics of atoms and molecules. Phys. Rev. (1926). doi:10.1103/PhysRev.28.1049
164. Lüchow, A. Quantum Monte Carlo methods. Wiley Interdisciplinary Reviews: Computational
Molecular Science (2011). doi:10.1002/wcms.40
165. Sham, L. J. Density functional theory. Phys. Today (1982). doi:10.1063/1.2914933
166. Rahal-Sekkal, M., Sekkal, N., Kleb, C. & Bleckmann, P. Structures and energies of D-galactose and galabiose conformers as calculated by ab initio and semiempirical methods. J.
Comput. Chem. (2003). doi:10.1002/jcc.10223
167. Fanfrlík, J. et al. A reliable docking/scoring scheme based on the semiempirical quantum mechanical PM6-DH2 method accurately covering dispersion and H-bonding: HIV-1 protease with 22 ligands. J. Phys. Chem. B 114, 12666–12678 (2010).
168. Guvench, O. et al. CHARMM Additive All-Atom Force Field for Carbohydrate Derivatives and Its Utility in Polysaccharide and Carbohydrate–Protein Modeling. J. Chem. Theory
Comput. 7, 3162–3180 (2011).
169. Pol-Fachin, L., Rusu, V. H., Verli, H. & Lins, R. D. GROMOS 53A6GLYC, an improved GROMOS force field for hexopyranose-based carbohydrates. J. Chem. Theory Comput. (2012). doi:10.1021/ct300479h
170. Kony, D., Damm, W., Stoll, S. & Van Gunsteren, W. F. An improved OPLS-AA force field for carbohydrates. J. Comput. Chem. (2002). doi:10.1002/jcc.10139
171. Xiong, X. et al. Force fields and scoring functions for carbohydrate simulation. Carbohydrate Research (2015). doi:10.1016/j.carres.2014.10.028
172. Wang, J., Wolf, R. M., Caldwell, J. W., Kollman, P. A. & Case, D. A. Development and testing of a general Amber force field. J. Comput. Chem. (2004). doi:10.1002/jcc.20035
173. Morris, G. M. et al. Software news and updates AutoDock4 and AutoDockTools4: Automated docking with selective receptor flexibility. J. Comput. Chem. (2009). doi:10.1002/jcc.21256
174. Trott, O. & Olson, A. AutoDock Vina: inproving the speed and accuracy of docking with a new scoring function, efficient optimization and multithreading. J. Comput. Chem. (2010). doi:10.1002/jcc.21334.AutoDock
175. Nivedha, A. K., Thieker, D. F., Makeneni, S., Hu, H. & Woods, R. J. Vina-Carb: Improving Glycosidic Angles during Carbohydrate Docking. J. Chem. Theory Comput. (2016). doi:10.1021/acs.jctc.5b00834
176. Henrissat, B., Vegetales, M. & Grenoble, F. A classification of glycosyl hydrolases based sequence similarities amino acid. Biochem. J. (1991). doi:10.1007/s007920050009
177. Reid, S. J. & Abratt, V. R. Sucrose utilisation in bacteria: genetic organisation and regulation.Appl. Microbiol. Biotechnol. 67, 312–321 (2005).
Page 183 of 188

178. Silverstein, R., Voet, J., Reed, D. & Abeles, R. H. Purification and mechanism of action of sucrose phosphorylase. J. Biol. Chem. (1967).
179. Voet, J. G. & Abeles, R. H. The mechanism of action of sucrose phosphorylase. Isolation and properties of a beta-linked covalent glucose-enzyme complex. J. Biol. Chem. 245, 1020–1031 (1970).
180. Wong, L. J. & Rose, I. A. Kinetic competence of a phosphoryl enzyme intermediate in the glucose-1,6-p2 synthase-catalyzed reaction. Purification, properties, and kinetic studies. J.
Biol. Chem. 251, 5431–5439 (1976).
181. Brooks, B. R. et al. CHARMM: the biomolecular simulation program. J. Comput. Chem. 30, 1545–1614 (2009).
182. Lindorff-Larsen, K. et al. Improved side-chain torsion potentials for the Amber ff99SB protein force field. Proteins 78, 1950–1958 (2010).
183. Sali, A. & Blundell, T. L. Comparative protein modelling by satisfaction of spatial restraints. J. Mol. Biol. 234, 779–815 (1993).
184. Van Der Spoel, D. et al. GROMACS: Fast, flexible, and free. J. Comput. Chem. 26, 1701–1718 (2005).
185. Huang, L. & Roux, B. Automated force field parameterization for nonpolarizable and polarizable atomic models based on ab initio target data. J. Chem. Theory Comput. (2013). doi:10.1021/ct4003477
186. Vanommeslaeghe, K., Raman, E. P. & MacKerell, A. D. Automation of the CHARMM General Force Field (CGenFF) II: Assignment of Bonded Parameters and Partial Atomic Charges. J. Chem. Inf. Model. 52, 3155–3168 (2012).
187. Vanommeslaeghe, K. & MacKerell, A. D. Automation of the CHARMM General Force Field(CGenFF) I: Bond Perception and Atom Typing. J. Chem. Inf. Model. 52, 3144–3154 (2012).
188. DeLano, W. L. The PyMOL Molecular Graphics System, Version 1.8. Schrödinger LLC (2014). doi:10.1038/hr.2014.17
189. Singh, U. C. & Kollman, P. A. An approach to computing electrostatic charges for molecules.J. Comput. Chem. 5, 129–145 (1984).
190. Besler, B. H., Merz, K. M. & Kollman, P. A. Atomic charges derived from semiempirical methods. J. Comput. Chem. 11, 431–439 (1990).
191. Vanommeslaeghe, K. et al. CHARMM general force field: A force field for drug-like molecules compatible with the CHARMM all-atom additive biological force fields. J.
Comput. Chem. 31, 671–690 (2010).
192. Yu, W., He, X., Vanommeslaeghe, K. & MacKerell, A. D. Extension of the CHARMM general force field to sulfonyl-containing compounds and its utility in biomolecular simulations. J. Comput. Chem. (2012). doi:10.1002/jcc.23067
Page 184 of 188
193. Blondel, A. & Karplus, M. New formulation for derivatives of torsion angles and improper torsion angles in molecular mechanics: Elimination of singularities. J. Comput. Chem. (1996). doi:10.1002/(SICI)1096-987X(19960715)17:9<1132::AID-JCC5>3.0.CO;2-T
194. Sousa da Silva, A. W. & Vranken, W. F. ACPYPE - AnteChamber PYthon Parser interfacE. BMC Res. Notes 5, 367 (2012).
195. ÖzpInar, G. A., Peukert, W. & Clark, T. An improved generalized AMBER force field (GAFF) for urea. J. Mol. Model. (2010). doi:10.1007/s00894-010-0650-7
196. RCSB. Research Collaboratory for Structural Bioinformatics (RCSB). http://www.rcsb.org/pdb/home/home.do (1998).
197. Iglesias-Fernández, J., Raich, L., Ardèvol, A. & Rovira, C. The complete conformational freeenergy landscape of β-xylose reveals a two-fold catalytic itinerary for β-xylanases. Chem.
Sci. (2015). doi:10.1039/c4sc02240h
198. Cui, S. W. Food Carbohydrates : Chemistry, Physical Properties, and Applications. FOOD
CARBOHYDRATES (2005). doi:doi:10.1201/9780203485286.ch2
199. Stick, R. Carbohydrates: The Essential Molecules of Life. Carbohydrates Essent. Mol. Life (2008). doi:10.1016/B978-0-240-52118-3.X0001-4
200. Slavin, J. Fiber and prebiotics: Mechanisms and health benefits. Nutrients (2013). doi:10.3390/nu5041417
201. Yamamoto, I., Muto, N., Nagata, E., Nakamura, T. & Suzuki, Y. Formation of a stable L-ascorbic acid alpha-glucoside by mammalian alpha-glucosidase-catalyzed transglucosylation.Biochim. Biophys. Acta (1990). doi:10.1016/0304-4165(90)90171-R
202. Crozier, A., Del Rio, D. & Clifford, M. N. Bioavailability of dietary flavonoids and phenolic compounds. Molecular Aspects of Medicine 31, 446–467 (2010).
203. Mitchell, H. Sweeteners and Sugar Alternatives in Food Technology. Sweeten. Sugar Altern.
Food Technol. (2007). doi:10.1002/9780470996003
204. Stick, R. V. in Carbohydrates (2001). doi:http://dx.doi.org/10.1016/B978-012670960-5/50009-1
205. Kraus, M., Grimm, C. & Seibel, J. Redesign of the Active Site of Sucrose Phosphorylase through a Clash-Induced Cascade of Loop Shifts. ChemBioChem (2016). doi:10.1002/cbic.201500514
206. Eswar, N. et al. Comparative protein structure modeling using MODELLER. Curr. Protoc.
Protein Sci. (2007). doi:10.1002/0471140864.ps0209s50
207. Sánchez, R. & Sali, a. Comparative protein structure modeling. Introduction and practical examples with modeller. Methods in molecular biology (Clifton, N.J.) (2000). doi:10.1385/1-59259-368-2:97
208. Lill, M. A. & Danielson, M. L. Computer-aided drug design platform using PyMOL. J.
Comput. Aided. Mol. Des. (2011). doi:10.1007/s10822-010-9395-8
Page 185 of 188

209. Kren, V. & Martínková, L. Glycosides in medicine: ‘The role of glycosidic residue in biological activity’. Curr. Med. Chem. (2001). doi:10.2174/0929867013372193
210. Rivas, F., Parra, A., Martinez, A. & Garcia-Granados, A. Enzymatic glycosylation of terpenoids. Phytochemistry Reviews (2013). doi:10.1007/s11101-013-9301-9
211. O’Neill, E. C. & Field, R. A. Enzymatic synthesis using glycoside phosphorylases. Carbohydr. Res. (2015). doi:10.1016/j.carres.2014.06.010
212. Goedl, C., Schwarz, A., Mueller, M., Brecker, L. & Nidetzky, B. Mechanistic differences among retaining disaccharide phosphorylases: insights from kinetic analysis of active site mutants of sucrose phosphorylase and α,α-trehalose phosphorylase. Carbohydrate Research (2008). doi:10.1016/j.carres.2008.01.029
213. Bornscheuer, U. T. Immobilizing enzymes: How to create more suitable biocatalysts. Angewandte Chemie - International Edition (2003). doi:10.1002/anie.200301664
214. Sheldon, R. A. Cross-linked enzyme aggregates as industrial biocatalysts. Org. Process Res.
Dev. 15, 213–223 (2011).
215. Cerdobbel, A. et al. Increasing the thermostability of sucrose phosphorylase by a combination of sequence- and structure-based mutagenesis. Protein Eng. Des. Sel. (2011). doi:10.1093/protein/gzr042
216. De Winter, K., Soetaert, W. & Desmet, T. An imprinted cross-linked enzyme aggregate (iCLEA) of sucrose phosphorylase: Combining improved stability with altered specificity. Int. J. Mol. Sci. (2012). doi:10.3390/ijms130911333
217. Morrison, K. L. & Weiss, G. A. Combinatorial alanine-scanning. Current Opinion in
Chemical Biology (2001). doi:10.1016/S1367-5931(00)00206-4
218. Labrou, N. E. Random Mutagenesis Methods for In Vitro Directed Enzyme Evolution. Curr.
Protein Pept. Sci. (2009). doi:10.2174/1389209198868622037
219. Arnold, F. H. & Georgiou, G. Directed enzyme evolution : Screening and selection methods . Methods 230, 2836–2837 (2003).
220. Nivedha, A. K., Thieker, D. F., Makeneni, S., Hu, H. & Woods, R. J. Vina-Carb: Improving Glycosidic Angles during Carbohydrate Docking. J. Chem. Theory Comput. (2016). doi:10.1021/acs.jctc.5b00834
221. Currin, A., Swainston, N., Day, P. J. & Kell, D. B. Synthetic biology for the directed evolution of protein biocatalysts: Navigating sequence space intelligently. Chemical Society
Reviews (2015). doi:10.1039/c4cs00351a
222. Acevedo-Rocha, C. G., Reetz, M. T. & Nov, Y. Economical analysis of saturation mutagenesis experiments. Sci. Rep. (2015). doi:10.1038/srep10654
223. Reichert, J. & S??hnel, J. The IMB Jena Image Library of Biological Macromolecules: 2002 update. Nucleic Acids Res. (2002). doi:10.1093/nar/30.1.253
Page 186 of 188

224. Verhaeghe, T. IMPROVING THE GLYCOSYLATION POTENTIAL OF SUCROSE PHOSPHORYLASE THROUGH ENZYME ENGINEERING. (2014), 233 pages, Ghent, Belgium
Page 187 of 188

Abstract
How mutations impact the activity of a protein is a long going question in the field of protein sciences. Traditional biochemical methods are powerful in that respect but are restricted by time. Computational approaches have been developed in that respect to overcome such restrains. In this thesis, we explore the usage of computational approaches for understanding the link between mutations and changes in activity. Our study model is a bacterial sucrose phosphorylase enzyme from Bifidobacterium adolescentis (BaSP). This glycosyl hydrolase from family 13 (GH13) has been a focus in the industry due to its ability to synthesize original disaccharides and glycoconjugates. In fact, its activity is to transfer a glucose moiety from a donor sucrose to an acceptor which can be a monosaccharide or a hydroxylated aglycone. The enzymatic reaction proceeds by a double displacement with retention of configuration mechanism whereby a covalent glucosyl-enzyme intermediate is formed. However, it is at stake to control the regioselectivity of this transfer for it to be applicable at industrial level. This thesis aimed at providing a rational explanation for the observed impact of mutations on the regioselectivity of BaSP in view of controlling the synthesis of rare pre-biotic disaccharides like kojibiose and nigerose.
We hypothesized that the preferred orientations of the acceptor determines the regioselectivity of the enzyme. In that respect, we used computational approaches to investigate the impact of mutations on the binding of the acceptor to the glucosyl-enzyme intermediate. Towards this end, we built models at atomic level of glucosyl-enzyme intermediate of the enzyme for every variants for which experimental data were available. For that purpose, we parametrized the glucosyl-aspartyl as a new residue which could directly be incorporated into modelling tools like Modeller and Gromacs. We evaluated the accuracy of these parameters and further applied it to test our working hypothesis which was confirmed by subsequent molecular docking experiments. The methodology used in this work opens the perspective of using computational approaches for engineering the regioselectivity of sucrose phosphorylase enzyme and more generally of glycosyl hydrolases with similar mechanism. Towards this end, a pipeline for large scale modelling and docking of acceptor molecules on glucosyl-enzyme intermediates (ENZO for ENZyme Optimization) has been developed during this thesis. Its application for engineering other variants of BaSP is currently being examined.
Comprendre comment les mutations impactent l’activité d’une protéine reste un défi dans le domaine des sciences protéiques. Les méthodes biochimiques traditionnellement utilisées pour résoudre ce type de questionnement sont très puissantes mais sont laborieuses à mettre en œuvre. Des approches bioinformatiques ont été développées à cet égard pour surmonter ces contraintes. Dans cette thèse, nous explorons l'utilisation d'approches bioinformatiques pour comprendre le lien entre mutations et changements d'activité. Notre modèle d'étude est une enzyme bactérienne, la sucrose phosphorylase de Bifidobacterium adolescentis (BaSP). Cette glycosyl-hydrolase de la famille 13 (GH13) suscite l’intérêt de l'industrie en raison de sa capacité à synthétiser des disaccharides et des glycoconjugués originaux. Son activité consiste à transférer un glucose d'un donneur, le saccharose, à un accepteur qui peut être un monosaccharide ou un aglycone hydroxylé. La réaction enzymatique se déroule selon un mécanisme dit « double déplacement avec rétention de configuration », ce qui nécessite la formation d'un intermédiaire covalent dit glucosyl-enzyme. Cependant, la possibilité de contrôler la régiosélectivité de ce transfert pour qu'il soit applicable au niveau industriel est un enjeu majeur. Cette thèse vise d’une part, à fournir une explication rationnelle quant aux modifications de la régiosélectivité de BaSP apportées par des mutations et d’autre part à proposer un canevas pour le contrôle de la régiosélectivité de couplage en vue de la synthèse de disaccharides pré-biotiques rares comme le kojibiose et le nigerose.
Dans notre approche, nous avons émis l'hypothèse que les orientations préférées de l'accepteur dans le site catalytique après formation du glycosyl-enzyme déterminent la régiosélectivité de l'enzyme. Nous avons utilisé des approches computationnelles pour étudier l'impact des mutations sur la liaison de l'accepteur à l'intermédiaire covalent, le glucosyl-enzyme. À cette fin, nous avons construit des modèles à l’échelle atomique du glucosyl-enzyme pour un ensemble de variants de la BaSP pour lesquels des données expérimentales étaient disponibles. Pour y parvenir, nous avons paramétré le glucosyl-aspartyle en tant que nouveau résidu et les avons intégré dans des outils de modélisation tels que Modeller et Gromacs. Nous avons évalué la pertinence de ces paramètres et les avons ensuite appliqués à la vérification de notre hypothèse de travail par le biais d’expériences d'ancrage moléculaire.La méthodologie utilisée dans ce travail ouvre la perspective de l'utilisation d'approches bioinformatiques pour l'ingénierie de la régiosélectivité de la sucrose phosphorylase et plus généralement des glycosyl hydrolases possédant un mécanisme similaire. A cet égard, un pipeline de modélisation moléculaire et d'amarrage de molécules accepteurs sur des intermédiaires covalents des enzymes de cette famille (ENZO pour Optimisation d’ENZyme) a été développé au cours de cette thèse. Son application à l’ingénierie d’autres variants de BaSP est en cours.
Résumé

Pôle Recherche Ecoles doctorales
LETTRE D’ENGAGEMENT DE NON-PLAGIAT
Je, soussigné(e) en ma qualité de doctorant(e) de
l’Université de La Réunion, déclare être conscient(e) que le plagiat est un acte délictueux
passible de sanctions disciplinaires. Aussi, dans le respect de la propriété intellectuelle et du
droit d’auteur, je m’engage à systématiquement citer mes sources, quelle qu’en soit la forme
(textes, images, audiovisuel, internet), dans le cadre de la rédaction de ma thèse et de toute
autre production scientifique, sachant que l’établissement est susceptible de soumettre le texte
de ma thèse à un logiciel anti-plagiat.
Fait à Saint-Denis le
Signature :
Extrait du Règlement intérieur de l'Université de La Réunion (validé par le Conseil d’Administration en date du 11 décembre 2014)
Article 9. Protection de la propriété intellectuelle – Faux et usage de faux, contrefaçon, plagiat
L’utilisation des ressources informatiques de l’Université implique le respect de ses droits de propriété intellectuelle ainsi que ceux de ses partenaires et plus généralement, de tous tiers titulaires de tes droits. En conséquence, chaque utilisateur doit : - utiliser les logiciels dans les conditions de licences souscrites ; - ne pas reproduire, copier, diffuser, modifier ou utiliser des logiciels, bases de données, pages Web, textes, images, photographies ou autres créations protégées par le droit d’auteur ou un droit privatif, sans avoir obtenu préalablement l’autorisation des titulaires de ces droits.
La contrefaçon et le faux Conformément aux dispositions du code de la propriété intellectuelle, toute représentation ou reproduction intégrale ou partielle d’une œuvre de l’esprit faite ans le consentement de son auteur est illicite et constitue un délit pénal. L’article 444-1 du code pénal dispose : « Constitue un faux toute altération frauduleuse de la vérité, de nature à cause un préjudice et accomplie par quelque moyen que ce soit, dans un écrit ou tout autre support d’expression de la pensée qui a pour objet ou qui peut avoir pour effet d’établir la preuve d’un droit ou d’un fait ayant des conséquences juridiques ». L’article L335_3 du code de la propriété intellectuelle précise que : « Est également un délit de contrefaçon toute reproduction, représentation ou diffusion, par quelque moyen que ce soit, d’une œuvre de l’esprit en violation des droits de l’auteur, tels qu’ils sont définis et réglementés par la loi. Est également un délit de contrefaçon la violation de l’un des droits de l’auteur d’un logiciel (…) ».
Le plagiat est constitué par la copie, totale ou partielle d’un travail réalisé par autrui, lorsque la source empruntée n’est pas citée, quel que soit le moyen utilisé. Le plagiat constitue une violation du droit d’auteur (au sens des articles L 335-2 et L 335-3 du code de la propriété intellectuelle). Il peut être assimilé à un délit de contrefaçon. C’est aussi une faute disciplinaire, susceptible d’entraîner une sanction. Les sources et les références utilisées dans le cadre des travaux (préparations, devoirs, mémoires, thèses, rapports de stage…) doivent être clairement citées. Des citations intégrales peuvent figurer dans les documents rendus, si elles sont assorties de leur référence (nom d’auteur, publication, date, éditeur…) et identifiées comme telles par des guillemets ou des italiques.
Les délits de contrefaçon, de plagiat et d’usage de faux peuvent donner lieu à une sanction disciplinaire indépendante de la mise en œuvre de poursuites pénales.
Mahesh VELUSAMY
09/10/2018