Thermophysical properties and molecular relaxations in cured epoxy resin+ PEO blends: Observations...
14
Thermophysical Properties and Molecular Relaxations in Cured Epoxy Resin þ PEO Blends: Observations on Factors Controlling Miscibility Ioannis M. Kalogeras,* 1 Aglaia Vassilikou-Dova, 1 Iraklis Christakis, 1 Dorota Pietkiewicz, 2 Witold Brostow 2 1 Solid State Physics Section, Department of Physics, University of Athens, Panepistimiopolis, 157 84 Zografos, Greece E-mail: [email protected] 2 Laboratory of Advanced Polymers & Optimized Materials (LAPOM), Department of Materials Science and Engineering, University of North Texas, P.O. Box 305310, Denton, Texas, USA Received: February 2, 2006; Revised: March 10, 2006; Accepted: March 14, 2006; DOI: 10.1002/macp.200600052 Keywords: blends; crystallization; dielectric properties; glass transition; poly(ethylene oxide); thermosets Introduction Relation to Previous Work Since the early 1960s, a variety of homopolymers, random or block copolymers have been incorporated into epoxy or novolac resins. The resulting blends exhibit microstructures that depend on type of polymers, their concentrations and curing programs (time and temperature). [1–3] The majority of thermosetting polymer blends studied hitherto are immiscible; [4–9] as a result of competition among kinetic and thermodynamic factors. In cases where miscibility has been found, attempts were made to relate it to structural similarities and in particular to the presence of various secondary interaction forces (e.g., hydrogen bonding dH, [10,11] ion–dipole forces and electron—donor–acceptor interactions). Poly(ethylene oxide) (PEO), a material with promising application in high-energy density electrochem- ical systems and biomedical devices (e.g., in electroche- mical sensors, solid-state batteries, haemodialysis membranes and drug delivery systems), is widely used as an elastomeric modifier of thermosets for enhancement of their mechanical and electrical properties, and as a mean to Summary: Thermophysical properties and molecular relaxa- tions in aromatic amine-cured diglycidyl ether of bisphenol-A (DGEBA) epoxy oligomer and poly(ethylene oxide) (PEO) mixtures were determined by DSC and dielectric techniques (TSC, DRS). The binary blends were judged to be fully miscible in the amorphous state (w PEO < 40 wt.-%), as evidenced by the single composition-dependent glass transition temperatures T g s. In the amorphous blends, negative deviations of dielectric/ thermal T g -estimates from the linear mixing rule or the behavior predicted by the Fox equation reveal weaker intermolecular interactions, compared to strong self-association of hydroxyls in the cured thermoset. Morphological changes in PEO-rich blends (w PEO 40 wt.-%) are in accordance with their complicated interface structure, previously reported to consist of amorphous PEO regions, branched epoxy resin chains and an imperfect epoxy resin network located between PEO lamellae. In these blends, PEO crystallites exert steric hindrances in the amorphous regions, causing strong T g upshifts. Changes in the relaxation dynamics of glyceryl segments (e.g., in the activation energy barrier and relaxation strength) are in accordance with the idea that the close matching between the molecular polarities of PEO, epoxy resin and the cure agent significantly contributes to the observed miscibility. Plots of transition temperatures as function of blend composition. Macromol. Chem. Phys. 2006, 207, 879–892 ß 2006 WILEY-VCH Verlag GmbH & Co. KGaA, Weinheim Full Paper DOI: 10.1002/macp.200600052 879
Transcript of Thermophysical properties and molecular relaxations in cured epoxy resin+ PEO blends: Observations...

Thermophysical Properties and Molecular
Relaxations in Cured Epoxy Resinþ PEO Blends:
Observations on Factors Controlling Miscibility
Ioannis M. Kalogeras,*1 Aglaia Vassilikou-Dova,1 Iraklis Christakis,1 Dorota Pietkiewicz,2 Witold Brostow2
1 Solid State Physics Section, Department of Physics, University of Athens, Panepistimiopolis, 157 84 Zografos, GreeceE-mail: [email protected]
2 Laboratory of Advanced Polymers & Optimized Materials (LAPOM), Department of Materials Science and Engineering,University of North Texas, P.O. Box 305310, Denton, Texas, USA
Received: February 2, 2006; Revised: March 10, 2006; Accepted: March 14, 2006; DOI: 10.1002/macp.200600052
Keywords: blends; crystallization; dielectric properties; glass transition; poly(ethylene oxide); thermosets
Introduction
Relation to Previous Work
Since the early 1960s, a variety of homopolymers, random
or block copolymers have been incorporated into epoxy or
novolac resins. The resulting blends exhibit microstructures
that depend on type of polymers, their concentrations and
curing programs (time and temperature).[1–3] The majority
of thermosetting polymer blends studied hitherto are
immiscible;[4–9] as a result of competition among kinetic
and thermodynamic factors. In cases where miscibility has
been found, attempts were made to relate it to structural
similarities and in particular to the presence of various
secondary interaction forces (e.g., hydrogen bonding
dH,[10,11] ion–dipole forces and electron—donor–acceptor
interactions). Poly(ethylene oxide) (PEO), a material with
promising application in high-energy density electrochem-
ical systems and biomedical devices (e.g., in electroche-
mical sensors, solid-state batteries, haemodialysis
membranes and drug delivery systems), is widely used as
an elastomeric modifier of thermosets for enhancement of
their mechanical and electrical properties, and as a mean to
Summary: Thermophysical properties and molecular relaxa-tions in aromatic amine-cured diglycidyl ether of bisphenol-A(DGEBA) epoxy oligomer and poly(ethylene oxide) (PEO)mixtures were determined by DSC and dielectric techniques(TSC, DRS). The binary blends were judged to be fully misciblein the amorphous state (wPEO< 40 wt.-%), as evidenced by thesingle composition-dependent glass transition temperaturesTgs. In the amorphous blends, negative deviations of dielectric/thermalTg-estimates from the linear mixing rule or the behaviorpredicted by the Fox equation reveal weaker intermolecularinteractions, compared to strong self-association of hydroxylsin the cured thermoset. Morphological changes in PEO-richblends (wPEO� 40 wt.-%) are in accordance with theircomplicated interface structure, previously reported to consistof amorphous PEO regions, branched epoxy resin chains and animperfect epoxy resin network located between PEO lamellae.In these blends, PEO crystallites exert steric hindrances in theamorphous regions, causing strong Tg upshifts. Changes in therelaxation dynamics of glyceryl segments (e.g., in the activationenergy barrier and relaxation strength) are in accordance withthe idea that the close matching between the molecularpolarities of PEO, epoxy resin and the cure agent significantlycontributes to the observed miscibility.
Plots of transition temperatures as function of blendcomposition.
Macromol. Chem. Phys. 2006, 207, 879–892 � 2006 WILEY-VCH Verlag GmbH & Co. KGaA, Weinheim
Full Paper DOI: 10.1002/macp.200600052 879

study crystallization processes, miscibility, compatibility,
and parameters controlling phase interactions.[1–4]
PEO is a proton-accepting polyether known to exhibit
strong interactions and miscibility with several polymers
possessing functional acid groups, such as poly(acrylic
acid) and poly(methacrylic acid) in which complexion
occurs from strong acid hydroxyls.[12] An important
example of miscible epoxy resin (ER)þ PEO mixtures is
the blend of PEO with poly(hydroxyl ether of bisphenol-A)
(phenoxy).[13,14] Epoxy resins in general, and specifically
diglycidyl ether of bisphenol-A (DGEBA)-type epoxies,
have a structure similar to phenoxy;[15,16] thus, we expect
them to show high compatibility with PEO. Nevertheless,
there is ample experimental evidence suggesting that the
presence of functional groups in thermosetting component
polymers cannot assure the formation of favorable
intermolecular specific interactions, nor can it ensure the
homogeneity of the resulting blends. For example, several
polyether-type thermoplastics, such as poly(propylene
oxide), poly(vinyl ethyl ether), polyacetal (polyoxymethyl-
ene), poly(2,6-dimethyl-1,4-phenylene oxide),[5,6] and
poly(ether imide)[8], when incorporated in cross-linking
ERs yield phase-separated morphology. Substantial bear-
ing on the morphology of the final (cured) product has also
the choice of the hardening agent as well as the cure
conditions. For example, PEO has been reported to exhibit
miscibility with DGEBA cured with 1,3,5-trihydroxybenz-
ene (THB),[11] aromatic amines [e.g. 4,40-methylenebis(2-
chloroaniline) (MOCA),[17] 4,40-diaminodiphenylmethane
(DDM),[18] 4,40-diaminodiphenyl sulfone (DDS),[19,20] and
4,40-methylenebis(3-chloro-2,6-diethylaniline)
(MCDEA)[21]], and aromatic anhydrides [e.g., pyromellitic
dianhydride (PMDA)[20] and phthalic anhydride (PA)[22]].
In contrast, immiscibility has been reported for ERþPEO blends cured with aliphatic amines, such as diethyl-
ene triamine (DETA)[20] and tetraethylene pentamine
(TEPA).[4] Thus, compared with linear polymer blends,
miscibility and intermolecular specific interactions in
thermosetting blends are much more complicated; kinetic
factors, curing processes, and topological structures of
thermosetting systems are closely coupled with the
thermodynamics of mixing.
The common criterion for miscibility is the detection of a
single glass transition temperature Tg located between the
respective temperatures of the pure components. This is the
reason why differential scanning calorimetry (DSC) has
been one of the most widely used techniques in determining
miscibility. DSC, however, can only sense movements at
length scales larger than �10 nm, so that any nano-
heterogeneities are averaged out. Dielectric relaxation
probes have been claimed to be more sensitive for
measuring structural heterogeneity in polymer blends,
copolymers, and composites, due to their considerably
smaller probe length scales.[23] The study of molecular
dynamics in thermosetþ polymer blends by means of
thermally stimulated currents (TSC) and by its ac counter-
part dielectric relaxation spectroscopy (DRS) can provide
valuable information on phase interactions and their
miscibility. Hitherto, dielectric methods have been imple-
mented to monitor phase separation, gelation, and vitri-
fication processes during cure,[24] or to study local-chain
and segmental relaxation modes in several epoxy resins.[25–
28] Bulk PEO and its complexes with several salts (e.g.,
potassium thiocyanate and lithium perchlorate) have also
been extensively studied dielectrically.[29,30] However, a
survey of the literature pertaining to cured ERþ PEO
blends revealed a shortage of reports on their relaxation
dynamics studied by dielectric techniques.
Using PEO as a model polymer to be incorporated in an
epoxy network, DSC, TSC, and DRS are used here to probe
the influence of molecular structure, components polarity,
and interactions, on thermal properties and their dielectric
relaxation response, with the aim to acquire information on
phase compatibility in cured epoxyþ polymer networks.
The merit of performing comparative thermal, dielectric,
and electrical studies on the molecular dynamics of
ERþ PEO systems is supported by reports of enhanced
conductivity of PEO-based fast ion conductors induced by
the addition of novolac phenolic resins.[31,32] A lower
pseudoactivation energy in lithium transfer and compli-
cated interactions among PEO, resin, and lithium salt, have
been detected by Chu et al.[31] The high ionic conductivity
in PEOþLiClO4 presumably originates from effective salt
dissociation and the establishment of a new conduction
network formed by amorphous PEO and the phenolic resin.
Furthermore, structural modifications were reported to
extend both thermal stability and mechanical strength of the
solid polymerþ electrolyte composite.[31]
Experimental Part
Materials
Figure 1 shows the structures of the chemicals used in thisstudy. PEO (Sigma Chemical Co., USA) with molecularweight Mw ¼ 20 000 g �mol�1 was used without furtherpurification. The epoxy resin used in the study was DGEBA(commercially available from Shell Chemicals Corporation,USA, as EPONTM resin 828) with the degree of oligomeriza-tion n� 0.1. The number-average molecular mass isMnðERÞ ¼ 360 g �mol�1 with the epoxide equivalent mass�185 g. For curing DGEBAþPEO mixtures, we employed acommon aromatic amine curing agent (hardener), DDM(chemical grade, MnðDDMÞ ¼ 198.26 g �mol�1) from AldrichChemical Inc. (USA), in granular form. Acetone solutions ofthe curing agent were mixed at 90 8C (just above the curingagent’s melting point, at 87 8C) with acetone solutionscontaining DGEBA and predetermined quantities of PEO.The amount of hardener relative to the DGEBA resin was28 phr (i.e., 28 parts of curing agent per 100 parts of resin),which results in the stoichiometric amino hydrogen/epoxy
880 I. M. Kalogeras, A. Vassilikou-Dova, I. Christakis, D. Pietkiewicz, W. Brostow
Macromol. Chem. Phys. 2006, 207, 879–892 www.mcp-journal.de � 2006 WILEY-VCH Verlag GmbH & Co. KGaA, Weinheim
ratio [r]. Curing of the well-mixed ternary DGE-BAþPEOþDDM blends was performed at 90 8C (for 4 h),followed by post-curing at 120 8C (for 2 h). The concentrationof PEO in each blend is expressed in wt.-% (e.g., 10/90ERþPEO for samples with 10 wt.-% of DGEBAþDDM and90 wt.-% PEO).
Techniques
Dielectric Relaxation Spectroscopy (DRS)
The complex dielectric permittivity data, e�ðoÞ ¼ e0ðoÞ�je00ðoÞ, determined by DRS, with e0(o) the real part ofpermittivity, e00(o) the dielectric loss and o¼ 2pf the angularfrequency, are usually fitted by assuming that the dielectricresponse is a linear superposition of the contribution from dc-conductivity sdc and various polarization processes expressedby their complex dielectric constant ei*(o). To account for thenon-Debye character of the ac response, ei*(o) can bedescribed quite well by the empirical asymmetric Havriliak-Negami (H–N) function.[33] Thus
e�ðoÞ ¼ e1 þXi
Dei
1 þ jf
f0;i
� �1�ai" #bi
� jsdc
e0os
ð1Þwhere 0< s� 1 (s¼ 1 for ohmic conductivity), e0 is thepermittivity of free space, and e1 is e0(f) for f >> fmax¼ 1/2pt(t is the relaxation time). In the framework of the H–N model,the temperature-dependent parameters of each relaxationprocess are the mean relaxation time, the relaxation strengthDe, and the width a and asymmetry b of the relaxation inrelation to a single Debye process (a¼ 0, b¼ 1). Sub-glassyrelaxations exhibit thermally activated relaxation timesexpressed by the Arrhenius-type equation
tðTÞ ¼ t0 expE
kBT
� �ð2Þ
where t0 is related to the inverse of the characteristic vibrationfrequency at infinite temperature of a charge carrier trapped inits site, E is the apparent activation energy barrier, and kB is theBoltzmann constant. The relaxation parameters (E, t0) can bededuced respectively from the slope and the intercept of thelinear plot of ln(fmax) versus 1/T (Arrhenius plots).
For DRS measurements disk-like specimens were sand-wiched between brass or gold-coated brass electrodes and e*was determined as a function of the frequency (10�2–106 Hz)at selected temperatures between �140 and 150 8C (controlledto better than �0.1 K). A Novocontrol Alpha Analyzer wasused in combination with the Novocontrol Quatro Cryosystem.
Thermally Stimulated Currents (TSC)
As an alternative to DRS, TSC measures the thermallyactivated release of stored dielectric polarization. The currentthermogram [i(T)] corresponds to an e00(T) plot at the frequencyof �10�3 Hz. Typically, the TSC experiment consists ofpolarizing a sample at some sufficiently high temperatureTp byapplying a static electric field Ep for a sufficient period of timetp. When sample temperature is lowered to T0 with the electricfield applied and then shorted at T0, the non-equilibrium stateof the system is frozen-in. During the successive heating, at aconstant heating rate b¼ dT/dt, the recovery of the system ismonitored by measuring the depolarization current density
JðTÞ ¼ P0ðTPÞtðTÞ exp � 1
b
ðTT0
dT 0
tðT 0Þ
264
375 ð3Þ
where P0 is the saturation polarization. Deviations in the shapeof a TSC peak from that described by Equation (3) areinterpreted on the basis of discrete or continuous distributionsin the relaxation times t(T). Some features of the TSC methodmake it particularly attractive as a complementary technique toDRS: The method is fast allowing for a quick characterizationof the overall dielectric response of the material underinvestigation, it is characterized by high sensitivity and highpeak resolving power (due to its low equivalent frequency)and it offers special techniques to analyze experimentallycomplex relaxation mechanisms into approximately singleresponses.[34]
The TSC scans were performed in vacuum (10�2–10�4 Pa),usually in the range �243–77 8C (or to 180 8C for blends withwPEO� 20 wt.-%), Ep� 2� 106 V/m, tp¼ 5 min and b¼ 5 8C/min. In each case, Tp was kept below the DSC-determinedmelting point of the crystalline component. Samples of typicaldimensions (5� 5� 1) mm3 were used. In order to facilitatecomparisons between different samples, the TSC spectra aregiven in transient conductivity units s(T)¼ J(T)/Ep. In mostcases, spectra were collected with the MISIM electrode
Figure 1. Chemical structures of: (a) poly(ethylene oxide) (PEO), (b) 4,40-diaminodiphenyl-methane(DDM), and (c) diglycidyl ether of bisphenol-A (DGEBA) resin.
Thermophysical Properties and Molecular Relaxations in Cured Epoxy Resinþ PEO Blends: . . . 881
Macromol. Chem. Phys. 2006, 207, 879–892 www.mcp-journal.de � 2006 WILEY-VCH Verlag GmbH & Co. KGaA, Weinheim

configuration (M¼ copper electrode electrolytically coveredby chromium, I¼ thin insulating FEP or Teflon foil, S¼sample).
Differential Scanning Calorimetry (DSC)
A Perkin-Elmer Pyris 6 differential scanning calorimeter undera dry nitrogen atmosphere was used, calibrated with an indiumstandard. Tg values were determined as follows. The samples(with weights 3.3–7 mg) were rapidly cooled from roomtemperature to�120 8C and subsequently heated to 110 8C andheld there for 5 min to eliminate the thermal history. This wasfollowed by a second quenching to �120 8C. Finally, thesamples were reheated to 200 or 250 8C (second scan at aheating rate of 20 8C min�1). Glass transition temperatureswere estimated as the midpoint of the heat capacity change.The apparent melting enthalpy Hm,blend and melting tempera-tures Tm(2) were determined from the DSC endothermic peakson the second heating run, based on the area and the maximumof the endothermic peaks, respectively. Crystallization enthal-piesHc and temperatures Tc were derived respectively from thearea and the maximum of the exothermic peaks recorded in thesecond cooling step.
Thermal Properties of Cured ERþPEO Blends
As a result of curing, the initial mixture (DGE-
BAþDDMþ PEO) undergoes a series of structural
changes, e.g., growth of chains, branching of chains, and
gelation, which transform the initial ternary system to a
binary system consisting of epoxy resin and PEO.
ERþ PEO blends with less than 50 wt.-% PEO were
transparent. On the other hand, due to the formation of PEO
spherulites, the blends with higher PEO contents were
opaque. Figure 2 shows the second heating scans for
selected cured blends. Relatively weak glass transitions,
indiscernible in the scale of the plot, were observed for most
samples and their characteristics (Tg, DCp) are listed in
Table 1. Significant is the absence of cold-crystallization
transitions during the second heating run, which implies
that crystallization was rapid and occurred to completion
during the quenching. Crystalline PEO, evidenced by
exothermic crystallization peaks in the region between 35
and 41 8C, has been observed in samples with PEO weight
fractions wPEO> 40 wt.-%.
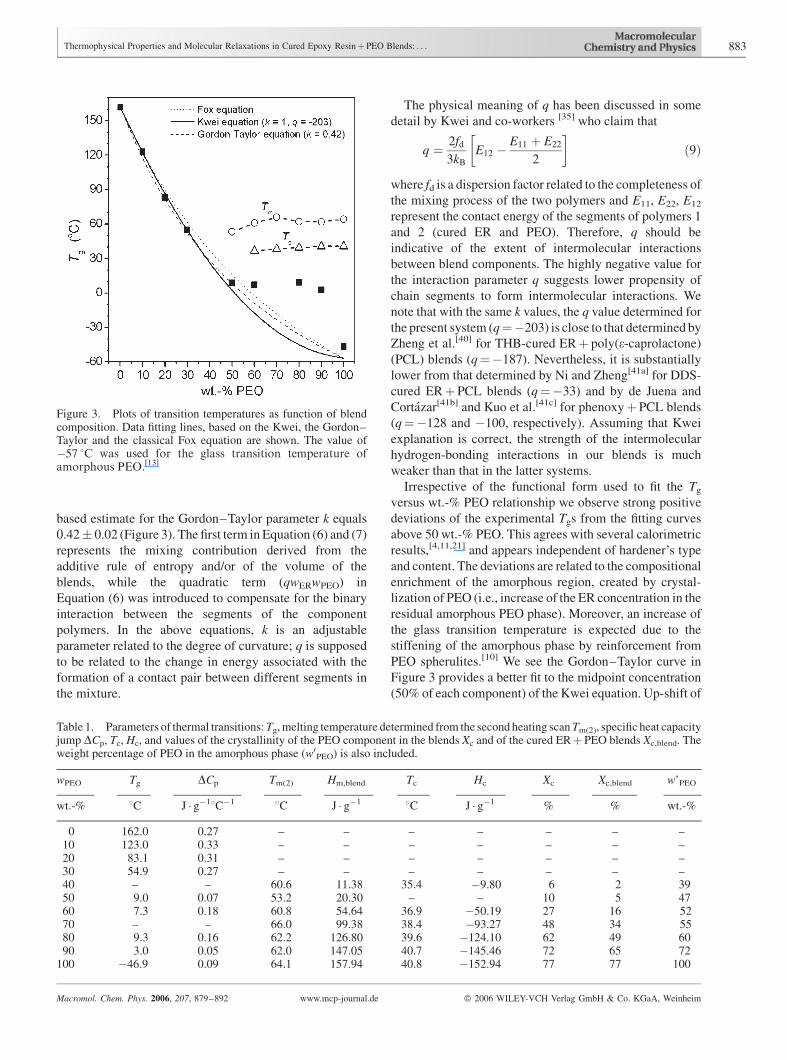
The values shown in Table 1 for the degree of crystallinity
were calculated as:
Xc;blend ¼ Hm;blend
H0m
ð4Þ
and
Xc ¼Hm;PEO
H0m
ð5Þ
where Hm,blend and Hm,PEO are the apparent melting
enthalpies per gram of blend and of PEO present on the
blend, respectively, and Hm0 is the enthalpy of melting per
gram of perfectly crystallized PEO (Hm0 ¼ 205 J/g). From
the values shown in Table 1 it is clear that the crystallinity of
the blends decreases with increasing concentration of the
non-crystallizable component (ER). This result could be
ascribed to the formation of the cross-linked epoxy network
and its strong topological influence on PEO crystallization.
Observation of single calorimetric glass transition peaks
(or equivalently of dielectric and mechanical segmental
relaxations) between the constituent values for the
amorphous components is regarded as a clear manifestation
of phase miscibility in binary cured thermosetþ polymer
systems.[18–22] The Tg–composition relationship observed
in our blends (Table 1 and Figure 3) has been described in
the left half of the diagram by an empirical equation of
Kwei[35]
Tblendg ¼
wPEOTPEOg þ kwERT
ERg
wPEO þ kwER
þ qwERwPEO ð6Þ
with k¼ 1 and q¼�203� 5. Equation (6) reduces to the
empirical equation developed by Jenckel and Heusch when
k¼ 1.[36] Apart from Equation (6) several other relations
exist,[37] such as the Gordon–Taylor equation[38]
Tblendg ¼
wPEOTPEOg þ kwERT
ERg
wPEO þ kwER
ð7Þ
and an empirical equation developed by Fox[39]
1
Tblendg
¼ wPEO
TPEOg
þ wER
TERg
ð8Þ
These equations were tested for their applicability in
describing the Tg-composition dependence. The DSC-
Figure 2. DSC curves of DDM-cured ERþ PEO blends (secondscans).
882 I. M. Kalogeras, A. Vassilikou-Dova, I. Christakis, D. Pietkiewicz, W. Brostow
Macromol. Chem. Phys. 2006, 207, 879–892 www.mcp-journal.de � 2006 WILEY-VCH Verlag GmbH & Co. KGaA, Weinheim
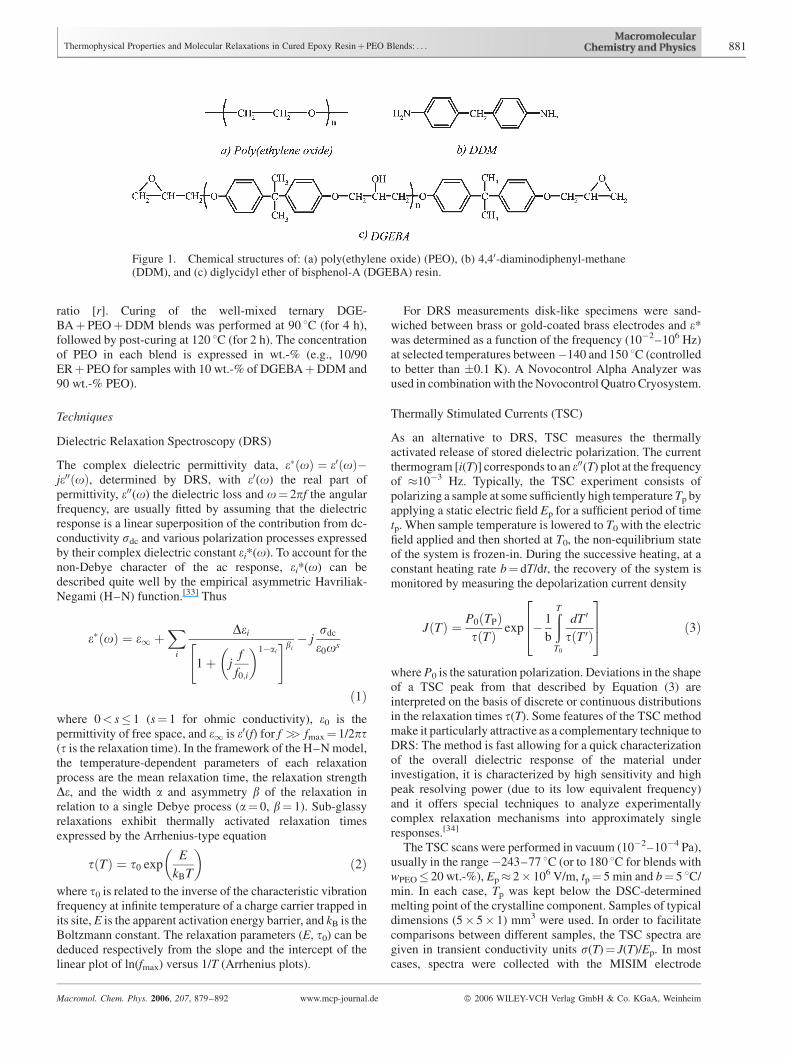
based estimate for the Gordon–Taylor parameter k equals
0.42� 0.02 (Figure 3). The first term in Equation (6) and (7)
represents the mixing contribution derived from the
additive rule of entropy and/or of the volume of the
blends, while the quadratic term (qwERwPEO) in
Equation (6) was introduced to compensate for the binary
interaction between the segments of the component
polymers. In the above equations, k is an adjustable
parameter related to the degree of curvature; q is supposed
to be related to the change in energy associated with the
formation of a contact pair between different segments in
the mixture.
The physical meaning of q has been discussed in some
detail by Kwei and co-workers [35] who claim that
q ¼ 2fd
3kB
E12 �E11 þ E22
2
� �ð9Þ
where fd is a dispersion factor related to the completeness of
the mixing process of the two polymers and E11, E22, E12
represent the contact energy of the segments of polymers 1
and 2 (cured ER and PEO). Therefore, q should be
indicative of the extent of intermolecular interactions
between blend components. The highly negative value for
the interaction parameter q suggests lower propensity of
chain segments to form intermolecular interactions. We
note that with the same k values, the q value determined for
the present system (q¼�203) is close to that determined by
Zheng et al.[40] for THB-cured ERþ poly(e-caprolactone)
(PCL) blends (q¼�187). Nevertheless, it is substantially
lower from that determined by Ni and Zheng[41a] for DDS-
cured ERþ PCL blends (q¼�33) and by de Juena and
Cortazar[41b] and Kuo et al.[41c] for phenoxyþ PCL blends
(q¼�128 and �100, respectively). Assuming that Kwei
explanation is correct, the strength of the intermolecular
hydrogen-bonding interactions in our blends is much
weaker than that in the latter systems.
Irrespective of the functional form used to fit the Tg
versus wt.-% PEO relationship we observe strong positive
deviations of the experimental Tgs from the fitting curves
above 50 wt.-% PEO. This agrees with several calorimetric
results,[4,11,21] and appears independent of hardener’s type
and content. The deviations are related to the compositional
enrichment of the amorphous region, created by crystal-
lization of PEO (i.e., increase of the ER concentration in the
residual amorphous PEO phase). Moreover, an increase of
the glass transition temperature is expected due to the
stiffening of the amorphous phase by reinforcement from
PEO spherulites.[10] We see the Gordon–Taylor curve in
Figure 3 provides a better fit to the midpoint concentration
(50% of each component) of the Kwei equation. Up-shift of
Figure 3. Plots of transition temperatures as function of blendcomposition. Data fitting lines, based on the Kwei, the Gordon–Taylor and the classical Fox equation are shown. The value of�57 8C was used for the glass transition temperature ofamorphous PEO.[13]
Table 1. Parameters of thermal transitions:Tg, melting temperature determined from the second heating scanTm(2), specific heat capacityjump DCp, Tc, Hc, and values of the crystallinity of the PEO component in the blends Xc and of the cured ERþ PEO blends Xc,blend. Theweight percentage of PEO in the amorphous phase (w0
PEO) is also included.
wPEO Tg DCp Tm(2) Hm,blend Tc Hc Xc Xc,blend w’PEO
wt.-% 8C J � g�18C�1 8C J � g�1 8C J � g�1 % % wt.-%
0 162.0 0.27 – – – – – – –10 123.0 0.33 – – – – – – –20 83.1 0.31 – – – – – – –30 54.9 0.27 – – – – – – –40 – – 60.6 11.38 35.4 �9.80 6 2 3950 9.0 0.07 53.2 20.30 – – 10 5 4760 7.3 0.18 60.8 54.64 36.9 �50.19 27 16 5270 – – 66.0 99.38 38.4 �93.27 48 34 5580 9.3 0.16 62.2 126.80 39.6 �124.10 62 49 6090 3.0 0.05 62.0 147.05 40.7 �145.46 72 65 72
100 �46.9 0.09 64.1 157.94 40.8 �152.94 77 77 100
Thermophysical Properties and Molecular Relaxations in Cured Epoxy Resinþ PEO Blends: . . . 883
Macromol. Chem. Phys. 2006, 207, 879–892 www.mcp-journal.de � 2006 WILEY-VCH Verlag GmbH & Co. KGaA, Weinheim

this experimental Tg value seems to be due to the formation
of a crystalline PEO phase.
In Figure 3 we also show how the melting temperature of
the crystalline component Tm and Tc change as a function of
blend composition. Tms of PEO in the blends slightly
decrease with an increase of DGEBA concentration. The
above phenomenon is characteristic of miscible blends and
has been explained thermodynamically by Nishi and
Wang.[42] In the present study, however, the melting point
depression is neither strong nor consistent so as to provide a
clear-cut criterion for phase miscibility.
Dielectric Characterization ofCured ERþPEO Blends
Transient Conductivity Spectra
Figure 4 shows transient conductivitys(T) signals of typical
relaxation mechanisms in vacuum-dried thick films of
DDM-cured DGEBA (ER) and pure PEO. The spectra of
selected cured ERþ PEO blends are divided into two
groups. In Figure 4(a) we show spectra of blends containing
appreciable crystalline PEO fractions (wPEO > 40 wt.-%).
The location of the relaxation modes ascribed to the
constituting materials is indicated. Figure 4(b) shows
selected spectra of amorphous blends along with the
nomenclature used for the main relaxation modes. In all
cases, thin insulating FEP films were interposed between
the samples and the electrodes to separate relaxation
response from the intense (in some blends) high-T dc
conductivity signals.
The main relaxation mode in the TSC spectra of cured
epoxy resins is the glass-transition signal aER. As expected,
the signal is highly dependent on hardener’s type and content
as well as curing time and temperature. For aromatic amine-
cured DGEBA, the aER band peaks at Ta¼ 156 8C, close to
the calorimetric Tg estimate of 162 8C. This signal is outside
the temperature range of the spectra shown in Figure 4; a low
temperature component, peaking near the polarizing temper-
ature (Tp¼ 57 8C) is only present.
The secondary transition [bER, Figure 4(a)] is located
around �108 8C, in agreement with the TSC estimate
reported by Shin et al.[25] Based on dynamic mechanical
analysis (DMA) of DDM-cured ER and ERþ PEO
blends,[5] the bER mode has a loss factor (tan d) peak
around �55 8C (measured at f¼ 0.1 Hz). The lower
temperature of the peak maximum, Tmax, in the TSC
spectrum is in agreement with the lower equivalent
frequency of the method (feq� 10�3 Hz). Several other
cured ER systems show TSC bER processes in the same
temperature range. For example, DDS-cured tetraglycidyl-
4,40-diaminodiphenyl (TGDDM) methane shows bER
maxima between �100 and �80 8C and triethylenetetr-
amine (TETA)-cured DGEBA shows this sub-Tg relaxation
between �113 and �73 8C.[27] In terms of the amino cross-
linked epoxy systems, the bER transition is attributed to the
crankshaft motion of the hydroxyl-ether groups (glyceryl
segment I, Figure 5), which most of them form after the
amine-epoxy curing reaction. It has been also reported that
the diphenyl propane units contribute to the relaxation with
the ‘‘flip-flop’’ motion of the phenyl rings that would relax
near �110 8C.[43]
Earlier TSC and thermally stimulated creep (TSCr)
studies of amine-cured epoxy networks revealed that both
Figure 4. Transient conductivity s(T) spectra of cured ER, purePEO and cured ERþ PEO blends. To reduce the strong high-T dcconductivity signal of PEO and reveal submerged relaxations thespectra were recorded with the MISIM electrode configuration(I¼ FEP).
884 I. M. Kalogeras, A. Vassilikou-Dova, I. Christakis, D. Pietkiewicz, W. Brostow
Macromol. Chem. Phys. 2006, 207, 879–892 www.mcp-journal.de � 2006 WILEY-VCH Verlag GmbH & Co. KGaA, Weinheim

the magnitude and Tmax of the bER mode increases with
increasing cross-link density.[43] According to Mangion and
Johari,[26] during curing the height of the secondary
relaxation peak first increases to a maximum value and
then decreases (at post-cure periods) due to physical aging
effects. Based on the above results, the TSC observation by
Lee et al.[28] of a bER process near �12 8C for DDM-cured
DGEBA should be considered with caution. A strong peak
upshift would necessitate very high cross-link density
accompanied by strong dipole–dipole, van der Waals or
hydrogen bonding interactions of the relaxation entities
with their surroundings; yet, none of the above factors
seems sufficient to account for such a dramatic upshift. The
very weak signal around �25 8C, generally ascribed to
unreacted hardener molecules,[18] complicates further an
explanation.
The diffuse low-T gER mode is attributed to main-chain
motion, most likely of the glycidyl ether segment (segment
II). The corresponding TSC signal appears here at temper-
atures well below �140 8C (Tmax��113,[28] �123,[27]
�145,[25] and �155 8C[43]). Among others, Mangion and
Johari[26] observed that the concentration of unreacted
epoxy groups decreases with increasing cross-linked
density, reached at longer curing and post-curing (or aging)
programs. In addition, Boye et al.[43] reported a drop of the
gER TSC band with [r] increasing from 0.5 to 1 (i.e.,
increased cross-linking density). In the present case, the low
dielectric strength of the gER mode is consistent with the
high cross-linking density obtained for [r]¼ 1.
The structure of the TSC spectrum is highly dependent on
PEO’s crystallinity, molecular weight, degree of hydration,
and preparation conditions. The bPEO transition
(Tmax ��40 to �21 8C) is attributed to long-range
segmental chain reorientations directly correlated with the
amount of amorphous phase in the amorphous–crystalline
two-phase structure of PEO.[44] Association of the bPEO
mode with a cooperative glass transition phenomenon in
disordered regions is supported by the disappearance of this
signal in single-crystal laminate solution-grown PEO (with
Mw > 105). The presence of the bPEO band well above the
frequently reported calorimetricTg of PEO (e.g.,�57 8C for
high–molecular-weight material) is attributed to the high
degree of crystallinity. The secondary gPEO process
(Tmax ��170 8C) is assigned to local twisting movements
(crank-shaft or kink motion) in the main chains in both
defective regions within crystallites and non-crystalline
regions,[44] including amorphous segments in the fold
structure on crystal surfaces. Note that in earlier TSC
studies of uncomplexed PEO the gPEO process has been
reported to peak at about �155 8C, showing (non-system-
atic) high-T shifts in the presence of salts and also great
sensitivity to the nature of electrodes.[45,46] The latter effect
was also observed in the present study (e.g., see Figure 6).
Both the location and strength of the peak recorded above
bPEO (e.g., at 20 8C in the homopolymer) is also highly
dependent on the selection of the electrode material.[47]
Blending induces modifications in the segmental and
local-chain dynamics of the constituting phases. The
relaxation bands attributed to local-chain motions (gPEO
and gER) activate in the same temperature region forming a
complex band (denoted gblend), which locates between
�190 and �140 8C. The main component of this signal
peaks near the temperature of the gPEO signal and is
relatively strong (higher smax(g)) and high-temperature
Figure 5. Section of cross-linked DDM-cured DGEBA. Thechain segments responsible for the bER (segment I) and gER
(segment II) relaxation modes of the cured epoxy resin areindicated.
Thermophysical Properties and Molecular Relaxations in Cured Epoxy Resinþ PEO Blends: . . . 885
Macromol. Chem. Phys. 2006, 207, 879–892 www.mcp-journal.de � 2006 WILEY-VCH Verlag GmbH & Co. KGaA, Weinheim

shifted (higher Tmax(g)) for blends with PEO contents
between 40 and 60 wt.-%.
The addition of PEO affects also the position and the
strength of the bER peak, in relation to the signal recorded in
the thermoset. The spectral information shown in Figure 7
and its insert cast doubt on the interpretation of earlier DMA
data. Zheng et al. report that DDM-cured blends show bER-
related signals in the range �100 to 0 8C, with loss factor
(tan d¼ e00/e0) peaks around �59 and �80 8C, for pure ER
and 50/50 ERþ PEO, respectively (measured at f¼ 0.1
Hz).[18] Based on our results involving the same composi-
tions, the TSC signal shows a clear upshift, irrespective of
the blocking-electrode system (e.g., from �107 to �99 8Cusing FEP films). According to Zheng et al., a high-T shift of
the DMA bER signal was observed only in the blend with
10 wt.-% PEO.[18] They explained this by association of
hydroxyl-ether units in the epoxy with oxygen atoms in
PEO, hindering the rotational motion of the hydroxyl ether
groups. Further, Zheng and co-workers suggested that
increasing concentration of the linear polymer component
should create, and progressively make dominant, plasticiz-
ing of the bER mode in the epoxy. We have studied more
blends than Zheng et al. and we find that plasticization in not
supported by simple DTmax considerations: a low-T shift
was absent for bblend modes in blends with 40–50 wt.-%
Figure 6. Dependence of the s(T) spectrum of pure PEO(Mw ¼ 2� 104 g �mol�1) on the electrode configuration: (a)copper electrodes electrolytically covered by chromium (ohmicelectrodes), and blocking electrode MISIM configurations, withI¼ FEP (b) or Teflon (c) films.
Figure 7. Plots of the transient conductivity signal at peak position (smax) of thebblend signal as a function of the PEO content in the blends. The inset shows thevariation of the band temperature maximum. Spectral parameters obtained withdifferent blocking electrodes are shown. The dashed lines are guide for the eye.
886 I. M. Kalogeras, A. Vassilikou-Dova, I. Christakis, D. Pietkiewicz, W. Brostow
Macromol. Chem. Phys. 2006, 207, 879–892 www.mcp-journal.de � 2006 WILEY-VCH Verlag GmbH & Co. KGaA, Weinheim

PEO. Conceivably, plasticization may be invoked to explain
an increase in the relaxation strength of bER (Figure 7) in
blends with 30 and 40 wt.-% PEO.
The position of the single prominent glass transition
mode of each blend (ablend) changes irregularly with the
change of the PEO/ER weight fraction. Its shape is also
dependent on this ratio (Figure 8). Broadening is highly
dependent upon the actual electrode configuration, since
this alters contributions from satellite peaks in a rather
irregular way. However, it is clear that broadening is
significant in blends with 20 wt.-% of PEO – when the
polyether is fully amorphous.
Frequency Dependence of Dielectric Modes
Representative frequency dependence of dielectric permit-
tivity e0 and loss factor e00 for the blend with wPEO¼ 90 wt.-
% are shown in Figure 9. The spectra in Figure 9(a) refer to a
dry blend (recorded at T¼ 50 8C) and in Figure 9(b) to a
hydrated one (weight increase due to water absorption
h¼ 4.14%, T¼ 25 8C). The main phenomena seen are the
glass transition (in the 1–105 Hz range) and dc conductivity
signals at lower frequencies. We also provide the electric
modulus, M� ¼ 1=e� ¼ M0 þ jM00.[48] The real M0 and
imaginary M00 parts of the electric modulus were obtained
by transforming the permittivity data as follows:
M0ðf Þ ¼ e0ðf Þe02ðf Þ þ e002ðf Þ ð10Þ
and
M00ðf Þ ¼ e00ðf Þe02ðf Þ þ e002ðf Þ ð11Þ
Using the modulus formalism the large contribution of the
non-local relaxation at low frequencies is suppressed, while
theM00(f) spectrum preserves the general shape and position
of the ablend dispersion. The temperature dependence of the
maximum of the low-frequency M00(f) band and its position
in the frequency scale below the glass transition region
suggests that the signal is space-charge related. A ‘‘con-
ductivity relaxation’’ (CR) mechanism is the most probable
cause;[49] however, considering the heterogeneities found in
this blend, a Maxwell–Wagner–Sillars (MWS) polariza-
tion phenomenon most likely overlaps with CR. Strong
overlap of CR and MWS signals is common in the DRS
studies; a recent example is the structure of the M00(f)spectra of microphase-separated bioactive polyur-
ethanes.[50] We note that with the samples in the hydrated
state both mechanisms shift to higher frequencies.
A representative example of the temperature variation of
the dielectric response is shown in Figure 10. At low
temperatures the M00(f) spectrum of the blend with
wPEO¼ 50 wt.-% shows a gblend relaxation at high
frequencies (e.g., fg,blend� 105 Hz at �70 8C), a small
contribution to the overall relaxation response.[51] The
dielectric strength Deg of the DRS gblend mode attains its
maximum value in the 50/50 ERþ PEO blend,[47] con-
sistent with the TSC estimate. We note that many TSC
spectra reveal a bimodal nature for the gblend signal, while
the high-frequency DRS response can be described by a
single relaxation mechanism. In both cases, however, the
gblend signal is broad (e.g., the half-width of the M00 signal is
Figure 8. Normalized plots (s/smax vs. T/Tmax) for the ablend
TSC signal ascribed to the glass transition mechanism of theERþ PEO blends. All spectra were recorded in the MISIMelectrode configuration, with ‘‘I’’ referring to FEP [Figure 8(a)] orTeflon [Figure 8(b)] films.
Thermophysical Properties and Molecular Relaxations in Cured Epoxy Resinþ PEO Blends: . . . 887
Macromol. Chem. Phys. 2006, 207, 879–892 www.mcp-journal.de � 2006 WILEY-VCH Verlag GmbH & Co. KGaA, Weinheim

much greater than that of Debye peak, 1.14 decades)
confirming that this mechanism is characterized by a broad
distribution of relaxation times. Analogous observations
apply for the neighboring signal (bblend mode), which enters
the frequency window when temperature increases above
�90 8C. The broad range of the b relaxation signal
illustrates the heterogeneous structure of the material.[27]
The Havriliak–Negami model was used to describe the
dielectric behavior and the Arrhenius rate law was found to
fit well sub-glassy relaxations (Figure 11). In all blends for
which data analysis was possible, the (re)orientation of the –
OH groups is controlled by an apparent activation energy
barrier of Eg,blend¼ 34� 2 kJ �mol�1. This value lies in the
range �20–50 kJ �mol�1 for typical local relaxations in
polymer matrices.[52] Arrhenius-type fits for the bblend
mode give estimates for Eb,blend that gradually decrease
with the addition of PEO. For example, Eb,blend¼ 90� 2
kJ �mol�1 for the blend with 20 wt.-% PEO, and it reduces
with increasing polyether content to 86� 4 kJ/mol (50 wt.-
% PEO), 71� 1 kJ �mol�1 (70 wt.-% PEO) and 65� 4
kJ �mol�1 (90 wt.-% PEO).
Preliminary results on highly hydrophilic PEO-rich
blends show that certain characteristics of the space-charge
related (CR and MWS) and segmental (ablend) relaxations
dependent strongly on the equilibrium hydration level (h).
Their high-frequency shift with increasing equilibrium
hydration level (ranging from 0 to 4.14% with relative
humidity environments from 0 to 75%) can be explained by
plasticization caused by occlusion of water molecules.
Further, sdc increases and the glass transition signal
broadens with water absorption (Figure 12).
Conclusion
Perturbations in the relaxation dynamics of the constituting
phases induced by blending provide information on
intermolecular interactions as well as structural character-
istics of the cure products. A characteristic example is the
downshift of the single glass-transition-related TSC signals
(quantified by the temperature of the TSC peak maximum,
Ta) with increasingwPEO (Figure 13). The shift is inherently
characteristic for the system and appears regardless of the
blocking electrode material. It is also in agreement with
DSC results (Figure 3). Satisfactory fits of the TSC data
were obtained using the Kwei equation with k¼ 1 and
parameter q in the range �277� q��228 [Figure 13(a)]
and to a lower degree using the Gordon–Taylor equation
[0.32� k� 0.39, Figure 13(b)]. The DSC estimate for the
Gordon–Taylor equation parameter is only slightly higher
(k¼ 0.42).
It has been proposed that the adjusting parameter k, used
in the Gordon–Taylor equation, can be taken as a semi-
quantitative measure of miscibility and strength of the
intermolecular interaction between components of polymer
blends. For instance, in blends of PCL with poly(vinyl
chloride) and chlorinated poly(vinyl chloride)s, the DSC-
based estimates for the Gordon–Taylor parameter k
increase from 0.56 to 0.76 with increasing degree of
chlorination,[53] which gives rise to increased amount of
intermolecular hydrogen-bonding between the a-hydrogen
of chlorinated polymers and the carbonyl of PCL. The
present estimate of a relatively low k value may be a
consequence of a decreased enthalpy contribution, which in
Figure 9. Dielectric permittivity (e0), dielectric loss (e00), andelectric modulus (M0, M00) spectra of a representative ERþ PEOblend (wPEO¼ 90 wt.-%): (a) dry blends (h¼ 0.00%, T¼ 50 8C)and (b) hydrated blend (h¼ 4.14% at 75% RH, T¼ 25 8C).
888 I. M. Kalogeras, A. Vassilikou-Dova, I. Christakis, D. Pietkiewicz, W. Brostow
Macromol. Chem. Phys. 2006, 207, 879–892 www.mcp-journal.de � 2006 WILEY-VCH Verlag GmbH & Co. KGaA, Weinheim

Figure 10. Isothermal M00(f) spectra for the blend with 50 wt.-% PEO, recordedat selected temperatures. The spectrum recorded at �70 8C is shown with athicker line.
Figure 11. Representative Arrhenius plots for mechanismsisolated in pure PEO and DDM-cured ERþ PEO blends (90, 70,50, and 20 wt.-% PEO). The lines are fits of the experimental data toappropriate equations for the temperature dependence for therelaxation frequencies.
Figure 12. Modification of the room temperature M00(f) spec-trum of the 10/90 ERþ PEO blend as result of (equilibrium) waterabsorption (RH%: relative humidity; h: equilibrium hydrationlevel).
Thermophysical Properties and Molecular Relaxations in Cured Epoxy Resinþ PEO Blends: . . . 889
Macromol. Chem. Phys. 2006, 207, 879–892 www.mcp-journal.de � 2006 WILEY-VCH Verlag GmbH & Co. KGaA, Weinheim

turn indicates weakened intermolecular-specific phase
interactions in the cross-linked structures. Analogous
assessments have been reported for miscible DDS-cured
(k¼ 0.42,[20]) and THB-cured (k¼ 0.26,[14]; k¼ 0.31,[40])
DGEBAþ PEO blends, with additional verification pro-
vided by FTIR spectroscopy results.
The observation of subtle changes in the local-chain
relaxation dynamics provides additional verification of our
arguments. It is generally accepted that the relaxation
behavior of the secondary relaxation in pure resins is
tailored by self-associations of –OH groups. A moderate
strengthening of the dielectric bER mode in several blends
(insert in Figure 7) suggests that the addition of the linear
polyether facilitates local motion of glyceryl segments. The
DRS result of a decrease in the apparent activation energy
barriers with the addition of PEO supports the above
scenario. Such ‘‘plasticization’’ effects indicate a reduction
in the number and/or the strength of intermolecular
interactions in the cross-linked epoxy network, accompa-
nied by some changes in the structural environment of the
relaxing entities. The role of the above effect is further
exemplified by the observation of Boye et al. that imperfect
cross-linking of the epoxy drastically depresses the bER
peak, i.e., due to the internal antiplasticization of the
mechanism by unreacted epoxy groups.[43] In our case, the
band intensification is readily observable for PEO contents
between 20 and 40 wt.-% (Figure 7), where the polyether
component is completely amorphous and the blend is in a
completely miscible state.[18] Considering that the strength
of the bblend signals shown in Figure 7 for PEO-rich blends
should be corrected to account for the actual content of ER
in the blend, it appears that polyether addition eventually
facilitates local motion of hydroxyl units in the epoxy.
Observations concerning the primary (a) and the
secondary (b) modes can be related to mechanisms
inducing miscibility of the components. The basic inter-
action force between the constituent chain segments is
considered to be hydrogen bonding between group
pairs, such as the hydroxyl (–OH) of epoxy and the ether
group (–O–) of PEO, which act antagonistically to the self-
association of hydroxyls in pure ER. As the hydrogen bond
is a directional attractive interaction between electron-
deficient hydrogen and a region of high electron density, its
strength is directly related to all the elements affecting the
acidity of the proton donor, the basicity of the proton
acceptor, and the accessibility of the donor and acceptor.
Among these, chemical and stereo structures of the donors
and acceptors are essential in determining the strength of
the hydrogen bonds. Therefore, factors such as steric
shielding (the screening effect) and low accessibility of
functional groups are likely to reduce specific interactions
between PEO and ER chains due to the formation of a cross-
linked network.[11] Surprisingly, similar observations have
been reported even for uncured binary blends.
Based on the present results, and in agreement with
earlier FTIR studies by Horng and Woo[20] and by Hu
et al.[11] in cured DGEBAþ PEO mixtures, the intermo-
lecular hydrogen-bonding interactions are much weaker
than the self-association of hydroxyls of ER. This behavior
Figure 13. Plots of TSC-based glass-transition temperaturesTa(�Tg) as a function of blends’ composition. TSC scans forsamples with wPEO � 20 wt.-% were conducted in the MSMelectrode configuration, since their relatively low dc conductivitydoes not obscure the isolation of the glass-transition related currentsignal. Note that the Ta values of blends containing PEOcrystallites (wPEO � 50 wt.-%) were not used in the fits.
890 I. M. Kalogeras, A. Vassilikou-Dova, I. Christakis, D. Pietkiewicz, W. Brostow
Macromol. Chem. Phys. 2006, 207, 879–892 www.mcp-journal.de � 2006 WILEY-VCH Verlag GmbH & Co. KGaA, Weinheim

is in marked contrast to the enhanced strength of the
intermolecular interactions in cured phenoxyþ PEO (mis-
cible blend).[11] In cases where dH interactions are possible,
cured blends may be either miscible (e.g., DDS-cured
ERþ PEO) or phase-separated (e.g. DETA-cured
ERþ PEO).[20] A homogeneous structure has been reported
even for blends cured with aromatic anhydride (PMDA), for
which structural similarity with the cure components is
present but hydrogen bonding is not expected.[20] In
contrast, aliphatic agents fail to produce miscible cured
thermosetþ polyether blends. Combining the above obser-
vations, we infer that the presence of hydrogen-bonding
sites between specific functional groups is neither a
sufficient nor a necessary condition for phase homogeneity.
It is the structural similarity of the components (resin,
hardener and polyether) and the extent of inter-associated
hydrogen bonds (rather than the strength of the bond itself)
that seems to govern the miscibility or compatibility of the
particular structures.
Acknowledgements: The present research has been funded byE.P.E.A.K. 2 (Operational Programme for Education and InitialVocational Training, Athens) in the framework of PYTHAGORAS(Project 70/3/7362).
[1] M. Larranaga, N. Gabilondo, G. Kortaberria, E. Serrano,P. Remiro, C. C. Riccardi, I. Mondragon, Polymer 2005, 46,7082.
[2] G. Xu, W. F. Shi, S. J. Shen, J. Polym. Sci. Phys. 2004, 42,2649.
[3] F. L. Barcia, T. P. Amaral, B. G. Soares, Polymer 2003, 44,5811.
[4] Q. Guo, X. Peng, Z. Wang, Polymer 1991, 32, 53.[5] R. W. Venderbosch, H. E. H. Meijier, P. J. Lemstra, Polymer
1995, 36, 2903.[6] R. A. Pearson, A. F. Yee, J. Appl. Polym. Sci. 1993, 48, 1051.[7] P. C. Sun, Q. Q. Dang, B. H. Li, T. H. Chen, Y. N. Wang, H.
Lin, Q. H. Jin, D. T. Ding, A. C. Shi, Macromolecules 2005,38, 5654.
[8] L. Li, M. J. Liu, S. J. Li, Polymer 2004, 45, 2837.[9] M. I. Giannotti, I. Mondragon, M. J. Galante, P. A.
Oyanguren, J. Polym. Sci. Phys. 2004, 42, 3964.[10] H. Lu, S. Zheng, Polymer 2003, 44, 4689.[11] L. Hu, H. Lu, S. Zheng, J. Polym. Sci. Phys. 2004, 42, 2567.[12] Y. He, B. Zhu, Y. Inoue, Prog. Polym. Sci. 2004, 29, 1021.[13] L. M. Robeson, W. F. Hale, C. N. Merriam, Macromolecules
1981, 14, 1644.[14] M. Iriarte, E. Espi, A. Etxeberria, M. Valero, M. J.
Fernandez-Berridi, J. J. Iruin, Macromolecules 1991, 24,5546.
[15] B. Bilyeu, W. Brostow, K. P. Menard, J. Mater. Ed. 1999, 21,281; J. Mater. Ed. 2000, 22, 107.
[16] B. Bilyeu, W. Brostow, K. P. Menard, J. Mater. Ed. 2001, 23,189.
[17] M. Yin, S. Zheng, Macromol. Chem. Phys. 2005, 206, 929.[18] S. Zheng, N. Zhang, X. Luo, D. Ma,Polymer 1995, 36, 3609.
[19] T. J. Horng, E. M. Woo,Angew.Makromol. Chem. 1998, 260,31.
[20] T. J. Horng, E. M. Woo, Polymer 1998, 39, 4115.[21] Q. Guo, C. Harrats, G. Groeninckx, M. H. J. Koch, Polymer
2001, 42, 4127.[22] X. Luo, S. Zheng, N. Zhang, D. Ma, Polymer 1994, 35,
2619.[23] M. Dionisio, J. F. Mano, N. M. Alves, e-Polymers 2004, no.
044.[24] I. Alig, W. Jenninger, J. Polym. Sci. Phys. 1998, 38, 2461.[25] S. M. Shin, D. K. Shin, D. C. Lee, Polym. Bull 1998, 40,
599.[26] M. B. M. Mangion, G. P. Johari, J. Polym. Sci. Phys.1991,29,
437.[27] [27a] W.-F. A. Su, S. H. Carr, J. O. Brittain, J. Appl. Polym.
Sci. 1980, 25, 1355; [27b] C. Maggana, P. Pissis, J.Macromol. Sci., Phys. B 1997, 36, 749.
[28] J. Y. Lee, Y. W. Song, S. W. Kim, H. K. Lee, Mater. Chem.Phys. 2003, 77, 455.
[29] C. Fanggao, G. A. Saunders, E. F. Lambson, R. N. Hampton,G. Carini, G. Di Marco, M. Lanza, J. Polym. Sci. Phys. 1996,34, 425.
[30] X. Jin, S. H. Zhang, J. Runt, Polymer 2002, 43, 6247.[31] P. P. Chu, M. J. Reddy, J. Tsai, J. Polym. Sci. Phys. 2004, 42,
3866.[32] A. M. Rocco, C. P. Fonseca, F. A. M. Loureiro, R. P. Pereira,
Solid State Ionics 2004, 166, 115.[33] S. Havriliak, Jr., S. J. Havriliak, ‘‘Dielectric andMechanical
Relaxation in Materials’’, Hanser Publishers, Munich 1997,p. 14.
[34] J. Vanderschueren, J. Gasiot, ‘‘Field-Induced ThermallyStimulated Currents’’, in: Topics in Applied Physics, G. M.Sessler, Ed., Springer, Berlin 1980.
[35] [35a] T. K. Kwei, J. Polym. Sci. Lett. 1984, 22, 307;[35b] T. K. Kwei, E. M. Pearce, J. R. Pennacchia, M.Charton, Macromolecules 1987, 20, 1174.
[36] E. Jenckel, R. Heusch, Kolloid Z. 1953, 30, 89.[37] A. A. Lin, T. K. Kwei, A. Raiser, Macromolecules 1989, 22,
4112.[38] M. Gordon, J. S. Taylor, J. Appl. Chem. 1952, 2, 493.[39] T. G. Fox, Bull. Am. Phys. Soc. 1956, 1, 123.[40] S. Zheng, H. Lu, C. Chen, K. Nie, Q. Guo, Colloid Polym.
Sci. 2003, 281, 1015.[41] [41a] Y. Ni, S. Zheng, Polymer 2005, 46, 5828; [41b] R. de
Juana, M. Cortazar, Macromolecules 1993, 26, 1170;[41c] S.-W. Kuo, S.-C. Chan, H.-D. Wu, F.-C. Chang,Macromolecules 2005, 38, 4729.
[42] T. Nishi, T. T. Wang, Macromolecules 1975, 8, 909.[43] J. Boye, P. Demont, C. Lacabanne, J. Polym. Sci. Phys. 1994,
32, 1359.[44] Y. Ishida, M. Matsuo, M. Takayanagi, J. Polym. Sci. Phys.
1965, 3, 321.[45] J. P. Calame, J. J. Fontanella, M. C. Wintersgill, C. G.
Andeen, J. Appl. Phys. 1985, 58, 2811.[46] D. R. Figueroa, J. J. Fontanella, M. C. Wintersgill, J. P.
Calame, C. G. Andeen, Solid State Ionics 1988, 28–30,1023.
[47] I. M. Kalogeras, M. Roussos, I. Christakis, A. Spanoudaki,D. Pietkiewicz, W. Brostow, A. Vassilikou-Dova, J. Non-Cryst. Solids 2005, 351, 2728.
[48] I. M. Hodge, K. L. Ngai, C. T. Moynihan, J. Non-Cryst.Solids 2005, 351, 104.
[49] ‘‘Relaxation in Complex Systems’’, H. Jain, K. L. Ngai, G. B.Wright, Eds., Naval Research Laboratory, Washington, DC1984, p. 221.
Thermophysical Properties and Molecular Relaxations in Cured Epoxy Resinþ PEO Blends: . . . 891
Macromol. Chem. Phys. 2006, 207, 879–892 www.mcp-journal.de � 2006 WILEY-VCH Verlag GmbH & Co. KGaA, Weinheim

[50] I. M. Kalogeras, M. Roussos, A. Vassilikou-Dova, A.Spanoudaki, P. Pissis, Y. V. Savelyev, V. I. Shtompel, L. P.Robota, Eur. Phys. J. E 2005, 18, 467.
[51] L. Zong, S. Zhou, R. Sun, L. C. Kempel, M. C. Hawley, J.Polym. Sci. Phys. 2004, 42, 2871.
[52] A. Schonhals, ‘‘Dielectric Spectroscopy of PolymericMaterials: Fundamentals and Applications’’, J. P. Runt,J. J. Fitzgerald, Eds., ACS, Washington, DC 1997,p. 107.
[53] F. C. Chiu, K. S. Min, Polym. Inter. 2000, 49, 223.
892 I. M. Kalogeras, A. Vassilikou-Dova, I. Christakis, D. Pietkiewicz, W. Brostow
Macromol. Chem. Phys. 2006, 207, 879–892 www.mcp-journal.de � 2006 WILEY-VCH Verlag GmbH & Co. KGaA, Weinheim