A Novel Technique for Experimental Thermophysical Characterization of PhaseChange Materials
19
Int J Thermophys (2011) 32:674–692 DOI 10.1007/s10765-010-0900-z A Novel Technique for Experimental Thermophysical Characterization of Phase-Change Materials Zohir Younsi · Laurent Zalewski · Stéphane Lassue · Daniel R. Rousse · Annabelle Joulin Received: 19 May 2010 / Accepted: 27 November 2010 / Published online: 29 December 2010 © Springer Science+Business Media, LLC 2010 Abstract The major objective of this project is to use phase-change materials (PCMs) as integrated components in passive solar heat recovery systems. The sug- gested approach involves experimental investigations and characterization of the global behavior of a parallelepiped “material wrap” filled with the PCM. The experi- mental apparatus permits simultaneous measurements of heat fluxes and temperatures. It also allows imposing and measuring temperatures variations with respect to selected time scales between the two predominant faces of the sample. The instantaneous heat flux measurements allow the determination of the “apparent” or overall heat storage capacities and thermal conductivities of the PCM—in the solid and liquid states—and that of the latent heat of melting. Results were found to be very satisfactory. Keywords Calorimetry · Heat flux measurement · Heat storage · Phase-change material · Thermophysical properties L. Zalewski · S. Lassue · A. Joulin Université Lille Nord de France, Lille, France L. Zalewski · S. Lassue (B ) · A. Joulin Université d’Artois, LGCgE, 62400 Béthune, France e-mail: [email protected] Z. Younsi Hautes Etudes d’Ingénieur (HEI), 59000 Lille, France D. R. Rousse Department of Mechanical Engineering, École de Technologie Supérieure, Université du Québec, Montréal, Canada 123
Transcript of A Novel Technique for Experimental Thermophysical Characterization of PhaseChange Materials

Int J Thermophys (2011) 32:674–692DOI 10.1007/s10765-010-0900-z
A Novel Technique for Experimental ThermophysicalCharacterization of Phase-Change Materials
Zohir Younsi · Laurent Zalewski · Stéphane Lassue ·Daniel R. Rousse · Annabelle Joulin
Received: 19 May 2010 / Accepted: 27 November 2010 / Published online: 29 December 2010© Springer Science+Business Media, LLC 2010
Abstract The major objective of this project is to use phase-change materials(PCMs) as integrated components in passive solar heat recovery systems. The sug-gested approach involves experimental investigations and characterization of theglobal behavior of a parallelepiped “material wrap” filled with the PCM. The experi-mental apparatus permits simultaneous measurements of heat fluxes and temperatures.It also allows imposing and measuring temperatures variations with respect to selectedtime scales between the two predominant faces of the sample. The instantaneous heatflux measurements allow the determination of the “apparent” or overall heat storagecapacities and thermal conductivities of the PCM—in the solid and liquid states—andthat of the latent heat of melting. Results were found to be very satisfactory.
Keywords Calorimetry · Heat flux measurement · Heat storage · Phase-changematerial · Thermophysical properties
L. Zalewski · S. Lassue · A. JoulinUniversité Lille Nord de France, Lille, France
L. Zalewski · S. Lassue (B) · A. JoulinUniversité d’Artois, LGCgE, 62400 Béthune, Francee-mail: [email protected]
Z. YounsiHautes Etudes d’Ingénieur (HEI), 59000 Lille, France
D. R. RousseDepartment of Mechanical Engineering, École de Technologie Supérieure,Université du Québec, Montréal, Canada
123

Int J Thermophys (2011) 32:674–692 675
NomenclatureT Temperature, ◦C�T Temperature difference, ◦Cϕ Density of heat flux, W · m−2
Q Total stored energy, JC Specific heat, J · kg−1 · K−1
L Latent heat of melting, J · kg−1
e Thickness, mk Thermal conductivity, W · m−1 · K−1
m Mass, kgt Time, h
Subscriptsl Liquid states Solid statemelting Melting pointinitial Initialfinal Finalint Internal face of the envelopeext External face of the envelopesamp Sample (brick) which includes the PCM and its envelope1 Measurement on the first side of the brick2 Measurement on the second side of the brickpcm Phase change materialend At the end, in steady state
1 Introduction
1.1 Interest
For many years, scientists and engineers have worked on the development of recoverysystems allowing the storage and use of solar energy in order to reduce the consump-tion of non-renewable energies and the emission of pollutants and greenhouse gasesin the atmosphere.
The use of phase-change materials (PCMs) seems to be particularly interestingbecause these can be used, through melting and solidifying at specific temperatures,to store and release large amounts of energy [1] in relatively reduced volumes. PCMsare substances involving high heats of melting which is the main reason why suchmaterials have received great interest for many applications such as energy storageand thermal protection systems as well as in active and passive cooling processes.These possibilities and their actual limitations are well presented in the papers ofTyagi and Buddhi [2] and Khudair and Farid [3]. Some of these materials also exhibit,for other interests, phase changes within temperature ranges closed to those of humanthermal comfort in buildings [4]. Different inorganic as well as organic substances,
123
676 Int J Thermophys (2011) 32:674–692
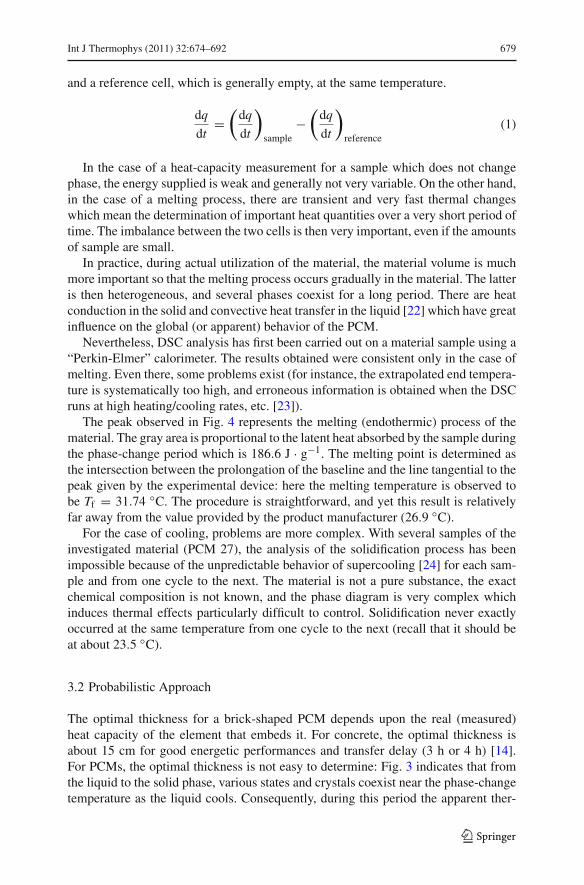
recently well reviewed by Zalba et al. [5], have been employed for the development ofPCMs: hydrated salts, inorganic eutectics, various non-eutectic mixtures of inorganicsubstances, fatty acids, organic eutectics, and paraffin waxes [3,5].
For the interested reader, excellent global reviews that pertain to phase-changematerials and their various applications were presented by Tyagi and Buddhi [2],Farid et al. [6], Sharma et al. [7], Zhang et al. [8], Regin et al. [9], Mondal [10], Sethiand Sharma [11], and especially the recent one by Verma et al. [12].
1.2 Difficulties
However, despite theoretical excellent performances, PCMs are often very difficult toimplement with effectiveness, due to very complex behaviors. One difficulty resides inan accurate knowledge of the relevant thermophysical properties of the materials, theappropriate methods to be used for adequate characterization, and the behavior withtime of the above-mentioned properties, i.e., their stability over numerous cycles.
Another difficulty is due to the scaling effect, i.e., the behavior of the materialencapsulated in large containers which may have properties that differ significantlyfrom those of the same material in microcapsules, for instance.
1.3 Contribution
This study presents the first results obtained at LGCgE in the context of the devel-opment of an original experimental characterization method for the determination ofphase change material thermophysical properties at nearly operating conditions.
2 Global Project
2.1 Composite Trombe Wall
The final objective is to insert these materials into a passive solar heat recovery compo-nent. The arrangement of the “composite Trombe wall” [13,14] is probably the systemwhich will be retained. This “variation” of the classical Trombe wall allows daily stor-age of solar energy in the building envelope and restitution later in the evening withthe possible control of air flux through a ventilated air layer (Fig. 1).
The advantage of this type of passive solar wall is an insulating partition whichallows, when necessary, to separate the massive storage wall from the heated roomand thus to control the use of the solar energy collected and stored via one ventilatedair layer. This concept ensures complete insulation of the building envelope in theevent of overcast conditions and at night.
Contrary to a window by which the solar contributions are instantaneous, the “com-posite TROMBE wall” allows the management of solar contributions via a storageelement located in the core of the device. This storage element is generally composedof one heavy (massive) material such as concrete, a strongly capacitive, and good, ifnot excellent, conductor of heat.
123

Int J Thermophys (2011) 32:674–692 677
Bricks filled with PCM Ventilated air layer
Closed air layer
Solar radiation
Glazing
Insulated partition
Fig. 1 Composite solar wall with PCM
The objective here is two-fold: reduce the size of the device in terms of occupiedvolume and mass, and provide heat at a constant temperature suitable for human com-fort. Smaller units allow more flexibility when it comes to installing the device inactual buildings whereas a small mass also has an effect on flexibility while reducingthe stress for high resistance structures. At a later stage, the objective is to producestandard units to be installed in residential and commercial buildings.
2.2 PCM Brick
To replace the traditional sensible heat storage element by PCMs, a commerciallyavailable hydrated salt-based PCM, engineered by Cristopia [5,15] and containedin polyolefin bricks, is employed. The value provided by the manufacturer for themelting point of the solid phase is Tf = 26.9 ◦C while the recrystallization orsolidification point is Ts = 23.5 ◦C. The phase-change material (hereafter calledPCM 27) is placed in rectangular-shaped bricks with the following dimensions:210 mm×140 mm×25 mm. These parallelepiped elements are about 1 kg each.To obtain overall one-dimensional heat transfer in the experimental device, the lateralfaces or edges are insulated with 10 cm thick polyurethane foam.
Nevertheless, this particular geometry enables two-dimensional and three-dimen-sional effects as shown in Figs. 2 and 3.
3 Materials Characterization
3.1 DSC Approach
Generally, phase-change materials are characterized by calorimetric methods such as“differential scanning calorimetry” (DSC) or “differential thermal analysis” (DTA)[16–18], which use very small quantities of the material. The DSC involves severaladvantages. The time required for a complete analysis is short, and the preparation of
123

678 Int J Thermophys (2011) 32:674–692
Liquid phase
Solid phase
Fig. 2 Melting process, visualization of two-dimensional and three-dimensional effects
Fig. 3 Solidification process, visualization of heterogeneous crystallization
the samples is easy. The device permits the analysis of many solid and liquid products[5]. Nevertheless, it also involves several disadvantages [19,20]. In particular, the lowmass of samples used in a DSC (some mg) may not be representative of the thermalbehavior of a larger size (scale effect) (see Figs. 2, 3). The wall-attachment effects canalso distort the measurements.
The DSC technique is derived from differential thermal analysis (DTA) whichbecame the reference method for thermal characterization of phase-change materials[21]. This equipment provides a heat flux (dq/dt)by the Joule effect which correspondsto the necessary power to maintain a “cell” containing the sample to be characterized
123
Int J Thermophys (2011) 32:674–692 679
and a reference cell, which is generally empty, at the same temperature.
dq
dt=
(dq
dt
)sample
−(
dq
dt
)reference
(1)
In the case of a heat-capacity measurement for a sample which does not changephase, the energy supplied is weak and generally not very variable. On the other hand,in the case of a melting process, there are transient and very fast thermal changeswhich mean the determination of important heat quantities over a very short period oftime. The imbalance between the two cells is then very important, even if the amountsof sample are small.
In practice, during actual utilization of the material, the material volume is muchmore important so that the melting process occurs gradually in the material. The latteris then heterogeneous, and several phases coexist for a long period. There are heatconduction in the solid and convective heat transfer in the liquid [22] which have greatinfluence on the global (or apparent) behavior of the PCM.
Nevertheless, DSC analysis has first been carried out on a material sample using a“Perkin-Elmer” calorimeter. The results obtained were consistent only in the case ofmelting. Even there, some problems exist (for instance, the extrapolated end tempera-ture is systematically too high, and erroneous information is obtained when the DSCruns at high heating/cooling rates, etc. [23]).
The peak observed in Fig. 4 represents the melting (endothermic) process of thematerial. The gray area is proportional to the latent heat absorbed by the sample duringthe phase-change period which is 186.6 J · g−1. The melting point is determined asthe intersection between the prolongation of the baseline and the line tangential to thepeak given by the experimental device: here the melting temperature is observed tobe Tf = 31.74 ◦C. The procedure is straightforward, and yet this result is relativelyfar away from the value provided by the product manufacturer (26.9 ◦C).
For the case of cooling, problems are more complex. With several samples of theinvestigated material (PCM 27), the analysis of the solidification process has beenimpossible because of the unpredictable behavior of supercooling [24] for each sam-ple and from one cycle to the next. The material is not a pure substance, the exactchemical composition is not known, and the phase diagram is very complex whichinduces thermal effects particularly difficult to control. Solidification never exactlyoccurred at the same temperature from one cycle to the next (recall that it should beat about 23.5 ◦C).
3.2 Probabilistic Approach
The optimal thickness for a brick-shaped PCM depends upon the real (measured)heat capacity of the element that embeds it. For concrete, the optimal thickness isabout 15 cm for good energetic performances and transfer delay (3 h or 4 h) [14].For PCMs, the optimal thickness is not easy to determine: Fig. 3 indicates that fromthe liquid to the solid phase, various states and crystals coexist near the phase-changetemperature as the liquid cools. Consequently, during this period the apparent ther-
123

680 Int J Thermophys (2011) 32:674–692
Fig. 4 Differential scanning calorimetry—DSC method application (5 ◦C · min−1)
mophysical properties of the material change significantly. Moreover, according tohistory of the material (the number of cycles), the crystallization or melting modesvary from one cycle to the next. This is why a probabilistic or statistical evaluation[24] of the thermophysical properties is necessary. An accurate knowledge of theseproperties is fundamental to correctly characterize the heat transfer in the wall and tohave sufficient control of it for optimum dimensioning and long-term operation [25].
Here, only the “apparent” behavior, in transfer and storage according to the princi-pal direction of energy transfer (from outdoor to indoor), will be considered thereafter,in the form of a one-dimensional model.
4 Experimental Device
The search for the overall thermophysical properties of PCMs called for the design,construction, and calibration of an original experimental device. Because of the samplegeometry, the apparatus should be designed for measurements of temperatures and heatfluxes at the predominant faces of the material (i.e., in the direction of heat transfer).Then, the thermophysical properties of the sample should be derived from these exper-imental data for temperatures and fluxes. Moreover, with the apparatus, one shouldalso be able to determine the heat exchanged during variations of the material ther-modynamic state between two temperature levels.
Figure 5 illustrates the principles of the experimental device that was designedand built at LGCgE. By imposing a temperature gradient between the two faces of the
123

Int J Thermophys (2011) 32:674–692 681
1. Insulation (foam) 2. Insulation (back) 3. PCM 4. Heat flux sensors (ϕ1) 5. Heat flux sensors (ϕ2) 6. Exchange plates 7. T1-ext (outside the brick) 8. T2-ext (outside the brick) 9. T1-int (in contact with PCM) 10. T2-int (in contact with PCM) 11. Thermo-regulated baths
10
2
1
4
6
3
ϕϕ > 0
81111
1
5
7
9
Fig. 5 Experimental device
sample, the experimental device allows determination of the apparent thermal conduc-tivity of the PCM bricks. The sample is installed vertically between two heat exchangealuminum plates. Thermo-regulated baths allow fast and fine regulation of the injectedwater temperature with a precision of about ±0.01 ◦C (Julabo Model F34 HE).
Squeezed between the exchange plates and the sample, on each of the twofaces, heat flux sensors and thermocouples (T-type) (diameter of 0.1 mm, sensitivity∼100 µV ·W−1 ·m2) inserted in the brick envelope are installed. The whole apparatusis maintained in place using a pneumatic jack, slightly tightened. The fluxmeters usedhere are special “tangential gradient heat fluxmeters” designed, built, calibrated, andused over a period of nearly 20 years at LGCgE [26]. Their thickness is about 0.2 mm,and their sensitivity about 45 µV · W−1 · m−2 for a sensor having an active surface of100 cm2. Over the years, these sensors were the subject of regular developments andimprovements making it possible to obtain highly reliable measurements [26].
These fluxmeters are calibrated, using planar electrical resistances with a size pre-cisely equal to those of the sensors. The calibration device [27] makes it possible tocalibrate these sensors with a precision of about ±3 %. The temperature measurementsare relative to a reference sensor located in the heart of a thermal sink that is very sta-ble in temperature. The various (different) sensors are connected to a multichannelmultimeter (Keithley 2700) adapted to low level signal measurements. Experimentaldata are taken and recorded at regular and adjustable steps of times (here 10 s).
123

682 Int J Thermophys (2011) 32:674–692
5 Measurements
Several materials were tested using the above-described device. The results presentedhere are solely for PCM 27 presented earlier (a mineral, containing potassium andcalcium chlorides).
5.1 Energy Storage
Initially, the material is isothermal and then it is suddenly heated by modifying thetemperature set point of the thermo-regulated baths. The material thus evolves fromthe temperature Tinitial to temperature Tend. Between these two states, the materialstores energy. The fluxmeters make it possible to measure the density of the heat fluxexchanged at the borders of the sample. The total stored energy can thus be estimatedby the following expression:
Q =tend∫
tinitial
[|ϕ1| + |ϕ2|] Sdt [J] (2)
where |ϕ1| + |ϕ2| is the cumulated density of the heat flux entering the sample (seeFig. 5). S is the lateral area where there is heat transfer between the brick and theexchange plates. The quantity “Q” can also be expressed by the following expression:
Q = msampCs�Ts + mpcm L + msampCl�Tl [J] (3)
where Cs and Cl are, respectively, the apparent heat capacity of the brick when thePCM is in the solid phase and in the liquid phase; �Ts is the temperature differ-ence between the melting point (27 ◦C) and Tinitial;�Tl is the temperature differencebetween Tend and the melting point (27 ◦C).
The first results are presented in Figs. 6 and 7. Temperatures are measured at thecenter of the external and internal faces of the brick envelope to take into account thethermal effect (resistance) of the material which contains the product (a polyolefinenvelope). The experiment consists first in imposing, on the sample, a constant tem-perature of 15 ◦C on each of its faces, until a thermal steady state corresponding toan isothermal material is obtained. Heat fluxes are then zero at the initial time t = 0.A null flux at both faces confirms that the thermal losses are negligible at the isolatedside faces. The experiment really starts at Tinitial; a sharp water temperature variationis imposed in the baths. This induces a thermal change of the system (storage) untilanother state of equilibrium is reached.
Figure 6 presents the variation of the heat storage of the sample in the solid phasefor a temperature range that varies from 15 ◦C to 20 ◦C, while Fig. 7 presents theresults for the transition from the solid-to-liquid phase when the temperature changesfrom 15 ◦C to 50 ◦C. Results for the liquid phase only have also been obtained and it isimportant to note that the behavior, despite the expected additional natural convective
123

Int J Thermophys (2011) 32:674–692 683
Fig. 6 Heat flux and temperature evolution of the solid phase (15 ◦C to 20 ◦C)
Fig. 7 Heat fluxes and temperature evolution from solid to liquid (15 ◦C to 50 ◦C)
heat transfer, is somewhat similar to the curves presented in Fig. 8, which presents theaverage values of the heat flux and temperature at the sample boundaries.
On the left-hand side of Fig. 6, one can notice, especially when considering the heatflux curve that the response time of the system is not instantaneous. As soon as theset point is changed from 15 ◦C to 20 ◦C, the heater starts and the heat flux increasesas more and more hot water heats the plates. But, as the material inertia plays a role,there is a period of a few minutes for which the temperature on the envelope (1-ext and
123

684 Int J Thermophys (2011) 32:674–692
Fig. 8 Average values of heat flux and temperature at the sample boundaries
2-ext) remains almost constant. Then, the temperature follows an asymptotic increasewhile the corresponding measured heat flux is decreasing.
The thermal evolution from 15 ◦C to 50 ◦C (Fig. 7) follows the complete meltingprocess, from the solid state to the liquid state during which a large quantity of heat hasbeen stored in the material. The selected initial and final temperatures are sufficientlyfar from the melting point range to consider that indeed the material is strictly in oneor the other state.
For the liquid and solid phases considered separately (prior to 15 min and afterabout 90 min), one can notice symmetrical behaviors of flows and temperatures corre-sponding to the result classically obtained with a solid material without phase change.The temperatures evolve in an asymptotic way to the set point after 90 min. It is alsonoted that the flux evolves very quickly at the beginning of the recording (sharp slopesfor about 15 min, until melting starts) and then approaches zero which corresponds toa new state of equilibrium obtained at the end of the test.
With regard to the variation between 15 ◦C and 50 ◦C (Fig. 7) during which there isthe phase period, one observes different behaviors between the temperatures measuredat the internal (1-int) and external (1-ext) faces of the “plastic” envelope. This is dueto the thermal resistance of “polyolefin” (thermal conductivity k ∼ 0.1 W ·m−1 ·K−1)
and to the very important latent heat absorption during the PCM melting which pro-duces a very important heat flux through the wall of the sample. Melting occurs, butit is shown that the polyolefin wall influences the two temperature curves. When theinner surface reaches the melting point, the outer surface is already above 35 ◦C, and asmelting starts close to the inner wall of the brick, the temperature curves flatten. Afterabout 90 min, most of the material is liquid and the temperature starts to increase morerapidly while the flux decreases correspondingly. A new thermal balance is reachedin a little more than 3 h. In the case of the variation from 40 ◦C to 50 ◦C, when the
123

Int J Thermophys (2011) 32:674–692 685
material is in the liquid state, the experimental curves obtained are similar to those forthe solid state. Internal convective heat transfer makes the determination of the realheat capacity of the PCM impossible but we can obtain a realistic value for the apparentheat capacity of the sample as a whole. In fact, this apparent value is the appropriateone for future characterizations and modeling of passive solar component behaviors.
Figure 7 shows that the heat stored is much more important than the sensible heattransfer. This confirms the interest in latent heat storage.
It is seen in Fig. 8 that the thermal behavior of the sample is very particular duringthe melting process. One clearly observes in this figure the different phases of thematerial evolution between a solid state at the start and the liquid state at the end.“Tint avg” is the average of temperatures measured on the inner sides of the envelope[Tint avg = (T1-int + T2-int)/2] and ϕavg, the average of the absolute values of fluxmeasurements [ϕavg = (|ϕ1| + |ϕ2|)/2].
First, Fig. 8 shows a short period of fast increase in the temperature (the curve tendsto being a straight line; cf. line 1), which corresponds to heat storage in the solid PCM.A second period of storage occurs as the temperature varies slowly from 26.5 ◦C (line2) to 32 ◦C, which corresponds to the latent heat storage. The surface temperaturereaches 32 ◦C as sensible heat transfer occurs near the wall to completely melt thecore of the brick which is still at 27 ◦C at this particular moment.
The change of the curve slope between heating of the solid phase and the begin-ning of melting is rather clear and thus gives a good indication on where melting islocated at 26.5 ◦C. From this point, gradually, the temperature on the external facesof the sample increase slowly whereas in the middle, the material continues to melt.The energy stored in this phase is to a large part latent heat which causes the meltingof the material, and in a much smaller proportion, the capacitive energy takes part inthe heating of the liquid and solid phases which coexist in a variable proportion ofthe briquette (material + envelope). At the end of this phase, in the neighborhood of32 ◦C, the capacitive heat overrides the latent one, the curve becomes deformed withtwo apparent slopes. Finally, a fast period of temperature increase (line 3) occurs forboth the liquid and envelope until stabilization at the final temperature set point whichis a period of sensible heat storage by the PCM in the liquid state.
The intersection between lines 1 and 2, thus, can define the beginning of the meltingof the PCM (26.5 ◦C) and the intersection between lines 2′ and 3 can define the endof melting (32 ◦C) with the material being entirely melted. If one adds up the heataccumulated between these two points, the latent heat of melting of the PCM can bedetermined.
For each test, the integration of the heat flux over time determines the amount ofheat stored during the process. Several tests were carried out to ensure reproducibilityof the experiments. Some results are reported in Table 1.
The estimated measurement uncertainty for the evaluation of the heat storage capac-ity is about 11 %. This value does not take into account possible variations due to thehistory of the thermal stresses imposed on the material. Here for every measurement, atest “zero” has been realized before tests 1 and 2. Next, when experiments gave aboutthe same results, this confirmed the reproducibility of the cyclic process. The errorestimated for the evaluation of the latent heat is of the same order of magnitude (about11 %).
123
686 Int J Thermophys (2011) 32:674–692
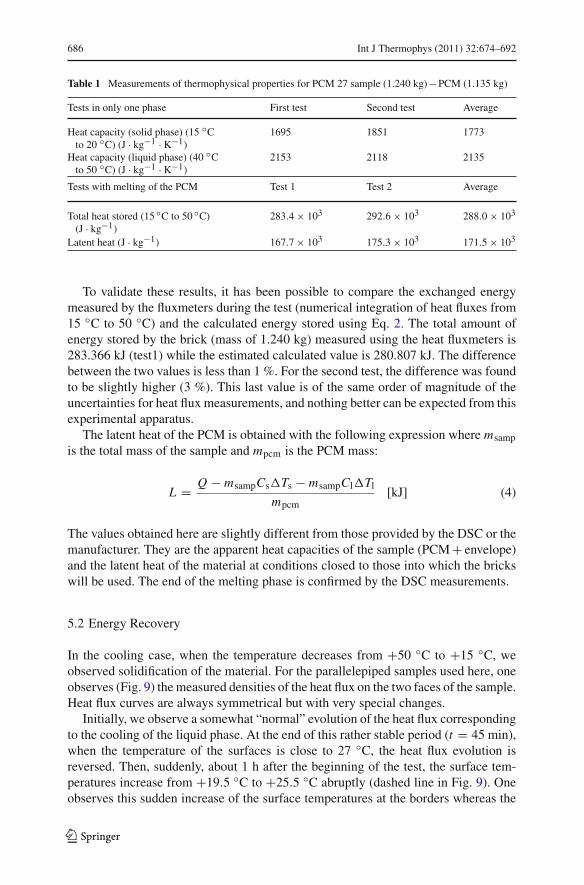
Table 1 Measurements of thermophysical properties for PCM 27 sample (1.240 kg)−PCM (1.135 kg)
Tests in only one phase First test Second test Average
Heat capacity (solid phase) (15 ◦Cto 20 ◦C) (J · kg−1 · K−1)
1695 1851 1773
Heat capacity (liquid phase) (40 ◦Cto 50 ◦C) (J · kg−1 · K−1)
2153 2118 2135
Tests with melting of the PCM Test 1 Test 2 Average
Total heat stored (15 ◦C to 50 ◦C)(J · kg−1)
283.4 × 10³ 292.6 × 10³ 288.0 × 10³
Latent heat (J · kg−1) 167.7 × 10³ 175.3 × 10³ 171.5 × 10³
To validate these results, it has been possible to compare the exchanged energymeasured by the fluxmeters during the test (numerical integration of heat fluxes from15 ◦C to 50 ◦C) and the calculated energy stored using Eq. 2. The total amount ofenergy stored by the brick (mass of 1.240 kg) measured using the heat fluxmeters is283.366 kJ (test1) while the estimated calculated value is 280.807 kJ. The differencebetween the two values is less than 1 %. For the second test, the difference was foundto be slightly higher (3 %). This last value is of the same order of magnitude of theuncertainties for heat flux measurements, and nothing better can be expected from thisexperimental apparatus.
The latent heat of the PCM is obtained with the following expression where msampis the total mass of the sample and mpcm is the PCM mass:
L = Q − msampCs�Ts − msampCl�Tl
mpcm[kJ] (4)
The values obtained here are slightly different from those provided by the DSC or themanufacturer. They are the apparent heat capacities of the sample (PCM + envelope)and the latent heat of the material at conditions closed to those into which the brickswill be used. The end of the melting phase is confirmed by the DSC measurements.
5.2 Energy Recovery
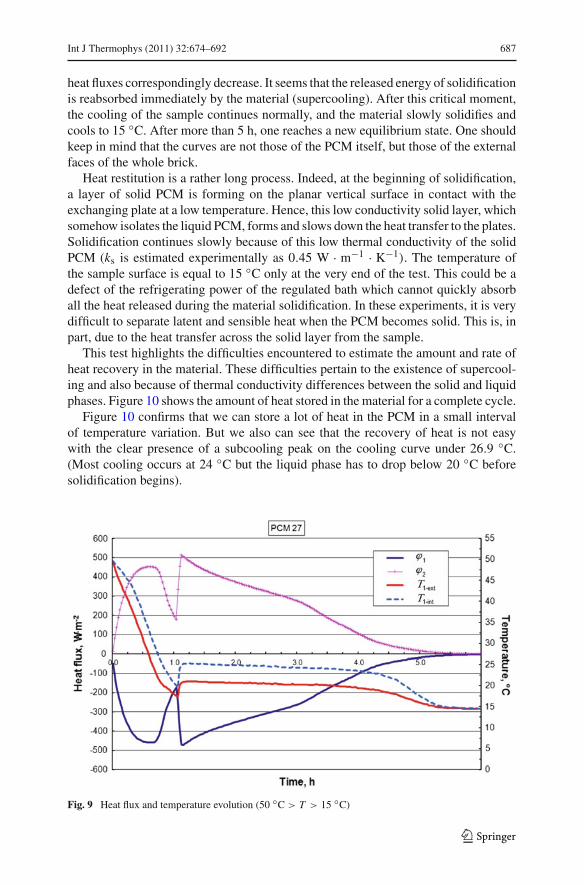
In the cooling case, when the temperature decreases from +50 ◦C to +15 ◦C, weobserved solidification of the material. For the parallelepiped samples used here, oneobserves (Fig. 9) the measured densities of the heat flux on the two faces of the sample.Heat flux curves are always symmetrical but with very special changes.
Initially, we observe a somewhat “normal” evolution of the heat flux correspondingto the cooling of the liquid phase. At the end of this rather stable period (t = 45 min),when the temperature of the surfaces is close to 27 ◦C, the heat flux evolution isreversed. Then, suddenly, about 1 h after the beginning of the test, the surface tem-peratures increase from +19.5 ◦C to +25.5 ◦C abruptly (dashed line in Fig. 9). Oneobserves this sudden increase of the surface temperatures at the borders whereas the
123
Int J Thermophys (2011) 32:674–692 687
heat fluxes correspondingly decrease. It seems that the released energy of solidificationis reabsorbed immediately by the material (supercooling). After this critical moment,the cooling of the sample continues normally, and the material slowly solidifies andcools to 15 ◦C. After more than 5 h, one reaches a new equilibrium state. One shouldkeep in mind that the curves are not those of the PCM itself, but those of the externalfaces of the whole brick.
Heat restitution is a rather long process. Indeed, at the beginning of solidification,a layer of solid PCM is forming on the planar vertical surface in contact with theexchanging plate at a low temperature. Hence, this low conductivity solid layer, whichsomehow isolates the liquid PCM, forms and slows down the heat transfer to the plates.Solidification continues slowly because of this low thermal conductivity of the solidPCM (ks is estimated experimentally as 0.45 W · m−1 · K−1). The temperature ofthe sample surface is equal to 15 ◦C only at the very end of the test. This could be adefect of the refrigerating power of the regulated bath which cannot quickly absorball the heat released during the material solidification. In these experiments, it is verydifficult to separate latent and sensible heat when the PCM becomes solid. This is, inpart, due to the heat transfer across the solid layer from the sample.
This test highlights the difficulties encountered to estimate the amount and rate ofheat recovery in the material. These difficulties pertain to the existence of supercool-ing and also because of thermal conductivity differences between the solid and liquidphases. Figure 10 shows the amount of heat stored in the material for a complete cycle.
Figure 10 confirms that we can store a lot of heat in the PCM in a small intervalof temperature variation. But we also can see that the recovery of heat is not easywith the clear presence of a subcooling peak on the cooling curve under 26.9 ◦C.(Most cooling occurs at 24 ◦C but the liquid phase has to drop below 20 ◦C beforesolidification begins).
Fig. 9 Heat flux and temperature evolution (50 ◦C > T > 15 ◦C)
123

688 Int J Thermophys (2011) 32:674–692
Fig. 10 Heat stored on temperature cycle (15 ◦C to +50 ◦C and then return to +15 ◦C)
5.3 Apparent Thermal Conductivity
In order to characterize the apparent thermal conductivity of the solid or liquid phases,the same device has been used with temperature variations on one face only (Figs. 11,12). The initial state of equilibrium (isothermal) is brought towards another state ofequilibrium where heat fluxes tend towards a non-null value corresponding to a tem-perature gradient between the two faces of the sample. Apparent thermal conductivitiesare calculated by the following equations:
Solid ks = ϕende
�Ts(5)
Liquid kl = ϕende
�Tl(6)
where the variables are defined in the nomenclature.Three tests were carried out on the material to check the reproducibility of the
measurements. The results were found to be satisfactory and gave median values ofthe apparent thermal conductivity of 0.6 W · m−1 · K−1 for the liquid and of 0.45 W ·m−1 · K−1 for the solid. The estimated cumulative error for the thermal-conductivitymeasurements with the proposed method and apparatus is about 10 %. This error isacceptable for our purpose but it should be mentioned that it mainly depends uponthe error in temperature measurements as the temperature differences used are small.Measurements of thermal conductivities were carried out for the following tempera-tures ranges: (8.5 ◦C to 13.5 ◦C); (14.5 ◦C to 19 ◦C), and (19.5 ◦C to 24 ◦C). The
123

Int J Thermophys (2011) 32:674–692 689
Fig. 11 Measurements with thermal variation on one side of the sample in the solid state (15 ◦C to 20 ◦C)
Fig. 12 Measurements with thermal variation on one side of the sample in the liquid state (40 ◦C to 50 ◦C)
values for the thermal conductivity, obtained for the solid state, were, respectively(0.45, 0.45, and 0.44) W · m−1 · K−1.
The difference is very small; however, one question arises. Is it the same for theapparent thermal conductivity of the liquid state despite natural convection within thebrick?
123

690 Int J Thermophys (2011) 32:674–692
Various measurements were then carried out having in mind the potential effectof natural convection in the liquid. Thermal-conductivity measurements in the liquidstate between (30 and 34) ◦C, (34.5 and 39) ◦C, and (39.5 and 44) ◦C, and thenfinally with a more important difference in temperature (to increase the convection)between (41 and 49) ◦C, were carried out. The estimated values are, respectively(0.57, 0.58, 0.60, and 0.62) W · m−1 · K−1. The results present a variation slightlygreater than 8 % among the thermal-conductivity measurements with a small increasewith respect to temperature and an increase when the temperature variation is moresignificant.
These results provide a better knowledge and control of the behavior of the materialunder the actual on-site conditions.
6 Conclusions
6.1 Summary
In this article, the first results obtained within the framework of a research programaimed at elaborating an original method to characterize the global or overall thermo-physical properties of selected brick-shaped phase change materials in real conditionsare presented.
Although these materials attract much interest as the current energy and economicconditions are favorable, their real characterization for several practical applicationsremains a problem.
In the case of materials with a phase period, it is a true asset to be able to measure inreal time the heat stored or released by the storage unit, particularly when the temper-ature varies very slightly about the melting point whereas the latent heat exchanged isvery high.
The determination of the heat flux is essential for a knowledge of the thermody-namic state of the material and its evolution over time.
Hence, this work proposes a method for the determination of the thermophysicalproperties of brick-shaped phase-change materials in either the liquid or the solid stateas well as during the phase change of the enclosed material when both phases coexistin its “envelope” or package.
The properties measured herein are the apparent thermal conductivity and the spe-cific heat in the solid and liquid states. The melting point and the latent heat werealso experimentally determined. The experimental method is based on heat flux andtemperature measurements at the boundaries of the material in the direction of thefluxes. It is carried out by inserting the test “brick” in contact with exchange plates atcontrolled known temperatures.
This study made it possible to highlight the influence of supercooling on the releaseand rate of release of the heat. Interest in the developed device lies in the reliabilityand repeatability of the measurements, the measurement of the overall behavior of theproperties of the macro-encapsulated PCM, and the low cost of the apparatus and itsoperation.
123

Int J Thermophys (2011) 32:674–692 691
Here, the determination of the thermophysical properties has been carried out forPCM 27 with a melting point close to normal comfort (ambient) temperatures. Theresults obtained here are very satisfactory when compared to the generic propertiesprovided by the manufacturer and show how this method can allow the study of com-plex-shaped materials embedding PCMs.
These flux and temperature measurements represent an additional experimentaldata source for the material package which can be used to supplement the traditionalmethods for a single material such as the calorimetric type (DSC) which can be usedwith very small amounts of pure material.
6.2 Future Work
In an upcoming project, the bricks of PCM will be inserted into a building wall andwill be subject to much more complex thermal challenges. The day–night cycles andsolar irradiation will replace the controlled environment and introduce sharply varyingheat fluxes. These new varying sources of heat transfer will determine the successivetransformations of the material. The data collected in these first experiments will hencebe quite useful for the interpretation of the results. The installation of optimal energymanagement systems and the development of tools for numerical simulations will thenallow the optimization of energy systems including PCMs.
Acknowledgments The authors are very grateful to ArtoisComm and the Nord-Pass de Ca Region forfinancing the Ph.D. thesis of Zohir Younsi.
References
1. A. Abhat, Sol. Energy 30, 313 (1983)2. V.V. Tyagi, D. Budhi, Renew. Sust. Energy Rev. 11, 1146 (2007)3. A.M. Khudhair, M.M. Farid, Energy Convers. Manage. 45, 263 (2004)4. N. Zhu, Z. Ma, S. Wang, Energy Convers. Manage. 50, 3169 (2009)5. B. Zalba, J.M. Marín, L.F. Cabeza, Appl. Therm. Eng. 23, 251 (2003)6. M.M. Farid, A.M. Khudhair, S.A.K. Razack, S. Al-Hallaj, Energy Convers. Manage. 45, 1597 (2004)7. A. Sharma, V.V. Tyagi, C.R. Chen, D. Buddhi, Renew. Sust. Energy Rev. 13, 318 (2009)8. Y. Zhang, G. Zhou, K. Lin, Q. Zhang, H. Di, Build. Environ. 42, 2197 (2007)9. A.F. Regin, S.C. Solanki, J.S. Saini, Renew. Sust. Energy Rev. 12, 2438 (2008)
10. S. Mondal, Appl. Therm. Eng. 28, 1536 (2008)11. V.P. Sethi, S.K. Sharma, Sol. Energy 82, 832 (2008)12. P. Verma, S. Varun, S.K. Singal, Renew. Sust. Energy Rev. 12, 999 (2008)13. L. Zalewski, S. Lassue, B. Duthoit, M. Butez, Build. Environ. 37, 109 (2002)14. L. Zalewski, M. Chantant, S. Lassue, B. Duthoit, Energy Build. 55, 8 (1997)15. Available from http://www.cristopia.com/english/products/indproducts.html, consulted 2010-03-15 to
obtain manufacturer’s parameters16. D. Banu, D. Feldman, D. Hawes, Thermochim. Acta 317, 39 (1998)17. M. Rady, Energy Convers. Manage. 50, 1210 (2009)18. D.P. Bentz, R. Turpin, Cem. Concr. Compos. 29, 527 (2009)19. Z. Yinping, J. Yi, Meas. Sci. Technol. 10, 201 (1999)20. F. Cordeiro Cavalcanti, Caractérisation thermique de produits de l’état liquide à l’état solide, Thèse de
Doctorat., Institut National des Sciences Appliquées de Lyon (2006)21. M.E. Brown, Handbook of Thermal Analysis and Calorimetry, vol. 2, 2nd edn. (Elsevier,
Amsterdam, 2003)
123
692 Int J Thermophys (2011) 32:674–692
22. G. Vidalain, L. Gosselin, M. Lacroix, Int. J. Heat Mass Transf. 52, 1753 (2009)23. B. He, V. Martin, F. Setterwall, Energy 29, 1785 (2004)24. J.F. Ehmimed, Y. Zeraouli, J.P. Dumas, A. Mimet, Int. J. Therm. Sci. 42, 33 (2003)25. U. Stritih, Int. J. Heat Mass Transf. 47, 2841 (2004)26. D. Leclercq, P. Thery, Rev. Sci. Instrum. 54, 374 (1983)27. S. Lassue, S. Guths, D. Leclercq, B. Duthoit, in Proceedings of 3rd Conf. on Experimental Heat
Transfer, Fluid Mechanics, and Thermodynamics (Hawaii, 1993), pp. 831–838
123