Thermodynamic analysis of the hydriding process of Mg–Ni alloys
12
L Journal of Alloys and Compounds 283 (1999) 213–224 Thermodynamic analysis of the hydriding process of Mg–Ni alloys * Kejun Zeng , T. Klassen, W. Oelerich, R. Bormann Institute of Materials Research, GKSS-Research Center, Max-Planck-Str., D-21502 Geesthacht, Germany Received 25 September 1998 Abstract A consistent set of thermodynamic functions for the Mg–Ni–H system has been developed from experimental data, and the Mg–Ni–H phase diagram has been calculated thermodynamically. The extended ternary solubility of hydrogen in Mg Ni, the ternary compound 2 phase Mg NiH , and the effect of Ni addition on the hydrogen solubility in molten magnesium have been modeled thermodynamically. 2 4 The ternary solid solution phases were extrapolated from the thermodynamic descriptions of the binary edge systems. The thermodynamic functions of the Mg–Ni–H system have been applied to study the hydriding process of Mg–Ni alloys. 1999 Elsevier Science S.A. All rights reserved. Keywords: Hydrogenation modelling; Mg–Ni alloys; Phase diagram calculations 1. Introduction phase relations in the alloy system is required. Therefore, a thermodynamic study of the phase diagrams of hydrogen- Magnesium-based alloys are considered to be the most containing Mg–Ni-based systems is currently being carried promising materials for hydrogen storage because of their out by our group in order to provide a basis for designing hydrogen-storage capacity, light weight, the abundance of new Mg–Ni-based hydrogen-storage alloys and to opti- magnesium in the earth’s crust, and low-cost compared mize their processing techniques. Based on the thermo- with alternative systems. Of all the magnesium-based dynamically assessed constituent binary systems, a thermo- alloys, Mg Ni is the most remarkable due to its relatively dynamic description of the Mg–Ni–H system is estab- 2 high capacity and favorable thermodynamics. It absorbs lished in the present work and applied to analyze the hydrogen at moderate temperatures and pressures and hydriding process of Mg–Ni alloys. forms a hydride, Mg NiH , which contains 3.6 wt.% 2 4 hydrogen [1]. The hydrogen absorption rate of pure magnesium is greatly improved by alloying with Ni due to 2. Experimental the catalytic activity of Ni [2]. However, to achieve a desorption pressure of 1 bar or more, as requested for 2.1. Ternary phases practical applications, Mg NiH has to be heated to at least 2 4 2408C. In order to make use of this compound at lower 2.1.1. t -Mg NiH 2 4 temperatures, ternary elements have been added to Mg Ni Of the two intermetallic compounds in the Mg–Ni 2 to improve its hydriding and dehydriding behavior [3–5]. system, MgNi does not react with H at pressures up to 2 2 However, the effects of these alloying additions on the 27.6 bar and temperatures up to 3508C. However, Mg Ni 2 stability of the hydride have not yet been clarified. reacts readily with H at 20.7 bar and 3258C [1]. The 2 For a better understanding of experimental results and product of the reaction is a ternary hydride, Mg NiH . 2 4 improvement of the alloy properties, knowledge of the After several hydriding and dehydriding cycles, it reacts thermodynamic stabilities of the alloy phases and their readily with H at pressures as low as 13.8 bar and 2 temperatures as low as 2008C. The reaction is reversible * Corresponding author. On leave from the Department of Physics, and upon decomposition the original starting material is Hunan University, 410082 Changsha, P.R. China. Present address: regenerated. Mg NiH can also be formed by the me- 2 4 Department of Electrical and Communications Engineering, Helsinki chanical alloying of pure magnesium and nickel powders University of Technology, FIN-02015 TKK, Finland. E-mail: [email protected] (3–5 mm particles) at 3108C in a hydrogen atmosphere of 0925-8388 / 99 / $ – see front matter 1999 Elsevier Science S.A. All rights reserved. PII: S0925-8388(98)00902-5
Transcript of Thermodynamic analysis of the hydriding process of Mg–Ni alloys

LJournal of Alloys and Compounds 283 (1999) 213–224
Thermodynamic analysis of the hydriding process of Mg–Ni alloys*Kejun Zeng , T. Klassen, W. Oelerich, R. Bormann
Institute of Materials Research, GKSS-Research Center, Max-Planck-Str., D-21502 Geesthacht, Germany
Received 25 September 1998
Abstract
A consistent set of thermodynamic functions for the Mg–Ni–H system has been developed from experimental data, and the Mg–Ni–Hphase diagram has been calculated thermodynamically. The extended ternary solubility of hydrogen in Mg Ni, the ternary compound2
phase Mg NiH , and the effect of Ni addition on the hydrogen solubility in molten magnesium have been modeled thermodynamically.2 4
The ternary solid solution phases were extrapolated from the thermodynamic descriptions of the binary edge systems. The thermodynamicfunctions of the Mg–Ni–H system have been applied to study the hydriding process of Mg–Ni alloys. 1999 Elsevier Science S.A. Allrights reserved.
Keywords: Hydrogenation modelling; Mg–Ni alloys; Phase diagram calculations
1. Introduction phase relations in the alloy system is required. Therefore, athermodynamic study of the phase diagrams of hydrogen-
Magnesium-based alloys are considered to be the most containing Mg–Ni-based systems is currently being carriedpromising materials for hydrogen storage because of their out by our group in order to provide a basis for designinghydrogen-storage capacity, light weight, the abundance of new Mg–Ni-based hydrogen-storage alloys and to opti-magnesium in the earth’s crust, and low-cost compared mize their processing techniques. Based on the thermo-with alternative systems. Of all the magnesium-based dynamically assessed constituent binary systems, a thermo-alloys, Mg Ni is the most remarkable due to its relatively dynamic description of the Mg–Ni–H system is estab-2
high capacity and favorable thermodynamics. It absorbs lished in the present work and applied to analyze thehydrogen at moderate temperatures and pressures and hydriding process of Mg–Ni alloys.forms a hydride, Mg NiH , which contains 3.6 wt.%2 4
hydrogen [1]. The hydrogen absorption rate of puremagnesium is greatly improved by alloying with Ni due to 2. Experimentalthe catalytic activity of Ni [2]. However, to achieve adesorption pressure of 1 bar or more, as requested for 2.1. Ternary phasespractical applications, Mg NiH has to be heated to at least2 4
2408C. In order to make use of this compound at lower 2.1.1. t-Mg NiH2 4
temperatures, ternary elements have been added to Mg Ni Of the two intermetallic compounds in the Mg–Ni2
to improve its hydriding and dehydriding behavior [3–5]. system, MgNi does not react with H at pressures up to2 2
However, the effects of these alloying additions on the 27.6 bar and temperatures up to 3508C. However, Mg Ni2
stability of the hydride have not yet been clarified. reacts readily with H at 20.7 bar and 3258C [1]. The2
For a better understanding of experimental results and product of the reaction is a ternary hydride, Mg NiH .2 4
improvement of the alloy properties, knowledge of the After several hydriding and dehydriding cycles, it reactsthermodynamic stabilities of the alloy phases and their readily with H at pressures as low as 13.8 bar and2
temperatures as low as 2008C. The reaction is reversible*Corresponding author. On leave from the Department of Physics, and upon decomposition the original starting material is
Hunan University, 410082 Changsha, P.R. China. Present address:regenerated. Mg NiH can also be formed by the me-2 4Department of Electrical and Communications Engineering, Helsinkichanical alloying of pure magnesium and nickel powdersUniversity of Technology, FIN-02015 TKK, Finland. E-mail:
[email protected] (3–5 mm particles) at 3108C in a hydrogen atmosphere of
0925-8388/99/$ – see front matter 1999 Elsevier Science S.A. All rights reserved.PI I : S0925-8388( 98 )00902-5
214 K. Zeng et al. / Journal of Alloys and Compounds 283 (1999) 213 –224
8 bar with a purity of 99.9995, because the dissociation amount of evolved hydrogen using gas chromatography.pressure is only 3 bar at this temperature [6]. Its actual X-ray diffraction measurements of the hydrogen dissolvedhydrogen stoichiometry is within the range 3.8–4.0 [1] or phase Mg NiH yielded the relation between the lattice2 12x
3.88–3.94 [7]. parameters of the hexagonal unit cell and the hydrogenThe hydride Mg NiH has two crystallographic forms, a content, from which the solubility limit of hydrogen in2 4
high temperature (HT) and a low temperature (LT) Mg Ni was determined to be 8.25 at.%, resulting in the2
modification. Thermal analysis of Mg NiH carried out in formula Mg NiH . Therefore, it can be accepted that the2 4 2 0.27
a thermobalance in a hydrogen atmosphere of 0.933 bar hydrogen solubility limit in the Mg NiH phase is about2 12x
revealed that the reversible transition LT↔HT occurred at 9 at.% in the temperature range around 3008C.220–2458C and the transition was not accompanied by any The effects of alloying elements on the hydrogenchange in the hydrogen composition for both structures solubilities in molten magnesium were investigated by[8]. However, another investigation found that the transi- Huang et al. [20]. Volumetric measurements were per-tion was due to a small composition change between the formed at 7008C. A sample of a Mg-based binary alloyLT and HT forms, as revealed by X-ray diffraction, with a given content of alloying element was placed in adifferential thermal analysis and thermogravimetry studies thin-walled reaction chamber of stainless steel filled with[9]. Noreus and Werner [10] reported that the phase hydrogen at a given pressure. The solubility of hydrogen intransformation of Mg NiH (HT) at 2358C was eutectoid, magnesium was calculated from the absorbed volume of2 4
producing not only Mg NiH (LT) but also a small amount hydrogen at standard temperature and pressure (08C and 12 4
of the less hydrogen containing phase Mg NiH (LT) with bar). It was found that the addition of nickel increased the2 y
y¯2. Many investigations have confirmed the transition hydrogen solubility in molten magnesium. The ternarytemperature to be around 2378C [7,9,11–16]. hydrogen solubility data in molten magnesium by Huang et
al. [20] were considered reliable in the present work2.1.2. Mg NiH because the binary hydrogen solubilities in magnesium2 12x
In addition to Mg NiH , four formulas that look like measured in the same work agree very well with other2 4
ternary Mg–Ni–H compounds have been reported in the works where similar experimental procedures were em-literature: Mg NiH [12], Mg NiH [16], Mg NiH [17], ployed (see Ref. [21]).2 0.3 2 2 1.2
and Mg NiH [18]. In fact, however, these phases are The formation and dissociation behavior of Mg NiH2 1.8 2 4
either stable hydrogen dissolved Mg Ni (Mg NiH ) or has been the topic of many investigations [22–25]. The2 2 0.3
metastable oversaturated phases (the other three), rather experimental pressure data obtained in these works are inthan new hydrides. In the present work, only the stable good agreement. Hysteresis behavior was observed, withhydrogen dissolved phase is considered and the formula the dissociation pressures being much lower than theMg NiH is used throughout the paper. formation pressures. The width of the hysteresis became2 12x
much smaller at lower temperatures. The width of the2.2. Phase equilibrium data hysteresis can also depend on the circumstances of the
respective measurement. If the kinetics of the reaction areNo ternary Mg–Ni–H phase diagram has been estab- slow, the time to reach equilibrium can be quite long.
lished in the literature so far. However, some phase Therefore, if the measurement points are taken too soon,equilibrium data have been reported. The ternary solu- the measured hysteresis will be larger. Consequently,bilities in the solid solution phases (Ni) and (Mg), the comparing different pressure–composition isotherms, theintermetallic compound MgNi , and the binary hydride smallest hysteresis is the most reliable. Reilly and Wiswall2
MgH are very limited and are neglected in this work. [1] determined the dissociation pressure of Mg NiH at2 2 4
From the pressure–composition isotherms of the temperatures from 274 to 3498C by measuring the pres-Mg Ni–Mg–H system, the ratio of hydrogen atoms sure–composition isotherms for the Mg Ni–H system.2 2 2 2
dissolved in the compound Mg Ni to metal atoms, H/ The Mg–Ni alloys were prepared in an induction furnace2
(Mg1Ni), was estimated to be about 0.1, i.e. the hydrogen under argon, then pulverized to 225 mesh, and introducedcontent of Mg NiH is about 9.09 at.%, in the tempera- into a stainless steel high-pressure reactor. The alloy2 12x
ture range 245–3908C [1,13]. Later, it was confirmed that a samples were hydrided by exposing them to H at about 242
hydrogen dissolved Mg NiH phase with formula bar and up to 3508C. The hydrided alloys were decom-2 12x
Mg NiH could be obtained by a conventional hydro- posed by reducing the H over-pressure through the use of2 |0.3 2
genation procedure [12,19]. Mintz et al. [11] studied the an evacuated gas reservoir or by outgassing under asolubility of hydrogen in Mg Ni by means of X-ray dynamic vacuum. The determined curve of the dissociation2
diffraction. Samples containing various amounts of hydro- pressure of Mg NiH lies between the curves of its2 4
gen were prepared by thermal decomposition of Mg NiH formation pressures and dissociation pressures determined2 4
at various hydrogen pressures below 0.92 bar. The hydro- by other groups [22–25]. The dissociation pressure data ofgen contents of the samples were determined by fusing the Reilly and Wiswall [1] were taken as the most reliablealloys at about 10008C and analyzing quantitatively the since the dissociation pressure of the binary hydride MgH2
K. Zeng et al. / Journal of Alloys and Compounds 283 (1999) 213 –224 215
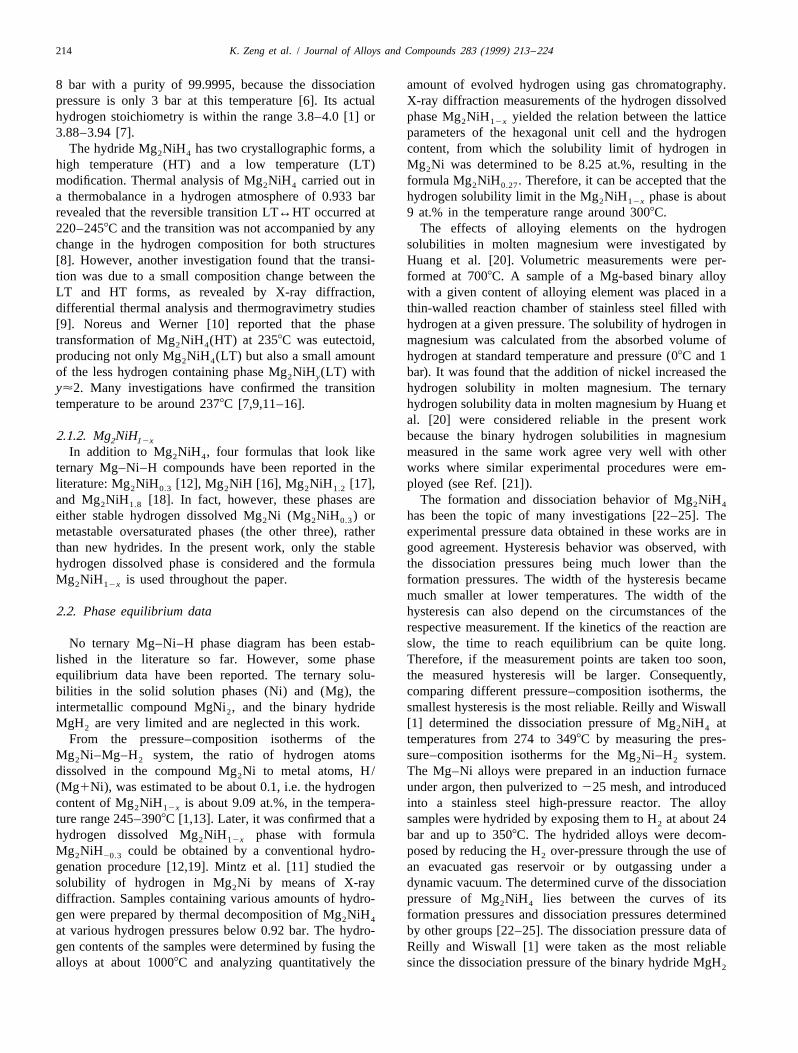
Table 1Thermodynamic properties of the Mg NiH phase measured by thermal analysis2 4
DH (kJ /mol-H ) Experimental conditions Ref.2
247.28 DSC under H flow, scanning rate unknown; dehydriding [8]221
256.0 DSC at P 5 27 bar, 208C min ; hydriding of Mg Ni, 200–4008C [28]H 22
259.0 DSC at P 5 9.9 bar, scanning rate unknown; dehydriding [29]H2
263.1 Isothermal calorimetry at P 5 6–8 bar, 3018C, average heat of formation from saturated g9-Mg NiH [24]H 2 12x2
268.063 Calorimetry at P 5 6–8 bar before LT→HT transition, H absorption of Mg Ni [7]H 2 2221
265.8 DTA at P 5 1.013 bar, 108C min , dehydriding [9,27]H2
measured in the same work agrees excellently with many hydrogen absorption of the intermetallic compound g-other experiments (see Ref. [21]). Mg Ni at 6–8 bar before the LT↔HT transition. The2
Using a similar experimental procedure, Buchner et al. measured value was 26863 kJ /mol-H . Taking into2
[26] measured the pressure–composition isotherms for the account the enthalpy for the LT↔HT transition and that(Mg Ni1Mg)–H system. The obtained dissociation for the Mg Ni1H →Mg NiH process (see paragraphs2 2 2 2 2 12x
pressures of Mg NiH are very close to the curve of Reilly below and Table 2), this value agrees very well with their2 4
and Wiswall [1]. The dissociation temperature of Mg NiH previous work [24] and the DTA measurements of Selvam2 4
was also measured at 1 atm hydrogen by other inves- et al. [9,27].tigators [8,9,14,27], but the temperatures were much higher Enthalpy values of the phase transition LT↔HT ofand seem to be less reliable. Mg NiH determined by means of DSC are collected in2 4
Table 2. Ono et al. [29] performed DSC measurements for2.3. Thermodynamic data several thermal cycles between 200 and 2508C. The
transition temperature varied around 2358C within a fewThe thermodynamic properties of Mg NiH have been degrees only and the heat of transition was measured to be2 4
studied by means of thermal analysis [7–9,24,27–29], but 4.14 kJ /mol-H with a deviation of 3%. Post and Murray2
the results are scattered (Table 1), with the data de- [7] carried out both up- and down-scan DSC with very lowtermined by DSC [8,28,29] being systematically much scanning rates. The data were taken from 68 scans with 11smaller. From DSC curves, Hirata [14] derived the en- samples. The enthalpy data for both up- and down-scansthalpies of hydriding at 30 bar and dehydriding at 1 bar of are very close and agree excellently with that of Ono et al.Mg–Ni alloys with different nickel contents. However, his [29]. The transition temperature by down-scan is 78Cdata are as small as about half of those values listed in lower than that by up-scan, indicating a small hysteresisTable 1. The reason for the small enthalpy data might be effect. This hysteresis effect was also observed in otherthat the reactions were not completed at the high scanning investigations [15,30].
21rate (208C min ). Post et al. [24] carried out isothermal The heat of hydrogen solution in the Mg Ni phase was2
calorimetry measurement of the heat of formation of the measured by Post et al. [24]. While the Mg Ni phase was2
Mg NiH phase at 3018C using twin-cell heat-conduction hydrided to Mg NiH with x¯0.8 (6.25 at.% H), the2 4 2 12x
calorimeters of Calvet–Tian design. Temperature and data corresponding heat exchange decreased smoothly fromacquisition were computer-controlled, which greatly facili- about 250 kJ /mol-H at initiation to 241 kJ /mol-H .2 2
tates achieving long term (10–50 days) isothermal stability When the hydrogen solubility in the formed Mg NiH2 12x
and voluminous data handling /storage /analysis require- phase was further increased to the stable maximum limit,ments when studying reactions of this type. The heat of the heat exchange was further reduced to about 234formation of HT t-Mg NiH from saturated g9- kJ /mol-H .2 4 2
Mg NiH in hydrogen of 6–8 bar was measured to be The enthalpy and entropy of the reaction Mg NiH 12 12x 2 12x
263.1 kJ /mol-H , close to the heat exchange when t was H ↔Mg NiH have been derived by many investigators2 2 2 4
dehydrided at 1.01 bar [9,27] (see Table 1). In another from the experimental desorption or absorption pressureswork, Post and Murray [7] measured heat exchange during (Table 3). A Japanese group [23,31,32] reported three
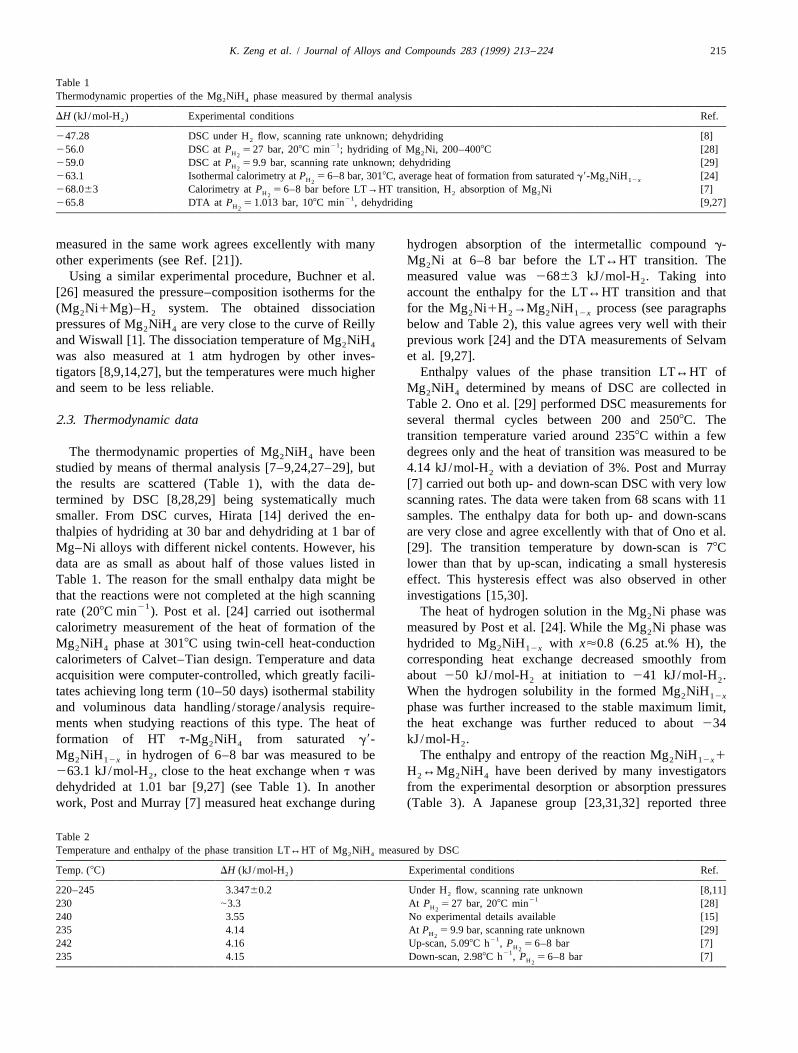
Table 2Temperature and enthalpy of the phase transition LT↔HT of Mg NiH measured by DSC2 4
Temp. (8C) DH (kJ /mol-H ) Experimental conditions Ref.2
220–245 3.34760.2 Under H flow, scanning rate unknown [8,11]221230 |3.3 At P 5 27 bar, 208C min [28]H2
240 3.55 No experimental details available [15]235 4.14 At P 5 9.9 bar, scanning rate unknown [29]H2
21242 4.16 Up-scan, 5.098C h , P 5 6–8 bar [7]H221235 4.15 Down-scan, 2.988C h , P 5 6–8 bar [7]H2
216 K. Zeng et al. / Journal of Alloys and Compounds 283 (1999) 213 –224
Table 3Thermodynamic properties of the Mg NiH phase derived from the experimental pressures (J, K, mol-H )2 4 2
DH DS Reaction Temperature range (8C) Ref.
264 43064184 2122.266.3 Desorption 274–349 [1]263 000 Desorption 302–356 [26]263 600 Desorption 220–320 [31]262 500 Desorption 220–320 [32]262 500 2119 Absorption 299–375 [22]264 600 2122 Desorption 299–350 [22]261 900 Absorption 220–320 [23]263 180 Desorption 259–320 [23]253 230 2104.67 Absorption 240–360 [25]272 850 2134.43 Desorption 240–360 [25]
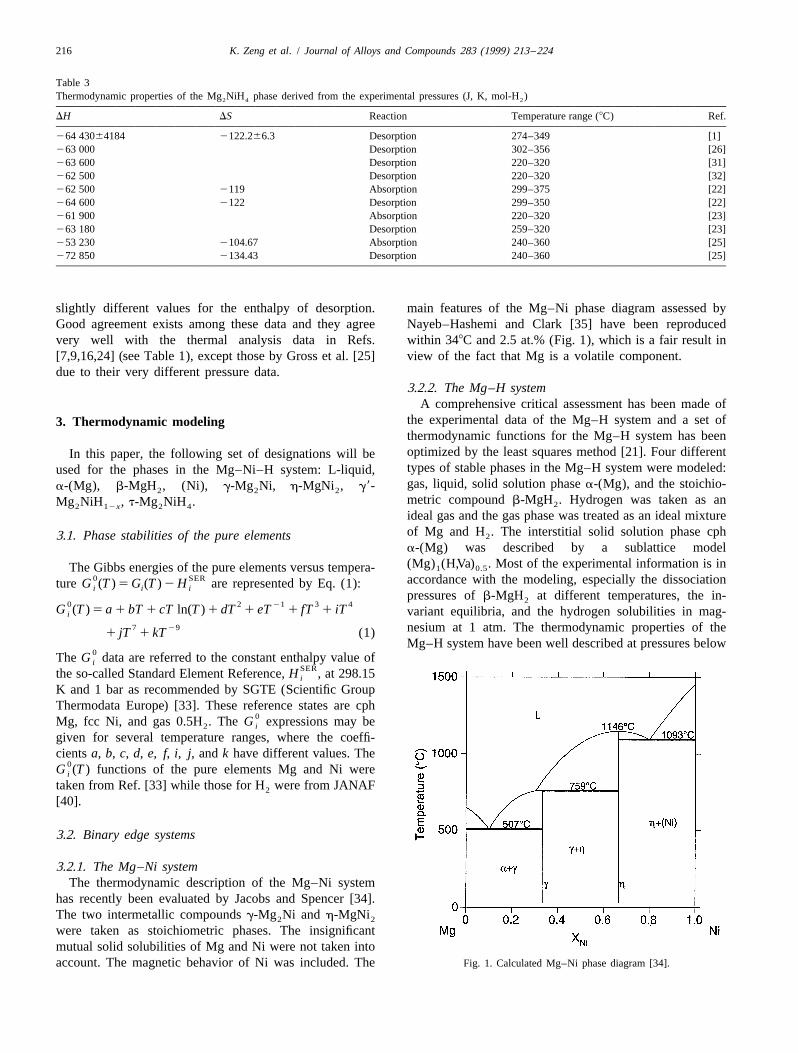
slightly different values for the enthalpy of desorption. main features of the Mg–Ni phase diagram assessed byGood agreement exists among these data and they agree Nayeb–Hashemi and Clark [35] have been reproducedvery well with the thermal analysis data in Refs. within 348C and 2.5 at.% (Fig. 1), which is a fair result in[7,9,16,24] (see Table 1), except those by Gross et al. [25] view of the fact that Mg is a volatile component.due to their very different pressure data.
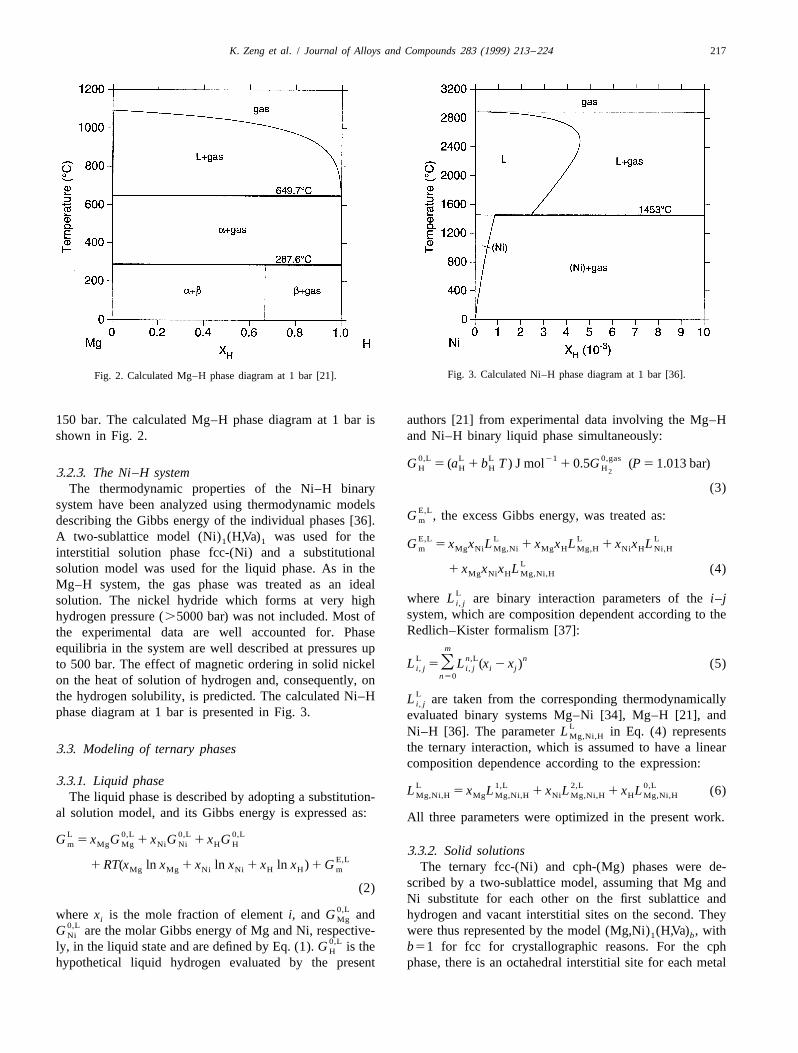
3.2.2. The Mg–H systemA comprehensive critical assessment has been made of
the experimental data of the Mg–H system and a set of3. Thermodynamic modelingthermodynamic functions for the Mg–H system has beenoptimized by the least squares method [21]. Four differentIn this paper, the following set of designations will betypes of stable phases in the Mg–H system were modeled:used for the phases in the Mg–Ni–H system: L-liquid,gas, liquid, solid solution phase a-(Mg), and the stoichio-a-(Mg), b-MgH , (Ni), g-Mg Ni, h-MgNi , g9-2 2 2metric compound b-MgH . Hydrogen was taken as anMg NiH , t-Mg NiH . 22 12x 2 4ideal gas and the gas phase was treated as an ideal mixtureof Mg and H . The interstitial solid solution phase cph23.1. Phase stabilities of the pure elementsa-(Mg) was described by a sublattice model(Mg) (H,Va) . Most of the experimental information is in1 0.5The Gibbs energies of the pure elements versus tempera-
0 SER accordance with the modeling, especially the dissociationture G (T ) 5 G (T ) 2 H are represented by Eq. (1):i i ipressures of b-MgH at different temperatures, the in-20 2 21 3 4G (T ) 5 a 1 bT 1 cT ln(T ) 1 dT 1 eT 1 fT 1 iT variant equilibria, and the hydrogen solubilities in mag-i
7 29 nesium at 1 atm. The thermodynamic properties of the1 jT 1 kT (1)Mg–H system have been well described at pressures below
0The G data are referred to the constant enthalpy value ofiSERthe so-called Standard Element Reference, H , at 298.15i
K and 1 bar as recommended by SGTE (Scientific GroupThermodata Europe) [33]. These reference states are cph
0Mg, fcc Ni, and gas 0.5H . The G expressions may be2 i
given for several temperature ranges, where the coeffi-cients a, b, c, d, e, f, i, j, and k have different values. The
0G (T ) functions of the pure elements Mg and Ni werei
taken from Ref. [33] while those for H were from JANAF2
[40].
3.2. Binary edge systems
3.2.1. The Mg–Ni systemThe thermodynamic description of the Mg–Ni system
has recently been evaluated by Jacobs and Spencer [34].The two intermetallic compounds g-Mg Ni and h-MgNi2 2
were taken as stoichiometric phases. The insignificantmutual solid solubilities of Mg and Ni were not taken intoaccount. The magnetic behavior of Ni was included. The Fig. 1. Calculated Mg–Ni phase diagram [34].
K. Zeng et al. / Journal of Alloys and Compounds 283 (1999) 213 –224 217
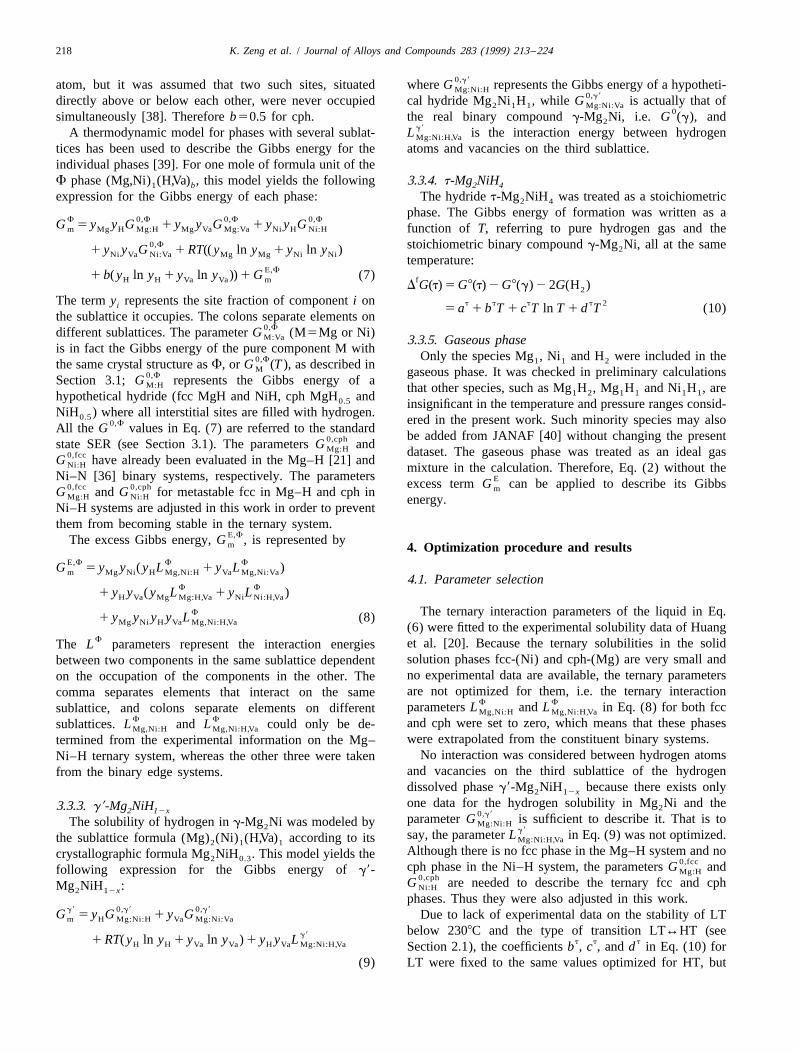
Fig. 3. Calculated Ni–H phase diagram at 1 bar [36].Fig. 2. Calculated Mg–H phase diagram at 1 bar [21].
150 bar. The calculated Mg–H phase diagram at 1 bar is authors [21] from experimental data involving the Mg–Hshown in Fig. 2. and Ni–H binary liquid phase simultaneously:
0,L L L 21 0,gasG 5 (a 1 b T ) J mol 1 0.5G (P 5 1.013 bar)H H H H23.2.3. The Ni–H system(3)The thermodynamic properties of the Ni–H binary
system have been analyzed using thermodynamic models E,LG , the excess Gibbs energy, was treated as:mdescribing the Gibbs energy of the individual phases [36].A two-sublattice model (Ni) (H,Va) was used for the E,L L L L1 1 G 5 x x L 1 x x L 1 x x Lm Mg Ni Mg,Ni Mg H Mg,H Ni H Ni,Hinterstitial solution phase fcc-(Ni) and a substitutional
Lsolution model was used for the liquid phase. As in the 1 x x x L (4)Mg Ni H Mg,Ni,H
Mg–H system, the gas phase was treated as an idealLwhere L are binary interaction parameters of the i–jsolution. The nickel hydride which forms at very high i, j
system, which are composition dependent according to thehydrogen pressure (.5000 bar) was not included. Most ofRedlich–Kister formalism [37]:the experimental data are well accounted for. Phase
mequilibria in the system are well described at pressures upL n,L nL 5OL (x 2 x ) (5)to 500 bar. The effect of magnetic ordering in solid nickel i, j i, j i j
n50on the heat of solution of hydrogen and, consequently, onLthe hydrogen solubility, is predicted. The calculated Ni–H L are taken from the corresponding thermodynamicallyi, j
phase diagram at 1 bar is presented in Fig. 3. evaluated binary systems Mg–Ni [34], Mg–H [21], andLNi–H [36]. The parameter L in Eq. (4) representsMg,Ni,H
the ternary interaction, which is assumed to have a linear3.3. Modeling of ternary phasescomposition dependence according to the expression:
3.3.1. Liquid phase L 1,L 2,L 0,LL 5 x L 1 x L 1 x L (6)Mg,Ni,H Mg Mg,Ni,H Ni Mg,Ni,H H Mg,Ni,HThe liquid phase is described by adopting a substitution-al solution model, and its Gibbs energy is expressed as: All three parameters were optimized in the present work.
L 0,L 0,L 0,LG 5 x G 1 x G 1 x Gm Mg Mg Ni Ni H H3.3.2. Solid solutions
E,L1 RT(x ln x 1 x ln x 1 x ln x ) 1 G The ternary fcc-(Ni) and cph-(Mg) phases were de-Mg Mg Ni Ni H H m
scribed by a two-sublattice model, assuming that Mg and(2)Ni substitute for each other on the first sublattice and
0,Lwhere x is the mole fraction of element i, and G and hydrogen and vacant interstitial sites on the second. Theyi Mg0,LG are the molar Gibbs energy of Mg and Ni, respective- were thus represented by the model (Mg,Ni) (H,Va) , withNi 1 b
0,Lly, in the liquid state and are defined by Eq. (1). G is the b51 for fcc for crystallographic reasons. For the cphH
hypothetical liquid hydrogen evaluated by the present phase, there is an octahedral interstitial site for each metal
218 K. Zeng et al. / Journal of Alloys and Compounds 283 (1999) 213 –224
0,g9atom, but it was assumed that two such sites, situated where G represents the Gibbs energy of a hypotheti-Mg:Ni:H0,g9directly above or below each other, were never occupied cal hydride Mg Ni H , while G is actually that of2 1 1 Mg:Ni:Va
0simultaneously [38]. Therefore b50.5 for cph. the real binary compound g-Mg Ni, i.e. G (g), and2g9A thermodynamic model for phases with several sublat- L is the interaction energy between hydrogenMg:Ni:H,Va
tices has been used to describe the Gibbs energy for the atoms and vacancies on the third sublattice.individual phases [39]. For one mole of formula unit of theF phase (Mg,Ni) (H,Va) , this model yields the following 3.3.4. t-Mg NiH1 b 2 4
expression for the Gibbs energy of each phase: The hydride t-Mg NiH was treated as a stoichiometric2 4
phase. The Gibbs energy of formation was written as aF 0,F 0,F 0,FG 5 y y G 1 y y G 1 y y Gm Mg H Mg:H Mg Va Mg:Va Ni H Ni:H function of T, referring to pure hydrogen gas and the
0,F stoichiometric binary compound g-Mg Ni, all at the same21 y y G 1 RT(( y ln y 1 y ln y )Ni Va Ni:Va Mg Mg Ni Ni temperature:E,F
1 b( y ln y 1 y ln y )) 1 G (7)H H Va Va m fD G(t) 5 G8(t) 2 G8(g) 2 2G(H )2
The term y represents the site fraction of component i on t t t t 2i 5 a 1 b T 1 c T ln T 1 d T (10)the sublattice it occupies. The colons separate elements on
0,Fdifferent sublattices. The parameter G (M5Mg or Ni)M:Va 3.3.5. Gaseous phaseis in fact the Gibbs energy of the pure component M with
Only the species Mg , Ni and H were included in the0,F 1 1 2the same crystal structure as F, or G (T ), as described inM gaseous phase. It was checked in preliminary calculations0,FSection 3.1; G represents the Gibbs energy of aM:H that other species, such as Mg H , Mg H and Ni H , are1 2 1 1 1 1hypothetical hydride (fcc MgH and NiH, cph MgH and0.5 insignificant in the temperature and pressure ranges consid-NiH ) where all interstitial sites are filled with hydrogen.0.5 ered in the present work. Such minority species may also0,FAll the G values in Eq. (7) are referred to the standard
be added from JANAF [40] without changing the present0,cphstate SER (see Section 3.1). The parameters G andMg:H dataset. The gaseous phase was treated as an ideal gas0,fccG have already been evaluated in the Mg–H [21] andNi:H mixture in the calculation. Therefore, Eq. (2) without theNi–N [36] binary systems, respectively. The parameters Eexcess term G can be applied to describe its Gibbs0,fcc 0,cph mG and G for metastable fcc in Mg–H and cph inMg:H Ni:H energy.Ni–H systems are adjusted in this work in order to preventthem from becoming stable in the ternary system.
E,FThe excess Gibbs energy, G , is represented bym 4. Optimization procedure and resultsE,F F FG 5 y y ( y L 1 y L )m Mg Ni H Mg,Ni:H Va Mg,Ni:Va
4.1. Parameter selectionF F
1 y y ( y L 1 y L )H Va Mg Mg:H,Va Ni Ni:H,Va
F The ternary interaction parameters of the liquid in Eq.1 y y y y L (8)Mg Ni H Va Mg,Ni:H,Va (6) were fitted to the experimental solubility data of HuangF et al. [20]. Because the ternary solubilities in the solidThe L parameters represent the interaction energies
solution phases fcc-(Ni) and cph-(Mg) are very small andbetween two components in the same sublattice dependentno experimental data are available, the ternary parameterson the occupation of the components in the other. Theare not optimized for them, i.e. the ternary interactioncomma separates elements that interact on the same
F Fparameters L and L in Eq. (8) for both fccsublattice, and colons separate elements on different Mg,Ni:H Mg,Ni:H,VaF F and cph were set to zero, which means that these phasessublattices. L and L could only be de-Mg,Ni:H Mg,Ni:H,Va
were extrapolated from the constituent binary systems.termined from the experimental information on the Mg–No interaction was considered between hydrogen atomsNi–H ternary system, whereas the other three were taken
and vacancies on the third sublattice of the hydrogenfrom the binary edge systems.dissolved phase g9-Mg NiH because there exists only2 12x
one data for the hydrogen solubility in Mg Ni and the3.3.3. g9-Mg NiH 22 12x 0,g9parameter G is sufficient to describe it. That is toThe solubility of hydrogen in g-Mg Ni was modeled by Mg:Ni:H2 g9say, the parameter L in Eq. (9) was not optimized.the sublattice formula (Mg) (Ni) (H,Va) according to its Mg:Ni:H,Va2 1 1Although there is no fcc phase in the Mg–H system and nocrystallographic formula Mg NiH . This model yields the2 0.3 0,fcccph phase in the Ni–H system, the parameters G andfollowing expression for the Gibbs energy of g9- Mg:H
0,cphG are needed to describe the ternary fcc and cphMg NiH : Ni:H2 12xphases. Thus they were also adjusted in this work.
g9 0,g9 0,g9G 5 y G 1 y G Due to lack of experimental data on the stability of LTm H Mg:Ni:H Va Mg:Ni:Va
below 2308C and the type of transition LT↔HT (seeg91 RT( y ln y 1 y ln y ) 1 y y L t t tH H Va Va H Va Mg:Ni:H,Va Section 2.1), the coefficients b , c , and d in Eq. (10) for
(9) LT were fixed to the same values optimized for HT, but
K. Zeng et al. / Journal of Alloys and Compounds 283 (1999) 213 –224 219
tcoefficient a was fitted to the enthalpy change of the molten magnesium has been well accounted for (see Fig.transition LT↔HT at 2358C. 6b).
The calculated enthalpy changes for different steps ofthe hydriding process of Mg Ni are compared with the2
4.2. Optimization experimental results in Table 5. The agreement is excel-lent. The calculated temperature-dependent enthalpy of
The Thermo-Calc program PARROT developed by dissociation of Mg NiH is compared in Fig. 7 with the2 4
Jansson [41] was used for the present optimization of the data derived from the experimental pressures. It agreesMg–Ni–H system. A stepwise optimization procedure was excellently with the value from Ref. [1], and the differ-designed to ensure the produced parameters were reason- ences from other values are within 2 kJ /mol-H . It is2
able. It was started by optimizing the thermodynamic worth noting that the calculated curve (full line) in Fig. 7functions of Mg NiH with respect to the dissociation corresponds to the dissociation equilibrium2 4
pressures in Refs. [1,23,26] and the enthalpy of formation Mg NiH ↔Mg NiH 1H , where the hydrogen solu-2 4 2 12x 2
of LT [7] and HT [24] by successively taking into account bility parameter x is pressure-dependent and thus tem-the parameters a through d in Eq. (10). The obtained perature-dependent. This curve demonstrates that the
0,g9 thermodynamic modeling method (also called the CAL-parameters were then modified when G in Eq. (9)Mg:Ni:H
PHAD method) employed in the present work is a verywas optimized to fit the hydrogen solubility in saturatedpowerful tool for analyzing the thermodynamic propertiesMg NiH at 2978C [1] and the solution enthalpy at2 12x
of a metal–hydrogen system from the equilibrium3018C [24]. Individual values were assigned to the parame-0,fcc 0,cph pressures, as indicated in another paper by the presentters G and G , so that the Mg–H fcc and Ni–H cphMg:H Ni:H
authors [36].phases became metastable in the temperature and pressureranges of interest. Finally, the whole system was optimizedusing all the selected experimental data simultaneously.
5. Analysis of the hydriding process of Mg–Ni alloysThe parameters already obtained were changed slightly inthis final step to achieve the best overall fit.
It can be concluded from Section 4.3 that the thermo-dynamic dataset in Table 4 accounts very well for the
4.3. Results and discussion experimental dissociation pressures of t-Mg NiH , solu-2 4
bilities in molten magnesium and g9-Mg NiH , and the2 12x
The thermodynamic parameters resulting from this least thermodynamic properties of hydriding and dehydriding ofsquares procedure are given in Table 4. The equilibrium the intermetallic compound Mg Ni. In addition, the2
(dissociation or formation) pressure of Mg NiH calcu- thermodynamic description of the Mg–Ni–H system can2 4
lated using these parameters is compared with the ex- be applied to analyze the hydriding and dehydridingperimental formation and dissociation pressures in Fig. 4, processes of Mg–Ni binary alloys.where, of the three sets of data of a Japanese group It was observed that when a Mg–Ni binary alloy with[23,31,32], only that from Ref. [23] was plotted since the the phase mixture of a-(Mg)1Mg Ni was hydrided, the2
three sets of data are very close. The calculated curve first hydride formed was MgH rather than Mg NiH2 2 4
agrees excellently with the experimental results of Reilly [1,26,31]. Later, Post et al. [24] studied the details of theand Wiswall [1] and lies between the experimental curves hydriding process of the alloy Mg Ni (Mg–29.24 at.%2.42
for formation and dissociation measured in Refs. [22–25]. Ni) at 3018C, which consisted of a-(Mg) and Mg Ni2
Reilly and Wiswall [1] measured the dissociation pres- phases. It was found that in the beginning the Mg Ni phase2
sure of Mg NiH to be 3.28 bar at 2998C and, as already was hydrided to g9-Mg NiH (6.25 at.% H). Then the2 4 2 0.2
mentioned in Section 2.1, estimated the hydrogen content a-(Mg) phase reacted with hydrogen to form the mag-of saturated g9-Mg NiH as 9.09 at.%. The vertical nesium hydride MgH . After the a-phase was consumed,2 12x 2
section of the Mg–Ni–H phase diagram at 3.28 bar the previously formed g9-Mg NiH was further hydrided2 0.2
through the line from g-Mg Ni to hydrogen, i.e. the to g9-Mg NiH (7.98 at.% H) before the ternary hydride2 2 0.26
pseudobinary Mg Ni–H system, has been calculated in Mg NiH appeared (For more details, readers are referred2 2 4
Fig. 5 using the optimized parameters. The hydrogen to Ref. [24]).solubility in the saturated g9-Mg NiH phase is calcu- At 3018C, the dissociation or formation pressure of2 12x
lated to be 9.07 at.%. The dissociation temperature of t-Mg NiH is calculated to be 3.47 bar by using the2 4
Mg NiH is predicted at 298.68C, very close to the parameters in Table 4. At this pressure and temperature,2 4
experimentally measured 2998C by Reilly and Wiswall [1]. the isothermal section of the Mg–Ni–H phase diagram isThe calculated isothermal section of the Mg–Ni–H calculated in Fig. 8. This diagram gives interesting in-
phase diagram at 7008C and 1 bar is shown in Fig. 6a. The formation on the hydriding of Mg–Ni binary alloys. Whenhydrogen solubility in Mg Ni is predicted to be 1.6 at.%. a Mg–Ni alloy with less than 33.3 at.% Ni is exposed to2
The effect of nickel addition on the hydrogen solubility in hydrogen at 3018C and 3.47 bar, which is represented by
220 K. Zeng et al. / Journal of Alloys and Compounds 283 (1999) 213 –224
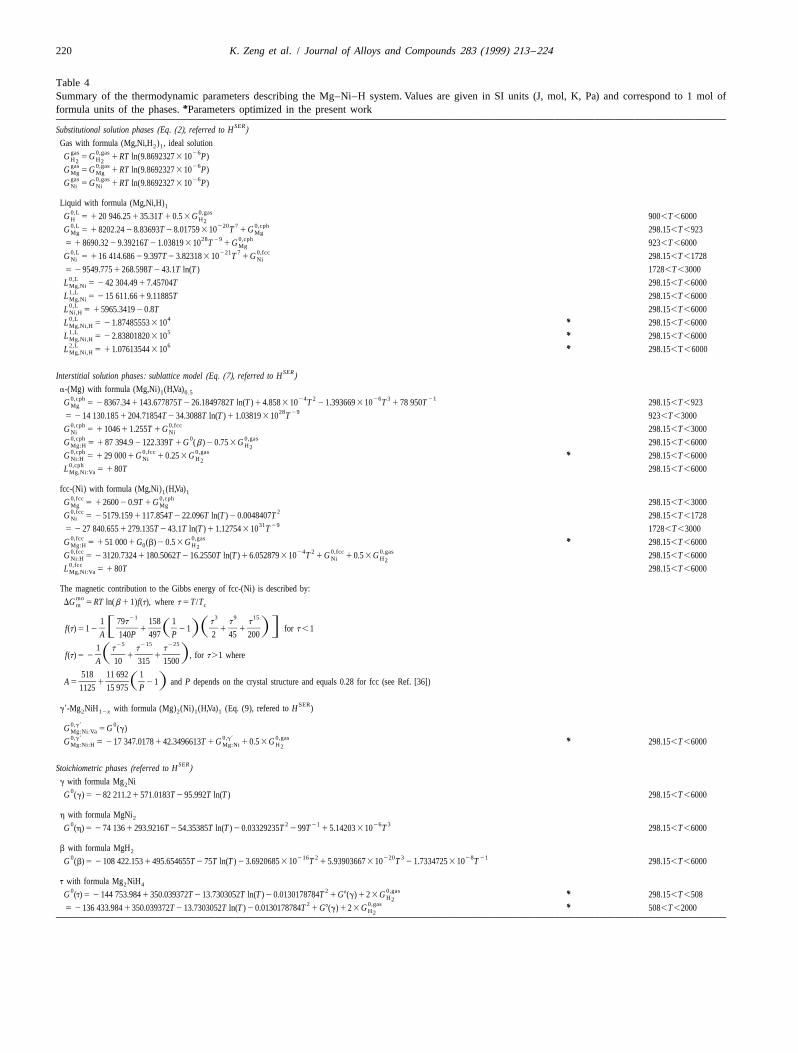
Table 4Summary of the thermodynamic parameters describing the Mg–Ni–H system. Values are given in SI units (J, mol, K, Pa) and correspond to 1 mol of
*formula units of the phases. Parameters optimized in the present work
SERSubstitutional solution phases (Eq. (2), referred to H )Gas with formula (Mg,Ni,H ) , ideal solution2 1
gas 0,gas 26G 5 G 1 RT ln(9.8692327 3 10 P)H H2 2gas 0,gas 26G 5 G 1 RT ln(9.8692327 3 10 P)Mg Mggas 0,gas 26G 5 G 1 RT ln(9.8692327 3 10 P)Ni Ni
Liquid with formula (Mg,Ni,H)10,L 0,gasG 5 1 20 946.25 1 35.31T 1 0.5 3 G 900,T ,6000H H20,L 220 7 0,cphG 5 1 8202.24 2 8.83693T 2 8.01759 3 10 T 1 G 298.15,T ,923Mg Mg
28 29 0,cph5 1 8690.32 2 9.39216T 2 1.03819 3 10 T 1 G 923,T ,6000Mg
0,L 221 7 0,fccG 5 1 16 414.686 2 9.397T 2 3.82318 3 10 T 1 G 298.15,T ,1728Ni Ni
5 2 9549.775 1 268.598T 2 43.1T ln(T ) 1728,T ,30000,LL 5 2 42 304.49 1 7.45704T 298.15,T ,6000Mg,Ni1,LL 5 2 15 611.66 1 9.11885T 298.15,T ,6000Mg,Ni0,LL 5 1 5965.3419 2 0.8T 298.15,T ,6000Ni,H0,L 4L 5 2 1.87485553 3 10 * 298.15,T ,6000Mg,Ni,H1,L 5L 5 2 2.83801820 3 10 * 298.15,T ,6000Mg,Ni,H2,L 6L 5 1 1.07613544 3 10 * 298.15,T, 6000Mg,Ni,H
SERInterstitial solution phases: sublattice model (Eq. (7), referred to H )a-(Mg) with formula (Mg,Ni) (H,Va)1 0.5
0,cph 24 2 26 3 21G 5 2 8367.34 1 143.677875T 2 26.1849782T ln(T ) 1 4.858 3 10 T 2 1.393669 3 10 T 1 78 950T 298.15,T ,923Mg28 29
5 2 14 130.185 1 204.71854T 2 34.3088T ln(T ) 1 1.03819 3 10 T 923,T ,30000,cph 0,fccG 5 1 1046 1 1.255T 1 G 298.15,T ,3000Ni Ni0,cph 0 0,gasG 5 1 87 394.9 2 122.339T 1 G (b ) 2 0.75 3 G 298.15,T ,6000Mg:H H20,cph 0,fcc 0,gasG 5 1 29 000 1 G 1 0.25 3 G * 298.15,T ,6000Ni:H Ni H20,cphL 5 1 80T 298.15,T ,6000Mg,Ni:Va
fcc-(Ni) with formula (Mg,Ni) (H,Va)1 10,fcc 0,cphG 5 1 2600 2 0.9T 1 G 298.15,T ,3000Mg Mg0,fcc 2G 5 2 5179.159 1 117.854T 2 22.096T ln(T ) 2 0.0048407T 298.15,T ,1728Ni
31 295 2 27 840.655 1 279.135T 2 43.1T ln(T ) 1 1.12754 3 10 T 1728,T ,3000
0,fcc 0,gasG 5 1 51 000 1 G (b) 2 0.5 3 G * 298.15,T ,6000Mg:H 0 H20,fcc 24 2 0,fcc 0,gasG 5 2 3120.7324 1 180.5062T 2 16.2550T ln(T ) 1 6.052879 3 10 T 1 G 1 0.5 3 G 298.15,T ,6000Ni:H Ni H20,fccL 5 1 80T 298.15,T ,6000Mg,Ni:Va
The magnetic contribution to the Gibbs energy of fcc-(Ni) is described by:mo
DG 5 RT ln(b 1 1)f(t), where t 5 T /Tm c
21 3 9 151 79t 158 1 t t t]F] ] ] S] ] ]DGf(t) 5 1 2 1 2 1 1 1 for t , 1S DA 140P 497 P 2 45 200
25 215 2251 t t t]S] ] ]Df(t) 5 2 1 1 , for t .1 whereA 10 315 1500
518 11 692 1] ]] ]A 5 1 2 1 and P depends on the crystal structure and equals 0.28 for fcc (see Ref. [36])S D1125 15 975 P
SERg9-Mg NiH with formula (Mg) (Ni) (H,Va) (Eq. (9), refered to H )2 12x 2 1 1
0,g9 0G 5 G (g)Mg:Ni:Va0,g9 0,g9 0,gasG 5 2 17 347.0178 1 42.3496613T 1 G 1 0.5 3 G * 298.15,T ,6000Mg:Ni:H Mg:Ni H2
SERStoichiometric phases (referred to H )g with formula Mg Ni2
0G (g) 5 2 82 211.2 1 571.0183T 2 95.992T ln(T ) 298.15,T ,6000
h with formula MgNi20 2 21 26 3G (h) 5 2 74 136 1 293.9216T 2 54.35385T ln(T ) 2 0.03329235T 2 99T 1 5.14203 3 10 T 298.15,T ,6000
b with formula MgH20 216 2 220 3 28 21G (b) 5 2 108 422.153 1 495.654655T 2 75T ln(T ) 2 3.6920685 3 10 T 1 5.93903667 3 10 T 2 1.7334725 3 10 T 298.15,T ,6000
t with formula Mg NiH2 40 2 0,gasG (t) 5 2 144 753.984 1 350.039372T 2 13.7303052T ln(T ) 2 0.0130178784T 1 G8(g) 1 2 3 G * 298.15,T ,508H2
2 0,gas5 2 136 433.984 1 350.039372T 2 13.7303052T ln(T ) 2 0.0130178784T 1 G8(g) 1 2 3 G * 508,T ,2000H2

K. Zeng et al. / Journal of Alloys and Compounds 283 (1999) 213 –224 221
Table 4. Continued.
Symbols0,gas 2 27 3 21G 5 2 9522.9741 1 78.5273879T 2 31.35707T ln(T ) 1 0.0027589925T 2 7.46390667 3 10 T 1 56 582.3T 298.15,T ,1000H2 2 27 3 21
5 1 180.108664 2 15.6128256T 2 17.84857T ln(T ) 2 0.00584168T 1 3.14618667 3 10 T 2 1 280 036T 1000,T ,21002 28 3 21
5 2 18 840.1663 1 92.3120255T 2 32.05082T ln(T ) 2 0.0010728235T 1 1.14281783 3 10 T 1 3 561 002.5T 2100,T ,60000,gas 24 2 28 3 21G 5 1140 825.883 2 8.26177982T 2 20.96302T ln(T )11.331861 3 10 T 2 1.51554617 3 10 T 15221.91T 298,T ,2900Mg
2 27 3 215 1 141 959.02 1 20.1923541T 2 25.1271T ln(T ) 1 0.002179723T 2 1.502275 3 10 T 2 3 744 678T 2900,T ,5400
2 27 3 8 215 1 458 455.469 2 794.05688T 1 70.54811T ln(T ) 2 0.010649025T 1 1.716475 3 10 T 2 1.996814 3 10 T 5400,T ,9200
24 2 28 35 2 315 972.848 1 423.179252T 2 63.73726T ln(T ) 2 2.847232 3 10 T 1 2.15099667 3 10 T 1 6.39436 3
8 2110 T 9200,T ,100000,gas 2 26 3G 5 1 423 093.837 2 21.4865718T 2 24.34001T ln(T ) 1 0.0046806645T 2 3.40084167 3 10 T 298,T ,400Ni
2 26 35 1 423 608.318 2 43.639632T 2 20.26685T ln(T ) 2 0.006038615T 1 1.2890125 3 10 T 400,T ,800
2 27 3 215 1 419 186.797 1 15.6323651T 2 29.24746T ln(T ) 1 0.0021365025T 2 1.14496517 3 10 T 1 412 765.95T 800,T ,2600
2 28 3 215 1 419 346.214 1 9.07992226T 2 28.29857T ln(T ) 1 0.001646801T 2 7.78248167 3 10 T 1 785 084T 2600,T ,5000
2 27 35 1 414 475.627 1 36.7731872T 2 31.80175T ln(T ) 1 0.0024133565T 2 1.0515525 3 10 T 5000,T ,6000
the dashed line between the alloy and hydrogen in Fig. 8, overall composition of the sample reaches C, the hydrogenthe hydrogen atoms are first dissolved in the g-Mg Ni content in g9 approaches the saturation limit g9-Mg NiH2 2 0.3
phase to g9-Mg NiH (point a in Fig. 8, 6.85 at.% H). (b in Fig. 8). Then, the ternary hydride t-Mg NiH starts2 0.22 2 4
Then magnesium in the a-(Mg) phase starts to react with to form. Thus, g-Mg Ni is hydrided to its full capacity for2
hydrogen to form the hydride b-MgH and the overall hydrogen in two separate steps and the reaction sequences2
composition of the sample enters through point A into the of a Mg–Ni alloy containing less than 33 at.% Ni witha1b1g9 three-phase region. This step is controlled by the hydrogen are as follows:diffusion of hydrogen atoms in the formed outer layer of
(i) Mg Ni 1 H → Mg NiHg9-Mg NiH . If the diffusion of hydrogen atoms in this 2 2 2 12x92 0.22
layer was extremely slow, the hydrogen atoms wouldaccumulate in the surface area and the g-Mg Ni phase2 (ii) (Mg) 1 H → MgH2 2would be hydrided directly into t-Mg NiH , but this seems2 4
not to be the case [24].(iii) Mg NiH 1 H → Mg NiH2 12x9 2 2 12xAfter the a-(Mg) phase is consumed at B, the hydriding
proceeds with the previously formed g9-Mg NiH being2 0.22
further hydrided in the b1g9-phase region. When the (iv) Mg Ni 1 H → Mg NiH2 12x 2 2 4
Fig. 4. Calculated equilibrium pressure over Mg NiH versus tempera- Fig. 5. Calculated vertical section of the Mg–Ni–H phase diagram2 4
ture, in comparison with both the experimental dissociation and formation through the Mg Ni–H line at 3.28 bar, showing hydrogen solubility in2
pressures from the literature. saturated g9-Mg NiH .2 12x

222 K. Zeng et al. / Journal of Alloys and Compounds 283 (1999) 213 –224
Fig. 7. Calculated enthalpy of dissociation of Mg NiH (———) to2 4
saturated g9-Mg NiH , compared with literature data derived from the2 12x
dissociation pressures of Mg NiH (- - -).2 4
Fig. 6. Calculated isothermal section of the Mg–Ni–H phase diagram at7008C and 1 bar. (a) The entire section. (b) An enlarged view of the Mgcorner in (a), showing the agreement of the calculation with theexperimental results with respect to the effects of nickel addition on the
Fig. 8. Calculated isothermal section at 3018C and 3.47 bar. The hydrogenhydrogen solubilities in molten magnesium.solubility in the saturated g9-Mg NiH phase, when Mg NiH de-2 12x 2 4
composes, is calculated to be 9.14 at.%, as shown by point b.
where x950.78, x50.7 at 3018C, compared with theexperimental data of 0.8 and 0.74, respectively, by Post et Therefore, the present calculations can predict all theal. [24]. The smaller hydrogen solubilities in g9- four steps of the hydriding process of an alloy with lessMg NiH observed experimentally could be attributed to than 33.3 at.% Ni and agree with experiments on that, even2 12x
the diffusion kinetics of hydrogen in g9. though b-MgH contains more hydrogen than t-Mg NiH ,2 2 4
Table 5Comparison between calculated and experimental enthalpy changes of hydriding processes
Reaction Temp. (8C) DH (kJ /mol-H ) DH (kJ /mol-H ) Ref.calc 2 exp 2
Mg Ni1H →g9-Mg NiH 301 234.7 234 [24]2 2 2 0.3
g9-Mg NiH 1H →Mg NiH 301 264.36 263.1 [24]2 0.3 2 2 4
282 264.6 265.8 [27]Mg Ni1H →Mg NiH 234 267.2 26863 [7]2 2 2 4
HT→LT 235 24.25 24.15 [7,29]

K. Zeng et al. / Journal of Alloys and Compounds 283 (1999) 213 –224 223
required to determine the thermodynamic properties of thelow temperature form of t-Mg NiH .2 4
(2) The present thermodynamic description of the Mg–Ni–H system can well account for the hydriding process ofMg–Ni alloys with less than 33.3 at.% Ni. The hydridingpath of such an alloy is: alloy → g9-Mg NiH → MgH → g9-Mg NiH → t-Mg NiH ,2 12x9 2 2 12x 2 4
where x9.x$0.7. The reason why MgH forms before2
Mg NiH in these alloys is that the chemical potential of2 4
hydrogen in MgH is much more negative than in2
Mg NiH .2 4
References
[1] J.J. Reilly, R.H. Wiswall, Inorg. Chem. 7 (1968) 2254.[2] F.G. Eisenberg, D.A. Zagnoli, J.J.S. III, J. Less-Common Met. 74
(1980) 323.[3] J.-P. Darnaudery, M. Pezat, B. Darriet, J. Less-Common Met. 92Fig. 9. Predicted phase stability diagram of the Mg–Ni–H system at
(1983) 199.3018C and 3.47 bar.[4] D. Lupu, A. Biris, E. Indrea, Int. J. Hydrogen Energy 7 (1982) 783.[5] P. Selvam, B. Viswanathan, C.S. Swamy, V. Srinivasan, Int. J.
Hydrogen Energy 11 (1986) 169.it forms first during hydriding of such an alloy. The reason [6] M.Y. Song, J. Mater. Sci. 30 (1995) 1343.for this behavior is that the chemical potential of hydrogen [7] M.L. Post, J.J. Murray, J. Less-Common Met. 134 (1987) 15.in the t1g91b three-phase field (25.78 J /mol-at.) is [8] Z. Gavra, M.H. Mintz, G. Kimmel, Z. Hadari, Inorg. Chem. 18
(1979) 3595.much less negative than in the a1b1g9 three-phase field[9] P. Selvam, B. Viswanathan, C.S. Swamy, V. Srinivasan, Bull. Mater.(22033 J /mol-at.), which is revealed by the calculated
Sci. 9 (1987) 21.stability diagram in Fig. 9. On the other hand, according to[10] D. Noreus, P.-E. Werner, Mater. Res. Bull. 16 (1981) 199.
Figs. 8 and 9, the dehydriding process of the system will [11] M.H. Mintz, Z. Gavra, G. Kimmel, Z. Hadari, J. Less-Common Met.proceed in reverse order of the hydriding process. The 74 (1980) 263.
[12] D. Noreus, P.-E. Werner, Acta Chem. Scand. A 36 (1982) 847.Mg NiH phase in a hydride mixture of Mg NiH 1MgH2 4 2 4 2¨[13] J. Schefer, P. Fischer, W. Halg, F. Stucki, L. Schlapbach, J.J.will decompose first to release hydrogen and produce
Didisheim, K. Yvon, A.F. Andresen, J. Less-Common Met. 74g9-Mg NiH since the hydrogen potential in it is much2 12x (1980) 65.higher. This is what was observed experimentally by Post [14] T. Hirata, Int. J. Hydrogen Energy 9 (1984) 855.et al. [24]. [15] D. Noreus, P.E. Werner, J. Less-Common Met. 97 (1984) 215.
According to Fig. 8, for a Mg–Ni alloy with a nickel [16] P. Selvam, B. Viswanathan, C.S. Swamy, V. Srinivasan, Thermoch-im. Acta 125 (1988) 1.content between 33.3 and 66.7 at.%, the hydriding process
[17] F.J. Liu, G. Sandrock, S. Suda, Z. Phys. Chem. 183 (1994) 163.is more simple: g-Mg Ni is hydrided directly into the2 [18] S. Orimo, H. Seto, K. Ikeda, M. Nagao, H. Fujii, Physica B 226ternary hydride t, while the h-MgNi phase does not take2 (1996) 370.part in the reaction. For a Ni-rich alloy (X .0.667), no [19] J.L. Soubeyroux, D. Fruchart, A. Mikou, M. Pezat, B. Darriet,Ni
hydride will be formed because the constituent phase h Mater. Res. Bull. 19 (1984) 895.[20] Y.C. Huang, T. Watanabe, R. Komatsu, in: Proceedings of the 4thand (Ni) are in equilibrium with hydrogen. This prediction
International Conference on Vacuum Metallurgy, Tokyo, 1973, p.is in agreement with the experimental result that MgNi2 176.does not react with H at pressures up to 27.6 bar and2 [21] K. Zeng, T. Klassen, W. Oelerich, R. Bormann, Int. J. Hydrogentemperatures up to 3508C [1]. Energy (in press, 1998).
[22] H.M. Lutz, O.D. Pous, in: Proceedings of the 2nd InternationalCongress on Hydrogen in Metals, 2 (1977) 1F5.
[23] K. Nomura, E. Akiba, S. Ono, Int. J. Hydrogen Energy 6 (1981)6. Conclusions295.
[24] M.L. Post, J.J. Murray, J.B. Taylor, Int. J. Hydrogen Energy 9(1) The binary constituent systems Mg–H, Ni–H, and (1984) 137.
¨Mg–Ni have been reliably modeled in the temperature and [25] K.J. Gross, P. Spatz, A. Zuttel, L. Schlapbach, J. Alloys Comp. 240(1996) 206.pressure ranges of interest. The Mg–Ni–H ternary system
[26] H. Buchner, O. Bernauer, W. Straub, in: T.N. Veziroglu, W. Seifritzis well described by the obtained thermodynamic parame-(Eds.), Proceedings of the World Hydrogen Energy Conference,
ters above the LT↔HT transition temperature. In order to ¨Zurich, 1978, Vol. 3, Pergamon, Oxford, 1978, p. 1677.obtain a better thermodynamic description of the system [27] P. Selvam, B. Viswanathan, C.S. Swamy, V. Srinivasan, Int. J.below the transition temperature, new experiments are Hydrogen Energy 13 (1988) 87.

224 K. Zeng et al. / Journal of Alloys and Compounds 283 (1999) 213 –224
[28] T. Hirata, T. Matsumoto, M. Amano, Y. Sasaki, J. Phys. F: Met. [35] A.A. Nayeb-Hashemi, J.B. Clark, in: A.A. Nayeb-Hashemi, J.B.Phys. 11 (1981) 521. Clark (Eds.), Monograph Series on Alloy Phase Diagrams, Phase
[29] S. Ono, H. Hayakawa, A. Suzuki, K. Nomura, N. Nishimiya, T. diagrams of Binary Magnesium Alloys, ASM International, MetalsTabata, J. Less-Common Met. 88 (1982) 63. Park, OH, 1988, p. 219.
[30] A.F. Andersen, E. Andersen, K. Pattersen, Acta Crystallogr. A [36] K. Zeng, T. Klassen, W. Oelerich, R. Bormann, J. Alloys Comp. 28337(Suppl. C) (1981) C–152. (1999) 151.
[31] E. Akiba, K. Nomura, S. Ono, Y. Minzuno, J. Less-Common Met. [37] O. Redlich, A.T. Kister, Ind. Eng. Chem. 40 (1948) 345.83 (1982) L43. [38] K. Frisk, CALPHAD 15 (1991) 79.
[32] E. Akiba, K. Nomura, S. Ono, S. Suda, Int. J. Hydrogen Energy 7 [39] M. Hillert, L.I. Staffanson, Acta Chim. Scand. 24 (1970) 3618.(1982) 787. [40] M.W. Chase, J. Phys. Chem. Ref. Data 14 (Suppl. 1) (1985).
[33] A.T. Dinsdale, CALPHAD 15 (1991) 317. [41] B. Jansson, PhD Thesis, Royal Institute of Technology, Stockholm,[34] M.H.G. Jacobs, P.J. Spencer, J. Chim. Phys. 90 (1993) 167. Sweden, 1984.