The global distribution of human population and recent volcanism

1
Catchline International Journal of Remote Sensing, Vol. X, No. X, Month 2006, xxx–xxx Running heads (verso) M. Kervyn et al. (recto) Thermal remote sensing of Oldoinyo Lengai
Thermal remote sensing of the low-intensity carbonatite volcanism of Oldoinyo Lengai, Tanzania
M. KERVYN†*, A.J.L. HARRIS‡, F. BELTON§, E. MBEDE#, P. JACOBS†, G.G.J. ERNST†
† Mercator & Ortelius Research Centre for Eruption Dynamics, Joseph Plateau Geological Fluid Dynamics Laboratory, Geological Institute, Ghent University, Krijgslaan 281/S8, B-9000 Gent, Belgium. ‡ HIGP/SOEST, University of Hawai‘i at Mānoa, 1680 East-West Road, Honolulu, Hawai‘i 96822, USA. § Developmental Studies Department, Middle Tennessee State University, Murfreesboro, TN 37132, USA. # Department of Geology, University of Dar es Salaam, Tanzania.
*Corresponding author. Email: [email protected]
2
Although Tanzania, Kenya and Ethiopia contain a number of active and potentially hazardous volcanoes, none of them are routinely or continuously monitored. Of these, Tanzania’s Oldoinyo Lengai has been almost continuously active over the past two decades (since 1983). Recent activity has been confined to small-scale effusive and explosive eruptions of natrocarbonatite within the summit crater, with lava flows occasionally overflowing the crater rim and extending onto the volcano flanks. The automated MODVOLC algorithm falls short of detecting all thermal anomalies within Oldoinyo Lengai’s crater. The sensitivity of the algorithm is insufficient to detect anomalies of the size and magnitude presented by those at Oldoinyo Lengai. We explore how MODIS infrared (IR) bands can still be used to monitor activity. We cross-verify our observations against field reports and higher resolution satellite images (ASTER, Landsat ETM+). Despite the limited-extent and low temperature (~585°C) of natrocarbonatite lavas, relative variations in eruption intensity, and periods of increased activity alternating with periods of reduced or no detectable activity can be observed using the MODLEN algorithm. Although activity in the last 2 decades has been moderate at Lengai, a more intense explosive eruption is overdue and there is a need for routine monitoring in the future. Our work makes a case for low-cost thermal IR monitoring as an essential component of such a monitoring program at several Tanzanian, Kenyan and Ethiopian volcanoes. The approach presented here is already available for routine use.
Keywords: Oldoinyo Lengai; thermal monitoring; MODIS; MODVOLC; MODLEN; eruption intensity; lava ponds; lava fountaining; lava flows AMS Subject Classifications: : 86A60, 86A30
3
1 Introduction
Oldoinyo Lengai (OL) is located in the Gregory rift valley, in NW Tanzania, some 16
km South of Lake Natron (Fig. 1; Dawson, 1992; Foster et al., 1997). OL is the only active volcano on Earth emitting natrocarbonatite lava (Dawson et al., 1990). Natrocarbonatite lavas are the lavas with the lowest temperature and viscosity ever recorded on Earth (see below). Since 1983, the volcano has emitted natrocarbonatite flows within its northern crater; the ~150 m-deep pit crater produced by the last explosive eruption of 1966-1967 gradually filling up with lava flow deposits (Dawson et al., 1968; Nyamweru, 1990). During the 20th century, OL underwent several explosive eruptions: in 1917, 1940-41 and 1966-67. These generated sub-plinian-style eruption columns with ash dispersal over wide areas (e.g. as far as the Nairobi and Arusha airports, at 180 km to NE and 110 km to SE, respectively). Recently, Keller (2002), Keller & Klaudius (2003) and Klaudius & Keller (2004) documented 4 debris avalanches deposits, sourced from OL. Volcano collapse is now recognized as one of the major hazards at OL (see also Kervyn et al., this issue).
Oldoinyo Lengai, however, is not monitored at all; a feature common to all the active volcanoes in Tanzania or Kenya. There is neither seismic instrumentation specifically dedicated to monitor OL nor is there routine visual inspection of the volcano. Those reports of the activity that exist (e.g. Nyamweru, 1990, 1997; GVN, 2002, 2003, 2004, 2005) are only the result of an increasing number of visitors who climb OL, including infrequent scientific parties. Moreover, reports over the last five years only provide some constraints on eruptive activity at OL, with greatly varying accuracy, for 10-50 days per year (i.e. observations only 3-15% of the time). Visits are typically concentrated during the dry season months (June-September), and, in minor proportion in January-February, with rare exceptions. Here we advocate that low-cost techniques are needed to regularly monitor activity at OL in order to detect the onset of any higher intensity eruptive episodes that could pose a threat for tourists, for the local Masaï people or for domestic and international air traffic from the nearby Nairobi and Kilimanjaro airports (~180 km away).
Near-real time thermal monitoring of active lavas developed rapidly during the last decade with the advent and increasing use of low spatial and high temporal resolution sensors, such as AVHRR (Bonneville & Gouze, 1992; Harris et al., 1997; Oppenheimer, 1998; Carn & Oppenheimer, 2000; Dehn et al., 2000; Lachlan-Cope et al., 2001; Dehn et al., 2002; Galindo & Dominguez, 2003; Pergola et al., 2004) and GOES (Harris & Thornber, 1999; Harris et al., 2000; Schneider et al., 2000; Harris et al., 2001; Harris et al., 2003). Since the launch of the Terra (1999) and Aqua (2002) satellites of the National Aeronautics and Space Administration (NASA) Earth Observing System (EOS) program, the Moderate Resolution Imaging Spectroradiometer (MODIS) sensors have been providing daily images of the Earth’s surface in 36 bands. Automated hotspot detection has since been implemented by the so-called MODVOLC algorithm using night-time and daytime scenes acquired by MODIS to systematically identify and record location and intensity of hotspots (Flynn et al., 2002; Wright et al., 2002, 2004), as explained in the third section of this paper. The automated MODVOLC method proves very useful to monitor activity of large (i.e. km-scale) lava flow fields (e.g. Nyiragongo; Wright & Flynn, 2003) and actively growing lava domes and lava lakes (Wright et al., 2004), especially at remote volcanoes for which it often provides the only documentation of activity (Rothery et al., 2005). The MODVOLC method is however currently limited when it comes to monitoring highly discontinuous activity (such as Strombolian or Vulcanian activity), low intensity anomalies or effusive events with low discharge rates (Wright et al., 2004). This is a result of the sensitivity of the algorithm being

4
set so as to consider global hotspot activity with minimal false detections (Wright et al., 2004). As a result of the small size and low temperature of lava flows, MODVOLC is not able to detect usual thermal activity at OL. We show here that the MODVOLC method can be adapted to enable detection of thermal activity at OL, and more specifically to retrieve the relative variation in thermal activity at OL.
This paper is organized as follows. First, the thermal activity at OL is described. Using simplifying assumptions, the expected effect of this activity on the radiance recorded in the mid-infrared bands by MODIS is modelled. Second, the MODVOLC algorithm is briefly described and its limitations for application to a Lengai-style hotspot are illustrated. An adapted version of the algorithm (MODLEN) for local, volcano-specific, utilization is then developed and tested against field data and moderately high resolution satellite images at OL. The results from applying the MODLEN algorithm to over 800 scenes, from several time periods together covering >18 months of data, are presented and analysed in terms of occurrence versus non-occurrence of thermal activity and in terms of relative variation in eruption intensity. Finally, the potential use of the MODVOLC-MODLEN algorithm for routine, semi-automated thermal monitoring at OL, and at other volcanoes, is discussed.
2 Thermal emissions of Lengai
In 1983, after 16 years of quiescence, OL started erupting natrocarbonatite lava onto the floor of its ~150 m deep northern crater (Nyamweru, 1990). This rare magmatic composition is associated with extremely fluid lava flows (low apparent viscosity: 10-2-102 Pa s; see Dawson et al., 1990; Wolff, 1994; Pinkerton et al., 1995; Norton & Pinkerton, 1997 for discussion) at relatively low temperature. Temperature measurements of lava flows made in the field using handheld thermo-couples, produced estimates within the 500-600°C interval. Krafft & Keller (1989) measured lava temperatures between 495 and 544°C and Dawson et al. (1990) and Pinkerton et al. (1995) estimated lava temperatures at 585 ±10°C. Similar eruption temperatures have also been measured in more recent years (GVN, 2004) with maximum temperatures for lava flowing in a tube being 588°C and minimum temperatures for lava still in slow motion being 496°C. This is in agreement with experiments by Norton & Pinkerton (1997), where the lava began to crystallize nyerereite and gregoryite minerals at ~600-640°C and the groundmass (i.e. including sylvite, fluorite, barite, Cl-rich nyerereite; Dawson et al., 1990) crystallized between 470° and 530°C. Eruption rates are also relatively low. From their observations in November 1988, Dawson et al. (1990) reported a maximum effusion rate of 0.3 m3 s-1 and an average of 2×10⁻³ m3 s-1, while effusion rate estimates of up to 5-10 m3 s-1 are only reported for unusually intense activity (GVN, 1992, 2004).
OL’s North crater floor, upon which activity is concentrated, contains several hornitos (i.e. 1-25 m high steep spatter cones) and lava pools, from which activity originates (Fig. 2), and whose morphologies, locations and number (although usually less than 25) can change from year to year (see Nyamweru, 1990, 1997). Eruptive activity includes intense magma degassing from lava pools, intermittent lava fountains up to 30 m high and effusion of pahoehoe lava flows (Fig. 2). Typical lava flows are 100-200 m long, 5-20 m wide and 5-10 cm thick (Nyamweru, 1997) and are associated with effusion rates lower than 0.04 m³ s-1. Thicker flows (1-2 m) with aa surface morphologies form at higher effusion rates (≥0.2-0.3 m³ s-1) as observed by Dawson and co-workers during their visit at OL in 1988 (Dawson et al., 1990; Pinkerton et al., 1995).
5
In June 1993, a series of explosive eruptions emitting mixed carbonatite-silicate ash, produced dark ash clouds that deposited a thin ash blanket on the upper volcano flanks and formed several ash cones within the southern part of the north crater (Nyamweru, 1997). Associated with this explosive activity, Dawson et al. (1994) described the occurrence of two unusually thick (3-6 m), voluminous (4-10×104 m3) and viscous aa lavas with a mixed silicate and natrocarbonatite composition. These were emitted at low effusion rates estimated at 3-8×10⁻² m3 s-1.
Satellite thermal monitoring of volcanoes is based on the detection of radiance emitted by sub-pixel high temperature surfaces in the short-wave infrared (SWIR: 1-4 µm), mid-infrared (MIR: 3-4 µm) and thermal infrared (TIR: 8-12 µm) range of the electromagnetic spectrum (Rothery et al., 1988; Oppenheimer, 1991; Oppenheimer et al., 1993; Harris et al., 1997). Assuming an emissivity of 1 and neglecting atmospheric effects, the effect of varying sub-pixel fractional coverage by hot lava at a given temperature on the recorded radiance can be modelled using the Planck function (Fig. 3). At night, a surface at 12°C (i.e. average ambient surface temperature for Lengai summit; C.Weber, personal communication), has an emission peak in the 8-12 µm range with insignificant emission in the SWIR. The position of this emission peak shifts towards shorter wavelengths as temperature increases (Rothery et al., 1988; Lillesand & Kiefer, 2000). A body at 1200°C (i.e. extrusion temperature of basaltic magma) has a maximum emission at 2.5 µm, whereas for Lengai lava (~550°C), it is around 3.5 µm (i.e. in the MIR).
Peak emission intensity also increases with temperature (Rothery et al., 1988; Lillesand & Kiefer, 2000). This means that a small proportion of lava (e.g. 0.05%, corresponding to a 500 m² flow within a 1000×1000 m² MODIS pixel) at 1200°C, within a surface at background temperature (12°C) has a proportionately large contribution to the pixel-integrated radiance at 4 µm (causing an increase of 3.5 W.m-2.sr-1.µm-1). However, this effect is much weaker if the lava is at 550°C (increasing the pixel-integrated radiance by merely 0.7 W.m-2.sr-1.µm-1). Thus a natrocarbonatite flow has to be 4 times more aerially extensive than a basaltic flow to produce a similar effect on the pixel-integrated radiance at 4 µm (Fig. 3). Although this simple model does not account for effects of lava flow crusting or contrasted cooling rates (i.e. natrocarbonatite flows cooling up to 10 times slower than basaltic ones of comparable dimensions, field estimates of the thermal diffusivity of thin natrocarbonatite flows being of the order of 4-5×10⁻⁸ m² s-1; Dawson et al., 1990; Pinkerton et al., 1995), it illustrates that sub-pixel hotspots for these natrocarbonatite flows will tend to be less intense than those for the more usual lava flow temperature range (~800-1200°C) (e.g. Harris et al., 1995b; Harris et al., 1997). Sensors at all wavelengths will thus tend to be less sensitive to natrocarbonatite flows; an effect which is exacerbated by the fact that natrocarbonatite flows are relatively small in terms of size, volume and eruption rate. This explains why these small flows often go undetected by MODVOLC.
Thermal emissions of natrocarbonatite lava at OL were first detected using thermal remote sensing by Oppenheimer (1997). Using bands 5 (1.55-1.75 µm) and 7 (2.08-2.35 µm) of a single 1984 Landsat TM scene, Oppenheimer (1997) illustrated that, although natrocarbonatite lavas are at low temperature and cover only small surface areas, they can be detected in the SWIR. This is due to the high spatial resolution (30 m) of the Landsat TM SWIR bands. Based on the difference in the summed radiance for all hot pixels in bands 5 and 7 and an emissivity estimated at 0.9, using reflection spectra, Oppenheimer (1997) derived an estimate for the lava surface temperature of 540°C. Assessing the potential of high temporal resolution, low spatial resolution AVHRR band 3 (3.55-3.93 µm) data to monitor the eruptive activity, Oppenheimer (1997) reported the visual identification of a hotspot on only one of the 24 scenes scrutinized. He nonetheless argued at that time that the new-coming sensors could

6
open the scope for systematic monitoring at OL. What Oppenheimer envisaged then is precisely what is being explored further hereafter.
3 MODVOLC and thermal monitoring
The MODVOLC algorithm was developed at the Hawaiian Institute for Geophysics and Planetology (HIGP) by Flynn et al (2002) and Wright et al. (2002; 2004). As described by these authors, it is a necessarily simple algorithm which can be applied to all MODIS scenes acquired by the TERRA and AQUA satellite and arriving at the NASA Distributed Active Archive Center (DAAC) with the objective of detecting global hotspot activity and of recording the pertinent data (i.e. location and spectral data). It takes advantage of the differential effect of a small proportion of hot material within a pixel on the radiance in the MIR and TIR wavelength bands (Harris et al., 1995a; Higgins & Harris, 1997; Harris et al., 2001). The main characteristics of the MODVOLC algorithm are briefly summarized from Wright et al. (2002; 2004) in the following paragraphs. For a more detailed description and discussion of this algorithm, see Wright et al. (2002; 2004).
For each pixel of any night-time MODIS scene, the algorithm derives the Normalized Thermal Index (NTI) from radiance values in bands 21 or 22 (3.95 µm) and 32 (12 µm) as follows (Fig. 4):
32band22band32band22bandNTI
+−
= (1)
Or, if band 22 is saturated, from
32band21band32band21bandNTI
+−
= (2)
MODIS bands 21 and 22 cover the same wavelengths (3.929-3.989 µm) but band 21 is sensitive to higher temperatures, and thus saturates less easily (i.e. band 21 and 22 saturate at ~500K and ~330K respectively). From empirical analyses of data for known lava lakes and lava flow fields, Wright et al. (2002) derived a threshold NTI value of (-0.80) to discriminate abnormally hot pixels, i.e. if NTI was greater than this value, then a hotspot status is assigned. The value of the threshold was set sufficiently high so as to be valid worldwide and to avoid false alerts. The consequence is that a true thermal anomaly of relative small intensity might not be recorded. Also, to run on a near-real time basis at NASA (i.e. data being available a few hours after acquisition), the algorithm had to be restricted to 8 processing steps and a single threshold had to be used (Wright et al., 2002). The algorithm was thus necessarily simple. MODVOLC is a point operation, i.e. anomaly at one pixel is detected solely based on the radiance measured for that pixel; no temporal or spatial derivative, as used by previous workers (e.g. Higgins & Harris, 1997), could be implemented.
Once detected, the information for the hotspot pixels is automatically recorded in a text file (Wright et al., 2002). The recorded information includes the geographical coordinates of the pixel centre and the radiance values in several bands, including bands 21, 22 and 32. These data are stored at HIGP and is freely available on the MODVOLC website (http://modis.higp.hawaii.edu/).
In order to investigate thermal emissions at OL, we downloaded all the hotspot alerts covering OL from the MODVOLC website since December 1999. Because of OL’s position, i.e. close to the Equator (2.9° S), it is not imaged every night by MODIS; on the Equator, band swaths are separated by a few hundred kilometres, so sometimes gaps in coverage occur
7
at these latitudes (Masuoka et al., 1998). Data collection for a year long period showed that, at this latitude, an average of 3 scenes are lacking every two weeks.
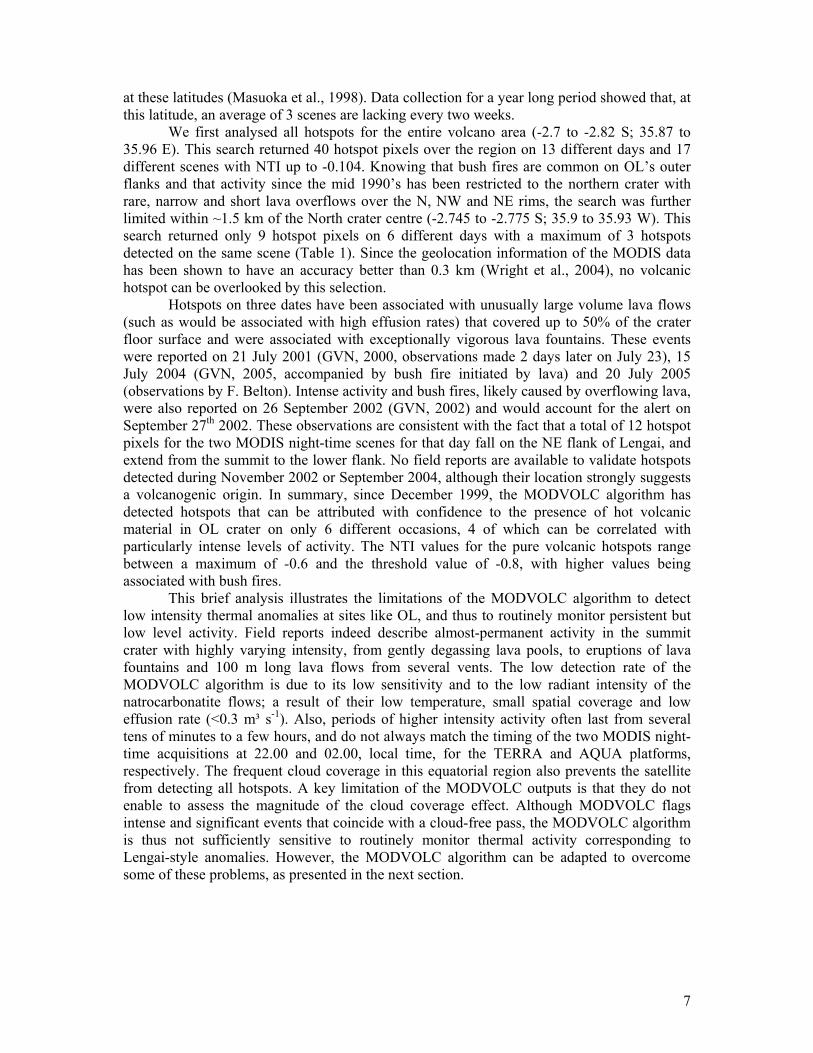
We first analysed all hotspots for the entire volcano area (-2.7 to -2.82 S; 35.87 to 35.96 E). This search returned 40 hotspot pixels over the region on 13 different days and 17 different scenes with NTI up to -0.104. Knowing that bush fires are common on OL’s outer flanks and that activity since the mid 1990’s has been restricted to the northern crater with rare, narrow and short lava overflows over the N, NW and NE rims, the search was further limited within ~1.5 km of the North crater centre (-2.745 to -2.775 S; 35.9 to 35.93 W). This search returned only 9 hotspot pixels on 6 different days with a maximum of 3 hotspots detected on the same scene (Table 1). Since the geolocation information of the MODIS data has been shown to have an accuracy better than 0.3 km (Wright et al., 2004), no volcanic hotspot can be overlooked by this selection.
Hotspots on three dates have been associated with unusually large volume lava flows (such as would be associated with high effusion rates) that covered up to 50% of the crater floor surface and were associated with exceptionally vigorous lava fountains. These events were reported on 21 July 2001 (GVN, 2000, observations made 2 days later on July 23), 15 July 2004 (GVN, 2005, accompanied by bush fire initiated by lava) and 20 July 2005 (observations by F. Belton). Intense activity and bush fires, likely caused by overflowing lava, were also reported on 26 September 2002 (GVN, 2002) and would account for the alert on September 27th 2002. These observations are consistent with the fact that a total of 12 hotspot pixels for the two MODIS night-time scenes for that day fall on the NE flank of Lengai, and extend from the summit to the lower flank. No field reports are available to validate hotspots detected during November 2002 or September 2004, although their location strongly suggests a volcanogenic origin. In summary, since December 1999, the MODVOLC algorithm has detected hotspots that can be attributed with confidence to the presence of hot volcanic material in OL crater on only 6 different occasions, 4 of which can be correlated with particularly intense levels of activity. The NTI values for the pure volcanic hotspots range between a maximum of -0.6 and the threshold value of -0.8, with higher values being associated with bush fires.
This brief analysis illustrates the limitations of the MODVOLC algorithm to detect low intensity thermal anomalies at sites like OL, and thus to routinely monitor persistent but low level activity. Field reports indeed describe almost-permanent activity in the summit crater with highly varying intensity, from gently degassing lava pools, to eruptions of lava fountains and 100 m long lava flows from several vents. The low detection rate of the MODVOLC algorithm is due to its low sensitivity and to the low radiant intensity of the natrocarbonatite flows; a result of their low temperature, small spatial coverage and low effusion rate (<0.3 m³ s-1). Also, periods of higher intensity activity often last from several tens of minutes to a few hours, and do not always match the timing of the two MODIS night-time acquisitions at 22.00 and 02.00, local time, for the TERRA and AQUA platforms, respectively. The frequent cloud coverage in this equatorial region also prevents the satellite from detecting all hotspots. A key limitation of the MODVOLC outputs is that they do not enable to assess the magnitude of the cloud coverage effect. Although MODVOLC flags intense and significant events that coincide with a cloud-free pass, the MODVOLC algorithm is thus not sufficiently sensitive to routinely monitor thermal activity corresponding to Lengai-style anomalies. However, the MODVOLC algorithm can be adapted to overcome some of these problems, as presented in the next section.
8
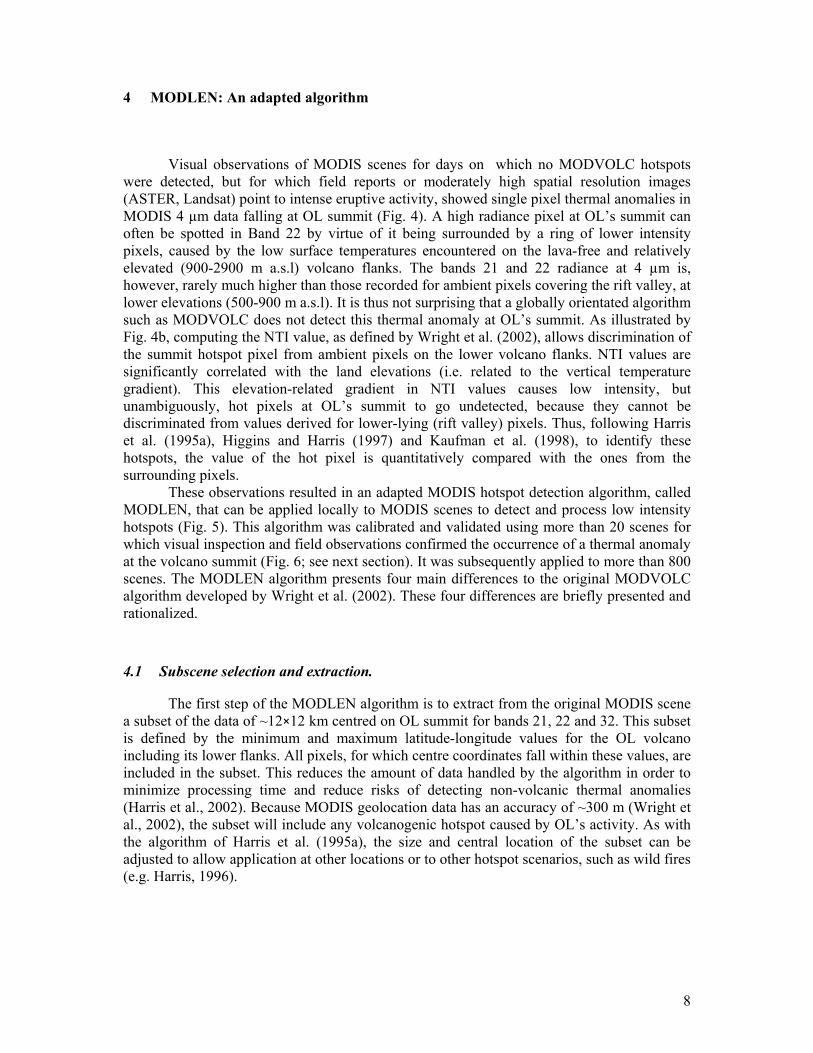
4 MODLEN: An adapted algorithm
Visual observations of MODIS scenes for days on which no MODVOLC hotspots were detected, but for which field reports or moderately high spatial resolution images (ASTER, Landsat) point to intense eruptive activity, showed single pixel thermal anomalies in MODIS 4 µm data falling at OL summit (Fig. 4). A high radiance pixel at OL’s summit can often be spotted in Band 22 by virtue of it being surrounded by a ring of lower intensity pixels, caused by the low surface temperatures encountered on the lava-free and relatively elevated (900-2900 m a.s.l) volcano flanks. The bands 21 and 22 radiance at 4 µm is, however, rarely much higher than those recorded for ambient pixels covering the rift valley, at lower elevations (500-900 m a.s.l). It is thus not surprising that a globally orientated algorithm such as MODVOLC does not detect this thermal anomaly at OL’s summit. As illustrated by Fig. 4b, computing the NTI value, as defined by Wright et al. (2002), allows discrimination of the summit hotspot pixel from ambient pixels on the lower volcano flanks. NTI values are significantly correlated with the land elevations (i.e. related to the vertical temperature gradient). This elevation-related gradient in NTI values causes low intensity, but unambiguously, hot pixels at OL’s summit to go undetected, because they cannot be discriminated from values derived for lower-lying (rift valley) pixels. Thus, following Harris et al. (1995a), Higgins and Harris (1997) and Kaufman et al. (1998), to identify these hotspots, the value of the hot pixel is quantitatively compared with the ones from the surrounding pixels.
These observations resulted in an adapted MODIS hotspot detection algorithm, called MODLEN, that can be applied locally to MODIS scenes to detect and process low intensity hotspots (Fig. 5). This algorithm was calibrated and validated using more than 20 scenes for which visual inspection and field observations confirmed the occurrence of a thermal anomaly at the volcano summit (Fig. 6; see next section). It was subsequently applied to more than 800 scenes. The MODLEN algorithm presents four main differences to the original MODVOLC algorithm developed by Wright et al. (2002). These four differences are briefly presented and rationalized.
4.1 Subscene selection and extraction.
The first step of the MODLEN algorithm is to extract from the original MODIS scene a subset of the data of ~12×12 km centred on OL summit for bands 21, 22 and 32. This subset is defined by the minimum and maximum latitude-longitude values for the OL volcano including its lower flanks. All pixels, for which centre coordinates fall within these values, are included in the subset. This reduces the amount of data handled by the algorithm in order to minimize processing time and reduce risks of detecting non-volcanic thermal anomalies (Harris et al., 2002). Because MODIS geolocation data has an accuracy of ~300 m (Wright et al., 2002), the subset will include any volcanogenic hotspot caused by OL’s activity. As with the algorithm of Harris et al. (1995a), the size and central location of the subset can be adjusted to allow application at other locations or to other hotspot scenarios, such as wild fires (e.g. Harris, 1996).
9
4.2 NTI threshold.
Consistent with Wright et al. (2002), empirical analysis based on hundreds of scenes for all seasons showed that the NTI values for non-anomalous pixels was always below -0.83. Every pixel, independently of its location, returning a NTI value above -0.83 is thus regarded as a hotspot. This first threshold enables detection of intense thermal anomalies, irrespective of the values of the neighbouring pixels.
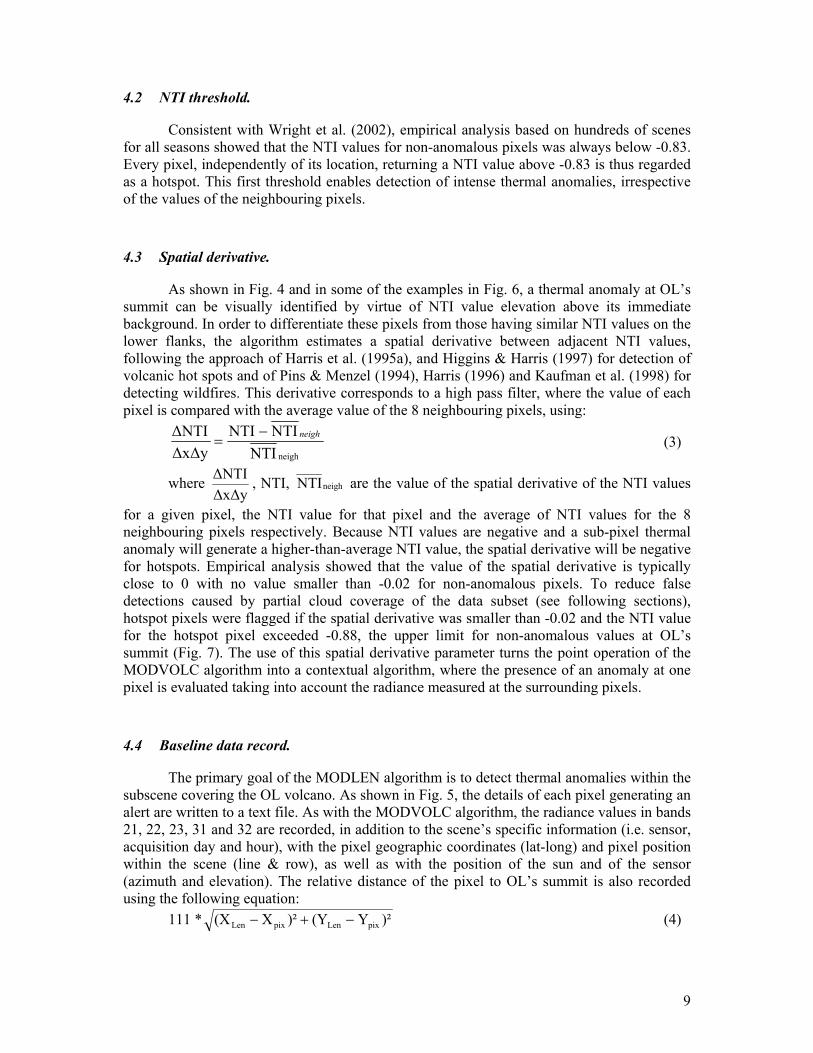
4.3 Spatial derivative.
As shown in Fig. 4 and in some of the examples in Fig. 6, a thermal anomaly at OL’s summit can be visually identified by virtue of NTI value elevation above its immediate background. In order to differentiate these pixels from those having similar NTI values on the lower flanks, the algorithm estimates a spatial derivative between adjacent NTI values, following the approach of Harris et al. (1995a), and Higgins & Harris (1997) for detection of volcanic hot spots and of Pins & Menzel (1994), Harris (1996) and Kaufman et al. (1998) for detecting wildfires. This derivative corresponds to a high pass filter, where the value of each pixel is compared with the average value of the 8 neighbouring pixels, using:
neighNTINTINTI
∆x∆y∆NTI neigh−
= (3)
where ∆x∆y∆NTI , NTI, neighNTI are the value of the spatial derivative of the NTI values
for a given pixel, the NTI value for that pixel and the average of NTI values for the 8 neighbouring pixels respectively. Because NTI values are negative and a sub-pixel thermal anomaly will generate a higher-than-average NTI value, the spatial derivative will be negative for hotspots. Empirical analysis showed that the value of the spatial derivative is typically close to 0 with no value smaller than -0.02 for non-anomalous pixels. To reduce false detections caused by partial cloud coverage of the data subset (see following sections), hotspot pixels were flagged if the spatial derivative was smaller than -0.02 and the NTI value for the hotspot pixel exceeded -0.88, the upper limit for non-anomalous values at OL’s summit (Fig. 7). The use of this spatial derivative parameter turns the point operation of the MODVOLC algorithm into a contextual algorithm, where the presence of an anomaly at one pixel is evaluated taking into account the radiance measured at the surrounding pixels.
4.4 Baseline data record.
The primary goal of the MODLEN algorithm is to detect thermal anomalies within the subscene covering the OL volcano. As shown in Fig. 5, the details of each pixel generating an alert are written to a text file. As with the MODVOLC algorithm, the radiance values in bands 21, 22, 23, 31 and 32 are recorded, in addition to the scene’s specific information (i.e. sensor, acquisition day and hour), with the pixel geographic coordinates (lat-long) and pixel position within the scene (line & row), as well as with the position of the sun and of the sensor (azimuth and elevation). The relative distance of the pixel to OL’s summit is also recorded using the following equation:
111 * )²Y(Y)²X(X pixLenpixLen −+− (4)

10
where Xpix,Ypix and XLen,YLen are the coordinates, in decimal degrees, of the centre of the hot pixel and of OL’s summit crater, respectively. Because, close to the Equator, 1 degree latitude or longitude corresponds to a distance of ~111 km, this parameter approximates the distance between the pixel centre and the crater centre in kilometres. This value thus helps the discrimination of volcanogenic alerts within the crater from fire-related hotspots on the outer flanks.
The algorithm also records baseline information for the OL summit from every image. Baseline data is here defined as the data of the pixel covering OL’s summit for scenes on which no thermal anomaly is detected at OL’s summit. This serves two purposes. First it allows us to assess qualitatively the effect of cloud coverage on the alert time series. Second it enables detection of long-term or subtle temperature variations at OL’s summit that would not be identified by alerts, as was achieved by Harris and Stevenson (1997) using an AVHRR-derived thermal baseline for similarly low magnitude thermal anomalies at Stromboli or Vulcano.
For each scene analysed by the algorithm, the information for the pixel closest to the centre of OL’s active crater (estimated using eq. 4) is recorded in the baseline database. Depending on the pixels’ effective size, the distance varies from a few tens of meters to 1.7 km. The size of the pixel and its position in relation to the crater vary for each scene, causing scatter in the baseline data. Indeed, because eruptive activity can be focused in one part of the active crater, it might not be recorded by the pixel closest to the crater centre. Nonetheless, this approach offers the opportunity to collect baseline data for OL’s eruptive activity for the first time.
The MODLEN algorithm was designed for implementation by local volcanologists for near-real time monitoring of OL and other volcanoes in developing countries with similar, low-intensity activity, that lack ground monitoring. As local volcanologists in developing countries commonly lack the most advanced remote sensing softwares, the more readily accessible MatLab software was selected to run MODLEN. It uses the MODIS L1B data (Calibrated Radiance 1 km – MOD021KM) combined with the L1A Geolocation data (MOD03).
5 MODLEN Validation
To validate MODLEN and assess its limitations, the results presented in Fig. 7 (a-c are analysed against field data (Table 2) for 3 periods during which detailed observations exist. Most of these field data are from the direct observations of one of the authors (F. Belton) or comes from local guide reports to him. This information has been previously summarised in the Global Volcanic Network bulletins (GVN 2002, 2003, 2005) or in the weekly reports published by the Smithsonian National Museum of Natural History (http://www.volcano.si.edu/reports/usgs/).
5.1 August 2002
Activity at Lengai was described for a total of 30 days during 2002, with detailed
reports for longer periods of time being available from two field visits in June and August

11
(GVN, 2002). This information is summarized in the section analysing the MODLEN results. Here the report for August 4th to 9th is used to assess the detection capabilities of MODLEN. On these dates vent T57B was continuously active. Activity varied between loud outgassing, intermittent spattering and lava overflows feeding short pahoehoe and aa flows. At various times T48, T44 and T46 showed similar activity. On August 4th, a new vent opened (T49F, Fig. 2b) close to the T49 vent cluster. Explosive outburst produced jet of lapilli to a height of ~8 m while a flow of aa lava was emitted from the same vent. At 2.00 a.m. on August 5th, the eruption increased in intensity to feed a 15 m high lava fountain and a rapidly moving pahoehoe flow. Similar activity occurred about every 2 hours for the next 28 hours. Each eruptive sequence was characterised by lava spattering, followed by a continuous fountain 10-15 m high lasting for 2-4 minutes, and being terminated by lava drainage, showing similar behaviour to gas pistoning cycles at Kilauea (Johnson et al., 2005). Within the crater, the lapilli fall deposit from the eruption was up to 10 cm thick and lava flows were >1 m thick. In addition, lava fountaining caused a bush fire on the East rim during the night of August 5th. Activity decreased on August 6th, and ceased that night, with no further activity being observed over the two following days. At 11.00 p.m. on August 8th, a 12 m-long fissure opened between two vents about 100 m SE of the vent that had been active two days previously. A 6-8 m high lava curtain erupted, associated with almost-continuous explosions, forming an elongated spatter cone containing a vigorously degassing lava lake. By the morning of August 9th, the 2 m high cone hosted a 5×9 m actively degassing lava lake. Although observations ceased on that day, a photo taken a week later (August 17th) showed that the cone had grown up to 10 m in height.
The MODIS data is especially poor for this August 2002 period. Data is lacking for August 3rd, 6th and 8th for the TERRA sensor, and for July 29th to August 6th for the AQUA sensor. The lack of AQUA scenes was caused by a data outage related to the Earth Pointing Safe Mode (MODIS, Data & Information Service Center website, http://daac.gsfc.nasa.gov/MODIS/). The data series is sufficiently complete, however, to allow comparisons against the field reports. As shown in Fig. 7a and Table 2, five thermally anomalous pixels were spotted on the MODIS scenes acquired between August 1st and 14th. These hot pixels occur on 4 different scenes covering 3 different days. On the night of August 5th at 10.30 p.m., the first 2-pixel anomaly was detected (Fig. 6a). On the previous night the summit pixel had been at the baseline level. This is consistent with the onset of the high intensity activity early on August 5th and of a bush fire extending onto the East flank to cause the second pixel to become anomalous. The small aa lava flow and low-intensity and intermittent vent spattering of August 4th was thus not detectable with MODLEN. Visual analysis shows that scenes on August 7th and 8th were affected by clouds. On August 9th (Fig. 6b) and 12th, the anomaly caused by the lava lake is clearly detectable. However, it was not apparent on August 10th and 11th due to cloud coverage. Variation in the lava lake activity and the degree of crusting can also account for the ~50 m² lake not being detected on every scene. Absence of thermal anomalies on the following days suggests that the lava lake started to significantly cool or drain during the night of August 12, which is consistent with the observation on August 17th of a 10 m-high cone with a large but empty crater.
5.2 July 2004
During 2004 activity was described for 44 days including continuous observations for
a 37-day-long period (GVN, 2005). The field observations extending from June 23 to the end of July are compared here with the data retrieved by MODLEN (Fig. 7b). In the last week of
12
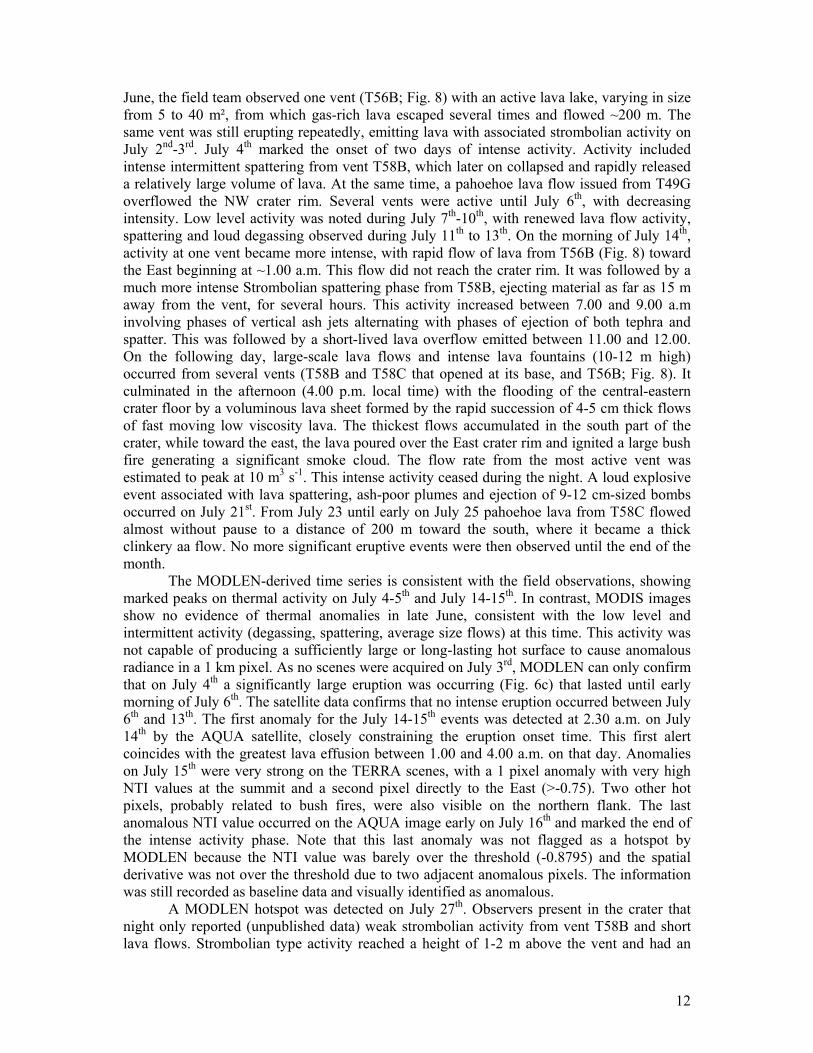
June, the field team observed one vent (T56B; Fig. 8) with an active lava lake, varying in size from 5 to 40 m², from which gas-rich lava escaped several times and flowed ~200 m. The same vent was still erupting repeatedly, emitting lava with associated strombolian activity on July 2nd-3rd. July 4th marked the onset of two days of intense activity. Activity included intense intermittent spattering from vent T58B, which later on collapsed and rapidly released a relatively large volume of lava. At the same time, a pahoehoe lava flow issued from T49G overflowed the NW crater rim. Several vents were active until July 6th, with decreasing intensity. Low level activity was noted during July 7th-10th, with renewed lava flow activity, spattering and loud degassing observed during July 11th to 13th. On the morning of July 14th, activity at one vent became more intense, with rapid flow of lava from T56B (Fig. 8) toward the East beginning at ~1.00 a.m. This flow did not reach the crater rim. It was followed by a much more intense Strombolian spattering phase from T58B, ejecting material as far as 15 m away from the vent, for several hours. This activity increased between 7.00 and 9.00 a.m involving phases of vertical ash jets alternating with phases of ejection of both tephra and spatter. This was followed by a short-lived lava overflow emitted between 11.00 and 12.00. On the following day, large-scale lava flows and intense lava fountains (10-12 m high) occurred from several vents (T58B and T58C that opened at its base, and T56B; Fig. 8). It culminated in the afternoon (4.00 p.m. local time) with the flooding of the central-eastern crater floor by a voluminous lava sheet formed by the rapid succession of 4-5 cm thick flows of fast moving low viscosity lava. The thickest flows accumulated in the south part of the crater, while toward the east, the lava poured over the East crater rim and ignited a large bush fire generating a significant smoke cloud. The flow rate from the most active vent was estimated to peak at 10 m3 s-1. This intense activity ceased during the night. A loud explosive event associated with lava spattering, ash-poor plumes and ejection of 9-12 cm-sized bombs occurred on July 21st. From July 23 until early on July 25 pahoehoe lava from T58C flowed almost without pause to a distance of 200 m toward the south, where it became a thick clinkery aa flow. No more significant eruptive events were then observed until the end of the month.
The MODLEN-derived time series is consistent with the field observations, showing marked peaks on thermal activity on July 4-5th and July 14-15th. In contrast, MODIS images show no evidence of thermal anomalies in late June, consistent with the low level and intermittent activity (degassing, spattering, average size flows) at this time. This activity was not capable of producing a sufficiently large or long-lasting hot surface to cause anomalous radiance in a 1 km pixel. As no scenes were acquired on July 3rd, MODLEN can only confirm that on July 4th a significantly large eruption was occurring (Fig. 6c) that lasted until early morning of July 6th. The satellite data confirms that no intense eruption occurred between July 6th and 13th. The first anomaly for the July 14-15th events was detected at 2.30 a.m. on July 14th by the AQUA satellite, closely constraining the eruption onset time. This first alert coincides with the greatest lava effusion between 1.00 and 4.00 a.m. on that day. Anomalies on July 15th were very strong on the TERRA scenes, with a 1 pixel anomaly with very high NTI values at the summit and a second pixel directly to the East (>-0.75). Two other hot pixels, probably related to bush fires, were also visible on the northern flank. The last anomalous NTI value occurred on the AQUA image early on July 16th and marked the end of the intense activity phase. Note that this last anomaly was not flagged as a hotspot by MODLEN because the NTI value was barely over the threshold (-0.8795) and the spatial derivative was not over the threshold due to two adjacent anomalous pixels. The information was still recorded as baseline data and visually identified as anomalous.
A MODLEN hotspot was detected on July 27th. Observers present in the crater that night only reported (unpublished data) weak strombolian activity from vent T58B and short lava flows. Strombolian type activity reached a height of 1-2 m above the vent and had an
13
eruptive period of ~5-10 sec. It deposited spatter on the upper two thirds of the cone, with some spatter being ejected up to 5 m to the east and some reaching the base of the cone during larger than average bursts. This is the only time that MODLEN was able to detect weak thermal activity at Lengai, possibly due to strombolian activity coinciding with satellite data acquisition. A new period of higher activity was recorded by MODLEN during the first week of August, with increasing NTI values recorded at summit after July 30th. This is consistent with observations from the volcano base of lava flows extending onto the NW flanks on July 30th, and at least one lava flow in the crater on August 4th (H. Anderson, written communication).
5.3 July 2005
A field visit occurred between July 19th and August 9th, 2005. Three very large
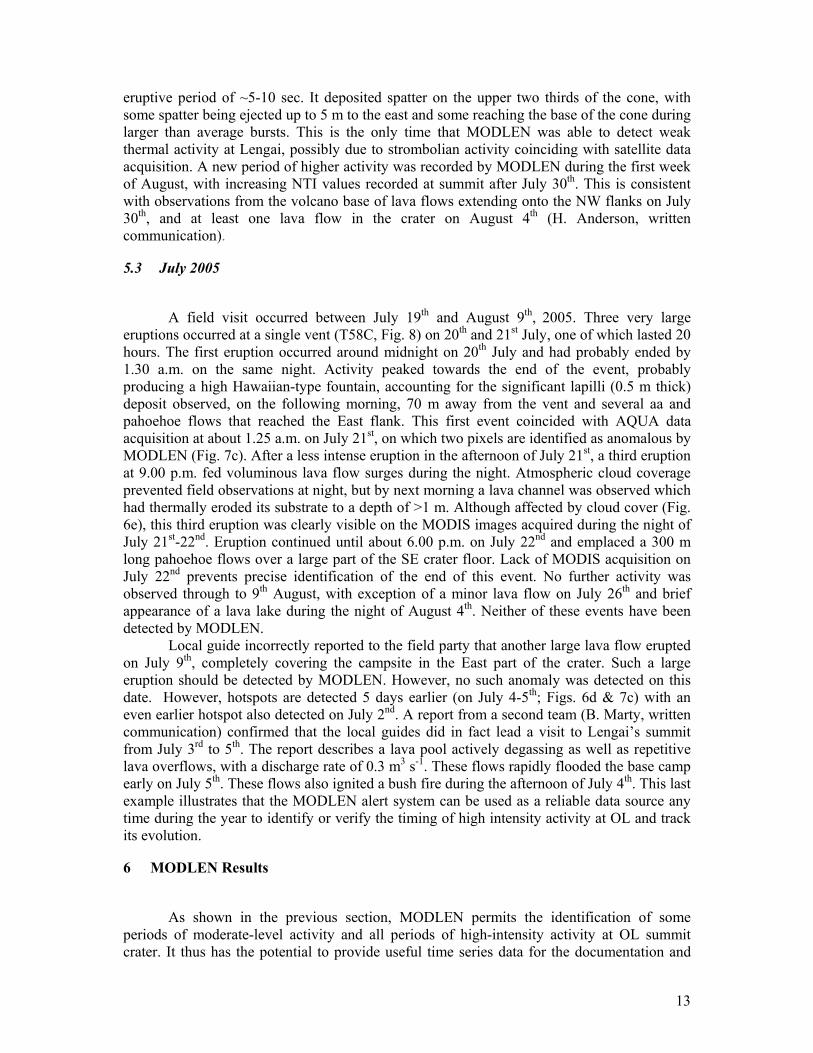
eruptions occurred at a single vent (T58C, Fig. 8) on 20th and 21st July, one of which lasted 20 hours. The first eruption occurred around midnight on 20th July and had probably ended by 1.30 a.m. on the same night. Activity peaked towards the end of the event, probably producing a high Hawaiian-type fountain, accounting for the significant lapilli (0.5 m thick) deposit observed, on the following morning, 70 m away from the vent and several aa and pahoehoe flows that reached the East flank. This first event coincided with AQUA data acquisition at about 1.25 a.m. on July 21st, on which two pixels are identified as anomalous by MODLEN (Fig. 7c). After a less intense eruption in the afternoon of July 21st, a third eruption at 9.00 p.m. fed voluminous lava flow surges during the night. Atmospheric cloud coverage prevented field observations at night, but by next morning a lava channel was observed which had thermally eroded its substrate to a depth of >1 m. Although affected by cloud cover (Fig. 6e), this third eruption was clearly visible on the MODIS images acquired during the night of July 21st-22nd. Eruption continued until about 6.00 p.m. on July 22nd and emplaced a 300 m long pahoehoe flows over a large part of the SE crater floor. Lack of MODIS acquisition on July 22nd prevents precise identification of the end of this event. No further activity was observed through to 9th August, with exception of a minor lava flow on July 26th and brief appearance of a lava lake during the night of August 4th. Neither of these events have been detected by MODLEN.
Local guide incorrectly reported to the field party that another large lava flow erupted on July 9th, completely covering the campsite in the East part of the crater. Such a large eruption should be detected by MODLEN. However, no such anomaly was detected on this date. However, hotspots are detected 5 days earlier (on July 4-5th; Figs. 6d & 7c) with an even earlier hotspot also detected on July 2nd. A report from a second team (B. Marty, written communication) confirmed that the local guides did in fact lead a visit to Lengai’s summit from July 3rd to 5th. The report describes a lava pool actively degassing as well as repetitive lava overflows, with a discharge rate of 0.3 m3 s-1. These flows rapidly flooded the base camp early on July 5th. These flows also ignited a bush fire during the afternoon of July 4th. This last example illustrates that the MODLEN alert system can be used as a reliable data source any time during the year to identify or verify the timing of high intensity activity at OL and track its evolution.
6 MODLEN Results
As shown in the previous section, MODLEN permits the identification of some
periods of moderate-level activity and all periods of high-intensity activity at OL summit crater. It thus has the potential to provide useful time series data for the documentation and
14
analysis of the temporal distribution of higher-intensity eruptions at Lengai. Such analysis would help constrain processes at work in the magmatic system at OL.
In addition to data collected to make the field data cross-checks described above, all MODIS scenes for a 15-month long period between April 2002 and June 2003 were systematically analysed using MODLEN. All the MODIS scenes acquired by both AQUA and TERRA platforms were downloaded, except those for which the preview revealed extensive and dense cloud cover over the Lengai region. A total of 615 scenes were analysed, giving an average of 21.5 scenes per month. The data are displayed in Figs. 9 & 10.
The thermal time series, using the ~4 µm radiance (Fig. 9) or NTI values (Fig. 10), shows a dominant low, baseline, level within which a low amplitude seasonal effect is apparent, with slightly higher values in September-October and February-March when the sun is at its highest elevation at this latitude. Such seasonal variation of the baseline has also been observed by Dehn et al. (2000) for the North Pacific volcanoes. A total of 27 MODLEN alerts were detected over this period (Table 3). An additional 10 pixels were visually identified as anomalous, but were not flagged as alert. These were not flagged because they were adjacent to a high intensity hotspot or were only just below the -0.88 threshold. However, they were characterised by above baseline-values in the thermal time series. These alerts occur in six main periods each lasting from a couple of days to a month (Fig. 10).
Little validation data is available for the period covered by the time series presented here except for August 2002, as has already been discussed in the previous section. In addition, between the end of May and mid-June 2002, field visitors reported low-levels of activity, except for June 18th when vent spattering reached heights of up to 3 m and produced a 50 m-long lava flow. The MODLEN data detect no anomalies at this time, except for one scene on June 2nd, 2002. This point plots well above the baseline level, but was not flagged by MODLEN as an alert due to a NTI value only just below the threshold (NTI : -0.8804; Fig. 10). The activity described for June 18th was, thus, not sufficient to cause a hotspot. This means that intermittent spattering, ejection of small lava fragments which cool in a few seconds, and typical, limited-extent, flow activity (i.e. flows only a few tens of meters long) can not be systematically detected by MODLEN.
During the first half of July, reports of observations from the volcano base do not suggest intense activity. MODLEN data however suggest that a significant eruptive event occurred during the night of July 6-7th between 11.10 p.m. (TERRA acquisition) and 2.05 a.m. (AQUA acquisition). The thermal activity detected by MODLEN in August is discussed in the previous section and corresponds with field observations. After August, the eruptive activity at OL was eye witnessed by a visiting group for 2 hours on September 26th when several active flows, as well as many inactive but recent flows, were identified - one of which flowed through a crack under the North crater rim (GVN, 2002). A grass fire was observed on the volcano NW flank on the following day and local Masai reported loud explosion noises during the previous night. This report corresponds to one of the two longest (i.e. 32 days) eruption periods recorded by MODLEN so far. One pixel, not detected by MODLEN, indeed was above baseline level on September 10th. Several MODLEN alerts were then identified during the last week of September with a peak on September 27th with 11 alerted pixels, most of which were also detected by MODVOLC, on the N flank (note than only the alerts located within 2 km of the summit are plotted on Fig. 10). This is consistent with the observations of a fire started by lava flowing over the crater rim. MODLEN alerts were still recorded until October 12th, 2002.
There are no field reports between end of September 2002 and mid-June 2003, except for a two-day visit during December which reported the occurrence of a 5 m diameter lava pool issuing a single 50 m long lava flow (GVN, 2003). No related thermal signal is detected by MODLEN due to intense cloud coverage in December. Although the continuity of the

15
MODIS data in the rainy season (i.e. November-March) is affected by frequent cloud coverage, another high intensity eruption period is clearly identified by MODLEN during the last week of November, with three MODLEN alerts on November 23rd and 27th (Fig. 10). One of these alerts was detected when the volcano was obviously cloud-covered. This illustrates that a strong thermal anomaly can still be detected even when OL is covered by thin or broken clouds.
Local guides reported that 2 new hornitos formed during the first half of 2003 in the centre of the active crater, that lava ponds appeared in these cones and later fed several lava flows. Although these accounts are not detailed, they are consistent with MODLEN results that display a 6 week-long period of high activity from February 13th to March 24th. More than half of the MODLEN alerts for the entire time series were detected during that period, activity concentrating especially in the last week of February and the first few days of March. According to local observers activity at these new hornitos was unusually intense in mid-June (GVN, 2004). MODLEN data, ending at the end of June, do not confirm this last report, as no abnormal thermal activity was detected for the whole month of June 2003. This may have been because virtually all the activity during this period (June-September 2003) was strombolian, and thus, by nature, intermittent and not producing long-lasting hot surfaces; thereby difficult to detect during daily passes, unless they fortuitously coincide with one of these short-lived events (Harris & Stevenson, 1997).
7 Discussion and Conclusions
7.1 Evaluating MODLEN capabilities
As part of an ongoing effort to document activity at Lengai since 2000, more than 800
night-time MODIS scenes were analysed using the MODLEN algorithm, covering 19 months of data (i.e. ~570 days). Over this period MODLEN enabled to detect 49 volcanogenic alerts on 43 different satellite scenes covering 36 different days (Table 3). An additional 18 other scenes were visually identified as alerts because of their above-baseline NTI values. MODLEN thus detected at least one alert on 8.5% of the days for which at least one scene was analysed. An independent dataset compiled from the field reports for the 209 days for which activity has been observed from the ground since 2001 allows assessment of the frequency of activity at OL. This compilation indeed suggests that “no activity” or “weak open vent/lava pool degassing” has been observed on 44% of the days. On 50% of the days low to moderate eruptive activity was recorded (lava flows within the crater for only tens of meters and Strombolian activity). High intensity activity, including high volume sustained flows, high lava fountains, and ash explosions, were observed for only 6% of the observation days. This suggests that MODLEN is sensitive only to high or very high intensity eruption events at OL.
The comparison with field observations also illustrates that MODLEN is capable of identifying virtually all periods of intense eruptions, especially those related to large active lava pools and extensive lava flow activity, sometimes associated with vegetation fires caused by lava overflowing the rim. There is only one example of a MODLEN alert not corresponding to an abnormally high period of activity (i.e. July 27th 2004, see section on July 2004).
The first limitation of MODLEN is that it acquires data in a discontinuous manner. Thus it provides an instantaneous record of the thermal state of the crater at just two given instants during each night (between 10.00-11.30 p.m. for TERRA and 1.30-3.00 a.m. for
16
AQUA, local time). This means that short duration events (i.e. lasting minutes to 1-2 hours), even some at fairly high intensity, might go undetected by MODLEN if they do not produce a “deposit” that will stay at high temperature until satellite image acquisition (i.e. a lava flow or lava lake).
Detection in such cases will thus depend on the timing of the event relative to data acquisition as well as on the eruption rate and explosivity of the event. Large eruption rates (>0.5 m³ s-1) will generate larger lava flows, piling up to a thickness >50 cm, that can remain warm for several days, while smaller effusion rates (~<0.1 m3 s-1), will tend to produce individual lava flows sufficiently thin to cool in a couple of hours. Field measurements of cooling rates by Pinkerton et al. (1995) indeed showed that temperature at the centre of a 31 mm thick pahoehoe flow lobe dropped from ~570°C to <250°C in 6 min of observation. This is consistent with basaltic events, where thick, voluminous flow fields can be apparent as hot, but cooling, anomalies for several weeks-to-months after the eruption event (Aries et al., 2001). However, thinner and smaller flow fields or short-lived events may be difficult to detect (Harris et al., 2001).
Dominantly explosive eruptions, typically of strombolian type at Lengai, produce pyroclastic deposits that cool much quicker than flows due to the fragmentation process (Thomas & Sparks, 1992). Strombolian eruptions at OL are of short duration and mostly intermittent, separated by quiescent periods of seconds to hours, and are associated with lower lava eruption rates. Thus, although they might appear as intense, due to their explosive nature, they will normally not generate a long-lasting thermal anomaly (Harris & Stevenson, 1997).
The second main limitation of MODIS images for thermal monitoring of active volcanoes especially in the sub-tropics is the frequent cloud coverage (see also Harris et al., 1997; Harris et al., 2001). While MODVOLC does not permit us to quantify the effect of cloud coverage on the thermal alert detection, MODLEN provides basic, though incomplete, assessment of cloud effects. Cold, high altitude clouds, can be easily discriminated (Flynn et al., 2002), as they are characterised by very low NTI values (<-0.92) and corresponding low radiance values in both band 22 (<0.25 W.m-².sr-1.µm-1) and 32 (<6 W.m-².sr-1.µm-1), which corresponds to brightness temperatures <0°C. These can be easily spotted in the time series and can thus be excluded (Fig. 10). Low elevation, more diffuse clouds or sub-pixel-size clouds affecting only part(s) of a given pixel appears to have much less of an effect on NTI values, and are difficult to discriminate from clear sky without using more complex algorithms (e.g. Ackerman et al., 1998). Diffuse or sub-pixel-size clouds might cause alerts to go undetected in what appears to be good, clear conditions.
MODLEN also detects non-volcanogenic alerts. About 74 additional MODLEN alerts (detected on 43 different scenes) that could not confidently be related to volcanic activity were detected from the 800 scenes examined so far. These non-volcanogenic alerts are 1.5 times more common that the volcanogenic ones. Most of them can easily be discriminated using the distance estimate between the pixel centre and OL’s active crater computed by MODLEN. In the absence of any alerts on the upper flank of the volcano, and knowing that lava flows, when they overflow the crater rim, do not flow down the flank for more than a few hundred meters, most of these alerts, being located more than 5 km away from the active crater can clearly be interpreted as not related to any volcanic activity. More than half of these alerts (41 out of the 74) can confidently be attributed to bush fires, due to an NTI value much higher than average value for OL’s lower flanks (>-0.85). Bush fires are common on the lower volcano flank. While some fires are related to lava flowing down the volcano flank, in which case the associated alert is close to the volcano summit, most fires are started by the local population and thus occur at a significant distance from the summit.
The rest of the alerts are related to the effects of clouds. Indeed, many NTI values on the lower flanks are frequently over the -0.88 threshold. When a pixel is adjacent to 3 pixels

17
or more that are affected by dense cold clouds, and thus have a low NTI value, the value of the spatial threshold might be sufficient for MODLEN to identify the central pixel as a hotspot. These false alerts are rare (2.5% of the analysed scenes) and can often be rejected using the distance parameter. Visual analysis of the MODIS scene is required to discriminate the origin of these anomalous pixels for which the cause of the alert is ambiguous. To avoid these alerts, a mask for cloud pixels can be used. Such cloud masks are automatically generated for any MODIS image using a series of tests and thresholds involving as many as 14 of the MODIS bands (Ackerman et al., 1998). It is distributed with the other MODIS products (MOD35_L2 products; Masuoka et al., 1998) but is available only 1-2 weeks after data acquisition, and its use would require longer data download and processing time. It is thus not useful for real-time monitoring purposes. A more straight-forward solution that will be implemented in a slightly more developed version of the MODLEN algorithm will be to identify cold clouds, based on radiance values in band 22 and 32, and then mask them.
A final limitation of the present MODLEN algorithm is that it was developed based on the assumption that Lengai volcanic activity will affect a single pixel on the MODIS image. Observations have shown that, although this assumption is valid in most cases, it happens that the thermal anomaly can concern 2 adjacent pixels. In such cases, the spatial threshold technique used will detect only the pixel with the highest NTI value, the value of the spatial derivative of the second pixel being lowered by the high NTI value of the adjacent pixel. Using an iterative process, masking MODLEN alerts detected on a previous run of the algorithm, as used by Harris et al. (1995a) and Higgins & Harris (1997), will allow, in a future more developed version of the algorithm, detection of all anomalous pixels. As in the case of Harris et al. (1995a), the iterative process stops when no new alert is detected.
In sum it appears that the MODLEN algorithm in its present version is well-suited to detect thermal activity in OL’s summit crater which corresponds to the 6-8% of days with most intense events, based on analysis of the OL record of the past years. As any significant hazards from OL would also be associated with such intense events and likely much more intense and rarer events, it does appear that the MODLEN system can contribute helpfully to a routine monitoring effort at OL.
7.2 Temporal distribution of alerts
Empirical observations at OL suggest that variations of eruption intensity, or eruption
rate, are not random with time. Recent field work has been dedicated to testing the hypothesis that the eruption rate at Lengai is controlled by daily tides, atmospheric pressure and/or moon cycles (Gordon et al., 2005). Based on a 30 days time series from field measurements at OL’s summit in July 2004, a statistically significant connection between increasing volcanic activity and decreasing or minimum barometric pressure has been recorded (Gordon et al., 2005). Preliminary compilation of all the field reports available (unpublished data) also suggest a possible relationships between intensity variations of eruptive activity at OL and lunar perigee and apogee. The hypothesis is that the control of such environmental factors on eruption rate and activity might be more pronounced at OL than at other volcanoes due to the low magma viscosity and to the open nature of the magmatic system.
The 15 month-long data series collected by MODLEN displays several periods (5-7) of increased activity ranging from 1 to 40 days in duration, with two main periods at the end of September and during February-March. Analyses so far have not enabled to identify that there could be a characteristic timing between periods of higher intensity activity. The interval separating high intensity activity varies between 3 weeks and 2-3 months. The data series this far established is not sufficiently long to statistically assess the potential effect of such
18
environmental factors on the temporal distribution of higher intensity activity periods. A detailed analysis of the relationship between eruption rate at OL and Earth tides will be undertaken after the ongoing collection of a 6 years dataset with MODLEN is completed. For example, a hypothesis that the occurrence of higher activity in September-October and March-April, due to a potential seasonal effect related to higher Earth tides amplitudes, may only be tested using a longer time series.
7.3 Perspectives
MODLEN was developed with the perspective of implementing it for near-real time
monitoring of OL’s activity. It will soon be routinely implemented on every newly acquired MODIS image made available on the internet. Our current processing of MODIS raw data relies on level 1B data being available, free of charge for download on the internet, 2 or 3 days after acquisition. While this does not yet permit real-time monitoring of the volcano, it does provide the most continuous and the most rapid way of retrieving information on OL’s activity, in the current absence of ground-based monitoring at the volcano. MODLEN implementation only requires an internet connection and requires less than 15 minutes of work each day, including data search and download (98% of the time) and running MODLEN to process and store the data (2% of the time). A shorter time lag could be achieved using the MODIS Direct Broadcast data that is transmitted by TERRA in near real-time using a dedicated ground station in Tanzania. Although more expensive, such a solution would enable the thermal monitoring of all the volcanoes of the region (i.e. Kenya, Tanzania), as well as fires, with a time lag reduced to less than an hour!
Although recent activity (e.g. since 1983) has been moderate at Lengai, a more intense explosive eruption is overdue and there is need for routine monitoring in the future. Low-cost thermal monitoring is an essential component of the much-needed monitoring program at several Tanzanian, Kenyan and Ethiopian volcanoes, and especially at OL. The MODLEN algorithm is capable of monitoring the relative thermal activity at OL. Systematic use by local volcanologists will allow identification of high activity periods. Continuous thermal RS monitoring can also provide a baseline from which the onset of abnormal eruptive activity or the beginning of more explosive and hazardous silicate magma eruptions, as occurred in 1917, 1940-41 and 1966-67, can be detected, as it is already the case, e.g. for volcanoes in North Pacific (Dehn et al., 2000).
Near-real time implementation will provide a long-term data series, while at the same time, all the archive MODIS data for Lengai will be analysed using MODLEN in order to obtain a near-daily record of eruption intensity at OL since December 1999. This will greatly extend the temporal record of eruption intensity variations at OL. This dataset, combined with available field reports, will provide a baseline knowledge of OL’s most intense activity since the earliest RS-documented eruption, and especially since 1999, using archive MODIS data. It will permit analysis of the temporal distribution of eruptive events and study of potential environmental controls on eruptive intensity on both long and short timescales. Availability of new, and detailed, field reports of the eruptive activity will also enable to assess the possible relationship between the intensity of activity and the thermal data recorded by MODIS (e.g. NTI value). The significance of small-scale variations of the NTI values in terms of variations in the activity will also be assessed.
MODVOLC is a robust, automated tool that returns global hotspot results (Flynn et al., 2002; Wright et al., 2002, 2004). It is not, however sufficiently sensitive to monitor thermal activity at volcanoes with low-level or intermittent effusive activity. MODLEN was adapted, building upon previous efforts to develop MODVOLC, to be as sensitive as possible
19
to thermal activity at OL and has the advantage of being based on a spatial threshold that is adaptable from image-to-image and case-to-case, thus allowing detection of more subtle anomalies than globally trained thresholds. Such an approach can be useful at other active volcanoes around the world displaying small-scale or low integrated-temperature thermal anomalies.
8 Acknowledgments
This work is dedicated to the people of Tanzania and Kenya and especially to the Masaï. M.K. and G.G.J.E. are funded by the Belgian NSF (FWO-Vlaanderen). The MODIS Thermal alert website (http://hotspot.higp.hawaii.edu/) and A.J.L. Harris are currently supported by NASA Grant NNG04G064G. This research was supported by the “Fondation Belge de la Vocation”. The MODIS data were provided by the Goddard Data Archive Centre. Reviews by R. Wright and S. Stewart greatly helped to improve a previous version of this paper. We are grateful to R. Wright and D. Rothery for insightful advice on MODIS image management and on the MODVOLC algorithm. C. Nyamweru, C. Weber and all the members of the Volcano Hazards Documentation and Logistic Research Organization (http://www.v-e-i.de/vhdl/) are thanked for providing field observations and data about Lengai. This effort would not have been possible without the support of UGent colleagues and without the long-term support of Steve Sparks, Bill Rose and of the “Fondation Belge de la Vocation” to G.G.J.E. and M.K.
9 References
ACKERMAN, S.A., STRABALA, K.I., MENZEL, W.P., FREY, R.A., MOELLER, C.C. and GUMLEY, L.A., 1998, Discriminating clear sky from clouds with MODIS. Journal of Geophysical Research, 103, pp. 32141-32157.
ARIES, S.E., HARRIS, A.J.L. and ROTHERY, D.A., 2001, Remote infrared detection of the cessation of volcanic eruptions. Geophysical Research Letters, 28, pp. 1803-1806.
BONNEVILLE, A. and GOUZE, P., 1992, Thermal survey of Mount Etna volcano from space. Geophysical Research Letters, 19, pp. 725-728.
CARN, S.A. and OPPENHEIMER, C., 2000, Remote monitoring of Indonesian volcanoes using satellite data from the Internet. International Journal of Remote Sensing, 21, pp. 873-910.
DAWSON, J.B., 1992, Neogene tectonics and volcanicity in the North Tanzania sector of the Gregory Rift Valley: Contrasts with the Kenya sector. Tectonophysics, 204, pp. 81-92.
DAWSON, J.B., BOWDEN, P. and CLARK, G.C., 1968, Activity of the carbonatite volcano Oldoinyo Lengai, 1966. Geologische Rundschau, 57, pp. 865-879.
DAWSON, J.B., PINKERTON, H., NORTON, G.E. and PYLE, D.M., 1990, Physicochemical properties of alkali carbonatite lavas: Data from the 1988 eruption of Oldoinyo Lengai, Tanzania. Geology, 18, pp. 260-263.
DAWSON, J.B., PINKERTON, H., PYLE, D.M. and NYAMWERU, C., 1994, June 1993 eruption of Oldoinyo Lengai, Tanzania: Exceptionnaly viscous and large carbonatite lava flows and evidence for coexisiting silicate and carbonate magmas. Geology, 22, pp. 799-802.
DEHN, J., DEAN, K. and ENGLE, K., 2000, Thermal monitoring of North Pacific volcanoes from space. Geology, 28, pp. 755-758.
20
DEHN, J., DEAN, K.G., ENGLE, K. and IZBEKOV, P., 2002, Thermal precursors in satellite images of the 1999 eruption of Shishaldin Volcano. Bulletin of Volcanology, 64, pp. 525-534.
FLYNN, L.P., WRIGHT, R., GARBEIL, H., HARRIS, A.J.L. and PILGER, E., 2002, A global thermal alert system using MODIS: Initial results from 2000-2001. Advances in Environmental Monitoring and Modelling, 1, pp. 37-69.
FOSTER, A., EBINGER, C., MBEDE, E. and REX, D., 1997, Tectonic development of the northern Tanzanian sector of the East African Rift System. Journal of the Geological Society of London, 154, pp. 689-700.
GALINDO, I. and DOMINGUEZ, T., 2003, Real-time AVHRR thermal monitoring and ash detection: The case of Colima volcano (Mexico). In: A. ROBOCK and C. OPPENHEIMER (Editors), Volcanism and the Earth Atmosphere. AGU Geophysical Monograph, 139, pp. 133-150.
GORDON, J., BELTON, F., CRIBB, W. and HENRY, J., 2005, Influences of changing lunar cycle and barometric pressure on the eruption of natrocarbonatite lava, Ol Doinyo Lengai volcano, Tanzania. Geological Society of America Abstracts with Programs, 37, pp. 7.
GVN, 1992, Oldoinyo Lengai: Continued lava production. Bulletin of the Global Volcanism Network, 17.
GVN, 2000, Oldoinyo Lengai: Continued intermittent eruptive activity, scientist burned by lava. Bulletin of the Global Volcanism Network, 25 (12).
GVN, 2002, Oldoinyo Lengai: Lava exits crater at 3 points during January 2001-September 2002. Bulletin of the Global Volcanism Network, 27 (10).
GVN, 2003, Oldoinyo Lengai: Continuing lava flows and vent activity in late December 2002. Bulletin of the Global Volcanism Network, 28 (02).
GVN, 2004, Oldoinyo Lengai: During February 2004, lavas still escape crater; temperature measurements. Bulletin of the Global Volcanism Network, 29 (02).
GVN, 2005, Oldoinyo Lengai: Tall hornito almost reaches summit elevations; more lava spills over rim. Bulletin of the Global Volcanism Network, 30 (04).
HARRIS, A.J.L., 1996, Towards automated fire monitoring from space: Semi-automated mapping of the January 1994 New South Wales wildfires using AVHRR data. International Journal of Wildland Fire, 6, pp. 107-116.
HARRIS, A.J.L. and STEVENSON, D.A., 1997, Thermal observations of degassing open conduits and fumaroles at Stromboli and Vulcano using remotely sensed data. Journal of Volcanology and Geothermal Research, 76, pp. 175-198.
HARRIS, A.J.L. and THORNBER, C., 1999, Complex effusive events at Kilauea as documented by the GOES satellite and remote video cameras. Bulletin of Volcanology, 61, pp. 382-395.
HARRIS, A.J.L., SWABEY, S.E.J. and HIGGINS, J., 1995a, Automated thresholding of active lavas using AVHRR data. International Journal of Remote Sensing, 16, pp. 3681-3686.
HARRIS, A.J.L., PILGER, E. and FLYNN, L.P., 2002, Web-based hot spot monitoring using GOEs: What it is and how it works. Advances in Environmental Monitoring and Modeling, 1, pp. 5-36.
HARRIS, A.J.L., ROSE, W.I. and FLYNN, L.P., 2003, Temporal trends in lava dome extrusion at Santiaguito 1922-2000. Bulletin of Volcanology, 65, pp. 77-89.
HARRIS, A.J.L., ROTHERY, D.A., CARLTON, R.W., LANGAAS, S. and MANNSTEIN, H., 1995b, Non-zero saturation of AVHRR thermal channels
21
over high-temperature targets: Evidence from volcano data and a possible explanation. International Journal of Remote Sensing, 16, pp. 189-196.
HARRIS, A.J.L., BUTTERWORTH, A.L., CARLTON, R.W., DOWNEY, I., MILLER, P., NAVARRO, P. and ROTHERY, D.A., 1997, Low-cost volcano surveillance from space: case studies from Etna, Krafla, Cerro Negro, Fogo, Lascar and Erebus. Bulletin of Volcanology, 59, pp. 49-64.
HARRIS, A.J.L., PILGER, E., FLYNN, L.P., GARBEIL, H., MOUGINIS-MARK, P.J., KAUAHIKAUA, J. and THORNBER, C., 2001, Automated, high temporal resolution, thermal analysis of Kilauea volcano, Hawai'i, using GOES satellite data. International Journal of Remote Sensing, 22, pp. 945-967.
HARRIS, A.J.L., FLYNN, L.P., DEAN, K., PILGER, E., WOOSTER, M.J., OKUBO, C., MOUGINIS-MARK, P.J., GARBEIL, H., THORNBER, C., DE LA CRUZ-RENYA, S., ROTHERY, D.A. and WRIGHT, R., 2000, Real-time satellite monitoring of volcanic hot spots. In: P.J. Mouginis-Mark, J. Crisp and J.F. Fink (Editors), Remote Sensing of Active Volcanism. AGU Geophysical Monograph, 116, pp. 139-159.
HIGGINS, J. and HARRIS, A.J.L., 1997, VAST: A program to locate and analyse volcanic thermal anomalies automatically from remotely sensed data. Computers & Geosciences, 23, pp. 627-645.
JOHNSON, J.B., HARRIS, A.J.L. and HOBLITT, R.P., 2005, Thermal observations of gas pistoning at Kilauea Volcano. Journal of Geophysical Research-Solid Earth, 110.
KAUFMAN, Y.J., JUSTICE, C.O., FLYNN, L.P., KENDALL, J.D., PRINS, E.M., GIGLIO, L., WARD, D.E., MENZEL, W.P. and SETZER, A.W., 1998, Potential global fire monitoring from EOS-MODIS. Journal of Geophysical Research-Atmospheres, 103, pp. 32215-32238.
KELLER, J., 2002. Cone collapses, flank stability and hazards at Oldoinyo Lengai, Tanzania, IAVCEI International Congress Abstracts with Program, Montagne Pelée 1902-2002, pp. 68.
KELLER, J. and KLAUDIUS, J., 2003. Volcanic hazard assessment at Oldoinyo Lengai, Tanzania, XXIII IUGG General Assembly Abstracts, Sapporo.
KERVYN, M., KLAUDIUS, J., KELLER, J., MBEDE, E., JACOBS, P. and ERNST, G.G.J., 2007, Remote sensing evidence for sector collapses and debris avalanches at Oldoinyo Lengai and Kerimasi volcanoes, Tanzania. International Journal of Remote Sensing, xxx (submitted).
KLAUDIUS, J. and KELLER, J., 2004. Quaternary debris avalanche deposits at Oldoinyo Lengai (Tanzania), IAVCEI General Assembly Abstracts with Program, Pucon, Chili.
KRAFFT, M. and KELLER, J., 1989, Temperature measurements in carbonatite lava-lake and flows: Oldoinyo Lengai, Tanzania. Science, 245, pp. 168-170.
LACHLAN-COPE, T., SMELLIE, J.L. and LADKIN, R., 2001, Discovery of a recurrent lava lake on Saunders Island (South Sandwich Islands) using AVHRR imagery. Journal of Volcanology and Geothermal Research, 112, pp. 105-116.
LILLESAND, T.M. and KIEFER, R.W., 2000, Remote sensing and image interpretation. John Wiley & Sons, New York, (5th ed), 784 pp.
MASUOKA, E., FLEIG, A., WOLFE, R.E. and PATT, F., 1998, Key characteristics of MODIS data products. IEEE Transactions on Geoscience & Remote Sensing, 36, pp. 1313-1323.
MODIS, Data & Information Service Center website, Available on line at: http://daac.gsfc.nasa.gov/MODIS/ (Accessed 10 November 2005)

22
NORTON, G.E. and PINKERTON, H., 1997, Rheological properties of natrocarbonatite lavas from Oldoinyo Lengai, Tanzania. European Journal of Mineralogy, 9, pp. 351-364.
NYAMWERU, C., 1990, Observations on changes in the active crater of Oldoinyo Lengai from 1960 to 1988. Journal of African Earth Sciences, 11, pp. 385-390.
NYAMWERU, C., 1997, Changes in the crater of Oldoinyo Lengai: June 1993 to February 1997. Journal of African Earth Sciences, 25, pp. 43-53.
OPPENHEIMER, C., 1991, Lava flow cooling estimated from Landsat Thematic Mapper infrared data: The Lonquimay eruption (Chile, 1989). Journal of Geophysical Research, 96, pp. 21865-21878.
OPPENHEIMER, C., 1997, Satellite observation of active carbonatite volcanism at Oldoinyo Lengai, Tanzania. International Journal of Remote Sensing, 19, pp. 55-64.
OPPENHEIMER, C., 1998, Volcanological application of meteorological satellite data. International Journal of Remote Sensing, 19, pp. 2829-2864.
OPPENHEIMER, C., FRANCIS, P.W., ROTHERY, D.A., CARLTON, R.W.T. and GLAZE, L., 1993, Infrared image analysis of volcanic thermal features: Lascar volcano, Chile, 1984-1992. Journal of Geophysical Research, 98, pp. 4269-4286.
PERGOLA, N., MARCHESE, F. and TRAMUTOLI, V., 2004, Automated detection of thermal features of active volcanoes by means of infrared AVHHR records. Remote Sensing of Environment, 93, pp. 311-327.
PINKERTON, H., NORTON, G.E., DAWSON, J.B. and PYLE, D.M., 1995, Field observations and measurements of the physical properties of Oldoinyo Lengai alkalic carbonatite lavas, November 1988. In: K. Bell and J. Keller (Editors), Carbonatite volcanism: Oldoinyo Lengai and the petrogenesis of natrocarbonatites. IAVCEI Proceedings in Volcanology. Springer-Verlag, 4, pp. 23-36.
PRINS, E.M. and MENZEL, W.P., 1994, Trends in South-American biomass burning detected with the GOES visible infrared spin scan radiometer atmospheric sounder from 1983 to 1991. Journal of Geophysical Research-Atmospheres, 99, pp. 16719-16735.
ROTHERY, D.A., FRANCIS, P.W. and WOOD, C.A., 1988, Volcano monitoring using short wavelength infrared data from satellites. Journal of Geophysical Research-Solid Earth and Planets, 93, pp. 7993-&.
ROTHERY, D.A., COPPOLA, D. and SAUNDERS, C., 2005, Analysis of volcanic activity patterns using MODIS thermal alerts. Bulletin of Volcanology, 67, pp. 539-556.
SCHNEIDER, D.J., DEAN, K.G., DEHN, J., MILLER, T.P. and KIRIANOV, V.Y., 2000, Monitoring and analysis of the volcanic activity using remote sensing data at the Alaska Volcano Observatory: Case study for Kamchatka, Russia, December 1997. In: P.J. Mouginis-Mark, J. Crisp and J.F. Fink (Editors), Remote Sensing of Active Volcanism. AGU Geophysical Monograph, 116, pp. 65-86.
THOMAS, R.M.E. and SPARKS, R.S.J., 1992, Cooling of tephra during fallout from eruption columns. Bulletin of Volcanology, 54, pp. 542-553.
WOLFF, J.A., 1994, Physical properties of carbonatite magmas inferred from molten salt data, and application to extraction patterns from carbonatite silicate magma chambers. Geological Magazine, 131, pp. 145-153.

23
WRIGHT, R. and FLYNN, L.P., 2003, Satellite observations of thermal emission before, during, and after the January 2002 eruption of Nyiragongo. Acta Vulcanologica, 15, pp. 67-74.
WRIGHT, R., FLYNN, L.P., GARBEIL, H., HARRIS, A.J.L. and PILGER, E., 2002, Automated volcanic eruption detection using MODIS. Remote Sensing of Environment, 82, pp. 135-155.
WRIGHT, R., FLYNN, L.P., GARBEIL, H., HARRIS, A.J.L. and PILGER, E., 2004, MODVOLC: Near-real time thermal monitoring of global volcanism. Journal of Volcanology and Geothermal Research, 135, pp. 29-49.
10 Captions of Tables
Table 1 Hot spots detected by the MODVOLC algorithm (i.e. only 9 alerts) since December 1999 with centre
pixel coordinates within ~1.5 km of the active crater of OL. Principal information provided by the alert files and field observations are summarized in the Table (see text for discussion). Lat, Long: Coordinates of the centre of
the pixel in Decimal Degree; NTI: Normalized Thermal Index; B21, B22, B32: Radiance values for MODIS bands 21 & 22 (both at 3.95 µm) and 32 (12 µm).
Table 2 Summary of field observations and link to thermal activity reported in Figs 7 a, b, c.
Table 3 Volcanogenic hot spots detected for OL by the MODLEN algorithm (i.e. 49 alerts). Note that compared
with Table 1, Table 2 data is merely for the time periods examined so far (i.e. 1/3 of 2000-2006 period) and discussed in the text. Hence MODLEN is expected to lead to detection of 100-150 alerts for the 2000-2005
period compared to only 9 alerts for MODVOLC for same period. Principal information provided by the alert files is summarized in the Table. Lat, Long: Coordinates of the centre of the pixel in Decimal Degree; NTI:
Normalized Thermal Index; B21, B22, B32: Radiance value for MODIS band 21 & 22 (3.95 µm) and 32 (12 µm). Additional pixels were visually identified as thermal anomalies but were not identified as alert by
MODLEN because they were neighboured by other anomalies or because they were just below the algorithm threshold. These visual alerts are not listed in this table.
Table 1
MODVOLC ALERTS Sensor Date Time Lat Long NTI B21 B22 B32 Field Observations
Terra 07-21-2000 20:40 35.916 -2.764 -0.763 0.776 0.766 5.702 Large volume lava flow Terra 09-27-2002 20:40 35.903 -2.750 -0.432 3.044 Saturated 7.668 Terra 09-27-2002 20:40 35.927 -2.745 -0.619 1.960 1.804 7.660
Terra 11-27-2002 20:10 35.912 -2.761 -0.792 0.628 0.777 6.708
Bush fire caused by lava overflowing OL crater rim
Terra 07-15-2004 19:40 35.905 -2.760 -0.648 1.551 1.565 7.324 Large volume lava flow Terra 07-15-2004 19:40 35.893 -2.759 -0.742 1.000 1.098 7.406 Large volume lava flow Terra 07-15-2004 19:40 35.916 -2.756 -0.736 1.113 1.100 7.241 Large volume lava flow Aqua 09-30-2004 11:20 35.905 -2.766 -0.542 3.690 Saturated 9.468 Aqua 07-20-2005 22:25 35.892 -2.752 -0,752 1.035 1.028 7.249 Large volume lava flow

24
Key Features
Level and trend of thermal signal
Field observations (FO) or likely interpretations from thermal data alone (TDA)
August 2002
From weak spattering with small lava flow to intense lava fountaining growing a 10m-high cone around a vigorously active pool
1 Weak but intensifying Weak spattering and small aa flow emitted (FO) 2 Intense to very intense First high intensity activity with intense lava fountaining
and extensive lava flow (FO) 3 Very low Activity continuing but satellite observations obscured by
clouds (FO) 4 Very intense Freshly-emplaced lava lake (50m²) (FO) 5 Fairly weak Lava lake still full but satellite observations obscured by
clouds (TDA) 6 Relatively intense Recently emplaced lava lake still full and again visible to
satellite (TDA) 7 Weakening Lava pool probably draining (TDA) 8 Very Low Likely end of eruption (TDA) 9 Weak Lava pool observed to be empty and eruptions observed
to be over (FO) June-August 2004
Waxing and waning cycles of spattering (Strombolian) activity feeding short lava flows with occasional intense lava fountaining (Hawaiian) event feeding much more extensive lava flows
10 Low & gradually increasing till July 1
Active lava lake generating some flows eventually reaching 100 m long (FO)
11 Low & decreasing on July 2; data gap July 3
Some vent intermittently active with spattering (Strombolian) (FO)
12 High and increasing to July 4 Onset of intense activity - intense Strombolian with extensive flows active till July 6 (FO)
13 Decreasing, low intensity Decreasing activity typically low level from several vents. No new lava flows between July 7-10 (FO)
14 Increasing to moderate level between July 11-13
Moderately intense spattering and some renewed lava flow activity (FO between July 11-13 (FO)
15 High increasing to extremely high July 14-15
More intense spattering feeding one long flow on July 14 followed by violent Strombolian/Hawaiian activity leading to large-scale lava flows starting bush fire (FO)
16 High but decreasing fast from 19
End of very intense eruptive phase (FO)
17 Moderate to low and decreased from 20 (July 21)
Intermittent Strombolian/spattering activity intense on July 21. Activity much less intense than on July 14-15 (FO)
18 Low to moderate and increasing from 21
Extensive lava flow from new vent (FO)
19 Moderate/randomly varying Weak intermittent spattering activity and short flows (FO) only leading to high thermal signal when activity closely coincides with data acquisition by satellite on July 27
20 Low increasing to high on 1st week of August
Gradually increasing activity not documented from ground (TDA) except for sighting of extensive lava flow overflowing the crater rim - seen from volcano base on July 30 - and at least one lava flow in crater on August 4
July-August 2005
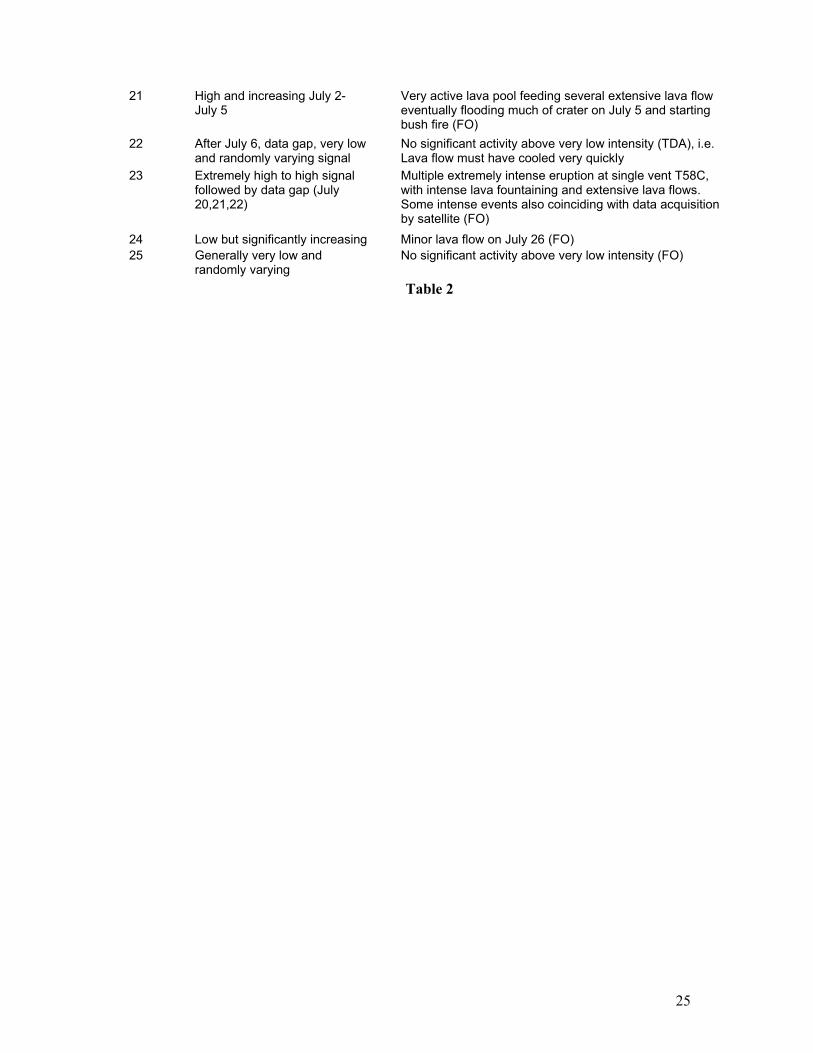
25
21 High and increasing July 2-July 5
Very active lava pool feeding several extensive lava flow eventually flooding much of crater on July 5 and starting bush fire (FO)
22 After July 6, data gap, very low and randomly varying signal
No significant activity above very low intensity (TDA), i.e. Lava flow must have cooled very quickly
23 Extremely high to high signal followed by data gap (July 20,21,22)
Multiple extremely intense eruption at single vent T58C, with intense lava fountaining and extensive lava flows. Some intense events also coinciding with data acquisition by satellite (FO)
24 Low but significantly increasing Minor lava flow on July 26 (FO) 25 Generally very low and
randomly varying No significant activity above very low intensity (FO)
Table 2
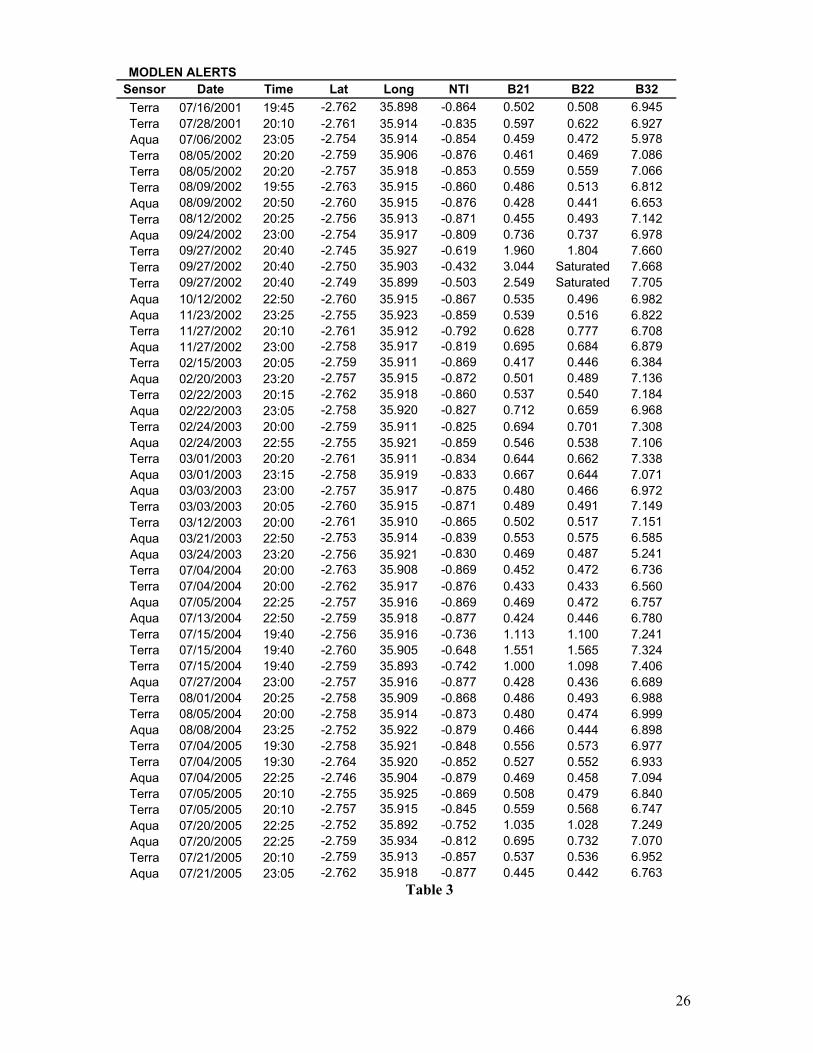
26
Table 3
MODLEN ALERTS Sensor Date Time Lat Long NTI B21 B22 B32 Terra 07/16/2001 19:45 -2.762 35.898 -0.864 0.502 0.508 6.945 Terra 07/28/2001 20:10 -2.761 35.914 -0.835 0.597 0.622 6.927 Aqua 07/06/2002 23:05 -2.754 35.914 -0.854 0.459 0.472 5.978 Terra 08/05/2002 20:20 -2.759 35.906 -0.876 0.461 0.469 7.086 Terra 08/05/2002 20:20 -2.757 35.918 -0.853 0.559 0.559 7.066 Terra 08/09/2002 19:55 -2.763 35.915 -0.860 0.486 0.513 6.812 Aqua 08/09/2002 20:50 -2.760 35.915 -0.876 0.428 0.441 6.653 Terra 08/12/2002 20:25 -2.756 35.913 -0.871 0.455 0.493 7.142 Aqua 09/24/2002 23:00 -2.754 35.917 -0.809 0.736 0.737 6.978 Terra 09/27/2002 20:40 -2.745 35.927 -0.619 1.960 1.804 7.660 Terra 09/27/2002 20:40 -2.750 35.903 -0.432 3.044 Saturated 7.668 Terra 09/27/2002 20:40 -2.749 35.899 -0.503 2.549 Saturated 7.705 Aqua 10/12/2002 22:50 -2.760 35.915 -0.867 0.535 0.496 6.982 Aqua 11/23/2002 23:25 -2.755 35.923 -0.859 0.539 0.516 6.822 Terra 11/27/2002 20:10 -2.761 35.912 -0.792 0.628 0.777 6.708 Aqua 11/27/2002 23:00 -2.758 35.917 -0.819 0.695 0.684 6.879 Terra 02/15/2003 20:05 -2.759 35.911 -0.869 0.417 0.446 6.384 Aqua 02/20/2003 23:20 -2.757 35.915 -0.872 0.501 0.489 7.136 Terra 02/22/2003 20:15 -2.762 35.918 -0.860 0.537 0.540 7.184 Aqua 02/22/2003 23:05 -2.758 35.920 -0.827 0.712 0.659 6.968 Terra 02/24/2003 20:00 -2.759 35.911 -0.825 0.694 0.701 7.308 Aqua 02/24/2003 22:55 -2.755 35.921 -0.859 0.546 0.538 7.106 Terra 03/01/2003 20:20 -2.761 35.911 -0.834 0.644 0.662 7.338 Aqua 03/01/2003 23:15 -2.758 35.919 -0.833 0.667 0.644 7.071 Aqua 03/03/2003 23:00 -2.757 35.917 -0.875 0.480 0.466 6.972 Terra 03/03/2003 20:05 -2.760 35.915 -0.871 0.489 0.491 7.149 Terra 03/12/2003 20:00 -2.761 35.910 -0.865 0.502 0.517 7.151 Aqua 03/21/2003 22:50 -2.753 35.914 -0.839 0.553 0.575 6.585 Aqua 03/24/2003 23:20 -2.756 35.921 -0.830 0.469 0.487 5.241 Terra 07/04/2004 20:00 -2.763 35.908 -0.869 0.452 0.472 6.736 Terra 07/04/2004 20:00 -2.762 35.917 -0.876 0.433 0.433 6.560 Aqua 07/05/2004 22:25 -2.757 35.916 -0.869 0.469 0.472 6.757 Aqua 07/13/2004 22:50 -2.759 35.918 -0.877 0.424 0.446 6.780 Terra 07/15/2004 19:40 -2.756 35.916 -0.736 1.113 1.100 7.241 Terra 07/15/2004 19:40 -2.760 35.905 -0.648 1.551 1.565 7.324 Terra 07/15/2004 19:40 -2.759 35.893 -0.742 1.000 1.098 7.406 Aqua 07/27/2004 23:00 -2.757 35.916 -0.877 0.428 0.436 6.689 Terra 08/01/2004 20:25 -2.758 35.909 -0.868 0.486 0.493 6.988 Terra 08/05/2004 20:00 -2.758 35.914 -0.873 0.480 0.474 6.999 Aqua 08/08/2004 23:25 -2.752 35.922 -0.879 0.466 0.444 6.898 Terra 07/04/2005 19:30 -2.758 35.921 -0.848 0.556 0.573 6.977 Terra 07/04/2005 19:30 -2.764 35.920 -0.852 0.527 0.552 6.933 Aqua 07/04/2005 22:25 -2.746 35.904 -0.879 0.469 0.458 7.094 Terra 07/05/2005 20:10 -2.755 35.925 -0.869 0.508 0.479 6.840 Terra 07/05/2005 20:10 -2.757 35.915 -0.845 0.559 0.568 6.747 Aqua 07/20/2005 22:25 -2.752 35.892 -0.752 1.035 1.028 7.249 Aqua 07/20/2005 22:25 -2.759 35.934 -0.812 0.695 0.732 7.070 Terra 07/21/2005 20:10 -2.759 35.913 -0.857 0.537 0.536 6.952 Aqua 07/21/2005 23:05 -2.762 35.918 -0.877 0.445 0.442 6.763

27
11 Captions of figures
Fig. 1 Regional geological context of the Northern Tanzanian section of the East African Rift. Black arrow points to location of Oldoinyo Lengai (OL). The volcano is situated against the Western wall of the Gregory rift valley, ~16 km south of Lake Natron (Dawson 1992). OL is part of a large volcano cluster including several calderas (e.g. Ngorongoro), stratovolcanoes (e.g. Kerimasi) and shields (e.g. Gelai, Ketumbeine), Lengai being the only historically active volcano (i.e. in the last century). Subset shows a sketched map of the Lengai area, including explosion crater and scoria cones (Courtesy of Chris Weber). Fig. 2 (a) Photo of the 450 m-wide Lengai North active crater, taken from South on July 28, 2001. ~15 hornitos cover the crater floor. Several of them can have mildly explosive or effusive activity at the same time. White colour is due to rapid alteration of natrocarbonatite lava. A fresh lava flow (black coloured) originating from a central hornito extends all the way to the S crater wall (~200 m long). 2 ash cones, formed by explosive eruption in 1993 are visible in the foreground and to the East of the crater, respectively. The white arrow marks the 8m-high hornito T51, also visible in (b). (b) Active vent (T49F) within Lengai summit crater emitting a 8 m high lava fountain (photo looking West on August 9th, 2002, see Fig. 7c). People in the background stand on the West crater rim, ~150 m away. Intermittent lava fountain <30 m high and low viscosity lava flows <200 m long, 10-20 m wide and <0.5 m thick are typical activity at Lengai. The natrocarbonatite lava flows erupted at temperatures between ~510-595°C (GVN 2002). Fig. 3 Planck curves for a range of blackbody surfaces. Curves for thermally homogeneous surfaces exhibit an increasing slope between 4 and 12 µm. This relationship breaks down for pixels containing sub-pixel-sized radiators, as the amount of radiance emitted at 4 µm increases faster than that at 12 µm (f1 and f2: proportion of pixel at temperature T1 and T2, respectively). Notice that a hot material covering only 0.05% of a pixel (500 m² within a MODIS 1 km pixel) has a marked 4 µm peak at 1000°C (basaltic lava), less well marked at 550°C (natrocarbonatite lava). The NTI value (Normalised Thermal Index) is a ratio between radiance at those 2 wavelengths (R4µm-R12µm)/( R4µm+R12µm). Fig. 4 Radiance maps of the summit of Lengai, recorded on March 1st, 2003 for band 22 (3.95 µm) (a) and derived NTI (c). Radiance values vary with ground elevation, lower values indicating higher elevations due to colder surface temperature. Although a peak emission is obvious at Lengai summit in band 22, this value cannot be discriminated from similar values from lower flanks. The NTI value, although still decreasing with higher elevation, enables to enhance the abnormally hot pixel at Lengai summit, with a value of -0.835, much higher than the surrounding pixels (<-0.86). Fig. 5 Flow diagram illustrating the operations of the MODLEN algorithm (adapted from Wright et al. 2004). After selecting the data for the region of interest, the algorithm evaluates data quality. Bad quality data are recorded by a digital number value >37767 by the MODIS sensor. They correspond to pixels for which the
radiance value cannot be extracted. ∆x∆y∆NTI
, NTI, neighNTI are the values of the spatial derivative of the NTI
values for a given pixel, the NTI value for that pixel and the average of NTI values for the 8 neighbouring pixels respectively. Fig. 6 Stretched grey-scaled night-time MODIS band 22 (3.95 µm) over Lengai (identified by the white arrow) for (a) August 5, 2002 (TERRA), (b) August 9, 2002 (AQUA), (c) July 4, 2004 (TERRA), (d) July 4, 2005 (TERRA) and (e) July 21, 2005. Lengai is located close to the image centre and characterised by one of 2 brighter pixels. North is up in each image; scenes were not geocorrected. (f) Generalized sketch of topographic features visible on the MODIS scenes: the Crater Highlands to the SW (CrH), including the lake of the Embagai caldera; Lake Natron to the N (LN); Gelai (G) and Ketumbeine (K) shield volcanoes as well as Oldoinyo Lengai (OL) and Kerimasi strato-volcanoes (Kr); the rift valley wall is denoted by the stippled line. Image contrast has been stretched independently for each scene to help visualisation. Scenes (a) and (e) are covered by clouds in most parts. Fig. 7 Time series of NTI value for Lengai crater, collected using MODLEN, including all MODLEN alerts within 2 km of Lengai summit for (a) August 1st to 19th, 2002 (b) June 20 to August 16, 2004 and (c) July 1st to August 10th, 2005. Dates are reported in “Universal time” (i.e. an image recorded at 2 a.m. local time on July 5th, will be plotted on July 4th), following the convention month/day/year. Horizontal black bars denote periods of available field reports. Vertical grey bars mark data acquisition gaps. Numbers refers to validation data from

28
field reports and interpretation of the thermal signal summarized in Table 2. Thresholds of (-0.88) and (-0.92) for eruptive activity in progress and unambiguous cloud coverage are valid for all three periods. Fig. 8 Sketch maps of crater features at OL (a) in August 2002 based on field observations and (b) in February 2005 surveyed with a global positioning system (GPS) (Courtesy of Chris Weber; GVN 2002, 2005). Although crater morphology and vents are rapidly changing at Lengai, this sketch allows to spot the location of the vent clusters T49 (August 2001 and 2002), T56 (July 2004) and T58 (July 2004 and 2005) which were active for several periods discussed in the text (different vents within a single hornito are identified using letters in the text but not in the figure). Activity within the crater has been focusing on the central vent cluster since 2002.All vents active during periods discussed in text are located in the central part of the crater (stippled circle). Fig. 9 Time series for April 2002 to June 2003 of MODIS band 22 (3.95 µm) radiance (in W.m-2.sr-1.µm-1) night-time scenes for pixel covering Lengai North crater, and hotspot pixel detected by MODLEN within 2 km of Lengai summit. One extreme pixel anomaly recorded on September 27, 2002 by the MODIS scene plots outside the data range (1.85 W.m-2.sr-1.µm-1; see Tables 1, 3). An obvious baseline level is visible between 0.3 and 0.4 W.m-2.sr-1.µm-1, with a weak seasonal variation of this baseline value. Stippled black line marked thresholds as in Fig. 7a. Interpretations for the thermal anomalies of this period are given in Figure 10. Fig. 10 Example of time series data here for April 2002 to June 2003 of the Normalised Thermal Index (NTI). Plotted are cloud-free MODIS night-time scenes for pixels covering Lengai, and hotspot pixels detected by MODLEN within 2 km of Lengai summit. Cloud coverage is substantially reducing the amount of data available for the periods April-May 2002 and the rainy-season of October 2002 to January 2003. Periods for which data are lacking (i.e. either due to cloud coverage or satellite data acquisition gaps) for more than five consecutive days, are marked by the grey vertical bars. The main periods of activity discussed in the text are identified. Tick marks are 5 days apart for clarity. Detailed field reports exist only for the end of June and the first days of August 2002 as discussed in the text.
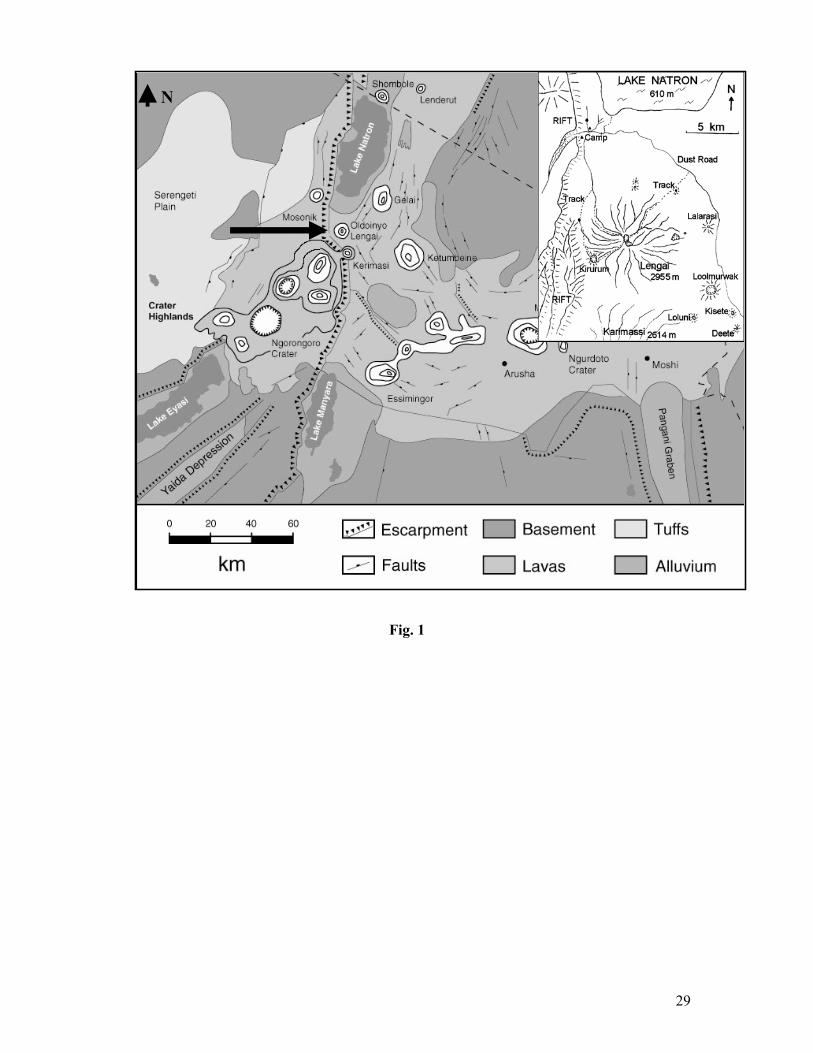
29
Fig. 1
N
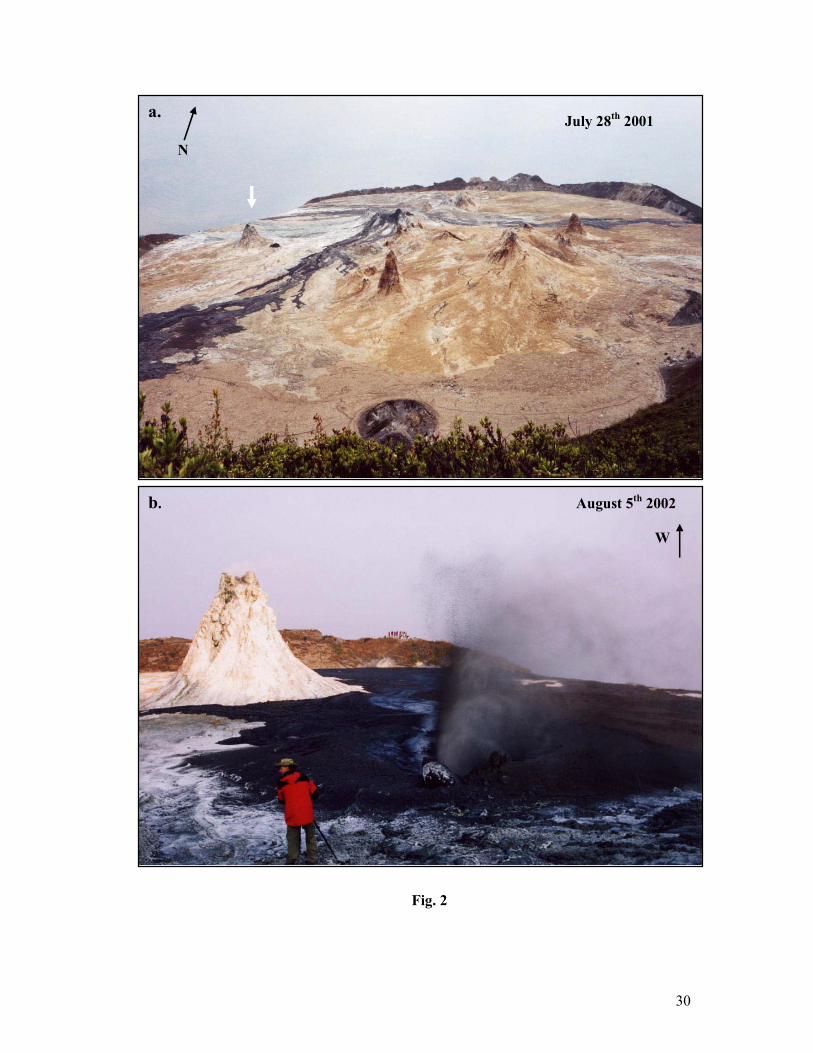
30
Fig. 2
August 5th 2002
W
b.
July 28th 2001
N
a.
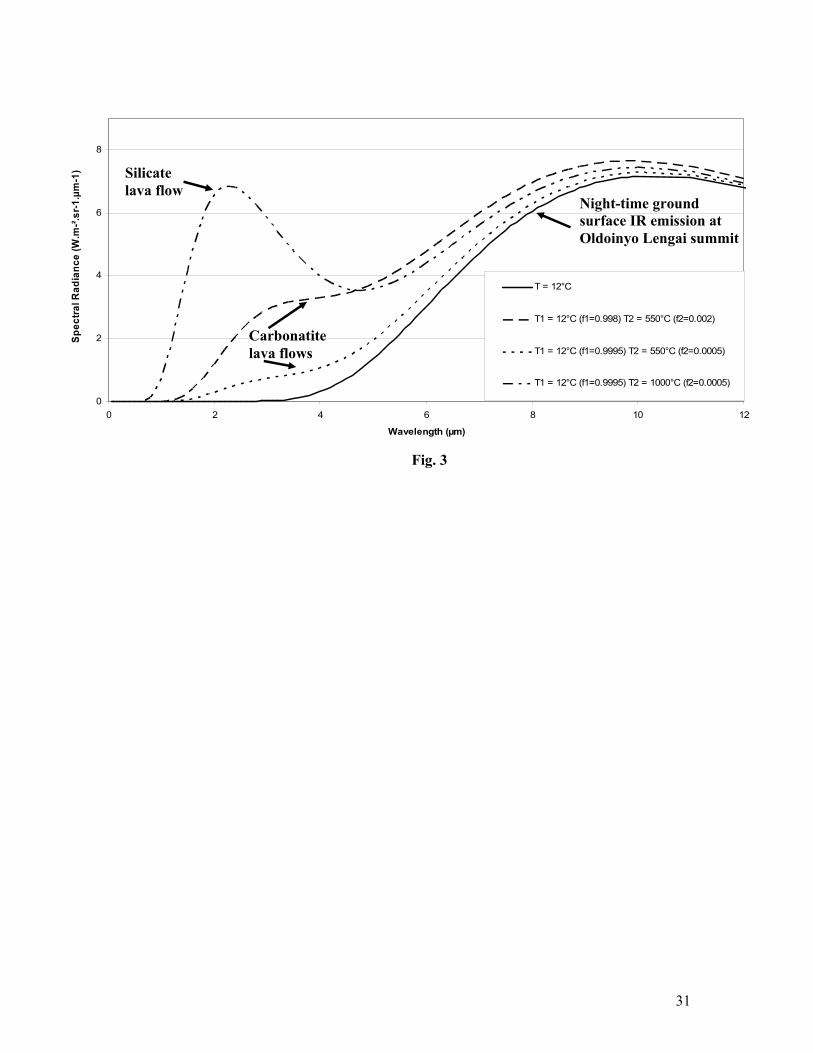
31
Fig. 3
Spec
tral R
adia
nce
(W.m
-².sr
-1.µ
m-1
)
0
2
4
6
8
0 2 4 6 8 10 12
Wavelength (µm)
T = 12°C
T1 = 12°C (f1=0.998) T2 = 550°C (f2=0.002)
T1 = 12°C (f1=0.9995) T2 = 550°C (f2=0.0005)
T1 = 12°C (f1=0.9995) T2 = 1000°C (f2=0.0005)
Carbonatite lava flows
Silicate lava flow
Night-time ground surface IR emission at Oldoinyo Lengai summit
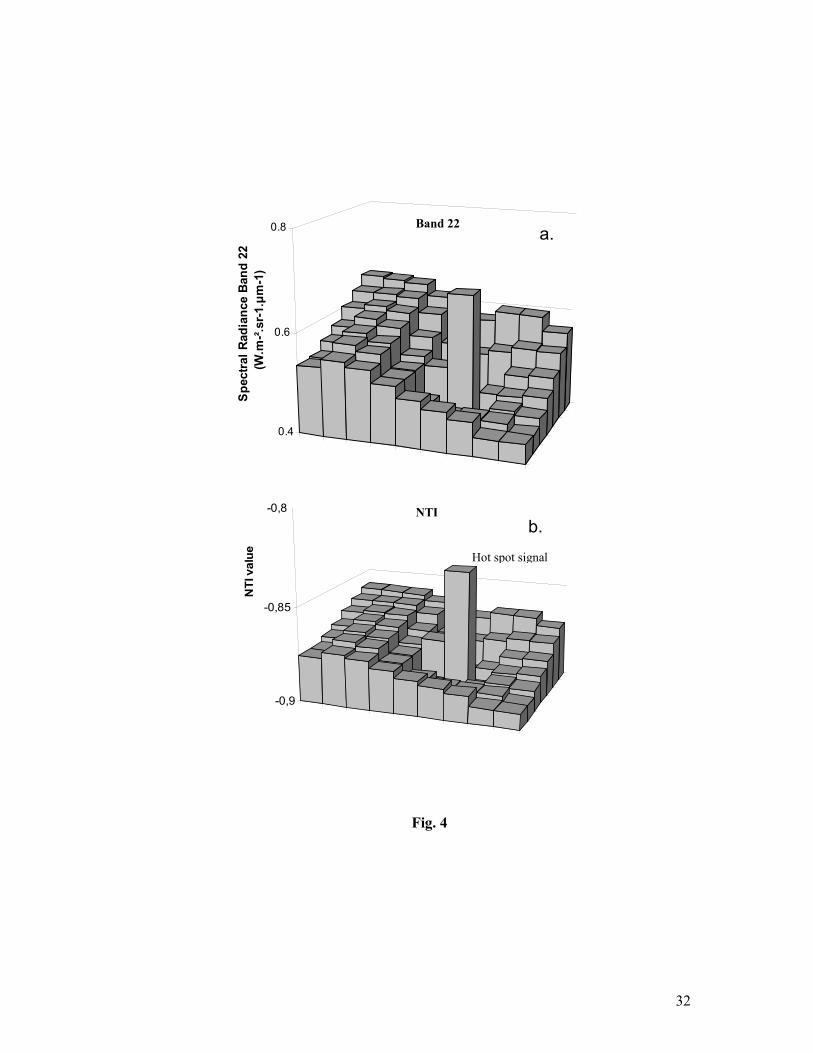
32
Fig. 4
a.
0.4
0.6
0.8S
pect
ral R
adia
nce
Ban
d 22
(W
.m-².
sr-1
.µm
-1)
a.Band 22
-0,9
-0,85
-0,8
NTI
val
ue
b.NTI
Hot spot signal
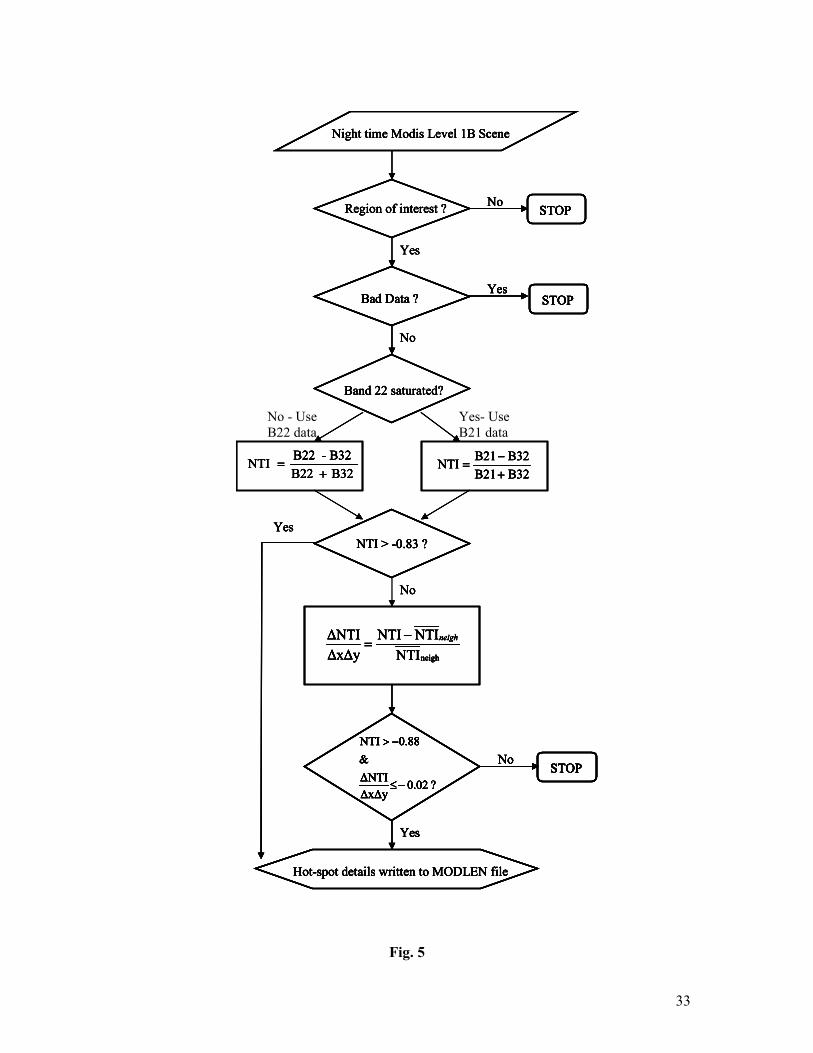
33
Fig. 5
Region of interest ? STOPNo
Night time Modis Level 1B Scene
Band 22 saturated?
B32B22B32- B22NTI
+=
B32B21B32B21NTI
+−
=
Bad Data ?
Yes
No
STOPYes
NTI > -0.83 ?
No
neighNTINTINTI
∆x∆y∆NTI neigh−
=
Yes
Hot-spot details written to MODLEN file
STOPNo
?02.0∆x∆y∆NTI&
0.88NTI
−≤
−>
Yes
Region of interest ? STOPNo
Night time Modis Level 1B Scene
Band 22 saturated?
B32B22B32- B22NTI
+=
B32B21B32B21NTI
+−
=
Bad Data ?
Yes
No
STOPYes
NTI > -0.83 ?
No
neighNTINTINTI
∆x∆y∆NTI neigh−
=
Yes
Hot-spot details written to MODLEN file
STOPNo
?02.0∆x∆y∆NTI&
0.88NTI
−≤
−>
Yes
Region of interest ? STOPNo
Night time Modis Level 1B Scene
Region of interest ?Region of interest ? STOPNo
STOPSTOPSTOPNo
Night time Modis Level 1B SceneNight time Modis Level 1B Scene
Band 22 saturated?
B32B22B32- B22NTI
+=
B32B21B32B21NTI
+−
=
Band 22 saturated?Band 22 saturated?
B32B22B32- B22NTI
+=
B32B22B32- B22NTI
+=
B32B21B32B21NTI
+−
=B32B21B32B21NTI
+−
=
Bad Data ?
Yes
No
STOPYes
Bad Data ?
Yes
No
STOPYes
Bad Data ?Bad Data ?
Yes
No
STOPYes
STOPSTOPSTOPYes
NTI > -0.83 ?
No
neighNTINTINTI
∆x∆y∆NTI neigh−
=
Yes
Hot-spot details written to MODLEN file
STOPNo
?02.0∆x∆y∆NTI&
0.88NTI
−≤
−>
YesNTI > -0.83 ?
No
neighNTINTINTI
∆x∆y∆NTI neigh−
=
NTI > -0.83 ?NTI > -0.83 ?
No
neighNTINTINTI
∆x∆y∆NTI neigh−
=neighNTI
NTINTI∆x∆y∆NTI neigh−
=
Yes
Hot-spot details written to MODLEN file
STOPNo
?02.0∆x∆y∆NTI&
0.88NTI
−≤
−>
YesYes
Hot-spot details written to MODLEN fileHot-spot details written to MODLEN file
STOPNo
?02.0∆x∆y∆NTI&
0.88NTI
−≤
−>
STOPNo
STOPSTOPSTOPNo
?02.0∆x∆y∆NTI&
0.88NTI
−≤
−>
?02.0∆x∆y∆NTI&
0.88NTI
−≤
−>
YesYes
Yes- Use B21 data
No - Use B22 data
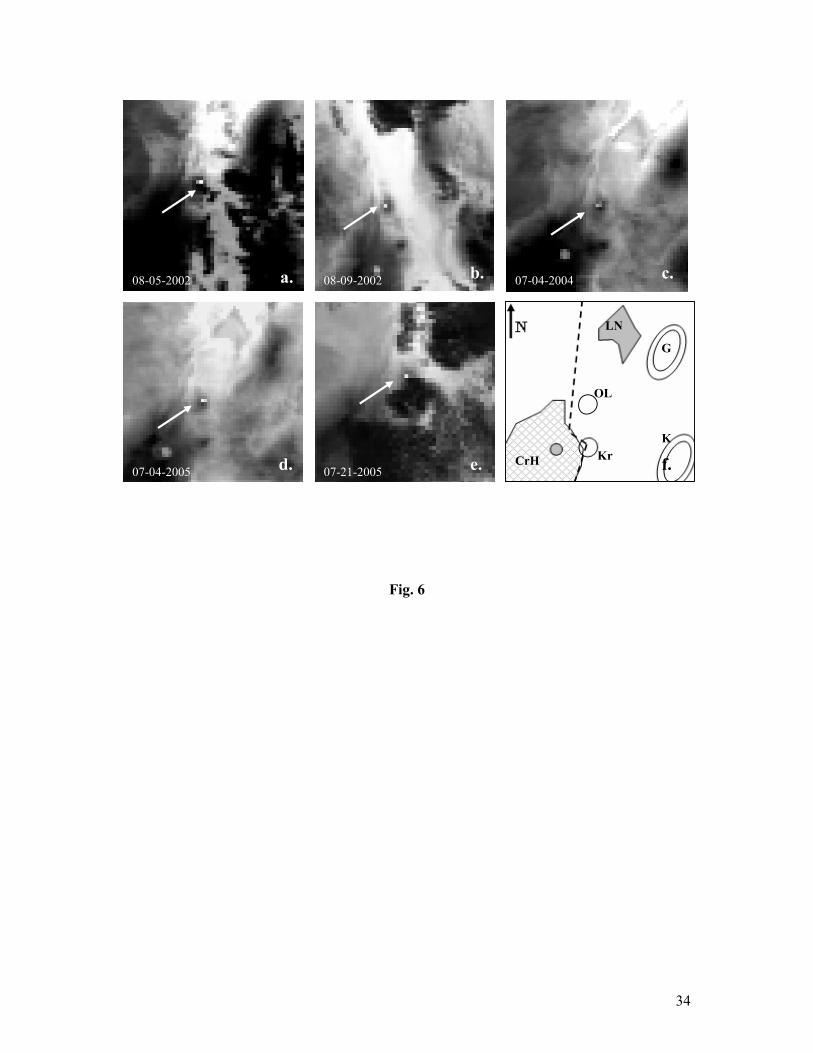
34
Fig. 6
07-15-2004f. CrH
LN
G
K
OL
Kr e. 07-21-2005
c. 07-04-2004 a. 08-05-2002
d. 07-04-2005
b. 08-09-2002
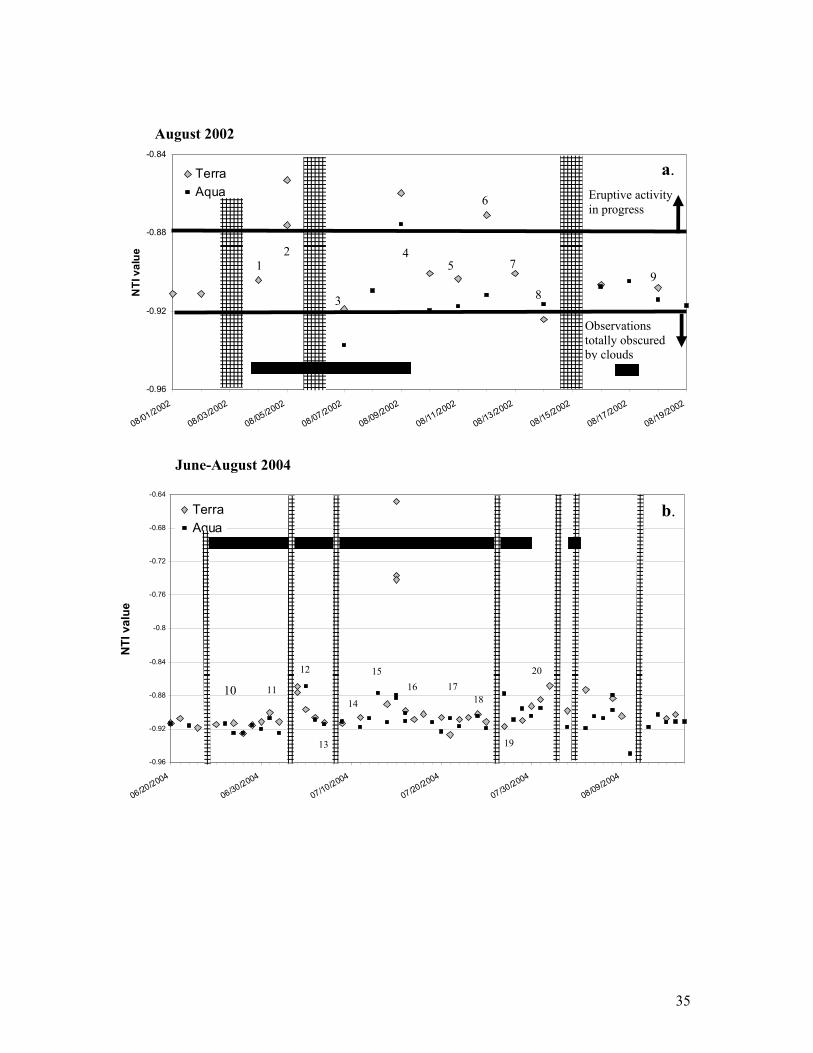
35
-0.96
-0.92
-0.88
-0.84
08/01/2002
08/03/2002
08/05/2002
08/07/2002
08/09/2002
08/11/2002
08/13/2002
08/15/2002
08/17/2002
08/19/2002
NTI
val
ue
TerraAqua
a.
August 2002
Observations totally obscured by clouds
Eruptive activity in progress
1 2
3
6
45 7
89
June-August 2004
-0.96
-0.92
-0.88
-0.84
-0.8
-0.76
-0.72
-0.68
-0.64
06/20/2004
06/30/2004
07/10/2004
07/20/2004
07/30/2004
08/09/2004
NTI
val
ue
TerraAqua
b.
10 11
13
14
1516
12 20
19
1718
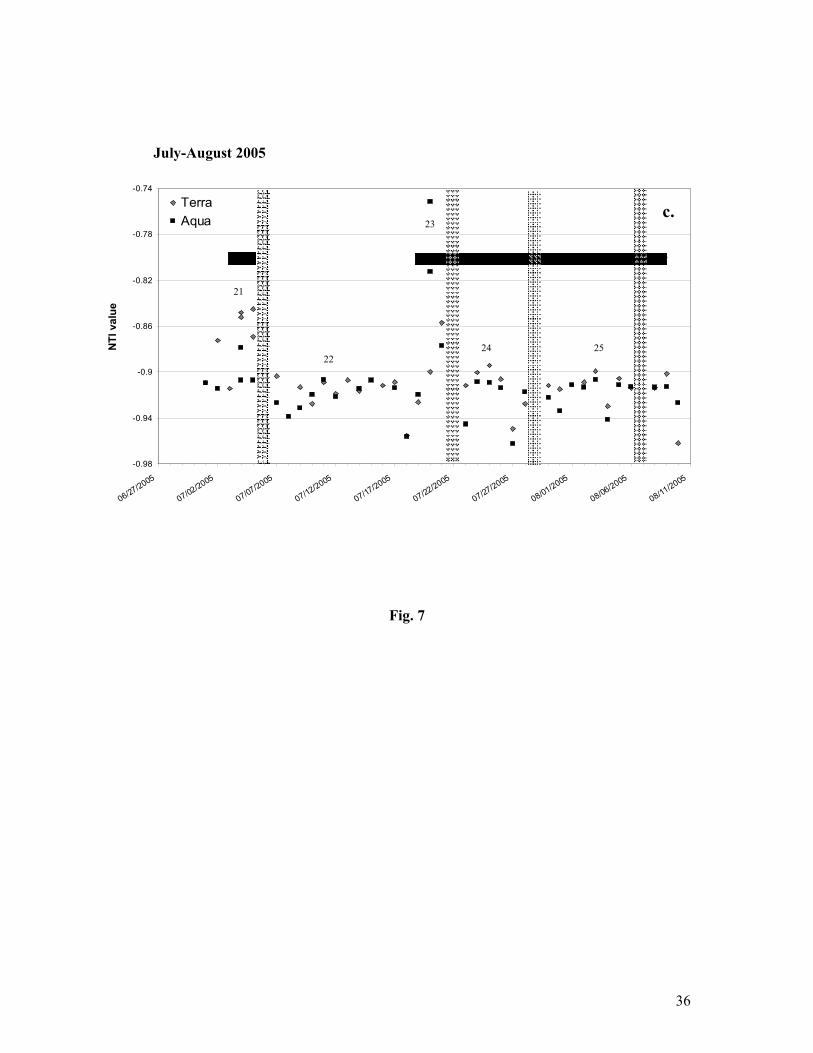
36
Fig. 7
-0.98
-0.94
-0.9
-0.86
-0.82
-0.78
-0.74
06/27/2005
07/02/2005
07/07/2005
07/12/2005
07/17/2005
07/22/2005
07/27/2005
08/01/2005
08/06/2005
08/11/2005
NTI
val
ue
TerraAqua c.
July-August 2005
21
2224
23
25
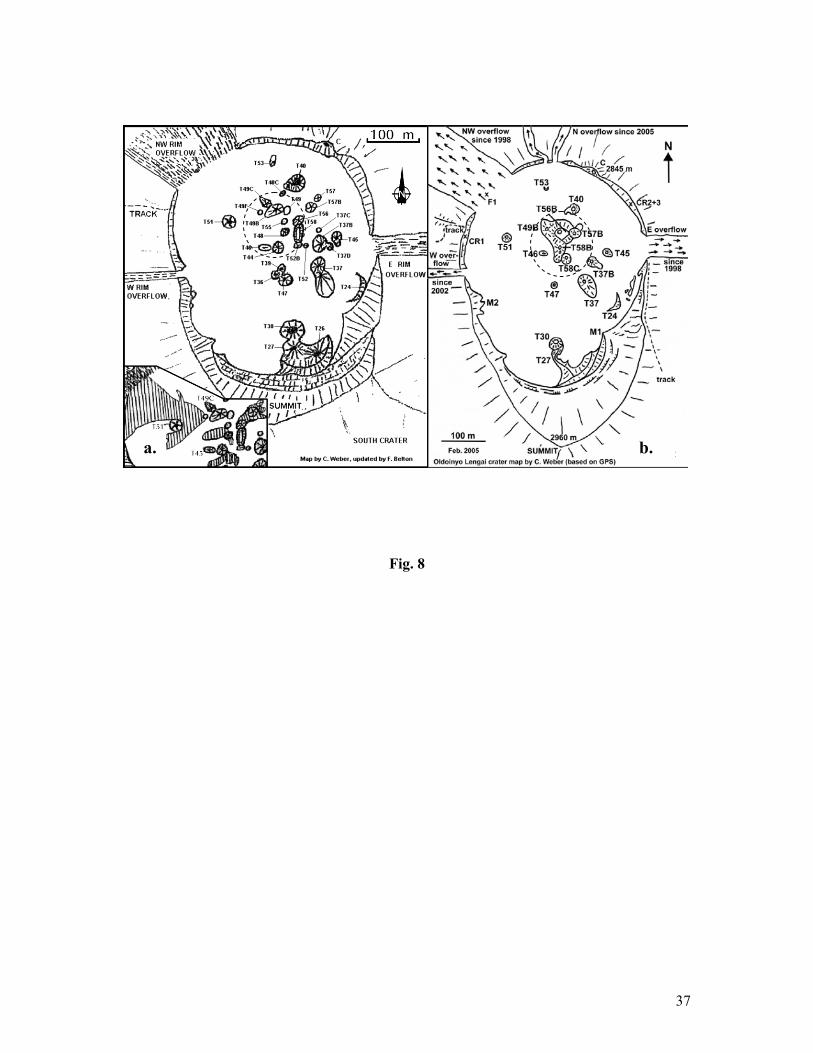
37
Fig. 8
a. b.
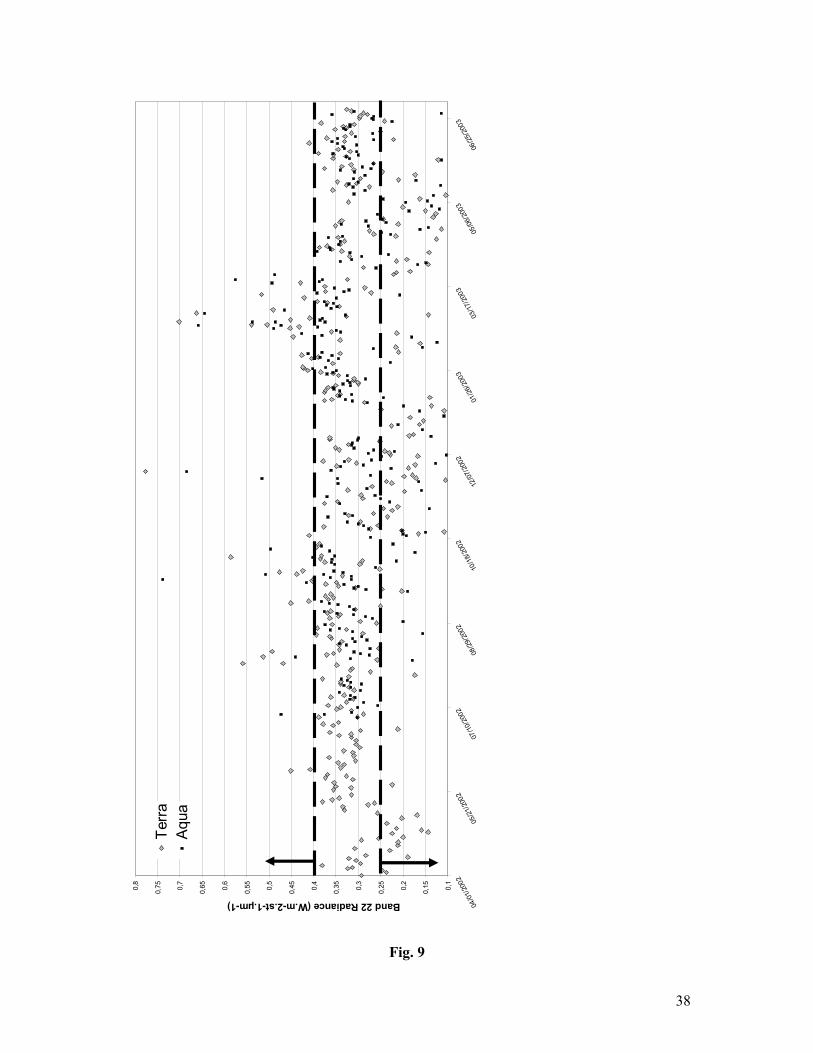
38
0,1
0,150,2
0,250,3
0,350,4
0,450,5
0,550,6
0,650,7
0,750,8
04/0
1/20
02
05/2
1/20
02
07/1
0/20
02
08/2
9/20
02
10/1
8/20
02
12/0
7/20
02
01/2
6/20
03
03/1
7/20
03
05/0
6/20
03
06/2
5/20
03
Band 22 Radiance (3,95 µm)
Terr
aAq
ua
Band 22 Radiance (W.m-2.st-1.µm-1)
0,1
0,150,2
0,250,3
0,350,4
0,450,5
0,550,6
0,650,7
0,750,8
04/0
1/20
02
05/2
1/20
02
07/1
0/20
02
08/2
9/20
02
10/1
8/20
02
12/0
7/20
02
01/2
6/20
03
03/1
7/20
03
05/0
6/20
03
06/2
5/20
03
Band 22 Radiance (3,95 µm)
Terr
aAq
ua
Band 22 Radiance (W.m-2.st-1.µm-1)
0,1
0,150,2
0,250,3
0,350,4
0,450,5
0,550,6
0,650,7
0,750,8
04/0
1/20
02
05/2
1/20
02
07/1
0/20
02
08/2
9/20
02
10/1
8/20
02
12/0
7/20
02
01/2
6/20
03
03/1
7/20
03
05/0
6/20
03
06/2
5/20
03
Band 22 Radiance (3,95 µm)
Terr
aAq
ua
Band 22 Radiance (W.m-2.st-1.µm-1)
Fig. 9
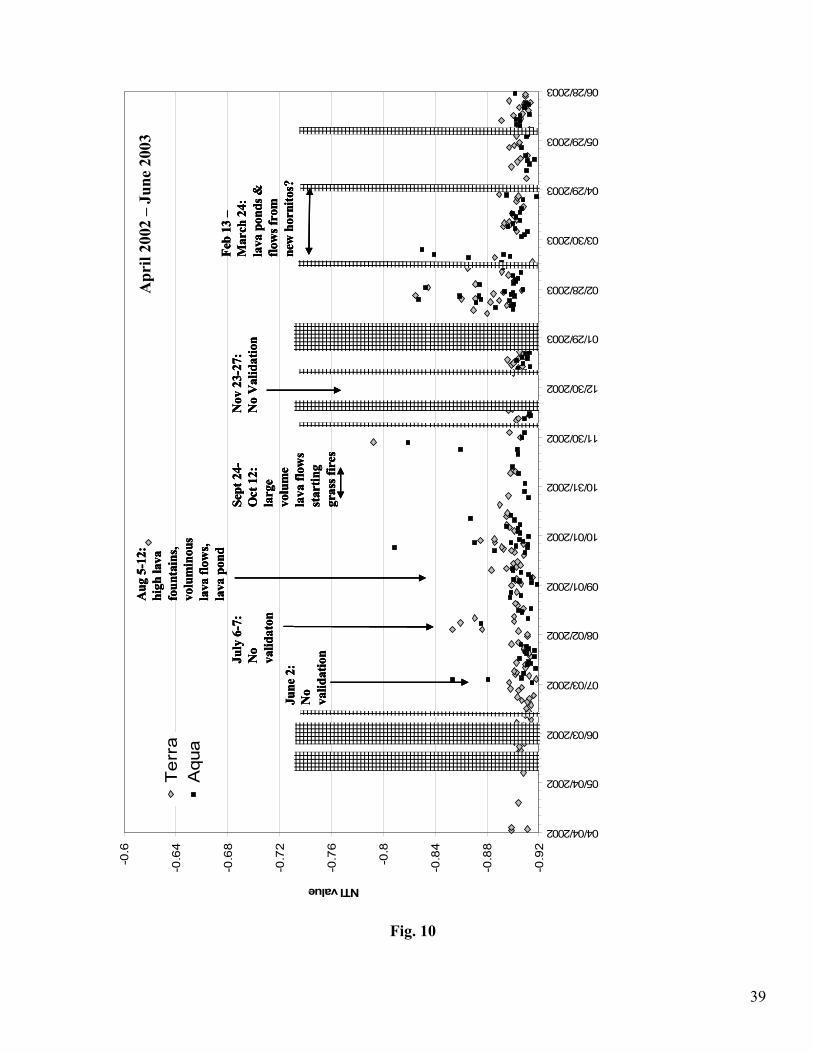
39
-0.9
2
-0.8
8
-0.8
4
-0.8
-0.7
6
-0.7
2
-0.6
8
-0.6
4
-0.6
04/04/2002
05/04/2002
06/03/2002
07/03/2002
08/02/2002
09/01/2002
10/01/2002
10/31/2002
11/30/2002
12/30/2002
01/29/2003
02/28/2003
03/30/2003
04/29/2003
05/29/2003
06/28/2003
NTI valueT
erra
Aqu
a
Apr
il 20
02 –
June
2003
Nov
23-2
7:
No
Val
idat
ion
Feb
13 –
Mar
ch 2
4:
lava
pon
ds &
flo
ws f
rom
ne
w h
orni
tos?
Sept
24-
Oct
12:
la
rge
volu
me
lava
flow
s st
artin
g gr
ass f
ires
June
2:
No
valid
atio
nJuly
6-7:
N
o va
lidat
on
Aug
5-12
: hi
ghla
va
foun
tain
s, vo
lum
inou
sla
va fl
ows,
lava
pon
d
-0.9
2
-0.8
8
-0.8
4
-0.8
-0.7
6
-0.7
2
-0.6
8
-0.6
4
-0.6
04/04/2002
05/04/2002
06/03/2002
07/03/2002
08/02/2002
09/01/2002
10/01/2002
10/31/2002
11/30/2002
12/30/2002
01/29/2003
02/28/2003
03/30/2003
04/29/2003
05/29/2003
06/28/2003
NTI valueT
erra
Aqu
a
Apr
il 20
02 –
June
2003
Nov
23-2
7:
No
Val
idat
ion
Feb
13 –
Mar
ch 2
4:
lava
pon
ds &
flo
ws f
rom
ne
w h
orni
tos?
Sept
24-
Oct
12:
la
rge
volu
me
lava
flow
s st
artin
g gr
ass f
ires
June
2:
No
valid
atio
nJuly
6-7:
N
o va
lidat
on
Aug
5-12
: hi
ghla
va
foun
tain
s, vo
lum
inou
sla
va fl
ows,
lava
pon
dN
ov23
-27:
N
o V
alid
atio
nN
ov23
-27:
N
o V
alid
atio
n
Feb
13 –
Mar
ch 2
4:
lava
pon
ds &
flo
ws f
rom
ne
w h
orni
tos?
Feb
13 –
Mar
ch 2
4:
lava
pon
ds &
flo
ws f
rom
ne
w h
orni
tos?
Sept
24-
Oct
12:
la
rge
volu
me
lava
flow
s st
artin
g gr
ass f
ires
Sept
24-
Oct
12:
la
rge
volu
me
lava
flow
s st
artin
g gr
ass f
ires
June
2:
No
valid
atio
n
June
2:
No
valid
atio
nJuly
6-7:
N
o va
lidat
on
July
6-7:
N
o va
lidat
on
Aug
5-12
: hi
ghla
va
foun
tain
s, vo
lum
inou
sla
va fl
ows,
lava
pon
d
Aug
5-12
: hi
ghla
va
foun
tain
s, vo
lum
inou
sla
va fl
ows,
lava
pon
d
Fig. 10
Copyright © 2022 FDOKUMEN