THERMAL ENERGY SYSTEM AND CHILLER COOLING ...
79
FINAL MITIGATED NEGATIVE DECLARATION THERMAL ENERGY SYSTEM AND CHILLER COOLING TOWER PROJECTS Mt. San Antonio Community College District Facilities Planning and Management 1100 North Grand Avenue Walnut, California 91789-1399 [email protected] SID LINDMARK, AICP Planning . Environmental . Policy 10 Aspen Creek Lane Laguna Hills, California 92653-7401 October 2015
-
Upload
khangminh22 -
Category
Documents
-
view
0 -
download
0
Transcript of THERMAL ENERGY SYSTEM AND CHILLER COOLING ...

FINAL MITIGATED NEGATIVE DECLARATION
THERMAL ENERGY SYSTEM AND
CHILLER COOLING TOWER PROJECTS
Mt. San Antonio Community College District
Facilities Planning and Management 1100 North Grand Avenue
Walnut, California 91789-1399
SID LINDMARK, AICP Planning . Environmental . Policy
10 Aspen Creek Lane Laguna Hills, California 92653-7401
October 2015
sklein2a
Text Box
APPENDICES ONLY

40
7.0 APPENDICES
A. Air Quality Report B. Noise Report C. On-Site Noise Measurements and Supplemental Information
D. Proof of Publication of Project CEQA Public Hearing Notices E. Three Valleys Municipal Water District Correspondence F. No Effect Determination Request – State of California Department of Fish and Wildlife G. Public Comments on the Draft MND H. Board Resolution 15-02 –Thermal Energy System and Chiller Cooling Tower Projects (Projects) I. Mitigation Monitoring Plan

638 CAMINO DE LOS MARES, SUITE H130‐153, SAN CLEMENTE, CA 92673 VOICE: 949•466•2967 EMAIL: [email protected]
Memorandum Date: September 9, 2015 To: Ms. Mikaela Klein, Mt. San Antonio College From: Fred Greve, Greve & Associates, LLC Subject: Thermal Energy Storage Tank & Central Plant Chiller– Air Quality Construction Analysis (Report #15‐104) The analysis presented below examines the potential air quality impacts of the construction phase of the Thermal Energy Storage (TES) and the Central Plant Chiller (CCT). The TES project will construct a chilled water tank below grade. The concrete tank will be piped into the campus central plant, which will require digging a trench for the new pipes. The TES tank will be located south of Edinger Way in Lot H which is currently used for surface parking (refer to Exhibit 1). It should be noted that the projects will need to comply with the air quality measures contained in the Mitigation Monitoring Program (MMP) for the 2012 Facilities Master Plan SEIR. Measures 3a through 3j of the MMP identify a spectrum of air quality mitigation with Measures 3a, 3b, 3c, 3f, 3g, 3h, and 3i are aimed specifically at reducing quality emissions. THRESHOLDS OF SIGNIFICANCE In their "1993 CEQA Air Quality Handbook”, the South Coast Air Quality Management District (SCAQMD) established significance thresholds to assess the impact of project related air pollutant emissions. Table 2 presents the significance thresholds for construction. There are separate thresholds for short‐term construction and long‐term operational emissions. A project with daily emission rates below these thresholds is considered to have a less than significant effect on regional air quality. It should be noted the thresholds recommended by the SCAQMD are very low and subject to controversy. It is up to the individual lead agencies to determine if the SCAQMD thresholds are appropriate for their projects.


TES Tank Greve & Associates, LLC Page 3
Table 1 Regional Pollutant Emission Thresholds of Significance
Pollutant Emissions (lbs./day) CO VOC NOx PM10 PM2.5 SOx
Construction 550 75 100 150 55 150
SCAQMD staff also developed a localized significance threshold (LST) methodology that can be used to determine whether or not a project may generate significant adverse localized air quality impacts. LSTs represent the maximum emissions from a project that will not cause or contribute to an exceedance of the most stringent applicable federal or state ambient air quality standard, and are developed based on the ambient concentrations of that pollutant for each source receptor area (SRA). The LST methodology is described in the “Final Localized Significance Threshold Methodology” updated in 2009 by the SCAQMD and is available at the SCAQMD website (http://aqmd.gov/ceqa/handbook/LST/LST.html). The LST mass rate look‐up tables provided by the SCAQMD allow one to determine if the daily emissions for proposed construction or operational activities could result in significant local air impacts. If the calculated on‐site emissions for the proposed construction or operational activities are below the LST emission levels found on the LST mass rate look‐up tables, then the proposed construction or operation activity is not significant for air quality.
The project is located in SRA 10. The nearest existing land uses are the residences approximately 160 feet from the edge of the project site. Table 2 summarizes the LSTs for construction.
Table 2 Localized Significance Thresholds at the Nearest Receptors
Localized Significance Threshold (lbs./day)
Description NOx CO PM10 PM2.5
Construction Activities 128 911 14 4
POTENTIAL FOR CONSTRUCTION IMPACTS Air pollutants are emitted by construction equipment and fugitive dust is generated during earth moving operations. Air impacts can contribute significantly to the regional air pollution levels, and this type of impact is referred to as a regional air impact. The project is located in Source Receptor Area 19. Air contaminants can also affect sensitive receptors very close to the project, and this is referred to as a local impact. Both regional and local impacts are assessed for the construction the TES project.
Regional Air Impacts
Construction Emission Calculation Methodology Emissions during the phases of construction were calculated using the California Emissions Estimator Model (CalEEMod). CalEEMod is a computer program developed by the SCAQMD in conjunction with the California Air Resources Board (CARB). The model calculates emissions for construction and

TES Tank Greve & Associates, LLC Page 4
operation of various projects. The latest version of the model was used (i.e., version CalEEMod.2013.2.2)
Construction Activities The project site totals approximately 0.6 acres. The tank site is approximately 0.3 acres and the trench for the supply return piping is also about 0.3 acres. The construction of the project is projected to take a little less than 1 year with an estimated start date of October 2015 and a completion date of July 2016. The following are the likely phases of construction; demolition, excavation of hole for the tank, trenching, tank construction, backfilling, and re‐paving. The appropriate number of acres, duration of each construction phase, key construction equipment, and other key elements of the project were input into the CalEEMod to generate the estimate of emissions. The overlap between construction phases will be minimal. Each construction phase is discussed below. A draft construction schedule is presented in the Appendix. CalEEMod printouts are included in the Appendix. Demolition. Demolition will be the first phase of construction and will take about 6 workdays. Light standards will be removed as necessary and asphalt will be removed over the tank and trench areas. Likely heavy equipment will include a concrete saw, excavator, a loader and a backhoe. An estimated 986 tons of demolition material will be moved to an area on campus. Excavation. Excavation of the tank hole will take about 24 days of work. An excavator, grader, loader, and backhoe may operate during this time. Approximately 13,500 cubic yards of dirt will be moved to Lot M on‐campus. Export of dirt will require about 750 haul truck trips. Trenching. Trenching will take about 5 workdays, and employ a concrete saw and a backhoe. Tank Construction. The tank construction will be the longest phase lasting approximately 119 workdays. It will require about 150 truck trips to the site to bring in the concrete. A concrete pump will be used for the pour. Backfilling. The area around the tank and the trench will be backfilled with dirt. This phase will last about 19 workdays. Paving. Finally, the tank and trench areas will be re‐paved and light standards reinstalled taking about 15 workdays. Mortar mixers, pavers, rollers, and loaders may be used.
Construction Emissions Table 3 presents the results of the total emissions calculations for the construction activities discussed above. The highest daily construction emissions for each phase are presented below and represent a worst‐case scenario. No mitigation is included in the emission projections presented below. The projected emissions are compared to the Significance Thresholds described above. CalEEMod printouts are included in the Appendix.

TES Tank Greve & Associates, LLC Page 5
Table 3 Peak Construction Emissions
Pollutant Emissions (lbs./day)
Activity ROG NOx CO SOx PM10 PM2.5
Demolition 1.9 15.7 14.0 0.0 4.7 1.5
Excavation of Tank Hole 2.8 25.0 23.6 0.0 1.6 1.4
Trenching 0.7 5.9 4.5 0.0 0.5 0.5
Tank Construction 0.9 6.6 5.7 0.0 0.7 0.5
Backfilling 0.4 3.3 2.6 0.0 0.3 0.2
Paving 1.3 10.7 8.5 0.0 0.9 0.7
SCQAMD Thresholds 75 100 550 150 150 55 Exceed Threshold? No No No No No No
The projected construction emissions are below the significance thresholds established by the SCAQMD. In all cases, the peak daily emissions are well below the thresholds. The exhibit below shows the emission projections for each phase and compares them to the SCAQMD thresholds. The exhibit graphically depicts how small the emissions will be in comparison to the threshold levels.
0
50
100
150
200
250
300
350
400
450
500
550
ROG NOX CO SOx PM10 PM2.5
Pe
ak D
aily
Co
nst
ruct
ion
Em
issi
on
s (lb
s./d
ay)
Demolition
Ecavation of Tank Hole
Trenching
Tank Construction
Backfi lling
Paving
SCQAMD Thresholds

TES Tank Greve & Associates, LLC Page 6
Local Air Impacts The on‐site emissions for the LST analysis were calculated utilizing CalEEMod. The emissions presented in Table 4 are those that would be emitted from activity within the project site. The total on‐site construction emissions are compared to the Localized Significance Thresholds (LSTs) described above. Table 4 On‐Site Emissions By Construction Activity
Daily Emissions (lbs./day) Activity NOx CO PM10 PM2.5
Demolition 15.0 10.9 4.5 1.5
Excavation of Tank Hole 22.6 13.3 1.5 1.3
Trenching 5.9 4.3 0.5 0.4
Tank Construction 5.3 3.9 0.4 0.4
Backfilling 3.3 2.4 0.3 0.2
Paving 10.6 7.3 0.7 0.6
LST Thresholds 128 911 14 4
Exceed Threshold? No No No No
None of the emissions will exceed the LST significance thresholds. This is due to the relatively small size of the project and the large distance between the project site and sensitive receptor locations. No significant local air impacts will occur due to construction activities.
Diesel Particulate Matter Emissions During Construction In 1998, the California Air Resources Board (ARB) identified particulate matter from diesel‐fueled engines (Diesel Particulate Matter or DPM) as a Toxic Air Contaminant (TAC). It is assumed that the majority of the heavy construction equipment utilized during construction would be diesel‐fueled and emit DPM.
Impacts from toxic substances are related to cumulative exposure and are assessed over a 70‐year period. Cancer risk is expressed as the maximum number of new cases of cancer projected to occur in a population of one million people due to exposure to the cancer‐causing substance over a 70‐year lifetime (California Environmental Protection Agency, Office of Environmental Health Hazard Assessment, Guide to Health Risk Assessment). Use of heavy diesel generating equipment will be used intermittently over a nine‐month period. Because of the relatively short duration of construction compared to a 70‐year lifespan, diesel emissions resulting from the construction of the project will not result in a significant impact.

TES Tank Greve & Associates, LLC Page 7
CENTRAL PLANT CHLLER (CCT) PROJECT The Central Plant Chiller project, which will be done in conjunction with the TES project, will have little potential for air quality impacts. The CCT project will add one new cooling tower with a 1,700 gallon per minute (gpm) flowrate, and an additional chiller. The construction will include mounting the units and connecting piping and electrical connections. Emissions will be very minimal. Therefore, there will be no significant air quality impact. GREENHOUSE GAS The SCAQMD has not officially adopted significance thresholds for greenhouse gas emissions. However, their draft recommendations use a 3,500 MT CO2EQ/yr threshold for residential projects, a 1,400 MT CO2EQ/yr (metric ton of equivalent carbon dioxide per year) threshold for commercial projects, and a 3,000 MT CO2 EQ/yr for mixed‐use projects. This project does not fall into any of these categories. Construction emissions are amortized over the life of the project, defined by SCAQMD as 30 years, and are added to the annual operation emissions. The greenhouse gas emissions for construction are very small when amortized over a 30 year period. Additionally, the operation of the projects is designed to reduce energy consumption and as a consequence reduce greenhouse gas emissions. Therefore, the projects will not have a significant impact on greenhouse gas emissions.
CONCLUSION Potential air quality impacts during construction were assessed for the TES and CCT projects. Both local and regional air impacts were considered. No significant air quality impacts are forecasted during construction of the TES and CCT projects.

TES Tank Greve & Associates, LLC Page 8
Appendix
Draft TES Construction Schedule
CalEEMod Output

Activity ID Activity Name Original
Duration
Start Finish
Mt SAC TES Tank ProposalMt SAC TES Tank Proposal 335 6/4/15 9/22/16
MilestonesMilestones 335 6/4/15 9/22/16
A1070 PROPOSAL DUE 0 6/4/15A1110 NTP 1 8/24/15 8/24/15A1060 START CONSTRUCTION 0 9/1/15A1080 CONSTRUCTION COMPLETE 0 6/30/16A1100 PROJECT COMPLETE 0 9/22/16
Contracts & AdministrativeContracts & Administrative 335 6/4/15 9/22/16
A1000 PROPOSALS DUE 1 6/4/15* 6/4/15A1010 RFP EVALUATIONS 6 6/5/15 6/12/15A1020 CONTRACTOR INTERVIEWS 1 6/25/15* 6/25/15A1030 CONTRACTOR SELECTION & NEGOTIATIONS 5 6/26/15 7/2/15A1040 CONTRACT APPROVAL (BOARD DATE) 1 8/12/15* 8/12/15A1050 EXECUTE CONTRACT 7 8/13/15 8/21/15A1120 EXECUTE SUBCONTRACTS 6 8/24/15 8/31/15A1130 WEATHER & CONTINGENCY 10 6/17/16 6/30/16A1090 CLOSEOUT AND FINAL APPROVALS 60 7/1/16 9/22/16
ConstructionConstruction 216 8/13/15 6/16/16
Procurement/Review ProcessProcurement/Review Process 45 8/13/15 10/15/15SubmittalsSubmittals 20 8/13/15 9/10/15
P1000 TANK DESIGN 20 8/13/15 9/10/15P1010 TEMP SHORING DESIGN 7 8/13/15 8/21/15
Submittal ReviewSubmittal Review 23 8/24/15 9/24/15P2010 TEMP SHORING REVIEW 10 8/24/15 9/4/15P2000 TANK DESIGN REVIEW 10 9/11/15 9/24/15
Procure/DeliverProcure/Deliver 28 9/8/15 10/15/15P3010 SHORING PROCUREMENT/MOBILIZATION 10 9/8/15 9/21/15P3000 TANK PROCUREMENT/FABRICATION - MOBILIZE15 9/25/15 10/15/15
Demo/SiteDemo/Site 209 8/24/15 6/16/16S1000 SECURE SITE - INSTALL FENCING 2 8/24/15 8/25/15S1010 SAFE OFF / REMOVE LIGHTING 2 8/26/15 8/27/15S1020 DEMO PAVEMENT & SITE 4 8/28/15 9/2/15S1030 DRILL/INSTALL SHORING BEAMS 6 9/22/15 9/29/15S1040 EXCAVATE PIT 22 9/30/15 10/29/15S1050 SHORING/LAGGING 15 10/5/15 10/23/15S1060 OX AND INSTALL TANK BASE COURSE 5 10/30/15 11/5/15
M J J A S O N D J F M A M J J A S O N
9/22/16, Mt SAC TES Tank Proposal
9/22/16, Milestones
PROPOSAL DUE
NTPSTART CONSTRUCTION
CONSTRUCTION COMPLETEPROJECT COMPLETE9/22/16, Contracts & Administrative
PROPOSALS DUERFP EVALUATIONS
CONTRACTOR INTERVIEWSCONTRACTOR SELECTION & NEGOTIATIONS
CONTRACT APPROVAL (BOARD DATE)EXECUTE CONTRACTEXECUTE SUBCONTRACTS
WEATHER & CONTINGENCYCLOSEOUT AND FINAL APPROVALS
6/16/16, Construction
10/15/15, Procurement/Review Process9/10/15, Submittals
TANK DESIGNTEMP SHORING DESIGN
9/24/15, Submittal Review
TEMP SHORING REVIEWTANK DESIGN REVIEW
10/15/15, Procure/Deliver
SHORING PROCUREMENT/MOBILIZATIONTANK PROCUREMENT/FABRICATION - MOBILIZE
6/16/16, Demo/Site
SECURE SITE - INSTALL FENCINGSAFE OFF / REMOVE LIGHTINGDEMO PAVEMENT & SITE
DRILL/INSTALL SHORING BEAMSEXCAVATE PIT
SHORING/LAGGINGOX AND INSTALL TANK BASE COURSE
Mt SAC TES Tank Proposal BCT PRECON Presentation group by WBS 6/4/15 09:38
Remaining Level of Effort
Project Baseline Bar
Primary Ba...
Secondary ...Page 1 of 2

Activity ID Activity Name Original
Duration
Start Finish
S2010 BACKFILL TANK 10 4/28/16 5/11/16S2000 CUT SHORING 4 5/12/16 5/17/16S2020 COMPLETE BACKFILL AND GRADE SITE 5 5/18/16 5/24/16S2030 INSTALL SITE LIGHTING CONDUIT 2 5/25/16 5/26/16S2060 INSTALL LIGHT STANDARDS 4 5/27/16 6/1/16S2040 BASE AND PAVE SITE 6 6/2/16 6/9/16S2050 REINSTALL SITE LIGHTS 1 6/10/16 6/10/16S2070 STRIPE PARKING LOT 3 6/10/16 6/14/16S2080 CLEAN SITE - REMOVE FENCE 2 6/15/16 6/16/16
TankTank 144 11/6/15 5/31/16T1000 TANK CONSTRUCTION 110 11/6/15 4/13/16T1010 FILL AND TEST TANK 10 4/14/16 4/27/16T1020 INSTALL CW PIPE AND VAULT 5 5/25/16 5/31/16
M J J A S O N D J F M A M J J A S O N
BACKFILL TANKCUT SHORINGCOMPLETE BACKFILL AND GRADE SITEINSTALL SITE LIGHTING CONDUITINSTALL LIGHT STANDARDSBASE AND PAVE SITEREINSTALL SITE LIGHTSSTRIPE PARKING LOTCLEAN SITE - REMOVE FENCE
5/31/16, Tank
TANK CONSTRUCTIONFILL AND TEST TANK
INSTALL CW PIPE AND VAULT
Mt SAC TES Tank Proposal BCT PRECON Presentation group by WBS 6/4/15 09:38
Remaining Level of Effort
Project Baseline Bar
Primary Ba...
Secondary ...Page 2 of 2

CalEEMod Version: CalEEMod.2013.2.2 Page 1 of 1 Date: 8/3/2015 1:10 PM
Thermal Energy Storage Tank - Construction OnlySouth Coast AQMD Air District, Winter
1.0 Project Characteristics
1.1 Land Usage
Land Uses Size Metric Lot Acreage Floor Surface Area Population
Parking Lot 0.61 Acre 0.61 26,571.60 0
1.2 Other Project Characteristics
Urbanization Urban Wind Speed (m/s) 2.2 Precipitation Freq (Days) 31
Climate Zone 9 Operational Year 2016
Utility Company Southern California Edison
CO2 Intensity (lb/MWhr)
630.89 CH4 Intensity (lb/MWhr)
0.029 N2O Intensity (lb/MWhr)
0.006
1.3 User Entered Comments & Non-Default Data
Project Characteristics -
Land Use -
Construction Phase - Per construction schedule.
Off-road Equipment - Best estimate per Tilden-Coil
Off-road Equipment - Best estimate per Tilden-Coil
Off-road Equipment - Best estimate per Tilden-Coil
Off-road Equipment - Best estimate per Tilden-Coil
Off-road Equipment - Best estimate per Tilden-Coil
Off-road Equipment - Best estimate per Tilden-Coil
Trips and VMT - Haul trips to Lot M for dirt export, 750 one-way trips, 1.1 one-way mileage to Lot M.Concrete hauling of 150 one-way trips during "building construction."Demolition -

Grading - Based on project description -- size of tank area.
Table Name Column Name Default Value New Value
tblConstructionPhase NumDays 100.00 119.00
tblConstructionPhase NumDays 10.00 6.00
tblConstructionPhase NumDays 2.00 19.00
tblConstructionPhase NumDays 5.00 15.00
tblConstructionPhase NumDays 1.00 24.00
tblConstructionPhase PhaseEndDate 5/10/2016 5/24/2016
tblConstructionPhase PhaseEndDate 6/14/2016 6/16/2016
tblConstructionPhase PhaseEndDate 10/6/2015 10/23/2015
tblConstructionPhase PhaseEndDate 10/30/2015 10/29/2015
tblConstructionPhase PhaseStartDate 4/14/2016 4/28/2016
tblConstructionPhase PhaseStartDate 5/25/2016 5/27/2016
tblConstructionPhase PhaseStartDate 9/3/2015 9/22/2015
tblConstructionPhase PhaseStartDate 10/24/2015 10/23/2015
tblGrading MaterialExported 0.00 13,500.00
tblOffRoadEquipment OffRoadEquipmentUnitAmount 1.00 0.00
tblOffRoadEquipment OffRoadEquipmentUnitAmount 1.00 0.00
tblOffRoadEquipment OffRoadEquipmentUnitAmount 2.00 0.00
tblOffRoadEquipment OffRoadEquipmentUnitAmount 1.00 0.00
tblOffRoadEquipment OffRoadEquipmentUnitAmount 1.00 0.00
tblOffRoadEquipment OffRoadEquipmentUnitAmount 2.00 0.00
tblOffRoadEquipment OffRoadEquipmentUnitAmount 2.00 1.00
tblOffRoadEquipment OffRoadEquipmentUnitAmount 1.00 2.00
tblOffRoadEquipment OffRoadEquipmentUnitAmount 0.00 1.00
tblOffRoadEquipment OffRoadEquipmentUnitAmount 0.00 1.00
tblOffRoadEquipment OffRoadEquipmentUnitAmount 0.00 1.00
tblOffRoadEquipment OffRoadEquipmentUnitAmount 0.00 1.00
tblOffRoadEquipment PhaseName Paving
tblOffRoadEquipment PhaseName Backfill around tank and trench

tblOffRoadEquipment PhaseName Trenching
tblOffRoadEquipment PhaseName Excavate hole for tank includes exporting dirt
tblOffRoadEquipment PhaseName Backfill around tank and trench
tblOffRoadEquipment PhaseName Concrete Pour
tblOffRoadEquipment PhaseName Backfill around tank and trench
tblOffRoadEquipment PhaseName Trenching
tblOffRoadEquipment PhaseName Trenching
tblOffRoadEquipment UsageHours 8.00 0.00
tblOffRoadEquipment UsageHours 4.00 0.00
tblOffRoadEquipment UsageHours 6.00 0.00
tblOffRoadEquipment UsageHours 1.00 0.00
tblOffRoadEquipment UsageHours 1.00 0.00
tblOffRoadEquipment UsageHours 8.00 0.00
tblOffRoadEquipment UsageHours 6.00 8.00
tblProjectCharacteristics OperationalYear 2014 2016
tblTripsAndVMT HaulingTripLength 20.00 1.10
tblTripsAndVMT HaulingTripLength 20.00 1.10
tblTripsAndVMT HaulingTripNumber 1,688.00 1,500.00
tblTripsAndVMT HaulingTripNumber 0.00 300.00
tblTripsAndVMT WorkerTripNumber 10.00 8.00
tblTripsAndVMT WorkerTripNumber 10.00 8.00
5.00 3.00
tblTripsAndVMT WorkerTripNumber 18.00 20.00
tblTripsAndVMT WorkerTripNumber
2.0 Emissions Summary
2.1 Overall Construction (Maximum Daily Emission)Unmitigated Construction

NOx CO SO2 Fugitive PM10
Fugitive PM2.5
Exhaust PM2.5
PM2.5 Total Bio- CO2ROG NBio- CO2 Total CO2 CH4 N2O CO2e
Year lb/day lb/day
Exhaust PM10
PM10 Total
2015 3.5348 30.9675 28.1611 0.0291 3.6218 1.8765 4.6599 0.5605 1.7418 1.8033
2016 1.3121 10.7429 8.4914 0.0138 0.2236 0.6625 0.8860 0.0593 0.6130 0.6723
Total 4.8469 41.7104 36.6525 0.0429 3.8454 2.5390 5.5459 0.6198 2.3549 2.4756
SO2 Fugitive PM10
Exhaust PM10
PM2.5 Total Bio- CO2 NBio- CO2
Mitigated Construction
ROG NOx CO Total CO2 CH4 N2O CO2e
Year lb/day lb/day
PM10 Total Fugitive PM2.5
Exhaust PM2.5
2015 3.5348 30.9675 28.1611 0.0291 3.6218 1.8765 4.6599 0.5605 1.7418 1.8033
2016 1.3121 10.7429 8.4914 0.0138 0.2236 0.6625 0.8860 0.0593 0.6130 0.6723
Total 4.8469 41.7104 36.6525 0.0429 3.8454 2.5390 5.5459 0.6198 2.3549 2.4756
ROG NOx CO SO2 Fugitive PM10
Exhaust PM10
PM10 Total Fugitive PM2.5
Exhaust PM2.5
PM2.5 Total
Bio- CO2 NBio-CO2 Total CO2 CH4 N20 CO2e
Percent Reduction 0.00 0.00 0.00 0.00 0.00 0.00 0.00 0.00 0.00 0.00 0.00 0.00 0.00 0.00 0.00 0.00
3.0 Construction Detail
Construction Phase
Phase Number
Phase Name Phase Type Start Date End Date Num Days Week
Num Days Phase Description
1 Demolition Demolition 8/26/2015 9/2/2015 5 6 Remove asphalt, etc.

2 Excavate hole for tank includes exporting dirt
Site Preparation 9/22/2015 10/23/2015 5 24 Excavate hole for tank
3 Trenching Trenching 10/23/2015 10/29/2015 5 5 Trenching
4 Concrete Pour Building Construction 10/30/2015 4/13/2016 5 119 Concrete pour for tank
5 Backfill around tank and trench Grading 4/28/2016 5/24/2016 5 19
6 Paving Paving 5/27/2016 6/16/2016 5 15
Acres of Grading (Site Preparation Phase): 0
Acres of Grading (Grading Phase): 0
Acres of Paving: 0
Residential Indoor: 0; Residential Outdoor: 0; Non-Residential Indoor: 0; Non-Residential Outdoor: 0 (Architectural Coating – sqft)
OffRoad Equipment
Phase Name Offroad Equipment Type Amount Usage Hours Horse Power Load Factor
Demolition Concrete/Industrial Saws 1 8.00 81 0.73
Demolition Excavators 1 8.00 162 0.38
Demolition Rubber Tired Dozers 0 0.00 255 0.40
Demolition Tractors/Loaders/Backhoes 2 6.00 97 0.37
Excavate hole for tank includes exporting dirt Excavators 1 8.00 162 0.38
Excavate hole for tank includes exporting dirt Graders 1 8.00 174 0.41
Excavate hole for tank includes exporting dirt Tractors/Loaders/Backhoes 2 8.00 97 0.37
Trenching Concrete/Industrial Saws 1 4.00 81 0.73
Trenching Rubber Tired Dozers 0 0.00 255 0.40
Trenching Tractors/Loaders/Backhoes 1 8.00 97 0.37
Concrete Pour Cranes 0 0.00 226 0.29
Concrete Pour Forklifts 0 0.00 89 0.20
Concrete Pour Pumps 1 8.00 84 0.74
Concrete Pour Tractors/Loaders/Backhoes 0 0.00 97 0.37
Backfill around tank and trench Cement and Mortar Mixers 0 0.00 9 0.56
Backfill around tank and trench Concrete/Industrial Saws 0 0.00 81 0.73
Backfill around tank and trench Pavers 0 0.00 125 0.42

Backfill around tank and trench Rollers 0 0.00 80 0.38
Backfill around tank and trench Rubber Tired Dozers 0 0.00 255 0.40
Backfill around tank and trench Tractors/Loaders/Backhoes 1 8.00 97 0.37
Paving Air Compressors 0 0.00 78 0.48
Paving Cement and Mortar Mixers 4 6.00 9 0.56
Paving Pavers 1 7.00 125 0.42
Paving Rollers 1 7.00 80 0.38
Paving Tractors/Loaders/Backhoes 1 7.00 97 0.37
Hauling Vehicle Class
Trips and VMT
Phase Name Offroad Equipment Count
Worker Trip Number
Vendor Trip Number
Hauling Trip Number
14.70
Worker Trip Length
Vendor Trip Length
Hauling Trip Length
Worker Vehicle Class
Vendor Vehicle Class
Excavate hole for tank includes exporting dirt
4 8.00 0.00 1,500.00
Demolition 4 8.00 0.00 97.00
HHDT
6.90 1.10 LD_Mix HDT_Mix HHDT
14.70
14.70 6.90 1.10 LD_Mix HDT_Mix
Concrete Pour 1 11.00 4.00 300.00
Trenching 2 3.00 0.00 0.00
HHDT
6.90 20.00 LD_Mix HDT_Mix HHDT
14.70
14.70 6.90 20.00 LD_Mix HDT_Mix
Paving 7 20.00 0.00 0.00
Backfill around tank and trench
1 3.00 0.00 0.00
20.00 LD_Mix HDT_Mix HHDT
6.90 20.00 LD_Mix HDT_Mix HHDT
NOx CO SO2 Fugitive PM10
14.70 6.90
Fugitive PM2.5
Exhaust PM2.5
PM2.5 Total Bio- CO2
3.1 Mitigation Measures Construction
3.2 Demolition - 2015Unmitigated Construction On-Site
ROG NBio- CO2 Total CO2 CH4 N2O CO2e
Category lb/day lb/day
Exhaust PM10
PM10 Total
Fugitive Dust 3.5166 0.0000 3.5166 0.5324 0.0000 0.5324
Off-Road 1.6694 15.0074 10.8810 0.0162 1.0310 1.0310 0.9796 0.9796

Total 1.6694 15.0074 10.8810 0.0162 3.5166 1.0310 4.5476 0.5324 0.9796 1.5120
SO2 Fugitive PM10
Exhaust PM10
PM2.5 Total Bio- CO2 NBio- CO2
Unmitigated Construction Off-Site
ROG NOx CO Total CO2 CH4 N2O CO2e
Category lb/day lb/day
PM10 Total Fugitive PM2.5
Exhaust PM2.5
Hauling 0.1467 0.6134 2.5434 9.4000e-004
0.0158 6.2900e-003
0.0221 4.3600e-003
5.7700e-003
0.0101
Vendor 0.0000 0.0000 0.0000 0.0000 0.0000 0.0000 0.0000 0.0000 0.0000 0.0000
Worker 0.0379 0.0509 0.5309 1.0600e-003
0.0894 7.9000e-004
0.0902 0.0237 7.2000e-004
0.0244
Total 0.1845 0.6642 3.0743 2.0000e-003
0.1052 7.0800e-003
0.1123 0.0281 6.4900e-003
0.0346
SO2 Fugitive PM10
Exhaust PM10
PM2.5 Total Bio- CO2 NBio- CO2
Mitigated Construction On-Site
ROG NOx CO Total CO2 CH4 N2O CO2e
Category lb/day lb/day
PM10 Total Fugitive PM2.5
Exhaust PM2.5
Fugitive Dust 3.5166 0.0000 3.5166 0.5324 0.0000 0.5324
Off-Road 1.6694 15.0074 10.8810 0.0162 1.0310 1.0310 0.9796 0.9796
Total 1.6694 15.0074 10.8810 0.0162 3.5166 1.0310 4.5476 0.5324 0.9796 1.5120
Mitigated Construction Off-Site

SO2 Fugitive PM10
Exhaust PM10
PM2.5 Total Bio- CO2 NBio- CO2ROG NOx CO Total CO2 CH4 N2O CO2e
Category lb/day lb/day
PM10 Total Fugitive PM2.5
Exhaust PM2.5
Hauling 0.1467 0.6134 2.5434 9.4000e-004
0.0158 6.2900e-003
0.0221 4.3600e-003
5.7700e-003
0.0101
Vendor 0.0000 0.0000 0.0000 0.0000 0.0000 0.0000 0.0000 0.0000 0.0000 0.0000
Worker 0.0379 0.0509 0.5309 1.0600e-003
0.0894 7.9000e-004
0.0902 0.0237 7.2000e-004
0.0244
Total 0.1845 0.6642 3.0743 2.0000e-003
0.1052 7.0800e-003
0.1123 0.0281 6.4900e-003
0.0346
SO2 Fugitive PM10
Exhaust PM10
PM2.5 Total Bio- CO2 NBio- CO2
3.3 Excavate hole for tank includes exporting dirt - 2015Unmitigated Construction On-Site
ROG NOx CO Total CO2 CH4 N2O CO2e
Category lb/day lb/day
PM10 Total Fugitive PM2.5
Exhaust PM2.5
Fugitive Dust 0.0857 0.0000 0.0857 0.0120 0.0000 0.0120
Off-Road 2.1992 22.5969 13.2711 0.0178 1.3885 1.3885 1.2774 1.2774
Total 2.1992 22.5969 13.2711 0.0178 0.0857 1.3885 1.4742 0.0120 1.2774 1.2894
SO2 Fugitive PM10
Exhaust PM10
PM2.5 Total Bio- CO2 NBio- CO2
Unmitigated Construction Off-Site
ROG NOx CO Total CO2 CH4 N2O CO2e
Category lb/day lb/day
PM10 Total Fugitive PM2.5
Exhaust PM2.5

Hauling 0.5670 2.3713 9.8328 3.6400e-003
0.0611 0.0243 0.0854 0.0169 0.0223 0.0392
Vendor 0.0000 0.0000 0.0000 0.0000 0.0000 0.0000 0.0000 0.0000 0.0000 0.0000
Worker 0.0379 0.0509 0.5309 1.0600e-003
0.0894 7.9000e-004
0.0902 0.0237 7.2000e-004
0.0244
Total 0.6049 2.4222 10.3637 4.7000e-003
0.1505 0.0251 0.1757 0.0406 0.0230 0.0636
SO2 Fugitive PM10
Exhaust PM10
PM2.5 Total Bio- CO2 NBio- CO2
Mitigated Construction On-Site
ROG NOx CO Total CO2 CH4 N2O CO2e
Category lb/day lb/day
PM10 Total Fugitive PM2.5
Exhaust PM2.5
Fugitive Dust 0.0857 0.0000 0.0857 0.0120 0.0000 0.0120
Off-Road 2.1992 22.5969 13.2711 0.0178 1.3885 1.3885 1.2774 1.2774
Total 2.1992 22.5969 13.2711 0.0178 0.0857 1.3885 1.4742 0.0120 1.2774 1.2894
SO2 Fugitive PM10
Exhaust PM10
PM2.5 Total Bio- CO2 NBio- CO2
Mitigated Construction Off-Site
ROG NOx CO Total CO2 CH4 N2O CO2e
Category lb/day lb/day
PM10 Total Fugitive PM2.5
Exhaust PM2.5
Hauling 0.5670 2.3713 9.8328 3.6400e-003
0.0611 0.0243 0.0854 0.0169 0.0223 0.0392
Vendor 0.0000 0.0000 0.0000 0.0000 0.0000 0.0000 0.0000 0.0000 0.0000 0.0000
Worker 0.0379 0.0509 0.5309 1.0600e-003
0.0894 7.9000e-004
0.0902 0.0237 7.2000e-004
0.0244
Total 0.6049 2.4222 10.3637 4.7000e-003
0.1505 0.0251 0.1757 0.0406 0.0230 0.0636

SO2 Fugitive PM10
Exhaust PM10
PM2.5 Total Bio- CO2 NBio- CO2
3.4 Trenching - 2015Unmitigated Construction On-Site
ROG NOx CO Total CO2 CH4 N2O CO2e
Category lb/day lb/day
PM10 Total Fugitive PM2.5
Exhaust PM2.5
Off-Road 0.7165 5.9293 4.3273 6.2500e-003
0.4626 0.4626 0.4411 0.4411
Total 0.7165 5.9293 4.3273 6.2500e-003
0.4626 0.4626 0.4411 0.4411
SO2 Fugitive PM10
Exhaust PM10
PM2.5 Total Bio- CO2 NBio- CO2
Unmitigated Construction Off-Site
ROG NOx CO Total CO2 CH4 N2O CO2e
Category lb/day lb/day
PM10 Total Fugitive PM2.5
Exhaust PM2.5
Hauling 0.0000 0.0000 0.0000 0.0000 0.0000 0.0000 0.0000 0.0000 0.0000 0.0000
Vendor 0.0000 0.0000 0.0000 0.0000 0.0000 0.0000 0.0000 0.0000 0.0000 0.0000
Worker 0.0142 0.0191 0.1991 4.0000e-004
0.0335 3.0000e-004
0.0338 8.8900e-003
2.7000e-004
9.1600e-003
Total 0.0142 0.0191 0.1991 4.0000e-004
0.0335 3.0000e-004
0.0338 8.8900e-003
2.7000e-004
9.1600e-003
SO2 Fugitive PM10
Exhaust PM10
PM2.5 Total Bio- CO2 NBio- CO2
Mitigated Construction On-Site
ROG NOx CO Total CO2 CH4 N2O CO2ePM10 Total Fugitive PM2.5
Exhaust PM2.5

Category lb/day lb/day
Off-Road 0.7165 5.9293 4.3273 6.2500e-003
0.4626 0.4626 0.4411 0.4411
Total 0.7165 5.9293 4.3273 6.2500e-003
0.4626 0.4626 0.4411 0.4411
SO2 Fugitive PM10
Exhaust PM10
PM2.5 Total Bio- CO2 NBio- CO2
Mitigated Construction Off-Site
ROG NOx CO Total CO2 CH4 N2O CO2e
Category lb/day lb/day
PM10 Total Fugitive PM2.5
Exhaust PM2.5
Hauling 0.0000 0.0000 0.0000 0.0000 0.0000 0.0000 0.0000 0.0000 0.0000 0.0000
Vendor 0.0000 0.0000 0.0000 0.0000 0.0000 0.0000 0.0000 0.0000 0.0000 0.0000
Worker 0.0142 0.0191 0.1991 4.0000e-004
0.0335 3.0000e-004
0.0338 8.8900e-003
2.7000e-004
9.1600e-003
Total 0.0142 0.0191 0.1991 4.0000e-004
0.0335 3.0000e-004
0.0338 8.8900e-003
2.7000e-004
9.1600e-003
SO2 Fugitive PM10
Exhaust PM10
PM2.5 Total Bio- CO2 NBio- CO2
3.5 Concrete Pour - 2015Unmitigated Construction On-Site
ROG NOx CO Total CO2 CH4 N2O CO2e
Category lb/day lb/day
PM10 Total Fugitive PM2.5
Exhaust PM2.5
Off-Road 0.7444 5.3084 3.8963 6.5800e-003
0.3991 0.3991 0.3991 0.3991
Total 0.7444 5.3084 3.8963 6.5800e-003
0.3991 0.3991 0.3991 0.3991

SO2 Fugitive PM10
Exhaust PM10
PM2.5 Total Bio- CO2 NBio- CO2
Unmitigated Construction Off-Site
ROG NOx CO Total CO2 CH4 N2O CO2e
Category lb/day lb/day
PM10 Total Fugitive PM2.5
Exhaust PM2.5
Hauling 0.0517 0.8125 0.5996 1.8600e-003
0.0987 0.0137 0.1124 0.0255 0.0126 0.0381
Vendor 0.0414 0.4013 0.5135 8.6000e-004
0.0250 6.9200e-003
0.0319 7.1200e-003
6.3700e-003
0.0135
Worker 0.0521 0.0699 0.7300 1.4600e-003
0.1230 1.0800e-003
0.1240 0.0326 9.9000e-004
0.0336
Total 0.1452 1.2838 1.8430 4.1800e-003
0.2467 0.0217 0.2684 0.0652 0.0200 0.0852
SO2 Fugitive PM10
Exhaust PM10
PM2.5 Total Bio- CO2 NBio- CO2
Mitigated Construction On-Site
ROG NOx CO Total CO2 CH4 N2O CO2e
Category lb/day lb/day
PM10 Total Fugitive PM2.5
Exhaust PM2.5
Off-Road 0.7444 5.3084 3.8963 6.5800e-003
0.3991 0.3991 0.3991 0.3991
Total 0.7444 5.3084 3.8963 6.5800e-003
0.3991 0.3991 0.3991 0.3991
Mitigated Construction Off-Site

SO2 Fugitive PM10
Exhaust PM10
PM2.5 Total Bio- CO2 NBio- CO2ROG NOx CO Total CO2 CH4 N2O CO2e
Category lb/day lb/day
PM10 Total Fugitive PM2.5
Exhaust PM2.5
Hauling 0.0517 0.8125 0.5996 1.8600e-003
0.0987 0.0137 0.1124 0.0255 0.0126 0.0381
Vendor 0.0414 0.4013 0.5135 8.6000e-004
0.0250 6.9200e-003
0.0319 7.1200e-003
6.3700e-003
0.0135
Worker 0.0521 0.0699 0.7300 1.4600e-003
0.1230 1.0800e-003
0.1240 0.0326 9.9000e-004
0.0336
Total 0.1452 1.2838 1.8430 4.1800e-003
0.2467 0.0217 0.2684 0.0652 0.0200 0.0852
SO2 Fugitive PM10
Exhaust PM10
PM2.5 Total Bio- CO2 NBio- CO2
3.5 Concrete Pour - 2016Unmitigated Construction On-Site
ROG NOx CO Total CO2 CH4 N2O CO2e
Category lb/day lb/day
PM10 Total Fugitive PM2.5
Exhaust PM2.5
Off-Road 0.6688 4.9093 3.8623 6.5800e-003
0.3563 0.3563 0.3563 0.3563
Total 0.6688 4.9093 3.8623 6.5800e-003
0.3563 0.3563 0.3563 0.3563
SO2 Fugitive PM10
Exhaust PM10
PM2.5 Total Bio- CO2 NBio- CO2
Unmitigated Construction Off-Site
ROG NOx CO Total CO2 CH4 N2O CO2e
Category lb/day lb/day
PM10 Total Fugitive PM2.5
Exhaust PM2.5
Hauling 0.0456 0.7161 0.5603 1.8600e-003
0.0642 0.0110 0.0752 0.0170 0.0101 0.0271
Vendor 0.0365 0.3542 0.4782 8.6000e-004
0.0250 5.7500e-003
0.0308 7.1200e-003
5.2800e-003
0.0124

Worker 0.0469 0.0631 0.6588 1.4600e-003
0.1230 1.0300e-003
0.1240 0.0326 9.4000e-004
0.0336
Total 0.1290 1.1334 1.6974 4.1800e-003
0.2121 0.0178 0.2299 0.0567 0.0163 0.0731
SO2 Fugitive PM10
Exhaust PM10
PM2.5 Total Bio- CO2 NBio- CO2
Mitigated Construction On-Site
ROG NOx CO Total CO2 CH4 N2O CO2e
Category lb/day lb/day
PM10 Total Fugitive PM2.5
Exhaust PM2.5
Off-Road 0.6688 4.9093 3.8623 6.5800e-003
0.3563 0.3563 0.3563 0.3563
Total 0.6688 4.9093 3.8623 6.5800e-003
0.3563 0.3563 0.3563 0.3563
SO2 Fugitive PM10
Exhaust PM10
PM2.5 Total Bio- CO2 NBio- CO2
Mitigated Construction Off-Site
ROG NOx CO Total CO2 CH4 N2O CO2e
Category lb/day lb/day
PM10 Total Fugitive PM2.5
Exhaust PM2.5
Hauling 0.0456 0.7161 0.5603 1.8600e-003
0.0642 0.0110 0.0752 0.0170 0.0101 0.0271
Vendor 0.0365 0.3542 0.4782 8.6000e-004
0.0250 5.7500e-003
0.0308 7.1200e-003
5.2800e-003
0.0124
Worker 0.0469 0.0631 0.6588 1.4600e-003
0.1230 1.0300e-003
0.1240 0.0326 9.4000e-004
0.0336
Total 0.1290 1.1334 1.6974 4.1800e-003
0.2121 0.0178 0.2299 0.0567 0.0163 0.0731
3.6 Backfill around tank and trench - 2016Unmitigated Construction On-Site

SO2 Fugitive PM10
Exhaust PM10
PM2.5 Total Bio- CO2 NBio- CO2ROG NOx CO Total CO2 CH4 N2O CO2e
Category lb/day lb/day
PM10 Total Fugitive PM2.5
Exhaust PM2.5
Fugitive Dust 0.0000 0.0000 0.0000 0.0000 0.0000 0.0000
Off-Road 0.3406 3.2551 2.4126 3.1100e-003 0.2506 0.2506 0.2306 0.2306
Total 0.3406 3.2551 2.4126 3.1100e-003 0.0000 0.2506 0.2506 0.0000 0.2306 0.2306
SO2 Fugitive PM10
Exhaust PM10
PM2.5 Total Bio- CO2 NBio- CO2
Unmitigated Construction Off-Site
ROG NOx CO Total CO2 CH4 N2O CO2e
Category lb/day lb/day
PM10 Total Fugitive PM2.5
Exhaust PM2.5
Hauling 0.0000 0.0000 0.0000 0.0000 0.0000 0.0000 0.0000 0.0000 0.0000 0.0000
Vendor 0.0000 0.0000 0.0000 0.0000 0.0000 0.0000 0.0000 0.0000 0.0000 0.0000
Worker 0.0128 0.0172 0.1797 4.0000e-004
0.0335 2.8000e-004
0.0338 8.8900e-003
2.6000e-004
9.1500e-003
Total 0.0128 0.0172 0.1797 4.0000e-004
0.0335 2.8000e-004
0.0338 8.8900e-003
2.6000e-004
9.1500e-003
SO2 Fugitive PM10
Exhaust PM10
PM2.5 Total Bio- CO2 NBio- CO2
Mitigated Construction On-Site
ROG NOx CO Total CO2 CH4 N2O CO2e
Category lb/day lb/day
PM10 Total Fugitive PM2.5
Exhaust PM2.5

Fugitive Dust 0.0000 0.0000 0.0000 0.0000 0.0000 0.0000
Off-Road 0.3406 3.2551 2.4126 3.1100e-003 0.2506 0.2506 0.2306 0.2306
Total 0.3406 3.2551 2.4126 3.1100e-003 0.0000 0.2506 0.2506 0.0000 0.2306 0.2306
SO2 Fugitive PM10
Exhaust PM10
PM2.5 Total Bio- CO2 NBio- CO2
Mitigated Construction Off-Site
ROG NOx CO Total CO2 CH4 N2O CO2e
Category lb/day lb/day
PM10 Total Fugitive PM2.5
Exhaust PM2.5
Hauling 0.0000 0.0000 0.0000 0.0000 0.0000 0.0000 0.0000 0.0000 0.0000 0.0000
Vendor 0.0000 0.0000 0.0000 0.0000 0.0000 0.0000 0.0000 0.0000 0.0000 0.0000
Worker 0.0128 0.0172 0.1797 4.0000e-004
0.0335 2.8000e-004
0.0338 8.8900e-003
2.6000e-004
9.1500e-003
Total 0.0128 0.0172 0.1797 4.0000e-004
0.0335 2.8000e-004
0.0338 8.8900e-003
2.6000e-004
9.1500e-003
SO2 Fugitive PM10
Exhaust PM10
PM2.5 Total Bio- CO2 NBio- CO2
3.7 Paving - 2016Unmitigated Construction On-Site
ROG NOx CO Total CO2 CH4 N2O CO2e
Category lb/day lb/day
PM10 Total Fugitive PM2.5
Exhaust PM2.5
Off-Road 1.1203 10.6282 7.2935 0.0111 0.6606 0.6606 0.6113 0.6113
Paving 0.1066 0.0000 0.0000 0.0000 0.0000
Total 1.2268 10.6282 7.2935 0.0111 0.6606 0.6606 0.6113 0.6113

SO2 Fugitive PM10
Exhaust PM10
PM2.5 Total Bio- CO2 NBio- CO2
Unmitigated Construction Off-Site
ROG NOx CO Total CO2 CH4 N2O CO2e
Category lb/day lb/day
PM10 Total Fugitive PM2.5
Exhaust PM2.5
Hauling 0.0000 0.0000 0.0000 0.0000 0.0000 0.0000 0.0000 0.0000 0.0000 0.0000
Vendor 0.0000 0.0000 0.0000 0.0000 0.0000 0.0000 0.0000 0.0000 0.0000 0.0000
Worker 0.0853 0.1147 1.1978 2.6500e-003
0.2236 1.8700e-003
0.2254 0.0593 1.7200e-003
0.0610
Total 0.0853 0.1147 1.1978 2.6500e-003
0.2236 1.8700e-003
0.2254 0.0593 1.7200e-003
0.0610
SO2 Fugitive PM10
Exhaust PM10
PM2.5 Total Bio- CO2 NBio- CO2
Mitigated Construction On-Site
ROG NOx CO Total CO2 CH4 N2O CO2e
Category lb/day lb/day
PM10 Total Fugitive PM2.5
Exhaust PM2.5
Off-Road 1.1203 10.6282 7.2935 0.0111 0.6606 0.6606 0.6113 0.6113
Paving 0.1066 0.0000 0.0000 0.0000 0.0000
Total 1.2268 10.6282 7.2935 0.0111 0.6606 0.6606 0.6113 0.6113
SO2 Fugitive PM10
Exhaust PM10
PM2.5 Total Bio- CO2 NBio- CO2
Mitigated Construction Off-Site
ROG NOx CO Total CO2 CH4 N2O CO2ePM10 Total Fugitive PM2.5
Exhaust PM2.5

Operational Information removed since it is not relevant to this study.
Category lb/day lb/day
Hauling 0.0000 0.0000 0.0000 0.0000 0.0000 0.0000 0.0000 0.0000 0.0000 0.0000
Vendor 0.0000 0.0000 0.0000 0.0000 0.0000 0.0000 0.0000 0.0000 0.0000 0.0000
Worker 0.0853 0.1147 1.1978 2.6500e-003
0.2236 1.8700e-003
0.2254 0.0593 1.7200e-003
0.0610
Total 0.0853 0.1147 1.1978 2.6500e-003
0.2236 1.8700e-003
0.2254 0.0593 1.7200e-003
0.0610

638 CAMINO DE LOS MARES, SUITE H130‐153, SAN CLEMENTE, CA 92673 VOICE: 949•466•2967 EMAIL: [email protected]
Memorandum Date: September 9, 2015 To: Ms. Mikaela Klein, Mt. San Antonio College From: Fred Greve, Greve & Associates, LLC Subject: Thermal Energy System (TES) and Chiller Cooling Tower (CCT) Projects – Noise Construction Analysis (Report #15‐104A) The analysis presented below examines the potential noise impacts of the construction phase of the Thermal Energy Storage (TES) project. The project will construct a chilled water tank below grade. The concrete tank will be piped into the campus central plant, which will require digging a trench for the new pipes. The TES tank will be located south of Edinger Way in Lot H which is currently used for surface parking (refer to Exhibit 1). CITY NOISE STANDARDS The Walnut Noise Ordinance (Chapter 16B of the Municipal Code) establishes exterior and interior noise standards that protect residential, commercial, and industrial areas. Section 16B‐5, quoted on page 3, presents the City’s Noise Ordinance Standards. DISTRICT NOISE STANDARDS The Mt. San Antonio College District is exempt from City zoning and the City’s Noise Ordinance pursuant to California Government Code 53096 for facilities related to the storage and transmission of water or electrical energy. The District complies with Department of the State Architect (DSA) and California Educational Code interior noise requirements for classroom facilities. The District adopted the following mitigation measure to reduce noise exposure from construction: 5a. All construction and general maintenance activities, except in emergencies or special circumstances, shall be limited to the hours of 7 am to 7 pm Monday‐Saturday. Staging areas for construction shall be located away from existing off‐site residences. All construction equipment shall use properly operating mufflers. These requirements shall be included in construction contracts and implemented. Facilities Planning & Management shall monitor compliance.


TES Tank Greve & Associates, LLC Page 3
Section 16B‐5 Citations for violations of the City’s Noise Ordinance are hereby authorized when: (a) Exterior noise levels shall apply to all receptor properties as follows, unless otherwise noted:
Receptor Land Use Time of Day Noise Level
Residential 11 p.m. to 7 a.m. 45 dB
7 a.m. to 11 p.m. 50 dB
Commercial 11 p.m. to 7 a.m. 45 dB
7 a.m. to 11 p.m. 50 dB
Industrial Anytime 70 dB
(b) If the measurement location is on a boundary property between two different zones, exterior noise level utilized in subsection (a) of this section to determine the exterior standard shall be the daytime exterior noise level of the subject receptor property.
The noise scale associated with the noise level limits presented in Section 16B‐5 of the City’s Noise Ordinance is not indicated. If one assumes that the levels specified in the Noise Ordinance were the levels that could not be exceeded at any time, the Ordinance would be overly restrictive and almost any commercial use adjacent to a residential use would likely violate the Noise Ordinance limits on a regular basis. It is likely that the City’s Noise Ordinance limits are intended to duplicate the County of Los Angeles Noise Ordinance limits. The County’s Noise Ordinance base limits are the same as specified in the City’s Noise Ordinance. In the County’s Ordinance, the base noise level limits are noise levels that cannot be exceeded for 30 minutes in one hour. The City’s Noise Ordinance (Article II Regulations, Section 16B‐3(a)) exempts construction noise from the noise level limits between the hours of 7:00 a.m. and 8:00 p.m. on weekdays. Construction is not allowed on holidays, Saturdays, and Sundays without special approvals or exceptions. If construction occurs outside the permitted hours, then the construction activities would be subject to the limits in Section 16B‐5. MEASURED NOISE LEVELS Noise levels were measured as part of the “Supplemental Noise Assessment for Mount San Antonio College 2008 Master Plan Update,” (by Mestre Greve Associates, April 22, 2008). Measurements were made in the rear yard of the home at 21034 Granite Wells Road, which is located directly across Edinger Way from the project site. The average noise level (Leq) was 51 dBA, and the maximum noise level (Lmax) was 65 dBA. Typical noise levels were caused by traffic on Edinger Way and activity in the adjacent college parking lot. The maximum noise level was caused by a commercial jet.

TES Tank Greve & Associates, LLC Page 4
THRESHOLDS OF SIGNIFICANCE The District has not adopted thresholds of significance for construction or operational noise. The District evaluates potential noise impacts consistent with Section XII NOISE of the CEQA Guidelines. However, Section XII does not include any specific thresholds of significance for noise. There are standard practices used by analysts in noise studies for traffic‐related noise impacts on off‐site areas with sensitive receptors. Usually a 3.0 dBA increase related to a project is regarded as significant. POTENTIAL FOR CONSTRUCTION NOISE IMPACTS Construction Activities The TES project site totals approximately 0.6 acres. The tank site is approximately 0.3 acres and the trench for the supply return piping is also about 0.3 acres. The construction of the project is projected to take a little less than 1 year with an estimated start date of October 2015 and a completion date of July 2016. The following are the likely phases of construction; demolition, excavation of hole for the tank, trenching, tank construction, backfilling, and re‐paving. The overlap between construction phases will be minimal. Each construction phase is discussed below. Demolition. Demolition will be the first phase of construction and will take about 6 workdays. Light standards will be removed as necessary and asphalt will be removed over the tank and trench areas. Likely heavy equipment will include a concrete saw, excavator, a loader and a backhoe. An estimated 986 tons of demolition material will be moved to an area on campus. Excavation. Excavation of the tank hole will take about 24 days of work. An excavator, grader, loader, and backhoe may operate during this time. Approximately 13,500 cubic yards of dirt will be moved to Lot M on‐campus. Export of dirt will require about 750 haul truck trips. The District is restricting haul trucks from using Edinger Way for the project. Therefore, no haul trucks will travel on Edinger Way. Trenching. Trenching will take about 5 workdays, and employ a concrete saw and a backhoe. Trenching will be located much further from existing residents on the opposite side of the demolition. Tank Construction. The tank construction will be the longest phase lasting approximately 119 workdays. It will require about 150 truck trips to the site to bring in the concrete. A concrete pump will be used for the pour. Backfilling. The area around the tank and the trench will be backfilled with dirt. This phase will last about 19 workdays. Paving. Finally the tank and trench areas will be re‐paved and light standards reinstalled taking about 15 workdays. Mortar mixers, pavers, rollers, and loaders may be used.

TES Tank Greve & Associates, LLC Page 5
Construction Noise Levels Noise levels at the residential area closest to the TES construction site were projected. Both maximum sound levels (Lmax) and average (Leq) noise levels were projected. Examples of construction noise are presented in Exhibit 2. The noise levels shown in Exhibit 2 are generally considered to be higher than typically experienced in real‐life situations. Therefore, when these levels are used for noise projections they are considered to be worst‐case projections. Noise levels presented in Exhibit 2 were used for the noise projections in this analysis. The type of equipment for each phase has been discussed above, and an asterisk also identifies the equipment to be used in Exhibit 2. Table 1 presents the noise levels at the nearest residential area for all construction phases except trenching. Trenching will occur far from the residences and is a minor noise concern. A distance of 135 feet from the closest edge of construction to the nearest residence property line was used for the projection of maximum noise levels (Lmax). A distance of 186 feet, which puts the source noise closer to the center of the TES site, was used for the average noise levels. No mitigation is included in the noise projections. A noise worksheet is included in the Appendix.
Table 1 Construction Noise Levels
Demolition
Tank Excavation
Tank Pour Backfill Paving
Maximum Levels at Residence (LmaxdBA)
93 93 93 93 93
Average Noise at Residence (dBALeq)
86 87 85 83 87
The maximum noise levels (Lmax) at the nearest residences may reach up to 93 dBA. These noise levels will be considered loud by the residents when they occur. Maximum noise levels will occur when the activities are at their highest, and could be considerably less when quieter equipment is being used and when few pieces of equipment are operating. Average noise levels (Leq) range from 83 to 87 dBA. Again these levels might be reached when construction activity levels are highest for that phase. All construction, except in emergencies or special circumstances, shall be limited to the hours of 7 a.m. and 8 p.m. Monday to Saturday. Construction during these hours, pursuant to California Government Codes 53091(e) and 53096, does not result in a significant noise impact.


TES Tank Greve & Associates, LLC Page 7
TRAFFIC NOISE ON EDINGER WAY Recently, 24‐hour traffic counts were conducted on Edinger Way by Counts Unlimited, Inc. (July 23, 2015). The counts indicated an average daily trip (ADT) of 1,254 vehicles. Using this value and the day, evening, and night traffic splits counted for the roadway, the existing noise level along this roadway was determined. The noise level is projected in terms of the Community Noise Equivalent Level (CNEL). The CNEL scale represents a time weighted 24‐hour average noise level based on the A‐weighted decibel. Time weighted refers to the fact that noise that occurs during certain sensitive time periods is penalized for occurring at these times. The evening time period (7 p.m. to 10 p.m.) penalizes noises by 5 dBA, while nighttime (10 p.m. to 7 a.m.) noises are penalized by 10 dBA. These time periods and penalties were selected to reflect people's increased sensitivity to noise during these time periods. The 55 CNEL noise contour lies 37 feet from the centerline of the roadway. Higher contour values (e.g., 60 and 65 CNEL) lie within the road right of way. At 100 feet from the roadway centerline, the noise level is about 48.6 CNEL. Edinger Way as it travels along the campus is a very low traffic volume roadway with corresponding low noise levels. Since the July counts were completed during the Summer Intersession, roadway volumes were very low. The 2008 Final EIR included projections of traffic‐related noise along Edinger Way during January 2008. The projected noise contour was estimated as 60 dBA (Mt. San Antonio College 2008 Master Plan Update, Section 3.4, p. 83). CENTRAL PLANT CHLLER (CCT) PROJECT The Central Plant Chiller project, which will be done in conjunction with the TES project, will have little potential for noise impact. The CCT project will add one new cooling tower with a 1,700 gallon per minute (gpm) flowrate, and an additional chiller. The construction will include mounting the units and connecting piping and electrical connections. The chiller will be located inside the Central Plant building with other chillers and equipment and will not have any significant potential to have a noise impact on the residential community to the north. The cooling tower will be located outside in the equipment yard with at least one other larger cooling tower. The equipment yard has a large sound wall around it that is 21 feet high. The new cooling tower will be approximately 1,240 feet from the nearest residential property line. The specifications for the cooling tower show that it will not exceed 80 dBA at 5 feet. This translates to a noise level of less than 45 dBA at the nearest residential property line. The noise level will be less than required by the Walnut Noise Ordinance and less than ambient conditions. The installation of the new equipment will not cause ground borne vibration and noise for adjacent campus buildings. Therefore, there will be no impact of CCT construction or operation on the residents.
CONCLUSION Potential noise impacts during construction were assessed for the TES project. No noise impacts are forecasted during construction of the TES project. Similarly, there will be no noise impacts due to construction or operation of the CCT project.

TES Tank Greve & Associates, LLC Page 8
Appendix
Draft TES Construction Schedule
Construction Noise
Traffic Noise

Activity ID Activity Name Original
Duration
Start Finish
MtSAC Central Plant UpgradeMtSAC Central Plant Upgrade 257 9/9/15 9/7/16
Contracts & MilestonesContracts & Milestones 257 9/9/15 9/7/16
A1000 BOARD APPROVAL OF PROJECT 0 9/9/15*A1010 CONTRACTS ISSUED AND EXECUTED 20 9/9/15 10/6/15A1020 WEATHER CONTINGENCY 7 6/2/16 6/10/16A1030 CONSTRUCTION COMPLETE 0 6/15/16A1040 PROJECT CLOSEOUT AND FINAL RECONCILIATION60 6/16/16 9/7/16A1050 PROJECT COMPLETE 0 9/7/16
Submittals/ProcurementSubmittals/Procurement 100 10/7/15 2/29/16
SubmittalsSubmittals 20 10/7/15 11/3/15P1-232113 PIPING & ACCESSORIES SUBMITTAL 5 10/7/15 10/13/15P1-232123 PUMP SUBMITTAL 15 10/7/15 10/27/15P1-232923 VFD SUBMITTALS 20 10/7/15 11/3/15P1-236416 CHILLER SUBMITTAL 20 10/7/15 11/3/15P1-236500 COOLING TOWER SUBMITTAL 15 10/7/15 10/27/15P1-230900 CONTROLS SUBMITTAL 20 10/7/15 11/3/15P1-260500 ELECTRICAL SUBMITTALS 10 10/7/15 10/20/15P1-033000 CONCRETE & REINFORCING SUBMITTAL 5 10/7/15 10/13/15P1-051000 STRUCTURAL STEEL SUBMITTAL 15 10/7/15 10/27/15P1-010000 BIM COORDINATION 20 10/7/15 11/3/15
Submittal ReviewSubmittal Review 35 10/14/15 12/4/15P2-232113 PIPING & ACCESSORIES SUBMITTAL REVIEW 10 10/14/15 10/27/15P2-033000 CONCRETE & REINFORCING SUBMITTAL REVIEW5 10/14/15 10/20/15P2-260500 ELECTRICAL SUBMITTAL REVIEW 10 10/21/15 11/3/15P2-232123 PUMP SUBMITTAL REVIEW 15 10/28/15 11/18/15P2-236500 COOLING TOWER SUBMITTAL REVIEW 15 10/28/15 11/18/15P2-051000 STRUCTURAL STEEL SUBMITTAL REVIEW 10 10/28/15 11/11/15P2-232923 VFD SUBMITTALS REVIEW 20 11/4/15 12/4/15P2-236416 CHILLER SUBMITTAL REVIEW 20 11/4/15 12/4/15P2-230900 CONTROLS SUBMITTAL REVIEW 15 11/4/15 11/25/15
ProcurementProcurement 90 10/21/15 2/29/16P3-033000 CONCRETE & REINFORCING PROCURE 5 10/21/15 10/27/15P3-232113 PIPING & ACCESSORIES PROCUREMENT 30 10/28/15 12/11/15P3-260500 ELECTRICAL PROCUREMENT 10 11/4/15 11/18/15P3-051000 STRUCTURAL STEEL FAB/DELIVER 15 11/12/15 12/4/15
A S O N D J F M A M J J A S O N
9/7/16, MtSAC Central Plant Upgrade
9/7/16, Contracts & Milestones
BOARD APPROVAL OF PROJECTCONTRACTS ISSUED AND EXECUTED
WEATHER CONTINGENCYCONSTRUCTION COMPLETE
PROJECT CLOSEOUT AND FINAL RECONCILIATIONPROJECT COMPLETE
2/29/16, Submittals/Procurement
11/3/15, SubmittalsPIPING & ACCESSORIES SUBMITTAL
PUMP SUBMITTALVFD SUBMITTALSCHILLER SUBMITTAL
COOLING TOWER SUBMITTALCONTROLS SUBMITTAL
ELECTRICAL SUBMITTALSCONCRETE & REINFORCING SUBMITTAL
STRUCTURAL STEEL SUBMITTALBIM COORDINATION
12/4/15, Submittal ReviewPIPING & ACCESSORIES SUBMITTAL REVIEW
CONCRETE & REINFORCING SUBMITTAL REVIEWELECTRICAL SUBMITTAL REVIEW
PUMP SUBMITTAL REVIEWCOOLING TOWER SUBMITTAL REVIEW
STRUCTURAL STEEL SUBMITTAL REVIEWVFD SUBMITTALS REVIEWCHILLER SUBMITTAL REVIEW
CONTROLS SUBMITTAL REVIEW2/29/16, Procurement
CONCRETE & REINFORCING PROCUREPIPING & ACCESSORIES PROCUREMENT
ELECTRICAL PROCUREMENTSTRUCTURAL STEEL FAB/DELIVER
MtSAC Central Plant Upgrade Std Presentation group by WBS 7/21/15 14:22
Actual WorkRemaining Work
Critical Remaining ...Milestone
Page 1 of 3

Activity ID Activity Name Original
Duration
Start Finish
P3-232123 PUMP PROCUREMENT 30 11/19/15 1/4/16P3-236500 COOLING TOWER PROCUREMENT 40 11/19/15 1/18/16P3-230900 CONTROLS PROCUREMENT 20 11/30/15 12/28/15P3-232923 VFD PROCUREMENT 40 12/7/15 2/1/16P3-236416 CHILLER PROCUREMENT 60 12/7/15 2/29/16
Site & PipingSite & Piping 122 12/14/15 6/1/16
S-01000 LOT H - FENCE & LAYOUT 3 12/14/15 12/16/15S-01010 SITE PIPING & REPAIRS - LOT H 25 12/17/15 1/21/16S-01020 FENCE & LAYOUT - LOT G & BCT SITE 3 1/22/16 1/26/16S-01030 SITE PIPING & REPAIRS - LOT G & BCT AREA 25 1/27/16 3/1/16S-01040 FENCE & LAYOUT - CP TO BONITA 3 3/2/16 3/4/16S-01050 SITE PIPING & REPAIRS - CP TO BONITA 25 3/7/16 4/8/16S-01060 SITE PIPING & REPAIRS - BONITA CROSSING 15 4/11/16 4/29/16S-01080 FENCE & LAYOUT - LOT F 3 4/11/16 4/13/16S-01090 SITE PIPING & REPAIRS - LOT F 20 4/14/16 5/11/16S-01070 SITE PIPING & REPAIRS - TEMPLE CROSSING 20 5/2/16 5/27/16A-1030 TEST/APPROVAL FINAL PIPING 3 5/30/16 6/1/16
Central PlantCentral Plant 157 11/4/15 6/15/16
C-01000 LAYOUT/DEMO/INSTALL FOOTINGS & PADS 10 11/4/15 11/18/15C-01040 INSTALL DRAINS 5 11/12/15 11/18/15C-01130 PAINT EQUIPMENT PADS 1 11/19/15 11/19/15C-01010 INSTALL WALL OPENING SUPPORTS 2 12/7/15 12/8/15C-01030 INSTALL EQUIPMENT SUPPORT STEEL 5 12/7/15 12/11/15C-01020 CUT WALL PENTRATIONS 2 12/9/15 12/10/15C-01050 MECHANICAL PIPING 40 12/14/15 2/8/16C-01070 INSTALL PUMPS 10 1/5/16 1/18/16C-01060 INSTALL COOLING TOWER 10 1/19/16 2/1/16C-01080 INSTALL CHILLER 5 3/1/16 3/7/16C-01090 INSTALL MISC EQUIPMENT 5 3/8/16 3/14/16C-01110 INSTALL CONTROLS 20 3/8/16 4/4/16C-01100 INSTALL ELECTRICAL TO EQUIPMENT 20 3/15/16 4/11/16C-01140 COMPLETE PIPING AND CUTOVERS 15 3/15/16 4/4/16C-01120 PAINT PIPING & FLOORS 10 4/5/16 4/18/16C-01150 STARTUP EQUIPMENT 1 4/12/16 4/12/16C-01160 TEST AND COMMISSION EQUIPMENT 15 4/13/16 5/3/16C-01180 PUNCHLIST AND CLEAN CENTRAL PLANT 10 5/4/16 5/17/16
A S O N D J F M A M J J A S O N
PUMP PROCUREMENTCOOLING TOWER PROCUREMENT
CONTROLS PROCUREMENTVFD PROCUREMENT
CHILLER PROCUREMENT6/1/16, Site & Piping
LOT H - FENCE & LAYOUTSITE PIPING & REPAIRS - LOT HFENCE & LAYOUT - LOT G & BCT SITE
SITE PIPING & REPAIRS - LOT G & BCT AREAFENCE & LAYOUT - CP TO BONITA
SITE PIPING & REPAIRS - CP TO BONITASITE PIPING & REPAIRS - BONITA CROSSING
FENCE & LAYOUT - LOT FSITE PIPING & REPAIRS - LOT F
SITE PIPING & REPAIRS - TEMPLE CROSSINGTEST/APPROVAL FINAL PIPING
6/15/16, Central Plant
LAYOUT/DEMO/INSTALL FOOTINGS & PADSINSTALL DRAINSPAINT EQUIPMENT PADS
INSTALL WALL OPENING SUPPORTSINSTALL EQUIPMENT SUPPORT STEELCUT WALL PENTRATIONS
MECHANICAL PIPINGINSTALL PUMPS
INSTALL COOLING TOWERINSTALL CHILLERINSTALL MISC EQUIPMENT
INSTALL CONTROLSINSTALL ELECTRICAL TO EQUIPMENT
COMPLETE PIPING AND CUTOVERSPAINT PIPING & FLOORS
STARTUP EQUIPMENTTEST AND COMMISSION EQUIPMENT
PUNCHLIST AND CLEAN CENTRAL PLANT
MtSAC Central Plant Upgrade Std Presentation group by WBS 7/21/15 14:22
Actual WorkRemaining Work
Critical Remaining ...Milestone
Page 2 of 3

Activity ID Activity Name Original
Duration
Start Finish
C-01170 TEST AND COMMISSION CENTRAL PLANT & TES10 6/2/16 6/15/16C-01190 OWNER TRAINING 5 6/2/16 6/8/16
A S O N D J F M A M J J A S O N
TEST AND COMMISSION CENTRAL PLANT & TESOWNER TRAINING
MtSAC Central Plant Upgrade Std Presentation group by WBS 7/21/15 14:22
Actual WorkRemaining Work
Critical Remaining ...Milestone
Page 3 of 3

TES - Construction Noise
Peak Noise @ 50 ft. Demolition
Tank Excavation Tank Pour Backfill Paving
Front Loader/Excavator 97 2 2 1Backhoe 93 1 1 1Grader 96 1Paver 92 1Truck 97 1 1 1 1 1Concrete Mixer 90 1Concrete Pump 85 1Saw 96 1Distance (ft.) 160 160 160 160 160Peak @ 50 ft. (dBA) 97 97 97 97 97Peak @ Receptor (dBA) 92 92 92 92 92
Average Noise @ 50
ft. DemolitionTank
Excavation Tank Pour Backfill PavingFront Loader/Excavator 85 2 2 0 0 1Backhoe 80 1 1 0 1 0Grader 85 0 1 0 0 0Paver 89 0 0 0 0 1Truck 88 1 1 1 1 1Concrete Mixer 85 0 0 1 0 0Concrete Pump 82 0 0 1 0 0Saw 76 1 0 0 0 0Distance (ft.) 205 205 205 205 205Avg. @ 50 ft. (dBA) 91 92 90 89 92Avg. @ Receptor (dBA) 85 86 84 83 86

CNEL PREDICTION WORKSHEET - CALVENO
Roadway Name: Edinger Way MT (%) 1.84% Day Eve Night Equiv.Vehicles per day 1,254 HT(%) 0.74% Auto 88.18% 6.29% 2.95% 137.6%
Speed (mph) 35 Day 91% MT 1.67% 0.12% 0.06% 2.6%Grade Adj. (dB) 0 Evening 6% HT 0.67% 0.05% 0.02% 1.0%
Vehicle Noise Red (dB) 0 Night 3%
This is the CNEL at 15 m. To get other noise levels, To get other distances,Soft Hard Put in other distances (ft). Put in other noise levels.
CNEL(15m) CNEL(15m) Dist. Soft Hard CNEL Soft HardAuto 51.7 52.9 100 48.6 51.3 57 27 27
Medium Trk. 44.2 45.4 250 42.6 47.3 60 17 14Heavy Truck 45.4 46.6 500 38.1 44.3 65 8 4
Total 53.2 54.4 1000 33.6 41.3 70 4 1

638 CAMINO DE LOS MARES, SUITE H130-153, SAN CLEMENTE, CA 92673 VOICE: 949•466•2967 EMAIL: [email protected]
Memorandum Date: October 19, 2015 To: Ms. Mikaela Klein, Mt. San Antonio College From: Fred Greve, Greve & Associates, LLC Subject: Results of On-Site Noise Measurements and Supplemental Information on the Potential Impact of the Proposed Cooling Tower (Report #15-111) Noise measurements were made on October 8, 2015 on-campus and at an adjacent residence (21020 Granite Wells Drive). The primary purpose of the measurements was to determine the noise levels from the Central Plant, and whether they are excessive at the residential area. The measurements are then combined with data on the proposed cooling tower to determine if a cumulative impact would occur. A secondary purpose of the noise measurements was to determine if noise generated by the air conditioning equipment on the Agricultural Sciences Building might also be excessive at the residential area to the north. CENTRAL PLANT NOISE/PROPOSED COOLING TOWER The Central Plant has an enclosed area with pumps and other equipment, and an outdoor yard. Noise to the north of the plant is due exclusively to the cooling tower located in the outdoor yard of the Central Plant. Exhibit 1 shows the measurements sites. Site A was inside the plant yard. Site B was near the tennis courts north of the plant, and Site C was in the parking lot north of the plant. The noise level due to the cooling tower was 82.5 dBA at Site A, 53 dBA at Site B, and about 47 dBA at Site C. Sites E and F were located at 21020 Granite Wells Drive, and are the sites of primary concern for this analysis. This residence is the closest to the Central Plant, and therefore, represents the highest noise levels that are likely to be experienced in the residential area north of the facility. Site E was located in the rear yard very near the wrought iron fence on the property line. Site F was located on the second floor bedroom balcony on the back of the house which faces the Central Plant.


On-Site Measurements Greve & Associates, LLC Page 3
Both sites have an interrupted line of sight to the Central Plant. Measurements were performed in half hour periods starting roughly at 8:00 p.m. and ending at 11 p.m. The site in the backyard was manned the entire time. From 8 p.m. to 10 p.m. the cooling tower could not be heard at all, or at times could be barely discernable. Noise from the school parking lot and distant traffic noise caused a constant sound that was louder than the cooling tower. From about 10 p.m. the cooling tower could be clearly heard on a regular basis. The data indicates that in the backyard the noise level is about 44 dBA due to the Central Plant. Upstairs the noise level is slightly higher and the cooling tower noise is about 47 dBA. The noise level is higher at the second floor because “ground absorption” is less for the second floor, and this typically results in slightly higher noise levels for elevated locations. College operations are exempt from the City of Walnut Noise Ordinance. However, the ordinance can still be used as general guide to the acceptability of noise levels. Based on our noise measurements, the noise levels due to the Central Plant would be below the Noise Ordinance criteria of 45 dBA in all residential backyard areas. At the bedroom balcony area, the measured noise level of 47 dBA would be slightly higher than the City criteria. Sleep disturbance is another way of determining the potential impact of the cooling tower. The Federal Interagency Committee on Noise (FICON) in 1992 in a document entitled Federal Interagency Review of Selected Airport Noise Analysis Issues recommended an interim dose-response curve for sleep disturbance based on laboratory studies of sleep disturbance. This document probably represents the greatest effort to coordinate noise and sleep disturbance. In June of 1997, the Federal Interagency Committee on Aviation Noise (FICAN) updated the FICON recommendation with an updated curve based on the more recent in-home sleep disturbance studies which show lower rates of awakening compared to the laboratory studies. FICAN recommended a curve based on the upper limit of the data presented and therefore considers the curve to represent the “maximum percent of the exposed population expected to be behaviorally awakened,” or the “maximum awakened.” The FICAN recommendation is shown on Exhibit 2. The “maximum awakened” curve reflected in Exhibit 2 shows the 10% awakening rate being reached at 80 dB SENEL. (The full FICAN report can be found on the internet at www.fican.org.) The Single Event Noise Exposure Level (SENEL) requires some explanation. The SENEL (also abbreviated SEL) noise metric was designed to be used primarily with aircraft noise events. It accounts for the duration of the event and the loudness of the event. It is generally believed that short-term noise events have a greater potential for sleep disturbance than does a steady-state noise level.


On-Site Measurements Greve & Associates, LLC Page 5
The SENEL noise represents the noise energy for an event that would be equal to the noise level of an event lasting one second. A noise event of 60 dBA that lasts for one second would have an SENEL of 60. A noise event of 45 dBA that lasts one hour would have a SENEL of 62. And examination of the chart shows that 4 to 5% of the population would incur sleep disturbance with a SENEL of 62 dBA. The chart in Exhibit 2 shows that according to the FICAN 1997 data, a SENEL of 80 dBA is needed to cause sleep disturbance in 10 percent of the population. The data also suggests that there is a huge range in people’s sensitivity for sleep disturbance, and this is why a single noise level is not used as criteria for preventing sleep disturbance. The resident stated that the noise levels are most irritating between midnight and 5 a.m. The operator of the plant was consulted and it was confirmed that the cooling tower runs the same 24 hours per day, seven days a week. It is most likely that the cooling tower noise is nearly the same at the residence all of the time. However, when the distant traffic and other noise sources die down at night the cooling tower will be more audible. It should be pointed out that there are many noise sources in the area that cause noise levels higher than the Central Plant at the residences. It has already been pointed out that distant traffic and college parking lot noise is louder than the cooling tower most of the time. Even when these sources drop below the cooling tower noise, there is an active railroad that parallels Valley Boulevard, high jet aircraft on approach to what appears to be Los Angeles International Airport (LAX), and loud trucks and motorcycles in the area that temporarily drown out the noise from the cooling tower. These intermittent noises, sometimes referred to as single-event noises, are more likely to cause sleep disturbance in this neighborhood than the Central Plant. A single new 1700 gallons per minute (gpm) cooling tower will be added to the cooling tower yard at the Central Plant as part of the Thermal Energy Storage (TES) project. Noise data provided indicate that the new cooling tower will be 80 dBA at 5 feet. Projections indicate that the new cooling tower would be 27.4 dBA at the closest residence (see worksheet in Appendix). Noise levels are added logarithmically. A couple examples are worthwhile. When one noise source of 60 dBA is added to another noise source of 60 dBA; the combined noise level is 63 dBA. If noise levels are more than 10 dB apart the quieter noise source does not add significantly to the louder. For example, a 50 dBA noise source added to a 60 dBA noise source results in a combined noise level of 60 dBA. For this case, the new cooling tower will be at least 17 dBA quieter than the existing cooling tower. The new cooling tower will not add significantly to the noise generated by the Central Plant (see worksheet in Appendix). Several conclusions can be drawn from the noise measurements and the analysis presented. First, the new proposed cooling tower will have noise levels that are very quiet (i.e., 27 dBA at the nearest residence) and well below the limits suggested by the Walnut Noise Ordinance.

On-Site Measurements Greve & Associates, LLC Page 6
There will be no noise impacts generated by the new cooling tower alone. Second, the new proposed cooling tower will not add measurably to the noise levels currently generated by the Central Plant, and therefore, there will not be cumulative impacts generated by the new cooling tower. The Central Plant alone may be slightly above the City’s recommended criteria, but the proposed cooling tower will add not add measurably to that level. Third, the existing ambient noise level at the residential area is strongly affected by traffic in the area, railroad, aircraft, and other noises. These noise levels for the majority of the night are higher than the noise generated by the Central Plant alone. Therefore, when one considers the existing noise plus the cooling tower, there will be no increase in noise level above the existing levels, and no significant impact will occur. AGRICULTURAL SCIENCE AIR CONDITIONING Short-term noise measurements were made at Sites D and G to determine if noise generated by the Agricultural Science Building air conditioner units are a problem. The air conditioner units are located on the roof of the Ag Science Building. Around 7:30 p.m. several areas immediately around the building were visited. At none of the sites could air conditioner noise from the Ag Science Building be heard. Site D was measured at 7:16 p.m. and the average noise level (L50) was 50.5 dBA. This was due to the air conditioner units on the nearby portable building units. The Ag Science air conditioning could not be heard. Site D was again measured at 11:56 p.m. and the average (L50) noise level was 43 dBA, which is considered quiet. Again, the Ag Science air conditioning could not be heard. Site G, which is closer to Ag Science, was measured at 12:21 a.m. and had an average noise level of 41 dBA. The Ag Science building could not be heard at this site, and the noise level is very quiet. In conclusion, based on my observations and measurements, the Ag Science Building air conditioners do not perceptively increase the ambient noise levels at any sensitive receptor including the nearest residences.

On-Site Measurements Greve & Associates, LLC Page 7
APPENDIX

BARRIER PREDICTION WORKSHEET, POINT SOURCE
Calcs for New Cooling Tower
Noise Level of 80.0 dBA at 5.0 feet
Critical Freq. (Hz) 500 To get other noise levels,
Dist. dBA dBA Dist.Noise Level at 50' 60.0 50 60.0 70 16
100 54.0 55 891000 34.0 60 501380 31.2 65 28
Source Distance Base Of Dist. To Pad Observer Wall ***Barrier Reduction*** Noise LevelLot Elevation To Wall Wall Observer Elevation Height Height (dBA)
Cooling Tower Alone 20 5 0 1195 30 5 0.0 5.0 27
Minimum 5 dB barrier reduction from exisitng wall gives 27 dBA for new cooling tower.
Noise Level at Residence Backyark (27 + 44) 44Noise Level at Residence Balcony (27 + 47) 47
Put in DistancesTo get other distances,
Put in other noise levels.


San Gabriel Valley Newspaper Group
Valley Tribune•Star-News•Daily News•Highlander
09/08/15 2:23:49PMPage 1 of 3Advertising Order Confirmation
ffundora 1100 N GRAND 1100 N GRAND
Order Taker Customer Address Payor Address
ffundora 5026827 5026827 Kerry Martinez
Customer Account Payor Account Ordered By
MT. SAN ANTONIO COLLEGEMT. SAN ANTONIO COLLEGE0010711404 Notice of Public Hearing for Sep
Ad Order Number Customer Payor Customer PO Number
Sales Rep.
Customer Fax
WALNUT CA 91789 USA WALNUT CA 91789 USA
Customer EMail Payor Phone Customer Phone Order Source
909-594-5611 909-594-5611
Ad Order Notes Invoice Text Current Queue
Ready
00 None
Special Pricing Blind Box AffidavitsTear Sheets Promo Type Materials
Ad Number Ad Size Color Ad Attributes Production Notes Production Color Production Method
0010711404-01 AdBooker4.0 X 124 Li
External Ad Number Pick Up Ad Type
Legal Liner
r.LP320-05/14/15\\albsjcvmwapp01\Crystal Reports\LANG\Advertising\LANG Order Confirmation.rpt

San Gabriel Valley Newspaper Group
Valley Tribune•Star-News•Daily News•Highlander
09/08/15 2:23:49PMPage 2 of 3Advertising Order Confirmation
0010711404 MT. SAN ANTONIO COLLEGE
Customer Ad Order Number
r.LP320-05/14/15\\albsjcvmwapp01\Crystal Reports\LANG\Advertising\LANG Order Confirmation.rpt

San Gabriel Valley Newspaper Group
Valley Tribune•Star-News•Daily News•Highlander
09/08/15 2:23:49PMPage 3 of 3Advertising Order Confirmation
0010711404 MT. SAN ANTONIO COLLEGE
Customer Ad Order Number
Run Dates # InsertsRequested Placement Product Requested Position
09/10/15SGV NewspapersSan Gabriel Trib 1Legals CLS MiscellaneousNotices-1076~
Order Charges:Net Amount
$694.48
Tax Amount
$0.00
Total Amount
$694.48
Payment Method Payment Amount
$0.00
Amount Due
$694.48
If this confirmation includes an advertising proof, please check your proof carefully for errors, spelling, and/or typos. Errors not marked on the returned proof are not subject to credit or refunds.
Please note: To meet our printer’s deadline, we must have your proof returned by the published deadline, and as indicated by your sales rep. If we have not heard from you by that time, we will
assume that your ad is correct, and it will run as is.
Please note: If you pay by bank card, your card statement will show the merchant as "LA NEWSPAPER GROUP".
r.LP320-05/14/15\\albsjcvmwapp01\Crystal Reports\LANG\Advertising\LANG Order Confirmation.rpt


San Gabriel Valley Newspaper Group
Valley Tribune•Star-News•Daily News•Highlander
09/30/15 10:07:22AMPage 2 of 3Advertising Order Confirmation
0010720254 MT. SAN ANTONIO COLLEGE
Customer Ad Order Number
r.LP321-09/08/15\\albsjcvmwapp01\Crystal Reports\LANG\Advertising\LANG Order Confirmation.rpt


State of California - Department of Fish and Wildlife NO EFFECT DETERMINATION REQUEST DFW 866 (Rev 01/13)
Lead agencies or project applicants that anticipate their project having no effect on fish and wildlife may use this form to request a “No Effect” Determination (NED) from the California Department of Fish and Wildlife (Department). This form prompts submittal of required information specified in the California Code of Regulations (Title 14 Section 753.5(c)(1)(A)). The California Environmental Quality Act (CEQA) document that was prepared for the project or a link to the webpage where the CEQA document has been published must also be provided with the written request.
Requests should be submitted when the CEQA document is released for public review, or as early as possible in the public comment period. Requests should include sufficient documentation to support a no effect determination, and must be submitted to the appropriate Regional Office. Requests for projects with multi-region or statewide impacts should be submitted to the Habitat Conservation Planning Branch. If insufficient documentation is submitted, or if the project will cause a physical disturbance to habitat regardless of the magnitude of effect or size of a project a NED will not be issued. Please refer to Title 14 California Code of Regulations 753.5(d) for determination criteria.
Date Submitted:
Applicant Name: Phone Number:
Address:
City: State: Zip:
Fax Number:
Email:
Contact Person: Phone Number:
Address:
City: State: Zip:
Fax Number:
Email:
CEQA Lead Agency:
Project Name:
SCH Number and/or Local Agency ID number: CEQA Document Type:
Project Location: (Include street address, city, county, lat/long, township/range/section, or other description that clearly indicates the location of the project site. Submit an aerial photograph and/or topographic map showing the project location if otherwise not included with the CEQA document)
Use “Comment” section on next page if more room is needed.
Brief Project Description: (Include details on the type of project; e.g. new construction [with square footage], demolition of existing buildings, adaptive reuse of existing buildings, zoning amendments, general plan amendments, conditional use for sale of alcoholic beverages, etc.)
Use “Comment” section on next page if more room is needed.
Justification of No Effect Determination [Explain how the proposed project has no effect on fish and wildlife consistent with 14 CCR § 753.5(d)]:
Use “Comment” section on next page if more room is needed.

State of California - Department of Fish and Wildlife NO EFFECT DETERMINATION REQUEST DFW 866 (Rev 01/13)
COMMENTS (Continued from previous page) Project Location: (Include street address, city, county, lat/long, township/range/section, or other description that clearly indicates the location of the project site. Submit an aerial photograph and/or topographic map showing the project location if otherwise not included with the CEQA document)
COMMENTS (Continued from previous page) Brief Project Description: (Include details on the type of project; e.g. new construction [with square footage], demolition of existing buildings, adaptive reuse of existing buildings, zoning amendments, general plan amendments, conditional use for sale of alcoholic beverages, etc.)
COMMENTS (Continued from previous page) Justification of No Effect Determination [Explain how the proposed project has no effect on fish and wildlife consistent with 14 CCR § 753.5(d)]:

State of California - Department of Fish and Wildlife NO EFFECT DETERMINATION REQUEST DFW 866 (Rev 01/13)
No Effect Determination Request Form Instructions
Applicant Name and Address Full name and address of the CEQA project applicant
Date Submitted Date of No Effect Determination Request Form submission
Phone Number CEQA project applicant’s phone number
Email CEQA project applicant’s email address
Fax Number Primary fax line for the CEQA project applicant
Contact Person and Address Full name and address of the person that should be contacted should additional information be needed to issue an NED
Phone Number Contact person’s direct phone or cell number
Email Contact person’s email address
Fax Number Contact person’s direct fax number (if available)
CEQA Lead Agency The agency responsible for primary approval of the project, and for filing the Notice of Determination, or Decision, and any applicable findings
SCH Number and/or Local Agency ID Number
State Clearinghouse Number – “SCH” – tracking number generated by Office of Planning and Research (OPR) when a project’s CEQA documents are filed/circulated with/through OPR’s State Clearinghouse
Local Agency ID Number – tracking/file number generated by the local agency (e.g. city or county) when a local agency is CEQA lead AND the project’s CEQA documents will not be filed/circulated with/through OPR’s State Clearinghouse
CEQA Document Type
Options include:
• Negative Declaration,
• Mitigated Negative Declaration,
• Environmental Impact Report, or
• Document for Certified Regulatory Program
Project Location May be the project’s street address including city and county, geographic coordinates (latitude/longitude, UTM), public land survey system coordinates (township/range/section), or other description that clearly indicates the location of the project site
Submit an aerial photograph and/or topographic map showing the project location if otherwise not included with the CEQA document
Brief Project Description Please include details on the type of project; e.g. new construction (with square footage), demolition of existing buildings, adaptive reuse of existing buildings, zoning amendments, general plan amendments, conditional use for sale of alcoholic beverages, etc.
Justification of No Effect Determination
Explain how the proposed project has no effect on fish and wildlife consistent with CCR Title 14 § 753.5(d)

sklein2a
Callout
Existing Central Plant
sklein2a
Ellipse
sklein2a
Callout
Proposed Tank

DI
DI
DI
DI
DI
DI
DI
DI
DI
DI
DI
DI
DI
DI
DI
DI
DI
DI
DI
DI
DI
DI
DI
DI
DI
DI
DI
DI
DI
DI
DI
DI
DI
DI
DI
DI
DI
DI
DI
26A
26D
26C26B
29A
27A27C
6667B
67A
69
69
F2C
F3
27B
29
80
CDCSTAIRS
BRUSH
DENSE TREES
DENSE TREES
DENSE TREES
DENSE TREES
DENSE TREES
DENSE TREES
DENSE TREES
DENSE TREES
DENSE TREES
DENSE TREES
DENSE TREES
DENSE TREES
DENSE TREES
DENSE TREES
DENSE TREES
DENSE TREES
DENSE TREES
DENSE TREES
PALMS
PALMS
DIRT PILES
DIRT PILES
DIRT PILES
ASPH
ASPH
ASPH
ASPH
ASPH
ASPH
ASPH
ASPH
ASPH
ASPH
ASPH
ASPH
ASPH
ASPH
ASPH
ASPH
ASPH
ASPH
ASPH
ASPH
ASPH
ASPH
ASPH
ASPH
ASPH
ASPH
ASPH
ASPH
ASPH
ASPH
ASPH
ASPH
ASPH
ASPH
ASPH
ASPH
CONC
CONC
CONC
CONC
CONC
CONC
CONC
CONC
CONC
CONC
CONC
CONC
CONC
CONC
CONC
CONC
CONC
CONC
CONC
CONC
CONC
CONC
CONC
CONC
CONC
CONC
CONC
TANK
779.22INV
775.10 inINV
D
D
769.52 in v. in
769.3 5 in v. out
BLDG. A
BLDG. B
BLDG. C
16" CHWS(E) 16" CHWS
16" CHWR(E) 16" CHWR
(E) TES TANK
1
M601(TYP.)
1 3
1
16" CHWS
16" CHWR
3
2
(E) 16" CHWS
(E) 16" CHWR
10" CHWS
10" CHWR
52
M603
3
M603
1
M601
1 3
1
3
M604
3
84
M604
8" CHWS
8" CHWR
4
M603
5
M6036
8" CHWS
8" CHWR
1
M604
2
M6047
4
(E) TES TANK ACCESS VAULT.
P.O.C. AT (E) BURIED CONCRETE VAULT TO EXISTING HIGH
PERFORMANCE BUTTERFLY VALVES ON (E) 16" CHWS/R PIPES.
EFORPD
ER
ET
SI
GE
R
RE
EN
IG
NE
LANOISS
C A L I F OR
N
IA
ST
AT
EO F
ME C HA N I C A
L
No. M34421
JA
ME
SP . V A
L
IE
NS
I
P2S Engineering, Inc.
5000 East Spring Street, 8th FloorLong Beach, CA 90815-5218T 562.497.2999 F 562.497.2990
www.p2seng.com
Project Title
Revisions
DateDescriptionNumber
Designed
Drawn
Checked
Date
Sheet Title
Sheet Number
Consultant
Approved
Scale
Submittal
1 2 3 4 5 6
A
B
C
D
E
1" = 60'-0"
C:\U
sers
\Mau
ricio
Alc
anta
ra\D
ocum
ents
\_Lo
cal R
evit
Pro
ject
s\76
27_M
EP
14_C
entr
al_M
auric
io A
lcan
tara
.rvt
6/30
/201
5 4:
58:4
6 P
M
Designer
Checker
Approver
June 26, 2015
M100
Site Plan - Overall
P2S No.7627
Author
Issue for Bid
Mt. San Antonio College CentralPlant Upgrades
1100 N. Grand AveWalnut, CA 91789
SCALE: NONE1
MECH_Site Plan - Overall
1MAINTAIN MINIMUM 3'-0" COVER ABOVE THE TOP OF THE CHW
PIPES.
ROUTE CHW PIPES BELOW COOLING TOWER YARD WALL AND UP
THROUGH SLAB.
REFER TO CIVIL SITE PLAN ON SHEET C4.01 FOR EXISTING
UNDERGROUND UTILITIES AND SITE WORK RELATED TO CHW PIPE
ROUTING.
UNDERGROUND PIPES TUNNEL BELOW STREET.
PROVIDE BURIED PRECAST CONCRETE VALVE PIT (VP-1) AND
BUTTERFLY VALVES FOR FUTURE BUSINESS TECHNOLOGY
CONNECTIONS.
PROVIDE BURIED PRECAST CONCRETE VALVE PIT (VP-2) AND
BUTTERFLY VALVES FOR FUTURE CONNECTIONS.
PROVIDE BURIED PRECAST CONCRETE VALVE PIT (VP-3) FOR
ACCESS TO PIPE INSTALLATION AT STREET CROSSING.
PROVIDE BURIED PRECAST CONCRETE VALVE PIT (VP-4) AND
BUTTERFLY VALVES FOR FUTURE ATHLETICS CONNECTIONS.
NOTES
2
3
4
5
6
7
8
sklein2a
Ellipse
sklein2a
Rectangle
sklein2a
Line
sklein2a
Line
sklein2a
Line
sklein2a
Line
sklein2a
Line
sklein2a
Line
sklein2a
Line
sklein2a
Line
sklein2a
Line
sklein2a
Line
sklein2a
Line
sklein2a
Line
sklein2a
Line
sklein2a
Line


1 Attachment
Dear Ms. Klein:
Attached is my comments on the Draft Mitigated Negative Declaration for the Thermal Energy System (TES) and the Chiller Cooling Tower (CCT) projects.
I hope that you'll find these comments constructive and helpful in your planning and implementing these projects. I hope that the College will be able to implement mitigations that lessen the negative impacts of these projects on our family and our property as mentioned in my comments.
Please send me a confirmation upon receipt of this email.
Thank you very much for your time and attention.
Best Regards,Katherine Nguyen
Comments on the Draft Mitigated Negative Declaration for the Thermal Energy System and Chiller Cooling Tower ProjectsKat Nguyen to:[email protected]/02/2015 12:25 AMHide Details From: Kat Nguyen <[email protected]>To: "[email protected]" <[email protected]>Please respond to Kat Nguyen <[email protected]>History: This message has been replied to.
The TES Project Comments - Final.docx
Page 1 of 1
10/2/2015file:///C:/Users/sklein2a/AppData/Local/temp/notes5F19E9/~web5817.htm

Comments on the Draft Mitigated Negative Declaration for the Thermal Energy System and Chiller Cooling Tower Projects
By Katherine Nguyen, Sr. Engineer Granite Wells Dr., Walnut CA Email: [email protected]
1. EIR Notification Process:
My property is located within 200 ft. of the TES project, and perhaps is most
impacted by this project. There should be no more than 100 properties in the area that would be affected by this project. But I was not notified about the project by mail. I just happened to learn about this project on the Mt.SAC website last week. I doubt that many residents who will be affected by this project have known about it.
2. According to the Mitigated Negative Declaration (MND), “the estimated electrical cost savings are projected to be $323,000 per year. However, the project preliminary cost of $10.0 million has grown with the addition of the Athletic Complex East piping costs. The payback period for the TES/CCT Project is approximately twelve years. However, if the Project includes projected piping costs for future projects such as the Athletics Complex East and Physical Education Complex, the payback period will increase (P2S Engineering, July 2015).” Does the estimated electrical cost savings take into account the cost savings
resulted from other energy saving projects such as the Solar Farm, etc.?
Would the payback period be much longer if the other projects were able to generate substantial energy saving costs for the college?
3. Project Alternatives (p.11).
Were other alternatives to the TES tank in a gravity system considered? For
example, another solar energy system, or non-gravity tank system, etc.
Can the college locate the tank further away from the residential homes by moving it further south of Edinger way, and closer to Walnut drive, OR moving it to the area in the east end of parking lot H, south of Edinger Way, east of Bonita Dr., and directly across from the Sherman Park? These locations almost have the same elevation as the proposed site of the TES, and it seems like the college will also be able to save the piping costs when this project is extended to Athletic Complex East and the Physical Education Complex, which is more feasible, more cost effective, and less detrimental to the residents.

4. Zoning (p.12). Since the City of Walnut has zoning ordinances that make provisions for
underground utility facilities, the college should seek a permit for the project with the City and comply with these zoning provisions.
It is a great concern for us as a homeowner that this project will negatively affect our home value because of the incompatible land use with the City of Walnut’s zoning and General Plan.
5. Issues and Supporting Information (p.13) Air Quality (p.14): The TES project is only 160 ft. away from the closest resident
home; therefore, the impact of the project on air quality may be significant if not mitigated. Many residential homes near the project site are home to retirees and seniors, as well as small children. Some residents also have children with Asthma. The college should implement strong measures to mitigate the pollution issue as a result of this project.
Geology and Soils (p.16): (a). Since the TES project is less than 200 ft. away from our property, the extraction of 13,500 cy of earth from the project site may create adverse impact to the foundation and structures of our property; may crack walls and break windows, or other glass materials. Contrary to the MND’s report which states that “the soils at the proposed project sites are not susceptible to liquefaction,” The JCP-LGS Residential Property Disclosure Reports/The Natural Hazard Disclosure Report for Los Angeles County shows that the residential homes near the project site is in the Liquefaction Zone. Therefore, the project could have a Potentially Significant Impact to the properties nearby due to strong seismic ground shaking.
6. Land Use and Planning (p.18):
The TES project is only 160 ft. away from the closest resident home, and both the TES and CCT are located in the area designated as Residential Plan Development 61,700 (0.6 du) with a Civic Center Overlay Zone by the City of Walnut. However, the TES and the CCT projects, together, will become a system that only exists in an industrial or commercial zone. This is not compatible with the land use and General Plan of the City of Walnut, and will be likely to create negative impacts on values of properties nearby.
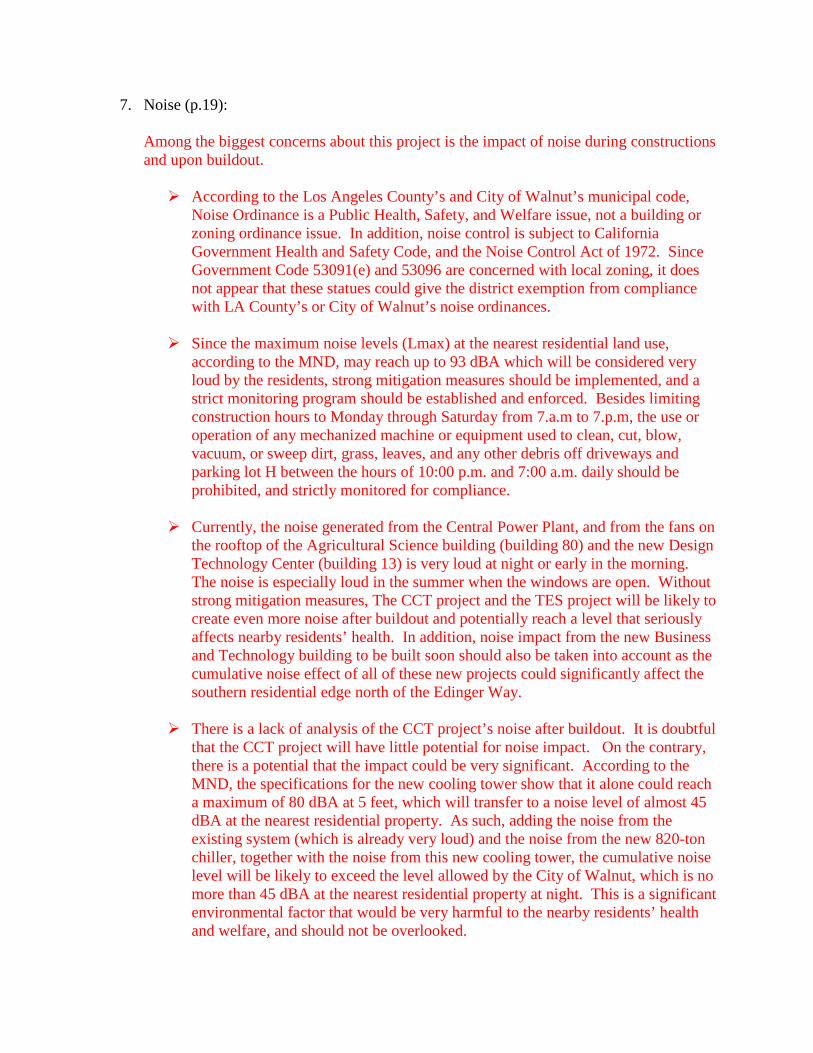
7. Noise (p.19): Among the biggest concerns about this project is the impact of noise during constructions and upon buildout.
According to the Los Angeles County’s and City of Walnut’s municipal code,
Noise Ordinance is a Public Health, Safety, and Welfare issue, not a building or zoning ordinance issue. In addition, noise control is subject to California Government Health and Safety Code, and the Noise Control Act of 1972. Since Government Code 53091(e) and 53096 are concerned with local zoning, it does not appear that these statues could give the district exemption from compliance with LA County’s or City of Walnut’s noise ordinances.
Since the maximum noise levels (Lmax) at the nearest residential land use, according to the MND, may reach up to 93 dBA which will be considered very loud by the residents, strong mitigation measures should be implemented, and a strict monitoring program should be established and enforced. Besides limiting construction hours to Monday through Saturday from 7.a.m to 7.p.m, the use or operation of any mechanized machine or equipment used to clean, cut, blow, vacuum, or sweep dirt, grass, leaves, and any other debris off driveways and parking lot H between the hours of 10:00 p.m. and 7:00 a.m. daily should be prohibited, and strictly monitored for compliance.
Currently, the noise generated from the Central Power Plant, and from the fans on the rooftop of the Agricultural Science building (building 80) and the new Design Technology Center (building 13) is very loud at night or early in the morning. The noise is especially loud in the summer when the windows are open. Without strong mitigation measures, The CCT project and the TES project will be likely to create even more noise after buildout and potentially reach a level that seriously affects nearby residents’ health. In addition, noise impact from the new Business and Technology building to be built soon should also be taken into account as the cumulative noise effect of all of these new projects could significantly affect the southern residential edge north of the Edinger Way.
There is a lack of analysis of the CCT project’s noise after buildout. It is doubtful that the CCT project will have little potential for noise impact. On the contrary, there is a potential that the impact could be very significant. According to the MND, the specifications for the new cooling tower show that it alone could reach a maximum of 80 dBA at 5 feet, which will transfer to a noise level of almost 45 dBA at the nearest residential property. As such, adding the noise from the existing system (which is already very loud) and the noise from the new 820-ton chiller, together with the noise from this new cooling tower, the cumulative noise level will be likely to exceed the level allowed by the City of Walnut, which is no more than 45 dBA at the nearest residential property at night. This is a significant environmental factor that would be very harmful to the nearby residents’ health and welfare, and should not be overlooked.

In addition, as mentioned above, the specifications for the new cooling tower
show that it alone could reach a maximum of 80 dBA at 5 feet, and since the future Business and Computer Technology building is right next to it, the potential cumulative noise impact from the CCT with the two newly added towers may be very significant and could have detrimental effects on health and productivity to the students, faculty, and staff who will be regularly attending classes, teaching in classes, or working in that building. Our family members could be taking classes in the new Business and Computer Technology building in the future, we hope that we and other students as well as other members of the campus community wouldn’t find it a nuisance.

Noise Concern: Thermal Energy System and Chiller Cooling Towermatt mcdonough to: agallegos40 10/01/2015 06:20 PMPlease respond to matt mcdonough
History: This message has been forwarded.
Dear Ms. Gallegos,I received a notice of availability of a mitigated negative declaration on my front door about the Thermal Energy System and Chiller Cooling Tower. I have some concerns about noise level and air quality. I live on Granite Wells Drive, the street parallel to Lot H. How loud will the construction be? My bedroom windows faces Lot H. I often sleep with my windows open.Does the project have to happen in this lot, next to the residential area? There are a lot of lots at Mt. SAC. Why does it have to be this one?Thanks,Matthew McDonough21012 Granite Wells DriveWalnut, CA 91789 909-851-2110

BOARD OF TRUSTEES MT. SAN ANTONIO COLLEGE DATE: October 21, 2015
PUBLIC HEARING AND ACTION
SUBJECT: Resolution No. 15-02 – Thermal Energy System and Chiller Cooling Tower Projects (Projects); Adopt Final Mitigated Negative Declaration for Projects and Approve Mitigation Monitoring and Reporting Program; Make Findings Under Government Code Sections 4217.10 et seq.; and Award Projects to Tilden-Coil Constructors, Inc.
Prepared by: Gary L. Nellesen/Teresa Patterson Reviewed by: Rosa M. Royce/Michael D. Gregoryk
Recommended by:
Bill Scroggins
Agenda Item:
Action #2
Page 1 of 8 Pages
BACKGROUND The College’s Central Plant provides heating and cooling to the campus by pumping hot and cold water to campus buildings through an underground infrastructure. The Central Plant Chilled Water Thermal Energy Storage (TES) Tank project will construct an underground chilled water thermal energy storage tank (2.0-million-gallon capacity) beneath Parking Lot H, with the surface of Lot H to be restored for student and staff parking. The Chiller Cooling Tower (CCT) Project at the Central Plant will include an 820-ton chiller, a 500-ton chiller, and a new 1,700-gallons-per-minute cooling tower that will provide additional cooled water capacity for current and future building projects. These two systems will allow the College to save electricity and costs by using the chiller and cooling equipment during periods when electrical rates are lower and by constructing a connection to the future Athletics Complex. The Projects were originally identified in the 2012 Mt. San Antonio College Facility Master Plan, dated February 18, 2013. However, project design and site plans were not available for the Projects at that time. Therefore, a draft Mitigated Negative Declaration (MND) has been prepared for the Projects, properly noticed as required by law, and circulated for a 21-day public review comments period. The draft MND has addressed all significant impacts and found they can be mitigated. The Board may receive comments at the public hearing concerning the Draft MND and will need to consider such comments, if any, before finding in Resolution No. 15-02 that no new significant environmental effects have been identified, and certifying the final MND. The Projects will be procured under Government Code §§ 4217.10 et seq., more specifically Government Code §4217.12(a), which authorizes a public agency, such as the College, after holding a regularly scheduled public hearing, public notice of which is given at least two weeks in advance, to enter into energy services contracts if the public entity’s governing board finds that its anticipated cost to the College for the energy conservation facilities (as defined in Government Code §4217.11) will be less than its anticipated marginal cost to the College of thermal, electrical, or other energy that would have been consumed in the absence of such purchases and, if a facility ground lease is proposed, that the fair rental value of the real property occupied by the energy conservation facilities will also be offset by the energy savings.
Page 96

SUBJECT: Resolution No. 15-02 – Thermal Energy System and Chiller Cooling Tower Projects (Projects); Adopt Final Mitigated Negative Declaration for Projects and Approve Mitigation Monitoring and Reporting Program; Make Findings Under Government Code Sections 4217.10 et seq.; and Award Projects to Tilden-Coil Constructors, Inc.
DATE: October 21, 2015
Page 2 of 8 Pages
The Projects are exempt from the zoning and land use controls of the City of Walnut, under Government Code § 53091(e), which provides that the zoning ordinances of a city shall not apply to the location or construction of facilities for the production, generation, storage, treatment, or transmission of water, or for the production or generation of electrical energy. ANALYSIS AND FISCAL IMPACT The College has sought proposals for the design, construction, and installation of the TES Tank, meeting technical criteria through a Request for Qualifications and Request for Proposals (RFQ/RFP) process issued in May 2015. The RFQ/RFP was legally advertised, and 20 contractors were invited to submit proposals. A mandatory pre-proposal conference was held on May 18, 2015, in which 11 contractors attended. The College received two proposals by the deadline of June 4, 2015, from Tilden-Coil Constructors, Inc. of Riverside, CA, and SSC Construction, Inc. of Corona, CA. Proposals were evaluated by the five-member evaluation committee based on financial benefits under Government Code § 4217.16, technical strengths, implementation approach, and the qualifications and experience of each contractor. Proposals were scored using a common evaluation matrix for each of these categories. Based on the evaluation results, both contractors were invited for interviews with the committee. Based on the final analysis, the evaluation committee was unanimous in recommending award of the Project to Tilden-Coil Constructors, Inc., located in Riverside, CA, as best meeting the College’s needs and providing the lowest cost for construction of the TES Tank. The College planned to enter into a lease-leaseback contract with Tilden-Coil Constructors, Inc. for the Central Plant Chiller Cooling Tower (CCT) upgrade project. The College has decided it is in its best interest to not implement a lease-leaseback contract and include the CCT Project in the award of the TES Tank project to Tilden-Coil Constructors, Inc., under Government Code § 4217.16. CCT Project and TES Tank Project when completed will be an integrated closed-loop water storage and transportation system that will result in significant electrical energy and cost savings to the College. The College has evaluated the energy savings from the Projects. The cost of the energy conservation measures to the College that will be provided by the Projects will be less than the anticipated marginal cost to the College of thermal, electrical, or other energy that would have been consumed in the absence of the energy conservation measures to be provided by the Projects. The costs associated with procurement of these Projects are as follows:
Page 97

SUBJECT: Resolution No. 15-02 – Thermal Energy System and Chiller Cooling Tower Projects (Projects); Adopt Final Mitigated Negative Declaration for Projects and Approve Mitigation Monitoring and Reporting Program; Make Findings Under Government Code Sections 4217.10 et seq.; and Award Projects to Tilden-Coil Constructors, Inc.
DATE: October 21, 2015
Page 3 of 8 Pages
Total Construction Costs for TES Tank (includes a $50,000 allowance for unforeseen soil or underground conditions)
$5,274,656
Total Construction Costs for Central Plant Upgrades (includes a $740,000 allowance for enhanced and unquantifiable scope)
$6,358,584
Total Construction Costs for TES Tank and Central Plant Upgrades $11,633,240 Funding Sources Measure RR (Series A) Bond funds. Proposition 39 Energy funds. Proposition 39 Grant funds. RECOMMENDATION It is recommended that the Board of Trustees (1) open a public hearing and receive comments on the following: (i) the Project and the Final Mitigated Negative Declaration and (ii) the findings to be made under Government Code §§ 4217.10 et seq.; (2) close the public hearing; (3) move the item forward for approval and adoption of the attached Resolution No. 15-02 at the October 21, 2015, regular meeting of the Board of Trustees; and (4) authorize the College to negotiate, prepare, and enter into a Design-Build Agreement for the design, procurement, installation, and construction of the Projects with Tilden-Coil Constructors, Inc.
Page 98

SUBJECT: Resolution No. 15-02 – Thermal Energy System and Chiller Cooling Tower Projects (Projects); Adopt Final Mitigated Negative Declaration for Projects and Approve Mitigation Monitoring and Reporting Program; Make Findings Under Government Code Sections 4217.10 et seq.; and Award Projects to Tilden-Coil Constructors, Inc.
DATE: October 21, 2015
Page 4 of 8 Pages
RESOLUTION NO. 15-02
MT. SAN ANTONIO COMMUNITY COLLEGE DISTRICT Thermal Energy System and Chiller Cooling Tower Projects
WHEREAS, Government Code Sections 4217.10 et seq., more specifically Section 4217.12(a), authorizes a public agency, such as the Mt. San Antonio Community College District (College), after holding a regularly scheduled public hearing, public notice of which is given at least two weeks in advance, to enter into energy services contracts if the public entity’s governing board finds that its anticipated cost to the College from the energy conservation facilities (as defined in Government Code Section 4217.11) will be less than its anticipated marginal cost to the College of thermal, electrical, or other energy that would have been consumed in the absence of such purchases; and
WHEREAS, the College wishes to reduce its energy costs and improve the quality and reliability of the campus cooling systems and electrical service by contracting to produce and implement certain new and upgraded energy systems including related equipment and materials; and
WHEREAS, under the proposed energy services contracts with the College, Tilden-Coil
Constructors, Inc., in accordance with 4217.10 et seq., will install a Chilled Water Thermal Energy Storage (TES) Tank System beneath Parking Lot H and restore the surface, and will perform the work of the Central Plant Expansion to include an 820-ton chiller, a 500-ton chiller, and a new 1,700-gallons-per-minute (gpm) cooling tower to provide additional cooled water capacity that would result in net energy savings to the College (the Projects”); and
WHEREAS, P2S Engineering, Inc. provided a comprehensive energy analysis (CEA) and
recommended an energy plan to implement certain energy conservation measures (“ECMs”) in the form of a chilled water thermal energy storage tank system and a cooling tower expansion, as identified in the CEA; and
WHEREAS, the College desires to enter into a design-build agreement for the design,
procurement, installation, construction, and commissioning of the Projects with Tilden Coil Constructors, Inc. of Riverside, California (Energy Contract) for the not-to-exceed amount of $11,633,240, which includes all allowances; and
WHEREAS, on October 2, 2015, the College published a notice in the Inland Valley Daily
Bulletin and the San Gabriel Valley Tribune of a public hearing at which the College would consider the Energy Contract and make findings as required under Government Code Section 4217.16; and
WHEREAS, the cost to the College for thermal electrical and other energy from the Energy
Contract will be less than the anticipated marginal cost to the College of thermal, electrical, or other energy that would have been consumed by the College in the absence of the Energy Contract; and
Page 99

SUBJECT: Resolution No. 15-02 – Thermal Energy System and Chiller Cooling Tower Projects (Projects); Adopt Final Mitigated Negative Declaration for Projects and Approve Mitigation Monitoring and Reporting Program; Make Findings Under Government Code Sections 4217.10 et seq.; and Award Projects to Tilden-Coil Constructors, Inc.
DATE: October 21, 2015
Page 5 of 8 Pages
WHEREAS, the College is the lead agency for purposes of environmental review of the Projects under the California Environmental Quality Act (CEQA), pursuant to Public Resources Code § 21000 et seq., and the State “Guidelines for Implementation of the California Environmental Quality Act”; and
WHEREAS, the Projects could, without mitigation, have resulted in a potential impact to
certain areas of environmental concern, and the College has prepared mitigation measures (the “Mitigation Measure”) to address and mitigate all potential environmental impacts to a “less than significant” level, which is a part of the Environmental Record reviewed and considered by the Board; and
WHEREAS, the College has incorporated the Mitigation Measures described in the initial
study and draft Mitigated Negative Declaration for the Projects as conditions of approval by the Board; and
WHEREAS, with the exception of the potential impacts stated above, there are no other
potentially significant environmental impacts resulting from the Projects; and WHEREAS, a final Mitigated Negative Declaration (final MND) has been prepared for the
Projects based upon the draft MND; and WHEREAS, the College submitted a Notice of Intent to prepare a Mitigated Negative
Declaration to the Los Angeles County Clerk; placed a legal notice concerning the Projects in the Inland Valley Bulletin and the San Gabriel Valley Tribune for publication on October 6, 2015 (the Legal Notice); posted an Intent to Adopt a Mitigated Negative Declaration at the College offices of Facilities Planning & Management Division and on the College website; and forwarded the draft Mitigated Negative Declaration with appendices and supporting information sources and Notice of Intent to the South Coast Air Quality District Management District, the College library, and the Walnut Public Library.
WHEREAS, the draft Mitigated Negative Declaration with appendices and supporting
information sources were duly noticed for public review and comment from September 10, 2015, to October 2, 2015, as provided by law; and
WHEREAS, the College has responded to all substantive comments, if any, regarding the
draft Mitigated Negative Declaration, all of which are part of the Environmental Record before the Board for the Projects; and
WHEREAS, a hearing concerning the College’s intent to adopt a Final MND was duly noticed
and held on October 21, 2015, at which time any interested parties were afforded an opportunity to be heard in addition to the public review and comment period referenced above as part of the Environmental Record; and
Page 100

SUBJECT: Resolution No. 15-02 – Thermal Energy System and Chiller Cooling Tower Projects (Projects); Adopt Final Mitigated Negative Declaration for Projects and Approve Mitigation Monitoring and Reporting Program; Make Findings Under Government Code Sections 4217.10 et seq.; and Award Projects to Tilden-Coil Constructors, Inc.
DATE: October 21, 2015
Page 6 of 8 Pages
WHEREAS, the Board has considered, prior to adoption of the final MND, the Environmental Record in support of the final MND; and
WHEREAS, as part of the process for complying with the environmental review of the Projects
as described above, there are no feasible alternative to the Projects, and WHEREAS, as part of the process for the Board to review evidence and make the findings
described above, the Board has been presented with and reviewed the agenda report prepared by College staff for the Projects (Agenda Report); and
NOW THEREFORE, BE IT RESOLVED that the Board of Trustees of the Mt. San Antonio Community College District (Board) hereby finds, determines, declares, and resolves as follows: Section 1. Recitals. The Board hereby finds and determines that all the above recitals are true and correct. Section 2. Notice of Public Hearing. This resolution is adopted following a public hearing at a regularly scheduled meeting of the Board of Trustees for which a minimum of two weeks public notice has been duly given pursuant to Government Code § 4217.12(a). Section 3. Adoption of Final Mitigated Negative Declaration. 3.1 The Board finds that the final Mitigated Negative Declaration reflects the independent judgment of the College as the lead agency for the Projects. 3.2 The Board further finds that it has independently reviewed and considered the Environmental Record including the Initial Study, the proposed Mitigated Negative Declaration, as a final Mitigated Negative Declaration, and the Mitigation Measures prior to adopting the final Mitigated Negative Declaration. On the basis of the Environmental Record as the whole record before the Board including the Initial Study and any comments received, the Board finds, in its independent judgment and analysis, that there is no substantial evidence the Projects will have a significant effect on the environment. 3.3. The Board further finds that the Mitigation Measures described in the Final Mitigated Negative Declaration have been incorporated into the Projects and adopts a Mitigated Negative Declaration, as the final Mitigated Negative Declaration, which documents are a part of the Environmental Record before the Board for the Projects. 3.4 The Board approves and adopts the findings set forth herein, the Final MND, and the Mitigation Measures based on the Environmental Record. The Board further finds the Mitigation Measures are specifically identified, and the College intends to implement and enforce a site-specific Mitigation Monitoring Program for the Projects.
Page 101
SUBJECT: Resolution No. 15-02 – Thermal Energy System and Chiller Cooling Tower Projects (Projects); Adopt Final Mitigated Negative Declaration for Projects and Approve Mitigation Monitoring and Reporting Program; Make Findings Under Government Code Sections 4217.10 et seq.; and Award Projects to Tilden-Coil Constructors, Inc.
DATE: October 21, 2015
Page 7 of 8 Pages
3.5 College staff is authorized and directed to cause a Notice of Determination concerning the adoption of the Final Mitigated Negative Declaration for the Projects to be filed in the office of the Los Angeles County, in accordance with CEQA and State CEQA Guidelines. Section 4. Government Code §§ 4217.10 et seq. Cost Benefit and Findings. 4.1 Based upon the Agenda Report, the facts developed at the public hearing, the Energy Contract and the administrative record as a whole, pursuant to Government Code §4217.12(a)(1), the Board hereby finds that the anticipated cost to the College for the energy conservation measures under the Energy Contract will be less than the anticipated marginal costs to the College of thermal, electrical, or other energy that would have been consumed by the College in the absence of such purchases under the Energy Contract. 4.2 The Board finds the College is not entering into a facility ground lease for the Projects, and the findings otherwise required in Government Code §4217.12(a)(2) are inapplicable. 4.3 Based upon the Agenda Report, the facts developed at the public hearing, the Energy Contract, and the administrative record as a whole, it is in the best interest of the College to enter into the Energy Contract. Section 5. Authority to Take All Actions Necessary. The College President or his designee is authorized to do all things that are necessary to give effect to and comply with the terms and intent of this Resolution including, but not limited to, the finalization and execution of the Energy Contract with Tilden-Coil Constructors, Inc. of Riverside, California, and notification of this Resolution to applicable public entities. The College President may designate and delegate to other College executive management personnel, as deemed necessary, tasks associated with the negotiating, drafting, and/or preparing the Energy Contract and any related documents. Section 6. Effect. This Resolution shall take effect immediately upon its passage. PASSED and ADOPTED this 21st day of October 2015, by the Board of Trustees of the Mt. San Antonio Community College District of the County of Los Angeles, State of California, by the following vote: AYES: NOES: ABSENT:
Page 102

SUBJECT: Resolution No. 15-02 – Thermal Energy System and Chiller Cooling Tower Projects (Projects); Adopt Final Mitigated Negative Declaration for Projects and Approve Mitigation Monitoring and Reporting Program; Make Findings Under Government Code Sections 4217.10 et seq.; and Award Projects to Tilden-Coil Constructors, Inc.
DATE: October 21, 2015
Page 8 of 8 Pages
This is to certify that this is a true and correct copy of the resolution as adopted and approved at a regular meeting of the Board of Trustees of the Mt. San Antonio Community College District. ___________________________________ William T. Scroggins College President/CEO and Secretary of the Board of Trustees Mt. San Antonio Community College District
Page 103