
Thermal Energy Storage by PCM-air Heat Exchangers: Temperature Maintenance in a Room
10
Energy Procedia 30 (2012) 225 – 234 1876-6102 © 2012 The Authors. Published by Elsevier Ltd. Selection and/or peer-review under responsibility of PSE AG doi:10.1016/j.egypro.2012.11.027 SHC 2012 Thermal energy storage by PCM-air heat exchangers: temperature maintenance in a room Pablo Dolado a* , Ana Lazaro, Monica Delgado, Conchita Peñalosa, Javier Mazo, Jose Maria Marin, Belen Zalba Aragón Institute of Engineering Research (I3A), Betancourt Bld. Maria de Luna s/n, Zaragoza, 50018, Spain Abstract This paper describes how to design a PCM-air heat exchanger once an application is specified. Free-cooling and temperature maintenance in rooms with special requirements possess high potential for PCM application in different countries according to their climate. Until now, the low thermal conductivity of PCM and air hindered the development of suitable heat exchangers. The overall objective here is to apply methodologies to study PCM-air heat exchangers that allow the development of applications with technical and economical viability. In particular, using the combined technique of design of experiments and numerical simulations, the feasibility of the possible application of this type of equipment is studied and optimized for temperature maintenance in rooms. Keywords: Thermal energy storage; phase change material; design; optimization 1. Background Let’s think about a telecom shelter, somehow far from civilization. The place is full of electronic equipment, continuously generating heat due to its operation. The chiller unit, plugged in to the electrical grid, is running avoiding the room air temperature to increase. But what if a short circuit, blackout or other similar problem happens? If the chiller stops running, the temperature will definitely rise and problems with the electronic devices will occur... maybe, even the functionality of the telecom shelter could crash! Electricity supply would be reset once technicians reach the place and fix the problem, but in * Corresponding author. Tel.: +34 976 761000 ext. 5258; fax: +34 976 762616. E-mail address: [email protected]. Available online at www.sciencedirect.com © 2012 The Authors. Published by Elsevier Ltd. Selection and/or peer-review under responsibility of PSE AG
Transcript of Thermal Energy Storage by PCM-air Heat Exchangers: Temperature Maintenance in a Room
Energy Procedia 30 ( 2012 ) 225 – 234
1876-6102 © 2012 The Authors. Published by Elsevier Ltd.Selection and/or peer-review under responsibility of PSE AGdoi: 10.1016/j.egypro.2012.11.027
SHC 2012
Thermal energy storage by PCM-air heat exchangers: temperature maintenance in a room
Pablo Doladoa*, Ana Lazaro, Monica Delgado, Conchita Peñalosa, Javier Mazo, Jose Maria Marin, Belen Zalba
Aragón Institute of Engineering Research (I3A), Betancourt Bld. Maria de Luna s/n, Zaragoza, 50018, Spain
Abstract
This paper describes how to design a PCM-air heat exchanger once an application is specified. Free-cooling and temperature maintenance in rooms with special requirements possess high potential for PCM application in different countries according to their climate. Until now, the low thermal conductivity of PCM and air hindered the development of suitable heat exchangers. The overall objective here is to apply methodologies to study PCM-air heat exchangers that allow the development of applications with technical and economical viability. In particular, using the combined technique of design of experiments and numerical simulations, the feasibility of the possible application of this type of equipment is studied and optimized for temperature maintenance in rooms. © 2012 Published by Elsevier Ltd. Selection and/or peer-review under responsibility of PSE AG Keywords: Thermal energy storage; phase change material; design; optimization
1. Background
Let’s think about a telecom shelter, somehow far from civilization. The place is full of electronic equipment, continuously generating heat due to its operation. The chiller unit, plugged in to the electrical grid, is running avoiding the room air temperature to increase. But what if a short circuit, blackout or other similar problem happens? If the chiller stops running, the temperature will definitely rise and problems with the electronic devices will occur... maybe, even the functionality of the telecom shelter could crash! Electricity supply would be reset once technicians reach the place and fix the problem, but in
* Corresponding author. Tel.: +34 976 761000 ext. 5258; fax: +34 976 762616. E-mail address: [email protected].
Available online at www.sciencedirect.com
© 2012 The Authors. Published by Elsevier Ltd.Selection and/or peer-review under responsibility of PSE AG

226 Pablo Dolado et al. / Energy Procedia 30 ( 2012 ) 225 – 234
the meantime, specific equipment is needed to ensure the temperature will not overcome certain safety threshold value.
Nomenclature
cp [J/(kgK)], specific heat capacity at constant pressure
eair [m], thickness of the air gap between two PCM plates
eplate [m], thickness of the PCM plate
Etmod [kJ], total stored thermal energy in 1 module
h [W/(m2K)], air convection coefficient
i, time step in the numerical scheme
m [kg], building enclosure mass
m [kg/s], mass flow
MPCM [kg], PCM mass
N, number of PCM plate walls (inside the TES unit)
demandQ [kW], internal cooling demand
Toutside [ºC], outdoors air temperature
Troomi [ºC], room temperature at i instant
surfaceT [ºC], average surface temperature of PCM plates
Tairinlet/outler [ºC], air temperature at storage unit inlet or at the outlet
tadd, T=38ºC [s], elapsed time to reach 38ºC in the room
tadd, T=44ºC [s], elapsed time to reach 44ºC in the room
V [m3/h], volumetric air flow
V [m3], volume
w [m], width
%Melt, ratio of PCM melted, percentage
ΔT=Tairinlet-Tair
outlet [K], temperature difference in the TES unit
Δp [Pa], pressure difference
Δt [s], time interval
λ [W/(mK)], thermal conductivity
λeff [W/(mK)], effective thermal conductivity
ρ [kg/m3], density
,· · / (2· )air air air p airC V c N [J/(sK)], heat capacity

Pablo Dolado et al. / Energy Procedia 30 ( 2012 ) 225 – 234 227
· · airNTU h x w C , number of transfer units
Bi , Biot number
Re, Reynolds number
DOE, Design of Experiments
HX, Heat Exchanger
PCM, Phase Change Material
TES, Thermal Energy Storage
2. Methodology
Currently, due to the feedback between the simulations and experimental studies, to complement the performance of physical experiments with numerical simulations is becoming increasingly common in many sectors. Some of these numerical experiments are conducted to select as well as the tools as the optimal process parameters that directly allow developing products that reduce to some extent the cost as well as time required for the corresponding physical experimentation [1, 2]. In other cases the aim is to obtain a deeper understanding of the effect of varying certain process parameters (sensitivity studies) towards the optimization of the process itself [3]. Del Coz Díaz et al. [4] apply the DOE to numerical simulations with the double aim of limiting the number of runs, significantly reducing the computational cost on the one hand, and on the other hand, allowing influence analysis of each parameter on the responses of interest. Whitt [5] indicates that as the simulations require a statistical analysis of their results, it is appropriate to consider the perspective of experimental design. However, Salazar and Baena Zapata [6] point out that the numerical studies based on the methodology of DOE are scarce in the literature. These authors invite researchers working in the area of statistics (although extensible to any other area) to implement the methodology of design and analysis of experiments to the numerical simulation studies as they consider that this type of analysis improves the quality of the findings (being these more convincing) as well as the presentation of the simulation analysis results. In addition, numerical simulation studies considered under this type of approaches allow analyzing many factors at once so optimizing the time spent in the execution of simulations. Further information on DOE concepts applicable to numerical simulations can be found in the work by Gunasegaram et al. [7] where advantages and limitations are reported by the authors. This kind of approach focused on product design rather than on process, is really scarce in scientific literature dealing with thermal equipment.
As a starting point we state the case brought by Lazaro [8], which provides that, for proper running of the electronic equipment, the maximum air temperature in the room should be between 38 ºC and 48 °C, in particular the threshold temperature is established at 44 °C. The idea behind this system is that after a failure of the conventional cooling system, the TES unit is intended to smooth the evolution of the temperature of the room so that it extends the time to reach a certain threshold temperature value. The aim is this period to be about two hours, so technicians have sufficient time to reach the place where the room is located and to repair the damage of the cooling system without having to stop the electronic equipment. A series of restrictions were put on the TES system, regarding dimensions and electrical power consumption, as well as on pressure drop.
228 Pablo Dolado et al. / Energy Procedia 30 ( 2012 ) 225 – 234
2.1. Empirical model: simulations of a case study and modular design
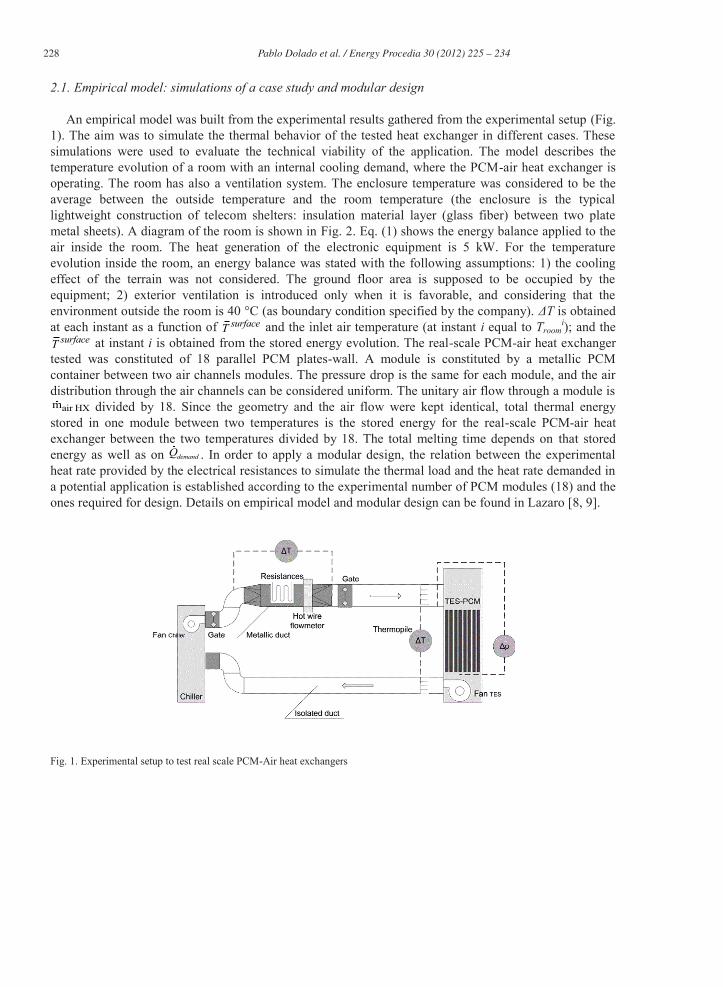
An empirical model was built from the experimental results gathered from the experimental setup (Fig. 1). The aim was to simulate the thermal behavior of the tested heat exchanger in different cases. These simulations were used to evaluate the technical viability of the application. The model describes the temperature evolution of a room with an internal cooling demand, where the PCM-air heat exchanger is operating. The room has also a ventilation system. The enclosure temperature was considered to be the average between the outside temperature and the room temperature (the enclosure is the typical lightweight construction of telecom shelters: insulation material layer (glass fiber) between two plate metal sheets). A diagram of the room is shown in Fig. 2. Eq. (1) shows the energy balance applied to the air inside the room. The heat generation of the electronic equipment is 5 kW. For the temperature evolution inside the room, an energy balance was stated with the following assumptions: 1) the cooling effect of the terrain was not considered. The ground floor area is supposed to be occupied by the equipment; 2) exterior ventilation is introduced only when it is favorable, and considering that the environment outside the room is 40 °C (as boundary condition specified by the company). ΔT is obtained at each instant as a function of surfaceT and the inlet air temperature (at instant i equal to Troom
i); and the surfaceT at instant i is obtained from the stored energy evolution. The real-scale PCM-air heat exchanger
tested was constituted of 18 parallel PCM plates-wall. A module is constituted by a metallic PCM container between two air channels modules. The pressure drop is the same for each module, and the air distribution through the air channels can be considered uniform. The unitary air flow through a module is
air HXm divided by 18. Since the geometry and the air flow were kept identical, total thermal energy stored in one module between two temperatures is the stored energy for the real-scale PCM-air heat exchanger between the two temperatures divided by 18. The total melting time depends on that stored energy as well as on demandQ . In order to apply a modular design, the relation between the experimental heat rate provided by the electrical resistances to simulate the thermal load and the heat rate demanded in a potential application is established according to the experimental number of PCM modules (18) and the ones required for design. Details on empirical model and modular design can be found in Lazaro [8, 9].
Fig. 1. Experimental setup to test real scale PCM-Air heat exchangers

Pablo Dolado et al. / Energy Procedia 30 ( 2012 ) 225 – 234 229
Fig. 2. Schematic diagram of the room (telecom shelter) in which the temperature is evaluated
i i-1p,enclosure air p,air room room=m·c ·p enclosure ρ ·V·c · T Ti
air p,air room rair p,air room
= ,
i i-1idT +T T +Ti i-1
idid idT ididroom outside room outsideTroom outside room ooutside roomroom outside room outsidet idT t idt id idT idid2 2
i i 1mmventilation p,air outside room demand air HX p,airm c T -T +Q -m cventilation p,air outside room demand air HX p,airm ·Δt i,i-1i 1m c ΔTi-1m ·c ·i HX i ΔTim c T T +Qim ·c · T -T +Qil i i idm c T -T +Q -m cventilation p air outside room demand air HX pp air outside room demand air HX air ΔTi HXi HX i ΔTm il i i idi id Q mQ md ddemanddemandd dd d
(1)
2.2. Theoretical model: DOE applied to simulations, improving designOO
The empirical model can give a very fast approach of relevant design parameters such as the PCMaverage phase change temperature. However, if we want to analyze the behavior of the equipment when modifying any other parameter or variable, or if we need to improve/optimize the design, we have to move to a numerical model [10, 11]. Furthermore, because the simulation itself is not a design tool, the combined methodology of DOE applied to numerical simulations is proposed to size the equipment. This technique greatly reduces the time spent in performing the simulations required to find the optimalequipment as well as and a potential cost saving on the experimental if the prototype-model similarityrelations are met. Moreover, contrary to a sequential analysis, it is reasonable to use a mathematical andstatistical methodology that allows planning the sequence of experiments on the philosophy of maximuminformation with minimum effort. For the implementation of DOE a series factors (mass of PCM, air flow, air channel width, thickness of the PCM plate, finishing of the plates) and responses (additionaltime for the air to reach a temperature of 44 ºC in the room, pressure drop, initial investment) wereconsidered. To meet the requirements of the proposed study case, the application of the DOEmethodology has been posed for a wider range rather than the experimental validity. Due to the specificrequirements of the study case, the similarity relationships between the experimental equipment and theequipment proposed for the application will not be adjusted in all cases (model-prototype similarity).Thus, calculation of the dimensionless relations of interest that characterize the equipment operation ismade for both the experimental equipment and for each of the simulated runs. So the degree of
Enclosure
tilationVenV tVenV
ToutsideTTTroomTT i
TairTT inlet
ΔT
TairTT outlet
T= TairiTTT inlet - TTairiTTT inlet
Qdemand·T surface

230 Pablo Dolado et al. / Energy Procedia 30 ( 2012 ) 225 – 234
dimensionless similarity of the proposed equipment with the experimental one is checked. Therefore the need for additional experimentation of the proposed unit can be stated, in the case of not being within the experimental validity range. The experimental validity range has been established for a series of relationships that characterize the heat exchange process in the TES unit. Specifically, the following ranges of values have been determined: the Reynolds number; the number of transfer units; the Biot number; and the thermal conductivities ratio (λeff/λ), that quantifies the effect of natural convection within the PCM inside the plate. As this relation goes beyond 1 the effect of natural convection is more substantial. The determination of all these parameters is detailed in [11], pp 115-8.
The series of restrictions put on the TES system are: Dimensions limitation due to the telecommunications shelter: the maximum length of the system is
limited to 2.5 m (height of the shelter) which limits the section of the PCM to 1.25 m. Likewise, the width of the unit is also limited to 5 m due to the wall dimensions;
Electrical power consumption limitation of the fan: so the fan can be electrically supplied by batteries without being essential a connection to the grid. Pressure drop should be less than 30 Pa.
Operating conditions are values to be considered inside the corresponding factor domains. For the implementation of DOE the following factors and responses were considered:
Factors (listed in table 1 along with their domain): mass of PCM, air flow, air channel width, thickness of the PCM plate, finishing of the plates (related to rugosity or to bulges in the surface of the plates).
Responses: melting ratio in 3 hours, additional time for the air to reach a temperature of 38 º C (compared with the evolution of temperature without unit TES) in the room, additional time for the air to reach a temperature of 44 º C (compared with the evolution of temperature without TES unit) in the room, pressure drop; initial investment (mainly depending on the amount of PCM, the installed fan, the casing, and whether or not the plates have bulges on its surface).
2.3. Response optimization
Response surface design methodology is often used to refine models after important factors have been determined using factorial designs, especially if curvature in the response surface is suspected. Response optimization helps to identify the combination of input variable settings that jointly optimize a single response or a set of responses. This is useful when there is a need to evaluate the impact of multiple inputs on a response. Given that the main objective of the TES unit is to extend the time period during which the room temperature is below a certain temperature limit, the highest importance has set to that response. Table 2 lists the input parameters in the optimization. It has been considered that the most important requirement is to get the unit to extend as much as possible the time to reach the temperature limit of the air in the room, assigning the greatest importance to the maximum temperature limit (44 ºC) and considering also important, but lesser, the time to reach the first temperature limit (38 ºC) as well as the Δp (in order to be as lower as possible so that the electrical power consumption of the corresponding fan will be reduced). Also the investment and the melting ratio are interesting responses considered in the study, as they are related to economical and technical feasibility respectively. Once the objectives are defined, each variable is assigned a weight (between 0.1 and 10) and an importance (also between 0.1 and 10). In this approach to the optimization, each of the values of the responses is transformed using a desirability function. The weight defines the shape of this function for each response and is related to the emphasis on achieving the target (a value greater than one emphasizes the importance of achieving the goal; a unit value gives equal importance to the objective and the limits; a value less than one puts less emphasis on the goal). After calculating the desirability for each response, the composite desirability is calculated (weighted geometric mean of the single ones) that allows to obtain the optimal solution. In this case, the same weight is set to each of the answers assuming a unit value. This will set the target as

Pablo Dolado et al. / Energy Procedia 30 ( 2012 ) 225 – 234 231
important as any value within the limits for the corresponding answer. On the other hand, assigning a value to the importance of each answer is related to the importance given to each of the answers, and if any of these responses is more important than the others (most important is a 10, less important is a 1).
Table 1. List of factors and their corresponding domain
MPCM [kg] V [m3/h] eplate [mm] eair [mm] Finish
Domain Level (-) 100 1000 6 10 1.5
Level (+) 200 2000 14 20 2
Table 2. Optimization parameters
Response variable Objective Weight Importance
tadd T=44ºC Maximize 1 10
Δp minimize 1 5
tadd T=38ºC Maximize 1 5
Investment minimize 1 1
%Melt Maximize 1 1
2.4. Model-prototype similarity
To check the degree of similarity between the experimental equipment and the different cases studied in the numerical simulations, the following dimensionless groups that characterize the process were calculated: Re, NTU, Bi, and the λeff/λ ratio.
3. Results and discussion
3.1. Empirical model results
Technical feasibility of incorporating the TES unit in the telecom shelter for temperature maintenance is checked first with the empirical model. Fig. 3 shows that, taken into account the boundary conditions shown in table 3, a reduction of the air temperature in the room can be provided with the TES unit, increasing significantly the time to reach the threshold temperature (nearly 1 hour).
3.2. Theoretical model results: DOE & numerical simulations
Once the usefulness is checked, the theoretical model comes into play. The operating conditions of the unit proposed by Lazaro, as well as the main simulation results obtained with the theoretical model running with those conditions are shown in table 4.
3.3. Optimization
Then, the combined technique is applied in order to optimize the design using Minitab 15 [12]. The Minitab Response Optimizer tool is used to show how different experimental settings affect the selected responses for the response surface design. Minitab calculates an optimal solution and draws the optimization plot. The optimal solution serves as the starting point for the plot (the settings can be

232 Pablo Dolado et al. / Energy Procedia 30 ( 2012 ) 225 – 234
modified interactively to see how different setting affect responses). What is interesting of the optimized results (Fig. 4) is the value of composite desirability as well as its trend according to each of the factors considered. The composite desirability obtained in this case (0.919) indicates that the values determined by the optimization nearly fulfill the requirements of the response variables. The trends of composite desirability for each factor allow to adjust their value (usually due to physical or technological constraints) while keeping high desirability values. However, at least there are two drawbacks to use this configuration: first, it does not respect the width limitation (this unit has a width of more than 10 meters), and secondly, when manufacturing the TES unit it will be more feasible to use a PCM thickness higher than 0.5 mm (proposed in the optimization). Thus, moving in the optimization plot to a greater value of PCM thickness without reducing too much the composed desirability and rounding parameters, a value of 2.5 mm in thickness is selected (which also meets the width restriction). Table 5 shows the results of the corresponding simulation. The results of the last proposed unit are somewhat unfavorable compared to the optimized unit, but the proposed thickness of PCM is much more realistic than the optimized one. Yet the responses provided by the proposed unit represent a storage that improves the very first one every aspect consider but the volume.
Fig. 3. Empirical model results of Lazaro’s case
Fig. 4. Optiization plot results
202224262830323436384042444648
0 1 2 3 4
Tem
pera
ture
(ºC
)
time (h)
Troom w TES
Troom w/o TES
Troom w TESTroom w/o TES

Pablo Dolado et al. / Energy Procedia 30 ( 2012 ) 225 – 234 233
Table 3. Boundary conditions Lazaro’s case
Generated heat
Room temperature
Ventilation airflow
Ambient temperature
Envelope total mass
cp envelope (glass fiber)
Initial room temperature
5000 W 27 ºC 2500 m3/h 40 ºC 2180 kg 880 J/(kgK) 20 ºC
Table 4. Operating conditions and Main results of the simulation with Lazaro’s case
Operating conditions Results
MPCM [kg] V [m3/h] eplate [mm] eair [mm] Finishing %Melt Investment [€] tadd T=38ºC
[min] tadd T=44ºC
[min] Δp
[Pa] 132 1340 6.5 12 3 69.47 3924 36 63 36
Table 5. Main results of the proposed and optimized units
Unit %Melt Investment [€] tadd, T=38ºC [min] tadd, T=44ºC [min] Δp [Pa] Proposed 92.64 3489 37 73 5 Optimized 100 3234 60 96 3
3.4. Model-prototype similarity
As shown in Fig. 5, dimensional analysis of these units show that the natural convection within the PCM is not going to be significant in any of the 2 units (proposed and optimized), being the heat transfer process by pure conduction for the second unit, and the ratio λeff/λ within the range of experimental validity for the other one [11]. Furthermore, since both Re, Bi, and NTU are within the experimental validity range, the units can be used for design purposes.
Fig. 5. Re numbers (up left), Bi numbers (up right), NTU numbers (down left), and λeff/λ ratio (down right) for each simulation and experimental validity range

234 Pablo Dolado et al. / Energy Procedia 30 ( 2012 ) 225 – 234
4. Conclusions
The combined methodology of Design of Experiments applied to the numerical simulations seems to be a valid tool for improving the design of this kind of heat exchangers. When applied to the case study of temperature maintenance in a room and compared to the very first design based on an empirical model: time to reach the maximum air temperature in the room was increased (19.7%), the initial investment was reduced by 11% and the PCM melting ratio was improved by 23.2%, as a drawback, the volume occupied by the unit was increased around 3 times. When applied to the study case, this methodology shows an improvement of the proposed design compared to the one initially posed: the time to reach the threshold air temperature has been extended, the initial investment has been reduced, and the melting degree of the system has been improved; however, as a drawback, the TES unit volume has been increased. Furthermore, the proposed methodology of applying the DOE to the numerical simulations has demonstrated to be a powerful tool to: reduce the number of numerical simulations runs and the invested time; improve the design; find an optimal point of operation; and find the factors settings that enable to fulfill with the requirements.
Acknowledgements
The authors would like to thank the Spanish Government for the partial funding of this work within the research project ENE2011-28269-C03-01. Special thanks are extended to Mr. Miguel Zamora, CIAT R&D Manager. Thanks also to the fruitful collaboration within the Annex 24-Task 42 of the ECES Implementing Agreement of the IEA, as well as in the Cost Action TU0802 (NeCOEPCM).
References
[1] Gunasegaram DR, Smith BJ. MAGMASOFT helps assure quality in a progressive Australian iron foundry. Proceedings of the 32nd National Convention of the Australian Foundry Institute 200; Fremantle (Australia), 99–104.
[2] Calise F, Palombo A, Vanoli L. Maximization of primary energy savings of solar heating and cooling systems by transient simulations and computer design of experiments. Appl Energ 2010;87:524.
[3] Gupta A, Ding Y, Xu L, Reinikainen T. Optimal parameter selection for electronic packaging using sequential computer simulations. J Manuf Sci Eng, ASME 2006;128:705–15.
[4] Del Coz Diaz JJ, Garcia Nieto PJ, Lozano Martinez-Luengas A, Suarez Sierra JL. A study of the collapse of a WWII communications antenna using numerical simulations based on design of experiments by FEM. Eng Struct 2010;32,7:1792-800.
[5] Whitt W. Analysis for the design of simulation experiments. New York: Columbia University; 2005. [6] Salazar JC, Baena Zapata A. Analysis and design of experiments applied to simulation studies. Dyna 2009;76,159:249-57. [7] Gunasegaram DR, Farnsworth DJ, Nguyen TT. Identification of critical factors affecting shrinkage porosity in permanent
mold casting using numerical simulations based on design of experiments. J Mater Process Technol 2009;209,3:1209–19. [8] Lazaro A. Thermal energy storage with phase change materials. Building applications: materials characterization and
experimental installation to test PCM to air heat exchanger prototypes. Thesis, University of Zaragoza, Spain; 2009. [9] Lazaro A, Dolado P, Marin JM, Zalba B. PCM-air heat exchangers for freecooling applications in buildings: empirical model
and application to design. Energy Conv Manag 2009;50:444-9. [10] Dolado P, Lazaro A, Marin JM and Zalba B. Characterization of melting and solidification in a real scale PCM-air heat
exchanger: Numerical model and experimental validation. Energy Conv Manag 2011;52:1890-907. [11] Dolado P. Thermal Energy Storage with phase change. Design and modelling of storage equipment to exchange heat with
air. Thesis University of Zaragoza, Spain; 2011. [12 ] Minitab 15 Users guide. Access date 2012/06/21 at: http://www.minitab.com/en-US/support/