Thermal biology of mosquito-borne disease - White Rose ...
20
This is a repository copy of Thermal biology of mosquito-borne disease. White Rose Research Online URL for this paper: https://eprints.whiterose.ac.uk/169139/ Version: Published Version Article: Mordecai, Erin A., Caldwell, Jamie M., Grossman, Marissa K. et al. (11 more authors) (2020) Thermal biology of mosquito-borne disease. Ecology Letters. pp. 1690-1708. ISSN 1461-023X https://doi.org/10.1111/ele.13335 [email protected] https://eprints.whiterose.ac.uk/ Reuse This article is distributed under the terms of the Creative Commons Attribution (CC BY) licence. This licence allows you to distribute, remix, tweak, and build upon the work, even commercially, as long as you credit the authors for the original work. More information and the full terms of the licence here: https://creativecommons.org/licenses/ Takedown If you consider content in White Rose Research Online to be in breach of UK law, please notify us by emailing [email protected] including the URL of the record and the reason for the withdrawal request.
-
Upload
khangminh22 -
Category
Documents
-
view
3 -
download
0
Transcript of Thermal biology of mosquito-borne disease - White Rose ...

This is a repository copy of Thermal biology of mosquito-borne disease.
White Rose Research Online URL for this paper:https://eprints.whiterose.ac.uk/169139/
Version: Published Version
Article:
Mordecai, Erin A., Caldwell, Jamie M., Grossman, Marissa K. et al. (11 more authors) (2020) Thermal biology of mosquito-borne disease. Ecology Letters. pp. 1690-1708. ISSN 1461-023X
https://doi.org/10.1111/ele.13335
[email protected]://eprints.whiterose.ac.uk/
Reuse
This article is distributed under the terms of the Creative Commons Attribution (CC BY) licence. This licence allows you to distribute, remix, tweak, and build upon the work, even commercially, as long as you credit the authors for the original work. More information and the full terms of the licence here: https://creativecommons.org/licenses/
Takedown
If you consider content in White Rose Research Online to be in breach of UK law, please notify us by emailing [email protected] including the URL of the record and the reason for the withdrawal request.
REV IEW AND
SYNTHES IS Thermal biology of mosquito-borne disease
Erin A. Mordecai,1*
Jamie M. Caldwell,1
Marissa K. Grossman,2
Catherine A. Lippi,3
Leah R. Johnson,4 Marco Neira,5
Jason R. Rohr,6
Sadie J. Ryan,3,7 Van Savage,8,9
Marta S. Shocket,1
Rachel Sippy,3,10
Anna M. Stewart Ibarra,10
Matthew B. Thomas2 and
Oswaldo Villena4
Abstract
Mosquito-borne diseases cause a major burden of disease worldwide. The vital rates of these
ectothermic vectors and parasites respond strongly and nonlinearly to temperature and therefore
to climate change. Here, we review how trait-based approaches can synthesise and mechanistically
predict the temperature dependence of transmission across vectors, pathogens, and environments.
We present 11 pathogens transmitted by 15 different mosquito species – including globally impor-
tant diseases like malaria, dengue, and Zika – synthesised from previously published studies.
Transmission varied strongly and unimodally with temperature, peaking at 23–29�C and declining
to zero below 9–23�C and above 32–38�C. Different traits restricted transmission at low versus
high temperatures, and temperature effects on transmission varied by both mosquito and parasite
species. Temperate pathogens exhibit broader thermal ranges and cooler thermal minima and
optima than tropical pathogens. Among tropical pathogens, malaria and Ross River virus had
lower thermal optima (25–26�C) while dengue and Zika viruses had the highest (29�C) thermal
optima. We expect warming to increase transmission below thermal optima but decrease transmis-
sion above optima. Key directions for future work include linking mechanistic models to field
transmission, combining temperature effects with control measures, incorporating trait variation
and temperature variation, and investigating climate adaptation and migration.
Keywords
Arbovirus, climate change, dengue virus, malaria, mosquito, Ross River virus, temperature, ther-
mal performance curve, West Nile virus, Zika virus.
Ecology Letters (2019) 22: 1690–1708
INTRODUCTION
Pathogens transmitted by biting arthropods – vector-borne
diseases – comprise a major burden of human, animal, and
plant diseases worldwide. Transmission of these pathogens is
tightly linked to the ecology of vector populations, including
biting behaviour, competence for transmitting the pathogen,
survival, and life history. This vector ecology depends in part
on climate, habitat, and host density (Gatton et al. 2005; Bi
et al. 2009; Paaijmans et al. 2010b, 2011; Werner et al. 2012;
Mordecai et al. 2013; Stewart Ibarra et al. 2013; Mordecai
et al. 2017; Paull et al. 2017; Shapiro et al. 2017; Thomson
et al. 2017; Shocket et al. 2018; Tesla et al. 2018). Since the
turn of the 20th century, when scientists and physicians dis-
covered that mosquitoes transmit malaria and yellow fever,
biologists have recognised that temperature drives vector-
borne disease transmission. Ambient temperatures alter
mosquito lifespan and the period after ingesting an infectious
blood meal before a mosquito becomes infectious (the extrin-
sic incubation period); these traits in turn affect the rate of
pathogen transmission (Cox 2010; Smith et al. 2012). Medical
entomologists have since characterised how temperature also
affects the rates of biting, reproduction, development, and
survival across vector life stages, and the probability of
becoming infectious after biting an infectious host (i.e., vector
competence) (Thomas & Blanford 2003; Shapiro et al. 2017).
Temperature shapes transmission via its effects on all of these
traits, promoting transmission at intermediate optimal temper-
atures and suppressing it beyond lower and upper thermal
limits (Craig et al. 1999; Lafferty 2009).
Although temperature affects the transmission of all arthro-
pod-borne pathogens, here we focus on mosquito-borne dis-
eases because they pose a major worldwide health burden and
because the effects of temperature are perhaps best recognised
1Department of Biology, Stanford University, 371 Serra Mall, Stanford, CA,
USA2Department of Entomology and Center for Infectious Disease Dynamics,
Penn State University, University Park, PA, 16802, USA3Department of Geography and Emerging Pathogens Institute, University of
Florida, Gainesville, FL, USA4Department of Statistics, Virginia Polytechnic and State University, 250
Drillfield Drive, Blacksburg, VA, USA5Center for Research on Health in Latin America (CISeAL), Pontificia
Universidad Cat�olica del Ecuador, Quito, Ecuador
6Department of Biological Sciences, Eck Institute of Global Health,
Environmental Change Initiative, University of Notre Dame, Notre Dame, IN,
USA7School of Life Sciences, University of KwaZulu-Natal, Durban, South Africa8Department of Ecology and Evolutionary Biology and Department of
Biomathematics, University of California Los Angeles, Los Angeles, CA 90095,
USA9Santa Fe Institute, 1399 Hyde Park Rd, Santa Fe, NM, 87501, USA10Institute for Global Health and Translational Sciences, SUNY Upstate
Medical University, Syracuse NY13210, USA
*Correspondence: E-mail: [email protected]
© 2019 The Authors Ecology Letters published by CNRS and John Wiley & Sons LtdThis is an open access article under the terms of the Creative Commons Attribution License, which permits use,
distribution and reproduction in any medium, provided the original work is properly cited.
Ecology Letters, (2019) 22: 1690–1708 doi: 10.1111/ele.13335
in these pathogens, particularly in light of climate change
(Martens et al. 1997; Craig et al. 1999; Pascual et al. 2006;
Pascual & Bouma 2009; Parham & Michael 2010; Alonso
et al. 2011; Rohr et al. 2011; Stewart Ibarra et al. 2013; Siraj
et al. 2014; Ryan et al. 2019). Several important gaps limit
our ability to understand the effect of temperature on mos-
quito-borne disease (Parham et al. 2015). In this paper, we
summarise scientific knowledge about the role of temperature
in mosquito-borne disease transmission, identify critical gaps,
and chart a course for future research in the context of chang-
ing climate and emerging diseases. First, we outline funda-
mental concepts in vector thermal biology. Then, we illustrate
how these concepts can be applied by synthesising recent
trait-based research on the effects of temperature on multiple
mosquito-borne parasites and viruses and by making quanti-
tative comparisons. Finally, we discuss implications and pre-
dictions for transmission under climate change, open
questions to shape future research on the thermal biology of
mosquito-borne disease (Box 1), and extensions to other types
of arthropod vectors. We aim to identify generalities in the
effects of temperature on mosquito-borne disease transmis-
sion, leaving more system-specific processes such as precipita-
tion, immature vector habitat, host distribution and
behaviour, immune dynamics, socioeconomic factors, and vec-
tor control for future work.
Foundational concepts in thermal biology
Temperature limits the geographic range and magnitude of
mosquito-borne disease transmission via its effects on mos-
quito and pathogen traits (Martens et al. 1997; Craig et al.
1999; Thomas & Blanford 2003; Parham & Michael 2010;
Mordecai et al. 2013, 2017; Paull et al. 2017; Shapiro et al.
2017; Shocket et al. 2018; Tesla et al. 2018). Transmission
cannot occur at temperatures that prohibit mosquito or
pathogen survival, development, reproduction, or metabolism.
Within the range of permissive temperatures, the nonlinear
influence of temperature on mosquito and pathogen traits
affects the magnitude of transmission (Thomas & Blanford
2003). Determining the effects of temperature on transmission
requires identifying temperatures that optimise the tradeoffs
between different temperature-dependent traits of mosquitoes
and pathogens.
Extensive empirical and theoretical work has established
that most physiological and life history traits respond nonlin-
early to temperature – increasing from zero at a thermal mini-
mum approximately exponentially up to an optimum before
declining back to zero at a thermal maximum (Huey & Berri-
gan 2001; Angilletta 2009; Dell et al. 2011) (Fig. 1). This uni-
modal or hump-shaped relationship is nearly universal across
measured responses from ectotherm taxa and traits (Dell et al.
2011) and is predicted from first principles of enzyme kinetics
and physiology (Huey & Berrigan 2001; Angilletta 2009;
Kingsolver 2009; Huey & Kingsolver 2011; Amarasekare &
Savage 2012). Moreover, the rates of increase and decline in
performance with temperature are tightly constrained for
many traits. From the metabolic theory of ecology (Brown
et al. 2004), the approximate exponential rate of increase (the
Boltzmann–Arrhenius constant) ranges from 0.6 to 0.7 eV for
most metabolically related traits and taxa, while the constant
for exponential decline above the optimum is approximately
1.2 eV (Brown et al. 2004; Dell et al. 2011). Metabolic theory
of ecology has predicted host and parasite traits that affect
parasite dynamics in microsporidia and helminths (Hechinger
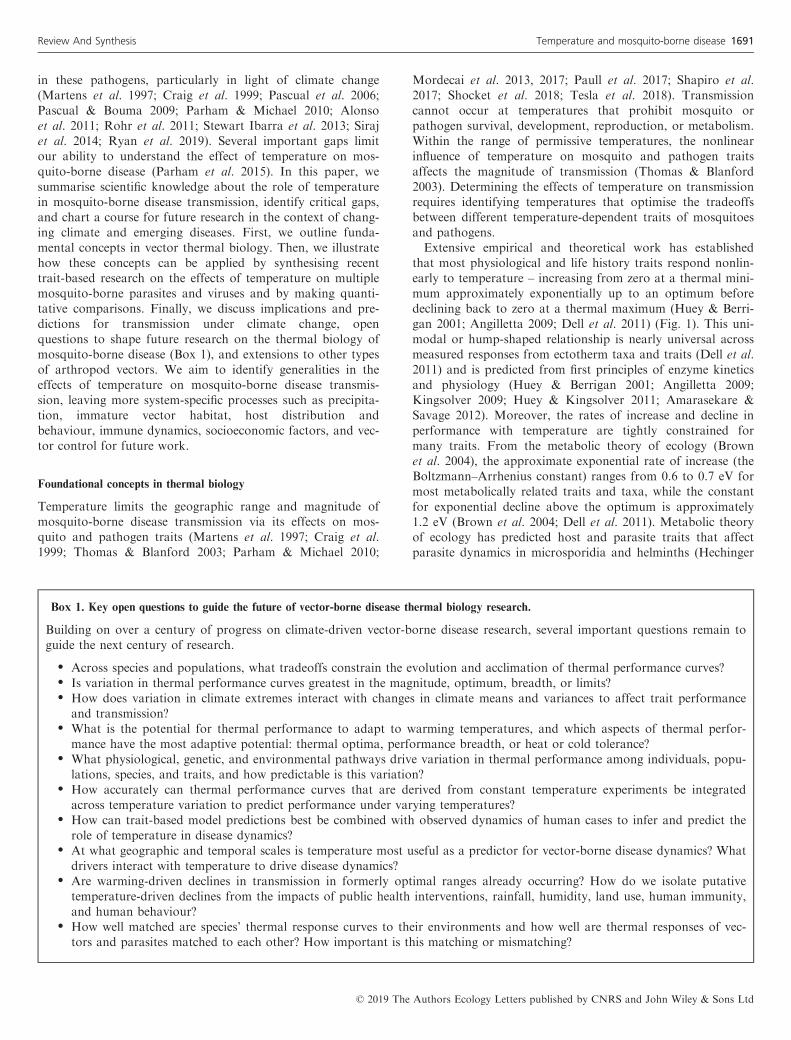
Box 1. Key open questions to guide the future of vector-borne disease thermal biology research.
Building on over a century of progress on climate-driven vector-borne disease research, several important questions remain to
guide the next century of research.
• Across species and populations, what tradeoffs constrain the evolution and acclimation of thermal performance curves?
• Is variation in thermal performance curves greatest in the magnitude, optimum, breadth, or limits?
• How does variation in climate extremes interact with changes in climate means and variances to affect trait performance
and transmission?
• What is the potential for thermal performance to adapt to warming temperatures, and which aspects of thermal perfor-
mance have the most adaptive potential: thermal optima, performance breadth, or heat or cold tolerance?
• What physiological, genetic, and environmental pathways drive variation in thermal performance among individuals, popu-
lations, species, and traits, and how predictable is this variation?
• How accurately can thermal performance curves that are derived from constant temperature experiments be integrated
across temperature variation to predict performance under varying temperatures?
• How can trait-based model predictions best be combined with observed dynamics of human cases to infer and predict the
role of temperature in disease dynamics?
• At what geographic and temporal scales is temperature most useful as a predictor for vector-borne disease dynamics? What
drivers interact with temperature to drive disease dynamics?
• Are warming-driven declines in transmission in formerly optimal ranges already occurring? How do we isolate putative
temperature-driven declines from the impacts of public health interventions, rainfall, humidity, land use, human immunity,
and human behaviour?
• How well matched are species’ thermal response curves to their environments and how well are thermal responses of vec-
tors and parasites matched to each other? How important is this matching or mismatching?
© 2019 The Authors Ecology Letters published by CNRS and John Wiley & Sons Ltd
Review And Synthesis Temperature and mosquito-borne disease 1691

2013; Moln�ar et al. 2013; Kirk et al. 2018, 2019; O’Connor &
Bernhardt 2018). Whether these canonical values from meta-
bolic theory apply to the traits of mosquitoes and pathogens
that drive vector-borne disease transmission is unknown
(Moln�ar et al. 2013, 2017).
Thermal optima for traits like development, survival, and
reproduction affect organismal fitness, and vary with the pro-
file of the environmental temperature (Deutsch et al. 2008;
Kingsolver 2009). As temperature varies over time, organisms
experience temperatures below and above their thermal
optima, affecting fitness. Such temperature variation may
limit species range boundaries (Overgaard et al. 2014). The
cost of exceeding thermal optima are higher than the costs of
undershooting thermal optima when trait thermal perfor-
mance curves are cold-skewed (Bernhardt et al. 2018). Since
daily and seasonal temperature variation is large in temperate
regions, many temperate species have evolved thermal perfor-
mance curves with optima well above the mean environmen-
tal temperature (Deutsch et al. 2008; Martin & Huey 2008).
This ‘thermal safety margin’ buffers individual and popula-
tion fitness against temperature fluctuations, particularly the
disproportionate cost of temperatures exceeding thermal
optima. By contrast, many tropical species, that experience
less variation in temperature have low thermal safety margins
(Deutsch et al. 2008). As a result, climate warming is
expected to push environmental temperatures above thermal
optima for many organisms, particularly in the tropics
(Deutsch et al. 2008; Kingsolver 2009). The emergent effect
of climate change depends on a population’s thermal perfor-
mance relative to the current environment, thermal stress tol-
erance, and ability to adapt or migrate, and the speed and
magnitude of climate change (Loarie et al. 2009; Paaijmans
et al. 2013).
From theory and empirical studies, we derive four key ther-
mal biology principles for mosquito-borne disease:
(1) Mosquito and pathogen traits related to survival, develop-
ment, and reproduction are temperature sensitive.
(2) These traits generally respond to temperature unimodally,
with lower and upper limits and optima potentially
adapted to local environments.
(3) Climate change will affect many mosquito and pathogen
traits that govern mosquito distribution, abundance, and
pathogen transmission.
(4) Climate change has the potential to increase, decrease, or
have minimal effect on transmission depending on organ-
ismal thermal responses, the changing climate regime, and
the rate of migration or adaptation.
Temperature defines one dimension of the fundamental eco-
logical niche for mosquito-borne disease transmission – the
range of conditions that is required for transmission to be
possible – which also includes immature vector habitat and
humidity. Within this fundamental niche, the realised ecologi-
cal niche for transmission additionally depends on host fac-
tors including density, movement, behaviour, demography,
susceptibility, control strategies, and exposure to mosquito
bites (Gething et al. 2010; Rodriguez-Barraquer et al. 2011;
Paaijmans & Thomas 2011a; Parham et al. 2015; Wesolowski
et al. 2015; Krisher et al. 2016; Metcalf et al. 2017; Salje et al.
2017, 2018; Jaramillo-Ochoa et al. 2019). Mosquito and
pathogen physiological responses to temperature determine
fundamental transmission potential, but the realised impact of
climate change on disease dynamics also depends on these
host population processes, socio-economics, disease control
efforts, or other mitigation measures (Gething et al. 2010;
Paaijmans & Thomas 2011a; Parham et al. 2015; Wesolowski
et al. 2017). Shared physiological mechanisms imply that mos-
quito thermal biology is likely to apply generally across sys-
tems and scales, whereas host population biology may be
more responsive to context-dependent behavioural or techno-
logical adaptation. For these reasons, we focus here on how
physiological effects of temperature on mosquito and patho-
gen traits affect transmission.
To illustrate one approach for applying principles of ther-
mal biology to vector-borne disease transmission, we synthe-
sise the results of previous research that used trait-based
models derived from experimental data to understand how
temperature affects mosquito-borne disease transmission. This
is one application – with several strengths and limitations – of
thermal biology concepts that apply more generally across
research approaches. We also highlight important caveats that
Figure 1 The trait-based approach to understanding effects of temperature on vector-borne disease transmission. In this approach, we derive trait thermal
performance curves from experimental data, synthesise their combined temperature-dependent effect on R0, validate the model with independent field
observations, and project predicted temperature suitability for transmission onto current and future climates.
© 2019 The Authors Ecology Letters published by CNRS and John Wiley & Sons Ltd
1692 E. A. Mordecai et al. Review And Synthesis
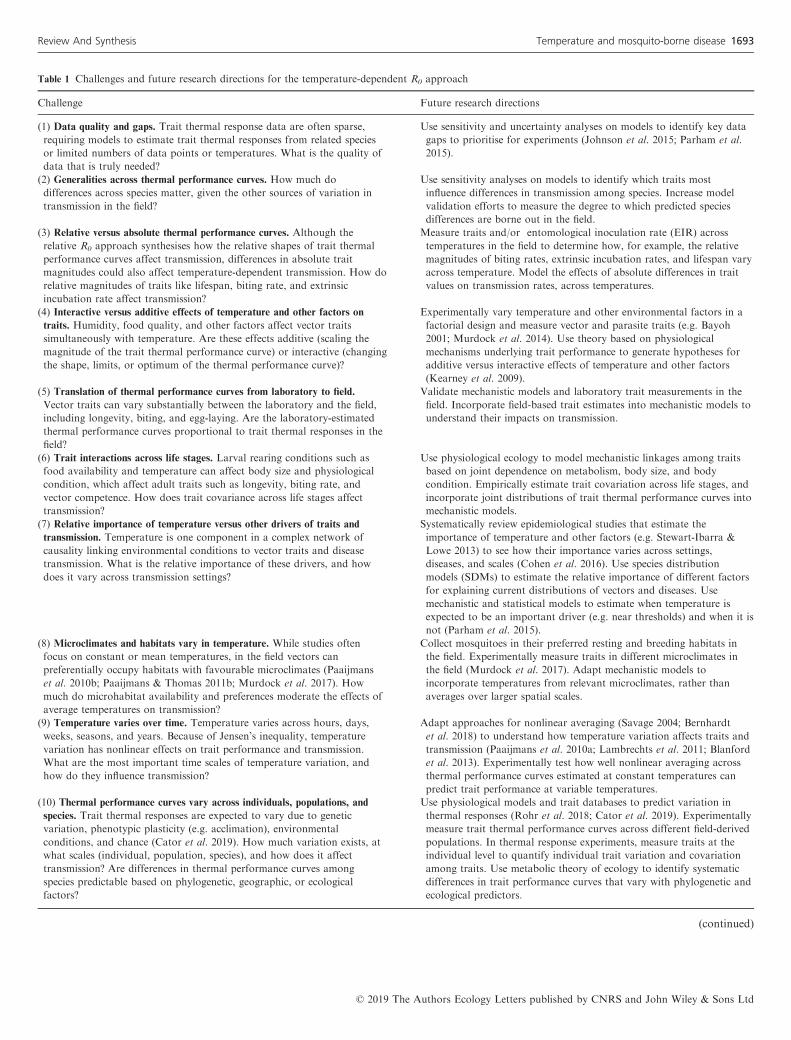
Table 1 Challenges and future research directions for the temperature-dependent R0 approach
Challenge Future research directions
(1) Data quality and gaps. Trait thermal response data are often sparse,
requiring models to estimate trait thermal responses from related species
or limited numbers of data points or temperatures. What is the quality of
data that is truly needed?
Use sensitivity and uncertainty analyses on models to identify key data
gaps to prioritise for experiments (Johnson et al. 2015; Parham et al.
2015).
(2) Generalities across thermal performance curves. How much do
differences across species matter, given the other sources of variation in
transmission in the field?
Use sensitivity analyses on models to identify which traits most
influence differences in transmission among species. Increase model
validation efforts to measure the degree to which predicted species
differences are borne out in the field.
(3) Relative versus absolute thermal performance curves. Although the
relative R0 approach synthesises how the relative shapes of trait thermal
performance curves affect transmission, differences in absolute trait
magnitudes could also affect temperature-dependent transmission. How do
relative magnitudes of traits like lifespan, biting rate, and extrinsic
incubation rate affect transmission?
Measure traits and/or entomological inoculation rate (EIR) across
temperatures in the field to determine how, for example, the relative
magnitudes of biting rates, extrinsic incubation rates, and lifespan vary
across temperature. Model the effects of absolute differences in trait
values on transmission rates, across temperatures.
(4) Interactive versus additive effects of temperature and other factors on
traits. Humidity, food quality, and other factors affect vector traits
simultaneously with temperature. Are these effects additive (scaling the
magnitude of the trait thermal performance curve) or interactive (changing
the shape, limits, or optimum of the thermal performance curve)?
Experimentally vary temperature and other environmental factors in a
factorial design and measure vector and parasite traits (e.g. Bayoh
2001; Murdock et al. 2014). Use theory based on physiological
mechanisms underlying trait performance to generate hypotheses for
additive versus interactive effects of temperature and other factors
(Kearney et al. 2009).
(5) Translation of thermal performance curves from laboratory to field.
Vector traits can vary substantially between the laboratory and the field,
including longevity, biting, and egg-laying. Are the laboratory-estimated
thermal performance curves proportional to trait thermal responses in the
field?
Validate mechanistic models and laboratory trait measurements in the
field. Incorporate field-based trait estimates into mechanistic models to
understand their impacts on transmission.
(6) Trait interactions across life stages. Larval rearing conditions such as
food availability and temperature can affect body size and physiological
condition, which affect adult traits such as longevity, biting rate, and
vector competence. How does trait covariance across life stages affect
transmission?
Use physiological ecology to model mechanistic linkages among traits
based on joint dependence on metabolism, body size, and body
condition. Empirically estimate trait covariation across life stages, and
incorporate joint distributions of trait thermal performance curves into
mechanistic models.
(7) Relative importance of temperature versus other drivers of traits and
transmission. Temperature is one component in a complex network of
causality linking environmental conditions to vector traits and disease
transmission. What is the relative importance of these drivers, and how
does it vary across transmission settings?
Systematically review epidemiological studies that estimate the
importance of temperature and other factors (e.g. Stewart-Ibarra &
Lowe 2013) to see how their importance varies across settings,
diseases, and scales (Cohen et al. 2016). Use species distribution
models (SDMs) to estimate the relative importance of different factors
for explaining current distributions of vectors and diseases. Use
mechanistic and statistical models to estimate when temperature is
expected to be an important driver (e.g. near thresholds) and when it is
not (Parham et al. 2015).
(8) Microclimates and habitats vary in temperature. While studies often
focus on constant or mean temperatures, in the field vectors can
preferentially occupy habitats with favourable microclimates (Paaijmans
et al. 2010b; Paaijmans & Thomas 2011b; Murdock et al. 2017). How
much do microhabitat availability and preferences moderate the effects of
average temperatures on transmission?
Collect mosquitoes in their preferred resting and breeding habitats in
the field. Experimentally measure traits in different microclimates in
the field (Murdock et al. 2017). Adapt mechanistic models to
incorporate temperatures from relevant microclimates, rather than
averages over larger spatial scales.
(9) Temperature varies over time. Temperature varies across hours, days,
weeks, seasons, and years. Because of Jensen’s inequality, temperature
variation has nonlinear effects on trait performance and transmission.
What are the most important time scales of temperature variation, and
how do they influence transmission?
Adapt approaches for nonlinear averaging (Savage 2004; Bernhardt
et al. 2018) to understand how temperature variation affects traits and
transmission (Paaijmans et al. 2010a; Lambrechts et al. 2011; Blanford
et al. 2013). Experimentally test how well nonlinear averaging across
thermal performance curves estimated at constant temperatures can
predict trait performance at variable temperatures.
(10) Thermal performance curves vary across individuals, populations, and
species. Trait thermal responses are expected to vary due to genetic
variation, phenotypic plasticity (e.g. acclimation), environmental
conditions, and chance (Cator et al. 2019). How much variation exists, at
what scales (individual, population, species), and how does it affect
transmission? Are differences in thermal performance curves among
species predictable based on phylogenetic, geographic, or ecological
factors?
Use physiological models and trait databases to predict variation in
thermal responses (Rohr et al. 2018; Cator et al. 2019). Experimentally
measure trait thermal performance curves across different field-derived
populations. In thermal response experiments, measure traits at the
individual level to quantify individual trait variation and covariation
among traits. Use metabolic theory of ecology to identify systematic
differences in trait performance curves that vary with phylogenetic and
ecological predictors.
(continued)
© 2019 The Authors Ecology Letters published by CNRS and John Wiley & Sons Ltd
Review And Synthesis Temperature and mosquito-borne disease 1693
correspond to key extensions and directions for future
research (Table 1).
APPROACH
Insights from trait-based mechanistic models
Here, we synthesise our previous research that applied a trait-
based modelling approach (Fig. 1) to incorporate the empirical
effects of constant temperature on mosquito and parasite traits,
and in turn transmission, for a variety of mosquito-borne
pathogen systems (Table 2) (Mordecai et al. 2013, 2017; John-
son et al. 2015; Shocket et al. 2018, 2019; Tesla et al. 2018). By
comparing previous model results – developed with consistent
methodology – we investigate how temperature differentially
affects transmission across vector-borne diseases and examine
the implications for climate change. Temperature affects all
traits of mosquitoes and pathogens that are tied to biological
rates, times, and probabilities via metabolism, including many
traits that drive transmission. Transmission is a dynamic, non-
linear process that depends on the density of infected vectors
and the availability of susceptible hosts. Time lags arise
between climate and transmission because temperature affects
mosquito development rates in immature stages, the oviposition
cycle, and pathogen extrinsic incubation period (Stewart Ibarra
et al. 2013; Huber et al. 2016). Temperature varies at multiple
time scales – daily, seasonally, yearly – that affect these traits
in different ways (Paaijmans et al. 2010a, 2013). As a result,
effects of temperature on transmission are nonlinear, dynamic,
and complex at multiple biological scales.
To capture nonlinearity and complexity in a simple, easily-
used model, we have ignored temperature variation and
dynamic time lags (Table 1) in this work and represented the
effects of temperature on transmission by focusing on a
common summary of transmission, the basic reproduction
number R0, at constant temperatures. This number describes
the average number of secondary cases that result from a single
infected individual introduced into a fully susceptible
population. Critically, R0 can incorporate all the temperature-
dependent mosquito and pathogen traits that control transmis-
sion, providing a simple metric for examining emergent, nonlin-
ear effects of temperature. Reproduction numbers can be
calculated using multiple methods, with differing interpretations
(Heesterbeek 2002; Heffernan et al. 2005; Diekmann et al.
2009), although their direct application is limited in realistically
variable environments (Baca€er & Guernaoui 2006; Baca€er &
Ait Dads 2012). Because several non-temperature factors that
vary across transmission settings can influence the absolute
magnitude of R0, our work has focused on the relative temper-
ature suitability for transmission, a version of R0 rescaled from
zero to one derived exclusively from temperature relationships.
The aim is to identify (constant) temperature limits on trans-
mission (where R0 = 0, so transmission is impossible) and the
optimal temperature for transmission (where R0 peaks) as met-
rics that can be compared across mosquito–pathogen systems,
transmission settings and climate scenarios. Temperature varia-
tion can then be incorporated into these models in the future
(see Table 1 and Limitations to the R0(T) approach).
This approach begins with a commonly used derivation
based on dynamical susceptible–infected–recovered (SIR)
models and leading-eigenvalue calculation (Dietz 1993), an
extension of the Ross–Macdonald framework (Smith et al.
2007b; Reiner et al. 2013):
R0 Tð Þ ¼
ffiffiffiffiffiffiffiffiffiffiffiffiffiffiffiffiffiffiffiffiffiffiffiffiffiffiffiffiffiffiffiffiffiffiffiffiffiffiffiffiffiffiffiffiffiffiffiffiffiffiffiffiffiffiffiffiffiffiffiffiffiffiffiffiffiffiffiffiffiffiffiffiffiffiffiffiffiffiffiffiffiffiffiffiffiffi
a Tð Þ2b Tð Þc Tð Þ exp �l Tð Þ=PDR Tð Þð ÞM Tð Þ
Nrl Tð Þ
s
; ð1Þ
where r is the host recovery rate, N is the density of hosts,
and T indicates the temperature dependence of the following
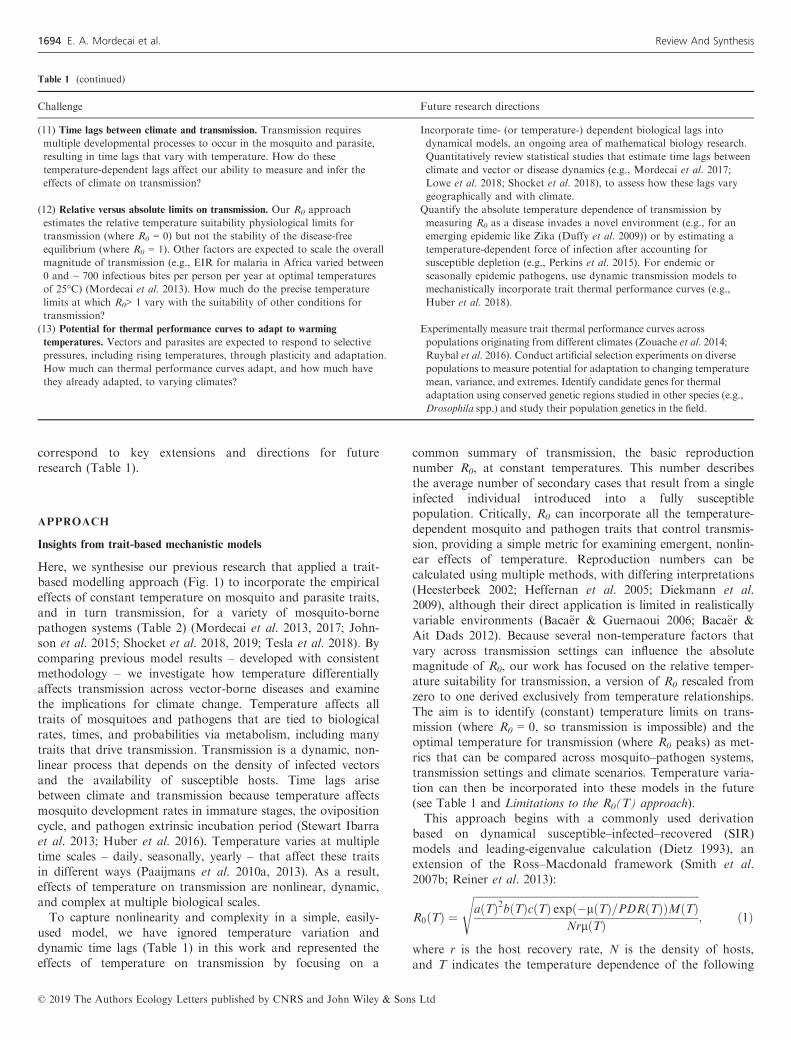
Table 1 (continued)
Challenge Future research directions
(11) Time lags between climate and transmission. Transmission requires
multiple developmental processes to occur in the mosquito and parasite,
resulting in time lags that vary with temperature. How do these
temperature-dependent lags affect our ability to measure and infer the
effects of climate on transmission?
Incorporate time- (or temperature-) dependent biological lags into
dynamical models, an ongoing area of mathematical biology research.
Quantitatively review statistical studies that estimate time lags between
climate and vector or disease dynamics (e.g., Mordecai et al. 2017;
Lowe et al. 2018; Shocket et al. 2018), to assess how these lags vary
geographically and with climate.
(12) Relative versus absolute limits on transmission. Our R0 approach
estimates the relative temperature suitability physiological limits for
transmission (where R0 = 0) but not the stability of the disease-free
equilibrium (where R0 = 1). Other factors are expected to scale the overall
magnitude of transmission (e.g., EIR for malaria in Africa varied between
0 and ~ 700 infectious bites per person per year at optimal temperatures
of 25�C) (Mordecai et al. 2013). How much do the precise temperature
limits at which R0> 1 vary with the suitability of other conditions for
transmission?
Quantify the absolute temperature dependence of transmission by
measuring R0 as a disease invades a novel environment (e.g., for an
emerging epidemic like Zika (Duffy et al. 2009)) or by estimating a
temperature-dependent force of infection after accounting for
susceptible depletion (e.g., Perkins et al. 2015). For endemic or
seasonally epidemic pathogens, use dynamic transmission models to
mechanistically incorporate trait thermal performance curves (e.g.,
Huber et al. 2018).
(13) Potential for thermal performance curves to adapt to warming
temperatures. Vectors and parasites are expected to respond to selective
pressures, including rising temperatures, through plasticity and adaptation.
How much can thermal performance curves adapt, and how much have
they already adapted, to varying climates?
Experimentally measure trait thermal performance curves across
populations originating from different climates (Zouache et al. 2014;
Ruybal et al. 2016). Conduct artificial selection experiments on diverse
populations to measure potential for adaptation to changing temperature
mean, variance, and extremes. Identify candidate genes for thermal
adaptation using conserved genetic regions studied in other species (e.g.,
Drosophila spp.) and study their population genetics in the field.
© 2019 The Authors Ecology Letters published by CNRS and John Wiley & Sons Ltd
1694 E. A. Mordecai et al. Review And Synthesis
parameters (traits): mosquito biting rate, a; mosquito adult
mortality rate, l (the inverse of lifespan, lf); parasite develop-
ment rate, PDR (the inverse of the extrinsic incubation per-
iod); and vector competence (the product of the proportion of
exposed mosquitoes that acquire a disseminated infection, c
and the proportion of infected mosquitoes that become infec-
tious with pathogens in their salivary glands, b).
Temperature should also affect mosquito abundance, M,
because it affects mosquito life-history traits. Parham &
Michael (2010) extended eqn (1) to incorporate effects of tem-
perature on mosquito abundance via its effects on egg-to-
adult development rate (MDR) and survival probability (pEA),
and lifetime fecundity (B, which we approximate as eggs per
female per day, EFD, times lifespan, 1/l). Following Parham
& Michael (2010), our work has modelled temperature-depen-
dent mosquito abundance as follows:
M Tð Þ ¼EFD Tð ÞpEA Tð ÞMDR Tð Þ
l Tð Þ2ð2Þ
Incorporating M(T) into the R0(T) model, we obtained the
full temperature-sensitive R0 expression (Mordecai et al. 2013,
2017; Johnson et al. 2015; Shocket et al. 2018; Tesla et al.
2018):
R0 Tð Þ¼ffiffiffiffiffiffiffiffiffiffiffiffiffiffiffiffiffiffiffiffiffiffiffiffiffiffiffiffiffiffiffiffiffiffiffiffiffiffiffiffiffiffiffiffiffiffiffiffiffiffiffiffiffiffiffiffiffiffiffiffiffiffiffiffiffiffiffiffiffiffiffiffiffiffiffiffiffiffiffiffiffiffiffiffiffiffiffiffiffiffiffiffiffiffiffiffiffiffiffiffiffiffiffiffiffiffiffiffiffiffiffiffiffiffiffiffiffiffiffiffiffiffiffiffi
a Tð Þ2b Tð Þc Tð Þexp �l Tð Þ=PDR Tð Þð ÞEFD Tð ÞpEA Tð ÞMDR Tð Þ
Nrl Tð Þ3
s
ð3Þ
To estimate the effect of temperature on R0, in previous
work, we parameterised thermal response functions for each
of the temperature-dependent parameters using laboratory
experiments that measure mosquito or pathogen traits at three
or more constant temperatures. Based on data availability, for
some mosquito species, we used alternative measurements of
immature survival and fecundity (Table S1) and adjust eqn (3)
accordingly (Shocket et al. 2019).
This approach is simple, mechanistic, analytical and broadly
applicable across the vector-borne disease systems for which
eqns (1–3) apply (i.e. mosquito- and fly-borne pathogens). In
this framework, we have used sensitivity analyses to examine
the effects of different temperature-dependent traits on trans-
mission, and Bayesian inference to assess how uncertainty in
traits affects uncertainty in R0 across temperatures, pinpoint-
ing critical traits and temperatures for further data collection
(Johnson et al. 2015). We have applied this approach to a
variety of mosquito vectors and pathogens to estimate temper-
ature-dependent transmission functions that can be field-tested
and compared across systems (Mordecai et al. 2013, 2017;
Shocket et al. 2018, 2019; Tesla et al. 2018) (Table 2).
Limitations to the R0(T) approach
This approach has several important limitations, some of
which can be addressed by extending the models – making
them less general – while others represent priorities for future
research (summarised in Table 1). One limitation of constant-
temperature models is that in nature temperature varies daily,
seasonally, interannually, and spatially. Because trait thermal
responses are nonlinear, trait performance under varying tem-
peratures deviates from performance at constant temperatures
due to Jensen’s inequality (Table 1) (Martin & Huey 2008;
Paaijmans et al. 2010a; Lambrechts et al. 2011). Performance
at variable temperatures exceeds performance at a constant
temperature for concave-up regions of thermal performance
curves (near thermal limits), and vice versa for concave-down
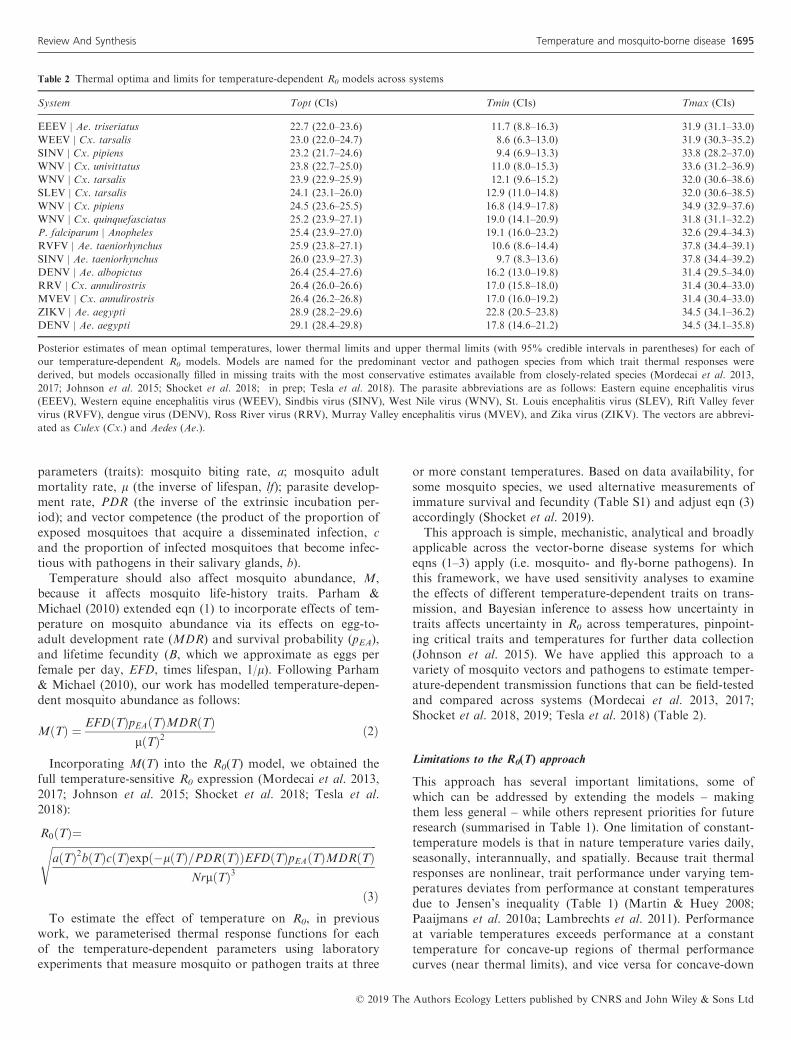
Table 2 Thermal optima and limits for temperature-dependent R0 models across systems
System Topt (CIs) Tmin (CIs) Tmax (CIs)
EEEV | Ae. triseriatus 22.7 (22.0–23.6) 11.7 (8.8–16.3) 31.9 (31.1–33.0)
WEEV | Cx. tarsalis 23.0 (22.0–24.7) 8.6 (6.3–13.0) 31.9 (30.3–35.2)
SINV | Cx. pipiens 23.2 (21.7–24.6) 9.4 (6.9–13.3) 33.8 (28.2–37.0)
WNV | Cx. univittatus 23.8 (22.7–25.0) 11.0 (8.0–15.3) 33.6 (31.2–36.9)
WNV | Cx. tarsalis 23.9 (22.9–25.9) 12.1 (9.6–15.2) 32.0 (30.6–38.6)
SLEV | Cx. tarsalis 24.1 (23.1–26.0) 12.9 (11.0–14.8) 32.0 (30.6–38.5)
WNV | Cx. pipiens 24.5 (23.6–25.5) 16.8 (14.9–17.8) 34.9 (32.9–37.6)
WNV | Cx. quinquefasciatus 25.2 (23.9–27.1) 19.0 (14.1–20.9) 31.8 (31.1–32.2)
P. falciparum | Anopheles 25.4 (23.9–27.0) 19.1 (16.0–23.2) 32.6 (29.4–34.3)
RVFV | Ae. taeniorhynchus 25.9 (23.8–27.1) 10.6 (8.6–14.4) 37.8 (34.4–39.1)
SINV | Ae. taeniorhynchus 26.0 (23.9–27.3) 9.7 (8.3–13.6) 37.8 (34.4–39.2)
DENV | Ae. albopictus 26.4 (25.4–27.6) 16.2 (13.0–19.8) 31.4 (29.5–34.0)
RRV | Cx. annulirostris 26.4 (26.0–26.6) 17.0 (15.8–18.0) 31.4 (30.4–33.0)
MVEV | Cx. annulirostris 26.4 (26.2–26.8) 17.0 (16.0–19.2) 31.4 (30.4–33.0)
ZIKV | Ae. aegypti 28.9 (28.2–29.6) 22.8 (20.5–23.8) 34.5 (34.1–36.2)
DENV | Ae. aegypti 29.1 (28.4–29.8) 17.8 (14.6–21.2) 34.5 (34.1–35.8)
Posterior estimates of mean optimal temperatures, lower thermal limits and upper thermal limits (with 95% credible intervals in parentheses) for each of
our temperature-dependent R0 models. Models are named for the predominant vector and pathogen species from which trait thermal responses were
derived, but models occasionally filled in missing traits with the most conservative estimates available from closely-related species (Mordecai et al. 2013,
2017; Johnson et al. 2015; Shocket et al. 2018; in prep; Tesla et al. 2018). The parasite abbreviations are as follows: Eastern equine encephalitis virus
(EEEV), Western equine encephalitis virus (WEEV), Sindbis virus (SINV), West Nile virus (WNV), St. Louis encephalitis virus (SLEV), Rift Valley fever
virus (RVFV), dengue virus (DENV), Ross River virus (RRV), Murray Valley encephalitis virus (MVEV), and Zika virus (ZIKV). The vectors are abbrevi-
ated as Culex (Cx.) and Aedes (Ae.).
© 2019 The Authors Ecology Letters published by CNRS and John Wiley & Sons Ltd
Review And Synthesis Temperature and mosquito-borne disease 1695
regions of thermal performance curves (near thermal optima)
(Bernhardt et al. 2018). For example, parasites may complete
development within the mosquito under varying temperatures
centred on constant temperatures at which development
would never be completed, near thermal limits (Blanford et al.
2013). Because of nonlinear thermal performance curves, the
optimal mean temperature in a variable environment depends
on the amount of temperature variation (Martin & Huey
2008; Paaijmans et al. 2010a; Lambrechts et al. 2011; Blanford
et al. 2013). Future work could incorporate variance and
higher-order terms for fluctuation in temperature across dif-
ferent time scales to estimate its effect on transmission
(Table 1) (Savage 2004; Cohen et al. 2019).
Nonlinearities also make many traits difficult to measure
even at constant temperatures, especially near thermal limits
(Table 1). For cold-skewed thermal performance curves, trait
performance can drop steeply from peak to zero over a few
degrees, so experiments must span wide ranges of tempera-
tures in small increments to fully capture nonlinear thermal
responses. Rates can be difficult to measure near lower ther-
mal limits because they are exceedingly slow (Waite et al.
2019). Near upper performance limits, constant temperature
estimates may not capture non-lethal and time-dependent
effects of heat stress (Kingsolver & Woods 2016; Sinclair
et al. 2016). Traits are most easily and accurately measured
near thermal optima, while uncertainty is highest near thermal
limits (Johnson et al. 2015). For composite traits such as
vector competence, measuring the underlying physiological
responses may be important for understanding thermal
responses, particularly under varying temperatures (Table 1).
Keeping these empirical limitations in mind, we have
applied R0(T) estimated from constant-temperature trait ther-
mal performance experiments as a consistent metric of relative
temperature suitability across vector-borne diseases. This met-
ric captures the emergent, nonlinear effects of temperature on
disease transmission, allowing us to investigate general pat-
terns in thermal responses. The models could be extended to
include temperature variation, individual- or population-level
trait variation, differences in performance between the labora-
tory and the field, and mosquito and human behaviour
(Table 1), gaining explanatory power while losing generality.
SYNTHESISING PREVIOUS RESULTS
We empirically parameterised thermal performance curves for
traits and R0 for a suite of 15 ecologically important mosquito
species that transmit 11 different pathogens: Western and
Eastern Equine Encephalitis virus (WEEV and EEEV), Sind-
bis virus (SINV), Rift Valley Fever virus (RVFV), West Nile
virus (WNV), St. Louis Encephalitis virus (SLEV), Plasmod-
ium falciparum malaria, Ross River virus (RRV), Murray Val-
ley Encephalitis virus (MVEV), dengue virus (DENV) and
Zika virus (ZIKV) (Figs 2–5; Table 2, Table S1). In total, we
empirically estimated thermal performance curves for 88
5 10 15 20 25 30 35 40
0.0
0.2
0.4
0.6
0.8
1.0
Temperature (°C)
Temperature (°C)
Re
lative
R0
EEEV | Ae. triseriatus
WEEV | Cx. tarsalis
SINV | Cx. pipiens
WNV | Cx. univittatus
WNV | Cx. tarsalis
SLEV | Cx. tarsalis
WNV | Cx. pipiens
WNV | Cx. quinq.
P. falciparum | Anopheles
RVFV | Ae. taeniorhynchus
SINV | Ae. taeniorhynchus
RRV | Cx. annulirostris
DENV | Ae. albopictus
MVEV | Cx. annulirostris
ZIKV | Ae. aegypti
DENV | Ae. aegypti
5 10 15 20 25 30 35 40
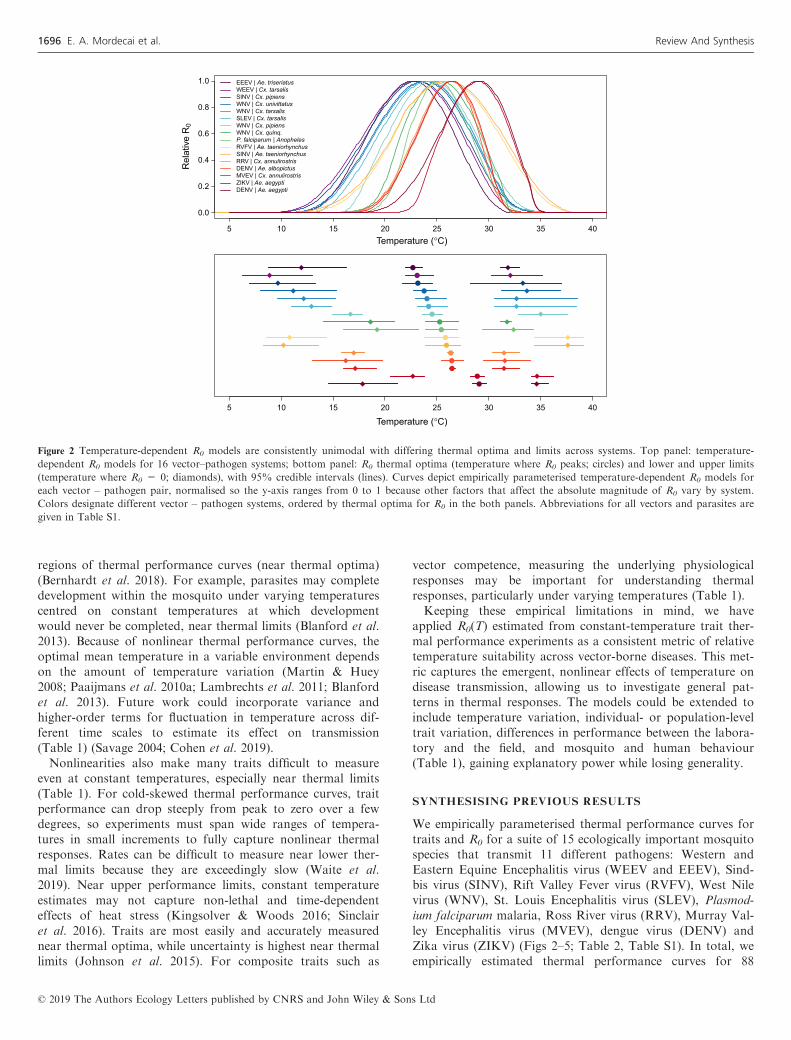
Figure 2 Temperature-dependent R0 models are consistently unimodal with differing thermal optima and limits across systems. Top panel: temperature-
dependent R0 models for 16 vector–pathogen systems; bottom panel: R0 thermal optima (temperature where R0 peaks; circles) and lower and upper limits
(temperature where R0 = 0; diamonds), with 95% credible intervals (lines). Curves depict empirically parameterised temperature-dependent R0 models for
each vector – pathogen pair, normalised so the y-axis ranges from 0 to 1 because other factors that affect the absolute magnitude of R0 vary by system.
Colors designate different vector – pathogen systems, ordered by thermal optima for R0 in the both panels. Abbreviations for all vectors and parasites are
given in Table S1.
© 2019 The Authors Ecology Letters published by CNRS and John Wiley & Sons Ltd
1696 E. A. Mordecai et al. Review And Synthesis

traits, resulting in 16 temperature-dependent R0 models (in
some cases, we estimated separate R0 models for different
pathogens in the same vector or different vectors for the same
pathogen) (Mordecai et al. 2013, 2017; Johnson et al. 2015;
Shocket et al. 2018, 2019; Tesla et al. 2018). With these ther-
mal performance curves, we compare temperature responses
across vector–pathogen systems and estimate potential effects
of climate change on disease transmission.
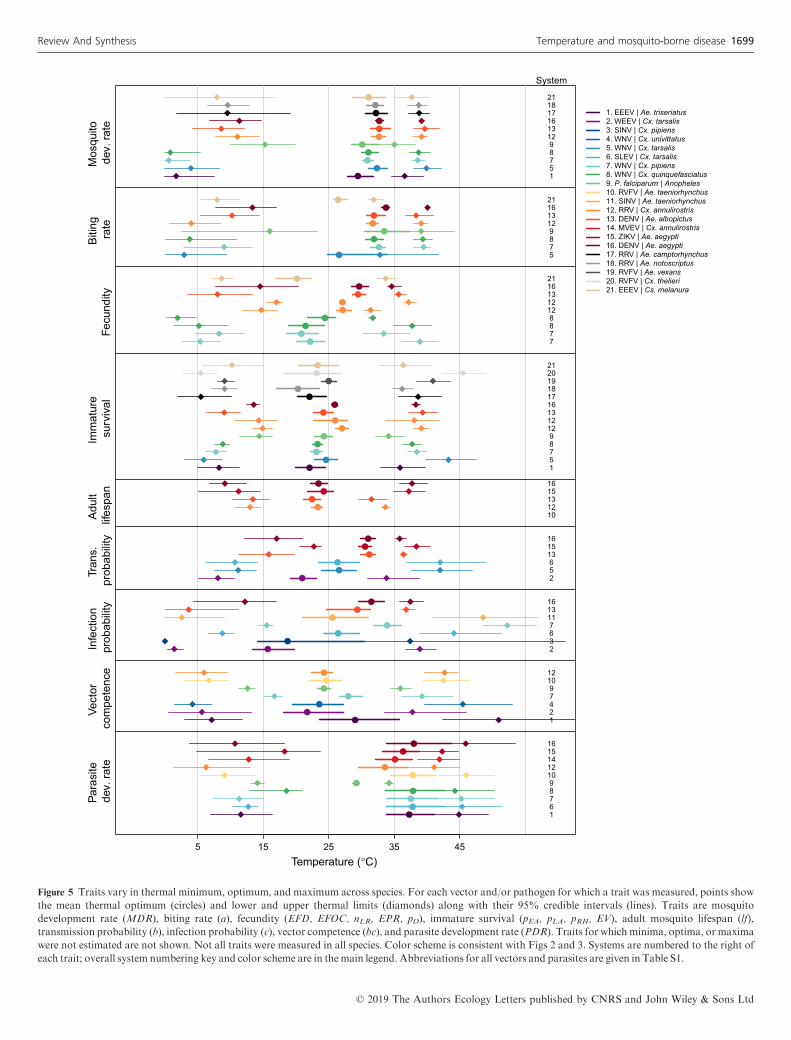
As expected, all of the mosquito and pathogen traits we
examined were temperature-sensitive and generally respond
unimodally, peaking from 15.7 to 38.0°C (mean thermal opti-
mum = 28.4°C; Figs 3–5). (One exception is lifespan for three
temperate mosquitoes, discussed below; Fig. 3.) These traits
were estimated to decline to zero at thermal minima ranging
from 0 to 22.7°C (mean = 9.5°C) and maxima ranging from
31.4 to 56.6°C (mean = 39.5°C; Fig. 5). Mosquito immature
survival and adult lifespan had the lowest thermal optima,
while pathogen development rate had the highest thermal
optima (Fig. 5). Vector competence often peaked at much
lower temperatures than pathogen development rate (Fig. 5),
emphasising the importance of measuring both trait thermal
responses (Paaijmans et al. 2011). Temperate mosquito species
had notably higher immature survival at temperatures below
10°C than the sub-tropical and tropical species (Fig. 3), sug-
gesting that this trait is important for persistence in temperate
climates. Consistent with previous ectotherm physiology work
(Amarasekare & Savage 2012), rate traits usually exhibited
asymmetric unimodal thermal responses with higher optima,
while probability traits were more symmetrical with lower
optima (Figs 3 and 4). Asymmetric curves for rates such as
immature development, fecundity, biting, and parasite incuba-
tion can be well fit by Bri�ere and modified Arrhenius func-
tions, while symmetrical curves for probability traits such as
survival and vector competence are well described by quadra-
tic or Gaussian functions (Figs 3 and 4) (Johnson & Lewin
1946; Briere et al. 1999; Amarasekare & Savage 2012; Moln�ar
et al. 2013, 2017).
In contrast to the unimodal responses for other traits, the
lifespans of three temperate mosquitoes – Culex pipiens, Cx.
tarsalis, and Cx. quinquefasciatus – monotonically declined
10 20 30 40
0.0
0.1
0.2
0.3
0.4
Bitin
g r
ate
(a
)
5
7
8
9
12
13
16
21
(a)
10 20 30 40
0.0
0.2
0.4
0.6
0.8
1.0
Re
lative
fe
cu
nd
ity
7
7
8
8
12
12
13
16
21
(b)
10 20 30 40
0.0
00
.04
0.0
80
.12
Mo
sq
uito
deve
lop
me
nt ra
te (
MD
R)
1
5
7
8
9
12
13
16
17
18
21
(c)
10 20 30 40
0.0
0.2
0.4
0.6
0.8
1.0
Imm
atu
re s
urv
iva
l
1
5
7
8
9
12
12
13
16
17
18
19
20
21
(d)
10 20 30 40
02
04
06
08
01
00
Mo
sq
uito
life
sp
an
(lf)
5
7
8
9
10
12
13
15
16
(e) 1. EEEV | Ae. triseriatus
2. WEEV | Cx. tarsalis
3. SINV | Cx. pipiens
4. WNV | Cx. univittatus
5. WNV | Cx. tarsalis
6. SLEV | Cx. tarsalis
7. WNV | Cx. pipiens
8. WNV | Cx. quinquefasciatus
9. P. falciparum | Anopheles
10. RVFV | Ae. taeniorhynchus
11. SINV | Ae. taeniorhynchus
12. RRV | Cx. annulirostris
13. DENV | Ae. albopictus
14. MVEV | Cx. annulirostris
15. ZIKV | Ae. aegypti
16. DENV | Ae. aegypti
17. RRV | Ae. camptorhynchus
18. RRV | Ae. notoscriptus
19. RVFV | Ae. vexans
20. RVFV | Cx. thelieri
21. EEEV | Cs. melanura
Temperature (°C)
Figure 3 Trait thermal performance curves for vector life history traits vary by species. Thermal performance curves estimated from laboratory
experimental data across different vector species that transmit different pathogens (systems are numbered in each panel; overall system numbering key and
color scheme are in the main legend). Color scheme is consistent with Fig. 2, i.e., ordered by thermal optima for R0; systems for which no R0 model was
calculated are listed last. Vector traits are (a) biting rate (a); (b) relative fecundity; (c) mosquito development rate (MDR); (d) immature survival; and (e)
mosquito lifespan (lf). Fecundity is rescaled to range from zero to one because it is alternatively measured as eggs per female per day (EFD; Ae. aegypti,
Cx. annulirostris), eggs per female per oviposition cycle (EFOC; Ae. albopictus, Cx. pipiens), number of larvae per raft (nLR; Cx. annulirostris [dashed line]),
eggs per raft (EPR; Cx. quinquefasciatus), or proportion ovipositing (pO; Cx. pipiens [dashed line], Cx. quinquefasciatus [dashed line], Cs. melanura).
Immature survival probability is measured as egg-to-adult survival probability (pEA; Ae. aegypti, Ae. albopictus, An. gambiae), larva-to-adult survival
probability (pLA; Ae. camptorhynchus, Ae. notoscriptus, Ae. triseriatus, Ae. vexans, Cx. annulirostris, Cx. pipiens, Cx. quinquefasciatus, Cx. tarsalis, Cs.
melanura), proportion of egg rafts that hatch (pRH; Cx. annulirostris [dashed line]), or egg viability (EV; Cx. thelieri). To be conservative, for three
temperate vectors that can undergo diapause and therefore survive cold temperatures (Cx. tarsalis, Cx. pipiens, Cx. quinquefasciatus), lifespan (lf) was
assumed to be constant from 0�C to the lowest temperature measured in the experiments (14-16�C), because a decline at low temperatures was not
observed in the data. Abbreviations for all vectors and parasites are given in Table S1.
© 2019 The Authors Ecology Letters published by CNRS and John Wiley & Sons Ltd
Review And Synthesis Temperature and mosquito-borne disease 1697

across the temperature ranges measured (above 14°C). These
species may differ in their biological responses to low temper-
ature because of their ability to diapause as an adaptation to
survive cold winters (Shocket et al. 2019). Further research in
species like Ae. albopictus, which differ geographically in the
ability to diapause, could test the hypothesis that diapause
affects the shape of the thermal performance curve for lifes-
pan (Table 1) (Thomas et al. 2012). Nonetheless, theory pre-
dicts that exposure to more extreme cold temperatures would
eventually limit lifespans even for diapausing mosquitoes, sug-
gesting a unimodal response over a wider temperature range.
Synthesising the overall influence of temperature on disease
transmission (R0), we found several commonalities in the ther-
mal performance curves and thermal limits from our trait-
based models. First, we estimated that transmission peaked at
intermediate temperatures between 22.7 and 29.1°C (mean
optimal temperature = 25.2°C; Fig. 2). Lower thermal limits
for modeled R0 under constant temperatures ranged from 8.7
to 22.7°C and upper thermal limits ranged from 31.5 to
37.8°C (Fig. 2). As expected, several temperate mosquito spe-
cies had relatively cool thermal ranges for transmission,
although the lower thermal limits are more divergent than the
thermal optima and upper limits (Fig. 2; Table 2). Tropical
mosquito-borne diseases had intermediate thermal optima
within the environmentally relevant range of temperatures,
ranging from 25.4°C for P. falciparum malaria in Anopheles
gambiae to 29.1°C for DENV in Ae. aegypti. At the same
time, many temperate vectors and pathogens (e.g., Cx. pipiens,
Cx. tarsalis, and Cx. quinquefasciatus and WNV, EEEV,
WEEV, SLEV, and SINV), had R0 thermal limits up to 32–
35°C, similar to those of tropical diseases (Fig. 2; Shocket
et al. 2019). Finally, the temperature response of R0 – particu-
larly the lower thermal limit and optimum – varied across
multiple pathogens transmitted by a single mosquito species
(e.g. DENV and ZIKV in Ae. aegypti; WNV, WEEV, and
SLEV in Cx. tarsalis; WNV and SINV in Cx. pipiens) and
across multiple mosquito species transmitting a single patho-
gen (e.g. DENV in Ae. albopictus and Ae. aegypti; WNV in
Cx. tarsalis, Cx. pipiens, Cx. quinquefasciatus, and Cx. univit-
tatus) (Fig. 2; Table 2). This implies that the thermal response
of transmission depends on the effects of temperature on
traits of both the mosquito and the pathogen.
Sensitivity analyses conducted in previous work showed that
all mosquito and pathogen traits limit the thermal response of
transmission – including traits regularly incorporated into
temperature-dependent models like mosquito lifespan, extrin-
sic incubation rate, and biting rate as well as less-recognised
temperature-dependent traits like vector competence and
demographic rates (Mordecai et al. 2013, 2017; Johnson et al.
2015; Shocket et al. 2018; Tesla et al. 2018). Adult mosquito
10 20 30 40
0.0
0.2
0.4
0.6
0.8
1.0
Tra
nsm
issio
n p
rob
ab
ility
(b
) 2
5
6
13
15
16
(a)
10 20 30 40
0.0
0.2
0.4
0.6
0.8
1.0
Infe
ctio
n p
rob
ab
ility
(c)
2
3
6
7
11
13
16
(b)
10 20 30 40
0.0
0.2
0.4
0.6
0.8
1.0
Ve
cto
r com
pete
nce (
bc)
1
2
4
7
9
10
12
(c)
10 20 30 40
0.0
00
.05
0.1
00
.15
0.2
00
.25
0.3
0
Pa
rasite d
eve
lopm
ent ra
te (
PD
R)
1
6
7
8
9
10
12
14
15
16
(d) 1. EEEV | Ae. triseriatus
2. WEEV | Cx. tarsalis
3. SINV | Cx. pipiens
4. WNV | Cx. univittatus
5. WNV | Cx. tarsalis
6. SLEV | Cx. tarsalis
7. WNV | Cx. pipiens
8. WNV | Cx. quinquefasciatus
9. P. falciparum | Anopheles
10. RVFV | Ae. taeniorhynchus
11. SINV | Ae. taeniorhynchus
12. RRV | Cx. annulirostris
13. DENV | Ae. albopictus
14. MVEV | Cx. annulirostris
15. ZIKV | Ae. aegypti
16. DENV | Ae. aegypti
17. RRV | Ae. camptorhynchus
18. RRV | Ae. notoscriptus
19. RVFV | Ae. vexans
20. RVFV | Cx. thelieri
21. EEEV | Cs. melanura
Temperature (°C)
Figure 4 Trait thermal performance curves for pathogen transmission traits within the vector vary by species. Thermal performance curves estimated from
laboratory experimental data across different pathogens and vectors (systems are numbered in each panel; overall system numbering key and color scheme
are in the main legend). Color scheme is consistent with Figs 2 and 3. Traits are (a) transmission probability (b); (b) infection probability (c); (c) vector
competence (bc); and (d) parasite development rate (PDR). Abbreviations for all vectors and parasites are given in Table S1.
© 2019 The Authors Ecology Letters published by CNRS and John Wiley & Sons Ltd
1698 E. A. Mordecai et al. Review And Synthesis
5 15 25 35 45
16789
1012141516
12479
1012
2367
111316
256
131516
1012131516
15789
121213161718192021
7788
1212131621
5789
12131621
15789
121316171821
Mo
sq
uito
dev. ra
te
Bitin
g
rate
Fe
cu
nd
ity
Imm
atu
re
su
rviv
al
Ad
ult
life
sp
an
Tra
ns.
pro
ba
bili
ty
Infe
ctio
n
pro
ba
bili
ty
Ve
cto
r
co
mp
ete
nce
Pa
rasite
dev. ra
te
System
Temperature (°C)
1. EEEV | Ae. triseriatus
2. WEEV | Cx. tarsalis
3. SINV | Cx. pipiens
4. WNV | Cx. univittatus
5. WNV | Cx. tarsalis
6. SLEV | Cx. tarsalis
7. WNV | Cx. pipiens
8. WNV | Cx. quinquefasciatus
9. P. falciparum | Anopheles
10. RVFV | Ae. taeniorhynchus
11. SINV | Ae. taeniorhynchus
12. RRV | Cx. annulirostris
13. DENV | Ae. albopictus
14. MVEV | Cx. annulirostris
15. ZIKV | Ae. aegypti
16. DENV | Ae. aegypti
17. RRV | Ae. camptorhynchus
18. RRV | Ae. notoscriptus
19. RVFV | Ae. vexans
20. RVFV | Cx. thelieri
21. EEEV | Cs. melanura
Figure 5 Traits vary in thermal minimum, optimum, and maximum across species. For each vector and/or pathogen for which a trait was measured, points show
the mean thermal optimum (circles) and lower and upper thermal limits (diamonds) along with their 95% credible intervals (lines). Traits are mosquito
development rate (MDR), biting rate (a), fecundity (EFD, EFOC, nLR, EPR, pO), immature survival (pEA, pLA, pRH, EV), adult mosquito lifespan (lf),
transmission probability (b), infection probability (c), vector competence (bc), and parasite development rate (PDR). Traits for which minima, optima, or maxima
were not estimated are not shown. Not all traits were measured in all species. Color scheme is consistent with Figs 2 and 3. Systems are numbered to the right of
each trait; overall system numbering key and color scheme are in the main legend. Abbreviations for all vectors and parasites are given in Table S1.
© 2019 The Authors Ecology Letters published by CNRS and John Wiley & Sons Ltd
Review And Synthesis Temperature and mosquito-borne disease 1699
lifespan consistently limited R0 at warm temperatures while
pathogen development rate (i.e., extrinsic incubation rate) and
mosquito biting rate limited R0 at low temperatures (Morde-
cai et al. 2013, 2017; Shocket et al. 2018, 2019). However, in
some systems other traits determined lower and upper thermal
limits, and optima for transmission varied across systems. For
RRV in Cx. annulirostris, fecundity and immature survival
determined the upper and lower limits, respectively (Shocket
et al. 2018). For WNV in Cx. pipiens, vector competence
determined the lower limit (Shocket et al. 2019). For WNV in
Cx. quinquefasciatus, oviposition rate determined the upper
limit, and for WNV, WEEV, and SLEV in Cx. tarsalis, biting
rate was important for the upper limits (Shocket et al. 2019).
Because R0 models were sensitive to different traits for differ-
ent systems, it is critical to include empirically-estimated ther-
mal responses for the full suite of traits in transmission
models. Models based on more limited thermal response
assumptions often predict very different effects of temperature
on transmission, which align poorly with field data.
DISCUSSION
Strengths and limitations of mechanistic and statistical approaches
Research on the effects of temperature on mosquito-borne
disease has taken either mechanistic (trait-based) or statistical
(correlative) approaches (Rogers & Randolph 2006). Mecha-
nistic approaches are most suitable for characterising the mul-
tivariate, nonlinear effects of temperature on disease
transmission across broad temperature and geographic ranges,
for estimating the fundamental environmental limits on trans-
mission, and for extrapolating into future climate regimes and
novel settings, for which statistical approaches have limited
applicability (Parham et al. 2015). However, statistical models
are often more appropriate for locally predicting disease
dynamics, for describing or forecasting transmission over
smaller spatial or temporal scales, for understanding the rela-
tive explanatory power of multiple drivers of transmission,
and for describing current patterns of disease transmission
(Parham et al. 2015).
Mechanistic models rely on our understanding of the domi-
nant processes that underlie organismal fitness to predict geo-
graphic range, population size, or transmission rate (Helmuth
et al. 2005; Kearney et al. 2009, 2010; Kearney & Porter
2009), and therefore require experiments on multiple traits of
pathogens, vectors, and their interactions across environmen-
tal conditions. Synthesising heterogeneous data sources from
the literature, including filling in parameter values from
related species where necessary (e.g., Mordecai et al. 2013),
introduces methodological and biological differences that can
add error to parameter estimates. Unlike statistical
approaches, such as species distribution models (SDMs),
mechanistic models often do not jointly capture many biotic
and abiotic constraints that limit observed ranges.
The value of mechanistic models is their flexibility and
extensibility, which are particularly important for predicting
distributions and dynamics in novel environments (Williams
& Jackson 2007). Because experiments can capture
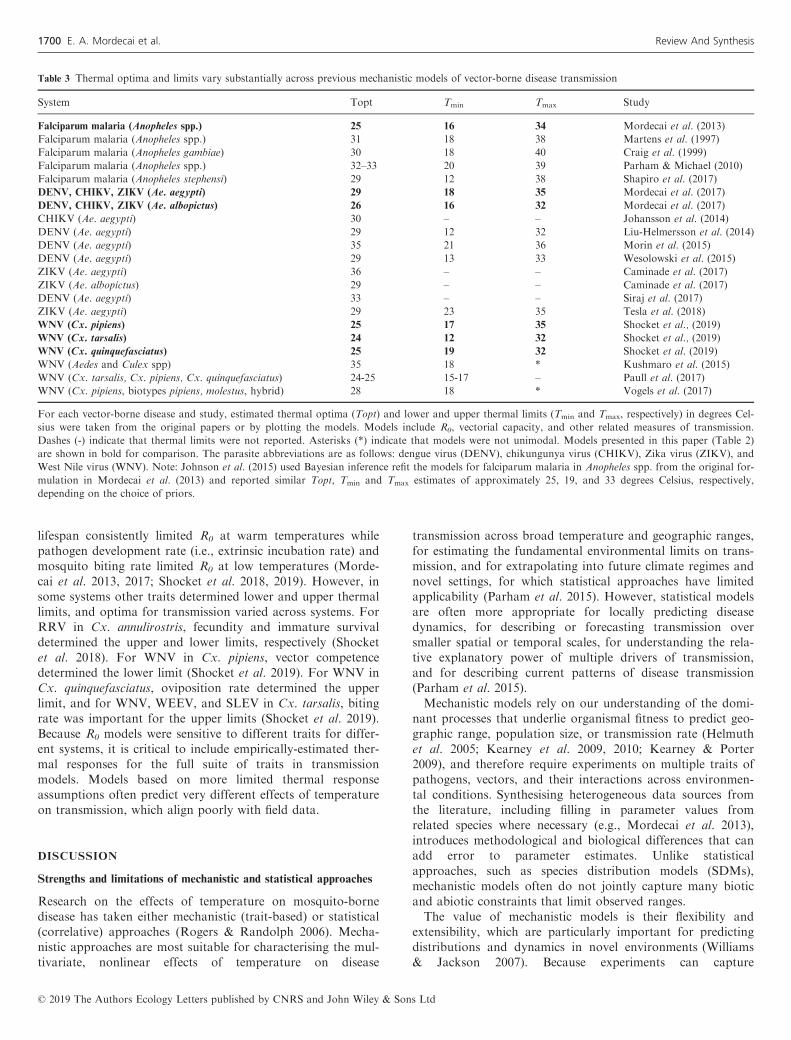
Table 3 Thermal optima and limits vary substantially across previous mechanistic models of vector-borne disease transmission
System Topt Tmin Tmax Study
Falciparum malaria (Anopheles spp.) 25 16 34 Mordecai et al. (2013)
Falciparum malaria (Anopheles spp.) 31 18 38 Martens et al. (1997)
Falciparum malaria (Anopheles gambiae) 30 18 40 Craig et al. (1999)
Falciparum malaria (Anopheles spp.) 32–33 20 39 Parham & Michael (2010)
Falciparum malaria (Anopheles stephensi) 29 12 38 Shapiro et al. (2017)
DENV, CHIKV, ZIKV (Ae. aegypti) 29 18 35 Mordecai et al. (2017)
DENV, CHIKV, ZIKV (Ae. albopictus) 26 16 32 Mordecai et al. (2017)
CHIKV (Ae. aegypti) 30 – – Johansson et al. (2014)
DENV (Ae. aegypti) 29 12 32 Liu-Helmersson et al. (2014)
DENV (Ae. aegypti) 35 21 36 Morin et al. (2015)
DENV (Ae. aegypti) 29 13 33 Wesolowski et al. (2015)
ZIKV (Ae. aegypti) 36 – – Caminade et al. (2017)
ZIKV (Ae. albopictus) 29 – – Caminade et al. (2017)
DENV (Ae. aegypti) 33 – – Siraj et al. (2017)
ZIKV (Ae. aegypti) 29 23 35 Tesla et al. (2018)
WNV (Cx. pipiens) 25 17 35 Shocket et al., (2019)
WNV (Cx. tarsalis) 24 12 32 Shocket et al., (2019)
WNV (Cx. quinquefasciatus) 25 19 32 Shocket et al. (2019)
WNV (Aedes and Culex spp) 35 18 * Kushmaro et al. (2015)
WNV (Cx. tarsalis, Cx. pipiens, Cx. quinquefasciatus) 24-25 15-17 – Paull et al. (2017)
WNV (Cx. pipiens, biotypes pipiens, molestus, hybrid) 28 18 * Vogels et al. (2017)
For each vector-borne disease and study, estimated thermal optima (Topt) and lower and upper thermal limits (Tmin and Tmax, respectively) in degrees Cel-
sius were taken from the original papers or by plotting the models. Models include R0, vectorial capacity, and other related measures of transmission.
Dashes (-) indicate that thermal limits were not reported. Asterisks (*) indicate that models were not unimodal. Models presented in this paper (Table 2)
are shown in bold for comparison. The parasite abbreviations are as follows: dengue virus (DENV), chikungunya virus (CHIKV), Zika virus (ZIKV), and
West Nile virus (WNV). Note: Johnson et al. (2015) used Bayesian inference refit the models for falciparum malaria in Anopheles spp. from the original for-
mulation in Mordecai et al. (2013) and reported similar Topt, Tmin and Tmax estimates of approximately 25, 19, and 33 degrees Celsius, respectively,
depending on the choice of priors.
© 2019 The Authors Ecology Letters published by CNRS and John Wiley & Sons Ltd
1700 E. A. Mordecai et al. Review And Synthesis
mechanistic responses to both current and anticipated climatic
conditions, they are more appropriate than SDMs for predict-
ing species responses to novel or non-equilibrium contexts,
such as climate change (Helmuth et al. 2005; Kearney & Por-
ter 2009). Moreover, many statistical models have several key
limitations: limited geographic and/or temporal extent
(Table S2), limited capacity to separate effects of multiple
interacting and covarying environmental, population, and
behavioural factors, and the assumption that the processes
currently limiting ranges have set range limits in the past and
will continue to do so in the future, despite entering unprece-
dented regimes of climate, population movement, and inter-
ventions. Direct comparisons of statistical and mechanistic
models revealed that they performed similarly at predicting
current distributions, but predicted differential responses of
species to a uniform warming (Buckley et al. 2010).
These approaches are complementary because of their dif-
fering strengths, applications, and data requirements (Parham
et al. 2015). Thermal biology principles that govern mosquito-
borne disease transmission – i.e., that temperature, and there-
fore climate change, has nonlinear effects on multiple traits
and on transmission as a whole – apply to both mechanistic
and statistical approaches.
Comparing our results with other mechanistic models
The assumption that warmer, wetter conditions universally
promote mosquito-borne disease is pervasive in the literature
(Ermert et al. 2012; Morin et al. 2015; Caminade et al. 2017;
Thomson et al. 2017). Yet our trait-based work (Figs 2–5) has
highlighted the importance of applying rigorous thermal biol-
ogy in mosquito-borne disease models to accurately estimate
nonlinear effects of temperature. Many models assume that
only mosquito longevity, extrinsic incubation period, and
sometimes biting rate are temperature-sensitive, measure either
temperature-dependent vector competence or extrinsic incuba-
tion period but not both, and/or assume monotonic thermal
responses that do not account for unimodal effects of temper-
ature (e.g. Martens et al. 1997; Craig et al. 1999; Fros et al.
2015; Morin et al. 2015; Perkins et al. 2016; Vogels et al.
2016; Paull et al. 2017; Siraj et al. 2017). Even when they pre-
dict that the effects of temperature on transmission are uni-
modal overall, these models with limited thermal biology
often predict very different thermal optima and limits for
transmission than models that include the full suite of nonlin-
ear trait thermal responses (Table 3).
For falciparum malaria, our published R0 model predicted a
suitable temperature range of 17–34�C and an optimum of
25�C (Mordecai et al. 2013; Johnson et al. 2015), while earlier
models with more limited thermal biology assumptions pre-
dicted 3–15�C wider temperature ranges and 5–7�C higher
optimal temperatures (Table 3) (Martens et al. 1997; Craig
et al. 1999; Parham & Michael 2010). Independent field data
on the number of malaria-infectious mosquitoes per person
per year (entomological inoculation rate; EIR) across Africa
strongly support our predicted optimum of 25�C and declines
in transmission above 28�C, providing little support for previ-
ous predictions (Fig. S1) (Mordecai et al. 2013). Similarly, for
dengue, chikungunya, and Zika viruses in Ae. aegypti,
previous models with more limited thermal biology assump-
tions predicted thermal optima for transmission up to 6�C
higher than our published R0 model, which peaked at 29�C
(Table 3) (Johansson et al. 2014; Liu-Helmersson et al. 2014;
Morin et al. 2015; Wesolowski et al. 2015; Caminade et al.
2017; Siraj et al. 2017). We found a strong positive relation-
ship between predicted temperature-dependent R0 and human
incidence of dengue (> 85% accuracy) and chikungunya and
Zika (> 66% accuracy) across the Americas in 2014–2016
(Fig. S2) (Mordecai et al. 2017). From a more recently pub-
lished version of our Ae. aegypti R0 model updated with Zika-
specific traits (which also peaked at 29�C), 71.5% of cases in
Colombia fell within municipalities with 1–12 months of pre-
dicted temperature suitability (mismatches were often due to
spatial grain of the data), strongly supporting our predicted
relationship (Tesla et al. 2018). Finally, for West Nile virus,
previous models predicted thermal optima up to 11�C higher
than our predicted optima of 24–25�C (Table 3) (Kushmaro
et al. 2015; Paull et al. 2017; Vogels et al. 2017), which
matched the unimodal thermal response of human neuroinva-
sive West Nile incidence that also peaked at 24�C (Fig. S3;
Shocket et al. 2019).
Together, these examples illustrate the importance of both
accurately incorporating a full suite of empirically derived,
nonlinear trait thermal responses into mechanistic models and
validating the models against field data. Other published
mechanistic models did not directly report the inferred rela-
tionship between temperature and transmission nor validate
the relationship with independent field data (e.g., Brady et al.
2014; Perkins et al. 2016; Li et al. 2019), making model com-
parison difficult.
Model validation
Connecting mechanistic model predictions to independent field
data – model validation – is critical for comparing different
models and for assessing their applicability in the field (Hoo-
ten & Hobbs 2015). Although several potential approaches
exist, including simulating data from mechanistic models to
compare with observed vector abundance or case incidence
(e.g., Morin et al. 2015; Kramer et al. 2016), or testing the
accuracy of models fit to a training dataset when predicting a
separate testing dataset (e.g. Smith et al. 2007a; Ren et al.
2016), few studies have applied existing methods to validate
vector-borne disease models (but see Tompkins & Ermert
2013; Wesolowski et al. 2015).
Several challenges have limited model validation (Table 1).
First, the relationship between R0 and incidence of human
cases – the most commonly available data for validation – is
nonlinear (Smith et al. 2007b), so their similarity may be diffi-
cult to assess. Second, in local time series data, temperature
ranges may cover only a subset of globally relevant tempera-
tures and covary with other environmental factors, but
larger-scale datasets that span a wider range of temperatures
introduce error from spatial aggregation and confounding
variation in other factors that affect transmission. Third,
because environmental drivers affect transmission at varying
time lags, the time scales on which to compare temperature
and transmission are not obvious. Validation of mechanistic
© 2019 The Authors Ecology Letters published by CNRS and John Wiley & Sons Ltd
Review And Synthesis Temperature and mosquito-borne disease 1701

temperature-dependent transmission models therefore remains
a critical gap in theory, statistical approaches, and data avail-
ability (Table 1).
In light of these challenges, we have taken several approaches
to validating mechanistic models, depending on the type and
scale of data available. First, we graphically compared pre-
dicted temperature-dependent R0 with entomological inocula-
tion rate (EIR, a metric closely related to R0 (Smith et al.
2007b)) for malaria plotted against average transmission sea-
son temperature from data spanning 30 years across Africa
(Hay et al. 2000). We showed that the maximum EIR within
data subsets binned by temperature were closely correlated
with predicted R0, though EIR varied greatly within tempera-
ture bins (Fig. S1) (Mordecai et al. 2013). With incidence data,
we graphically compared seasonal and geographical patterns
with predicted temperature-dependent R0. Ross River virus
incidence in Australia from 1992 to 2013 closely aligned with
predicted average seasonal temperature-dependent R0 across
cities weighted by population size, with a 2-month lag (Fig. S4)
(Shocket et al. 2018). As described above, our mechanistic
model predictions corresponded closely with monthly county-
level West Nile neuroinvasive disease incidence in the US from
2001 to 2016 (Fig. S3) (Shocket et al. 2019), weekly dengue,
chikungunya, and Zika incidence across countries in the Amer-
icas from 2014 to 2016 (Fig. S2) (Mordecai et al. 2017), and
Zika occurrence across municipalities in Colombia from 2015
to 2017 (Tesla et al. 2018). Together, this diverse set of field
data and approaches shows that temperature-dependent R0 is
often strongly associated with observed patterns of disease,
despite the known limitations of the models and data.
Comparison with previous statistical models
In contrast to mechanistic models, statistical models have
directly inferred relationships between climate and vector
abundance, occurrence, or disease incidence from field data at
local, regional, and global scales. In particular, species distri-
bution models (SDMs) use statistical analyses of geographic
records of vector or disease occurrence and climate and other
environmental covariates to predict species geographic distri-
butions and their ecological determinants (Table S2). These
methods are appealing because they can infer current climate
relationships using presence-only data from health depart-
ments or surveillance records, along with remotely sensed or
ground-based climate data.
Most SDMs for vectors and vector-borne diseases find at
least one aspect of temperature (e.g., mean, range, variability)
to be an important predictor of occurrence (Table S2). Differ-
ences among models may arise because of the difficulty of
inferring nonlinear, dynamic effects of temperature in noisy
data and the limited range of environmental conditions repre-
sented in many studies. Direct model comparison with mecha-
nistic models is not feasible because most SDMs do not
directly report either the inferred relationships between cli-
mate variables and probability of occurrence or the occur-
rence probabilities as spatially explicit datasets. This is an
important problem because individual SDMs are often diffi-
cult to reproduce, externally validate, or apply to new
research settings. Without such improvements (Qiao et al.
2016; Sloyer et al. 2019), the majority of published SDMs
cannot contribute substantially to our understanding of the
drivers and projected changes in vector-borne disease trans-
mission. Recent efforts in model comparison and ensemble
modelling for mosquito-borne disease (Yamana et al. 2016;
Little et al. 2017; Carlson et al. 2018) highlight how multi-
model synthesis can move the field forward when model
assumptions and results are transparent and reproducible.
Nonetheless, SDMs provide evidence that temperature is a
strong statistical predictor of the occurrence of vector-borne
diseases and vectors, supporting principles from vector ther-
mal biology.
Evidence of unimodal temperature responses in the field
A key principle of thermal biology, supported by mechanistic
models (Fig. 2), is that the effects of temperature on mos-
quito-borne disease transmission are unimodal. This implies
that relationships observed across more limited temperature
ranges are expected to range from negative to positive to null.
Field-based empirical support for positive temperature – dis-
ease relationships is widespread (e.g., Alonso et al. 2011;
Mena et al. 2011; Stewart-Ibarra & Lowe 2013; Siraj et al.
2014; Lowe et al. 2018), but support for unimodal responses
or declines at high temperatures is more limited. However,
emerging field evidence supports unimodal relationships with
temperature, including declines at high temperatures, for den-
gue incidence and Aedes aegypti abundance in Colombia
(Pe~na-Garc�ıa et al. 2016, 2017), for chikungunya incidence in
the Americas (Perkins et al. 2015), for malaria incidence in
Kenya and across Africa (Mordecai et al. in review; Shah
et al. in press), for West Nile disease in the United States
(Fig. S3; Shocket et al. 2019), and for the vectors of malaria,
dengue, chikungunya, yellow fever, Zika, leishmaniasis, and
Chagas disease in Ecuador (Escobar et al. 2016). Ambiguous
or spatially variable relationships between temperature and
incidence (e.g., for Ross River virus, Gatton et al. 2005;
Bi et al. 2009; Hu et al. 2010; Werner et al. 2012; Koolhof
et al. 2017) may be explained by unimodal thermal responses.
In other cases, for example, for malaria in sub-Saharan
Africa, effects of climate are attributed to temperature in
cooler, highland areas and to drought in warm, semi-arid
regions, without recognising that high temperatures alone
could limit transmission (Ermert et al. 2012; Thomson et al.
2017). However, recent work has shown negative effects of
locally high temperatures on urban malaria transmission in a
semi-arid city in India (Santos-Vega et al. 2019). Mechanistic
temperature-based models are important for predicting effects
on disease when climate change alters the covariation among
temperature, humidity, rainfall, and drought. We find growing
support for unimodal relationships between mosquito-borne
disease and temperature in the field from the few studies that
have investigated nonlinear responses, supporting thermal
biology principles and mechanistic model predictions (Fig. 2).
Implications and predictions for climate change
Our synthesis of previous research on the effects of tempera-
ture on mosquito-borne disease transmission provides a clear
© 2019 The Authors Ecology Letters published by CNRS and John Wiley & Sons Ltd
1702 E. A. Mordecai et al. Review And Synthesis
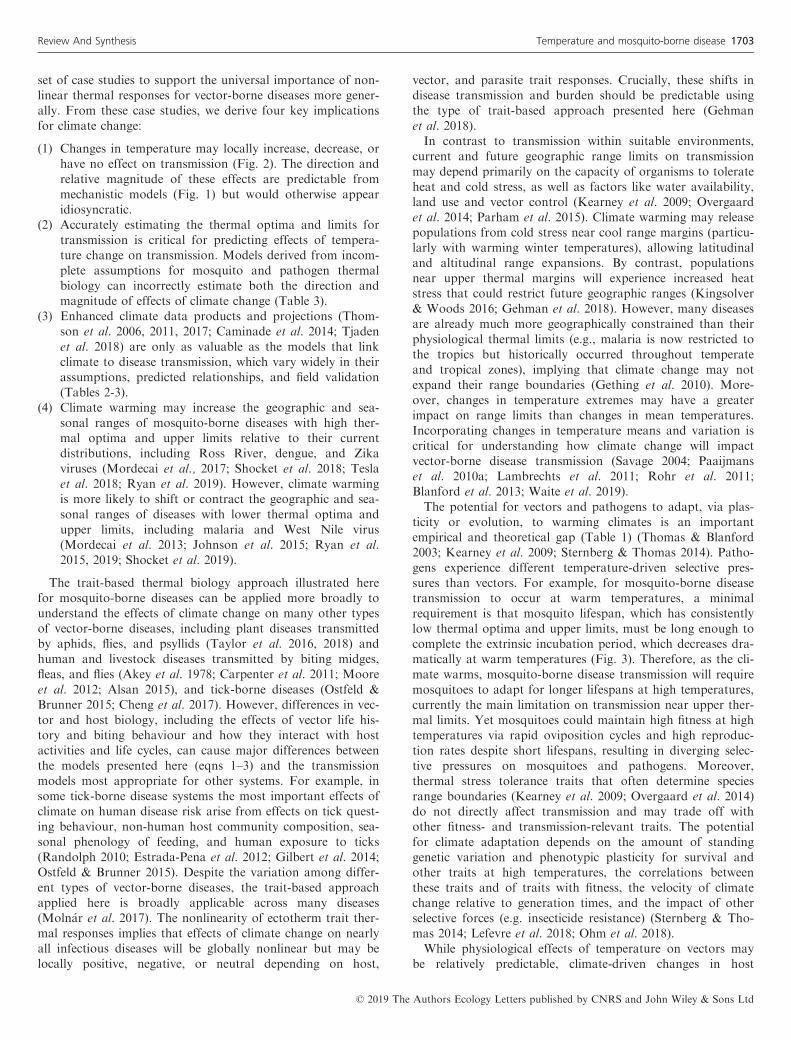
set of case studies to support the universal importance of non-
linear thermal responses for vector-borne diseases more gener-
ally. From these case studies, we derive four key implications
for climate change:
(1) Changes in temperature may locally increase, decrease, or
have no effect on transmission (Fig. 2). The direction and
relative magnitude of these effects are predictable from
mechanistic models (Fig. 1) but would otherwise appear
idiosyncratic.
(2) Accurately estimating the thermal optima and limits for
transmission is critical for predicting effects of tempera-
ture change on transmission. Models derived from incom-
plete assumptions for mosquito and pathogen thermal
biology can incorrectly estimate both the direction and
magnitude of effects of climate change (Table 3).
(3) Enhanced climate data products and projections (Thom-
son et al. 2006, 2011, 2017; Caminade et al. 2014; Tjaden
et al. 2018) are only as valuable as the models that link
climate to disease transmission, which vary widely in their
assumptions, predicted relationships, and field validation
(Tables 2-3).
(4) Climate warming may increase the geographic and sea-
sonal ranges of mosquito-borne diseases with high ther-
mal optima and upper limits relative to their current
distributions, including Ross River, dengue, and Zika
viruses (Mordecai et al., 2017; Shocket et al. 2018; Tesla
et al. 2018; Ryan et al. 2019). However, climate warming
is more likely to shift or contract the geographic and sea-
sonal ranges of diseases with lower thermal optima and
upper limits, including malaria and West Nile virus
(Mordecai et al. 2013; Johnson et al. 2015; Ryan et al.
2015, 2019; Shocket et al. 2019).
The trait-based thermal biology approach illustrated here
for mosquito-borne diseases can be applied more broadly to
understand the effects of climate change on many other types
of vector-borne diseases, including plant diseases transmitted
by aphids, flies, and psyllids (Taylor et al. 2016, 2018) and
human and livestock diseases transmitted by biting midges,
fleas, and flies (Akey et al. 1978; Carpenter et al. 2011; Moore
et al. 2012; Alsan 2015), and tick-borne diseases (Ostfeld &
Brunner 2015; Cheng et al. 2017). However, differences in vec-
tor and host biology, including the effects of vector life his-
tory and biting behaviour and how they interact with host
activities and life cycles, can cause major differences between
the models presented here (eqns 1–3) and the transmission
models most appropriate for other systems. For example, in
some tick-borne disease systems the most important effects of
climate on human disease risk arise from effects on tick quest-
ing behaviour, non-human host community composition, sea-
sonal phenology of feeding, and human exposure to ticks
(Randolph 2010; Estrada-Pena et al. 2012; Gilbert et al. 2014;
Ostfeld & Brunner 2015). Despite the variation among differ-
ent types of vector-borne diseases, the trait-based approach
applied here is broadly applicable across many diseases
(Moln�ar et al. 2017). The nonlinearity of ectotherm trait ther-
mal responses implies that effects of climate change on nearly
all infectious diseases will be globally nonlinear but may be
locally positive, negative, or neutral depending on host,
vector, and parasite trait responses. Crucially, these shifts in
disease transmission and burden should be predictable using
the type of trait-based approach presented here (Gehman
et al. 2018).
In contrast to transmission within suitable environments,
current and future geographic range limits on transmission
may depend primarily on the capacity of organisms to tolerate
heat and cold stress, as well as factors like water availability,
land use and vector control (Kearney et al. 2009; Overgaard
et al. 2014; Parham et al. 2015). Climate warming may release
populations from cold stress near cool range margins (particu-
larly with warming winter temperatures), allowing latitudinal
and altitudinal range expansions. By contrast, populations
near upper thermal margins will experience increased heat
stress that could restrict future geographic ranges (Kingsolver
& Woods 2016; Gehman et al. 2018). However, many diseases
are already much more geographically constrained than their
physiological thermal limits (e.g., malaria is now restricted to
the tropics but historically occurred throughout temperate
and tropical zones), implying that climate change may not
expand their range boundaries (Gething et al. 2010). More-
over, changes in temperature extremes may have a greater
impact on range limits than changes in mean temperatures.
Incorporating changes in temperature means and variation is
critical for understanding how climate change will impact
vector-borne disease transmission (Savage 2004; Paaijmans
et al. 2010a; Lambrechts et al. 2011; Rohr et al. 2011;
Blanford et al. 2013; Waite et al. 2019).
The potential for vectors and pathogens to adapt, via plas-
ticity or evolution, to warming climates is an important
empirical and theoretical gap (Table 1) (Thomas & Blanford
2003; Kearney et al. 2009; Sternberg & Thomas 2014). Patho-
gens experience different temperature-driven selective pres-
sures than vectors. For example, for mosquito-borne disease
transmission to occur at warm temperatures, a minimal
requirement is that mosquito lifespan, which has consistently
low thermal optima and upper limits, must be long enough to
complete the extrinsic incubation period, which decreases dra-
matically at warm temperatures (Fig. 3). Therefore, as the cli-
mate warms, mosquito-borne disease transmission will require
mosquitoes to adapt for longer lifespans at high temperatures,
currently the main limitation on transmission near upper ther-
mal limits. Yet mosquitoes could maintain high fitness at high
temperatures via rapid oviposition cycles and high reproduc-
tion rates despite short lifespans, resulting in diverging selec-
tive pressures on mosquitoes and pathogens. Moreover,
thermal stress tolerance traits that often determine species
range boundaries (Kearney et al. 2009; Overgaard et al. 2014)
do not directly affect transmission and may trade off with
other fitness- and transmission-relevant traits. The potential
for climate adaptation depends on the amount of standing
genetic variation and phenotypic plasticity for survival and
other traits at high temperatures, the correlations between
these traits and of traits with fitness, the velocity of climate
change relative to generation times, and the impact of other
selective forces (e.g. insecticide resistance) (Sternberg & Tho-
mas 2014; Lefevre et al. 2018; Ohm et al. 2018).
While physiological effects of temperature on vectors may
be relatively predictable, climate-driven changes in host
© 2019 The Authors Ecology Letters published by CNRS and John Wiley & Sons Ltd
Review And Synthesis Temperature and mosquito-borne disease 1703

population size, movement, behaviour, and immunology are
much more idiosyncratic. Human populations may respond to
climate change via changes in land use and agricultural prac-
tices, housing type and density, water storage practices, sea-
sonal migration, relocation between regions, and demographic
shifts (Parham et al. 2015; Wesolowski et al. 2017), which will
inevitably vary geographically. As a result, the realised impact
of climate change on disease dynamics will depend on physio-
logical changes in vectors and pathogens as well as on beha-
vioural and demographic changes in host populations
(Parham et al. 2015; Metcalf et al. 2017; Wesolowski et al.
2017).
Although direct and indirect effects of temperature on vec-
tors, parasites and hosts have a profound effect on transmis-
sion, temperature is only one component of a complex
network of causality. Our goal is to predict conditions that
favour and disfavor transmission. By analogy, warming
oceans tend to increase the intensity of hurricanes, yet warm
oceans alone do not generate hurricanes. Likewise, steroid use
in baseball players makes hitting home runs more likely, but
steroids alone do not cause home runs. In the same way,
increasing temperature suitability does not cause disease out-
breaks, but it can increase their probability and intensity
when other necessary conditions align: it is a threat multiplier
(Department of Defense 2014).
Physiological effects of temperature on transmission predict
that cool locations and seasons are most vulnerable to warm-
ing-driven increases in vector-borne disease transmission,
while warmer regions may see climate-driven declines or sea-
sonal shifts in transmission. Urbanisation, land conversion,
and other landscape changes may act in concert with climate
to drive shifts in the burden of vector-borne disease from
cooler-adapted diseases like An. gambiae-transmitted malaria
to warmer-adapted diseases like Ae. aegypti-transmitted den-
gue, chikungunya, and Zika (Mordecai et al. in review).
Already, in the last two decades malaria has declined in
Africa (Bhatt et al. 2015) and Latin America (Carter et al.
2015), which may be attributable to interactive effects of cli-
mate and malaria control programs (Thomson et al. 2017),
while dengue and other viruses transmitted by warm-adapted
Ae. aegypti mosquitoes have risen dramatically (Mitchell
2016; Stanaway et al. 2016; PAHO WHO & | Chikungunya |
Statistic Data 2016), consistent with the combined effects of
climate, urbanisation, and declining vector control.
CONCLUSIONS
Temperature is a fundamental, complex and nonlinear driver
of vector-borne disease transmission. Its physiological effects
are consistent across a variety of ectotherm vectors and
pathogens because of the underlying constraints of ectotherm
physiology. Combining these effects into a unified trait-based
transmission framework can facilitate qualitative predictions
for the effects of climate change and comparison across sys-
tems. For any vector – pathogen system, a limited range of
temperatures permits transmission and intermediate tempera-
tures within this range are optimal. Across systems, thermal
limits and optima vary. In a changing climate, the transmis-
sion of specific diseases may experience seasonal and
geographic shifts that include declines, increases, and minimal
effects, which are predictable from trait-based models. At the
same time, because thermal limits and optima vary across vec-
tors and pathogens, the relative suitability for transmission of
different diseases is expected to change with the climate.
Finally, seasonal and inter–annual variation in temperature,
variation in rainfall and weather events, changing land use
and urbanisation, and human population changes may miti-
gate or exacerbate the influence of climate change on vector-
borne disease transmission in many settings. Integrative
research that builds on thermal physiology as a backbone and
incorporates additional drivers of vector, pathogen, and host
ecology is critical for understanding the changing ecology of
vector-borne disease.
ACKNOWLEDGEMENTS
We are grateful to Iain Caldwell, Hannah Fung, Sindiso
Nyathi and Johannah Farner for helpful feedback on the
manuscript and to Nicole Nova for manuscript feedback and
for making Fig. 1. EAM, LRJ, MN, JRR, SJR, VS, AMSI
and MBT were funded by a National Science Foundation
Ecology and Evolution of Infectious Diseases grant
(DEB-1518681). MBT was also part supported by NIH NIAID
Grant # R01AI110793. EAM and JMC were supported by the
Stanford Woods Institute for the Environment (https://woods.
stanford.edu/research/environmental-venture-projects). EAM was
supported by the Hellman Faculty Fellowship and the Terman
Fellowship.
AUTHORSHIP
EAM conceived of, designed and wrote the manuscript.
EAM, LRJ, JRR, SJR, VS, MSS, AMSI and MBT con-
tributed to model parameterisation and validation. EAM,
LRJ, MN, JRR, SJR, VS, AMSI and MBT obtained funding
for the study. All authors contributed to literature reviews in
the studies. All authors revised the manuscript and approved
of its final version.
DATA ACCESSIBILITY STATEMENT
All data used in this paper are either already published else-
where or included within the tables.
REFERENCES
Akey, D.H., Potter, H.W. & Jone, R.H. (1978). Effects of rearing
temperature and larval density on longevity, size, and fecundity in the
biting gnat Culicoides variipennis. Ann. Entomol. Soc. Am., 71, 411–
418.
Alonso, D., Bouma, M.J. & Pascual, M. (2011). Epidemic malaria and
warmer temperatures in recent decades in an East African highland.
Proc. R. Soc. B Biol. Sci., 278, 1661–1669.
Alsan, M. (2015). The effect of the TseTse fly on African development.
Am. Econ. Rev., 105, 382–410.
Amarasekare, P. & Savage, V. (2012). A framework for elucidating the
temperature dependence of fitness. Am. Nat., 179, 178–191.
Angilletta, M.J. (2009). Thermal Adaptation: A Theoretical and Empirical
Synthesis. Oxford, UK:Oxford University Press.
© 2019 The Authors Ecology Letters published by CNRS and John Wiley & Sons Ltd
1704 E. A. Mordecai et al. Review And Synthesis
Baca€er, N. & Ait Dads, E.H. (2012). On the biological interpretation of a
definition for the parameter R 0 in periodic population models. J.
Math. Biol., 65, 601–621.
Baca€er, N. & Guernaoui, S. (2006). The epidemic threshold of vector-
borne diseases with seasonality. J. Math. Biol., 53, 421–436.
Bayoh, M.N. (2001). Studies on the development and survival of
anopheles gambiae sensu stricto at various temperatures and relative
humidities. Durham University, Doctoral.
Bernhardt, J.R., Sunday, J.M., Thompson, P.L. & O’Connor, M.I.
(2018). Nonlinear averaging of thermal experience predicts population
growth rates in a thermally variable environment. Proc R Soc B, 285,
20181076.
Bhatt, S., Weiss, D.J., Cameron, E., Bisanzio, D., Mappin, B.,
Dalrymple, U., et al. (2015). The effect of malaria control on
Plasmodium falciparum in Africa between 2000 and 2015. Nature, 526,
207–211.
Bi, P., Hiller, J.E., Cameron, A.S., Zhang, Y. & Givney, R. (2009).
Climate variability and Ross River virus infections in Riverland, South
Australia, 1992–2004. Epidemiol. Infect., 137, 1486–1493.
Blanford, J.I., Blanford, S., Crane, R.G., Mann, M.E., Paaijmans, K.P.,
Schreiber, K.V., et al. (2013). Implications of temperature variation for
malaria parasite development across Africa. Sci. Rep., 3, 1300.
Brady, O.J., Golding, N., Pigott, D.M., Kraemer, M.U.G., Messina, J.P.,
Reiner, R.C. Jr., et al. (2014). Global temperature constraints on Aedes
aegypti and Ae. albopictus persistence and competence for dengue virus
transmission. Parasit. Vectors, 7, 338.
Briere, J.-F., Pracros, P., Le Roux, A.-Y. & Pierre, J.-S. (1999). A novel
rate model of temperature-dependent development for arthropods.
Environ. Entomol., 28, 22–29.
Brown, J.H., Gillooly, J.F., Allen, A.P., Savage, V.M. & West, G.B.
(2004). Toward a metabolic theory of ecology. Ecology, 85, 1771–1789.
Buckley, L.B., Urban, M.C., Angilletta, M.J., Crozier, L.G., Rissler, L.J.
& Sears, M.W. (2010). Can mechanism inform species’ distribution
models? Ecol. Lett., 13, 1041–1054.
Caminade, C., Kovats, S., Rocklov, J., Tompkins, A.M., Morse, A.P.,
Col�on-Gonz�alez, F.J., et al. (2014). Impact of climate change on global
malaria distribution. Proc. Natl Acad. Sci., 111, 3286–3291.
Caminade, C., Turner, J., Metelmann, S., Hesson, J.C., Blagrove, M.S.C.,
Solomon, T., et al. (2017). Global risk model for vector-borne
transmission of Zika virus reveals the role of El Ni~no 2015. Proc. Natl
Acad. Sci., 114, 119–124.
Carlson, C.J., Dougherty, E., Boots, M., Getz, W. & Ryan, S.J. (2018).
Consensus and conflict among ecological forecasts of Zika virus
outbreaks in the United States. Sci. Rep., 8, 4921.
Carpenter, S., Wilson, A., Barber, J., Veronesi, E., Mellor, P., Venter, G.,
et al. (2011). Temperature dependence of the extrinsic incubation
period of orbiviruses in Culicoides biting midges. PLoS ONE, 6,
e27987.
Carter, K.H., Singh, P., Mujica, O.J., Escalada, R.P., Ade, M.P.,
Castellanos, L.G., et al. (2015). Malaria in the Americas: trends from
1959 to 2011. Am. J. Trop. Med. Hyg., 92, 302–316.
Cator, L., Johnson, L.R., Mordecai, E.A., Moustaid, F.E., Smallwood,
T., Deau, S.L., et al. (2019). More than a flying syringe: using
functional traits in vector borne disease research. bioRxiv, 501320.
Cheng, A., Chen, D., Woodstock, K., Ogden, N.H., Wu, X. & Wu, J.
(2017). Analyzing the potential risk of climate change on lyme disease
in eastern ontario, Canada using time series remotely sensed
temperature data and tick population modelling. Remote Sens., 9, 609.
Cohen, J.M., Civitello, D.J., Brace, A.J., Feichtinger, E.M., Ortega, C.N.,
Richardson, J.C., et al. (2016). Spatial scale modulates the strength of
ecological processes driving disease distributions. Proc. Natl Acad. Sci.,
113, E3359–E3364. 201521657
Cohen, J.M., Civitello, D.J., Venesky, M.D., McMahon, T.A. & Rohr, J.R.
(2019). An interaction between climate change and infectious disease
drove widespread amphibian declines.Glob. Change Biol., 25, 927–937.
Cox, F.E. (2010). History of the discovery of the malaria parasites and
their vectors. Parasit. Vectors, 3, 5.
Craig, M.H., Snow, R.W. & le Sueur, D. (1999). A climate-based
distribution model of malaria transmission in sub-saharan Africa.
Parasitol. Today, 15, 105–111.
Dell, A.I., Pawar, S. & Savage, V.M. (2011). Systematic variation in the
temperature dependence of physiological and ecological traits. Proc.
Natl. Acad. Sci., 108, 10591–10596.
Department of Defense (2014). Quadrennial Defense Review 2014. United
States Department of Defense, Washington D.C.
Deutsch, C.A., Tewksbury, J.J., Huey, R.B., Sheldon, K.S., Ghalambor,
C.K., Haak, D.C., et al. (2008). Impacts of climate warming on
terrestrial ectotherms across latitude. Proc. Natl Acad. Sci., 105, 6668–
6672.
Diekmann, O., Heesterbeek, J.A.P. & Roberts, M.G. (2009). The
construction of next-generation matrices for compartmental epidemic
models. J. R. Soc. Interface, 7, 873–885.
Dietz, K. (1993). The estimation of the basic reproduction number for
infectious diseases. Stat. Methods Med. Res., 2, 23–41.
Duffy, M.R., Chen, T.-H., Hancock, W.T., Powers, A.M., Kool, J.L.,
Lanciotti, R.S., et al. (2009). Zika virus outbreak on yap Island,
federated states of micronesia. N. Engl. J. Med., 360, 2536–2543.
Ermert, V., Fink, A.H., Morse, A.P. & Paeth, H. (2012). The impact of
regional climate change on malaria risk due to greenhouse forcing and
land-use changes in tropical Africa. Environ. Health Perspect., 120, 77–
84.
Escobar, L.E., Romero-Alvarez, D., Leon, R., Lepe-Lopez, M.A., Craft,
M.E., Borbor-Cordova, M.J., et al. (2016). Declining Prevalence of
Disease Vectors Under Climate Change. Sci. Rep., 6, 39150.
Estrada-Pe~na, A., Ayllon, N. & De La Fuente, J. (2012). Impact of
climate trends on tick-borne pathogen transmission. Front. Physiol., 3,
64.
Fros, J.J., Geertsema, C., Vogels, C.B., Roosjen, P.P., Failloux, A.-B.,
Vlak, J.M., et al. (2015). West nile virus: High transmission rate in
North-Western European mosquitoes indicates Its epidemic potential
and warrants increased surveillance. PLoS Negl. Trop. Dis., 9,
e0003956.
Gatton, M.L., Kay, B.H. & Ryan, P.A. (2005). Environmental predictors
of Ross River virus disease outbreaks in Queensland. Australia. Am. J.
Trop. Med. Hyg., 72, 792–799.
Gehman, A.-L.M., Hall, R.J. & Byers, J.E. (2018). Host and parasite
thermal ecology jointly determine the effect of climate warming on
epidemic dynamics. Proc. Natl Acad. Sci, 115, 744–749.
Gething, P.W., Smith, D.L., Patil, A.P., Tatem, A.J., Snow, R.W. & Hay,
S.I. (2010). Climate change and the global malaria recession. Nature,
465, 342–345.
Gilbert, L., Aungier, J. & Tomkins, J.L. (2014). Climate of origin affects
tick (Ixodes ricinus) host-seeking behavior in response to temperature:
implications for resilience to climate change? Ecol. Evol., 4, 1186–1198.
Hay, S.I., Rogers, D.J., Toomer, J.F. & Snow, R.W. (2000). Annual
Plasmodium falciparum entomological inoculation rates (EIR) across
Africa: literature survey, internet access and review. Trans. R. Soc.
Trop. Med. Hyg., 94, 113–127.
Hechinger, R.F. (2013). A metabolic and body-size scaling framework for
parasite within-host abundance, biomass, and energy flux. Am. Nat.,
182, 234–248.
Heesterbeek, J.A.P, (2002). A brief history of R0 and a recipe for its
calculation. Acta Biotheor., 50, 189–204.
Heffernan, J.M., Smith, R.J. & Wahl, L.M. (2005). Perspectives on the
basic reproductive ratio. J. R. Soc. Interface, 2, 281–293.
Helmuth, B., Kingsolver, J.G. & Carrington, E. (2005). Biophysics,
physiological ecology, and climate change: does Mechanism Matter?
Annu. Rev. Physiol., 67, 177–201.
Hooten, M.B. & Hobbs, N.T. (2015). A guide to Bayesian model
selection for ecologists. Ecol. Monogr., 85, 3–28.
Hu, W., Clements, A., Williams, G., Tong, S. & Mengersen, K. (2010).
Bayesian spatiotemporal analysis of socio-ecologic drivers of ross River
virus transmission in queensland. Australia. Am. J. Trop. Med. Hyg.,
83, 722–728.
© 2019 The Authors Ecology Letters published by CNRS and John Wiley & Sons Ltd
Review And Synthesis Temperature and mosquito-borne disease 1705
Huber, J.H., Johnston, G.L., Greenhouse, B., Smith, D.L. & Perkins,
T.A. (2016). Quantitative, model-based estimates of variability in the
generation and serial intervals of Plasmodium falciparum malaria.
Malar. J., 15, 490.
Huber, J.H., Childs, M.L., Caldwell, J.M. & Mordecai, E.A. (2018).
Seasonal temperature variation influences climate suitability for dengue,
chikungunya, and Zika transmission. PLoS Negl. Trop. Dis., 12,
e0006451.
Huey, R.B. & Berrigan, D. (2001). Temperature, demography, and
ectotherm fitness. Am. Nat., 158, 204–210.
Huey, R.B. & Kingsolver, J.G. (2011). Variation in universal temperature
dependence of biological rates. Proc. Natl Acad. Sci., 108, 10377–
10378.
Jaramillo-Ochoa, R., Sippy, R., Farrell, D.F., Cueva-Aponte, C., Beltr�an-
Ayala, E., Gonzaga, J.L., et al. (2019). Effects of political instability in
Venezuela on malaria resurgence at ecuador-peru border, 2018. Emerg.
Infect. Dis., 25, 834–836.
Johansson, M.A., Powers, A.M., Pesik, N., Cohen, N.J. & Staples, J.E.
(2014). Nowcasting the spread of chikungunya virus in the Americas.
PLoS ONE, 9, e104915.
Johnson, F.H. & Lewin, I. (1946). The growth rate of E. coli in relation
to temperature, quinine and coenzyme. J. Cell. Comp. Physiol., 28, 47–
75.
Johnson, L.R., Ben-Horin, T., Lafferty, K.D., McNally, A., Mordecai,
E., Paaijmans, K.P., et al. (2015). Understanding uncertainty in
temperature effects on vector-borne disease: a Bayesian approach.
Ecology, 96, 203–213.
Kearney, M. & Porter, W. (2009). Mechanistic niche modelling:
combining physiological and spatial data to predict species’ ranges.
Ecol. Lett., 12, 334–350.
Kearney, M., Porter, W.P., Williams, C., Ritchie, S. & Hoffmann, A.A.
(2009). Integrating biophysical models and evolutionary theory to
predict climatic impacts on species’ ranges: the dengue mosquito Aedes
aegypti in Australia. Funct. Ecol., 23, 528–538.
Kearney, M., Simpson, S.J., Raubenheimer, D. & Helmuth, B. (2010).
Modelling the ecological niche from functional traits. Philos. Trans. R.
Soc. B Biol. Sci., 365, 3469–3483.
Kingsolver, J.G. (2009). The well-temperatured biologist: (American
Society of Naturalists Presidential Address). Am. Nat., 174, 755–768.
Kingsolver, J.G. & Woods, H.A. (2016). Beyond thermal performance
curves: Modeling time-dependent effects of thermal stress on ectotherm
growth rates. Am. Nat., 187, 283–294.
Kirk, D., Jones, N., Peacock, S., Phillips, J., Moln�ar, P.K., Krko�sek, M.,
et al. (2018). Empirical evidence that metabolic theory describes the
temperature dependency of within-host parasite dynamics. PLOS Biol.,
16, e2004608.
Kirk, D., Luijckx, P., Stanic, A. & Krko�sek, M. (2019). Predicting the
thermal and allometric dependencies of disease transmission via the
metabolic theory of ecology. Am. Nat., 193, 661–676.
Koolhof, I.S., Bettiol, S. & Carver, S. (2017). Fine-temporal forecasting
of outbreak probability and severity: Ross River virus in Western
Australia. Epidemiol. Infect., 145, 2949–2960.
Kramer, A.M., Pulliam, J.T., Alexander, L.W., Park, A.W., Rohani, P. &
Drake, J.M. (2016). Spatial spread of the West Africa Ebola epidemic.
R. Soc. Open Sci., 3, 160294.
Krisher, L.K., Krisher, J., Ambuludi, M., Arichabala, A., Beltr�an-Ayala,
E., Navarrete, P., et al. (2016). Successful malaria elimination in the
Ecuador-Peru border region: epidemiology and lessons learned. Malar.
J., 15, 573.
Kushmaro, A., Awerbuch-Friedlander, T. & Levins, R. (2015).
Temperature effects on the basic reporudctive number (R0) of West
Nile virus, based on ecological parameters: Endemic vs. new emergence
regions. J. Trop., Dis, S1–001.
Lafferty, K.D. (2009). The ecology of climate change and infectious
diseases. Ecology, 90, 888–900.
Lambrechts, L., Paaijmans, K.P., Fansiri, T., Carrington, L.B., Kramer,
L.D., Thomas, M.B., et al. (2011). Impact of daily temperature
fluctuations on dengue virus transmission by Aedes aegypti. Proc. Natl
Acad. Sci., 108, 7460–7465.
Lefevre, T., Ohm, J., Dabir�e, K.R., Cohuet, A., Choisy, M., Thomas,
M.B., et al. (2018). Transmission traits of malaria parasites within the
mosquito: Genetic variation, phenotypic plasticity, and consequences
for control. Evol. Appl., 11, 456–469.
Li, R., Xu, L., Bjørnstad, O.N., Liu, K., Song, T., Chen, A., et al. (2019).
Climate-driven variation in mosquito density predicts the
spatiotemporal dynamics of dengue. Proc. Natl Acad. Sci., 116, 3624–
3629.
Little, E., Bajwa, W. & Shaman, J. (2017). Local environmental and
meteorological conditions influencing the invasive mosquito Ae.
albopictus and arbovirus transmission risk in New York City. PLoS
Negl. Trop. Dis., 11, e0005828.
Liu-Helmersson, J., Stenlund, H., Wilder-Smith, A. & Rockl€ov, J. (2014).
Vectorial capacity of Aedes aegypti: effects of temperature and
implications for global dengue epidemic potential. PLoS ONE, 9,
e89783.
Loarie, S.R., Duffy, P.B., Hamilton, H., Asner, G.P., Field, C.B. &
Ackerly, D.D. (2009). The velocity of climate change. Nature, 462,
1052–1055.
Lowe, R., Gasparrini, A., Meerbeeck, C.J.V., Lippi, C.A., Mahon, R.,
Trotman, A.R., et al. (2018). Nonlinear and delayed impacts of climate
on dengue risk in Barbados: A modelling study. PLoS Med., 15,
e1002613.
Martens, W.J.M., Jetten, T.H. & Focks, D.A. (1997). Sensitivity of
malaria, schistosomiasis and dengue to global warming. Clim. Change,
35, 145–156.
Martin, T.L. & Huey, R.B. (2008). Why “Suboptimal” Is optimal:
Jensen’s inequality and ectotherm thermal preferences. Am. Nat., 171,
E102–E118.
Mena, N., Troyo, A., Bonilla-Carri�on, R. & Calder�on-Arguedas, �O.
(2011). Factores asociados con la incidencia de dengue en Costa Rica.
Rev. Panam. Salud P�ublica, 29, 234–242.
Metcalf, C.J.E., Walter, K.S., Wesolowski, A., Buckee, C.O.,
Shevliakova, E., Tatem, A.J., et al. (2017). Identifying climate drivers
of infectious disease dynamics: recent advances and challenges ahead.
Proc R Soc B, 284, 20170901.
Mitchell, C. (2016). PAHO WHO | PAHO Statement on Zika Virus
Transmission and Prevention. Pan Am. Health Organ. World Health
Organ. Available at: http://www.paho.org/hq/index.php?
option=com_content&view=article&xml:id=11605&Itemxml:
id=41716&xml:lang=en. Last accessed 5 May 2016.
Moln�ar, P.K., Kutz, S.J., Hoar, B.M. & Dobson, A.P. (2013). Metabolic
approaches to understanding climate change impacts on seasonal host-
macroparasite dynamics. Ecol. Lett., 16, 9–21.
Moln�ar, P.K., Sckrabulis, J.P., Altman, K.A. & Raffel, T.R. (2017).
Thermal performance curves and the metabolic theory of ecology—a
practical guide to models and experiments for parasitologists. J.
Parasitol., 103, 423–439.
Moore, S., Shrestha, S., Tomlinson, K.W. & Vuong, H. (2012). Predicting the
effect of climate change on African trypanosomiasis: integrating epidemiology
with parasite and vector biology. J. R. Soc. Interface, 9, 817–830.
Mordecai, E.A., Ryan, S.J., Caldwell, J.M., Shah, M. & LaBeaud, A.D.
(in review). Climate change could shift disease burden from malaria to
arboviruses in Africa. Nat. Clim. Change.
Mordecai, E.A., Paaijmans, K.P., Johnson, L.R., Balzer, C.H., Ben-
Horin, T., de Moor, E., et al. (2013). Optimal temperature for malaria
transmission is dramatically lower than previously predicted. Ecol.
Lett., 16, 22–30.
Mordecai, E.A., Cohen, J.M., Evans, M.V., Gudapati, P., Johnson, L.R.,
Lippi, C.A., et al. (2017). Detecting the impact of temperature on
transmission of Zika, dengue, and chikungunya using mechanistic
models. PLoS Negl. Trop. Dis., 11, e0005568.
Morin, C.W., Monaghan, A.J., Hayden, M.H., Barrera, R. & Ernst, K.
(2015). Meteorologically driven simulations of dengue epidemics in San
Juan. PR. PLoS Negl Trop Dis, 9, e0004002.
© 2019 The Authors Ecology Letters published by CNRS and John Wiley & Sons Ltd
1706 E. A. Mordecai et al. Review And Synthesis
Murdock, C.C., Blanford, S., Luckhart, S. & Thomas, M.B. (2014).
Ambient temperature and dietary supplementation interact to shape
mosquito vector competence for malaria. J. Insect Physiol., 67, 37–44.
Murdock, C.C., Evans, M.V., McClanahan, T.D., Miazgowicz, K.L. &
Tesla, B. (2017). Fine-scale variation in microclimate across an urban
landscape shapes variation in mosquito population dynamics and the
potential of Aedes albopictus to transmit arboviral disease. PLoS Negl.
Trop. Dis., 11, e0005640.
O’Connor, M.I. & Bernhardt, J.R. (2018). The metabolic theory of
ecology and the cost of parasitism. PLOS Biol., 16, e2005628.
Ohm, J.R., Baldini, F., Barreaux, P., Lefevre, T., Lynch, P.A., Suh, E.,
et al. (2018). Rethinking the extrinsic incubation period of malaria
parasites. Parasit. Vectors, 11, 178.
Ostfeld, R.S. & Brunner, J.L. (2015). Climate change and Ixodes tick-
borne diseases of humans. Philos. Trans. R. Soc. B Biol. Sci., 370,
20140051.
Overgaard, J., Kearney, M.R. & Hoffmann, A.A. (2014). Sensitivity to
thermal extremes in Australian Drosophila implies similar impacts of
climate change on the distribution of widespread and tropical species.
Glob. Change Biol., 20, 1738–1750.
Paaijmans, K.P. & Thomas, M.B. (2011a). Health: Wealth versus
warming. Nat. Clim. Change, 1, 349–350.
Paaijmans, K.P. & Thomas, M.B. (2011b). The influence of mosquito
resting behaviour and associated microclimate for malaria risk. Malar.
J., 10, 183.
Paaijmans, K.P., Blanford, S., Bell, A.S., Blanford, J.I., Read, A.F. &
Thomas, M.B. (2010a). Influence of climate on malaria transmission
depends on daily temperature variation. Proc. Natl Acad. Sci., 107,
15135–15139.
Paaijmans, K.P., Imbahale, S.S., Thomas, M.B. & Takken, W. (2010b).
Relevant microclimate for determining the development rate of malaria
mosquitoes and possible implications of climate change. Malar. J., 9,
196.
Paaijmans, K.P., Blanford, S., Chan, B.H.K. & Thomas, M.B. (2011).
Warmer temperatures reduce the vectorial capacity of malaria
mosquitoes. Biol. Lett., 8, 465–468, rsbl20111075.
Paaijmans, K.P., Heinig, R.L., Seliga, R.A., Blanford, J.I., Blanford, S.,
Murdock, C.C., et al. (2013). Temperature variation makes ectotherms
more sensitive to climate change. Glob. Change Biol., 19, 2373–2380.
PAHO WHO & | Chikungunya | Statistic Data. (2016). Available at:
http://www.paho.org/hq/index.php?
option=com_topics&view=readall&cxml:id=5927&Itemxml:
id=40931&xml:lang=en Last accessed 10 July 2016 .
Parham, P. & Michael, E. (2010). Modeling the effects of weather and
climate change on malaria transmission. Environ. Health Perspect., 118,
620–626.
Parham, P.E., Waldock, J., Christophides, G.K., Hemming, D., Agusto,
F., Evans, K.J., et al. (2015). Climate, environmental and socio-
economic change: weighing up the balance in vector-borne disease
transmission. Biol. Sci., 370, 20130551–20130551.
Pascual, M. & Bouma, M.J. (2009). Do rising temperatures matter?
Ecology, 90, 906–912.
Pascual, M., Ahumada, J., Chaves, L., Rodo, X. & Bouma, M. (2006).
Malaria resurgence in the East African highlands: temperature trends
revisited. Proc. Natl Acad. Sci., 103, 5829–5834.
Paull, S.H., Horton, D.E., Ashfaq, M., Rastogi, D., Kramer, L.D.,
Diffenbaugh, N.S., et al. (2017). Drought and immunity determine the
intensity of West Nile virus epidemics and climate change impacts.
Proc. R. Soc. B Biol. Sci., 284, 20162078.
Pe~na-Garc�ıa, V., Triana-Ch�avez, O., Mej�ıa-Jaramillo, A., D�ıaz, F.,
G�omez-Palacio, A., Arboleda-S�anchez, S., et al. (2016). Infection rates
by dengue virus in mosquitoes and the influence of temperature may be
related to different endemicity patterns in three colombian cities. Int. J.
Environ. Res. Public. Health, 13, 734.
Pe~na-Garc�ıa, V.H., Triana-Ch�avez, O. & Arboleda-S�anchez, S. (2017).
Estimating effects of temperature on dengue transmission in colombian
cities. Ann. Glob., Health, 83, 509–518.
Perkins, T.A., Metcalf, C.J.E., Grenfell, B.T. & Tatem, A.J. (2015).
Estimating drivers of autochthonous transmission of chikungunya virus
in its invasion of the Americas. PLoS Curr., 7.
Perkins, T.A., Siraj, A.S., Ruktanonchai, C.W., Kraemer, M.U.G. &
Tatem, A.J. (2016). Model-based projections of Zika virus infections in
childbearing women in the Americas. Nat. Microbiol., 1, 16126.
Qiao, H., Peterson, A.T., Campbell, L.P., Sober�on, J., Ji, L. & Escobar,
L.E. (2016). NicheA: creating virtual species and ecological niches in
multivariate environmental scenarios. Ecography, 39, 805–813.
Randolph, S.E. (2010). To what extent has climate change contributed to
the recent epidemiology of tick-borne diseases? Vet. Parasitol. Ticks
and Tick-borne Pathogens, 167, 92–94.
Reiner, R.C., Perkins, T.A., Barker, C.M., Niu, T., Chaves, L.F., Ellis,
A.M., et al. (2013). A systematic review of mathematical models of
mosquito-borne pathogen transmission: 1970–2010. J. R. Soc. Interface,
10, 20120921.
Ren, Z., Wang, D., Ma, A., Hwang, J., Bennett, A., Sturrock, H.J.W.,
et al. (2016). Predicting malaria vector distribution under climate
change scenarios in China: Challenges for malaria elimination. Sci.
Rep., 6, 20604.
Rodriguez-Barraquer, I., Cordeiro, M.T., Braga, C., de Souza, W.V.,
Marques, E.T. & Cummings, D.A.T. (2011). From re-emergence to
hyperendemicity: The natural history of the dengue epidemic in Brazil.
PLoS Negl. Trop. Dis., 5, e935.
Rogers, D.J. & Randolph, S.E. (2006). Climate change and vector-borne
diseases. Adv. Parasitol., 62, 345–381.
Rohr, J.R., Dobson, A.P., Johnson, P.T.J., Kilpatrick, A.M., Paull, S.H.,
Raffel, T.R., et al. (2011). Frontiers in climate change–disease research.
Trends Ecol. Evol., 26, 270–277.
Rohr, J.R., Civitello, D.J., Cohen, J.M., Roznik, E.A., Sinervo, B. &
Dell, A.I. (2018). The complex drivers of thermal acclimation and
breadth in ectotherms. Ecol. Lett., 21, 1425–1439.
Ruybal, J.E., Kramer, L.D. & Kilpatrick, A.M. (2016). Geographic
variation in the response of Culex pipiens life history traits to
temperature. Parasit. Vectors, 9, 116.
Ryan, S.J., McNally, A., Johnson, L.R., Mordecai, E.A., Ben-Horin, T.,
Paaijmans, K., et al. (2015). Mapping physiological suitability limits for
malaria in Africa under climate change. Vector-Borne Zoonotic Dis., 15,
718–725.
Ryan, S.J., Carlson, C.J., Mordecai, E.A. & Johnson, L.R. (2019). Global
expansion and redistribution of Aedes-borne virus transmission risk
with climate change. PLoS Negl. Trop. Dis., 13, e0007213.
Salje, H., Lessler, J., Berry, I.M., Melendrez, M.C., Endy, T.,
Kalayanarooj, S., et al. (2017). Dengue diversity across spatial and
temporal scales: Local structure and the effect of host population size.
Science, 355, 1302–1306.
Salje, H., Cummings, D.A.T., Rodriguez-Barraquer, I., Katzelnick, L.C.,
Lessler, J., Klungthong, C., et al. (2018). Reconstruction of antibody
dynamics and infection histories to evaluate dengue risk. Nature, 557,
719–723.
Santos-Vega, M., Lowe, R., Anselin, L., Desai, V., Vaishnav, K.G., Naik,
A., et al. (2019). Local climate and social inequality drive spatio-
temporal variation in malaria risk across a complex urban landscape.
bioRxiv, 583880. https://doi.org/10.1101/583880
Savage, V.M. (2004). Improved approximations to scaling relationships
for species, populations, and ecosystems across latitudinal and
elevational gradients. J. Theor. Biol., 227, 525–534.
Shah, M., Krystosik, A.R., Ndenga, B.A., Mutuku, F.M., Caldwell, J.M.,
Otuka, V., et al. (2019). Malaria smear positivity among Kenyan
children peaks at intermediate temperatures as predicted by ecological
models. Parasit. Vectors, 12, 288.
Shapiro, L.L.M., Whitehead, S.A. & Thomas, M.B. (2017). Quantifying
the effects of temperature on mosquito and parasite traits that
determine the transmission potential of human malaria. PLOS Biol.,
15, e2003489.
Shocket, M.S., Ryan, S.J. & Mordecai, E.A. (2018). Temperature explains
broad patterns of Ross River virus transmission. eLife, 7, e37762.
© 2019 The Authors Ecology Letters published by CNRS and John Wiley & Sons Ltd
Review And Synthesis Temperature and mosquito-borne disease 1707
Shocket, M.S., Verwillow, A.B., Numazu, M.G., Slamani, H., Cohen,
J.M., Moustaid, F.E., et al. (2019). Transmission of West Nile virus
and other temperate mosquito-borne viruses occurs at lower
environmental temperatures than tropical diseases, bioRxiv, 597898.
https://doi.org/10.1101/597898
Sinclair, B.J., Marshall, K.E., Sewell, M.A., Levesque, D.L., Willett, C.S.,
Slotsbo, S., et al. (2016). Can we predict ectotherm responses to climate
change using thermal performance curves and body temperatures? Ecol.
Lett., 19, 1372–1385.
Siraj, A.S., Santos-Vega, M., Bouma, M.J., Yadeta, D., Carrascal, D.R.
& Pascual, M. (2014). Altitudinal changes in malaria incidence in
highlands of Ethiopia and Colombia. Science, 343, 1154–1158.
Siraj, A.S., Oidtman, R.J., Huber, J.H., Kraemer, M.U.G., Brady, O.J.,
Johansson, M.A., et al. (2017). Temperature modulates dengue virus
epidemic growth rates through its effects on reproduction numbers and
generation intervals. PLoS Negl. Trop. Dis., 11, e0005797.
Sloyer, K.E., Burkett-Cadena, N.D., Yang, A., Corn, J.L., Vigil, S.L.,
McGregor, B.L., et al. (2019). Ecological niche modeling the potential
geographic distribution of four Culicoides species of veterinary
significance in Florida, USA. PLoS ONE, 14, e0206648.
Smith, D.L., Guerra, C.A., Snow, R.W. & Hay, S.I. (2007a).
Standardizing estimates of the Plasmodium falciparum parasite rate.
Malar. J., 6, 131.
Smith, D.L., McKenzie, F.E., Snow, R.W. & Hay, S.I. (2007b).
Revisiting the basic reproductive number for malaria and its
implications for malaria control. PLoS Biol., 5, e42.
Smith, D.L., Battle, K.E., Hay, S.I., Barker, C.M., Scott, T.W. &
McKenzie, F.E. (2012). Ross, macdonald, and a theory for the
dynamics and control of mosquito-transmitted pathogens. PLoS
Pathog., 8, e1002588.
Stanaway, J.D., Shepard, D.S., Undurraga, E.A., Halasa, Y.A., Coffeng,
L.E., Brady, O.J., et al. (2016). The global burden of dengue: an
analysis from the Global Burden of Disease Study 2013. Lancet Infect.
Dis., 16, 712–723.
Sternberg, E.D. & Thomas, M.B. (2014). Local adaptation to temperature
and the implications for vector-borne diseases. Trends Parasitol., 30,
115–122.
Stewart Ibarra, A.M., Ryan, S.J., Beltr�an, E., Mej�ıa, R., Silva, M. &
Mu~noz, �A. (2013). Dengue vector dynamics (Aedes aegypti) influenced
by climate and social factors in Ecuador: implications for targeted
control. PLoS ONE, 8, e78263.
Stewart-Ibarra, A.M. & Lowe, R. (2013). Climate and non-climate drivers
of dengue epidemics in southern coastal Ecuador. Am. J. Trop. Med.
Hyg., 88, 971–981.
Taylor, R.A., Mordecai, E.A., Gilligan, C.A., Rohr, J.R. & Johnson,
L.R. (2016). Mathematical models are a powerful method to
understand and control the spread of Huanglongbing. PeerJ, 4, e2642.
Taylor, R.A., Ryan, S.J., Lippi, C.A., Hall, D.G., Narouei-Khandan,
H.A., Rohr, J.R., et al. (2018). Predicting the fundamental thermal
niche of crop pests and diseases in a changing world: a case study on
citrus greening, bioRxiv, 465898. https://doi.org/10.1101/465898
Tesla, B., Demakovsky, L.R., Mordecai, E.A., Ryan, S.J., Bonds, M.H.,
Ngonghala, C.N., et al. (2018). Temperature drives Zika virus
transmission: evidence from empirical and mathematical models. Proc
R Soc B, 285, 20180795.
Thomas, M.B. & Blanford, S. (2003). Thermal biology in insect-parasite
interactions. Trends Ecol. Evol., 18, 344–350.
Thomas, S.M., Obermayr, U., Fischer, D., Kreyling, J. & Beierkuhnlein,
C. (2012). Low-temperature threshold for egg survival of a post-
diapause and non-diapause European aedine strain, Aedes albopictus
(Diptera: Culicidae). Parasit. Vectors, 5, 100.
Thomson, M.C., Doblas-Reyes, F.J., Mason, S.J., Hagedorn, R., Connor,
S.J., Phindela, T., et al. (2006). Malaria early warnings based on
seasonal climate forecasts from multi-model ensembles. Nature, 439,
576–579.
Thomson, M.C., Connor, S.J., Zebiak, S.E., Jancloes, M. & Mihretie, A.
(2011). Africa needs climate data to fight disease. Nature, 471, 440–442.
Thomson, M.C., Ukawuba, I., Hershey, C.L., Bennett, A., Ceccato, P.,
Lyon, B., et al. (2017). Using rainfall and temperature data in the
evaluation of national malaria control programs in Africa. Am. J.
Trop. Med. Hyg., 97, 32–45.
Tjaden, N.B., Caminade, C., Beierkuhnlein, C. & Thomas, S.M. (2018).
Mosquito-borne diseases: Advances in modelling climate-change
impacts. Trends Parasitol., 34, 227–245.
Tompkins, A.M. & Ermert, V. (2013). A regional-scale, high resolution
dynamical malaria model that accounts for population density, climate
and surface hydrology. Malar. J., 12, 65.
Vogels, C.B.F., Fros, J.J., G€oertz, G.P., Pijlman, G.P. & Koenraadt,
C.J.M. (2016). Vector competence of northern European Culex pipiens
biotypes and hybrids for West Nile virus is differentially affected by
temperature. Parasit. Vectors, 9, 393.
Vogels, C.B.F., Hartemink, N. & Koenraadt, C.J.M. (2017). Modelling
West Nile virus transmission risk in Europe: effect of temperature and
mosquito biotypes on the basic reproduction number. Sci. Rep., 7, 5022.
Waite, J.L., Suh, E., Lynch, P.A. & Thomas, M.B. (2019). Exploring the
lower thermal limits for transmission of human malaria, Plasmodium
falciparum. Biol. Lett. in press.
Werner, A.K., Goater, S., Carver, S., Robertson, G., Allen, G.R. &
Weinstein, P. (2012). Environmental drivers of ross river virus in
southeastern Tasmania, Australia: towards strengthening public health
interventions. Epidemiol. Infect., 140, 359–371.
Wesolowski, A., Qureshi, T., Boni, M.F., Sundsøy, P.R., Johansson,
M.A., Rasheed, S.B., et al. (2015). Impact of human mobility on the
emergence of dengue epidemics in Pakistan. Proc. Natl Acad Sci., 112,
11887–11892.
Wesolowski, A., Erbach-Schoenberg, E., zu, Tatem, A.J., Lourenc�o, C.,
Viboud, C., Charu, V.,, , et al. (2017). Multinational patterns of
seasonal asymmetry in human movement influence infectious disease
dynamics. Nat. Commun., 8, 2069.
Williams, J.W. & Jackson, S.T. (2007). Novel climates, no-analog
communities, and ecological surprises. Front. Ecol. Environ., 5, 475–
482.
Yamana, T.K., Kandula, S. & Shaman, J. (2016). Superensemble
forecasts of dengue outbreaks. J. R. Soc. Interface, 13, 20160410.
Zouache, K., Fontaine, A., Vega-Rua, A., Mousson, L., Thiberge, J.-M.,
Lourenco-De-Oliveira, R., et al. (2014). Three-way interactions between
mosquito population, viral strain and temperature underlying
chikungunya virus transmission potential. Proc. R. Soc. B Biol. Sci.,
281, 20141078.
SUPPORTING INFORMATION
Additional supporting information may be found online in
the Supporting Information section at the end of the article.
Editor, James (Jeb) Byers
Manuscript received 15 April 2019
First decision made 22 May 2019
Manuscript accepted 6 June 2019
© 2019 The Authors Ecology Letters published by CNRS and John Wiley & Sons Ltd
1708 E. A. Mordecai et al. Review And Synthesis