
PhD Thesis_ChiaraNiespolo_WhiteRose.pdf - White Rose ...
281
Investigating the Post-transcriptional Regulation of Macrophage and Prostate Cancer Transcriptome by microRNAs with focus on Tribbles-1 Chiara Niespolo Registration No: 160266054 A thesis submitted in partial fulfilment of the requirements for the degree of Doctor of Philosophy The University of Sheffield Faculty of Medicine, Dentistry & Health Department of Infection, Immunity & Cardiovascular Disease April 2020
-
Upload
khangminh22 -
Category
Documents
-
view
0 -
download
0
Transcript of PhD Thesis_ChiaraNiespolo_WhiteRose.pdf - White Rose ...

Investigating the Post-transcriptional Regulation of
Macrophage and Prostate Cancer Transcriptome by
microRNAs with focus on Tribbles-1
Chiara Niespolo
Registration No: 160266054
A thesis submitted in partial fulfilment of the requirements for the degree of
Doctor of Philosophy
The University of Sheffield
Faculty of Medicine, Dentistry & Health
Department of Infection, Immunity & Cardiovascular Disease
April 2020

2
I am just a child who has never grown up. I still keep asking
these 'how' and 'why' questions. Occasionally, I find an answer.
Stephen Hawking

3
Thesis format
Each chapter of this thesis is structured individually and consists of:
I. A general introduction, providing a background to each results chapter
(Chapter 1);
II. General materials and methods, describing all the techniques, procedures
and assay used in this work (Chapter 2);
III. First results chapter, structured as a traditional thesis chapter but intended
to be published (Chapter 3, first author);
IV. Second results chapter, structured as a traditional thesis chapter but
intended to be published (Chapter 4, co-first author);
V. Two additional results chapters describing small, side projects fitting the
aims of this thesis (Chapter 5,6);
VI. A conclusive chapter, summarizing the main findings (Chapter 7);
VII. Supporting information, additional methods and supplementary results,
not included in the main chapters (Chapter 8).
List of contents, figures and tables is also provided at the beginning of the thesis.

4
Declaration
The work presented in this thesis has been generated and analysed by myself,
unless otherwise stated. Help from Dr Jessica Johnston and Kajus Baidzajevas
was greatly appreciated, as well as from Dr Alessandra Iscaro, Swapna Satam
and Ziyanda Shologu who provided animal samples and prostate cancer
specimens. Chapter 4 arises from a close collaboration with Sumeet Deshmukh
and Dr Ian Sudbery, who performed the whole transcriptomics analysis. Chapter
3 and Chapter 4 are intended to be published, along with data not shown in this
thesis. During the years, all the help and support received from IICD technicians
was critical and I would like to thank them all, in particular Dr Markus Arians,
Jonathan Kilby and Dr Ben Durham.

5
Associated Publications
Conference papers (published abstracts):
I. Niespolo C, Shologu Z, Satam S, Iscaro A, Muthana M, Socorro S, Wilson
HL, Kiss-Toth E, microRNAs regulating Tribbles-1: potential molecular
targets in prostate cancer, European Urology Supplements 18(8):e3090-
e3091 Oct 2019, 10.1016/s1569-9056(19)33337-8;
II. Niespolo C, Salamanca Viloria J, Deshmukh S, Villacanas Perez O,
Sudbery I, Wilson H, Kiss-Toth E , Investigating the MIR-101-3P/TRIB1
axis in macrophage immunometabolism, BMJ Publishing Group Ltd and
British Cardiovascular Society, Basic Science May 2019,
10.1136/heartjnl-2019-bcs.188;
III. Niespolo C, Viloria JS, Perez OV, Wilson HL, Kiss-Toth E, miR-101-3p
controls TRIB1 expression in human macrophages: a potential target on
atherosclerotic plaques, Cardiovascular Research. Oxford University Press
(OUP). 114: S8-S8. 01 Sep 2018, 10.1093/cvr/cvy216.029;
IV. Niespolo C, Viloria JS, Perez OV, Wilson H, Kiss-Toth E, Post-
transcriptional regulation of TRIB1 by miRNAs in primary macrophages
Heart. 104: a86. 01 Jun 2018, 10.1136/heartjnl-2018-bcs.109.
Manuscripts in preparation
I. Niespolo C, Johnston J, Kim T, Deshmukh S, Sudbery IM, Wilson H, Kiss-
Toth E, TRIB1 Regulates Macrophage Polarisation in Vivo and in Vitro
and is a Direct Target of miR-101-3p (EMBO Reports);
II. Niespolo C*,Deshmukh S*, Wilson H, Kiss-Toth E, Sudbery IM, Super
regulator miRNAs and SNP-dependent allelic imbalance: a comprehensive
transcriptome analysis of pro-inflammatory macrophages (Nature
Immunology).

6
Other Publications
Contribution, not presented in this thesis:
I. Ingrid Gomez, Ben Ward, Celine Souilhol, Chiara Recarti, Mark Ariaans,
Jessica Johnston, Amanda Burnett, Marwa Mahmoud, Le Anh Luong,
Laura West, Merete Long, Sion Parry, Rachel Woods, Carl Hulston, Birke
Benedikter, Chiara Niespolo, Rohit Bazaz, Sheila Francis, Endre Kiss-
Toth, Marc van Zandvoort, Andreas Schober, Paul Hellewell, Paul C.
Evans & Victoria Ridger, Neutrophil microvesicles drive atherosclerosis
by delivering miR-155 to atheroprone endothelium, Nature
Communications volume 11, Article number: 214 (2020),
https://doi.org/10.1038/s41467-019-14043-y.

7
Acknowledgments
Above all, I would like to thank my supervisors Prof. Endre Kiss-Toth and Dr Heather Wilson,
who have been not only exceptional supervisors, but also my parents over the last 3 years. They
have been always supportive and caring, especially during hard times. I have learnt so much
from both of them.
Thanks to Sumeet and Ian for our great collaboration and for teaching me the impossible (the
RNA-seq analysis!).
A special acknowledgment goes to one of the smartest and sweetest persons I have ever met
during my PhD: Dr Yang Li, my mentor and guide in the lab, a brilliant scientist and a lovely
friend. Thanks for teaching me everything and for making the best dumplings in the world!
I would like to thank my friends and best lab mates Laura, Taewoo and Ahmed, who have been
fundamental during these years. We started this journey together and we always supported each
other, either in good or bad moments. Thanks also to all the I&M group members. It’s been
great working with you guys. I will miss you so much.
I must thank my best friends and my “rocks” Merete, Taghreed, Rehab, Lindsay and Anjana.
The support and the love they gave me every single day meant the world to me. Without them,
I would have been lost.
Thanks to Graham, my drinking buddy, the best TRAIN manager and trip organiser. And to
the whole TRAIN Consortium, PIs and ESRs: I will miss you all. I had a great time with you.
Thanks to my lovely family and my friends “since ever”, who never stopped believing in me
and supporting me. It’s been so hard staying away, but I am coming back soon (hopefully!).
Last, but not least, I should really thank myself, for my resilience, patience, strength and
motivation during the hardest times. For not giving up, when I was unwell and everything
around me seemed to fall into pieces.
Now, let’s take this PhD home!
8
Table of contents
List of Figures .......................................................................................................................... 15
List of Tables ........................................................................................................................... 18
Appendices ............................................................................................................................... 20
List of Abbreviations ............................................................................................................... 21
Abstract ................................................................................................................................... 23
Chapter 1. General Introduction .......................................................................................... 24
1.1. microRNAs as master regulators of gene expression ....................................................... 24
1.1.1. Genomics & biogenesis ................................................................................................. 24
1.1.2. Mechanisms & functions: the RNA-Induced Silencing Complex ................................. 27
1.1.3. Computational tools to predict microRNA-target interaction ....................................... 30
1.1.4. microRNAs in health and disease .................................................................................. 34
1.2. Macrophages, a plastic cell population ............................................................................. 36
1.2.1. Origin and development ................................................................................................. 36
1.2.2. Function and activation states ........................................................................................ 37
1.2.3. Macrophages in health and disease ................................................................................ 40
1.2.4. microRNAs regulating macrophage development and function .................................... 43
1.2.5. Limitations of the M1/M2 paradigm.............................................................................. 44
1.3. Tribbles pseudo-kinases: regulators of inflammation, metabolism and cancer ................ 46
1.3.1. Tribbles, a family of pseudo-kinases ............................................................................. 46
1.3.2. Overview of Tribbles binding partners .......................................................................... 46

9
1.3.3. Cell-context dependent functions of Tribbles ................................................................ 50
1.3.4. TRIB1-mediated control of macrophages ...................................................................... 50
1.3.5. TRIB1 and Prostate Cancer ........................................................................................... 51
1.3.6. TRIB1: an unstable transcript ........................................................................................ 52
1.3.7. TRIB1 as a potential target of multiple microRNAs ..................................................... 53
1.4. Tribbles Research and Innovation Network (TRAIN)...................................................... 54
Chapter 2. General Materials and Methods ........................................................................ 56
Part I, In Silico ......................................................................................................................... 56
2.1. microRNA-target prediction and databases management................................................. 56
2.1.1. miRNAs targeting TRIB1 genetic variants: Single Nucleotide Polymorphisms (SNPs)
.................................................................................................................................................. 58
2.1.2. Additional tools used ..................................................................................................... 58
2.2. RNA-sequencing ............................................................................................................... 58
2.2.1. Small non-coding RNA sequencing............................................................................... 59
2.2.2. Messenger RNA-sequencing ......................................................................................... 60
Part II, In Vitro ......................................................................................................................... 62
2.3. Cell culture and maintenance ............................................................................................ 62
2.3.1. Primary cells .................................................................................................................. 62
2.3.1.1. Human monocyte-derived macrophages (MDMs) ..................................................... 62
Statement of Ethics .................................................................................................................. 62
Blood Monocytes isolation and macrophages differentiation ................................................. 62
Macrophages in vitro polarisation ........................................................................................... 63
10
2.3.2. Established cell lines ...................................................................................................... 63
2.3.2.1. Immortalised BMDMs (iBMDMs) ............................................................................. 63
2.3.2.2. HEK293T cell line ...................................................................................................... 63
2.3.2.3. Prostate cancer cell lines ............................................................................................. 64
2.4. Gene expression profiling ................................................................................................. 64
2.4.1. RNA extraction .............................................................................................................. 64
2.4.2. cDNA synthesis ............................................................................................................. 64
2.4.3. Real Time-quantitative PCR .......................................................................................... 65
2.4.4. Gene expression analysis: 2–∆Ct method ........................................................................ 65
2.5. Protein analysis ................................................................................................................ 68
2.5.1. Protein Extraction .......................................................................................................... 68
2.5.2. BCA Protein Quantification Assay ................................................................................ 68
2.5.3. Western Blotting ............................................................................................................ 68
2.6. Transient transfection........................................................................................................ 69
2.7. Molecular Cloning and Site-Directed Mutagenesis .......................................................... 70
2.7.1. Cloning reaction ............................................................................................................. 71
2.7.1.1. pENTR Directional TOPO cloning ............................................................................. 71
2.7.1.2. Gateway Cloning ........................................................................................................ 72
2.7.2. Site-directed mutagenesis .............................................................................................. 73
2.8. Dual Luciferase Reporter Assay ....................................................................................... 73
2.9. Enzyme-linked immunosorbent assay (ELISA) ............................................................... 75

11
2.10. Viability Assay (MTT) ................................................................................................... 76
2.11. Immunofluorescence ....................................................................................................... 77
2.12. Microscope Imaging and analysis ................................................................................... 77
2.13. Cholesterol Efflux Assay ................................................................................................ 78
2.14. Flow cytometry ............................................................................................................... 78
2.15. Statistics .......................................................................................................................... 78
Chapter 3. miR-101-3p negatively regulates Tribbles-1 in primary human macrophages
.................................................................................................................................................. 79
Declaration ............................................................................................................................... 79
Abstract .................................................................................................................................... 79
3.1. Introduction ....................................................................................................................... 80
3.2. Hypothesis and aims ......................................................................................................... 81
3.3. Results ............................................................................................................................... 82
3.3.1. Endogenous TRIB1 expression in human polarised macrophages ................................ 82
3.3.2. TRIB1 overexpression in human macrophages ............................................................. 87
3.3.3. Post-transcriptional regulation of TRIB1: impact of the 3’UTR ................................... 90
3.3.4. Identification of miRNAs potentially targeting TRIB1 ................................................. 93
3.3.5. Experimental validation of miR-101-3p/TRIB1 interaction ........................................ 101
3.3.6. Impact of miR-101-3p on human macrophages........................................................... 107
3.4. Summary ......................................................................................................................... 112
Chapter 4. Integrated transcriptome analysis of small non-coding RNAs and mRNAs in
pro-inflammatory macrophages ......................................................................................... 114

12
Declaration ............................................................................................................................. 114
Abstract .................................................................................................................................. 114
4.1. Introduction ..................................................................................................................... 115
4.2. Hypothesis and aims ....................................................................................................... 116
4.3. Results ............................................................................................................................. 117
4.3.1. Small RNA sequencing data quality and analysis strategy .......................................... 117
4.3.2. Differential expression of miRNAs in response to LPS and INF- in human primary
macrophages .......................................................................................................................... 122
4.3.3. Identification of “super regulator” miRNAs: miRNA-target prediction analysis and
datasets overlapping ............................................................................................................... 127
4.3.4. Impact of “super regulator” miRNAs on macrophage transcriptome .......................... 137
4.4. Summary ......................................................................................................................... 148
Chapter 5. miRNAs targeting TRIB1 non-coding variants and identification of two novel
eQTLs .................................................................................................................................... 150
Declaration ............................................................................................................................. 150
Abstract .................................................................................................................................. 150
5.1. Introduction ..................................................................................................................... 151
5.2. Hypothesis and aim of this study .................................................................................... 153
5.3. Results ............................................................................................................................. 154
5.3.1. Impact of the 3’UTR of TRIB1 on mRNA stability .................................................... 154
5.3.2. Identification of TRIB1 non-coding variants affecting miRNA-binding sites ............ 155
5.3.3. Effect of TRIB1 3’UTR SNPs on gene reporter activity ............................................. 160
13
5.3.4. Experimental validation of rs62521034/miR-29a-3p interaction ................................ 163
5.3.5. Identification of two novel trans-eQTLs...................................................................... 166
5.4. Summary ......................................................................................................................... 168
5.5. Limitations of the study .................................................................................................. 169
Chapter 6. miRNAs targeting TRIB1 in Prostate Cancer ............................................... 171
Declaration ............................................................................................................................. 171
Abstract .................................................................................................................................. 171
6.1. Introduction ..................................................................................................................... 172
PCa overview ......................................................................................................................... 172
Genetics of PCa...................................................................................................................... 173
Downregulation of microRNAs in PCa ................................................................................. 173
The potential role of TRIB1 in PCa ....................................................................................... 174
6.2. Hypothesis and aim of the study ..................................................................................... 175
6.3. Results ............................................................................................................................. 176
6.3.1. Data mining of PCa datasets: cBioPortal for Cancer Genomics.................................. 176
6.3.2. Assessment of TRIB1 gene expression in human and mouse models of PCa by RT-qPCR
................................................................................................................................................ 181
6.3.2. Identification of downregulated miRNAs potentially targeting TRIB1 ...................... 184
6.3.3. Validation of miR-132-3p/TRIB1 interaction by gene reporter assay......................... 189
6.3.4. Impact of miR-132-3p and TRIB1 on PC3 gene expression ....................................... 191
6.4. Summary ......................................................................................................................... 195
6.5. Limitations of the study .................................................................................................. 197
14
Chapter 7. General discussion and conclusions ................................................................ 198
References ............................................................................................................................. 204
Chapter 8, Supporting Information ................................................................................... 247
Appendix I, Chapter 2, General Materials and Methods................................................. 247
A1.4. Plasmids maps .............................................................................................................. 250
A1.6. Site-directed mutagenesis primers ............................................................................... 253
Appendix II, Supplementary data for Chapter 3 .............................................................. 255
A2.1. Assessment of CD14+ monocyte purity: flow cytometry ............................................ 255
A2.2. Immunofluorescence: isotype controls ........................................................................ 256
A2.3. Assessment of co-transfection efficiency .................................................................... 257
Appendix III, Supplementary data for Chapter 4 ................................................................... 260
A3.1. RNA quality and concentration: representative samples ............................................. 260
A3.2. miRNA-seq: overrepresented sequence ....................................................................... 262
A3.3. List of differentially expressed small RNAs ................................................................ 263
A3.4. List of differentially expressed genes .......................................................................... 270
Appendix IV, Supplementary data for Chapter 5 ............................................................ 275
A4.1. TRIB1 non-coding variants .......................................................................................... 275
A4.2. SNPs analysis with miRanda algorithm: workflow and scripts ................................... 276
Appendix V, Supplementary data for Chapter 6 .............................................................. 281
A5.1. miRCancer database output ......................................................................................... 281

15
List of Figures
Figure 1.1. Schematic illustration of miRNAs biogenesis in mammals .................................. 26
Figure 1.2. miRNA binding site on target sequence and its downstream consequences ......... 29
Figure 1.3. Schematic overview of free energy and RNA site accessibility ............................ 33
Figure 1.4. Overview of macrophage polarisation and function ............................................. 39
Figure 1.5. The contribution of macrophages to health and disease ........................................ 42
Figure 1.6. TRIB protein structure and interactions ................................................................ 48
Figure 2.1. Schematic overview of molecular cloning steps ................................................... 71
Figure 2.2. Overview of the dual luciferase reporter assay ..................................................... 75
Figure 3.1. TRIB1 RNA expression in human tissues: GTExPortal ....................................... 83
Figure 3.2. Assessment of TRIB1 RNA expression in polarised human macrophages by RT-
qPCR ................................................................................................................................ 84
Figure 3.3. Assessment of TRIB1 protein expression in polarised human macrophages by
immunofluorescence ........................................................................................................ 85
Figure 3.4. Representative immunofluorescence images ........................................................ 86
Figure 3.5. Assessment of TRIB1 overexpression in MDMs by RT-qPCR ............................ 88
Figure 3.6. Impact of TRIB1 overexpression on MDMs phenotype ...................................... 89
Figure 3.7. Impact of the 3’UTR of TRIB1 on gene reporter activity ..................................... 91
Figure 3.8. Confirmation of DICER1 and AGO2 knock-down by RT-qPCR ......................... 91
Figure 3.9. Effect of DICER1 and AGO2 knock-down on TRIB1 mRNA expression ........... 92
Figure 3.10. Effect of DICER1 knock-down on TRIB1 protein expression ........................... 92
Figure 3.11. Endogenous expression of candidate miRNAs in human polarised MDMs: small
RNA-seq .......................................................................................................................... 96
Figure 3.12. Confirmation of miRNAs overexpression in MDMs by RT-qPCR ................... 97
Figure 3.13. Assessment of TRIB1 endogenous expression in transfected MDMs by RT-
qPCR ................................................................................................................................ 98
Figure 3.14. Assessment of mTrib1 endogenous expression in transfected iBMDMs by RT-
qPCR ................................................................................................................................ 98
Figure 3.15. KEGG enrichment pathway analysis of macrophage-specific genes targeted by
miR-101-3p and miR-132-3p ......................................................................................... 100
Figure 3.16. Impact of miR-101-3p on gene reporter activity ............................................... 103
Figure 3.17. Phylogenetic conservation of miR-101-3p binding site on the 3’UTR of TRIB1
........................................................................................................................................ 103
16
Figure 3.18. Impact of miR-101-3p on TRIB1 3’UTR mutant.............................................. 104
Figure 3.19. Confirmation of site-directed mutagenesis: miR-101-3p binding site deletion 104
Figure 3.20. Impact of miR-101-3p inhibitor on TRIB1 gene reporter activity ..................... 105
Figure 3.21. Effect of miR-101-3p mimic on Trib1 protein expression ................................ 105
Figure 3.22. Assessment of miR-101-3p specificity: miR-101/TRIB1 target site blocker ... 106
Figure 3.23. Impact of miR-101-3p mimic on DUSP1 and ABCA1 genes in human
macrophages .................................................................................................................. 108
Figure 3.24. miR-101-3p effect on pro-inflammatory IL-6 and IL-8 .................................... 109
Figure 3.25. miR-101-3p impact on M1 polarisation markers expression by RT-qPCR ...... 110
Figure 3.26. miR-101-3p impact on M2 polarisation markers expression by RT-qPCR ...... 111
Figure 4.1. Sequencing error distribution rate ....................................................................... 118
Figure 4.2. Overview of analysis strategy ............................................................................. 121
Figure 4.3. Percentage of RNA types sequenced ................................................................... 123
Figure 4.4. PCA plot of small RNA-seq ................................................................................ 123
Figure 4.5. Differential expression of small RNAs in pro-inflammatory M1 macrophages 124
Figure 4.6. PCA plot of RNA-seq data .................................................................................. 130
Figure 4.7. Volcano plot of RNA-seq data ............................................................................ 130
Figure 4.8. Number of differentially expressed miRNA-target genes ................................... 133
Figure 4.9. Assessment of “super regulator” miRNAs by RT-qPCR .................................... 134
Figure 4.10. Gene Ontology and KEGG Pathway Enrichment analysis of DE miRNAs target
genes .............................................................................................................................. 135
Figure 4.11. Gene Ontology terms of target genes of “super regulator” miRNAs ................ 136
Figure 4.12. Target genes overlapping: Jaccard Index .......................................................... 136
Figure 4.13. Confirmation of miRNAs overexpression in transfected MDMs by RT-qPCR 140
Figure 4.14. Single PCA plots of RNA-seq data: super regulator miRNAs overexpression . 141
Figure 4.15. Global PCA plot of RNA-seq data: gender-dependent clustering? ................... 142
Figure 4.16. Volcano plots of RNA-seq data: super regulators overexpression .................... 142
Figure 4.17. Number of target genes up- and downregulated in response to miRNA
overexpression ............................................................................................................... 143
Figure 4.18. Gene ontology terms of genes differentially expressed in response to miRNA
mimics ............................................................................................................................ 144
Figure 4.19. MTT assay on MDMs transfected with miRNAs mimics ................................. 145
Figure 5.1. Impact of the 3’UTR of TRIB1 on mRNA stability............................................ 154
Figure 5.2. Example of SNP sequence before and after Python processing .......................... 156

17
Figure 5.3. Confirmation of TRIB1 3’UTR mutants: Sanger sequencing results ................. 161
Figure 5.4. Effect of TRIB1 non-coding SNPs on gene reporter activity.............................. 162
Figure 5.5. miRNA-target alignment calculated by the algorithm miRanda ......................... 164
Figure 5.6. Experimental validation of rs62521034/miR-29a-3p interaction ........................ 165
Figure 5.7. TRIB1 expression negatively correlates with MRSP21 and NLRC4 in GSE81046
dataset ............................................................................................................................ 167
Figure 6.1. Screenshot of cBioPortal for Cancer Genomics showing the summary of TRIB1
alterations in PCa ........................................................................................................... 178
Figure 6.2. Data mining of PCa datasets show TRIB1 gene amplification ........................... 179
Figure 6.3. Overall Survival Kaplan-Meier estimate ............................................................. 180
Figure 6.4. Assessment of TRIB1 RNA expression in human and mouse models of PCa ... 182
Figure 6.5. Assessment of murine Trib1 primers’ target specificity using BLAST Primers tool
........................................................................................................................................ 183
Figure 6.6. Identification of downregulated miRNAs targeting TRIB1 ................................ 185
Figure 6.7. Assessment of candidate miRNAs expression in prostate cancer cell lines by RT-
qPCR .............................................................................................................................. 188
Figure 6.8. miR-132-3p/TRIB1 experimental validation ...................................................... 190
Figure 6.9. Assessment of TRIB1 RNA expression by RT-qPCR after miR-132-3p
overexpression and TRIB1 knockdown in PC3 cell line ............................................... 192
Figure 6.10. Impact of miR-132-3p and TRIB1 on pro-inflammatory cytokines in PC3 cell
line.................................................................................................................................. 193
Figure 6.11. Impact of miR-132-3p and TRIB1 on cancer-related genes in PC3 cell line .... 194
Figure 7.1. miRNAs targeting TRIB1 in macrophages and prostate cancer ......................... 200

18
List of Tables
Table 1.1. List of online repositories for miRNA-target identification and SNP detection .... 32
Table 1.2. TRIB protein-protein interactions and their biological effect ................................ 49
Table 2.1. List of miRNA-target prediction tools .................................................................... 57
Table 2.2. Experimental conditions for the RNA-seq experiment ........................................... 61
Table 2.3. Packages, functions and database used to carry out the RNA-seq analysis ........... 61
Table 2.4. cDNA synthesis protocols ...................................................................................... 66
Table 2.5. RT-qPCR reagents and protocol: Primer Design .................................................... 66
Table 2.6. RT-qPCR reagents and protocol: QIAGEN............................................................ 66
Table 2.7. RT-qPCR running protocol: Primer Design ........................................................... 67
Table 2.8. RT-qPCR running protocol: QIAGEN ................................................................... 67
Table 2.9. Transient transfection assays .................................................................................. 70
Table 3.1. miRNA-TRIB1 target prediction analysis .............................................................. 95
Table 3.2. Characteristics of candidate miRNAs ..................................................................... 95
Table 3.3. Reactome pathway analysis of candidate miRNAs target genes ............................ 99
Table 4.1. Data quality summary ........................................................................................... 119
Table 4.2. Data filtering summary ......................................................................................... 120
Table 4.3. List of upregulated miRNAs ................................................................................. 125
Table 4.4. List of downregulated miRNAs ............................................................................ 126
Table 4.5. Number of target genes of upregulated miRNAs ................................................. 131
Table 4.6. Number of target genes of downregulated miRNAs ............................................ 132
Table 4.7. List of “super regulator” miRNAs with more than 500 target genes in macrophages
........................................................................................................................................ 133
Table 4.8. Adjusted p-values-filtered differentially expressed genes .................................... 146
Table 4.9. Log fold change values-filtered differentially expressed genes .......................... 147
Table 5.1. List of TRIB1 3’UTR SNPs creating new miRNA-binding sites ......................... 157
Table 5.2. Output generated by PolymiRTS database 3.0 ..................................................... 159
Table 5.3. TRIB1 non-coding variants selected for experimental validation ........................ 160
Table 5.4. miR-29a/b and TRIB1 involvement in cancer and metabolism ........................... 165
Table 5.5. Identification of two novel trans-eQTLs .............................................................. 166
Table 6.1. cBioPortal for Cancer genomics: selected studies ............................................... 177
Table 6.2. Overview of the human prostate cell lines used in the present study ................... 181
Table 6.3. Candidate miRNAs downregulated in PCa and predicted to target the 3’UTR ... 186

19
of TRIB1 ................................................................................................................................ 186
Table 6.4. TargetScan miRNA-TRIB1 analysis output ......................................................... 187
Table 6.5. Experimentally validated targets of miR-132-3p and their effect on PCa ............ 190
Table 6.6. List of genes analysed in transfected PC3 cell line .............................................. 192

20
Appendices
A1.1. List of reagents and kits ............................................................................................... 247
A1.2. List of machines and equipment .................................................................................. 249
A1.3. List of antibodies used in western blot and immunofluorescence ............................... 249
A1.4.1. Firefly reporter plasmid map..................................................................................... 250
A1.4.2. Renilla reporter plasmid map .................................................................................... 250
A1.4.3. TRIB1 3’UTR renilla reporter plasmid map ............................................................. 251
A1.4.4. Plasmids used for overexpression experiment .......................................................... 251
A1.5. List of RT-qPCR primers ............................................................................................. 252
A1.6.1. Forward and reverse primers used for site-directed mutagenesis of miR-101-3p
binding site ..................................................................................................................... 253
A1.6.2. Forward and reverse primers used to generate SNPs in the 3’UTR of TRIB1 ......... 254
A2.1. Assessment of CD14+ monocyte population purity .................................................... 255
A2.2. Immunofluorescence isotype controls ......................................................................... 256
A2.3.1. Flow cytometry: non-transfected HEK293T cells .................................................... 257
A2.3.2. Flow cytometry: DNA transfection in HEK293T cells ............................................ 258
A2.3.3. Flow cytometry: DNA and RNA co-transfection in HEK293T cells ....................... 258
A2.3.4. Flow cytometry: DNA and RNA siGLO co-transfection in HEK293T cells ........... 259
A2.3.5. Flow cytometry: fluorescence percentage and MFI .................................................. 259
A3.1.1. RNA agarose gel electrophoresis: RNA quality assessment .................................... 260
A3.1.2. Agilent 2100 bioanalyser: RNA quality assessment ................................................. 261
A3.2. MultiQC report: overrepresented sequences ................................................................ 262
A3.3.1. List of small RNAs upregulated in M1 macrophages ............................................... 263
A3.3.2. List of small RNAs downregulated in M1 macrophages .......................................... 268
A3.4.1. List of genes significantly downregulated in miR-155-5p overexpressing
macrophages .................................................................................................................. 270
A3.4.2. List of genes significantly downregulated in miR-125a-3p overexpressing
macrophages .................................................................................................................. 274
A3.4.3. List of genes significantly downregulated in miR-186-5p overexpressing
macrophages .................................................................................................................. 274
A4.1. List of TRIB1 non-coding variants .............................................................................. 275
A5.1. miRCancer Output: dysregulated miRNAs in PCA ..................................................... 281
21
List of Abbreviations
AML Acute myeloid leukaemia
BMDMs Bone marrow derived macrophages
CDS Coding sequence
CPM Counts per million
Ct Cycle threshold
DE Differential expression/differentially expressed
DLR Dual luciferase reporter
eQTLs Expression quantitative trait loci
FC Fold change
FDR False discovery rate
GO Gene ontology
iBMDMs Immortalised bone marrow derived macrophages
INDELs Insertion-deletion polymorphisms
IUPAC International Union of Pure and Applied Chemistry
KEGG Kyoto Encyclopedia of Genes and Genomes
MDMs Monocyte derived macrophages (human primary macrophages)
miRNA microRNA
mRNA Messenger RNA
OD Optical density
padj Adjusted p value
PBMCs Peripheral blood mononuclear cells
PCa Prostate cancer
PCA Principal component analysis
piR Piwi-interacting RNA
QC Quality control
RIN RNA integrity number
RISC RNA induced silencing complex
SEM Standard error mean
SNPs Single nucleotide polymorphisms
STR Short Tandem Repeat
TAMs Tumour associated macrophages
TME Tumour microenvironment

22
TMP Transcript per million
TRAIN Tribbles research and innovation network
TRIB Tribbles
tRNA Transfer RNA
TSB Target site blocker
UTR Untranslated region
23
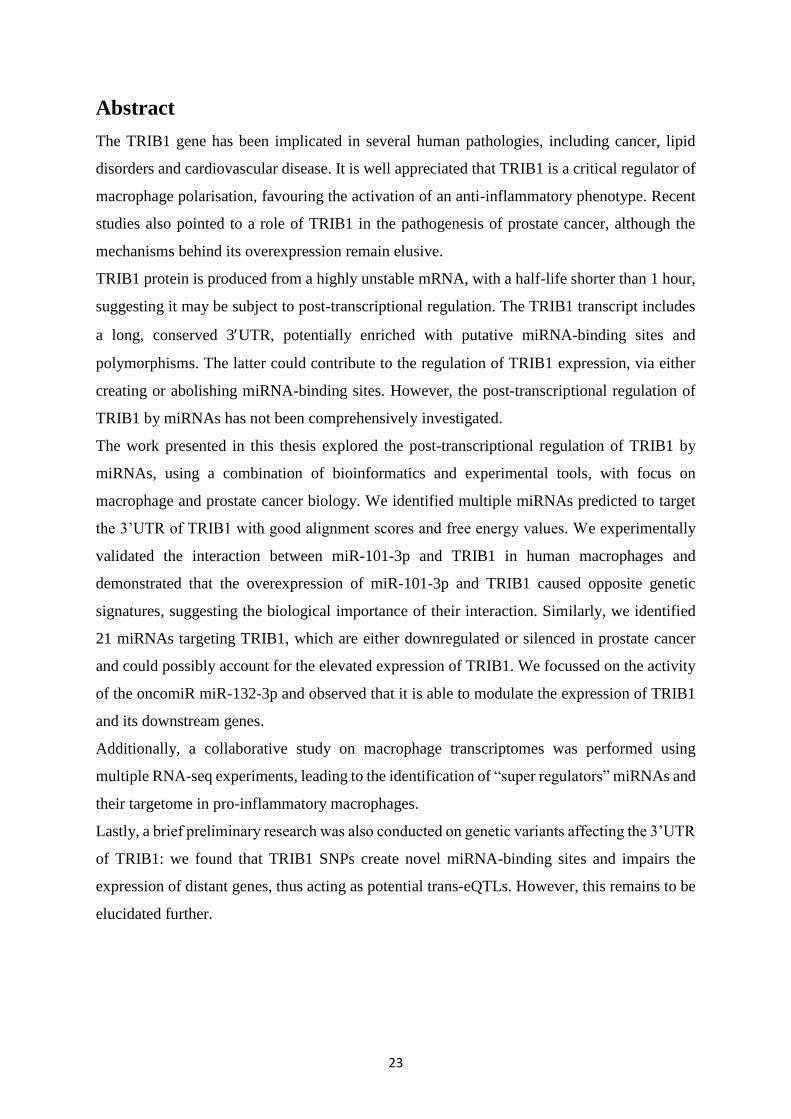
Abstract
The TRIB1 gene has been implicated in several human pathologies, including cancer, lipid
disorders and cardiovascular disease. It is well appreciated that TRIB1 is a critical regulator of
macrophage polarisation, favouring the activation of an anti-inflammatory phenotype. Recent
studies also pointed to a role of TRIB1 in the pathogenesis of prostate cancer, although the
mechanisms behind its overexpression remain elusive.
TRIB1 protein is produced from a highly unstable mRNA, with a half-life shorter than 1 hour,
suggesting it may be subject to post-transcriptional regulation. The TRIB1 transcript includes
a long, conserved 3UTR, potentially enriched with putative miRNA-binding sites and
polymorphisms. The latter could contribute to the regulation of TRIB1 expression, via either
creating or abolishing miRNA-binding sites. However, the post-transcriptional regulation of
TRIB1 by miRNAs has not been comprehensively investigated.
The work presented in this thesis explored the post-transcriptional regulation of TRIB1 by
miRNAs, using a combination of bioinformatics and experimental tools, with focus on
macrophage and prostate cancer biology. We identified multiple miRNAs predicted to target
the 3’UTR of TRIB1 with good alignment scores and free energy values. We experimentally
validated the interaction between miR-101-3p and TRIB1 in human macrophages and
demonstrated that the overexpression of miR-101-3p and TRIB1 caused opposite genetic
signatures, suggesting the biological importance of their interaction. Similarly, we identified
21 miRNAs targeting TRIB1, which are either downregulated or silenced in prostate cancer
and could possibly account for the elevated expression of TRIB1. We focussed on the activity
of the oncomiR miR-132-3p and observed that it is able to modulate the expression of TRIB1
and its downstream genes.
Additionally, a collaborative study on macrophage transcriptomes was performed using
multiple RNA-seq experiments, leading to the identification of “super regulators” miRNAs and
their targetome in pro-inflammatory macrophages.
Lastly, a brief preliminary research was also conducted on genetic variants affecting the 3’UTR
of TRIB1: we found that TRIB1 SNPs create novel miRNA-binding sites and impairs the
expression of distant genes, thus acting as potential trans-eQTLs. However, this remains to be
elucidated further.

24
Chapter 1. General Introduction
1.1. microRNAs as master regulators of gene expression
MicroRNAs (miRNAs) are small non-coding, single stranded RNAs (generally 21-25
nucleotides long) that play a fundamental role in the regulation of gene expression, acting as
key molecules in RNA-mediated silencing mechanisms. The first miRNA was discovered in
1993 by Lee and colleagues. They were screening for mutations in the Caenorhabditis elegans
larval development and found that the gene lin-4 does not code for a protein but for a small
RNA complementary to multiple sites in the 3’ untranslated region (3’UTR) of the lin-14
messenger RNA (mRNA) (Lee et al.,1993, Wightman et al.,1993). This complementarity
resulted in the impairment of the translation of the lin-14 mRNA into the LIN-14 protein. It
was the first evidence of anti-sense RNA-RNA interaction and since then a large number of
small non-coding RNAs and their targets have been discovered and characterized. miRNAs
have been found in both animals and plants, as well as in some viruses and they are highly
conserved among different species (Bartel et al., 2003, Zhang et al., 2006). There are over
48,000 mature miRNA products in 271 species recorded in miRBase (version 22, released in
October 2018), a searchable online database of published miRNAs and annotations (Kozomara
et al., 2019). Highlighting the importance of miRNAs in human physiology, it has been
estimated that more than half of the protein coding-genes are negatively regulated by miRNAs
and that a single miRNA species can target hundreds of different mRNAs (Friedman et al.,
2009). Therefore, it is not surprising that dysregulated miRNA expression is associated with
multiple human diseases (Calin et al., 2006).
1.1.1. Genomics & biogenesis
The identification of miRNA coding genes has been largely approached by using the
complementary DNA (cDNA) cloning method, in which small RNA molecules are first
separated from the total RNA and then cloned to construct a cDNA library to be sequenced, as
described in detail by Ambros and colleagues (Ambros et al., 2004). However, this method is
limited by not being sensitive to discover miRNAs whose expression is not abundant or is
restricted only to some cell/tissue types. This can be overcome by using computational
approaches and examining genomic sequences on the basis of phylogenetic conservation
criteria (Bartel et al., 2004, Kim et al., 2006). Several studies showed that genes encoding for
miRNAs are located in intergenic regions and they are distant from annotated genes, thus

25
forming independent transcriptional units (Lagos-Quintana et al., 2001, Lau et al., 2001, Lee
et al., 2001). However, it is also known that some miRNAs are processed from the introns of
protein coding genes (Ambros et al., 2003), as well as introns and exons of “non-coding” genes
(Rodriguez et al., 2004). Interestingly, Cai and colleagues found that 9 human miRNAs are
excised from the 3’UTR of transcripts (Cai et al., 2004). miRNA coding genes are usually
transcribed by RNA polymerase II (Lee et al., 2004), despite some evidence suggesting that
the transcription of miRNA genes can be also mediated by the RNA polymerase III (Borchert
et al., 2006). The canonical mechanism of miRNA biogenesis in mammals is illustrated in
Figure 1.1. The first maturation step occurs inside the nucleus after the transcription of the
miRNA coding gene. The product of transcription is a long capped and polyadenylated primary
miRNA (pri-miRNA) characterized by the presence of stem loop structures. The pri- miRNA
is processed into a precursor miRNA (pre-miRNA) of approximately 60-70 nucleotides by the
RNase III endonuclease DROSHA that cleaves both strands at the level of the stem loops. To
process the pri-miRNA the protein PASHA (DGCR8) is also required (Tomari et al., 2005).
The pre-miRNAs are then transported to the cytoplasm by Exportin 5 (EXP-5), a GTP-
dependent nucleo/cytoplasmic transporter. The latter recognizes a 2-nucleotide 3’ overhang
created by DROSHA at the 3’ end of the pre-miRNAs, which therefore defines one end of the
mature miRNA. Once in the cytoplasm, another RNase III endonuclease, DICER, processes
the precursors into small double-stranded RNA duplexes containing both the mature sequence
of the miRNA and its complementary strand (Bartel et al., 2004, He et al., 2004). The dsRNA
duplex is also referred to as a miRNA: miRNA* duplex, where miRNA is the mature miRNA
and miRNA* (also known as star-strand) corresponds to the complementary arm. They are
commonly termed 5p and 3p, depending on which end of the stem loop they derive from.
Generally, only one strand, probably the most unstable, is incorporated in the RNA-induced
silencing complex (RISC), whereas the other one is released and degraded (Du et al., 2005).
However, it has been reported that in some cases both strands can be loaded into the RISC: for
example, Huang and colleagues have recently demonstrated that both miR-582-3p and miR-
582-5p are functional. They have been shown to repress prostate cancer metastasis to bone by
targeting and downregulating several components of the TGF- signalling pathway (Huang et
al., 2019). The RISC complex is composed of different conserved proteins, including
Argonaute (AGO) proteins that form the catalytic core of the RISC complex (Pratt et al., 2009).

26
Figure 1.1. Schematic illustration of miRNAs biogenesis in mammals
miRNA-coding genes are transcribed by RNA pol II into a pri-miRNA. This is further cleaved
by DROSHA that together with the protein PASHA creates a pre-miRNA of 60-70 nucleotides.
In turn, this is translocated to the cytoplasm by the GTP-dependent nucleo/cytoplasm cargo
transporter EXP-5. Once in the cytoplasm, the pre-miRNA is processed by DICER that forms
a miRNA: miRNA* duplex. In general, only one miRNA strand will be incorporated in the
RISC complex.
miRNA-coding gene
RNA-pol II
Pri-miRNA
Drosha
Exp5
Pre-miRNA
NUCLEO
Dicer
miRNA:miRNA* duplex
Unwinding
RISC
Pasha
CYTOPLASM
27
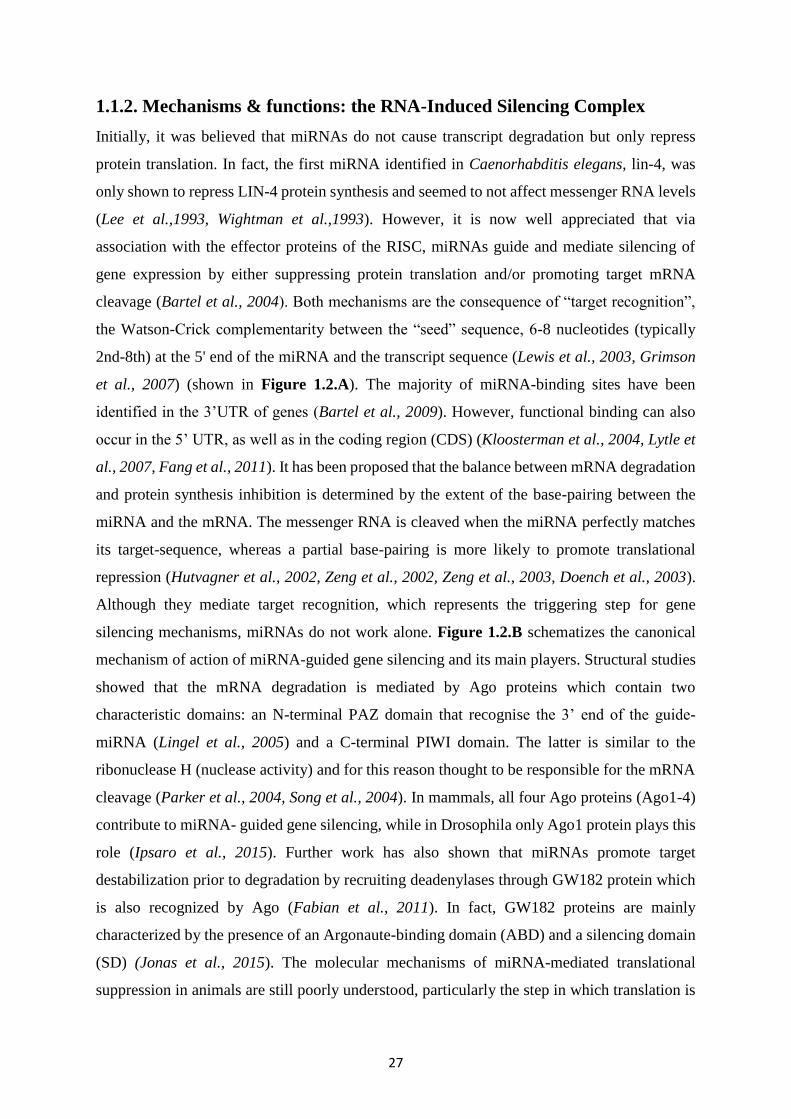
1.1.2. Mechanisms & functions: the RNA-Induced Silencing Complex
Initially, it was believed that miRNAs do not cause transcript degradation but only repress
protein translation. In fact, the first miRNA identified in Caenorhabditis elegans, lin-4, was
only shown to repress LIN-4 protein synthesis and seemed to not affect messenger RNA levels
(Lee et al.,1993, Wightman et al.,1993). However, it is now well appreciated that via
association with the effector proteins of the RISC, miRNAs guide and mediate silencing of
gene expression by either suppressing protein translation and/or promoting target mRNA
cleavage (Bartel et al., 2004). Both mechanisms are the consequence of “target recognition”,
the Watson-Crick complementarity between the “seed” sequence, 6-8 nucleotides (typically
2nd-8th) at the 5' end of the miRNA and the transcript sequence (Lewis et al., 2003, Grimson
et al., 2007) (shown in Figure 1.2.A). The majority of miRNA-binding sites have been
identified in the 3’UTR of genes (Bartel et al., 2009). However, functional binding can also
occur in the 5’ UTR, as well as in the coding region (CDS) (Kloosterman et al., 2004, Lytle et
al., 2007, Fang et al., 2011). It has been proposed that the balance between mRNA degradation
and protein synthesis inhibition is determined by the extent of the base-pairing between the
miRNA and the mRNA. The messenger RNA is cleaved when the miRNA perfectly matches
its target-sequence, whereas a partial base-pairing is more likely to promote translational
repression (Hutvagner et al., 2002, Zeng et al., 2002, Zeng et al., 2003, Doench et al., 2003).
Although they mediate target recognition, which represents the triggering step for gene
silencing mechanisms, miRNAs do not work alone. Figure 1.2.B schematizes the canonical
mechanism of action of miRNA-guided gene silencing and its main players. Structural studies
showed that the mRNA degradation is mediated by Ago proteins which contain two
characteristic domains: an N-terminal PAZ domain that recognise the 3’ end of the guide-
miRNA (Lingel et al., 2005) and a C-terminal PIWI domain. The latter is similar to the
ribonuclease H (nuclease activity) and for this reason thought to be responsible for the mRNA
cleavage (Parker et al., 2004, Song et al., 2004). In mammals, all four Ago proteins (Ago1-4)
contribute to miRNA- guided gene silencing, while in Drosophila only Ago1 protein plays this
role (Ipsaro et al., 2015). Further work has also shown that miRNAs promote target
destabilization prior to degradation by recruiting deadenylases through GW182 protein which
is also recognized by Ago (Fabian et al., 2011). In fact, GW182 proteins are mainly
characterized by the presence of an Argonaute-binding domain (ABD) and a silencing domain
(SD) (Jonas et al., 2015). The molecular mechanisms of miRNA-mediated translational
suppression in animals are still poorly understood, particularly the step in which translation is

28
blocked. To date, several mechanisms have been proposed; they involve GW182 and the
recruitment of translational repressors (Iwakawa et al., 2015, Jonas et al., 2015). However,
even though recent reports have enhanced our understanding of the miRNA-mediated
mechanisms of silencing, it is still believed that they may exert additional functions. In fact, it
is beginning to emerge that miRNA activity may oscillate between activation and repression
of target genes, as previously reported, particularly in cancer (Vasudevan et al., 2007,
Valinezhad et al., 2014). Therefore, there is no doubt that miRNA-mediated mechanisms in
regulating gene expression should be investigated further.

29
Figure 1.2. miRNA binding site on target sequence and its downstream consequences
The miRNA binding site on the target mRNA referred as “seed region” (A). Typically, this is
located between the 2nd and the 8th nucleotide at the 5' end of the miRNA but its length varies
among different molecules. The most common seed lengths are 6nt, 7nt and 8nt. The process
of target recognition (1) is followed by the recruitment of the RISC proteins Ago and GW182
(2) which together with other repressors mediate the cleavage of mRNA and the inhibition of
protein translation (3) (B).

30
1.1.3. Computational tools to predict microRNA-target interaction
It is thought that genes with longer 3’UTRs have a higher number of miRNA-binding sites,
compared to genes with shorter 3’UTRs. Moreover, genes with longer 3’UTRs are more
conserved and often involved in developmental processes (Cheng et al., 2009), whereas
housekeeping genes contributing to basic cellular mechanisms, although conserved, have
shorter 3’UTRs, thereby avoiding stringent miRNA-mediated post-transcriptional regulation
(Stark et al., 2005). However, it is well established that a single miRNA has the potential to
bind to multiple genes and, conversely, one gene can be targeted by multiple miRNAs.
Moreover, it is likely that single miRNA binds to different sequences in the same 3’UTR and
these binding sites might also overlap with each other. As mentioned earlier, miRNAs also
bind to the 5’UTR and CDS of transcripts. In addition, one must consider the presence of
Single-Nucleotide-Polymorphisms (SNPs) as well as Multiple-Nucleotide-Polymorphisms
(MNPs) and small insertions/deletions (INDELs). In fact, mutations in either of the sequences
(miRNA and target) can affect the miRNA-target interaction by creating and abolishing the
binding site, as well as modifying the binding affinity (Chen et al., 2008, Wei et al., 2012). For
this reason, prior to applying experimental approaches it is useful to characterize and predict
miRNA-target interactions “in silico”, as well as the putative presence of known
polymorphisms. To this aim, in the last few years, a number of bioinformatics and
computational tools have been developed. The current databases used to identify and predict
miRNA-target interactions, including SNPs databases, are briefly listed in Table 1.1. along
with a short description. They are characterized by intuitive function and a friendly interface
and can be easily accessed by less experienced users. Mostly, target prediction tools are
accessible via free web-sources but some of them can also be downloaded as software and
packages (R, C, Python, Java) for independent external searches (Riffo-Campos et al., 2016).
All of them rely on the function of different, dedicated algorithms that can be divided into two
main categories: rule-based algorithms and data-driven algorithms (Yue et al., 2009). Rule
based algorithms consider biological parameters including the seed region matching (Watson-
Crick complementarity), the conservation status between different species and the
thermodynamic features of RNA-RNA interaction (Riffo-Campos et al., 2016, Peterson et al.,
2014). The latter refer to the minimization of the free energy or Gibbs free energy (showing
how strong the miRNA binds to its target) and the site accessibility (the degree of openness of
the 3’UTR bound to a miRNA, representing how much the binding site is accessible) (Mathews
et al., 1999, Kertesz et al., 2007) (Figure 1.3.A-B). Indeed, the majority of target prediction

31
tools incorporate the Vienna RNA package and the PITA program, designed to calculate the
free energy and the accessibility energy (Lorenz et al., 2011, Kertesz et al., 2007). Data-driven
algorithms follow the same rules but they are further complemented with experimental findings
(validated interactions) (Yue et al., 2009). Interestingly, several databases contain both
predicted and validated modules and they also provide users with additional information (e.g.
miRWalk 2.0 contains tissue specific expression, cell line specific expression, gene-enrichment
analysis, wiki-pathways, disease associated miRNAs, based on published literature) (Dweep et
al., 2015).
32
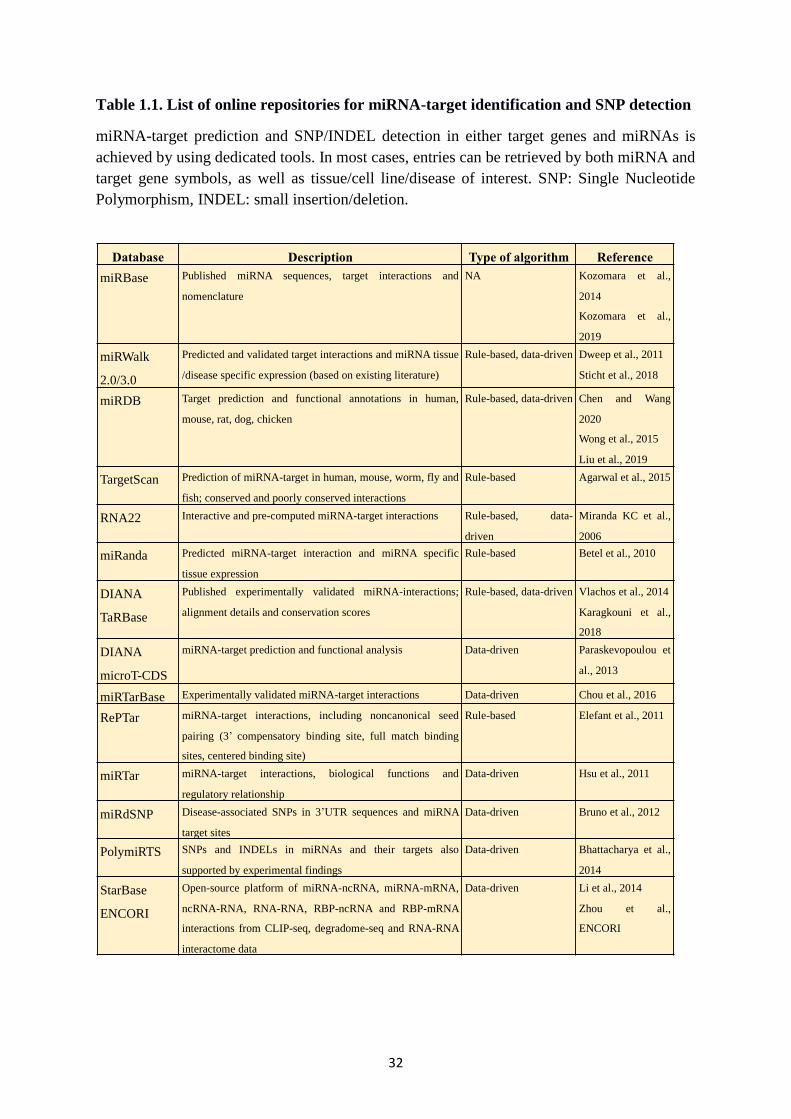
Table 1.1. List of online repositories for miRNA-target identification and SNP detection
miRNA-target prediction and SNP/INDEL detection in either target genes and miRNAs is
achieved by using dedicated tools. In most cases, entries can be retrieved by both miRNA and
target gene symbols, as well as tissue/cell line/disease of interest. SNP: Single Nucleotide
Polymorphism, INDEL: small insertion/deletion.
Database Description Type of algorithm Reference
miRBase Published miRNA sequences, target interactions and
nomenclature
NA Kozomara et al.,
2014
Kozomara et al.,
2019
miRWalk
2.0/3.0
Predicted and validated target interactions and miRNA tissue
/disease specific expression (based on existing literature)
Rule-based, data-driven Dweep et al., 2011
Sticht et al., 2018
miRDB Target prediction and functional annotations in human,
mouse, rat, dog, chicken
Rule-based, data-driven Chen and Wang
2020
Wong et al., 2015
Liu et al., 2019
TargetScan Prediction of miRNA-target in human, mouse, worm, fly and
fish; conserved and poorly conserved interactions
Rule-based Agarwal et al., 2015
RNA22 Interactive and pre-computed miRNA-target interactions Rule-based, data-
driven
Miranda KC et al.,
2006
miRanda Predicted miRNA-target interaction and miRNA specific
tissue expression
Rule-based Betel et al., 2010
DIANA
TaRBase
Published experimentally validated miRNA-interactions;
alignment details and conservation scores
Rule-based, data-driven Vlachos et al., 2014
Karagkouni et al.,
2018
DIANA
microT-CDS
miRNA-target prediction and functional analysis Data-driven Paraskevopoulou et
al., 2013
miRTarBase Experimentally validated miRNA-target interactions Data-driven Chou et al., 2016
RePTar miRNA-target interactions, including noncanonical seed
pairing (3’ compensatory binding site, full match binding
sites, centered binding site)
Rule-based Elefant et al., 2011
miRTar miRNA-target interactions, biological functions and
regulatory relationship
Data-driven Hsu et al., 2011
miRdSNP Disease-associated SNPs in 3’UTR sequences and miRNA
target sites
Data-driven Bruno et al., 2012
PolymiRTS SNPs and INDELs in miRNAs and their targets also
supported by experimental findings
Data-driven Bhattacharya et al.,
2014
StarBase
ENCORI
Open-source platform of miRNA-ncRNA, miRNA-mRNA,
ncRNA-RNA, RNA-RNA, RBP-ncRNA and RBP-mRNA
interactions from CLIP-seq, degradome-seq and RNA-RNA
interactome data
Data-driven Li et al., 2014
Zhou et al.,
ENCORI

33
Figure 1.3. Schematic overview of free energy and RNA site accessibility
RNA secondary structure showing a region of high free energy characterized by the presence
of a hairpin loop and a region of low free energy corresponding to the stem which increases
stability (A) (adapted from Peterson et al., 2014); example of an RNA secondary structure
illustrating the base-pairing probability, calculated by RNAFold WebServer
(http://rna.tbi.univie.ac.at//cgi-bin/RNAWebSuite/RNAfold.cgi) (B).

34
1.1.4. microRNAs in health and disease
Being master regulators of gene expression, cell differentiation, proliferation and apoptosis,
miRNAs are recognised to have a big impact on health and disease. Aberrant expression of
miRNAs has been implicated in virtually all human diseases, from inherited conditions to
cancer, autoimmunity, neurodegeneration, cardiovascular disease, metabolic disorders and
many others (Ardekani et al., 2010, Li et al., 2012). A strong link between miRNAs and human
diseases is seen in DiGeorge Syndrome, a genetic disorder characterized by a heterogeneous
group of defects and clinical manifestations, including immunodeficiency, skeletal and cardiac
anomalies, neuromuscular problems, hypocalcaemia and psychiatric illnesses. This syndrome
is caused by a deletion in chromosomal region 22q11.2, where the gene encoding Pasha
(DGCR8, also called DiGeorge Syndrome Chromosomal or Critical Region 8) is located. As
discussed above (Section 1.1.1. Genomics & biogenesis), Pasha acts as partner of Drosha in
the biogenesis of miRNAs. Therefore, patients affected by DiGeorge Syndrome show a pattern
of dysregulated miRNA expression, resulting in aberrant gene expression and multi organ
disease (de La Morena et al., 2013, Landthaler et al., 2004, Shiohama et al., 2003). miRNAs
are also required for normal development and organogenesis, as suggested by a multitude of
studies involving Dicer mutant animals and cell lines. In fact, it has been shown that mice
lacking Dicer1 die at embryonic stage, because of the lack of proliferation and differentiation
of embryonic stem cells (Bernstein et al., 2003). In zebrafish and Drosophila, deletion of
Dicer1 also results in development arrest and impairment of stem cell proliferation (Hatfield et
al., 2005, Wienholds et al., 2003). The same effect was observed in human embryonic stem
cells (hESCs), where the loss of DICER1 induces apoptosis and impairs self-renewal, due to
deficiency in mature miRNAs. In fact, transfection of selected miRNAs is able to rescue the
phenotype of DICER1-depleted cells, regulating the expression of apoptotic genes (Teijeiro et
al., 2018). As the fundamental impact of miRNAs on health and disease became clear, much
attention has focused on their potential role as biomarkers for disease diagnosis, prognosis and
responses to therapy. To date, a number of circulating miRNAs have been established as
diagnostic markers for different types of cancer, as well as in cardiovascular and infectious
diseases. For example, it has been shown that in HIV-infected patients plasma levels of miR-
29, miR-150 and miR-146b-5p are highly altered compared to healthy individuals (Faruq et
al., 2015, Monteleone et al., 2015, Munshi et al., 2014). Plasma miR-21-5p, miR-20a-5p, miR-
141-3p, miR-145-5p, miR-155-5p and miR-223-3p have been identified as biomarkers for
early diagnosis of non-small cell lung cancers (NSCLC) (Geng et al., 2014, Arab et al., 2017,

35
Zhang et al., 2017). Interestingly, miRNAs found in body fluids can also be used as diagnostic
biomarkers. A number of miRNAs found in the saliva have been shown to be predictive of
mild-traumatic brain injury and concussion, which is known to be difficult to diagnose (Di
Pietro et al., 2018). Five serum miRNAs (miR-1, miR-20a, miR-27a, miR-34 and miR-423-
5p) have been identified as strong diagnostic markers for gastric cancer (Liu et al., 2011), while
miR-125a-5p, targeting HER2, serves as a prognostic marker and could be used as a potential
therapy against gastric neoplasms (Nishida et al., 2011). Notably, the world’s first miRNA-
based therapeutic, miravirsen, is currently in phase II clinical trials for the treatment of hepatitis
C liver infection (HCV). It is based on the inhibition of miR-122, the most abundant miRNA
in the liver, which is known to be an important host factor for HCV pathogenesis (Lindow et
al., 2012).
36
1.2. Macrophages, a plastic cell population
Macrophages are professional phagocytes, first discovered in the late 19th century by Ilya
Metchnikoff (https://en.wikipedia.org/wiki/%C3%89lie_Metchnikoff). They represent a key
cell type of the innate immune system and according to environmental cues they can change
their physiology and become either protective or detrimental in the context of human disease.
The ability to integrate and respond to a wide range of extracellular signals, both pro- and anti-
inflammatory, makes macrophages one of the most versatile and plastic cell types of the
haematopoietic system (Wynn et al., 2013, Gordon et al., 2014). Macrophages function in a
multitude of biological processes such as inflammation (promotion/resolution),
immunosuppression, phagocytosis, apoptotic cell clearance (efferocytosis), wound healing,
tumour promotion (tumour-associated macrophages, TAMs) and intercellular communication
via the release of extracellular vesicles (Mosser et al., 2008, Koh et al., 2011, Quatromoni et
al., 2012, Ismail et al., 2013, Martin et al., 2014). This section summarises the main features
of macrophages, focusing on their plasticity and involvement in a variety of human diseases.
1.2.1. Origin and development
Macrophages reside in all the tissues of the body and, as for all blood cells, they arise following
a complex differentiation program. It was initially believed that macrophages only derive from
circulating monocytes but recently it has become clear that they have a dual origin: a proportion
of these cells originate from haematopoietic stem cells (HSCs) but most adult tissue resident
macrophage populations are established during embryonic development and before definitive
haematopoiesis (Epelman et al., 2014, Davies et al., 2015). In fact, through the power of fate-
mapping strategies it has been revealed that tissue macrophages derive from cells existing
within the yolk sac and the foetal liver (Schulz et al., 2012, Yona et al., 2013). The
differentiation of macrophages from HSCs strictly depends on the activity of Myb, a
haematopoietic transcription factor involved in myeloblastosis and leukemia (Sumner et al.,
2000, Lahortiga et al., 2007, Nguyen et al., 2016). However, macrophages derived from
embryonic and extra-embryonic tissues do not require Myb activity, suggesting that they are
genetically distinct from the blood precursor (Pattabiraman et al., 2013, Schulz et al., 2012).
Embryonic and monocyte-derived macrophage lineages are found in the brain (microglia), lung
(alveolar macrophages), liver (Kupffer cells), spleen (red pulp macrophages), heart (CCR2-
macrophages), skin (Langerhans cells), peritoneum and kidney. Macrophages populating the
skin, heart (CCR2+ macrophages) and gut also differentiate from circulating monocytes that
continuously replace them (Epelman et al., 2014).
37
1.2.2. Function and activation states
Being leukocytes, macrophages are motile cells. They have the ability to migrate through the
wall of blood vessels as monocytes into inflamed and damaged tissues, differentiating into
macrophages. This process is known as chemotaxis and it requires complex cellular signalling
(Jones et al., 2000, Xuan et al., 2015). More importantly, macrophages are characterized by
the expression of Toll-Like Receptors (TLRs) through which they detect and internalise
products of bacteria and pathogens. They also produce nitric oxide (NO) and reactive oxygen
species (ROS) facilitating the killing of phagocytosed microorganisms and secrete bioactive
lipids and multiple cytokines (Billack et al., 2006). Cytokines produced by macrophages
represent the link between innate and adaptive immunity and they can either promote or inhibit
inflammation, as well as cause tissue damage. The activation of macrophages toward different
phenotypes is called polarisation and it has been intensively studied in both human and animal
models. However, this is not a fixed event and classifying macrophage phenotypes still remains
a big challenge. According to the historical concept of polarisation, M1 macrophages are the
classically activated cells which exhibit a pro-inflammatory status, whilst M2 macrophages
display an anti-inflammatory phenotype and are mainly involved in tissue repair and
homeostasis (Martinez et al., 2008, Wang et al., 2014). M1 macrophages are activated by pro-
inflammatory cytokines such as INF- and LPS which enhance the expression of TLRs thus
favouring the phagocytic activity of macrophages. Moreover, these cells are characterized by
high levels of opsonic receptors (CD16) and IL-12 and low levels of IL-10. In addition, by
secreting high levels of IL-1, TNF-, IL-15, IL-18, IL-23, IL-8 and IL-6, M1 macrophages
significantly contribute to the activation and polarisation of Th1 cells and mediate pathogen
killing and tumour resistance. On the contrary, M2 phenotype arises when macrophages are
activated upon stimulation with anti-inflammatory cytokines, mainly IL-4 and IL-10. M2
macrophages are characterized by IL-10high and IL-12low expression and abundant levels of
non-opsonic receptors, such as the mannose receptor and scavenger receptors. They are further
classified in three subtypes M2a, M2b and M2c activated by different stimuli, including IL-4,
IL-10, IL-13, TGF-, glucocorticoids (GCs) and immune complexes (ICs). M2 macrophages
not only exert an anti-inflammatory activity, but they also contribute to wound healing,
immunoregulation, immunosuppression, tissue remodelling, clearance of apoptotic bodies and
tumour progression (Mantovani et al., 2004, Mantovani et al., 2005, Martinez et al., 2008,
Viola et al., 2019). From a metabolic point of view, it has been shown that murine macrophages
are characterized by the metabolism of arginine, which is a complex amino acid involved in a

38
variety of biological processes, ranging from single cell regulation to the whole organism
regulation. In M1 cells, arginine is used to produce NO, while in M2 macrophages it is mainly
catabolised to produce ornithine, urea and polyamines. The production of NO is mediated by
the inducible nitric oxide synthase (iNos), which is highly expressed by M1 cells and results in
increased cell death. Instead, ornithine, urea and polyamines are generated by arginase (Arg),
abundant in M2 cells, which in turn promote proliferation. These two enzymes are among the
most employed markers enabling the functional characterization of M1 and M2 macrophages
in mice (Rath et al., 2014). However, in human macrophages the expression and activity of
iNos and arginase is still under debate. In fact, many groups have been able to detect them but
others have not. It seems that the presence of arginine-metabolizing enzymes strictly depends
on cell source (i.e. blood-derived macrophages and tissue resident macrophages), as well as the
health status of the individual (Thomas et al., 2014). In addition to arginine metabolism,
different macrophages display different lipid metabolism pathways. M1 macrophages rely on
fatty acid synthesis (FAS), while M2 cell metabolism is mainly supported by fatty-acids
oxidation (FAO), which is also thought to promote cellular longevity (Remmerie et al., 2018).
Macrophage phenotypes and their main functions are illustrated in Figure 1.4.
39
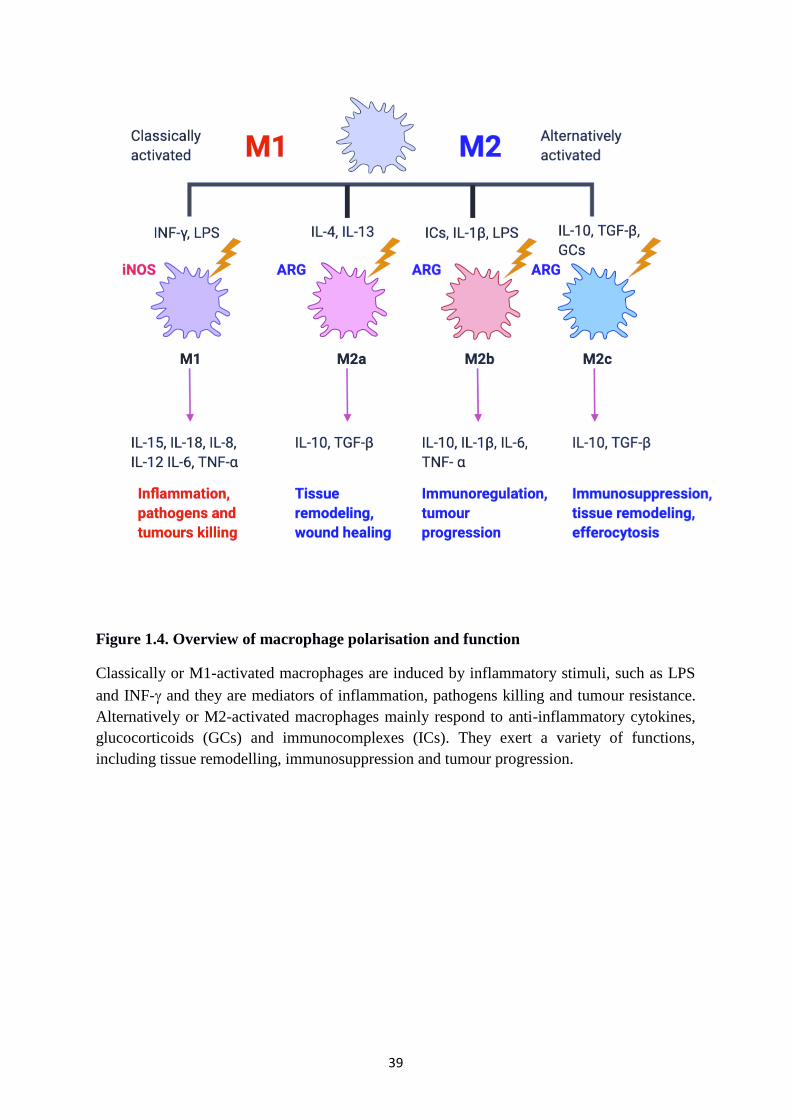
Figure 1.4. Overview of macrophage polarisation and function
Classically or M1-activated macrophages are induced by inflammatory stimuli, such as LPS
and INF- and they are mediators of inflammation, pathogens killing and tumour resistance.
Alternatively or M2-activated macrophages mainly respond to anti-inflammatory cytokines,
glucocorticoids (GCs) and immunocomplexes (ICs). They exert a variety of functions,
including tissue remodelling, immunosuppression and tumour progression.

40
1.2.3. Macrophages in health and disease
Traditionally considered the first line of defence against infectious diseases, macrophages play
a crucial role in maintaining all tissues in a healthy condition, for example by directing the
clearance of dead and dying cells, as well as toxic substances and pathogens. The physiological
roles of macrophages have been intensively studied in metabolic tissues (adipose tissue and
liver) where, polarised towards an anti-inflammatory M2 phenotype, they control and maintain
insulin sensitivity and energy homeostasis, especially after an increased caloric intake
(Fujisaka et al., 2016). However, in individuals affected by obesity the protective role of
macrophages is subverted: they switch to the pro-inflammatory M1 phenotype, promoting a
low-grade chronic inflammation, thus leading to insulin resistance, fibrosis and fatty liver
disease (Claria et al.,2011, Odegaard et al., 2013). Both M1 and M2 macrophages play a key
role in the pathogenesis of atherosclerosis, a chronic inflammatory disease caused by lipid
retention in the arterial wall. Recruited at the site of the lesion, macrophages accumulate in the
arterial intima where they uptake atherogenic lipoproteins via either scavenger receptors or
micropinocytosis, promoting the formation of foam “fatty” cells, the hallmark of the
atherosclerotic plaque. The population of macrophages found in the plaques is highly
heterogeneous but it is believed that M1 macrophages are present in progressing plaques, at an
early stage, while M2 macrophages, involved in the mechanisms of repair and stabilization, are
found in regressing plaques (Moore et al., 2013, Bobryshev et al., 2016). A dual role for
macrophages has been also established in cancer, where they take the name of tumour-
associated macrophages (TAMs). Up to 50% of solid tumours are composed of macrophages:
they have been shown to facilitate angiogenesis, immunosuppression, invasion and metastasis
and for this reason they have formed a key area of investigation for the development of cell-
based therapies and genetic reprogramming strategies (Yang et al., 2018). Several studies
reported that either genetic or pharmacological inhibition of macrophage-colony stimulating
factor (M-CSF) results in a strong reduction in the number of TAMs thus suppressing
angiogenesis and tumour growth and progression in different cancer models (Kubota et al.,
2009, Pyonteck et al., 2012, Ryder et al., 2013). TAMs derive from both circulating monocytes
and embryonic tissues and they usually display different activation states, depending on the
type of cancer, as well as the stage (Zhu et al., 2017, Laviron et al., 2019). Due to the high
plasticity of TAMs, they cannot be defined by the classical M1/M2 nomenclature. It is,
however, widely accepted that the population of macrophages found in tumours more closely
resembles the phenotype of M2-like cells. In fact, TAMs express high levels of arginase, which,

41
as mentioned before, is required for cell proliferation and it is also linked to
immunosuppression (Bronte et al., 2005, Mantovani et al., 2013, Laviron et al., 2019). Indeed,
inhibiting arginase expression has a negative effect on tumour growth and has been shown to
shift TAMs toward a pro-inflammatory phenotype (Sharda et al., 2011, Steggerda et al., 2017).
Pro-inflammatory M1-macrophages are thought to be protective against cancer, due to their
cytotoxic activity. It has been reported that M2 cells predominate over M1 in tumour tissue and
cancer patients with higher infiltration of M1 cells in the tumour show a better overall survival,
compared to patients with low M1 macrophages infiltration (Ohri et al., 2009, Jackute et al.,
2018). In addition, mice lacking Stat6, a transcription factor required for M2 polarisation,
produce M1 macrophages with high levels of iNOS and are resistant to metastatic disease
compared to control mice (Sinha et al., 2005). Similarly, the pharmacological inhibition of
STAT3, another transcription factor required for M2 activation, induces tumour cell apoptosis
and enhanced tumour immunogenicity (Xin et al., 2009). Interferon regulatory factor 5 (IRF-
5) in combination with its activating kinase IKKβ has also been tested and was successful in
generating anti-tumour immunity through M1 induction in models of melanoma, glioblastoma
and ovarian cancer (Zhang et al., 2019). However, it is important to mention that the tumour
microenvironment (TME) “educates” macrophages and TAMs often sharing features of both
M1 and M2 varying among individual stages of tumour development (Qian et al., 2010, Laoui
et al., 2011, van Dalen et al., 2018).
In addition to insulin resistance, cardiovascular disease and cancer, the plasticity of
macrophages has also been implicated in autoimmunity, rheumatoid arthritis, kidney disease
and neuroimmune disorders (Kinne et al., 2000, Duffield et al., 2010, Fan et al., 2016). The
contribution of macrophages to human health and disease is schematized in Figure 1.5.

42
Figure 1.5. The contribution of macrophages to health and disease
Macrophages play a crucial role in maintaining all tissues in a healthy state, acting as
modulators of immunity, metabolism and tissue homeostasis. However, in the presence of a
pathological insult their protective role is subverted: closely involved in a multitude of
biological processes, macrophages can trigger a variety of human diseases including cancer,
atherosclerosis, insulin resistance, fibrosis, fatty liver and autoimmunity.
Health Disease
Immunity Inflammation,
autoimmunity
Tissue Homeostasis Cancer and
metastasis
Cardiovascular
System
Atherosclerosis
MetabolismObesity, Insulin
Resistance, Fibrosis, Fatty Liver

43
1.2.4. microRNAs regulating macrophage development and function
In the past few years, miRNA regulation of macrophage development, function and
polarisation has been the subject of intense research. It has been shown that murine macrophage
development from haematopoietic precursor cells requires the expression of a specific subset
of miRNAs (miR-146a, miR-342, miR-338, miR-155) which are induced by the transcription
factor PU.1 (Zhang et al., 1994); miR-146, has also been tested in zebrafish, confirming its
crucial and conserved role in macrophage differentiation (Ghani et al., 2011). However, the
importance of miR-146 in macrophage differentiation appears to be controversial.
Starczynowski and colleagues reported that over-expression of miR-146a in mouse
hematopoietic precursor cells causes a reduced differentiation and survival of these cells,
mimicking the cytotoxic effect of LPS long exposure (Starczynowski et al., 2011). PU.1 also
suppresses a specific cluster of miRNAs (miR17-5p, miR-18a, miR-20a, miR-92) which have
been shown to act in a feedback loop with the transcription factor acute myeloid leukemia-1
(AML1) during haematopoiesis (Fontana et al., 2007, Ghani et al., 2011). Several studies
identified specific subsets of miRNAs that are differentially expressed in distinct macrophage
phenotypes. By using a miRNA microarray analysis in cultured bone marrow derived
macrophages (BMDMs), Zhang and colleagues identified a total of 109 miRNAs differentially
expressed between M1 and M2 conditions (Zhang et al., 2013). M1 polarised macrophages are
characterized by the expression of miR-181a, miR-155-5p, miR-204-5p, miR-451, whereas M2
macrophages differentially express miR-125-3p, miR-146-3p, miR-143-3p, miR-145-5p
(Zhang et al., 2013). In particular, miR-155 has been intensively studied in M1 polarised
macrophages. It has been shown that macrophages derived from miR-155 knockout mice do
not express M1 related genes, even in response to stimulation with LPS and INF- (Jablonski
et al., 2016). Moreover, the lack of miR-155 is linked to the dysregulation of approximately
650 genes previously associated with M1 phenotype (Jablonski et al., 2015). Accordingly,
myeloid specific knockout of miR-155 enhances tumour growth in a breast cancer mouse
model, due to the lack of M1 anti-tumoural immunity (Zonari et al., 2013). Macrophage
polarisation has also been linked to the activity of miR-21, which has been found by several
groups to suppress M1 cells and favour M2 macrophage polarisation (Caescu et al., 2015,
Wang et al., 2015). Consistent with these findings, miR-21 expression is associated with poor
survival in patients with specific cancers. miR-21 knockout mice develop smaller tumours
compared to controls, suggesting that the lack of miR-21 activates genes able to re-educate
TAMs towards an M1-like phenotype (Xi et al., 2018). Another M2-specific miRNA is miR-

44
124, which has been shown to upregulate CD206, Ym1, Fizz1, Arg1 and TGF- and
downregulate iNOS, CD86, TNF- (Veremeyko et al., 2013). Furthermore, miR-124
expression is strongly induced by IL-4 and IL-13 (Veremeyko et al., 2013). Another miRNA
controlling macrophage function is miR-101-3p, which directly target the 3’UTR of the dual
specificity phosphatase (DUSP1) and the ATP-binding cassette transporter A1 (ABCA1). By
negatively modulating these genes, miR-101-3p enhances inflammation and promote
cholesterol accumulation in macrophages, thus offering a promising target to simultaneously
antagonize inflammation and improve lipid metabolism (Wei et al., 2015, Zhang et al., 2015).
Although many other miRNAs have been implicated in macrophages, there is little information
about miRNA-mRNA networks in human macrophages and there are often opposing data. This
raises the need for integrated transcriptomic analysis to identify multiple gene networks that
can be used for both mechanistic investigations and novel drug development.
1.2.5. Limitations of the M1/M2 paradigm
The M1/M2 classification of functional macrophage phenotypes has been widely used to
characterize macrophage populations in vitro and so far, has provided useful insights into the
role of macrophage in health and disease. However, when it comes to complex in vivo
environments, this model has significant limitations: macrophages generate heterogeneous and
dynamic responses that are not easy to categorize, especially during some diseases (Martinez
et al., 2014, Laviron et al., 2019). Martinez and Gordon suggested that M1 and M2 features do
not exclude each other, but they can coexist, giving rise to a mixed phenotype that only depends
on the balance of activating and inhibiting environmental signals. For this reason, the role of
M1 and M2 should be considered beyond the historical, bipolar classification (Martinez et al.,
2014). Mitsi and colleagues have observed that steady state alveolar macrophages are
characterized by both M1 and M2 signatures and this mixed phenotype can be changed by
environmental stresses and stimuli, such as HIV infection (Mitsi et al., 2018). Trombetta and
colleagues also reported the existence of a mixed M1/M2 population in the lung of patients
affected by systemic sclerosis (Trombetta et al., 2018). Other examples of macrophage
heterogeneity come from atherosclerosis and cancer (as previously discussed in section 1.2.3.
Macrophages in health and disease). They are diseases in which both pro- and anti-
inflammatory cells play decisive roles, more often in a stage- and environment-dependent
manner. Both M1 and M2 makers have been detected in atherosclerotic plaques: M2 cells
populate the stable region, while M1 cells are more abundant in the unstable plaque (de

45
Gaetano et al., 2016). Similarly, TAMs found in non-small cell lung cancer (NSCLC) consist
of a mixed M1/M2 populations: Jackute and colleagues observed that the tumour tissue and
stroma are mostly populated by M2 cells, but the tumour islets host cytotoxic M1 macrophages
(Jackute et al., 2018). Recently, melanoma extracellular vesicles (EVs) have been shown to
influence macrophage polarisation, towards a mixed M1/M2 phenotype (Bardi et al., 2018). In
the light of these recent observations and to sum up, macrophage polarisation is a complex,
dynamic and flexible process that depends on the surrounding environment. Therefore,
classifying macrophages into M1 and M2 phenotypes often does not fully reflect what happens
in physiological contexts.

46
1.3. Tribbles pseudo-kinases: regulators of inflammation, metabolism and
cancer
Described for the first time in Drosophila melanogaster as regulators of mitosis and
morphogenesis via string/cdc25 (Mata et al., 2000), Tribbles genes are now the subject of
intense investigation in mammals, due to their involvement in numerous signalling pathways.
Here, we briefly describe the function and key interacting partners of Tribbles proteins, mostly
focusing on Tribbles-1 and discussing its critical role in the control of inflammation,
metabolism and cancer.
1.3.1. Tribbles, a family of pseudo-kinases
Tribbles (TRIBs) genes encode for an evolutionary conserved family of pseudo-kinases that
control a wide range of interacting signalling pathways. In mammals, three TRIB family
members have been identified (TRIB1, TRIB2, TRIB3) and they have been associated with a
significant number of human diseases, including cancer, cardiovascular disease, inflammation
and immune-metabolic disorders (Hegedus et al., 2006, Kiss-Toth 2011, Yokoyama et al.,
2011). Sequence alignments revealed a high conservation of TRIB proteins between human
and mouse (identities: TRIB1, 97.5%, TRIB2, 99.2%, TRIB3, 81.2%) and a high degree of
similarity among different human TRIBs (TRIB1/TRIB2, 71.3%, TRIB1/TRIB3, 53.3%,
TRIB2/TRIB3, 53.7%). It is thought that TRIB proteins are mainly located in the nucleus, but
can also interact with their partners in the cytoplasm. TRIB1 and TRIB2 are strongly associated
with subsets of acute myeloid leukemia (AML), while TRIB3 has mainly been studied in the
context of metabolic disorders, including insulin resistance, atherosclerosis (Yokoyama et al.,
2011) and cancer (Dong et al., 2016, Yu et al., 2019).
1.3.2. Overview of Tribbles binding partners
Structurally, TRIBs are three-domain proteins that contain an N-terminal PEST region, a
pseudo-kinase domain and a C-terminal, COP1-binding region. However, they lack a
functional adenosine 5’-triphosphate (ATP) binding site and therefore classified as
catalytically inactive pseudo-kinase proteins. It has been proposed that through the pseudo-
kinase domain, TRIBs act as adaptors or scaffold kinases facilitating the assembly with other
proteins (Hegedus et al., 2007, Lohan et al., 2013). In addition, structural studies demonstrated
that TRIB proteins have a unique C-terminal domain defined by two distinct motifs: the HPW

47
[F/L] motif binding to the MAPKK/MEK family members and the DQVXP [D/E] that targets
the E3-ubiquitin ligases, including the constitutive photomorphogenic protein 1 (COP1)
(Yoshida et al., 2013, Eyers et al., 2017) (Figure 1.6.). Through these motifs, TRIB proteins
exert multiple functions in different cell types and tissues, important for the development of
cancer and in the control of inflammatory signalling. TRIBs selectively regulate several
members of the mitogen-activated protein kinase kinase (MAPKK) pathway, including ERKs,
JNKs and p38 MAPK. It has been shown that TRIB1 is able to control the extent and specificity
of MAPK activation depending on its expression level (Kiss-Toth et al., 2004, Sung et al.,
2005, Guan et al., 2016). By recruiting E3 ubiquitin ligases, TRIBs have been shown to
promote target protein degradation. In fact, both TRIB1 and TRIB2 cause the degradation of
C/EBPα and this has been associated with the development of acute myelogenous leukemia in
murine models (Keeshan et al., 2006, Dedhia et al., 2010). Furthermore, by blocking C/EBPβ,
TRIB1 impairs TLR-mediated responses and leads to a dysregulation of LPS-inducible genes
and NF-IL6 in murine macrophages (Yamamoto et al., 2007). TRIB2 also promotes the
proteolysis of C/EBPβ and this together with the inhibition of AKT has a strong inhibitory
effect on adipocytes differentiation in mice (Naiki et al., 2007). Similarly, TRIB3 has been
associated with the degradation of acetyl coenzyme carboxylase (ACC) in adipose tissue
through the recruitment of COP1. In fact, adipose tissue lacking TRIB3 accumulates ACC (Qi
et al., 2006). In adipose tissue, TRIB3 also interacts with PPARγ which results in the
suppression of adipocytes differentiation (Takahashi et al., 2008). Moreover, TRIB3 is thought
to contribute to insulin resistance by inhibiting the phosphorylation of AKT. In fact, hepatic
overexpression of TRIB3 leads to hyperglycemia and glucose intolerance (Du et al., 2003).
Notably, diabetic patients show an increased expression of TRIB3 compared to healthy
controls suggesting a central role of TRIB3 in the pathogenesis of insulin resistance (Liu et al.,
2010). TRIB protein-protein interactions and their biological effect are briefly listed in Table
1.2.

48
Figure 1.6. TRIB protein structure and interactions
TRIB proteins contain a N-terminal PEST domain, a Ser/Thr kinase-like domain lacking a
functional ATP binding pocket and a C-terminal domain that mediate the interactions of TRIB
with other factors. Due to the presence of two motifs HPW[F/L] and DQVXP[D/E] in the C-
terminal domain, TRIBs interact with MAPKK/MEK family members and E3-ubiquitin
ligases, respectively. Interactions with MAPKK/MEK mainly affect inflammatory and
proliferative pathways, whilst via binding the ubiquitin E3 ligases, such as COP1, TRIBs
regulate degradation of target proteins, affecting different biological processes.

49
Table 1.2. TRIB protein-protein interactions and their biological effect
TRIB interactions with target proteins mainly occur through their C-terminal domain,
containing specific MAPKK/MEK and E3-ligases binding sites. Most biological effects are
crucial in the context of inflammation and adipogenesis.
Tribbles Protein Biological Effect Cell Type Reference
TRIB1-3 MEK-1 ERK phosphorylation
enhancement, myeloid
leukemia
HeLa, U2OS,
HEK293, NIH 3T3
Kiss-Toth et al., 2004, Yokoyama
et al., 2010
TRIB2,
TRIB3
AKT Suppression of adipocytes
differentiation and insulin
resistance
Hepatocytes, 3T3-
L1 adipocytes
Du et al., 2003, Naiki et al., 2007
TRIB1,
TRIB2
C/EBPα Acute myelogenous leukemia Haematopoietic
stem cells
Dedhia et al., 2010
TRIB1,
TRIB3
MKK4 Inhibition of vascular smooth
muscle cells migration
Vascular smooth
muscle cells
Sung et al., 2007
TRIB3 CHOP Endoplasmic reticulum (ER)
stress and apoptosis
induction
A375, HEK293,
HepG2
Ohoka et al., 2005, Ohoka et al.,
2007
TRIB3 SIAH1 Inhibition of TGF-β signaling HEK293T Zhou Y et al., 2008
TRIB1,
TRIB2
C/EBPβ Suppression of adipocytes
differentiation; TLR
responses enhancement
Adipocytes,
macrophages
Naiki et al., 2007, Yamamoto et
al., 2007
TRIB3 PPARγ Suppression of adipogenesis 3T3-L1 adipocytes Takahashi et al., 2008
TRIB1-3 COP1 Target proteins degradation Adipocytes, 32Dcl3,
HEK293T
Qi et al., 2006, Keeshan et al.,
2010, Yoshida et al., 2013

50
1.3.3. Cell-context dependent functions of Tribbles
TRIBs can exert opposing roles in a cell-dependent manner. In fact, it is well appreciated that
they can act both as oncogenes and oncosuppressors, activators and repressors of inflammation.
Several groups have shown that TRIB3 is critical in breast cancer pathogenesis: it supports
cancer cells stemness by regulating FOXO1-AKT interaction (Yu et al., 2019) and NOTCH1
signalling pathway (Izrailit et al., 2013); it is also thought to contribute to the development of
breast cancer radiation resistance (Lee et al., 2019). TRIB3 knockdown in radiation-resistant
breast cancer cell lines was shown to sensitize cells toward radiotherapy, by reducing NOTCH1
activation (Lee et al., 2019). High levels of TRIB3 have been also associated with other
neoplasia, including colorectal (Hua et al., 2019) and lung cancer (Zhou et al., 2013, Zhang et
al., 2019). However, in different contexts TRIB3 can behave as an oncosuppressor: Salazar
and colleagues reported that TRIB3 is implicated in the anti-tumoral activity of cannabinoids,
by regulating autophagy. They also found that genetic inhibition of TRIB3 enhances
tumorigenesis in different cancer models and this is due to TRIB3’s ability to control and
modulate the extent of AKT activation (Salazar et al., 2015). Similarly, TRIB1 seems to have
a dual role in regulating inflammation, depending on the context. Ostertag and colleagues have
demonstrated that Trib1 mRNA is upregulated in response to inflammatory stimuli (i.e. LPS)
in the whole white adipose tissue (WAT) depot of mice, but not in the macrophage-enriched
fractions; moreover, Trib1 acts as activator of inflammation in adipose tissue as its deficiency
in adipocytes impairs IL-6 and IL-1β gene expression and also protects mice from high-diet
induced obesity (Ostertag et al., 2010). On the contrary, the lack of Trib1 in the haematopoietic
system causes an increase in pro-inflammatory cytokines, as well as hypertriglyceridemia and
insulin resistance (Akira et al., 2013). The role of TRIB1 in inflammation is further discussed
in the next section.
1.3.4. TRIB1-mediated control of macrophages
TRIB1 is a critical regulator of tissue resident macrophage differentiation. Tissue resident
macrophages are M2-like cells which mainly display an anti-inflammatory phenotype under
homeostatic condition. A massive reduction of M2 macrophages has been observed in bone
marrow, spleen, lung and adipose tissue of mice lacking Trib1 in the haematopoietic system.
This is due to the aberrant expression of C/EBPα, a TRIB1 downstream factor (Satoh et al.,
2013). Interestingly, the lack of macrophages in these mice has also been associated with an
increase in lipolysis and a reduction of adipose tissue mass. This pathological phenotype was

51
rescued when M2-macrophages were injected in the mice. Notably, when fed with a high fat
diet, Trib1 knockout mice developed insulin resistance and hypertriglyceridemia. These results
show that by regulating macrophages differentiation TRIB1 is also essential for the
maintenance and functioning of adipose tissue, as well as lipid homeostasis (Satoh et al., 2013).
TRIB1 also plays a role in macrophage migration. TRIB1 knock-down in RAW264.7 cells
impairs macrophage migration behaviour mediated via C/EBPβ and TNF-α and is also
associated with a change in cell morphology (Liu et al., 2013). It has been demonstrated that
in absence of TRIB1, macrophages do not show MCP-1 induced chemotaxis, they detach and
appear rounded with monocyte-like features (Liu et al., 2013). In addition, it has been reported
that Trib1 deficiency change bone marrow-derived macrophages (BMDMs) phenotype, by
downregulating both M1 markers (Il6, Il1, Nos2) and M2 genes (Arg1, Fizz1, Cd206) (Arndt
et al., 2018). Recently, TRIB1 has been implicated in atherogenesis, particularly in
macrophage foam cell formation (Fu et al., 2017, Johnston et al., 2019). Over-expression of
TRIB1 in THP1-derived macrophages exposed to oxidized-LDL decreases intracellular lipid
accumulation and increases cholesterol efflux (Fu et al., 2017). In contrast, work recently
published from our group by Johnston and colleagues showed that myeloid specific knockout
of Trib1 is atheroprotective, while myeloid overexpression is detrimental in vivo. Trib1
overexpression upregulates the oxidized LDL receptor (OLR-1), increasing lipid uptake and
foam cell formation in two distinct experimental models of atherosclerosis (Johnston et al.,
2019). Taken together these data suggest a pivotal role of TRIB1 in macrophage biology.
However, considering the existence of contrasting results (Fu et al., 2017, Johnston et al.,
2019) and the lack of experimental data in human macrophages, further investigation is needed.
1.3.5. TRIB1 and Prostate Cancer
Prostate cancer (PCa) is one of the most common malignancies in men with over 1 million new
cases diagnosed per year, worldwide. PCa is a slow-growing cancer, it usually has a long
progression and it can also remain asymptomatic for a long period. However, the majority of
patients experience urinary dysfunction and sexual discomfort (Shen et al., 2010). Although
human PCa is considered to be highly heterogeneous, it has been reported that more than 95%
of these cancers are classified as adenocarcinomas that, in common with most tumours, have
the ability to spread from their original site and preferentially metastasize in the lungs, liver,
pleura, adrenals, brain and bone (Shen et al., 2010). Bone metastasis has been described as the
most common for PCa, as well as the most severe for patients; it is also characterised by the

52
presence of peculiar osteoblast lesions (Bubendorf et al., 2000, Logothetis et al., 2005). Despite
recent progress and the existence of different therapeutic strategies, the management of
advanced and metastatic PCa still remains a big challenge (Shen et al., 2010, Litwin et al.,
2017). Furthermore, the mutation rate in PCa is lower, compared to other cancer types. In fact,
no single gene has been found to be responsible for the development of PCa but a significant
number of genetic aberrations in multiple loci has been implicated (Lawrence et al., 2014,
Wang et al., 2018, Testa et al., 2019). Among them it is important to mention mutations in
androgen receptor (AR), phosphatase and tensin homolog (PTEN), Homeobox Protein NK-3
Homolog A (NKX3-1), adenomatous polyposis coli (APC), breast cancer susceptibility genes
(BRCA1 and BRCA2), ATM Serine/Threonine Kinase (ATM) and Speckle Type BTB/POZ
Protein (SPOP) (Wang et al., 2018).
TRIB1 has recently been reported to have a role in the tumorigenesis and progression of PCa.
Mashima and colleagues found that TRIB1 is upregulated in PCa and required for the in vitro
growth of the cancer under 3D conditions, by regulating the expression of endoplasmic
reticulum (ER) chaperones (Mashima et al., 2014). Interestingly, the pseudo-kinase seems to
promote M2 macrophage polarisation in the immune microenvironment of the tumour: in fact,
the RNA expression of TRIB1 positively correlates with the amount of CD163+ macrophages
infiltration (Liu et al., 2019). Moreover, data mining of PCa expression datasets shows
overexpression and amplification of the TRIB1 gene, as well as correlation with risk,
aggressiveness and survival. A short tandem repeat (STR) found in the 3’UTR of TRIB1 was
significantly associated with prostate cancer risk and it is thought to alter TRIB1 mRNA
expression and stability (Moya et al., 2018). However, despite published data and in silico
analysis suggest an emerging role for TRIB1 in the pathogenesis of PCa, the mechanisms
underlying its overexpression still remain unknown and require further investigation.
More information about miRNAs and TRIB1 in PCa is provided in the introduction section of
Chapter 6, miRNAs regulating TRIB1 in PCa.
1.3.6. TRIB1: an unstable transcript
The TRIB1 mRNA is highly unstable, showing a half-life shorter than 1 hour (Sharova et al.,
2009). This is often cell/tissue specific and likely due to the presence of endogenous post-
transcriptional regulators. In mouse embryonic stem cells Sharova and colleagues identified
TRIB1 among the top 50 genes with the most unstable mRNA half-life. They also reported that
genes with unstable mRNAs often exert regulatory functions (transcription factors), while

53
stable mRNA species with longer half-lives are genes related to cell structure and metabolism
(Sharova et al., 2009). TRIB1 gene expression is highly variable among different cell types
and tissues, suggesting it might be subject to cell type-dependent post-transcriptional regulation
(Sung et al., 2006). In fact, the 3’UTR of TRIB1 mRNA represents more than 50% of the whole
sequence (1.5 Kbp), it is highly conserved among different animal species and it is enriched in
regulatory binding sites. Soubeyrand and colleagues have showed that blocking transcription
through actinomycin-D dramatically reduced TRIB1 mRNA levels in HeLa and arterial smooth
muscle cells (ASMCs) but inhibiting protein translation using cycloheximide and puromycin
had the opposite effect (Soubeyrand et al.,2016). This may be explained with the presence of
a compensatory mechanism enhancing TRIB1 transcription when the protein translation is
compromised. Nevertheless, the post-transcriptional regulation of TRIB1 expression remains
largely unknown.
1.3.7. TRIB1 as a potential target of multiple microRNAs
Currently, there is little information about TRIB1 upstream regulators. However, in silico
analysis show that TRIB1 is a potential target of multiple miRNAs, both in human and in
mouse. To date, only a few interactions have been experimentally validated. In PCa, TRIB1
has been shown to be negatively modulated by miR-224, a miRNA often silenced in cancer.
The expression level of miR-224 and TRIB1 negatively correlates in prostate tissue and their
interaction results in the suppression of cell proliferation, invasion and metastasis (Lin et al.,
2014). Moreover, it has been shown that in hepatocellular carcinoma (HCC), where TRIB1 is
usually overexpressed, miR-23a directly targets the 3’UTR of the pseudo-kinase, affecting
HCC cell growth, through a mechanism involving p53 and -catenin (Ye et al., 2017). TRIB1
is also regulated by miR-202 in HepG2 and primary hepatocytes, as was shown in our research
group (Ilyas et al., 2015, unpublished, manuscript under development). We found an inverse
correlation between miR-202 and TRIB1 expression levels in an inflammatory context (Ilyas
et al., 2015, unpublished). Considering its role in a multitude of signalling pathways and its
short half-life, investigating TRIB1 post-transcriptional regulation by miRNAs seems a
promising strategy to identify endogenous upstream regulators of the pseudo-kinase that might
be used to modulate its expression in a tissue-specific context. Therefore, further work in this
field is needed.
54
1.4. Tribbles Research and Innovation Network (TRAIN)
Tribbles Research and Innovation Network (TRAIN, http://train-itn.eu) is a project funded by
the European Union’s Horizon 2020 research and innovation programme that started in 2017,
under the Marie Sklodowska Curie ITN Project Grant No 721532. TRAIN has brought together
a group of scientists working at the interface of metabolism, immunity and cancer, for a total
of 15 distinct multi-disciplinary research projects, spread across 6 European countries. The
purpose of the TRAIN Consortium is to unravel the role of Tribbles pseudo-kinases in the
development and progression of prostate cancer, with particular focus on metabolic and
immune responses. The TRAIN scientific programme contains at least four different work
packages: metabolism, immunity, cancer and genomics/system biology; all of them mainly
focus on the function of TRIB1 and TRIB3 in macrophages, adipocytes, T-regulatory cells,
Natural Killer cells and prostate cancer cells. My individual PhD project sits in the
genomics/system biology package, as it is based on the identification and characterization of
miRNAs targeting TRIB1, by using a combination of wet lab and bioinformatics procedures.
The cell type of my focus is human macrophage as it is closely involved in immunity and
metabolism, as well as in cancer. Therefore, the work presented in this thesis is mostly related
to macrophage biology. However, to integrate my PhD individual project within the TRAIN
Consortium interests I have performed some experiments using prostate cancer cell lines,
which are described in Chapter 6, as a minor results chapter.

55
1.5. Hypothesis
Although the downstream interactors of TRIB1 are well characterised, the mechanisms
underlying its regulation are still largely unknown. Considering the length of its 3’UTR,
we hypothesised that TRIB1 undergoes post-transcriptional regulation by microRNAs.
The purpose of this study is to identify and characterise miRNAs regulating TRIB1
expression by using a combination of computational and experimental approaches, with
focus on human macrophages and prostate cancer in vitro models. Since TRIB1 genetic
variants have been associated with disease traits and susceptibility, we also aim to
investigate the potential impact of TRIB1 non-coding SNPs on miRNA-binding sites.

56
Chapter 2. General Materials and Methods
Part I, In Silico
2.1. microRNA-target prediction and databases management
microRNA-target prediction analysis was performed to identify miRNAs regulating TRIB1
expression. We used 7 prediction tools, listed in Table 2.1.; all of them were used online,
except miRanda, which was downloaded and used locally as independent software.
miRanda is a dedicated algorithm developed for the detection of miRNA binding sites in target
sequences. It reads RNA from a first input file containing mature miRNA sequences and DNA
or RNA sequences from a second input file containing genes of interest. Between the two sets
of sequences (Reference and Query), miRanda algorithm performs a dynamic local alignment
and calculates the thermodynamic stability of RNA/RNA duplexes. This step takes advantage
of the ViennaRNA package written by Ivo Hofacker (Lorenz et al., 2011) and included in the
script. miRanda detection software (Version 3.3a, Computational Biology Center of Memorial
Sloan-Kettering Cancer Center, http://www.microrna.org/) was downloaded in C and used as
an open source method under the GPL. The following default parameters were used, according
to the original script:
Gap Open Penalty: -9.000000
Gap Extend Penalty: -4.000000
Score Threshold: 140.000000
Energy Threshold: 1.000000 kCal/mol
Scaling Parameter: 4.000000
miRanda input files were used in FASTA format: human mature miRNAs sequences were
downloaded from miRbase 22.1 (http://www.mirbase.org/ftp.shtml), while TRIB1 3’UTR
sequence (NM_025195.4, transcript variant 1) was taken from NCBI database
(https://www.ncbi.nlm.nih.gov/). The output files generated by miRanda algorithm were post-
processed and organised in tables by using Python (Python v3.6.2/BioPython v1.70). Tables
were imported in MySQL database (pgAdmin version 4, Management Tools for PostgresSQL),
along with the outputs generated by other prediction tools used (which were downloaded from
the webpages of the tools). Results were filtered and analysed by using structural queries and

57
are explained in Chapter 3. The total number of miRNAs predicted to target the 3’UTR of
TRIB1 was obtained following these filtering steps:
Detect the number of miRNAs predicted by each algorithm;
Eliminate duplicates (same miRNAs predicted by different algorithms);
Select only “high confidence” miRNAs, taken from miRbase 22.1
(ftp://mirbase.org/pub/mirbase/22.1/).
Further filter the list selecting only miRNAs which are present in at least 3 databases
(miRanda, TargetScan and Starbase);
Scripts used to post-process miRanda output are listed in Chapter 8 (Appendix IV).
Table 2.1. List of miRNA-target prediction tools
Prediction tool/algorithm Link Reference
miRanda http://www.microrna.org/microrna/home.do Betel et al., 2008
TargetScan v.7.2 http://www.targetscan.org/vert_72/ Agarwal et al., 2015
StarBase ENCORI http://starbase.sysu.edu.cn/ Li et al., 2014
miRDB http://www.mirdb.org/ Chen and Wang 2020
miRwalk v.3 http://mirwalk.umm.uni-heidelberg.de/ Sticht et al., 2018
DIANA Tools, microT-CDS http://diana.imis.athena-
innovation.gr/DianaTools/index.php?r=microT_CDS/index
Paraskevopoulou et al.,
2013, Reczko et al., 2012
DIANA Tools, Tarbase v.8 http://carolina.imis.athena-
innovation.gr/diana_tools/web/index.php?r=tarbasev8/index
Karagkouni et al., 2018
miRbase 22.1 http://www.mirbase.org/ Kozomara et al., 2019

58
2.1.1. miRNAs targeting TRIB1 genetic variants: Single Nucleotide
Polymorphisms (SNPs)
To predict miRNAs potentially targeting TRIB1 SNPs we used the algorithm miRanda, as
described earlier. As input file, we used a list of 90 genetic variants affecting the 3’UTR of
TRIB1, downloaded from NCBI database. This list included both SNPs and small
insertions/deletions (INDELs). However, these sequences were downloaded as short sequences
containing IUPAC ambiguity codes, therefore we pre-processed them using Python to generate
the full-length 3’UTR sequences carrying each SNP. After executing miRanda, we used Python
to organise the output file into tables. We created a table for the reference transcript and a table
for all the SNPs; we then imported the tables in mySQL and used structural queries to intersect
each dataset and find, for example, common interactions and non-common interactions. Results
are explained in Chapter 5, while the list of SNPs and scripts is provided in Chapter 8
(Appendix IV).
2.1.2. Additional tools used
As additional tools, we used the database PolymiRTS (http://compbio.uthsc.edu/miRSNP/) and
the database miRCancer (http://mircancer.ecu.edu/). PolymiRTS is a web-based tool enabling
the detection of miRNAs targeting SNPs and it is based on both TargetScan and experimental
data (Bhattacharya et al., 2014) (see Chapter 5); miRCancer (Xie et al., 2013) was used to
download a list of miRNAs dysregulated in prostate cancer according to published literature
(see Chapter 6).
2.2. RNA-sequencing
RNA was isolated from human primary macrophages using the miRNeasy Mini Kit (QIAGEN)
and sent to the sequencing company Novogene Co. Ltd (https://en.novogene.com) for two
different type of RNA sequencing: a small non-coding RNA sequencing and a messenger RNA
sequencing, which are the topic of Chapter 4. Prior to the sequencing, RNA samples were
assessed for quality and concentration using Nanodrop, Agarose Gel Electrophoresis and
Agilent 2100 (quality and concentration of representative samples are shown in Chapter 8,
Appendix III). In the following sections we briefly describe the sequencing strategy, the
bioinformatic pipelines and all the packages we used to analyse the data.

59
2.2.1. Small non-coding RNA sequencing
Small non-coding RNA sequencing was carried out on unpolarised (M0) and polarised (M1,
pro-inflammatory phenotype) macrophages isolated from 8 healthy donors, for a total of 16
samples. The protocol of macrophage polarisation is specified below (Section 2.3.1.). For the
cDNA library construction, 18-40 bp inserts were involved and for the sequencing an Illumina
platform was used (NovaSeq platform, single-end 50 bp). Sequencing depth ranged from 18 to
25 million reads (recommended sequencing depth is 10 million reads). First, we performed a
quality control check (QC) on fastq files, generated by the sequencer, using the package
MultiQC (Ewels et al., 2016). We also carried out a trimming phase using Cutadapt to remove
“contaminating” adapter sequences and improve the mappability of the reads. By using the
aligner Bowtie2 we performed the mapping. However, instead of mapping the reads to a
reference genome, we used sequences downloaded from RNACentral, a comprehensive
database of non-coding RNAs (RNAcentral Consortium, 2017). This was necessary to avoid
the alignment of small RNAs to unrelated, complementary sequences in the genome. After
mapping, we used SAMTools to post-process the alignments and generate raw counts. The
latter were then passed into the limma R package to generate CPM values (Counts Per Million).
Differential expression (DE) analysis was performed using Deseq2 package (p value cut off
0.05; fold change threshold 1). A Principal Component Analysis (PCA) was also performed
using the R functions “prcomp” and R package “factoextra”. PCA analysis shows clusters of
samples according to their similarities and we generated PCA plots considering CPM values.
Once DE microRNAs between M0 and M1 macrophages were identified, we used TargetScan
algorithm to predict their target genes; the expression of these genes was then checked using
an RNA seq experiment, previously generated in our lab (DOI: 10.17632/j2hmt7k9fh.1). We
chose this dataset as it was carried out on human polarised macrophages (M0 vs M1) isolated
from 8 healthy donors, following the same experimental protocol through which we generated
our samples; moreover, both datasets are characterised by the same number of donors (n = 8).
This RNA-seq was analysed starting from fastq files and following the same workflow
described in the next section (Section 2.2.2. Messenger RNA sequencing). After overlapping
the two sets of macrophage transcriptomic data, we carried out a downstream analysis to
identify pathways and biological processes, using the R package GOSeq.

60
2.2.2. Messenger RNA-sequencing
Messenger RNA sequencing was performed on transiently transfected macrophages, isolated
from 6 healthy volunteers for a total of 24 samples (as specified in Table 2.2.). According to
the small RNA sequencing results, we selected miR-125a-3p, miR-155-5p and miR-186-5p as
candidate miRNAs and transiently overexpressed them for our second sequencing experiment
(see Chapter 4). For the cDNA library construction, inserts of 250-300 bp were used and
sequencing was performed using an Illumina platform (paired-end 150 bp). As we did for the
previous sequencing, we performed a QC on fastq file, followed by trimming and mapping
using the reference genome. This time, the trimming was carried out using the tool
Trimmomatic and the mapping was performed using the human reference genome (GRCh38).
We used Salmon tool to perform the quantification. The DE analysis was performed by using
DESeq2 (p value cut off=0.05; fold change threshold=1). Table 2.3. lists all the R packages
and functions used to analyse both the small RNA seq and the RNA seq data, along with
relevant links and publications. All the sequencing related graphs presented in Chapter 4 were
generated using R scripting.

61
Table 2.2. Experimental conditions for the RNA-seq experiment
The table summarises the experimental conditions behind the mRNA-seq. We transiently
transfected unpolarised macrophages (M0) isolated from 6 different individuals with candidate
miRNA mimics and a negative control.
Cell type 4 transfection conditions (24 hours)
Monocyte-derived macrophages
(isolated from 6 healthy volunteers)
miR-125a-3p Mimic, 50nM
miR-155-5p Mimic, 50nM
miR-186-5p Mimic, 50nM
Negative Control Mimic, 50nM
Table 2.3. Packages, functions and database used to carry out the RNA-seq analysis
The table lists all the tools used to analyse RNA-seq data. DE= differential expression;
PCA=principal component analysis; GO=gene ontology; KEGG: Kyoto Encyclopedia of
Genes and Genomes.
Package/function/database Used for URL Reference
MultiQC Quality Control https://multiqc.info/ Ewels et al., 2016
Cutadapt Adapter trimming, miR-seq https://cutadapt.readthedocs.io/en/stable/ Martin et al., 2011
Trimmomatic Adapter trimming, RNA-seq http://www.usadellab.org/cms/?page=tri
mmomatic
Bolger et al., 2014
RNA Central (v14) Mapping, alignment
(non-coding RNA sequences
as reference genome)
https://rnacentral.org The RNACentral
Consortium 2019
GRCh38 Mapping, alignment https://www.ncbi.nlm.nih.gov/assembly/
GCF_000001405.26/
Genome Reference
Consortium Human
Build 38
Bowtie2 Mapping, alignment http://bowtie-
bio.sourceforge.net/bowtie2/index.shtml
Langmead et al., 2012
SAMtools Quantification http://www.htslib.org/ Li et al., 2009
Salmon tool Quantification https://salmon.readthedocs.io/en/latest/s
almon.html
Patro et al., 2017
Limma Quantification, post-
processing
https://bioconductor.org/packages/releas
e/bioc/html/limma.html
Ritchie et al., 2015
DESeq2 DE analysis http://bioconductor.org/packages/release
/bioc/html/DESeq2.html
Love et al., 2014
Prcomp Generate PCA https://stat.ethz.ch/R-manual/R-
devel/library/stats/html/prcomp.html
Mardia et al., 1979,
Becker et al., 1988,
Venables et al., 2002
Factoextra Visualise PCA https://rpkgs.datanovia.com/factoextra/i
ndex.html
Le et al., 2008
GOSeq GO and KEGG Enrichment
Analysis
https://bioconductor.org/packages/releas
e/bioc/html/goseq.html
Young et al., 2010

62
Part II, In Vitro
2.3. Cell culture and maintenance
2.3.1. Primary cells
2.3.1.1. Human monocyte-derived macrophages (MDMs)
Statement of Ethics
To isolate primary human blood monocytes, up to 80 mL of venous blood was taken from
healthy donors. The study was ethically approved by the University of Sheffield Ethics
Committee (Reference Number: 031330; previously SMBRER310) and written informed
consent was obtained from all volunteers.
Blood Monocytes isolation and macrophages differentiation
Peripheral blood mononuclear cells (PBMCs) were isolated from whole blood using a Ficoll
gradient centrifugation. All steps were performed at room temperature. In a 50 mL conical
centrifuge tube, 40 mL of fresh whole blood was added along with 5 mL of 3.8% (w/v) Sodium
Citrate to prevent coagulation; 30 mL of the mixture was slowly layered over 15 mL of Ficoll-
Paque Plus (GE Healthcare) (2 volumes of blood per 1 volume of Ficoll) and centrifuged at
900xg for 20 minutes (accel and brake 1). Plasma was aspirated and the mononuclear cell layer
was transferred to a new 50 mL conical tube filled with PBS-EDTA; the mixture was
centrifuged at 265xg for 5 minutes. Red blood cells lysis buffer 1X (16.6 g NH4Cl, 2 g KHCO3,
400 uL 0.5 M EDTA, 200 mL distilled, sterile H2O) was added for the removal of platelets
and erythrocytes and left at room temperature for 5 minutes. Cells were further centrifuged and
counted for the CD14+
positive magnetic selection using the Miltenyi Biotech MACS
magnetic cell separation system and the anti-CD14 human antibody-beads. CD14+
monocytes
purity was assessed by Flow Cytometry and cells were subsequently cultured in RPMI-1640
(Gibco) supplemented with 10% (v/v) of Low Endotoxin Heat Inactivated Foetal Bovine
Serum, 1% (v/v) Penicillin/Streptomycin, 1% (v/v) L-Glutamine. Human recombinant
macrophage-colony stimulating factor (M-CSF, Human, Prepotech) was added (100 ng/mL) to
enable the differentiation of monocytes into macrophages. Cells were incubated for 7 days at
37°C, 5% CO2.

63
Macrophages in vitro polarisation
After 7 days of differentiation, human macrophages were activated towards three different
phenotypes by adding the following cytokines to the media:
M1 pro-inflammatory phenotype: 20 ng/mL IFN-γ (Human, Peprotech) and 100
ng/mL E. coli lipopolysaccharide (Serotype R515 TLR grade TM, Enzo Life Sciences);
M2a anti-inflammatory phenotype: 20 ng/mL IL-4 (Human, Peprotech);
M2c anti-inflammatory phenotype: 20 ng/mL IL-10 (Human, Peprotech).
After 24 hours of treatment, cells were washed twice with PBS 1X and cell pellets were
collected and stored at -80°C for further RNA/protein isolation.
2.3.2. Established cell lines
2.3.2.1. Immortalised BMDMs (iBMDMs)
Immortalised BMDMs were used for transient transfection of miRNA mimics (see Chapter 3).
The line was generated from wild-type male mice as described by Hornung et al., 2008 and
they were a gift from Professor David Brough (University of Manchester). The cells were
grown in T75 flasks in DMEM (Gibco) supplied with 10% (v/v) of Low Endotoxin Heat
Inactivated Foetal Bovine Serum, 1% (v/v) Penicillin/Streptomycin and 1% Sodium Pyruvate
and passaged every 2 days, by using cell scraping.
2.3.2.2. HEK293T cell line
Human embryonic kidney cell line 293T (HEK293T) was used to perform transient
transfection and luciferase reporter assay, as it is highly transfectable with either DNA and
RNA constructs. Cells were grown in DMEM (Gibco) supplied with 10% (v/v) of Low
Endotoxin Heat Inactivated Foetal Bovine Serum, 1% (v/v) Penicillin/Streptomycin, 1% Non-
Essential Amino acids. Cells were passaged every 2 days in T25 flasks, by using
Trypsin/EDTA.

64
2.3.2.3. Prostate cancer cell lines
Cell lines from prostate cancer (PC3, DU145, LNCAP, 22RV1) and normal epithelium
(PNT1A, PWRE1, RWPE1) were cultured and used to investigate TRIB1 and miRNAs
endogenous expression, as well as for transient transfection experiments (see Chapter 6). PC3
and DU145 cell lines were grown in DMEM (Gibco) supplemented with 10% (v/v) of Low
Endotoxin Heat Inactivated Foetal Bovine Serum, 1% (v/v) Penicillin/Streptomycin, 1% Non-
Essential Amino acids; LNCAP, 22RV1 and PNT1A were grown in RPMI-1640 (Gibco)
supplemented with 10% (v/v) of Low Endotoxin Heat Inactivated Foetal Bovine Serum, 1%
(v/v) Penicillin/Streptomycin, 1% (v/v) Glutamine, 1% (v/v) Non-Essential Amino acids;
PWRE1 and RWPE1 were cultured in Keratinocyte Serum Free Media (K-SFM, Gibco)
supplied with 1% (v/v) Penicillin/Streptomycin, 0.05 mg/mL bovine pituitary extract (BPE)
and 5ng/mL human recombinant epidermal growth factor (EGF), both provided with the K-
SFM kit. All cell lines were grown in T75 flasks and passaged every 2-3 days in a 1:5 ratio, by
using Trypsin/EDTA.
2.4. Gene expression profiling
2.4.1. RNA extraction
Total RNA isolation was performed by using the miRNeasy Mini Kit (QIAGEN) according to
manufacturer’s instructions. The kit enables the purification of total RNA, including small
RNA from approximately 18 nucleotides and are based on silica-spin columns which optimize
the RNA binding. RNA concentration and purity were measured by NanoDropTM
Spectrophotometer (260/280 ratio= 1.8/2.0; 260/230 ratio=1.8/2.0). Prior to the small-RNA
sequencing and the mRNA sequencing, RNA integrity and concentration were also assessed
by using Agarose Gel Electrophoresis (Gel Con: 1%; voltage: 180v; Run Time: 16min) and
Bioanalyzer Agilent 2100 (RNA Integrity Number ≥ 7.5) (details in Chapter 8, Appendix III).
2.4.2. cDNA synthesis
cDNA synthesis was performed by using the iScript cDNA synthesis kit (Biorad) and the
miRCURY Universal cDNA synthesis kit (QIAGEN) according to manufacturer’s
instructions. The latter enable the reverse-transcription of all miRNAs in one single reaction
which includes the following steps: (1) a poly-A tail is first added to the mature miRNA

65
template and (2) the cDNA is synthesized using a poly T primer with a 3’ degenerate anchor
and a 5’ universal tag. Protocols, incubation and heat inactivation steps for both kits are listed
below (Table 2.4.).
2.4.3. Real Time-quantitative PCR
Real Time qPCR was performed using SYBR Green Master Mix (Primer Design) for the
messenger RNA; the miRCURY LNA miRNA PCR Assay (QIAGEN) was used for miRNAs.
SYBR primers were designed and checked for specificity using the BLAST Primer Design
Tool (https://www.ncbi.nlm.nih.gov/tools/primer-blast) and purchased from Sigma-Aldrich;
miRNA Primer Mix were purchased from QIAGEN (sequences and details are listed in Chapter
8, Appendix I). Protocols are listed below (Table 2.5. and Table 2.6.). Results were analysed
upon a CFX384 C1000 Touch Thermal Cycler (Biorad) using the PCR cycle conditions listed
below (Table 2.7. and Table 2.8. and the 2(-Delta Ct)) method described below.
2.4.4. Gene expression analysis: 2–∆Ct method
Prior to the analysis, specificity of each primer pair was confirmed by Melt Curve Analysis,
provided by the qPCR thermal cycler. Data were then exported in Excel and analysed by using
the 2–∆Ct method which enables the calculation of the expression of a gene relative to a
housekeeping gene. The method consists in the following formulas:
1. Average Ct (or Cq) for each gene and sample;
2. ∆Ct calculation for each sample:
Ct gene of interest – Ct housekeeping gene
3. 2-∆Ct calculation for test sample and control sample:
=power (2, - ∆Ct)

66
Table 2.4. cDNA synthesis protocols
Table 2.5. RT-qPCR reagents and protocol: Primer Design
Table 2.6. RT-qPCR reagents and protocol: QIAGEN
iScript cDNA synthesis (Biorad) miRCURY Universal cDNA synthesis (QIAGEN)
5x iScript Reaction Mix: 4 uL
iScript Reverse Transcriptase: 1 uL
Nuclease-free water: variable
RNA template (100 fg-1 ug total RNA)
5x miRCURY RT Reaction Buffer: 2 uL
RNase-free water: 4.5 uL
10x miRCURY RT Enzyme Mix: 1 uL
Synthetic RNA spike ins, optional: 0,5 uL
Template RNA (5 ng/uL): 2 uL
Reactions volume: 20 uL
• Priming for 5 min at 25 ̊C.
• Reverse transcription for 20 min at 46 ̊C.
• RT inactivation for 1 min at 95 ̊C.
• Immediately cool to 4°C.
• Store at 4°C or freeze.
Reactions volume: 10 uL
• Incubate for 60 min at 42 ̊C.
• Heat-inactivate the reverse transcriptase for 5 min at
95 ̊C.
• Immediately cool to 4°C.
• Store at 4°C or freeze.
Component SYBR Green Master Mix (Primer Design)
SYBR Green Master Mix 5 uL
Primer Forward 10uM 0,3 uL
Primer Reverse 10uM 0,3 uL
Diluted cDNA (0,2-1ng/uL) 5 uL
Total Reaction Volume 10,6 uL
Component miRCURY LNA miRNA PCR Assay (QIAGEN)
2x miRCURY SYBR Green Master Mix 5 uL
Nuclease-free water 1 uL
Primer Mix 1 uL
Diluted cDNA (1:60) 3 uL
Total Reaction Water 10 uL

67
Table 2.7. RT-qPCR running protocol: Primer Design
Table 2.8. RT-qPCR running protocol: QIAGEN
Process Step Settings Primer Design
Polymerase
Activation/Denaturation
95°C, 2min
Amplification 40 amplification cycles at
95°C, 15sec
60 °C ,1min
Melting Curve Analysis Yes 60°C-95°C/0.5 °C Increment
Process Step Settings QIAGEN
Polymerase
Activation/Denaturation
95°C, 2min
Amplification 40 amplification cycles at
95°C, 10sec
56 °C ,1min
Melting Curve Analysis Yes 60°C-95°C/0.5 °C Increment
A
B
68
2.5. Protein analysis
2.5.1. Protein Extraction
Proteins were extracted from cell pellets using the RIPA Buffer ready-to-use-solution (Sigma-
Aldrich) and 1 uL/mL of Protease Inhibitor (100 uL each 1x10⁶ cells). Cell lysates were further
sonicated using the ultrasonic bath at voltage 220-240 and Hertz 50-60 for 15-30 minutes
(Ultrawave, Cardiff, UK). Lysates were then centrifuged at 10.000xg for 20 minutes at 4°C;
proteins (supernatants) were transferred in a new tube while the debris was discarded.
2.5.2. BCA Protein Quantification Assay
Total protein concentration was measured compared to a protein standard (Bovine serum
albumin, BSA) using the Pierce BCA Protein Assay kit according the manufacturer’s
instructions (Thermo Fisher Scientific). Concentration was estimated by a colorimetric
microplate reader at 562nm. Data were analysed using GraphPad Prism 8.0 (GraphPad
Software, La Jolla, CA, USA); the BSA standard curve was log transformed and plotted to
allow the interpolation of unknown samples with 95% confidence intervals.
2.5.3. Western Blotting
Western Blotting was performed using the InvitrogenTM Novex XCell SureLockTM Mini- Cell
(Invitrogen). 10-20 ug of sample protein was added to 5x Loading Buffer (10% SDS (w/v),
25% (v/v) beta-mercaptoethanol, 50% (v/v) glycerol, 0.01% (w/v) bromophenol blue, 0.125M
Tris-HCl, pH 6.8) up to a final volume of 30 uL (volumes were adjusted with RIPA buffer)
and incubated at 95 °C for 10 minutes; 25 uL of proteins was then loaded into the wells of a
NuPAGE 4-12% Bis-Tris SDS-PAGE gel Novex (Invitrogen) together with a standard protein
size marker (SeeBlue, Plus2 Prestained Standard, Invitrogen). Electrophoresis was performed
at 150 V for 60/80 minutes in NuPAGE MOPS/MES SDS Running Buffer (Novex, Invitrogen).
Proteins were then transferred onto a nitrocellulose membrane at 35 V for 60 minutes in
NuPAGE Transfer Buffer (5% (v/v) 20x transfer buffer, 0.1% (v/v) antioxidant, 20% (v/v)
methanol (Novex, Invitrogen). Transfer efficiency was further determined by staining the
membrane with Red-Ponceau S Solution (Sigma-Aldrich) for 5-10 minutes at room
temperature. The membrane was washed in TBS-T (Tris Buffered Saline pH 8.0 powder
dissolved in 1 L of distilled water, 0.1% (v/v) Tween 20, Sigma-Aldrich) and blocked at room

69
temperature for 1 hour in 5% Milk TBS-T. Primary antibody was diluted in 5% Milk TBS-T
and left at 4°C, overnight. After the overnight incubation, the membrane was washed 3 times
for 5 min in TBS-T and incubated with the HRP-conjugated secondary antibody (1:1000, 5%
Milk TBS-T) at room temperature for 1 hour. The membrane was then washed again (3x5min
in TBS-T). In order to use different primary antibodies (i.e. protein of interest and
housekeeping) the membrane was cut when possible or stripped in ReBlot Plus Strong
Antibody Stripping Solution 1X (EMD, Millipore) and re-blocked in 5% Milk TBS-T at room
temperature for 1 hour. Prior to the development a chemiluminescent substrate (ECL Prime
Western Blotting Detection Reagent, GE Healthcare) was added to the membrane for 60-90
seconds. Specific protein bands were detected by using either C-DiGit Blot Scanner (LI-COR
Bioscience) and the ChemiDoc XRS+ Imaging System (Biorad). Primary and secondary
antibodies and their working concentrations are specified in Chapter 8, Appendix I. Results
were analysed in Excel through ImageStudio Digit version 5 (LI-COR Bioscience) and
ImageLab version 6.0 (Biorad), as follows:
1. Calculate intensity for each protein band;
2. Background subtraction (adjusted intensity);
3. Normalise intensity for each test and control sample:
Adjusted Intensity protein of interest / Adjusted Intensity housekeeping
2.6. Transient transfection
Transient cell transfection was performed on both cell lines (HEK293T, iBMDMs, PC3) and
primary cells (MDMs) by using different kits and different RNA and DNA constructs.
Dharmafect DUO (Horizon Discovery) was used to co-transfect DNA (reporter plasmids) and
RNA (miRNA mimics and inhibitors) in HEK293T cells for the dual luciferase reporter assay;
Viromer Green and Viromer Blue kits (Cambridge Bioscience) were used to transiently
transfect RNA constructs (miRNA mimics, inhibitors, siRNA and target-site blocker) into
MDMs, iBMDMs and PC3. Lipofectamine 3000 (Invitrogen) was used to overexpress human
TRIB1 into MDMs by using an expression plasmid. For each transfection protocol we followed
the manufacturer’s instruction (see Table 2.9.). All the details about DNA and RNA constructs
used in this thesis are specified in Chapter 8 (Appendix I).

70
Table 2.9. Transient transfection assays
List of the 4 transfection systems used in the present thesis along with details about cell type,
experiment format, DNA/RNA concentrations and incubation time; constructs concentrations
and incubation time are also specified in the figure legend of each results chapter.
2.7. Molecular Cloning and Site-Directed Mutagenesis
Molecular cloning was performed to generate gene reporter plasmids. Each cloning experiment
was carried out performing the following steps: (1) PCR amplification of sequence to be
cloned, (2) PCR-fragment purification from gel, (3) cloning reaction with an entry vector and
a destination gateway vector, (4) competent bacteria transformation and antibiotic selection,
(5) bacterial colonies harvesting, (6) plasmid mini/midi prep, (7) restriction digestion analysis
and (8) Sanger sequencing (Figure 2.1.). For Sanger sequencing, we have sent our samples to
Source BioScience laboratory (Nottingham, UK) and further analysed the sequences by using
the software DNASTAR LaserGene (https://www.dnastar.com).
Site-directed mutagenesis was performed to generate miRNA-binding site mutants and SNPs
in the TRIB1 3’UTR reporter plasmid. PCR primers for mutagenesis were designed with
mutations using the Agilent website (QuickChange Primer Design,
https://www.agilent.com/store/primerDesignProgram.jsp) and purchased from Sigma-Aldrich;
the mutagenesis reaction was prepared using the QuikChange II Site-Directed Mutagenesis Kit
(Agilent) following the manufacturer’s instruction.
Details about kits, reagents, bacteria and plasmids are specified in Chapter 8 (Appendix I).
Protocols used for cloning and mutagenesis are described below.
Transfection system Cell type Experiment format DNA RNA Incubation time
Dharmafect DUO HEK293T 96-well plate Test plasmids 95ng/well
Control 5 ng/well
Mimic 50 nM
Inhibitor 25 nM
24 hours
Viromer Blue PC3, LNCAP,
iBMDMs
6-well plate
12-well plate
N/A Mimic 50nM
Inhibitor 50nMsiRNA 50nM
24-48 hours
Viromer Green MDMs 6-well plate
12-well plate
N/A Mimic 50nM
Inhibitor 50nMTarget Site Blocker 50 nM
24 hours
Lipofectamine 3000 MDMs 6-well plate
12-well plate
human TRIB1 1-2,5 ug/well
Control (GFP) 1-2,4 ug/well
N/A 24-48 hours

71
Figure 2.1. Schematic overview of molecular cloning steps
The sequence of interest is first amplified through a standard PCR (1); the PCR product is
excised and purified from the gel (2) and then cloned in a specific vector (3). The obtained
plasmid is used to transform competent bacteria (4). As soon as the bacteria grow (5), the
plasmid is isolated using a commercial kit (6), digested (7) and sequenced (8).
2.7.1. Cloning reaction
Cloning was carried out using the pENTR Directional TOPO cloning kit (Invitrogen) and the
Gateway LR Clonase kit (Invitrogen) according to manufacturer’s instruction. Directional
cloning enables to clone a blunt-end PCR fragment into an entry vector which is subsequently
cloned into a gateway system through a set of recombination sequences. We first cloned the
3’UTR of TRIB1 in a TOPO vector; then we used EF1 GWB Renilla Luciferase plasmid as a
gateway system to further clone the 3’UTR of TRIB1 downstream to the luciferase gene.
2.7.1.1. pENTR Directional TOPO cloning
The DNA fragment to be cloned was mixed together with a salt solution and a topo vector (4
uL of DNA fragment, 1 uL of salt solution and 1 uL of topo vector) and left at room temperature

72
for 10 minutes; 50 uL of bacteria (E. Coli C2987H) was then mixed with 3 uL of the cloning
reaction and incubated on ice for 30 minutes, followed by 90 seconds at 42 °C and 5 minutes
on ice again. Up to 1mL of lysogeny broth (LB) was then added and the mixture was incubated
at 37 °C for 40 minutes. The tube was centrifuged at 6000 rmp for 5 minutes at room
temperature and 100 uL of the mixture was plated on agar plates prepared with antibiotic. Plates
were incubated over night at 37 °C. The next days, colonies were picked up with a pipette tip,
mixed with super broth (SB) and left to grow at 37 °C in a water bath shaker. Plasmid mini and
midi preps were carried out by using GenElute ™ Plasmid Midiprep Kit/Miniprep Kit (Sigma
Aldrich) following the manufacturer’s instructions.
2.7.1.2. Gateway Cloning
The Gateway cloning was used to clone the 3’UTR of TRIB1 (entry clone) downstream of a
renilla luciferase gene (destination vector, EF1 GWB Renilla Luciferase). The two plasmids
were mixed together with LR clonase enzyme (1 uL plasmid1, 1 uL plasmid2, 0.5 uL LR
clonase) and the mixture was incubated for 1 hour at room temperature; 1.5 uL of clonase
reaction was then mixed with 50 uL of competent bacteria (E. Coli C2987H) and incubated as
follows:
30’ on ice;
30’’ at 42°C;
5’ on ice.
Up to 1 mL of SB was added to the mixture, which was incubated for 1 hour at 37 °C. The
mixture was then centrifuged (2000xg for 5’) and up to 100 uL of mixture was plated on agar
plate prepared with antibiotic. Plates were incubated over night at 37 °C. The next day, colonies
were harvested with a pipette tip, mixed with super broth (SB) and left to grow at 37 °C in a
water bath shaker. Plasmid mini and midi preps were carried out by using GenElute ™ Plasmid
Midiprep Kit/Miniprep Kit (Sigma Aldrich) following the manufacturer’s instructions.
Plasmids were digested using restriction enzymes and sequenced (Sanger sequencing).

73
2.7.2. Site-directed mutagenesis
Being a PCR reaction, site-directed mutagenesis is mediated by oligonucleotide primers that
introduce a mutation of interest (deletion, insertion, substitution) in a target sequence. After the
mutagenesis reaction, we performed from step 4 to step 8 of the molecular cloning pipelines.
PCR machine settings for mutagenesis
1. Segment 1: 95°C for 2 minutes;
2. Segment 2: 95°C for 20 seconds; 55-60°C for 10 seconds; 68°C for 30 seconds/kb
plasmid length; 18-30 cycles;
3. Segment 3: 68°C for 5 minutes;
4. Segment 4: hold at 4°C.
2.8. Dual Luciferase Reporter Assay
The Dual Luciferase Reporter Assay (DLR) is widely used as a quantitative assay to test the
negative effect of a specific miRNA on a predicted target gene using a luciferase reporter clone
(usually renilla and firefly luciferase enzymes from Renilla reniformis and Photinus pyralis,
respectively). The experimental procedure first requires the cloning of the predicted target
sequence (mostly the 3’UTRs) downstream of a luciferase reporter. Next, after transfecting the
construct together with the miRNA into a cell line, the reporter activity is measured by adding
a substrate. Negative changes in luciferase transcriptional activity will indicate whether or not
the specific miRNA binds to its target, regulating its expression and stability which, in turn,
affect the upstream gene. A schematic illustration of the DLR assay is shown in Figure 2.2.
The DLR assay was performed in HEK293T cell line to assess the impact of the 3’UTR of
TRIB1 on mRNA stability (reference alleles and genetic variants, see Chapter 5) and also to
validate miRNA-target interactions (see Chapter 3, 5 and 6). We used renilla luciferase reporter
plasmids (TRIB1 3’UTR and control plasmid without UTRs) and a firefly reporter as internal
control. Each condition was performed in triplicate. The kit was purchased from Promega. The
preparation of the reagents, the assay procedure and data analysis are described below.
Preparations:
Passive Lysis Buffer (PLB) 5x was diluted in distilled water in a 1:5 ratio to obtain the working
concentration 1x and stored at 4°C; Luciferase Assay Reagent II (LAR II, Firefly) was prepared
by resuspending the provided lyophilized Luciferase Assay Substrate in 10 mL of the supplied
74
Luciferase Assay Buffer II and stored at -80°C; Stop & Glo reagent (Renilla) was prepared by
adding 200 uL of 50X Stop & Glo Substrate to the 10 mL Stop & Glo Buffer and stored at -
80°C.
Procedure:
After 24 hours of transient transfection performed in a 96-well plate, the media was
removed and each well was washed twice in PBS 1x; 35 uL of PLB 1x was then added and
cells were lysed by pipetting up and down. Up to 5 uL of cell lysates were transferred into
a nunc-384 well plate; 5 uL of the first substrate (LARII, Firefly) were added to each well
and the plate was read at 560 nm using a microplate reader (luminometric). After the
first reading, 5 uL of the second substrate (Stop & Glo, Renilla) were added and the plate
was read at 580 nm. Data generated by the plate reader were exported and analysed in
Excel, as described below.
Data analysis:
Data were analysed by calculating the average of firefly and renilla readings (OD, optical
density) for each replicate and condition. For the background subtraction, the OD
readings generated by untransfected cells were subtracted to each test reading. To correct
variations due to cell density, transfection efficiency and pipetting error, Firefly/Renilla
ratio was calculated for each condition and the numbers generated were plotted in a
column graph.
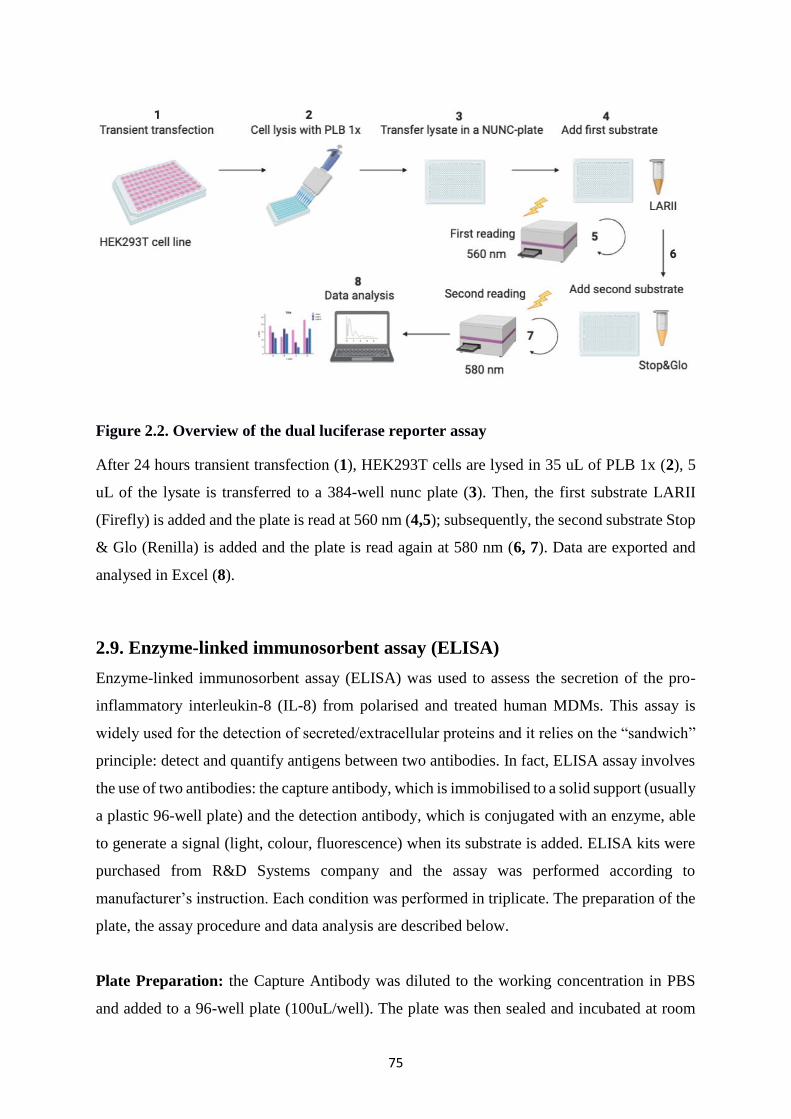
75
Figure 2.2. Overview of the dual luciferase reporter assay
After 24 hours transient transfection (1), HEK293T cells are lysed in 35 uL of PLB 1x (2), 5
uL of the lysate is transferred to a 384-well nunc plate (3). Then, the first substrate LARII
(Firefly) is added and the plate is read at 560 nm (4,5); subsequently, the second substrate Stop
& Glo (Renilla) is added and the plate is read again at 580 nm (6, 7). Data are exported and
analysed in Excel (8).
2.9. Enzyme-linked immunosorbent assay (ELISA)
Enzyme-linked immunosorbent assay (ELISA) was used to assess the secretion of the pro-
inflammatory interleukin-8 (IL-8) from polarised and treated human MDMs. This assay is
widely used for the detection of secreted/extracellular proteins and it relies on the “sandwich”
principle: detect and quantify antigens between two antibodies. In fact, ELISA assay involves
the use of two antibodies: the capture antibody, which is immobilised to a solid support (usually
a plastic 96-well plate) and the detection antibody, which is conjugated with an enzyme, able
to generate a signal (light, colour, fluorescence) when its substrate is added. ELISA kits were
purchased from R&D Systems company and the assay was performed according to
manufacturer’s instruction. Each condition was performed in triplicate. The preparation of the
plate, the assay procedure and data analysis are described below.
Plate Preparation: the Capture Antibody was diluted to the working concentration in PBS
and added to a 96-well plate (100uL/well). The plate was then sealed and incubated at room
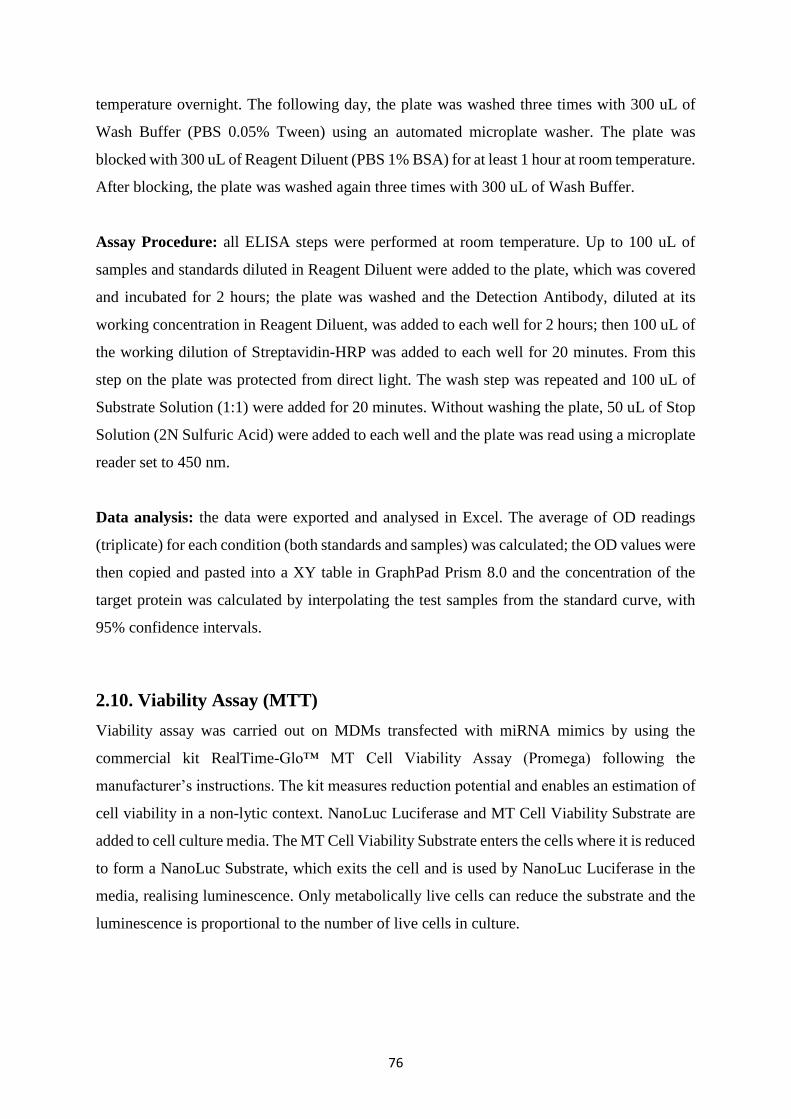
76
temperature overnight. The following day, the plate was washed three times with 300 uL of
Wash Buffer (PBS 0.05% Tween) using an automated microplate washer. The plate was
blocked with 300 uL of Reagent Diluent (PBS 1% BSA) for at least 1 hour at room temperature.
After blocking, the plate was washed again three times with 300 uL of Wash Buffer.
Assay Procedure: all ELISA steps were performed at room temperature. Up to 100 uL of
samples and standards diluted in Reagent Diluent were added to the plate, which was covered
and incubated for 2 hours; the plate was washed and the Detection Antibody, diluted at its
working concentration in Reagent Diluent, was added to each well for 2 hours; then 100 uL of
the working dilution of Streptavidin-HRP was added to each well for 20 minutes. From this
step on the plate was protected from direct light. The wash step was repeated and 100 uL of
Substrate Solution (1:1) were added for 20 minutes. Without washing the plate, 50 uL of Stop
Solution (2N Sulfuric Acid) were added to each well and the plate was read using a microplate
reader set to 450 nm.
Data analysis: the data were exported and analysed in Excel. The average of OD readings
(triplicate) for each condition (both standards and samples) was calculated; the OD values were
then copied and pasted into a XY table in GraphPad Prism 8.0 and the concentration of the
target protein was calculated by interpolating the test samples from the standard curve, with
95% confidence intervals.
2.10. Viability Assay (MTT)
Viability assay was carried out on MDMs transfected with miRNA mimics by using the
commercial kit RealTime-Glo™ MT Cell Viability Assay (Promega) following the
manufacturer’s instructions. The kit measures reduction potential and enables an estimation of
cell viability in a non-lytic context. NanoLuc Luciferase and MT Cell Viability Substrate are
added to cell culture media. The MT Cell Viability Substrate enters the cells where it is reduced
to form a NanoLuc Substrate, which exits the cell and is used by NanoLuc Luciferase in the
media, realising luminescence. Only metabolically live cells can reduce the substrate and the
luminescence is proportional to the number of live cells in culture.
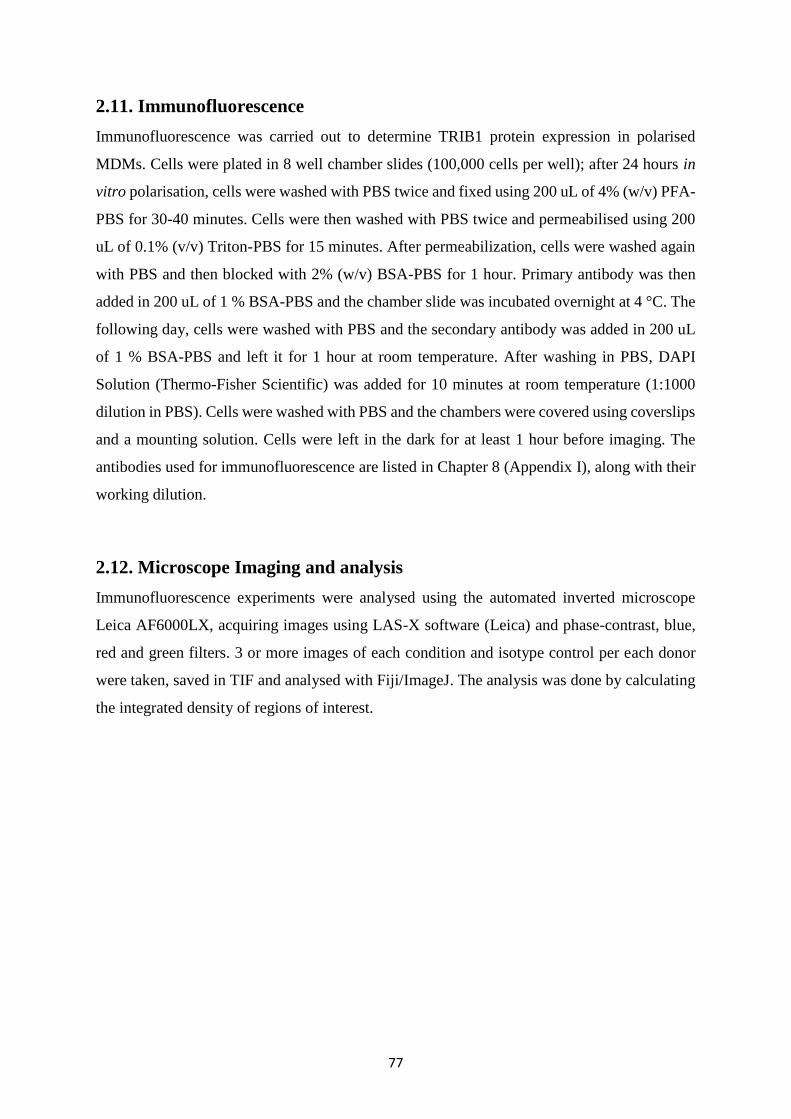
77
2.11. Immunofluorescence
Immunofluorescence was carried out to determine TRIB1 protein expression in polarised
MDMs. Cells were plated in 8 well chamber slides (100,000 cells per well); after 24 hours in
vitro polarisation, cells were washed with PBS twice and fixed using 200 uL of 4% (w/v) PFA-
PBS for 30-40 minutes. Cells were then washed with PBS twice and permeabilised using 200
uL of 0.1% (v/v) Triton-PBS for 15 minutes. After permeabilization, cells were washed again
with PBS and then blocked with 2% (w/v) BSA-PBS for 1 hour. Primary antibody was then
added in 200 uL of 1 % BSA-PBS and the chamber slide was incubated overnight at 4 °C. The
following day, cells were washed with PBS and the secondary antibody was added in 200 uL
of 1 % BSA-PBS and left it for 1 hour at room temperature. After washing in PBS, DAPI
Solution (Thermo-Fisher Scientific) was added for 10 minutes at room temperature (1:1000
dilution in PBS). Cells were washed with PBS and the chambers were covered using coverslips
and a mounting solution. Cells were left in the dark for at least 1 hour before imaging. The
antibodies used for immunofluorescence are listed in Chapter 8 (Appendix I), along with their
working dilution.
2.12. Microscope Imaging and analysis
Immunofluorescence experiments were analysed using the automated inverted microscope
Leica AF6000LX, acquiring images using LAS-X software (Leica) and phase-contrast, blue,
red and green filters. 3 or more images of each condition and isotype control per each donor
were taken, saved in TIF and analysed with Fiji/ImageJ. The analysis was done by calculating
the integrated density of regions of interest.

78
2.13. Cholesterol Efflux Assay
Cholesterol efflux assay was carried out in MDMs transfected with miRNA mimic and
inhibitor. The assay was previously optimised in my lab by Dr Jessica Johnston. Cells were
transfected with 50 nM of miRNA mimic/inhibitor for 24 hours and then treated with 2.5 uM
of TopFluor Cholesterol (23-(dipyrromtheneboron difluoride)-24-norcholesterol (Avanti Polar
Lipids) for 24 hours in RPMI 0.2% BSA fatty-acid free (Sigma-Aldrich) for other 24 hours.
Media was changed RPMI 0.2% BSA fatty-acid free for 18 hours (equilibration step). After
that, a cholesterol acceptor was added: 50ug/mL of HDL (Biorad) for 4 hours. At end of
incubation, the media was collected and cells were lysed using a solution of 1% Cholic Acid
in 100% Ethanol (Sigma-Aldrich). Both cells lysates and supernatants were added to a nunc 96
well plate (black) in triplicates and fluorescence was read using a microplate reader (excitation
490nm, emission 520nm). Data were analysed as follows in Excel (Low et al., 2012):
% cholesterol efflux = SN/ (lysate * dilution factor) + SN * 100
Final % efflux = % cholesterol efflux-% blank efflux (no acceptor)
where SN is the supernatant.
2.14. Flow cytometry
Flow cytometry was carried out to assess CD14+ monocyte purity and transfection efficiency,
by using BD LSR II machine (BD Bioscience). In the flow cytometry experiment we used TO-
PRO-1 Iodide (515/531) staining for live/dead cells (1:10000) (Invitrogen). Flow cytometry
results are shown in Chapter 8 (Appendix II).
2.15. Statistics
All experiments were performed at least three times and data are presented as means ± SEM.
Graphs and statistical analysis were generated in GraphPad Prism 8.00 (GraphPad, San Diego,
CA, USA). Statistical methods are specified in each figure legend. P‐values < 0.05 were
considered to be statistically significant. Each statistical test was performed as parametric and
two-tailed.

79
Chapter 3. miR-101-3p negatively regulates Tribbles-1 in primary
human macrophages
Declaration
This part of the work is intended to be published along with additional data not shown here
(manuscript in preparation). The experiments and the bioinformatics analysis described in this
chapter have been entirely performed by myself. The only exception is Figure 3.15.: the KEGG
enrichment pathway analysis by using GOSeq was generated by my colleague Sumeet
Deshmukh.
Abstract
Tribbles-1 (TRIB1) is an evolutionarily conserved pseudo-kinase protein that in mammals
control a wide range of interacting signalling pathways. In myeloid cells, TRIB1 controls
macrophage polarisation and dysregulated myeloid Trib1 expression has been shown to alter
adipose homeostasis and atherosclerosis burden. However, mechanisms that regulate TRIB1
expression remain elusive. Taking advantages of in-silico predictions, we showed that the
3’untranslated region (3’UTR) of TRIB1 is enriched in microRNA-binding sites and when
cloned downstream of a luciferase reporter gene, leads to a significant reduction of the reporter
activity. Macrophage-specific knock-down of DICER1 and AGO2, key enzymes involved in
miRNAs biogenesis and activity, causes an increase of TRIB1 RNA and protein, suggesting a
role for microRNAs in its post-transcriptional regulation. We demonstrated that miR-101-3p,
miR-132-3p and miR-214-5p are able to negatively modulate TRIB1 expression in
macrophages and have validated the direct interaction of miR-101-3p and TRIB1 by employing
site-directed mutagenesis. Through regulation of TRIB1, miR-101-3p induced an M1-like
macrophage polarisation, altering the levels of pro-inflammatory markers. Our results suggest
that the TRIB1-miR-101-3p interaction is biologically relevant in the context of human
macrophage polarisation in vitro and should be further investigated in vivo, in the context of
those diseases, in which the activation of macrophages towards different phenotypes plays a
determinant role.

80
3.1. Introduction
Tribbles-1 (TRIB1) pseudo-kinase regulates cell function in a range of contexts, via regulating
MAP kinase activation (Kiss-Toth et al., 2004) and mediating protein degradation via the COP1
ubiquitin ligase (Yoshida et al., 2013). Its expression is detectable in all tissues, but it is highly
enhanced in the bone marrow and in the thyroid gland (The Human Protein Atlas,
https://www.proteinatlas.org). In fact, TRIB1 has been shown to play a pivotal role in the
differentiation of anti-inflammatory M2-macrophages, in the pathogenesis of early
atherosclerosis and during adipose tissue inflammation (Ostertag et al., 2010, Satoh et al.,
2013, Johnston et al., 2019). In murine bone-marrow derived macrophages, Trib1 deficiency
has been reported to alter polarisation markers, impairing the transcription of both pro-
inflammatory and anti-inflammatory genes (Arndt et al., 2018). Besides, TRIB1 is also an
established oncogene in acute myeloid leukemia, a cancer that arise from monocytes
(Röthlisberger et al., 2007, Yoshida et al., 2013).
At the gene level, TRIB1 is highly unstable, showing a mRNA half-life shorter than 1 hour
(Sharova et al., 2009). Its expression is also highly variable among different cell types and
tissues, suggesting it might be subject to cell type-dependent post-transcriptional regulation
(Sung et al., 2006). The 3’untraslated region (3’UTR) of TRIB1 mRNA represents more than
50% of the whole sequence, it is highly conserved among different animal species and it is
enriched in regulatory binding sites. Recently, Soubeyrand and colleagues have showed that
blocking transcription through actinomycin-D dramatically reduced TRIB1 mRNA levels in
different in vitro models (Soubeyrand et al., 2016). However, the regulation of human TRIB1
at the post-transcriptional level has not been investigated.
One of the main gene regulatory mechanisms described in eukaryotes is mediated by
microRNAs (miRNAs) in a process called RNA Interference (RNAi). miRNAs are small non-
coding RNAs that bind to the 3’UTR of target, complementary mRNAs and via association
with effector proteins form the RNA-induced silencing complex (RISC). This ultimately leads
to RNA degradation and inhibition of protein translation (Bartel et al., 2004). The role of
miRNAs in macrophage development and function has been extensively studied (Roy et al.,
2016, Curtale et al., 2019).
In the current work, we investigated for the first time the post-transcriptional regulation of
TRIB1 by miRNAs. To date, only a few studies identified miRNAs regulating TRIB1 in the
context of prostate and liver cancer (Lin et al., 2014, Ye et al., 2017). Considering its
predominant role in myeloid cells we focussed on human macrophage function and

81
polarisation. In fact, the role of TRIB1 in human macrophages has not been extensively
investigated and the majority of published studies are related to mice models and murine cell
lines.
3.2. Hypothesis and aims
We hypothesised that TRIB1 is subject to post-transcriptional regulation by miRNAs in human
macrophages. The aims of this study were (1) to investigate the expression and the function of
TRIB1 in human macrophages; (2) to identify and validate macrophage-specific miRNAs
potentially targeting TRIB1; (3) to test the impact of candidate miRNAs on macrophage
biology.

82
3.3. Results
3.3.1. Endogenous TRIB1 expression in human polarised macrophages
TRIB1 expression has been reported to be highly variable among different cell types, both at
the mRNA and protein levels and it appears to be regulated in response to inflammatory stimuli
(Sung et al., 2006, Soubeyrand et al., 2016). By using GTEx Portal database
(https://gtexportal.org/home/), we checked TRIB1 mRNA expression among 54 different
human tissues; the top 5 tissues in which TRIB1 is expressed the most are thyroid (median
Transcript Per Million, TPM 155), lung (median TPM 50.96), whole blood (median TPM
38.28), visceral adipose tissue (median TPM 37) and liver (median TPM 34.61) (Figure 3.1.).
As TRIB1 is critical in the myeloid system (Yokoyama et al., 2010, Satoh et al., 2013), we
measured its mRNA expression in human primary unpolarised (also referred as M0 and Mun
macrophages) macrophages (MDMs), isolated from 18 different individuals of mixed age and
gender, by using RT-qPCR. Prior to the RNA isolation, we polarised the cells towards M1,
M2a and M2c phenotypes for 24 hours, as described in Chapter 2. The result is shown in Figure
3.2.: TRIB1 mRNA expression is highly variable among different individuals. However, it is
significantly increased in M1LPS+INF- and M2aIL-4 conditions, compared to Mun (2.6-fold
change, p=0.02; 2.6-fold change, p=0.0002). TRIB1 expression seems to increase also in
response to IL-10 (M2cIL-10) but the change is not statistically significant (1.4-fold change,
p=0.3). We also investigated TRIB1 protein expression by using immunofluorescence. We first
observed a nuclear localisation of TRIB1 in human macrophages, which was consistent with
what have been reported before (Kiss-Toth et al., 2006, Yokoyama et al., 2010, Guan et al.,
2016). As expected, we observed variability among different donors (Figure 3.3. B-F) and we
did not find any statistically significant changes in the expression of TRIB1 protein (Figure
3.3. A). This was potentially due to the low n number (n=5). Representative
immunofluorescence pictures are shown in Figure 3.4., while the isotype control staining for
each condition is shown in Chapter 8 (Appendix II). TRIB1 is expressed in human
macrophages differentiated from blood monocytes and it increases in response to both anti-
inflammatory and pro-inflammatory polarising stimuli.

83
Fig
ure
3.1
. T
RIB
1 R
NA
exp
ress
ion
in
hu
man
tis
sues
: G
TE
xP
ort
al
TR
IB1 R
NA
ex
pre
ssio
n i
n 5
4 d
iffe
rent
hum
an t
issu
es E
xpre
ssio
n v
alues
are
show
n i
n T
PM
(T
ransc
ripts
per
Mil
lion);
box
plo
ts a
re s
how
n a
s
med
ian, w
hil
e dots
are
dis
pla
yed
as
outl
iers
(ab
ov
e or
bel
ow
1.5
tim
es t
he
inte
rquar
tile
ran
ge)
. T
PM
val
ues
wer
e ta
ken
fro
m R
NA
-seq
dat
a,
not
norm
alis
ed:
the
TP
M v
alues
wer
e ca
lcula
ted f
rom
a g
ene
model
in w
hic
h i
sofr
om
s ar
e co
llap
sed t
o a
sin
gle
gen
e.
Dat
a S
ourc
e: G
TE
x A
nal
ysi
s R
elea
se V
8 (
dbG
aP A
cces
sion p
hs0
00424.v
8. p2).

84
Figure 3.2. Assessment of TRIB1 RNA expression in polarised human macrophages by
RT-qPCR
Relative TRIB1 RNA expression normalised to the housekeeping GAPDH, after 24 hours
polarisation. Cells were treated with LPs and INF- (M1), IL-4 (M2a) and IL-10 (M2c); Mun
refers to untreated/unpolarised macrophages, used as a control. Data are presented as mean
SEM (One-way ANOVA with Dunnett’s post-test, n = 18, *** p < 0.001, * p<0.05, p0.05).
Mun
M1 (L
PS +
INF-γ
)
M2a
IL-4
M2c
IL-1
0
0
2×10⁻²
4×10⁻²
6×10⁻²
8×10⁻²
TR
IB1 R
NA
expre
ssio
n r
ela
tive to G
AP
DH
*
***
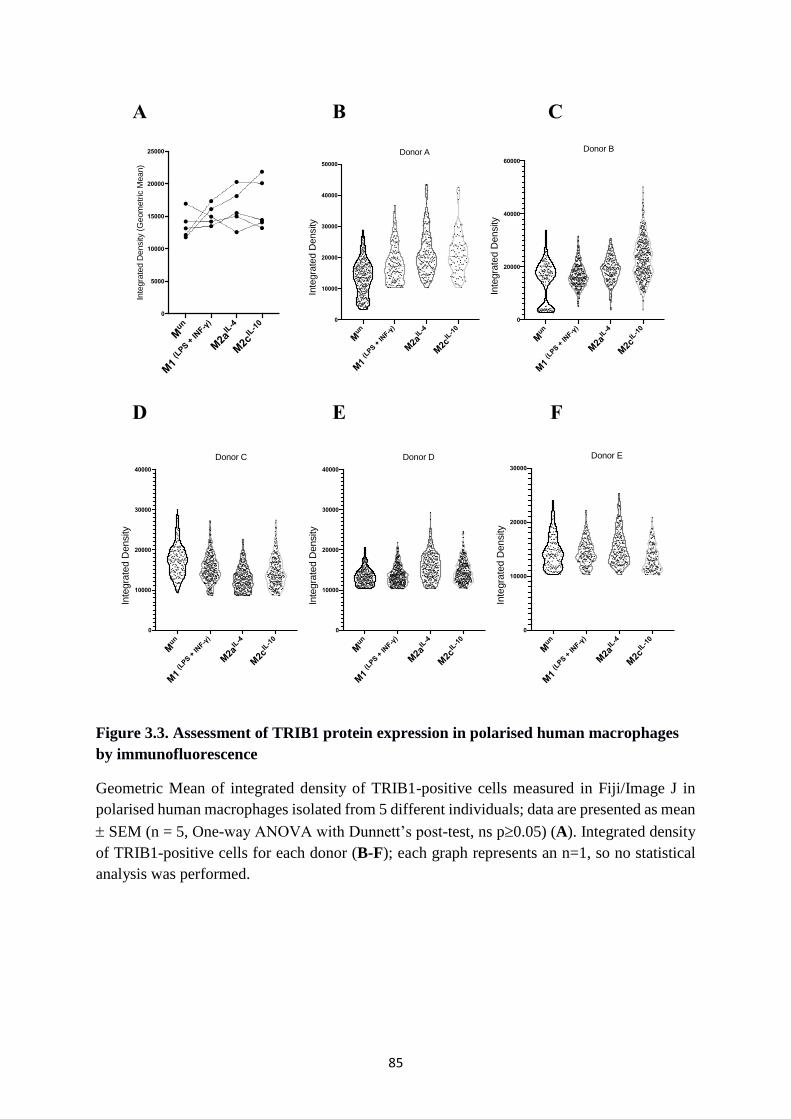
85
Figure 3.3. Assessment of TRIB1 protein expression in polarised human macrophages
by immunofluorescence
Geometric Mean of integrated density of TRIB1-positive cells measured in Fiji/Image J in
polarised human macrophages isolated from 5 different individuals; data are presented as mean
SEM (n = 5, One-way ANOVA with Dunnett’s post-test, ns p0.05) (A). Integrated density
of TRIB1-positive cells for each donor (B-F); each graph represents an n=1, so no statistical
analysis was performed.
A B
FED
C
Mun
M1 (L
PS +
INF-γ
)
M2a
IL-4
M2c
IL-1
0
0
5000
10000
15000
20000
25000
Inte
gra
ted D
ensity (
Geom
etr
ic M
ean)
Mun
M1 (L
PS +
INF-γ
)
M2a
IL-4
M2c
IL-1
0
0
10000
20000
30000
40000
50000
Inte
gra
ted D
ensity
Donor A
Mun
M1 (L
PS +
INF-γ
)
M2a
IL-4
M2c
IL-1
0
0
20000
40000
60000
Inte
gra
ted D
ensity
Donor B
Mun
M1 (L
PS +
INF-γ
)
M2a
IL-4
M2c
IL-1
0
0
10000
20000
30000
40000
Inte
gra
ted D
ensity
Donor C
Mun
M1 (L
PS +
INF-γ
)
M2a
IL-4
M2c
IL-1
0
0
10000
20000
30000
40000
Inte
gra
ted D
ensity
Donor D
Mun
M1 (L
PS +
INF-γ
)
M2a
IL-4
M2c
IL-1
0
0
10000
20000
30000
Inte
gra
ted D
ensity
Donor E

86
Figure 3.4. Representative immunofluorescence images
Representative immunofluorescence images for Donor B showing polarised MDMs stained for
dapi (blue) tubulin (green), TRIB1 (red); merged channels are also shown in the last panel.
Images were acquired using a 20x objective magnification. Integrated density analysis was
performed in Fiji/ImageJ.

87
3.3.2. TRIB1 overexpression in human macrophages
Our lab previously investigated the role of Trib1 manipulation in tissue-resident macrophages
with focus on metabolic tissues (liver and adipose). By using Trib1 knockout and transgenic
mice, we observed that Trib1 does not alter macrophage number but changes their phenotype.
Specifically, Trib1KO mice exhibit more pro-inflammatory cells, compared to Trib1WT;
conversely, macrophages from Trib1Tg mice show an anti-inflammatory phenotype (data not
shown, manuscript in preparation). A recent study performed on murine bone-marrow derived
macrophages (BMDMs) has also shown that Trib1 alters macrophage phagocytosis, migration
and polarisation (Arndt et al., 2018). However, no data is available about the role of TRIB1 in
human primary macrophages. Therefore, we carried out a TRIB1 plasmid overexpression in
unpolarised MDMs and checked the gene expression of macrophage markers and pro-
inflammatory cytokines. First, we confirmed the overexpression of TRIB1 RNA by using RT-
qPCR (Figure 3.5.), which is highly variable, probably due to different transfection efficiency
as well as different endogenous levels of TRIB1 transcript in different individuals. We found
that when TRIB1 is upregulated, there is a significant increase in anti-inflammatory
macrophage markers (MSR-1, CD163 and IL-4) at the RNA level (Figure 3.6. A-C) and a
decrease in the pro-inflammatory IL-6 and IL-8 RNA expression (Figure 3.6. D-E). We also
measured IL-8 protein secretion by performing ELISA on supernatants and found that it is
significantly decreased and this was consistent with the RNA data (Figure 3.6. F). This was in
line with what was reported by Arndt and colleagues who showed that BMDMs from Trib1
deficient mice are pro-inflammatory (Arndt et al., 2018).

88
Figure 3.5. Assessment of TRIB1 overexpression in MDMs by RT-qPCR
Relative TRIB1 RNA expression normalised to the housekeeping GAPDH in MDMs
transfected with a control plasmid (GFP) and a TRIB1 overexpression plasmid (24 hours
transfection); total DNA transfected was 2500ng/well in a 6 well plate. Data are presented as
mean SEM (n = 4, paired t-test, ns p0.05).
Control hTRIB1 0.0
0.2
0.4
50
100
150
200
TR
IB1 R
NA
expre
ssio
n r
ela
tive to G
AP
DH
TRIB1
p=0.1

89
Figure 3.6. Impact of TRIB1 overexpression on MDMs phenotype
Relative RNA expression of MSR-1 (A), CD163 (B), IL-4 (C), IL-6 (D) and IL-8 (E)
normalised to the housekeeping GAPDH in MDMs transfected with a plasmid control (GFP)
and TRIB1 overexpression plasmid (24 hours transfection); total DNA transfected was
2500ng/well in a 6 well plate. IL-8 protein levels measured by using ELISA in supernatants
collected after 24 hours MDMs transfection (F) (n =4-7, paired t-test, * p<0.05, ns p0.05).
Control hTRIB1 0.0000
0.0005
0.0010
0.0015
0.0020
0.2
0.4
0.6
0.8
IL-4
RN
A e
xpre
ssio
n r
ela
tive to G
AP
DH
IL-4
p=0.09
Control hTRIB1 0
5
10
15
20
25
IL-8
RN
A e
xpre
ssio
n r
ela
tive to G
AP
DH
IL-8
*
Control hTRIB1 0
20000
40000
60000
80000
IL-8
pg/m
L
IL-8 secretion
*
Control hTRIB1 0.0
0.1
0.2
0.3
0.4
0.5
MS
R-1
RN
A e
xpre
ssio
n r
ela
tive to G
AP
DH
MSR-1
*
Control hTRIB1 0.0
0.1
0.2
0.3
0.4
0.5
CD
163 R
NA
expre
ssio
n r
ela
tive to G
AP
DH
CD163
*
Control hTRIB1 0.00
0.05
0.10
0.15
0.20
IL-6
RN
A e
xpre
ssio
n r
ela
tive to G
AP
DH
IL-6
*
A B C
D E F

90
3.3.3. Post-transcriptional regulation of TRIB1: impact of the 3’UTR
It has been reported that TRIB1 exhibits an mRNA half-life shorter than 1 hour (Sharova et
al., 2009) and it is likely to be post-transcriptionally regulated by either proteasomal or non-
proteasomal mechanisms (Soubeyrand et al., 2016). Therefore, we investigated the role of the
3’UTR in the post-transcriptional regulation of TRIB1. We cloned the full-length sequence of
the 3’UTR of TRIB1 downstream of a renilla luciferase gene and evaluated the impact of this
region on the enzyme activity, by using a dual luciferase reporter assay. We observed a robust
reduction of the enzymatic activity (> 40% reduction, p<0.0001), suggesting that this region
contributes to the post-transcriptional regulation of TRIB1 (Figure 3.7.). In fact, the 3’UTR of
coding genes is the main target of miRNAs (Bartel et al., 2009). To investigate whether TRIB1
might be regulated by miRNAs, we performed a transient knock-down of DICER1 and AGO2,
both key regulators of miRNA biogenesis and function (O'Brien et al., 2018) and checked
TRIB1 mRNA and protein levels. Figure 3.8. shows the confirmation of efficient DICER1 and
AGO2 enzyme knock-down in MDMs by RT-qPCR (DICER1 70% knock-down, p=0.001;
AGO2 80% knock-down, p=0.02). In both conditions, TRIB1 mRNA levels tended to increase
but with high variability and not in all the individuals and the change was not statistically
significant (siDICER1, 1.3-fold-change, p=0.069; siAGO2 1.6-fold-change, p=0.36) (Figure
3.9.). Similarly, TRIB1 protein in siDICER1 samples tended to increase but the change was
not statistically significant (1.6-fold-change, p=0.23) (Figure 3.10.). In fact, by genetically
impairing the biogenesis and the activity of miRNAs we are likely perturbating multiple genes,
that can indirectly have an effect on TRIB1.

91
Figure 3.7. Impact of the 3’UTR of TRIB1 on gene reporter activity
Relative luciferase activity measured in HEK293T cell line after 24 hours co-transfection of a
renilla luciferase reporter (control plasmid, no UTR) and a TRIB1 3’UTR reporter with a firefly
luciferase control (required for normalisation). Total DNA transfected 100 ng/well (96-well
plate). Data are presented as mean SEM (unpaired t-test, n = 12, *** p < 0.001).
Figure 3.8. Confirmation of DICER1 and AGO2 knock-down by RT-qPCR
Relative RNA expression of DICER1 and AGO2 normalised to the housekeeping GAPDH in
MDMs transfected with DICER1 siRNA (A) and AGO2 siRNA (B) (48 hours transfection);
total RNA transfected was 50nM in a 6 well plate. Data are presented as mean SEM (n=3-8,
paired t-test, *** p<0.001, *p<0.05).
Control TRIB1 3'UTR0
50
100
150
200
250
Rela
tive L
ucifera
se A
ctivity
(arb
itra
ry u
nits)
***
Scr
amble
siDIC
ER1
0.00
0.02
0.04
0.06
0.08
DIC
ER
1 R
NA
expre
ssio
n r
ela
tive to G
AP
DH
**DICER1
Scr
amble
siAGO2
0.000
0.001
0.002
0.003
0.004
AG
O2 R
NA
expre
ssio
n r
ela
tive to G
AP
DH
*AGO2
A B
92
Figure 3.9. Effect of DICER1 and AGO2 knock-down on TRIB1 mRNA expression
Relative RNA expression of TRIB1 normalised to the housekeeping GAPDH in MDMs
transfected with DICER1 siRNA (A) and AGO2 siRNA (B) (48 hours transfection); total RNA
transfected was 50nM in a 6 well plate. Data are presented as individual points (n=3-8, paired
t-test, ns p0.05).
Figure 3.10. Effect of DICER1 knock-down on TRIB1 protein expression
Relative TRIB1 protein expression normalised to the housekeeping HSP90 in MDMs
transfected with DICER1 siRNA/scramble (A) (48 hours transfection); total RNA transfected
was 50nM in a 6 well plate; western blot representative picture (B); letters (a, b, c, d) refer to
4 different individuals. Data are presented as individual points (n=4, paired t-test, ns p0.05).
Scr
amble
siDIC
ER1
0.00
0.01
0.02
0.03
0.04T
RIB
1 R
NA
expre
ssio
n r
ela
tive to G
AP
DH TRIB1
p=0.07
Scr
amble
siAGO2
0.000
0.002
0.004
0.006
0.008
0.010
TR
IB1 R
NA
expre
ssio
n r
ela
tive to G
AP
DH TRIB1
p=0.4
A B
A B
42 kDa
83 kDa

93
3.3.4. Identification of miRNAs potentially targeting TRIB1
Our previous findings suggest that TRIB1 might be subject to post-transcriptional regulation
by miRNAs, so our next aim was to in silico identify potential regulators of the pseudo-kinase.
We performed a comprehensive miRNA-target prediction analysis taking advantage of
multiple web-based tools and algorithms, as described in Chapter 2. Table 3.1. lists the
predicted number of miRNAs targeting the 3’UTR of TRIB1, according to 7 different
prediction tools. We identified a total of 1237 miRNAs predicted to target TRIB1: the list was
further narrowed down by selecting high-confidence miRNAs and those predicted by at least
3 databases. Next, we selected miR-101-3p, miR-132-3p and miR-214-5p for experimental
validation, according to the following criteria:
miR-101-3p is known to regulate macrophage function (Wei et al., 2015, Zhang et al.,
2015, Huang et al., 2020); it is a high-confidence annotated miRNA and the predicted
interaction, detected in 3 databases, is well conserved among different species;
miR-132-3p is also established to regulate inflammatory responses in different contexts
(Shaked et al., 2009, Liu et al., 2014, Leinders et al., 2016) and it is a high confidence
miRNA, detected in 3 databases; however, the 2 binding sites on the 3’UTR of TRIB1
are poorly conserved among different species;
miR-214-5p is not listed among the high-confidence miRNAs, but it has been
previously associated with inflammation (Iizuka et al., 2012, Yang et al., 2019); the 2
predicted binding sites are poorly conserved, but the interaction was predicted by 3
databases.
Moreover, we also considered that all the predicted interactions are characterised by a
canonical seed region (7mers). The characteristics of miR-101-3p, miR-132-3p and miR-214-
5p are summarised in Table 3.2.; binding site position, seed region types and phylogenetic
conservation were taken from TargetScan, while high confidence miRNAs were taken from
miRbase. Next, we checked the expression of these miRNAs in polarised MDMs, by using a
small non-coding RNA-seq, performed on M0 and M1 macrophages (sequencing experiment
is explained in Chapter 4). Figure 3.11. shows the counts per million values (CPM) of the
candidate miRNAs in M0 and M1 macrophages. None of the miRNAs was differentially

94
expressed between the two groups. However, considering that the highest CPM value among
the small RNA sequenced was 17 and the lowest was -2, we can conclude that miR-101-3p and
miR-132-3p were abundant in both M0 and M1 macrophages (miR-101-3p average CPM
M0=7, average CPM M1=7.3; miR-132-3p average CPM M0=7.6 average CPM M1=7.8),
whilst miR-214-5p was the least expressed (average CPM M0= -0.4, average CPM M1= -0.8).
To investigate whether these miRNAs are able to modulate TRIB1 expression, we transiently
transfected miRNA mimics in unpolarised MDMs and iBMDMs and performed RT-qPCR on
both human and murine TRIB1. We first evaluated that the overexpression of miRNAs by
transfection of mimics in MDMs was successful (Figure 3.12.) and then we determined the
downstream effect on TRIB1 RNA. MiR-101-3p, miR-132-3p and miR-214-5p significantly
impaired TRIB1 expression in human macrophages, causing a 40% reduction (Figure 3.13.
A-C); similarly, in murine macrophages, Trib1 expression was negatively modulated by the
mimics (30% decrease). However, the change induced by miR-214-5p was not statistically
significant (p=0.1) (Figure 3.14.). This may be due to the high variability of the negative
control in transfected iBMDMs. Lastly, we performed a pathway enrichment analysis of all
predicted target genes of candidate miRNAs by using Reactome (https://reactome.org/) (p-
value cut off 0.05). The list of target genes of each miRNA was downloaded from TargetScan.
Table 3.3. lists the top 10 significant pathways for miRNAs target genes. The majority of miR-
101-3p target genes appear to be involved in chromatin organization and oestrogen-mediated
signalling pathways; miR-132-3p target genes seem to be transcription factors, regulating AKT
and PTEN signalling pathways, while genes targeted by miR-214-5p are involved in
development and axon guidance. We then filtered the list of target genes, selecting only those
differentially expressed by human polarised macrophages (M0 vs M1), by using an RNA-seq
dataset, previously generated in our lab (DOI: 10.17632/j2hmt7k9fh.1). We performed a
KEGG pathway enrichment analysis using GOSeq R package (cut off p value 0.05). Figure
3.15. shows the results for miR-101-3p and miR-132-3p; unfortunately, miR-214-5p did not
show any significant enrichment. Interestingly, among the most significant enriched pathways
for miR-101-3p we observed MAPK signalling pathway, which is a master regulator of
inflammation, and chemokine signalling pathway, while for miR-132-3p was either WNT-
signalling pathway or actin regulation. We then decided to go on with the full validation of
miR-101-3p/TRIB1 interaction, as it appears more biologically relevant in macrophages.
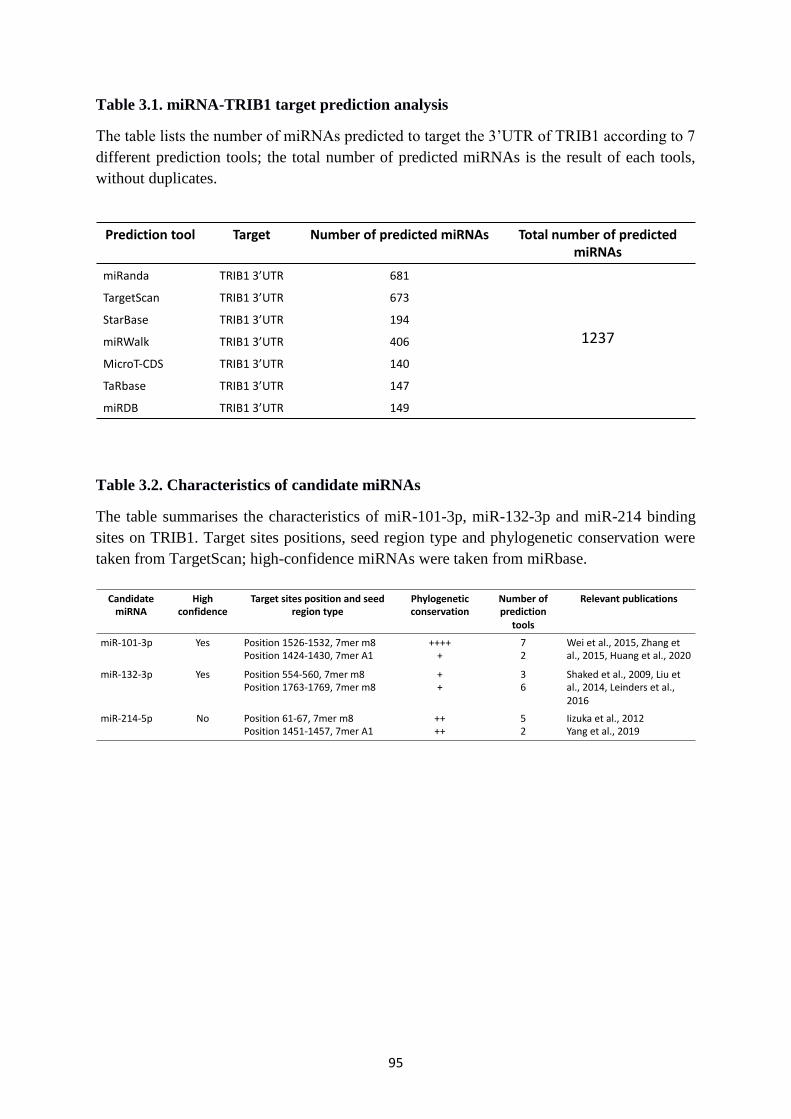
95
Table 3.1. miRNA-TRIB1 target prediction analysis
The table lists the number of miRNAs predicted to target the 3’UTR of TRIB1 according to 7
different prediction tools; the total number of predicted miRNAs is the result of each tools,
without duplicates.
Table 3.2. Characteristics of candidate miRNAs
The table summarises the characteristics of miR-101-3p, miR-132-3p and miR-214 binding
sites on TRIB1. Target sites positions, seed region type and phylogenetic conservation were
taken from TargetScan; high-confidence miRNAs were taken from miRbase.
Prediction tool Target Number of predicted miRNAs Total number of predicted miRNAs
miRanda TRIB1 3’UTR 681
1237
TargetScan TRIB1 3’UTR 673
StarBase TRIB1 3’UTR 194
miRWalk TRIB1 3’UTR 406
MicroT-CDS TRIB1 3’UTR 140
TaRbase TRIB1 3’UTR 147
miRDB TRIB1 3’UTR 149
Candidate miRNA
High confidence
Target sites position and seed region type
Phylogenetic conservation
Number of prediction
tools
Relevant publications
miR-101-3p Yes Position 1526-1532, 7mer m8Position 1424-1430, 7mer A1
+++++
72
Wei et al., 2015, Zhang et al., 2015, Huang et al., 2020
miR-132-3p Yes Position 554-560, 7mer m8Position 1763-1769, 7mer m8
++
36
Shaked et al., 2009, Liu et al., 2014, Leinders et al., 2016
miR-214-5p No Position 61-67, 7mer m8Position 1451-1457, 7mer A1
++++
52
Iizuka et al., 2012Yang et al., 2019

96
Figure 3.11. Endogenous expression of candidate miRNAs in human polarised MDMs:
small RNA-seq
miR-101-3p (A), miR-132-3p (B) and miR-214-5p (C) abundance in M0 and M1 macrophages,
expressed as counts per million values (log2 CPM +1), from small RNA sequencing analysis.
No statistical analysis was performed.
Mun M1 (LPS + INF-γ)5
6
7
8
9
CP
M C
ou
nts
hsa-miR-101-3p
Mun M1 (LPS + INF-γ)6
7
8
9
10
CP
M C
ou
nts
hsa-miR-132-3p
A B
Mun M1 (LPS + INF-γ)-4
-2
0
2
4
CP
M C
ou
nts
hsa-miR-214-5p
C

97
Figure 3.12. Confirmation of miRNAs overexpression in MDMs by RT-qPCR
Relative expression of miR-101-3p (A), miR-132-3p (B) and miR-214-5p (C) normalised to
the housekeeping U6 in samples transfected with miRNA mimics (24 hours transfection). Total
RNA transfected was 50nM per well in a 6 well plate. Data are presented as mean SEM (n =
4-8, paired t-test, *** p<0.001). Plots showing PCR amplification of a representative sample
for miR-101-3p/control (D), miR-132-3p/control (E) and miR-214-5p/control (F).
Control miR-132-3p mimic0
20
40
60
80
miR
-132-3
p e
xpre
ssio
n r
ela
tive to U
6 ***
Control miR-101 mimic0
5
10
15
miR
-101-3
p e
xpre
ssio
n r
ela
tive to U
6 ***
Control miR-214-5p mimic 0
10
20
30
40
miR
-214-5
p e
xpre
ssio
n r
ela
tive to U
6 ***
A CB
ControlMimic ControlMimicMimic Control
D FE

98
Figure 3.13. Assessment of TRIB1 endogenous expression in transfected MDMs by RT-
qPCR
Relative TRIB1 RNA expression normalised to the housekeeping GAPDH in MDMs treated
with miR-101-3p mimic (A), miR-132-3p mimic (B) and miR-214-5p mimic (C) and a
negative control (24 hours transfection). Total RNA transfected was 50nM per well in a 6 well
plate. Data are presented as mean SEM (n = 5-8, paired t-test, ** p<0.01, * p<0.05).
Figure 3.14. Assessment of mTrib1 endogenous expression in transfected iBMDMs by
RT-qPCR
Relative Trib1 RNA expression normalised to the housekeeping Gapdh in iBMDMs treated
with miRNA mimics and negative control (24 hours transfection). Total RNA transfected was
50nM per well in a 6 well plate. Data are presented as mean SEM (n = 4, ordinary one-way
ANOVA with Dunnett’s post-test, * p<0.05, ns p0.05).
Control Mimic0.000
0.005
0.010
0.015
0.020
TR
IB1 R
NA
expre
ssio
n r
ela
tive to G
AP
DH
miR-101-3p
**
Control Mimic0.000
0.005
0.010
0.015
0.020
0.025
TR
IB1 R
NA
expre
ssio
n r
ela
tive to G
AP
DH
miR-132-3p
*
Control Mimic0.000
0.005
0.010
0.015
0.020
TR
IB1 R
NA
expre
ssio
n r
ela
tive to G
AP
DH
miR-214-5p
*
A B C
Contr
ol
miR
-101
-3p m
imic
miR
-132
-3p m
imic
miR
-214
-5p m
imic
0.0
5.0×10⁻⁴
1.0×10⁻³
1.5×10⁻³
Rela
tive T
rib1 R
NA
expre
ssio
n r
ela
tive to G
apdh
*
p=0.1
*

99
Table 3.3. Reactome pathway analysis of candidate miRNAs target genes
Top 10 significant enriched pathways of miR-101-3p, miR-132-3p and miR-214-5p target
genes, downloaded from TargetScan. Reactome was used online and results were downloaded
as tables (p-value cut off 0.05).
Entities found refer to the number of input genes found in each specific pathway overlapping
with the total genes involved in the pathway.
Entities total refer to the total number of genes involved in each specific pathway.
Entities ratio refers to the ratio of reactions from each pathway that contain the input genes.
Entities p value refers to the result of statistical test.
Pathway name #Entities found #Entities total Entities ratio Entities pValueChromatin organization 38 256 1.76E-02 1.07E-04Chromatin modifying enzymes 38 256 1.76E-02 1.07E-04Transcriptional Regulation by MECP2 20 100 6.89E-03 1.21E-04Estrogen-dependent gene expression 26 154 1.06E-02 1.91E-04Regulation of MECP2 expression and activity 11 39 2.69E-03 2.55E-04PKMTs methylate histone lysines 12 49 3.38E-03 4.79E-04MET activates RAP1 and RAC1 6 13 8.96E-04 5.50E-04ESR-mediated signaling 35 256 1.76E-02 8.34E-04MECP2 regulates neuronal receptors and channels 9 32 2.20E-03 9.22E-04HDMs demethylate histones 8 31 2.14E-03 2.94E-03
Pathway name #Entities found #Entities total Entities ratio Entities pValuePIP3 activates AKT signaling 32 316 2.18E-02 9.62E-07Intracellular signaling by second messengers 33 363 2.50E-02 6.22E-06FOXO-mediated transcription 15 110 7.58E-03 3.11E-05PTEN Regulation 18 171 1.18E-02 1.42E-04
Diseases of signal transduction by growth factor receptors and second messengers 36 484 3.33E-02 1.47E-04Regulation of MECP2 expression and activity 8 39 2.69E-03 1.56E-04Transcriptional Regulation by MECP2 13 100 6.89E-03 1.64E-04Gene expression (Transcription) 100 1850 1.27E-01 2.22E-04FOXO-mediated transcription of cell death genes 6 23 1.58E-03 2.96E-04MECP2 regulates transcription factors 4 10 6.89E-04 6.47E-04
Pathway name #Entities found #Entities total Entities ratio Entities pValueTranscriptional Regulation by E2F6 5 46 3.17E-03 1.06E-03Oxidative Stress Induced Senescence 7 114 7.85E-03 3.01E-03Nuclear Receptor transcription pathway 6 86 5.93E-03 3.20E-03Axon guidance 19 584 4.02E-02 3.84E-03POU5F1 (OCT4), SOX2, NANOG activate genes related to proliferation 3 21 1.45E-03 5.22E-03Cellular Senescence 9 199 1.37E-02 6.06E-03Post-transcriptional silencing by small RNAs 2 7 4.82E-04 6.08E-03Transcriptional regulation of pluripotent stem cells 4 45 3.10E-03 6.79E-03Nervous system development 19 620 4.27E-02 7.14E-03Developmental Biology 32 1241 8.55E-02 7.37E-03
Reactome pathway analysis
miR
-10
1-3
pm
iR-1
32
-3p
miR
-21
4-5
p

100
Figure 3.15. KEGG enrichment pathway analysis of macrophage-specific genes targeted
by miR-101-3p and miR-132-3p
Top 10 significant enriched pathways of miR-101-3p (A) and miR-132-3p (B) macrophage-
specific target genes. miRNA-target prediction analysis was performed using TargetScan; the
list of target genes was filtering selecting only genes differentially expressed in macrophages
(M0 vs M1) from RNA-seq dataset (DOI: 10.17632/j2hmt7k9fh.1). KEGG analysis was done
by using GOSeq and the plots were generated in R (p value < 0.05).
A B
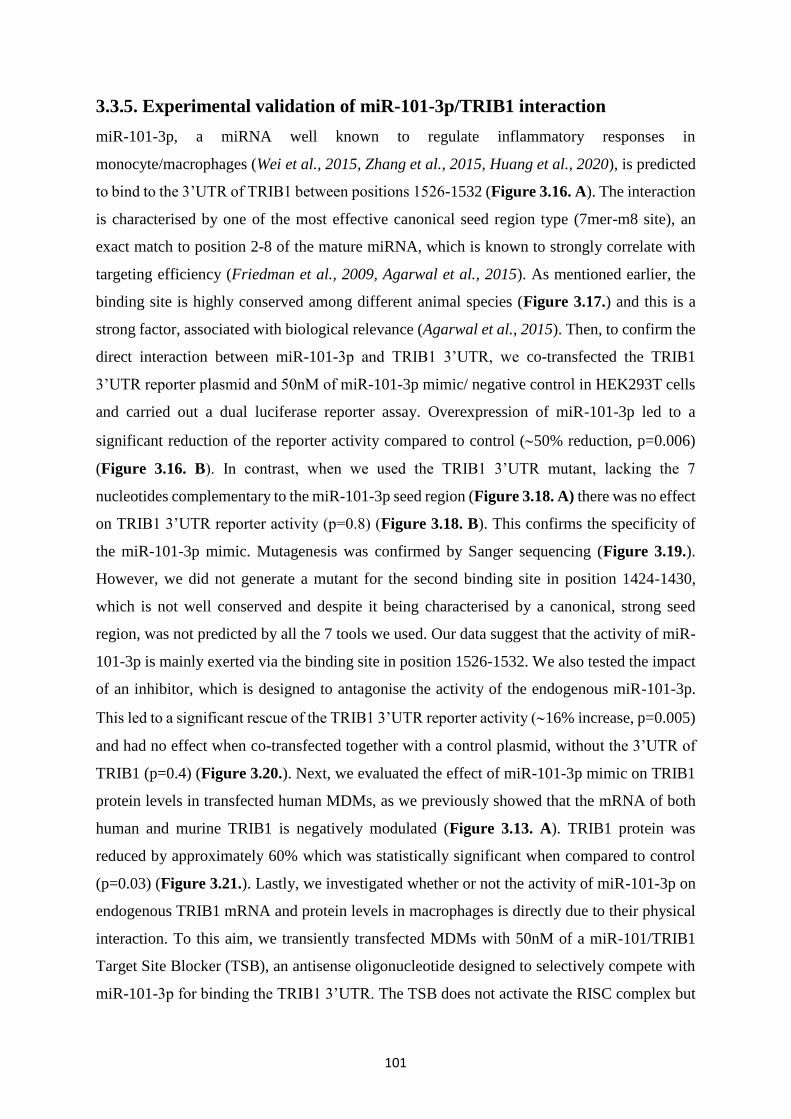
101
3.3.5. Experimental validation of miR-101-3p/TRIB1 interaction
miR-101-3p, a miRNA well known to regulate inflammatory responses in
monocyte/macrophages (Wei et al., 2015, Zhang et al., 2015, Huang et al., 2020), is predicted
to bind to the 3’UTR of TRIB1 between positions 1526-1532 (Figure 3.16. A). The interaction
is characterised by one of the most effective canonical seed region type (7mer-m8 site), an
exact match to position 2-8 of the mature miRNA, which is known to strongly correlate with
targeting efficiency (Friedman et al., 2009, Agarwal et al., 2015). As mentioned earlier, the
binding site is highly conserved among different animal species (Figure 3.17.) and this is a
strong factor, associated with biological relevance (Agarwal et al., 2015). Then, to confirm the
direct interaction between miR-101-3p and TRIB1 3’UTR, we co-transfected the TRIB1
3’UTR reporter plasmid and 50nM of miR-101-3p mimic/ negative control in HEK293T cells
and carried out a dual luciferase reporter assay. Overexpression of miR-101-3p led to a
significant reduction of the reporter activity compared to control (50% reduction, p=0.006)
(Figure 3.16. B). In contrast, when we used the TRIB1 3’UTR mutant, lacking the 7
nucleotides complementary to the miR-101-3p seed region (Figure 3.18. A) there was no effect
on TRIB1 3’UTR reporter activity (p=0.8) (Figure 3.18. B). This confirms the specificity of
the miR-101-3p mimic. Mutagenesis was confirmed by Sanger sequencing (Figure 3.19.).
However, we did not generate a mutant for the second binding site in position 1424-1430,
which is not well conserved and despite it being characterised by a canonical, strong seed
region, was not predicted by all the 7 tools we used. Our data suggest that the activity of miR-
101-3p is mainly exerted via the binding site in position 1526-1532. We also tested the impact
of an inhibitor, which is designed to antagonise the activity of the endogenous miR-101-3p.
This led to a significant rescue of the TRIB1 3’UTR reporter activity (16% increase, p=0.005)
and had no effect when co-transfected together with a control plasmid, without the 3’UTR of
TRIB1 (p=0.4) (Figure 3.20.). Next, we evaluated the effect of miR-101-3p mimic on TRIB1
protein levels in transfected human MDMs, as we previously showed that the mRNA of both
human and murine TRIB1 is negatively modulated (Figure 3.13. A). TRIB1 protein was
reduced by approximately 60% which was statistically significant when compared to control
(p=0.03) (Figure 3.21.). Lastly, we investigated whether or not the activity of miR-101-3p on
endogenous TRIB1 mRNA and protein levels in macrophages is directly due to their physical
interaction. To this aim, we transiently transfected MDMs with 50nM of a miR-101/TRIB1
Target Site Blocker (TSB), an antisense oligonucleotide designed to selectively compete with
miR-101-3p for binding the TRIB1 3’UTR. The TSB does not activate the RISC complex but

102
prevents the access of a miRNA to a given target gene. This enables the study of a single
miRNA in the context of a single gene. The TSB treatment caused a significant increase of
both TRIB1 mRNA (1.3-fold change, p=0.004) and protein levels (76%, p=0.04), compared
to controls (Figure 3.22.). Taken together, these data indicate that miR-101-3p is a negative
regulator of TRIB1 in macrophages.

103
Figure 3.16. Impact of miR-101-3p on gene reporter activity
Nucleotide alignment between miR-101-3p and TRIB1 3’UTR (A); relative luciferase activity
measured in HEK293T cells after 24 hours co-transfection of TRIB1 3’UTR reporter, firefly
luciferase reporter (required for data normalisation) and 50nM of miR-101-3p mimic or
negative control. Total DNA transfected 100 ng/well (96-well plate). Data are presented as
mean SEM (unpaired t-test, n = 9, ** p<0.01) (B).
Figure 3.17. Phylogenetic conservation of miR-101-3p binding site on the 3’UTR of
TRIB1
The figure, taken from TargetScan, shows that miR-101-3p binding site on TRIB1 is highly
conserved.
5’… .CCGUGUAUACCUCAGUACUGUG…3’ TRIB1 3’UTR 1526-1532
3’ AAGUCAAUAGUGUCAUGACAU 5’ miR-101-3p
5’… .CCGUGUAUACCUCA - - - - - - - G…3’ TRIB1 3’UTR mutant
3’ AAGUCAAUAGUGUCAUGACAU 5’ miR-101-3p
| | || || |
A
B

104
Figure 3.18. Impact of miR-101-3p on TRIB1 3’UTR mutant
Nucleotide alignment between miR-101-3p and TRIB1 3’UTR mutant lacking the 7 bases
complementary to the seed-region of the miRNA (A); relative luciferase activity measured in
HEK293T cells after 24 hours co-transfection of TRIB1 3’UTR mutant, firefly luciferase
reporter (required for data normalisation) and 50nM of miR-101-3p mimic or negative control.
Total DNA transfected 100 ng/well (96-well plate). Data are presented as mean SEM
(unpaired t-test, n = 7, ns p0.05) (B).
Figure 3.19. Confirmation of site-directed mutagenesis: miR-101-3p binding site deletion
TRIB1 3’UTR mutagenesis to generate was confirmed by reverse Sanger sequencing: 1 out of
3 plasmids had the 7-nucleotides deletion (screenshot taken from SeqMan Pro alignment
software, DNAStar).
A
B

105
Figure 3.20. Impact of miR-101-3p inhibitor on TRIB1 gene reporter activity
Relative luciferase activity measured in HEK293T cells after 24 hours co-transfection of renilla
control reporter (control plasmid) and TRIB1 3’UTR reporter with firefly reporter (required
for data normalisation) and 25nM of miR-101-3p inhibitor or negative control. Data are
presented as mean SEM (ordinary one-way ANOVA with Sidak’s post-test, n = 6, ** p<0.01,
ns p0.05).
Figure 3.21. Effect of miR-101-3p mimic on Trib1 protein expression
Relative Trib1 protein expression normalised to the housekeeping alpha-tubulin in human
MDMs transfected with 50nM of miR-101-3p mimic/negative control (24 hours transfection);
data are presented as mean SEM (n = 5, paired t-test, * p<0.05) (A); western blot membrane
of a representative sample, showing bands for Trib1 and alpha-tubulin (B).
Control Inhibitor Control Inhibitor0
20
40
60
80
Rela
tive L
ucife
rase A
ctivity
(arb
itra
ry u
nits)
**0.4397
Control plasmid
TRIB1 3’UTR Reporter
42 kDa
53 kDaControl Mimic
0.0
0.5
1.0
1.5
2.0
TR
IB1
/TU
BU
LIN
Le
vels
*
A B
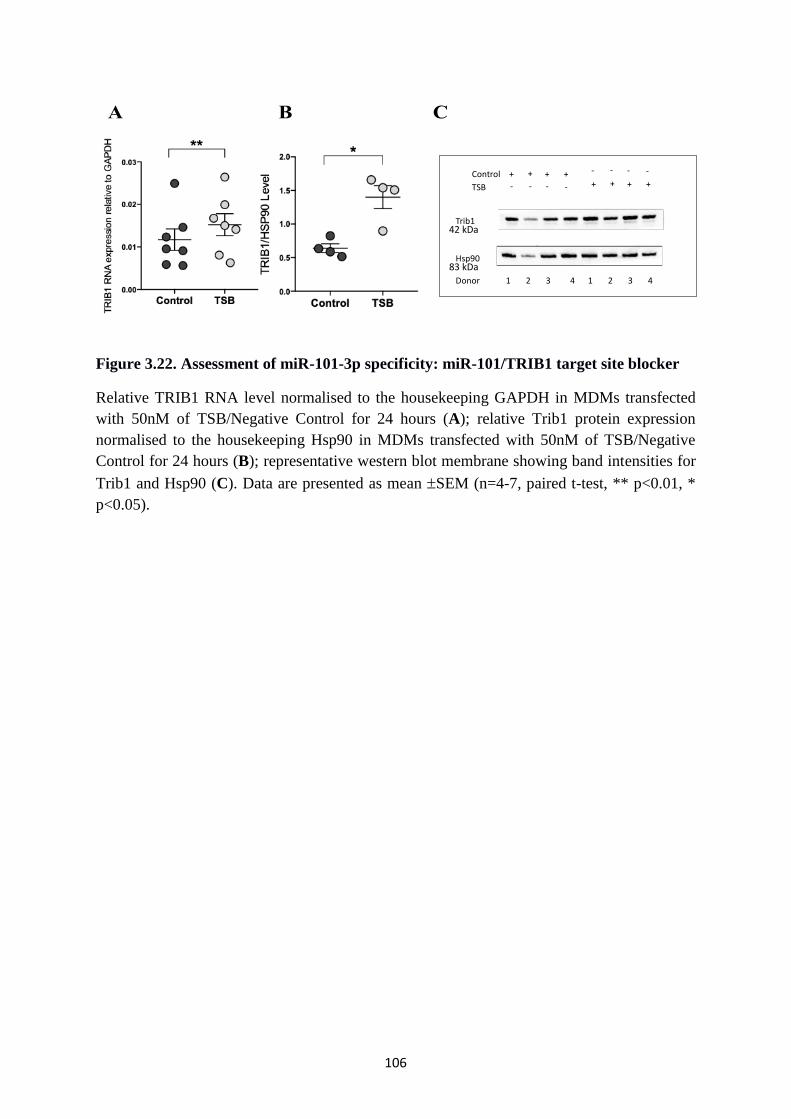
106
Figure 3.22. Assessment of miR-101-3p specificity: miR-101/TRIB1 target site blocker
Relative TRIB1 RNA level normalised to the housekeeping GAPDH in MDMs transfected
with 50nM of TSB/Negative Control for 24 hours (A); relative Trib1 protein expression
normalised to the housekeeping Hsp90 in MDMs transfected with 50nM of TSB/Negative
Control for 24 hours (B); representative western blot membrane showing band intensities for
Trib1 and Hsp90 (C). Data are presented as mean SEM (n=4-7, paired t-test, ** p<0.01, *
p<0.05).
42 kDa
83 kDaHsp90
Trib1
Control
TSB
+ ++++ +++- ---
- ---
Donor 1 2 3 4 1 2 3 4
A B C

107
3.3.6. Impact of miR-101-3p on human macrophages
Our previous results demonstrated that miR-101-3p is a negative regulator of TRIB1
expression by direct interaction. Next, we evaluated the effect of these miRNAs on DUSP1
and ABCA1, which have been previously identified and experimentally validated as miR-101-
3p target genes in macrophages (Wei et al., 2015, Zhang et al., 2015). DUSP1, dual specificity
phosphatase, interacts with MAPK proteins as a negative regulator, limiting inflammatory
responses (Abraham et al., 2006). ABCA1, ATP-binding cassette transporter A1, is responsible
for cholesterol efflux from macrophages to lipid-free apoA-I, the main component of HDL
(Zhao et al., 2012). The binding site of miR-101-3p on the 3’UTR of DUSP1 and ABCA1 is
characterised by canonical seed regions (8mer and 7mer A1, respectively) and they are both
well conserved among different species (from TargetScan). Accordingly, in response to miR-
101-3p mimic, both genes were significantly downregulated at the mRNA levels (Figure 3.23.
A, B). We evaluated also the effect of miR-101-3p mimic and inhibitor on cholesterol efflux
in transfected MDMs and found that in the presence of the mimic the % of total cholesterol
efflux from macrophages to HDL was reduced by 20% (p=0.008). Similarly, when we used
the inhibitor we observed an increase of 20% (p=0.003) (Figure 3.23. C). Despite the
significance, the effect of miR-101-3p on cholesterol efflux was quite small, but this is likely
due to the assay itself, requiring frequent media changes and testing 2 days post-transfection.
However, this effect of miR-101-3p is not TRIB1-dependent. Therefore, we investigated the
expression of IL-6 and IL-8 genes, which were significantly impaired in response to TRIB1
overexpression in MDMs (see Figure 3.6.). Macrophages transfected with miR-101-3p mimic
showed a significant increase of both IL-6 and IL-8 mRNA levels, compared to control
(p=0.03, p=0.04, respectively) (Figure 3.24. A, B). We also measured IL-8 protein through
ELISA and observed that there was a significant increase in response to miR-101-3p mimic
(p=0.007) (Figure 3.24. C). IL-6 ELISA did not show any differences among conditions, as
levels measured were below the threshold of detection (data not shown). To understand
whether the effect on IL-8 is TRIB1-dependent, we performed IL-8 ELISA in MDMs
transfected with the TSB. The TSB led to a small but significant decrease of IL-8 protein
(p=0.01) (Figure 3.24. D). This suggests that TRIB1 might be an upstream regulator of IL-8
gene, by either direct or indirect regulation. M1-like macrophages, challenged with LPS and
INF-, are also characterised by an increase in IL-8 production, compared to unpolarised cells
(Figure 3.24. E). Lastly, we looked at the gene expression of other macrophage polarisation
markers: miR-101-3p increased the expression of the M1 markers CD80 (p=0.04), CD86
108
(p=0.02), TNF- (p=0.04) and FAM26F (p=0.01) (Figure 3.25.). The latter was characterised
in our lab as M1 macrophage marker and it is strongly induced by LPS and INF- (manuscript
in submission). However, we did not observe any miR-101-3p mediated changes in M2
markers IL-4 (p=0.5), IL-10 (p=0.7), CD36 (p=0.3) and CD163 (p=0.4) (Figure 3.26.).
Overall, we can conclude that miR-101-3p induces an M1-like phenotype in human
macrophages, partially by directly targeting TRIB1, which, as mentioned earlier, is a positive
regulator of M2 macrophages, acting as anti-inflammatory gene.
Figure 3.23. Impact of miR-101-3p mimic on DUSP1 and ABCA1 genes in human
macrophages
Relative RNA expression of DUSP1 (A) and ABCA1 (B) normalised to the housekeeping
GAPDH in MDMs transfected with miR-101-3p mimic/control (50nM, 24 hours transfection).
Percentage of total cholesterol efflux to HDL measured on MDMs transfected with miR-101-
p mimic/control (50nM) and miR-101-3p inhibitor/control (25nM) (C). Data are presented as
mean SEM (n=4-7, paired t-test, ** p<0.01, * p<0.05).
Control Mimic0.00
0.02
0.04
0.06
AB
CA
1 R
NA
expre
ssio
n r
ela
tive to G
AP
DH
*
ABCA1
Control Mimic0.000
0.005
0.010
0.015
0.020
DU
SP
1 R
NA
expre
ssio
n r
ela
tive to G
AP
DH
**
DUSP1
Mimic Inhibitor60
80
100
120
140
Tota
l C
hole
ste
rol E
fflu
x (
%)
**
**
A B C

109
Figure 3.24. miR-101-3p effect on pro-inflammatory IL-6 and IL-8
Relative RNA expression of IL-6 (A) and IL-8 (B) normalised to the housekeeping GAPDH in
MDMs transfected with miR-101-3p mimic/control (24 hours transfection). IL-8 protein levels
measured by using ELISA in supernatants collected after 24 hours MDMs transfection with
miR-101-3p mimic/control (C), TSB/control (D) and 24 hours MDMs polarisation (E). Total
RNA transfected was 50nM per well in a 6 well plate. Data are presented as mean SEM (n=4-
8, paired t-test, ** p<0.01, * p<0.05).
Control Mimic0
2
4
6
IL-8
RN
A e
xpre
ssio
n r
ela
tive to G
AP
DH
IL-8
*
Control Mimic0.000
0.002
0.004
0.006
0.008
IL-6
RN
A e
xpre
ssio
n r
ela
tive to G
AP
DH
IL-6
*
Control Mimic0
5000
10000
15000
20000
IL-8
pg/m
L
**
Control TSB0
5000
10000
15000
IL-8
pg/m
L
*
Mun M1 (LPS + INF-γ)0
10000
20000
30000
40000
IL-8
pg/m
L
*
A B
C D E

110
Figure 3.25. miR-101-3p impact on M1 polarisation markers expression by RT-qPCR
Relative RNA expression of CD80 (A), CD86 (B), TNF (C) and FAM26F (D) normalised to
the housekeeping GAPDH in MDMs transfected with miR-101-3p/control (50nM, 24 hours
transfection). Data are presented as mean SEM (n=4-7, paired t-test, * p<0.05).
Control Mimic0.000
0.002
0.004
0.006
0.008
TN
Fa
RN
A e
xpre
ssio
n r
ela
tive to G
AP
DH
TNFa*
Control Mimic0.0
0.1
0.2
0.3
0.4
0.5
CD
86 R
NA
expre
ssio
n r
ela
tive to G
AP
DH
CD86*
Control Mimic0.00
0.01
0.02
0.03
0.04
CD
80 R
NA
expre
ssio
n r
ela
tive to G
AP
DH
CD80*
Control Mimic0.000
0.005
0.010
0.015
0.020
0.025
FA
M26F
RN
A e
xpre
ssio
n r
ela
tive to G
AP
DH
FAM26F*
A B
C D
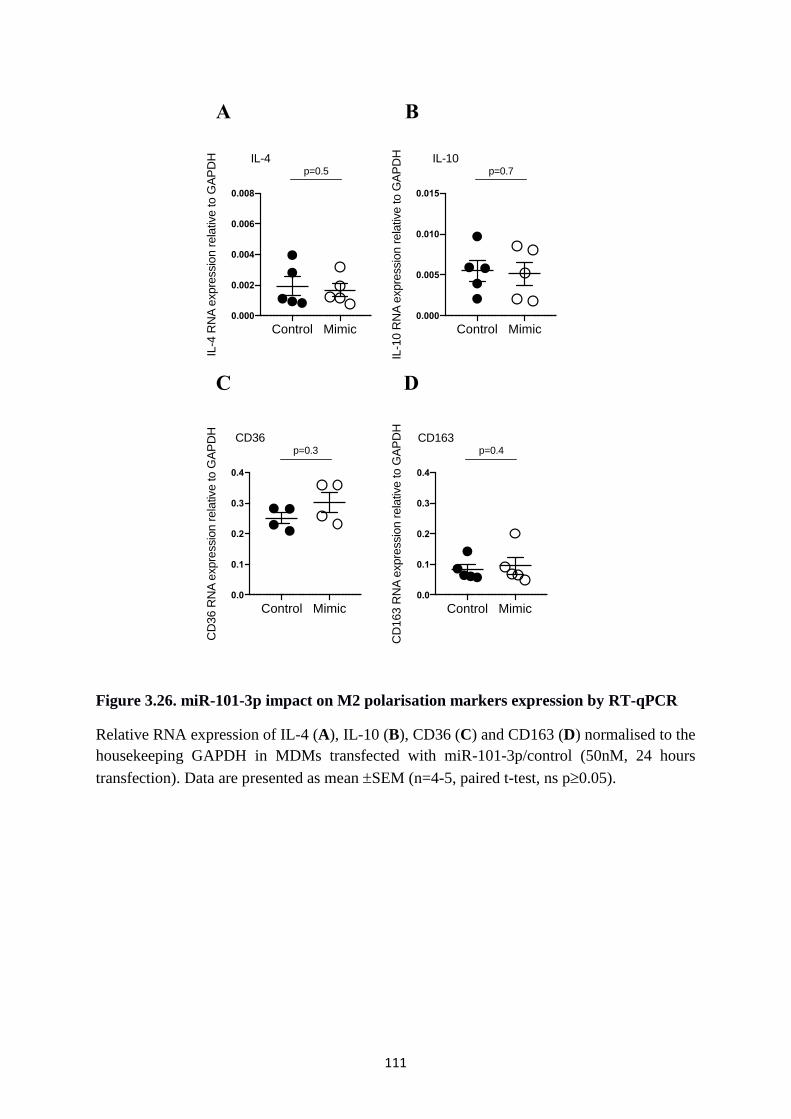
111
Figure 3.26. miR-101-3p impact on M2 polarisation markers expression by RT-qPCR
Relative RNA expression of IL-4 (A), IL-10 (B), CD36 (C) and CD163 (D) normalised to the
housekeeping GAPDH in MDMs transfected with miR-101-3p/control (50nM, 24 hours
transfection). Data are presented as mean SEM (n=4-5, paired t-test, ns p0.05).
Control Mimic0.000
0.002
0.004
0.006
0.008
IL-4
RN
A e
xpre
ssio
n r
ela
tive to G
AP
DH
IL-4p=0.5
Control Mimic0.000
0.005
0.010
0.015
IL-1
0 R
NA
expre
ssio
n r
ela
tive to G
AP
DH
IL-10p=0.7
Control Mimic0.0
0.1
0.2
0.3
0.4
CD
36 R
NA
expre
ssio
n r
ela
tive to G
AP
DH
CD36p=0.3
Control Mimic0.0
0.1
0.2
0.3
0.4
CD
163 R
NA
expre
ssio
n r
ela
tive to G
AP
DH
CD163p=0.4
A B
C D

112
3.4. Summary
To date, multiple in vivo and in vitro studies highlighted the critical role of TRIB1 in the
function and polarisation of macrophages, in both physiological and pathological contexts
(Satoh et al., 2013, Akira et al., 2013). TRIB1, along with its family members TRIB2 and
TRIB3, are considered master regulators of inflammation, metabolism and cancer, given their
ability to interact with proteins such as MAPK, AKT and COP1 (Dugast et al., 2013, Johnston
et al., 2015, Eyers et al., 2017).
It is well appreciated that TRIB1 can have a context-dependent function, acting as either
activator or inhibitor of inflammation in different tissues (Ostertag et al., 2010, Akira et al.,
2013). In addition, TRIB1 is characterised by an unstable transcript and it was ranked among
the top 50 most unstable genes, with a mRNA half-life shorter than 1 hour (Sharova et al.,
2009). It has been estimated that more than half of the protein-coding genes in the human
genome are post-transcriptionally repressed by miRNAs (Friedman et al., 2009).
In the present work, we aimed to investigate the post-transcriptional regulation of TRIB1
mRNA, focussing on miRNA-mediated gene regulation in human macrophages. We
investigated the expression of TRIB1 mRNA in human polarised macrophages and showed
that it significantly increases in response to LPS and INF- (M1 stimuli), as well as IL-4 (M2a
stimulus). Immunofluorescence staining of MDMs highlighted that Trib1 protein is mainly
located in the nucleus, where it ultimately acts as a transcription factor. Indeed, the
overexpression of the pseudo-kinase in MDMs resulted in increased M2 markers (MSR-1,
CD163 and IL-4) and decreased M1 markers (IL-6, IL-8). However, this was not consistent
with what Arndt and colleagues found in murine BMDMs, where Trib1 deficiency resulted in
the impairment of both M1 and M2 genes, including Il6 (Arndt et al., 2018). However, it is
well known that genetic manipulation in animals is often associated with gene compensatory
events and it is not equally comparable to in vitro settings (El-Brolosy et al., 2017).
To determine whether TRIB1 is post-transcriptionally regulated by miRNAs, we took
advantage of bioinformatics analysis and experimental approaches. For the first time, we
demonstrated that the 3’UTR of TRIB1 exerts a robust, negative effect on gene regulation and
it is enriched in miRNA-binding sites, some of them highly conserved among different species.
We identified a total of 1237 potential regulators of TRIB1 using 7 different miRNA-target
prediction tools, but we narrowed down the list, selecting high-confidence miRNAs and
miRNAs predicted by 3 tools. We showed that miR-101-3p, miR-132-3p and miR-214-5p
are expressed in human macrophages and they are able to negatively modulate TRIB1

113
transcript in both human and murine macrophages. However, we decided to focus on miR-101-
3p: as suggested by previous studies, miR-101-3p targets key genes regulating inflammatory
and metabolic outcomes in macrophages, such as DUSP1 and ABCA1 (Wei et al., 2015, Zhang
et al., 2015). In addition, our enrichment analysis suggested that the target genes of miR-101-
3p, specifically expressed by human macrophages, are involved in inflammatory signalling
pathways (i.e. MAPK pathway, chemokines pathway). By using a dual luciferase reporter assay
in HEK293T cell line, we fully validated the interaction between miR-101-3p and TRIB1. Site-
directed mutagenesis experiment confirmed that the binding site in position 1526-1532 on the
3’UTR of TRIB1 is functional. To substantiate further our findings, we employed a novel
approach: the use of a target-site blocker. Target site blockers (TSB) are antisense
oligonucleotides (18-20 nucleotides long), designed to bind selectively to the miRNA target
site within a mRNA, competing with the endogenous miRNA and without activating the RNA
interference mechanism (RISC complex). By using this approach, we could evaluate the impact
of miR-101-3p inhibition on TRIB1 without using an inhibitor. In fact, the use of inhibitors is
associated with changes in multiple genes, as a single miRNA can target hundreds of different
genes simultaneously. When we transfected the TSB in MDMs, we observed a small but
significant increase in TRIB1 at both mRNA and protein level. This suggests that miR-101-
3p/TRIB1 interaction is biologically relevant in macrophages. Finally, we observed that miR-
101-3p induced an M1-like phenotype in macrophages, partially due to TRIB1 downregulation.
Particularly, the pro-inflammatory IL-8 was downregulated in TRIB1 overexpressing cells and
upregulated in cells treated with miR-101-3p mimic. Notably, IL-8 significantly increased in
response to the TSB treatment, hinting that TRIB1 is an upstream negative regulator of IL-8
transcription. However, this should be investigated further.
In conclusion, our data suggest that TRIB1 undergoes miRNAs-mediated regulation. MiR-101-
3p is a direct regulator of TRIB1 expression in human macrophages. As it also controls the
expression of DUSP1 and ABCA1 genes, miR-101-3p offers an interesting, potential target to
antagonise inflammation and improve cholesterol metabolism. Future efforts are needed to
investigate this interaction in in vivo environments and in the context of human disease, in
which both TRIB1 and macrophages are dysregulated, including atherosclerosis.

114
Chapter 4. Integrated transcriptome analysis of small non-coding
RNAs and mRNAs in pro-inflammatory macrophages
Declaration
This part of my thesis is intended to be published along with additional data produced by
collaborators, thus not shown here (manuscript in preparation). All the experiments have been
performed by myself. The RNA-seq and downstream bioinformatics analyses have been
carried out entirely by Sumeet Deshmukh, under the supervision of Dr Ian Sudbery.
We declare no conflicts of interest.
Abstract
Macrophage polarisation is a crucial process through which macrophages respond to
environmental signals, adapting and integrating multiple clues from damaged and healthy
tissues. This process is highly dynamic and it is regulated by complex signalling networks,
including miRNA-mediated regulation of gene expression. However, studies that correlate
miRNAs and target gene expression in polarised macrophages are missing. Here, we
investigated the expression of miRNAs and their target genes in human polarised macrophages
by using an integrative approach and multiple RNA-seq experiments. We found that 73
miRNAs were differentially expressed between M0 and M1-polarised macrophages: 47 were
downregulated and 26 upregulated. By using TargetScan we predicted their target genes and
investigated their expression by using data from a second M0/M1 RNA-seq experiment.
Interestingly, we observed that 1573 upregulated genes in M1 macrophages are predicted to be
targets of 44 downregulated miRNAs; the M1 polarising stimuli led to the increased expression
of genes involved in immune responses and inflammation. Similarly, 1790 downregulated
genes are potential targets of 26 upregulated miRNAs. Significantly, enriched terms in a KEGG
analysis for downregulated genes included cell cycle and proliferation. We identified 9
differentially expressed miRNAs (miR-7-5p, miR-125a-3p, miR-3614-5p, miR-4773, miR-
186-5p, miR-4709-3p, miR-1343-3p, miR-766-3p, miR-335-3p) which were predicted to target
more than 500 different genes and named them “super regulators”. We evaluated the direct
impact of some of these on M0 macrophage transcriptome, by employing the transient
transfection of miRNA mimics followed by RNA-seq and observed altered gene expression
that recapitulate those seen in M1-like phenotype. Our results demonstrate the existence of a

115
macrophage-specific targetome that underpin many of the critical biological pathways
involved in inflammation.
4.1. Introduction
Macrophages are the most plastic cell type of the haematopoietic system, playing a crucial role
in maintaining all tissues in a physiological state and influencing disease development and
progression. This is due to their ability to sense microenvironmental signals, adopting different
phenotypes in a process named “polarisation” (Mills et al., 2012). Macrophage polarisation has
been extensively studied in both in vitro and in vivo models: it is not a fixed event and can be
triggered by a multitude of biological and mechanical events, such as infection, tissue injury
and carcinogenesis (Murray et al., 2017). Polarisation is often simplified into two main
phenotypes: pro-inflammatory M1 macrophages and anti-inflammatory M2 macrophages.
However, this definition finds significant limitations in in vivo contexts, where classifying
macrophages remains a big challenge, due to their high plasticity and the existence of mixed
phenotypes (Martinez et al., 2014).
One of the major mechanisms controlling macrophage polarisation is transcriptional regulation
of gene expression. Macrophage polarisation results in distinct genetic signatures that
recapitulate their phenotype and function (Martinez et al., 2006). It has been shown that the
main gene networks involved in M1/M2 polarisation are those related to membrane receptor
signalling pathways, cytokine and chemokine release, lipid metabolism and apoptosis
(Martinez et al., 2006). Key transcription factors involved in macrophage activation are STATs
(Signal Transducers and Activators of Transcription), PPARs (Peroxisome Proliferator
Activated Receptors), IRFs (Interferon Regulatory Factors), NFκB (Nuclear Factor κB), GRs
(glucocorticoid receptors), HIFs (Hypoxia-Inducible Factors) and KLFs (Krüppel-Like
Factors) (Tugal et al., 2013). Transcriptional changes behind macrophage polarisation are also
affected by the activity of endogenous miRNAs (Essandoh et al., 2016, Curtale et al., 2019).
miRNAs are a class of small non-coding RNAs that negatively regulate gene expression via
binding to complementary sequences located on the 3’UTR of target mRNAs (Bartel et al.,
2004). To date, numerous studies highlight the potential of miRNAs in regulating macrophage
activation by direct interaction with multiple genes: this has been particularly studied in the
context of cancer and metabolic diseases (Fernández-Hernando et al., 2013, Deiuliis et al.,
2016, Essandoh et al., 2016). However, the extent of the association between miRNAs and

116
their target genes during macrophage polarisation has not been investigated in a systematic
manner.
In the present work, we aimed to address the differential expression between miRNAs and their
putative target genes in human macrophages challenged with LPS and INF- (M1-like cells),
by using an integrative approach. We identified 73 differentially expressed miRNAs during
M1-polarisation which could lead to the dysregulation of 3363 genes. We identified 9 distinct
miRNAs, each predicted to target more than 500 genes in macrophages, and named them
“super regulators”. Gene Ontology and KEGG pathway enrichment analysis indicate that these
miRNAs are key regulators of innate immune responses and cell division, thus contributing to
the transcriptional changes underlying the M1-like phenotype. Further research is needed to
experimentally validate miRNA-target gene networks and determine functional outcomes by
dedicated in vitro assays.
4.2. Hypothesis and aims
We hypothesised that the transcriptional changes induced in M1 polarised macrophages are
due to the activity of miRNAs. Therefore, we aimed to:
identify differentially expressed miRNAs between M0 and M1 macrophages;
investigate their association with differentially expressed genes;
address the extent of this association;
determine the functional category of miRNA targetome.
117
4.3. Results
4.3.1. Small RNA sequencing data quality and analysis strategy
To investigate the expression of miRNAs in human macrophages, we performed a small non-
coding RNA sequencing on unpolarised (Mun or M0) and polarised (M1LPS+INF- or M1)
monocyte-derived macrophages (MDMs), isolated from 8 healthy volunteers. The sequencing
was performed with an Illumina platform by the genome sequencing company Novogene.
Illumina technology uses a “sequencing by synthesis” approach and it is usually associated
with an error rate of 0.1% per nucleotide (Pfeiffer et al., 2018). Errors are due to either the
consumption of the sequencing reagents or the imperfect binding of the primers to the template
(Erlich and Mitra, 2008, Jiang et al. 2011). In our cases, the error rate was very low (>0.03%
per nucleotide) for all the samples (representative sample is shown in Figure 4.1.). The
recommended sequencing depth for small RNAs is > 10,000,000 raw reads; the depth of our
sequencing ranged from 18,959,214 to 24,618,695. Table 4.1. shows the data quality summary
provided by the company. The raw data were further processed by the company in order to
eliminate some contaminants and to obtain the final clean reads. The data filtering is
summarised in Table 4.2. Specifically, they eliminated reads of which more than 50% bases
show a base quality score ≤ 5, reads containing more than 10% of unsolved bases (“N”), reads
with 5’ primer contaminants, reads without 3’ primer and without the insert tag and reads with
poly A/T/G/C. However, the percentage of these contaminants was very low. After performing
the quality check, the company sent us fastq files. The fastq files were analysed as described
in Chapter 2 (Section 2.2.1.). For the mapping phase, we did not use the reference human
genome, but sequences downloaded from RNA Central, a comprehensive database containing
sequences of all type of non-coding RNAs (RNAcentral Consortium, 2017). We observed a
strong signal for a sequence of 23 nucleotides corresponding to hsa-miR-21
(UAGCUUAUCAGACUGAUGUUGAC), therefore we decided to exclude it from the
analysis to avoid biased results. This sequence was over represented in all the samples (30-
50%, shown in Chapter 8, Appendix III). When we performed the analysis considering miR-
21, gene differential expression was not statistically significant, but removing this sequence
improved the results. In fact, miR-21 is known to be one of the most abundant miRNAs in
macrophages with roles in both inflammatory and anti-inflammatory mechanisms (Sheedy
2015). The overview of the analysis described in this chapter is briefly illustrated in Figure
4.2. and each step is specified in the following result sections.

118
Figure 4.1. Sequencing error distribution rate
Sequencing error distribution rates of two representative samples. The horizontal axis shows
the reads position, the vertical axis shows the percentage of single base error rate. Graphs were
provided by Novogene company.

119
Table 4.1. Data quality summary
The table summarises our sequencing data quality and it was provided by the company.
Sample: sample ID; raw reads: four rows as a unit to calculate the sequence number of each
raw data file. Clean reads: calculated as raw reads, statistics object is clean data file. The
subsequent analyses are all based on clean reads: raw bases= (Number of sequences) *
(sequence length), use G for unit. Clean bases= (Number of sequences) * (sequence length),
use G for unit. Error rate: base error rate. Q20, Q30= (Base number of Phred value > 20(> 30))
/ (Total base number). GC content: (G&C base number) / (Total base number). Description
provided by Novogene.
SampleRaw Reads
Clean Reads
Raw Bases(G)
Clean Bases(G)
Error rate(%)
Q20(%) Q30GC content(%)
D199_M0 20665801 20665682 1.033 1.033 0.01 98.42 95.66 47.27
D199_M1 20536744 20536643 1.027 1.027 0.01 98.42 95.66 48.02
D204_M0 24266598 24266499 1.213 1.213 0.01 98.45 95.91 47.41
D204_M1 20581158 20581061 1.029 1.029 0.01 98.39 95.54 47.45
D179_M0 24417998 24417855 1.221 1.221 0.01 98.49 95.87 46.91
D179_M1 18959214 18959113 0.948 0.948 0.01 98.34 95.62 46.84
D194_M0 22670952 22670839 1.134 1.134 0.01 98.31 95.56 47.87
D194_M1 21464756 21464646 1.073 1.073 0.01 98.44 95.75 47.19
D206_M0 24618695 24618559 1.231 1.231 0.01 98.50 96.05 46.44
D206_M1 20304336 20304235 1.015 1.015 0.01 98.47 95.84 47.09
D221_M0 23995072 23994973 1.200 1.200 0.01 98.43 95.68 47.48
D221_M1 20639156 20639049 1.032 1.032 0.01 98.42 95.67 48.49
D223_M0 24130715 24130600 1.207 1.207 0.01 98.43 95.67 47.39
D223_M1 23468860 23468724 1.173 1.173 0.01 98.40 95.57 48.12
D225_M0 24096600 24096468 1.205 1.205 0.01 98.46 95.82 47.55
D225_M1 21805125 21805021 1.090 1.090 0.01 98.25 95.53 47.08

120
Table 4.2. Data filtering summary
The table contains a summary of data filtering and it was provided by the company. Sample:
Sample id; total_reads: total sequenced reads; N% > 10%: Percentage of reads with N > 10%;
low quality: percentage of low quality reads; 5_adapter_contamine: Percentage of reads with
5'adapter contamination; 3_adapter_null or insert_null: Percentage of reads with 3'adapter null
or insert null; with polyA/T/G/C: Percentage of reads with polyA/T/G/C; clean reads: total
clean reads and its percentage accounted for raw reads. Description provided by Novogene.
Sample total_reads N% > 10%low quality
5_adapter_contamine
3_adapter_null or insert_null
with ployA/T/G/C
clean reads
D199_M020665801 (100.00%)
119 (0.00%) 0 (0.00%) 9087 (0.04%) 1480403 (7.16%) 9674 (0.05%)19166518 (92.75%)
D199_M120536744 (100.00%)
101 (0.00%) 0 (0.00%) 17525 (0.09%) 1481878 (7.22%) 7510 (0.04%)19029730 (92.66%)
D204_M024266598 (100.00%)
99 (0.00%) 0 (0.00%) 24416 (0.10%) 2309753 (9.52%) 12032 (0.05%)21920298 (90.33%)
D204_M120581158 (100.00%)
97 (0.00%) 0 (0.00%) 17175 (0.08%) 1800058 (8.75%) 13117 (0.06%)18750711 (91.11%)
D179_M024417998 (100.00%)
143 (0.00%) 0 (0.00%) 6906 (0.03%) 1502087 (6.15%) 21407 (0.09%)22887455 (93.73%)
D179_M118959214 (100.00%)
101 (0.00%) 0 (0.00%) 4711 (0.02%) 1276694 (6.73%) 9713 (0.05%)17667995 (93.19%)
D194_M022670952 (100.00%)
113 (0.00%) 0 (0.00%) 26875 (0.12%)2343525 (10.34%)
18474 (0.08%)20281965 (89.46%)
D194_M121464756 (100.00%)
110 (0.00%) 0 (0.00%) 7938 (0.04%) 1534902 (7.15%) 29600 (0.14%)19892206 (92.67%)
D206_M024618695 (100.00%)
136 (0.00%) 0 (0.00%) 5514 (0.02%) 1643806 (6.68%) 20897 (0.08%)22948342 (93.22%)
D206_M120304336 (100.00%)
101 (0.00%) 0 (0.00%) 8740 (0.04%) 1420593 (7.00%) 15007 (0.07%)18859895 (92.89%)
D221_M023995072 (100.00%)
99 (0.00%) 0 (0.00%) 24143 (0.10%)2498826 (10.41%)
12302 (0.05%)21459702 (89.43%)
D221_M120639156 (100.00%)
107 (0.00%) 0 (0.00%) 19980 (0.10%) 1909131 (9.25%) 17067 (0.08%)18692871 (90.57%)
D223_M024130715 (100.00%)
115 (0.00%) 0 (0.00%) 13828 (0.06%) 1769383 (7.33%) 18777 (0.08%)22328612 (92.53%)
D223_M123468860 (100.00%)
136 (0.00%) 0 (0.00%) 24602 (0.10%) 1704725 (7.26%) 17773 (0.08%)21721624 (92.56%)
D225_M024096600 (100.00%)
132 (0.00%) 0 (0.00%) 18034 (0.07%) 2033805 (8.44%) 18899 (0.08%)22025730 (91.41%)
D225_M121805125 (100.00%)
104 (0.00%) 0 (0.00%) 9106 (0.04%) 1827568 (8.38%) 12903 (0.06%)19955444 (91.52%)
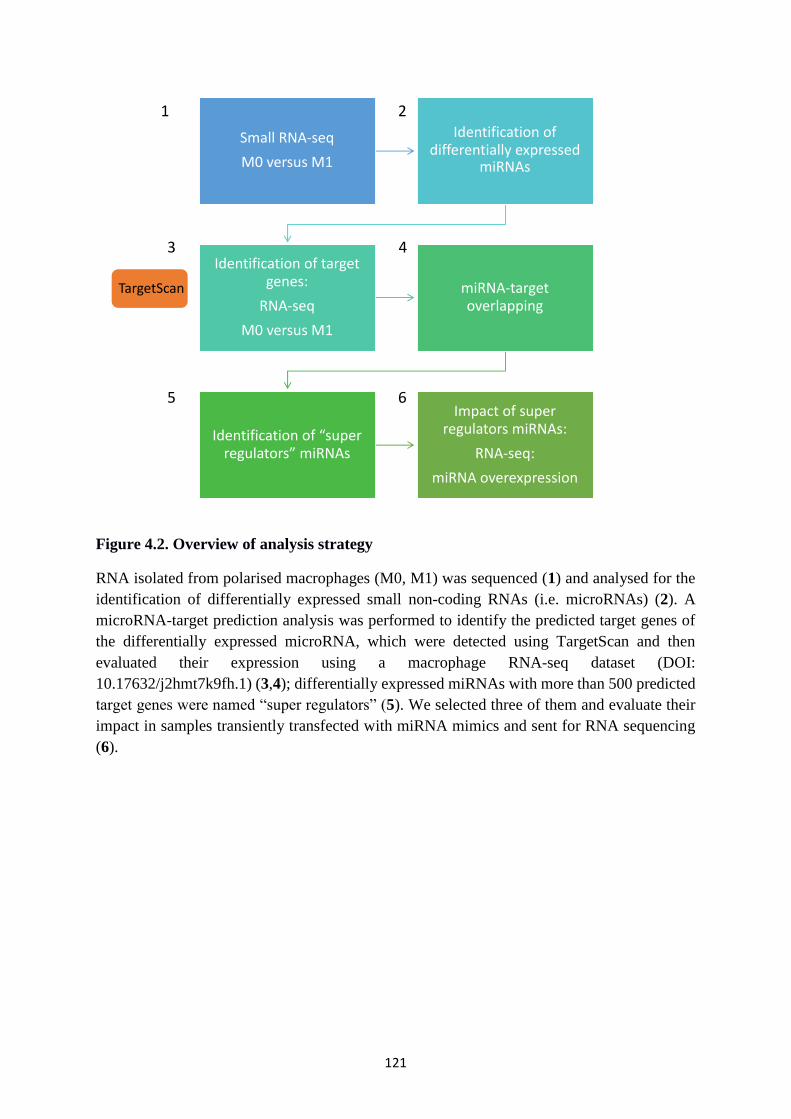
121
Figure 4.2. Overview of analysis strategy
RNA isolated from polarised macrophages (M0, M1) was sequenced (1) and analysed for the
identification of differentially expressed small non-coding RNAs (i.e. microRNAs) (2). A
microRNA-target prediction analysis was performed to identify the predicted target genes of
the differentially expressed microRNA, which were detected using TargetScan and then
evaluated their expression using a macrophage RNA-seq dataset (DOI:
10.17632/j2hmt7k9fh.1) (3,4); differentially expressed miRNAs with more than 500 predicted
target genes were named “super regulators” (5). We selected three of them and evaluate their
impact in samples transiently transfected with miRNA mimics and sent for RNA sequencing
(6).
Small RNA-seq
M0 versus M1
Identification of differentially expressed
miRNAs
Identification of target genes:
RNA-seq
M0 versus M1
miRNA-target overlapping
Identification of “super regulators” miRNAs
Impact of super regulators miRNAs:
RNA-seq:
miRNA overexpression
1 2
5
43
6
TargetScan

122
4.3.2. Differential expression of miRNAs in response to LPS and INF- in
human primary macrophages
The majority of small RNAs sequenced consisted of miRNAs (80%), but also other types,
including piwi-interacting RNAs (piR), ribosomal RNAs, transfer RNAs (tRNA) and Y RNAs
were found in our sequencing (20%) (Figure 4.3.). The Principal Component Analysis
(PCA), displayed as two-dimensional plot in Figure 4.4., shows the distance between the two
groups of samples. We observed that the majority of samples cluster according to the treatment
(M0 and M1). The heatmap (Figure 4.5. A) highlights the differential expression of small
RNAs across the samples. The volcano plot (Figure 4.5. B), showing the statistical significance
(y axis) versus the magnitude of the fold change (x axis), highlights upregulated and
downregulated small RNAs (green), as well as small RNAs passing the threshold of our
analysis (orange and red) (adjusted p value 0.05, fold change 1). A total of 272 small non-
coding RNAs were differentially expressed between the two groups; among them, 73 were
miRNAs: 47 were downregulated and 26 were upregulated in M1 macrophages, compared to
unpolarised cells. A previous study performed on murine BMDMs by using a miRNA-
microarray, detected a total of 120 miRNAs differentially expressed between M0 and M1
polarised cells, but with only 1 miRNA downregulated (Zhang et al. 2013). In our analysis, the
majority of differentially expressed miRNAs were downregulated in M1 cells. Cobos Jimenez
and colleagues also identified a total of 303 differentially expressed miRNAs across human
monocytes and polarised macrophages by using SOLID sequencing and RT-qPCR (Cobos
Jimenez et al. 2013). Among the differentially expressed miRNAs we observed miR-155-5p
(up), miR-125a-3p (up), miR-149-5p (down) and miR-191-3p (down). These miRNAs have all
been reported to control macrophage M1/M2 polarisation and response to infection (Curtale et
al., 2019). Differentially expressed miRNAs are listed in Table 4.3. and Table 4.4., while the
complete list of differentially expressed small RNAs is provided in Chapter 8 (Appendix III),
along with expression and p-values. However, small RNAs other than miRNAs were not
further investigated in this thesis.

123
Figure 4.3. Percentage of RNA types sequenced
Bar chart graph showing the % of RNA classes sequenced in our small non-coding sequencing
(figure made in R). miR= microRNA; piR= piwi-interacting RNA; tRNA=transfer RNA;
letters refer to different individuals; M1 and M0 refer to polarised (LPS+INF-) and
unpolarised (untreated) macrophages.
Figure 4.4. PCA plot of small RNA-seq
PCA plot of small non-coding RNA-seq data showing the clustering of the samples according
their gene expression. Dots represent different samples; larger dots represent the class-centroid.
Figure was made in R from CPM values.

124
Figure 4.5. Differential expression of small RNAs in pro-inflammatory M1 macrophages
Heatmap of small non-coding RNA sequencing showing the differential expression of small
RNAs across the two groups of samples (heatmap generated in R) (A); volcano plot showing
small RNAs passing cut off of adjusted p value 0.05 (red), small RNAs passing threshold of
log fold change 0 (orange); significant small RNAs with cut off of adjusted p-value 0.05 and
log fold change 1 (green); not statistically significant small RNAs (black) (B).
A B

125
Table 4.3. List of upregulated miRNAs
The table lists the miRNAs significantly upregulated in M1 macrophages, compared to M0
cells; baseMean is the average of the normalised count values; log2FoldChange represents the
effect size estimate: how much the expression of a gene changed due to the treatment (M0 vs
M1); lfcSE is the standard error estimate for the log2FoldChange; stat represents the wald
statistics; pvalue is attained by the wald test; padj is the pvalue corrected for multiple testing
using the Benjamini and Hochberg method.
rnacentral_id description baseMean log2FoldChange lfcSE stat pvalue padj
URS0000D54CAD hsa-miR-155-5p 211862.08 2.83 0.23 12.05 1.89E-33 3.67E-31
URS00004208C5 hsa-miR-9-5p 1644.39 1.60 0.18 8.89 5.88E-19 3.36E-17
URS00003D4175 hsa-miR-3614-5p 66.96 3.59 0.44 8.17 3.01E-16 1.17E-14
URS000040DCFF hsa-miR-186-5p 1826.38 1.36 0.17 8.09 6.10E-16 2.15E-14
URS0000410073 hsa-miR-4773 11.84 6.73 0.86 7.82 5.47E-15 1.63E-13
URS0000424278 hsa-miR-147b 300.29 2.37 0.32 7.37 1.69E-13 3.87E-12
URS0000591950 hsa-miR-7-5p 298.69 1.44 0.21 6.80 1.07E-11 1.98E-10
URS00001F0C23 hsa-miR-125a-3p 55.30 2.32 0.35 6.70 2.05E-11 3.61E-10
URS00002DABEA hsa-miR-125b-1-3p 13.47 4.97 0.74 6.67 2.56E-11 4.33E-10
URS00002198F3 hsa-miR-449c-5p 16.15 2.95 0.45 6.58 4.59E-11 7.13E-10
URS0000593537 hsa-miR-221-5p 178.13 1.70 0.26 6.48 9.34E-11 1.39E-09
URS000061B694 hsa-miR-146b-5p 12821.77 1.13 0.19 5.86 4.72E-09 6.54E-08
URS00003496BE hsa-miR-9-3p 71.05 1.44 0.25 5.82 5.88E-09 7.86E-08
URS000075BEBE hsa-miR-324-5p 35.93 2.09 0.37 5.64 1.75E-08 2.19E-07
URS00001F5B39 hsa-miR-449a 15.61 2.16 0.42 5.18 2.17E-07 2.10E-06
URS00000FC8EB hsa-miR-1301-3p 1694.09 1.06 0.22 4.84 1.32E-06 1.13E-05
URS00004B1671 hsa-miR-1307-3p 1602.06 1.48 0.31 4.83 1.34E-06 1.13E-05
URS000001C659 hsa-miR-135b-5p 7.14 4.50 0.93 4.83 1.40E-06 1.16E-05
URS00001C308D hsa-miR-99b-3p 1258.45 1.28 0.29 4.34 1.44E-05 1.01E-04
URS00001123BD hsa-miR-29b-1-5p 24.72 1.41 0.33 4.24 2.20E-05 1.50E-04
URS000031B6ED hsa-miR-365a-5p 8.28 1.87 0.45 4.13 3.58E-05 2.28E-04
URS000043D1A9 hsa-miR-30a-5p 93.87 1.03 0.27 3.84 1.23E-04 6.63E-04
URS000034309A hsa-miR-155-3p 8.34 3.31 0.87 3.79 1.54E-04 8.05E-04
URS00000AA464 hsa-miR-193b-3p 22.03 1.39 0.40 3.50 4.59E-04 2.09E-03
URS0000381B86 hsa-miR-3200-3p 5.17 1.82 0.60 3.05 2.32E-03 8.80E-03
URS0000244A71 hsa-miR-181c-3p 5.05 1.47 0.55 2.67 7.57E-03 2.41E-02
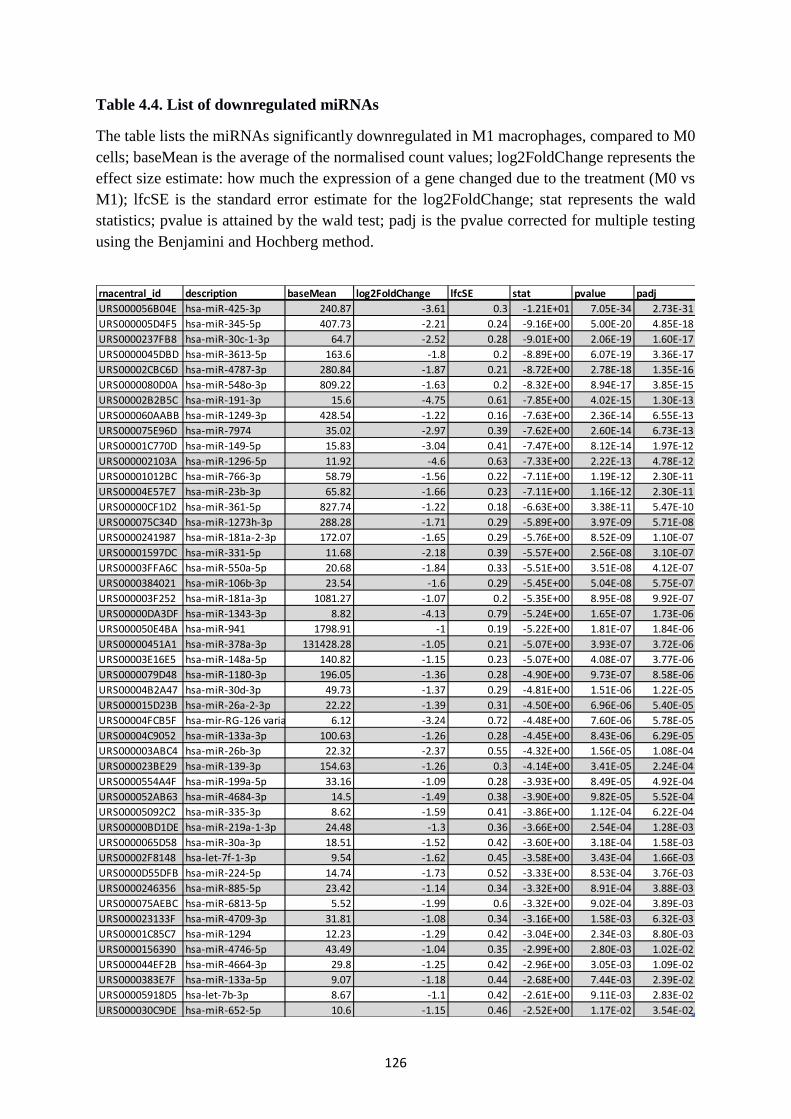
126
Table 4.4. List of downregulated miRNAs
The table lists the miRNAs significantly downregulated in M1 macrophages, compared to M0
cells; baseMean is the average of the normalised count values; log2FoldChange represents the
effect size estimate: how much the expression of a gene changed due to the treatment (M0 vs
M1); lfcSE is the standard error estimate for the log2FoldChange; stat represents the wald
statistics; pvalue is attained by the wald test; padj is the pvalue corrected for multiple testing
using the Benjamini and Hochberg method.
rnacentral_id description baseMean log2FoldChange lfcSE stat pvalue padj
URS000056B04E hsa-miR-425-3p 240.87 -3.61 0.3 -1.21E+01 7.05E-34 2.73E-31
URS000005D4F5 hsa-miR-345-5p 407.73 -2.21 0.24 -9.16E+00 5.00E-20 4.85E-18
URS0000237FB8 hsa-miR-30c-1-3p 64.7 -2.52 0.28 -9.01E+00 2.06E-19 1.60E-17
URS0000045DBD hsa-miR-3613-5p 163.6 -1.8 0.2 -8.89E+00 6.07E-19 3.36E-17
URS00002CBC6D hsa-miR-4787-3p 280.84 -1.87 0.21 -8.72E+00 2.78E-18 1.35E-16
URS0000080D0A hsa-miR-548o-3p 809.22 -1.63 0.2 -8.32E+00 8.94E-17 3.85E-15
URS00002B2B5C hsa-miR-191-3p 15.6 -4.75 0.61 -7.85E+00 4.02E-15 1.30E-13
URS000060AABB hsa-miR-1249-3p 428.54 -1.22 0.16 -7.63E+00 2.36E-14 6.55E-13
URS000075E96D hsa-miR-7974 35.02 -2.97 0.39 -7.62E+00 2.60E-14 6.73E-13
URS00001C770D hsa-miR-149-5p 15.83 -3.04 0.41 -7.47E+00 8.12E-14 1.97E-12
URS000002103A hsa-miR-1296-5p 11.92 -4.6 0.63 -7.33E+00 2.22E-13 4.78E-12
URS00001012BC hsa-miR-766-3p 58.79 -1.56 0.22 -7.11E+00 1.19E-12 2.30E-11
URS00004E57E7 hsa-miR-23b-3p 65.82 -1.66 0.23 -7.11E+00 1.16E-12 2.30E-11
URS00000CF1D2 hsa-miR-361-5p 827.74 -1.22 0.18 -6.63E+00 3.38E-11 5.47E-10
URS000075C34D hsa-miR-1273h-3p 288.28 -1.71 0.29 -5.89E+00 3.97E-09 5.71E-08
URS0000241987 hsa-miR-181a-2-3p 172.07 -1.65 0.29 -5.76E+00 8.52E-09 1.10E-07
URS00001597DC hsa-miR-331-5p 11.68 -2.18 0.39 -5.57E+00 2.56E-08 3.10E-07
URS00003FFA6C hsa-miR-550a-5p 20.68 -1.84 0.33 -5.51E+00 3.51E-08 4.12E-07
URS0000384021 hsa-miR-106b-3p 23.54 -1.6 0.29 -5.45E+00 5.04E-08 5.75E-07
URS000003F252 hsa-miR-181a-3p 1081.27 -1.07 0.2 -5.35E+00 8.95E-08 9.92E-07
URS00000DA3DF hsa-miR-1343-3p 8.82 -4.13 0.79 -5.24E+00 1.65E-07 1.73E-06
URS000050E4BA hsa-miR-941 1798.91 -1 0.19 -5.22E+00 1.81E-07 1.84E-06
URS00000451A1 hsa-miR-378a-3p 131428.28 -1.05 0.21 -5.07E+00 3.93E-07 3.72E-06
URS00003E16E5 hsa-miR-148a-5p 140.82 -1.15 0.23 -5.07E+00 4.08E-07 3.77E-06
URS0000079D48 hsa-miR-1180-3p 196.05 -1.36 0.28 -4.90E+00 9.73E-07 8.58E-06
URS00004B2A47 hsa-miR-30d-3p 49.73 -1.37 0.29 -4.81E+00 1.51E-06 1.22E-05
URS000015D23B hsa-miR-26a-2-3p 22.22 -1.39 0.31 -4.50E+00 6.96E-06 5.40E-05
URS00004FCB5F hsa-mir-RG-126 variant 1 6.12 -3.24 0.72 -4.48E+00 7.60E-06 5.78E-05
URS00004C9052 hsa-miR-133a-3p 100.63 -1.26 0.28 -4.45E+00 8.43E-06 6.29E-05
URS000003ABC4 hsa-miR-26b-3p 22.32 -2.37 0.55 -4.32E+00 1.56E-05 1.08E-04
URS000023BE29 hsa-miR-139-3p 154.63 -1.26 0.3 -4.14E+00 3.41E-05 2.24E-04
URS0000554A4F hsa-miR-199a-5p 33.16 -1.09 0.28 -3.93E+00 8.49E-05 4.92E-04
URS000052AB63 hsa-miR-4684-3p 14.5 -1.49 0.38 -3.90E+00 9.82E-05 5.52E-04
URS00005092C2 hsa-miR-335-3p 8.62 -1.59 0.41 -3.86E+00 1.12E-04 6.22E-04
URS00000BD1DE hsa-miR-219a-1-3p 24.48 -1.3 0.36 -3.66E+00 2.54E-04 1.28E-03
URS0000065D58 hsa-miR-30a-3p 18.51 -1.52 0.42 -3.60E+00 3.18E-04 1.58E-03
URS00002F8148 hsa-let-7f-1-3p 9.54 -1.62 0.45 -3.58E+00 3.43E-04 1.66E-03
URS0000D55DFB hsa-miR-224-5p 14.74 -1.73 0.52 -3.33E+00 8.53E-04 3.76E-03
URS0000246356 hsa-miR-885-5p 23.42 -1.14 0.34 -3.32E+00 8.91E-04 3.88E-03
URS000075AEBC hsa-miR-6813-5p 5.52 -1.99 0.6 -3.32E+00 9.02E-04 3.89E-03
URS000023133F hsa-miR-4709-3p 31.81 -1.08 0.34 -3.16E+00 1.58E-03 6.32E-03
URS00001C85C7 hsa-miR-1294 12.23 -1.29 0.42 -3.04E+00 2.34E-03 8.80E-03
URS0000156390 hsa-miR-4746-5p 43.49 -1.04 0.35 -2.99E+00 2.80E-03 1.02E-02
URS000044EF2B hsa-miR-4664-3p 29.8 -1.25 0.42 -2.96E+00 3.05E-03 1.09E-02
URS0000383E7F hsa-miR-133a-5p 9.07 -1.18 0.44 -2.68E+00 7.44E-03 2.39E-02
URS00005918D5 hsa-let-7b-3p 8.67 -1.1 0.42 -2.61E+00 9.11E-03 2.83E-02
URS000030C9DE hsa-miR-652-5p 10.6 -1.15 0.46 -2.52E+00 1.17E-02 3.54E-02
127
4.3.3. Identification of “super regulator” miRNAs: miRNA-target prediction
analysis and datasets overlapping
miRNAs regulate gene expression through physically targeting the mRNA of protein-coding
genes, therefore once we identified candidate miRNAs differentially expressed between M0
and M1 macrophages, we performed a target prediction analysis by using TargetScan
(http://www.targetscan.org/vert_72/). We downloaded the predicted target genes of both
upregulated and downregulated miRNAs and carried out a Gene Ontology and KEGG Pathway
Enrichment analysis by using GOSeq. However, among the putative target genes, we only
considered those differentially expressed in human polarised macrophages. To this aim, we
used an RNA-seq dataset previously generated in our lab (DOI: 10.17632/j2hmt7k9fh.1) and
performed an overlaying between DE miRNAs and DE target genes. We chose this dataset as
it was carried out following the same cell isolation and polarisation protocol (Mun and
M1LPS+INF-) and it was done using the same number of donors (n=8 per group). The method
used to analyse the RNA-seq dataset is described in detail Chapter 2 (Section 2.2.). The PCA
of the RNA-seq is shown in Figure 4.6. We observed two distinct groups of samples
suggesting that the M1-polarising stimuli caused a robust gene expression profile change,
consistent in all samples. The volcano plot shows that 5681 genes are significantly
differentially expressed: 2728 genes are upregulated, 2953 are downregulated (Figure 4.7.).
We found that 1573 upregulated genes are predicted targets of 44 downregulated miRNAs
(Table 4.5.). Similarly, 1790 downregulated genes are potential targets of 26 upregulated
miRNAs (Table 4.6.). Distinct miRNAs are also predicted to have common target genes. When
we counted the number of predicted target genes of each DE miRNA it ranged from 9 to 740
(Figure 4.8.): we selected those targeting more than 500 genes and named them “super
regulators” (Table 4.7.). Next, we assessed the expression of selected super regulators by using
RT-qPCR. For the upregulated miRNAs, we also chose to include miR-155-5p which has less
than 500 target genes but it is a well characterized miRNA in pro-inflammatory macrophages
(Jablonski et al., 2016, Curtale et al., 2019). Therefore, we used it as a “positive control” in
the further analysis. Similarly, for the downregulated miRNAs, we included miR-149-5p as it
is negatively modulated in response to inflammatory stimuli (Xu et al., 2014). We measured
the expression of the upregulated miRNAs in polarised MDMs from 9 different donors: miR-
155-5p and miR-125a-3p were significantly upregulated in M1 macrophages, compared to
unpolarised cells (p<0.0001, p=0.003, respectively) (Figure 4.9. A, B); miR-186-5p expression
was also increased but the change was not statistically significant (p=0.07) (Figure 4.9. C).
128
However, the expression of the downregulated miRNAs, measured in 5 donors, was highly
variable and in some samples was increased in M1, compared to M0 and miR-149-5p was
expression was not detected in samples from 2 different donors (Figure 4.9. D-F). This could
be explained by the very low expression levels of these miRNAs: the Ct values generated in
the RT-qPCR were very high, compared to the housekeeping gene (average Ct values for the
housekeeping U6 was 20, average Ct values for miR-766-3p, miR-149-5p and miR-1343-3p
was > 33). KEGG pathway enrichment analysis (Figure 4.10. A) highlights that the target
genes of downregulated miRNAs are involved in cytokine and chemokine signalling pathways,
antigen presentation, T cell receptor signalling pathway, apoptosis and MAPK signalling
pathway, while the target genes of upregulated miRNAs seem to participate in cell cycle and
DNA replication mechanisms. Similarly, the gene ontology terms (Figure 4.10. B), divided
into biological process, cellular component and molecular function, show that the target genes
of downregulated miRNAs are involved in innate immune and cytokine-mediated cellular
responses: they localise in the plasma membrane or cell surface, regulating
chemokine/cytokine receptor and ligand activity. Conversely, when we looked at genes
potentially targeted by upregulated miRNAs, we observed that they act as regulators of mitosis
and cell cycle and localise intracellularly. In fact, M1-like macrophages and macrophages
activated with LPS and INF- are highly cytotoxic and less viable, compared to M2 cells
(Martinez et al., 2008). We also performed a gene enrichment component analysis on the
potential targets of super regulator miRNAs: the most significant enriched terms for the genes
targeted by upregulated miRNAs were chromosome assembly and condensation (Figure 4.11.
A), while for the genes targeted by downregulated miRNAs, which are overexpressed in M1
macrophages, significant enriched terms were responses to the cytokine INF- (Figure 4.11.
B). This suggests that super regulators also have common target genes and it is particularly
evident for the targets of downregulated miRNAs. In fact, we can observe that INF- signalling
pathway is not only the most significant (-log10 FDR > 4), but it is also common between 3
super regulators. To substantiate this, we calculated the overlap between super regulator target
genes, by using Jaccard Index analysis. The Jaccard index of two or more gene lists counts the
number of genes in the intersection divided by the number of genes in the union of the gene
lists and it is a number between 0 and 1: the higher the index, the higher the overlap (Bass et
al., 2013). We found that there is an overlap of 19% to 33% between upregulated miRNAs
target genes (Figure 4.12. A) and of 29% to 39% between downregulated target genes (Figure
4.12. B). The highest % was for miR-1343-3p and miR-766-3p pair (39% genes overlapping).

129
Interestingly, miR-1343-3p was also one of the most downregulated by M1-polarising stimuli,
as it shows a log2 fold change of -4.13 (see Table 4.4.), suggesting it might have a big impact
on gene expression. So far, this miRNA has not been investigated in the literature.

130
Figure 4.6. PCA plot of RNA-seq data
PCA plot of RNA-seq data showing the clustering of the samples according their gene
expression. Dots represent different samples; larger dots are the class-centroids. Plots were
made in R from CPM values.
Figure 4.7. Volcano plot of RNA-seq data
Volcano plot of RNA-seq data showing genes passing cut off of adjusted p value 0.05 (red),
genes passing threshold of Log fold change 1 (orange); significant genes with cut off of
adjusted p-value 0.05 and log fold change 1 (green). Plot made in R.
2953 genes downregulated
2728 genes upregulated

131
Table 4.5. Number of target genes of upregulated miRNAs
small RNA seq RNA seq
miRNA M1 expression Target genes M1 expression
hsa-miR-193b-3p Upregulated 26 Downregulated
hsa-miR-135b-5p Upregulated 42 Downregulated
hsa-miR-449a Upregulated 55 Downregulated
hsa-miR-146b-5p Upregulated 56 Downregulated
hsa-miR-99b-3p Upregulated 58 Downregulated
hsa-miR-125b-1-3p Upregulated 59 Downregulated
hsa-miR-147b Upregulated 95 Downregulated
hsa-miR-181c-3p Upregulated 175 Downregulated
hsa-miR-30a-5p Upregulated 185 Downregulated
hsa-miR-449c-5p Upregulated 193 Downregulated
hsa-miR-1307-3p Upregulated 212 Downregulated
hsa-miR-3200-3p Upregulated 258 Downregulated
hsa-miR-324-5p Upregulated 324 Downregulated
hsa-miR-155-3p Upregulated 333 Downregulated
hsa-miR-155-5p Upregulated 362 Downregulated
hsa-miR-365a-5p Upregulated 401 Downregulated
hsa-miR-221-5p Upregulated 430 Downregulated
hsa-miR-9-3p Upregulated 471 Downregulated
hsa-miR-1301-3p Upregulated 480 Downregulated
hsa-miR-9-5p Upregulated 481 Downregulated
hsa-miR-29b-1-5p Upregulated 490 Downregulated
hsa-miR-7-5p Upregulated 533 Downregulated
hsa-miR-125a-3p Upregulated 555 Downregulated
hsa-miR-3614-5p Upregulated 566 Downregulated
hsa-miR-4773 Upregulated 617 Downregulated
hsa-miR-186-5p Upregulated 739 Downregulated

132
Table 4.6. Number of target genes of downregulated miRNAs
small RNA seq RNA seqmiRNA M1 expression Target genes M1 expression
hsa-miR-550a-5p Downregulated 9 Upregulatedhsa-miR-23b-3p Downregulated 38 Upregulatedhsa-let-7b-3p Downregulated 39 Upregulated
hsa-miR-4787-3p Downregulated 48 Upregulated
hsa-miR-30d-3p Downregulated 53 Upregulated
hsa-miR-181a-3p Downregulated 54 Upregulatedhsa-miR-26a-2-3p Downregulated 59 Upregulatedhsa-miR-1180-3p Downregulated 62 Upregulated
hsa-miR-4664-3p Downregulated 65 Upregulated
hsa-miR-106b-3p Downregulated 66 Upregulatedhsa-miR-191-3p Downregulated 71 Upregulatedhsa-miR-1249-3p Downregulated 72 Upregulated
hsa-miR-425-3p Downregulated 92 Upregulatedhsa-miR-4746-5p Downregulated 92 Upregulatedhsa-miR-6813-5p Downregulated 100 Upregulated
hsa-miR-941 Downregulated 105 Upregulated
hsa-let-7f-1-3p Downregulated 143 Upregulated
hsa-miR-1296-5p Downregulated 208 Upregulatedhsa-miR-30c-1-3p Downregulated 210 Upregulated
hsa-miR-3613-5p Downregulated 243 Upregulated
hsa-miR-652-5p Downregulated 257 Upregulated
hsa-miR-331-5p Downregulated 266 Upregulatedhsa-miR-885-5p Downregulated 297 Upregulated
hsa-miR-4684-3p Downregulated 310 Upregulated
hsa-miR-219a-1-3p Downregulated 321 Upregulated
hsa-miR-139-3p Downregulated 327 Upregulatedhsa-miR-361-5p Downregulated 347 Upregulated
hsa-miR-133a-5p Downregulated 351 Upregulatedhsa-miR-378a-3p Downregulated 363 Upregulated
hsa-miR-1294 Downregulated 374 Upregulatedhsa-miR-199a-5p Downregulated 376 Upregulated
hsa-miR-148a-5p Downregulated 389 Upregulated
hsa-miR-345-5p Downregulated 402 Upregulated
hsa-miR-1273h-3p Downregulated 418 Upregulatedhsa-miR-224-5p Downregulated 444 Upregulated
hsa-miR-26b-3p Downregulated 447 Upregulated
hsa-miR-7974 Downregulated 460 Upregulated
hsa-miR-181a-2-3p Downregulated 468 Upregulatedhsa-miR-30a-3p Downregulated 494 Upregulatedhsa-miR-149-5p Downregulated 497 Upregulatedhsa-miR-4709-3p Downregulated 506 Upregulatedhsa-miR-1343-3p Downregulated 620 Upregulatedhsa-miR-766-3p Downregulated 653 Upregulatedhsa-miR-335-3p Downregulated 734 Upregulated

133
Figure 4.8. Number of differentially expressed miRNA-target genes
The graph shows the number of predicted target genes (y axis) of differentially expressed
miRNAs (x axis); downregulated miRNAs are shown in red, upregulated miRNAs are shown
in blue. miRNA-target prediction analysis was done by using TargetScan. The list of the target
genes was then filtered using only genes differentially expressed in the macrophage RNA-seq
(DOI: 10.17632/j2hmt7k9fh.1).
Table 4.7. List of “super regulator” miRNAs with more than 500 target genes in
macrophages
The table lists the number of target genes of differentially expressed miRNAs in human
macrophage (M1LPS+INF), predicted by the algorithm TargeScan. Genes were filtered selecting
only those differentially expressed by human macrophages, according to the dataset DOI:
10.17632/j2hmt7k9fh.1.
miRNAs ExpressionM0 vs M1
Number of target genes
hsa-miR-7-5p Upregulated 533
hsa-miR-125a-3p Upregulated 555
hsa-miR-3614-5p Upregulated 566
hsa-miR-4773 Upregulated 617
hsa-miR-186-5p Upregulated 739
has-miR-155-5p Upregulated 362
hsa-miR-4709-3p Downregulated 506
hsa-miR-1343-3p Downregulated 620
hsa-miR-766-3p Downregulated 653
hsa-miR-335-3p Downregulated 734

134
Figure 4.9. Assessment of “super regulator” miRNAs by RT-qPCR
Relative abundance of miR-155-5p (A), miR-125a-3p (B) and miR-186-5p (C) normalised to
the housekeeping U6 (upregulated miRNAs); relative abundance of miR-149-5p (D), miR-766-
3p (E) and miR-1343-3p (F) normalised to the housekeeping U6 (downregulated miRNAs).
Data were analysed using the log2 transformed 2-DCT values and presented as individual
points (n = 3-9, paired t-test, **** p< 0.0001, ** p<0.01, ns p0.05).
Mun M1 (LPS + INF-γ)
-20
-15
-10
miR
-155-5
p e
xpre
ssio
n r
ela
tive to U
6 (
log2)
****
miR-155-5p
A B C
FED
Mun M1 (LPS + INF-γ)
-20
-15
-10
miR
-125a-3
p e
xpre
ssio
n r
ela
tive to U
6 (
log2)
**
miR-125a-3p
Mun M1 (LPS + INF-γ)
-15
-14
-13
-12
-11
-10
miR
-186-5
p e
xpre
ssio
n r
ela
tive to U
6 (
log2)
miR-186-5p
p=0.07
Mun M1 (LPS + INF-γ)
-20
-19
-18
-17
-16
-15m
iR-1
343-3
p e
xpre
ssio
n r
ela
tive to U
6 (
log2)
miR-1343-3p
p=0.7
Mun M1 (LPS + INF-γ)
-18
-16
-14
-12
-10
miR
-766-3
p e
xpre
ssio
n r
ela
tive to U
6 (
log2)
miR-766-3p
p=0.6
Mun M1 (LPS + INF-γ)
-25
-20
-15
miR
-149-5
p e
xpre
ssio
n r
ela
tive to U
6 (
log2)
miR-149-5p
p=0.6

135
Figure 4.10. Gene Ontology and KEGG Pathway Enrichment analysis of DE miRNAs
target genes
KEGG Pathway enrichment analysis (A) and Gene Ontology terms (B) of macrophage-specific
genes, predicted to be regulated by differentially expressed miRNAs. First column shows the
condition in which miRNAs are downregulated and their target genes are upregulated; the
second column shows the opposite, downregulated genes and upregulated miRNAs. BP=
biological process, CC= cellular component, MF= molecular function. Analysis was performed
using GOSeq, heatmaps were generated in R.
miRNA↓
Genes↑
miRNA↓
Genes ↑
miRNA↑
Genes↓
miRNA↑
Genes↓
A B
BP
CC
MF

136
Figure 4.11. Gene Ontology terms of target genes of “super regulator” miRNAs
Gene Ontology terms of genes targeted by upregulated miRNAs (A) and downregulated
miRNAs (B). Analysis was done by using GOSeq. Heatmaps were generated in R.
Figure 4.12. Target genes overlapping: Jaccard Index
Target gene overlapping analysis using Jaccard Index: overlapping between upregulated (A)
and downregulated (B) miRNAs target genes. Diagrams were generated in R.
137
4.3.4. Impact of “super regulator” miRNAs on macrophage transcriptome
To substantiate the role of “super regulator” miRNAs in macrophages, we performed an RNA-
seq on MDMs, transfected with mimics of selected miRNAs. Our previous RNA-seq on
polarised macrophages showed that M1-polarising stimuli led to more gene downregulation,
compared to upregulation (2953 were downregulated, 2728 genes were upregulated). Although
the difference in the number of genes down- and up-regulated is small (only 225 genes), we
decided to focus on the activity of upregulated miRNAs, which in turn could contribute to the
downregulation of these genes and to the M1 phenotype. We transiently overexpressed miR-
155-5p, miR-125a-3p and miR-186-5p in MDMs by using miRNA mimics and analysed their
impact on gene expression. miRNA-155-5p is not a super regulator by our definition, but we
included it as a positive control, due to its well characterised biological function in macrophage
polarisation. We used MDMs isolated from 6 different individuals and transfected them for 24
hours with 50nM of miRNA mimics or negative control. Prior to the RNA-seq we confirmed
the overexpression of the 3 miRNAs by using RT-qPCR (Figure 4.13.). The sequencing was
carried out by the company Novogene using Illumina technology. We performed 3
simultaneous paired-analysis: each miRNA mimic versus the negative control. Unfortunately,
the PCA plots (Figure 4.14.) did not show defined clusters between conditions. This can be
explained by several reasons: miRNAs endogenous expression is highly variable among
different individuals and this can have a different impact on the overexpression experiment (as
shown by RT-qPCR data), primary cells isolated from different donors might also respond
differently to transient transfection. Results described in Chapter 3 are also affected by high
variability, as macrophages are extremely sensitive and being cells of the innate immune
system can be easily activated by in vitro procedures. Moreover, in this experiment, we used
cells isolated from 3 male individuals and 3 female individuals, aged 23 to 28 and with different
ethnicity. It is well appreciated that miRNAs expression can be different between males and
females, as some studies have reported (Dai et al., 2014, Cui et al., 2018). Interestingly, the
global PCA, plotted on the 3 overexpression experiments (miR-155-5p, miR-125a-3p, miR-
186-5p vs negative control) (showed in Figure 4.15.) suggests that there is a clustering
according to the gender of the donors. However, this was not further investigated in the present
analysis due to the low number of individuals.
When we performed the differential expression analysis (each miRNA versus the negative
control), we found only few significant differentially expressed genes (adjusted p value ≤ 0.05).
Specifically, we found 158, 4 and 1 DE genes, for miR-155-5p, miR-125a-3p and miR-186-5p

138
respectively (list of significant DE genes is provided in Chapter 8, Appendix III). This was not
surprising, as it is believed that the effect of miRNAs on gene expression is small and
overexpressing a single miRNA not always leads to the downregulation of target genes, which
is also seed region type- and context-dependent (Liu et al., 2019). Nevertheless, we carried on
with the downstream analysis, considering the directional changes of the genes, rather than the
p-values. The volcano plots on the DE analysis for each overexpressed miRNA are shown in
Figure 4.16. The dots in green represent genes with an FDR 0.05, including those with
adjusted p values ≤ 0.05. For miR-155-5p-overexpressing cells (Figure 4.16. A) there are more
dysregulated genes passing the FDR threshold, both up- and downregulated, in comparison to
miR-125a-3p and miR-186-5p overexpressing cells (Figure 4.16. B, C). When we compared
the DE genes in each miRNA overexpression condition with DE genes between M0 and M1,
we observed an interesting overlap (Figure 4.17.):
1. miR-155-5p: 362 target genes, previously identified as downregulated in M1
macrophages, 82 were upregulated and 280 were downregulated;
2. miR-125a-3p: among its 555 target genes, previously identified as downregulated in
M1 macrophages, 336 were upregulated and 219 were downregulated;
3. miR-186-5p: among its 739 target genes, previously identified as downregulated in M1
macrophages, 326 were upregulated and 413 were downregulated.
Despite it being well established that miRNAs work by repressing the expression of target
genes, the presence of upregulated transcripts is not surprising, even among their potential
target genes. Overexpressing a miRNA by cell transient transfection leads to a massive
perturbation of gene expression, by either direct or indirect activity (Khan et al., 2009).
However, when we looked at the gene ontology terms of downregulated genes we found results
consistent with the M1-like phenotype (Figure 4.18.): enrichment of genes involved in mitosis,
cell cycle, DNA replication and chromosome condensation/segregation. The enriched terms
for each miRNA overexpression experiment are specified below.
1. miR-155-5p: downregulation of genes related to DNA replication, mitosis and cell
cycle; upregulation of genes involved in B cells activation and proliferation as well as
chemokine signalling pathway;

139
2. miR-125a-3p: downregulation of genes involved in chromosome segregation and
condensation; upregulation of genes related to inositol phosphate metabolism;
3. miR-186-5p: downregulation of genes related to chromosome and DNA package;
upregulation of genes involved in mitosis and chromosome segregation.
The latter was not consistent with miR-155-5p and miR-125a-3p, as it shows similar
enrichment for both down- and up-regulated genes. In fact, miR-186-5p has been well
characterised in cancer, where it acts as either oncogene (inducing proliferation) or onco-
suppressor (inducing apoptosis), depending on the tissue (Wang et al., 2019). Overall, this data
suggests that the overexpression of these miRNAs affect DNA replication and mitosis.
Therefore, we evaluated the effect of miRNA mimics on cells viability, using an MTT assay.
This assay measures cells viability thought a substrate that is reduced only by live and
metabolically active cells. The assay did not show any significant difference (Figure 4.19.),
likely due to either individuals or transfection variability, as well as the low n number.
However, we can observe that samples transfected with the mimics tend to be less
metabolically active, compared to the negative control.
Lastly, we looked at the identity of the genes showing the same direction in fold change of
those differentially expressed in M1 macrophages. Table 4.8. lists the top 10 genes selected
according to adjusted p values, while Table 4.9. shows those filtered according to the fold
change. For the latter we prioritised downregulation. We observed that not all the genes show
the same expression status in M1 macrophages and only some of them are predicted targets of
the miRNAs. Among the downregulated genes in both miRNA overexpression and M1
macrophages we observed:
E2F2 (miR-155-5p target), a transcription factor regulating inflammation (Wang et al.,
2018);
DUSP1 (miR-125a-3p target), negative regulator of MAPK signalling pathway;
CCL1 (miR-214-5p target), ligand of the chemokine receptor CCR8, driving
inflammation (Kishi et al., 2016).

140
Taken together, our results suggest that these miRNAs, strongly induced by LPS and INF-,
contribute to the transcriptomic profile of human pro-inflammatory macrophages.
Figure 4.13. Confirmation of miRNAs overexpression in transfected MDMs by RT-qPCR
Relative abundance of miR-155-5p (A), miR-125a-3p (B) and miR-186-5p (C) normalised to
the housekeeping U6 in MDMs transiently transfected with miRNA mimics or negative
control. Total RNA transfected was 50nM per well, in a 6 well plate. Data were analysed using
the log2 transformed 2-DCT values and presented as individual points (n =4, paired t-test, ****
p<0.0001, *** p<0.001, ** p<0.01).
Control Mimic
-15
-10
-5
0
miR
-155-5
p e
xpre
ssio
n r
ela
tive to U
6
(log2)
****
Control Mimic
-15
-10
-5
0
5
miR
-125a-3
p e
xpre
ssio
n r
ela
tive to U
6
(log2)
**
Control Mimic
-10
-5
0
5
10
miR
-186-5
p e
xpre
ssio
n r
ela
tive to U
6
(log2)
***
A CB

141
Figure 4.14. Single PCA plots of RNA-seq data: super regulator miRNAs overexpression
PCA plots of paired RNA-seq analysis showing miR-155-5p/control (A), miR-125a-3p/control
(B) and miR-186-5p/control (C) overexpression experiments in MDMs isolated from 6
individuals. Dots represent different samples; larger dots are the class-centroids. Plots were
made in R.
A B
C

142
Figure 4.15. Global PCA plot of RNA-seq data: gender-dependent clustering?
Global PCA plot of super regulators overexpression RNA-seq analysis showing a potential
clustering of the samples, according to gender, highlighted by blue circles. Plot was generated
in R, using CPM values.
Figure 4.16. Volcano plots of RNA-seq data: super regulators overexpression
Volcano plot showing the log2fold change vs the log adjusted p value of macrophage genes in
response to miR-155-5p mimic (A), miR-125a-3p mimic (B) and miR-186-5p mimic (C). None
of the genes is significantly differentially expressed (fold change threshold 0; FDR cut off 0.05;
genes passing FDR cut off are shown in green).
miR-155-5p miR-125a-3p miR-186-5p
A CB

143
Figure 4.17. Number of target genes up- and downregulated in response to miRNA
overexpression
The bar graph shows the number of up- and downregulated genes in response to miR-155-5p,
miR-125a-3p and miR-186-5p overexpression. These genes were previously identified as
downregulated in response to M1 polarising stimuli (RNA-seq, DOI:10.17632/j2hmt7k9fh.1).
0
100
200
300
400
500N
um
ber
of Targ
et G
enes
miR-155-5p
362 target genes
miR-125a-3p
555 target genes
miR-186-5p
739 target genes
82
280
326
413
336
219
Upregulated
Downregulated
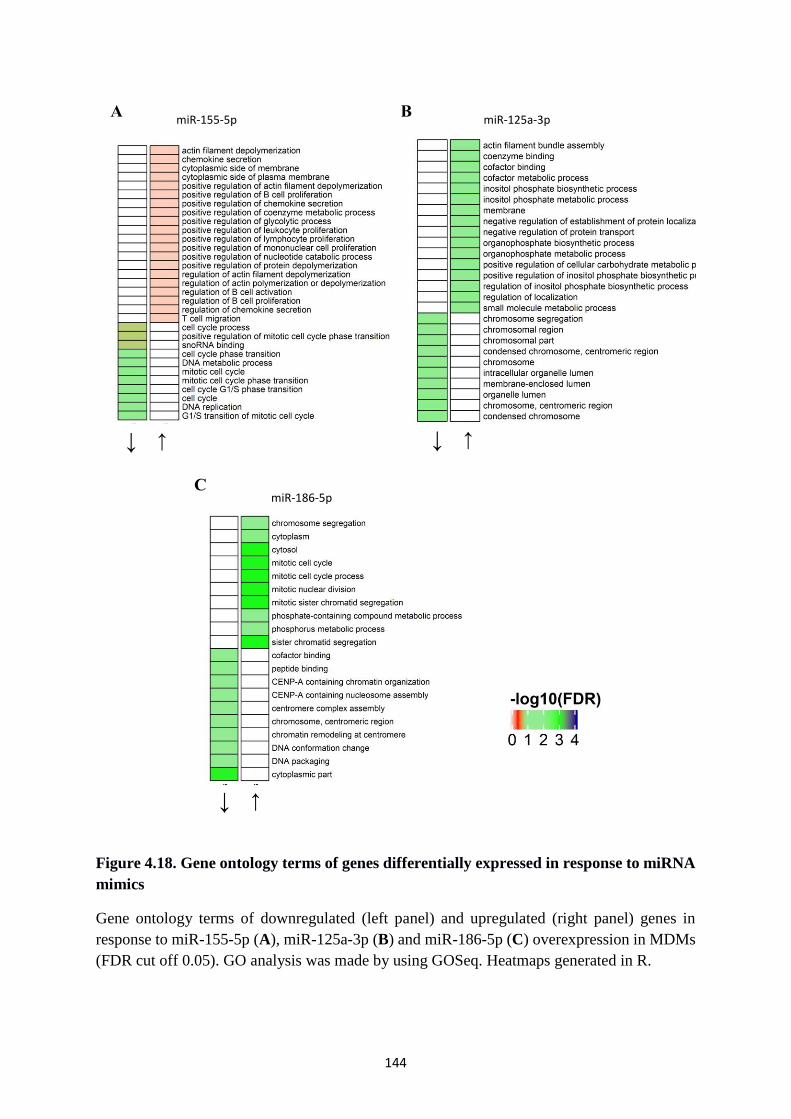
144
Figure 4.18. Gene ontology terms of genes differentially expressed in response to miRNA
mimics
Gene ontology terms of downregulated (left panel) and upregulated (right panel) genes in
response to miR-155-5p (A), miR-125a-3p (B) and miR-186-5p (C) overexpression in MDMs
(FDR cut off 0.05). GO analysis was made by using GOSeq. Heatmaps generated in R.
miR-155-5p miR-125a-3pA B
↓ ↑ ↓ ↑
miR-186-5pC
↓ ↑

145
Figure 4.19. MTT assay on MDMs transfected with miRNAs mimics
MTT assay on MDMs transfected with 50nM of miRNA mimics/control (24 hours
transfection). Cells viability is normalised to the control. Dots represent different donors (n=4,
RM One-way ANOVA with Dunnett’s post-test, ns p<0.05).
Con
trol
miR
-155
-5p
miR
-125
a-3p
miR
-186
-5p
0.6
0.7
0.8
0.9
1.0
1.1
Meta
bolic
ally
active c
ells
Lum
inescence (
AU
)
p=0.3 p=0.3 p=0.2

146
Table 4.8. Adjusted p-values-filtered differentially expressed genes
Table listing the DE genes in response to miRNAs overexpression filtered according to
adjusted p values; only those highlighted in red are statistically significant; last column shows
the expression status of the same genes in M1 macrophages, according to the RNA-seq
DOI:10.17632/j2hmt7k9fh.1. Target prediction analysis was done by using TargetScan.
Gene Control vs miR-155-5p miR-155-5p target gene M0 vs M1
SLC1A3 Upregulated No Downregulated
ARHGAP18 Downregulated No Downregulated
CSF1R Downregulated Yes Downregulated
MOCS2 Downregulated No Downregulated
MPEG1 Downregulated Yes Downregulated
MARCHF1 Upregulated No Downregulated
PICALM Upregulated Yes Downregulated
ANXA2 Downregulated No Downregulated
PTPN22 Downregulated No Downregulated
SPRED1 Downregulated Yes Downregulated
Gene Control vs miR-125a-3p miR-125a-3p target gene M0 vs M1
DTX4 Downregulated Yes Downregulated
DUSP1 Downregulated Yes Upregulated
INF2 Downregulated Yes Downregulated
EHD1 Downregulated Yes Upregulated
TP53INP2 Downregulated Yes Upregulated
TRAF1 Downregulated Yes Upregulated
BCAT2 Downregulated Yes Downregulated
NFKBIA Downregulated Yes Upregulated
BBS5 Downregulated Yes Downregulated
SLC43A2 Downregulated Yes Upregulated
Gene Control vs miR-186-5p miR-186-5p target gene M0 vs M1
CRTAP Downregulated No Downregulated
PDIA4 Downregulated No Downregulated
BLMH Downregulated Yes Downregulated
GINM1 Downregulated Yes Upregulated
OAZ2 Downregulated No Upregulated
DENND10 Downregulated No Upregulated
UBQLN2 Downregulated Yes Upregulated
ASIC1 Downregulated No Downregulated
PSAT1 Downregulated No Upregulated
PUDP Downregulated No Downregulated

147
Table 4.9. Log fold change values-filtered differentially expressed genes
Table listing the DE genes in response to miRNAs overexpression filtered according to log
fold change values; only those highlighted in red are statistically significant; last column shows
the expression status of the same genes in M1 macrophages, according to the RNA-seq
DOI:10.17632/j2hmt7k9fh.1. Target prediction analysis was done by using TargetScan.
Gene Control vs miR-155-5p miR-155-5p target gene M0 vs M1
LIN7A Downregulated No Downregulated
LGI2 Downregulated No Downregulated
S1PR3 Downregulated No Downregulated
CDC25A Downregulated No Downregulated
SYT1 Downregulated Yes Downregulated
RGS18 Downregulated No Downregulated
E2F2 Downregulated Yes Downregulated
FGD5 Downregulated No Downregulated
MPEG1 Downregulated Yes Downregulated
ANTXR1 Downregulated No Downregulated
Gene Control vs miR-125a-3p miR-125a-3p target gene M0 vs M1
SLCO5A1 Downregulated Yes Upregulated
CCL1 Downregulated Yes Upregulated
UBD Downregulated Yes Upregulated
CHST3 Downregulated Yes Upregulated
CCR7 Downregulated Yes Upregulated
ACOD1 Downregulated No Upregulated
PTGS2 Downregulated Yes Upregulated
TRAF1 Downregulated Yes Upregulated
DYRK1A Downregulated Yes Upregulated
GUCY1A1 Downregulated No Upregulated
Gene Control vs miR-186-5p miR-186-5p target gene M0 vs M1
SPIN3 Downregulated No Downregulated
EDNRB Downregulated No Downregulated
MRO Downregulated No Downregulated
FAM124B Downregulated Yes Downregulated
GPC5 Downregulated No Upregulated
C15orf41 Downregulated No Downregulated
AL139260.3 Downregulated No Upregulated
ASIC1 Downregulated No Downregulated
DLG2 Downregulated No Upregulated
LOXL4 Downregulated No Upregulated

148
4.4. Summary
Macrophages are involved in a multitude of physiological and pathological conditions. Hence,
understanding the mechanisms behind their activation can lead to the identification of novel
therapeutic targets. It has been reported that one of the major mechanisms regulating
macrophages polarisation towards different phenotypes is transcriptional regulation (Martinez
et al., 2006, Tugal et al., 2013). To date, a significant number of studies pointed out the
potential role of miRNAs (Jablonski et al., 2016, Li et al., 2018, Curtale et al., 2019). However,
the association of miRNA and their target genes in macrophages remains elusive, due to the
lack of integrated and systematic studies.
The work described in this chapter was designed to address the transcriptional changes induced
by inflammatory stimuli, with a focus on miRNAs targetome. We investigated the gene
expression profile of human macrophages challenged with LPS and INF-, taking advantage
of computational tools and 3 RNA-seq experiments. We performed a small non-coding RNA-
seq on polarised MDMs and identified 73 miRNAs differentially expressed in M1
macrophages, 44 were downregulated and 26 upregulated. Among them, we found miR-155-
5p which is on the most characterised in the context of pro-inflammatory macrophages and it
was previously shown to control multiple genes (Jablonski et al., 2016). By using TargetScan
we identified the potential target genes of differentially expressed miRNAs. We used
TargetScan as its prediction is strongly based on phylogenetic conservation of miRNA-binding
sites, which in turn can be predictive of biological relevance (Agarwal et al., 2015). We
determined the expression of potential target genes using a second RNA-seq experiment,
carried out on the same number of samples and experimental conditions. The differentially
expressed genes between M0 and M1 macrophages were 5681. We observed that 1573
upregulated genes are predicted targets of 44 downregulated miRNAs. Similarly, 1790
downregulated genes are potential targets of 26 upregulated miRNAs. This is suggesting that
more than 50% of the macrophage transcriptome could be controlled by miRNAs, during
polarisation. However, we did not validate any of the interactions, therefore we are not sure
whether all the predictions occur in our model. Gene ontology and KEGG pathway enrichment
analysis indicate that the target genes of downregulated miRNAs are related to innate immune
responses, while those targeted by upregulated miRNAs have a role in cell cycle regulation.
Our enrichment analysis was consistent with what Jiang and colleagues reported in murine
polarised macrophages (Jiang et al., 2017). In addition, we identified 9 “super regulators”
miRNAs (miR-7-5p, miR-125a-3p, miR-3614-5p, miR-4773, miR-186-5p, miR-4709-3p,

149
miR-1343-3p, miR-766-3p, miR-335-3p) predicted to target more than 500 genes. In fact, the
potential of miRNAs relies on their ability to simultaneously target multiple genes and the same
gene can be regulated by multiple miRNAs at the same time (Bartel et al., 2009). In light of
this, we determined the impact of two super regulators (miR-125a-3p and miR-186-5p) and
miR-155-5p as positive control on unpolarised macrophage transcriptome. To this aim we
employed the RNA-seq of samples transfected with miRNA mimics and a non-targeting
control. As expected we did not find many statistically significant differentially expressed
genes, due to either the variability among the individuals or the difference in transfection
efficiency. Moreover, it is recognised that despite miRNAs are master regulators of gene
expression, their individual effect on target genes is likely to be small (Liu et al., 2019). This
is particularly evident if we compare it with the effect induced by M1 polarising stimuli after
24 hours, which was strong and robust as shown by the PCA analysis. The mimics transfection
was also carried on for 24 hours, as it was found efficient, for example, in causing the
repression miR-101-3p target genes (TRIB1, DUSP1 and ABCA1), described in Chapter 3.
Nevertheless, among the two datasets (M0/M1 RNA-seq and miRNA/control RNA-seq) we
did find gene overlapping and the same directional changes in expression.
Overall our findings indicate the existence of a gene network controlled by multiple miRNAs,
which account for the regulation of the most relevant biological pathways activated or
repressed during M1 macrophage polarisation. Further work is needed to validate miRNA
target interactions and perform dedicated assay to evaluate the biological impact of super
regulators miRNAs.

150
Chapter 5. miRNAs targeting TRIB1 non-coding variants and
identification of two novel eQTLs
Declaration
The work and the experiments described in this chapter have been performed by myself. I
received great help and support from Dr Oscar Villacanas Perez, Dr Ignasi Gomez and Juan
Salamanca Viloria in the development of the bioinformatics pipeline and in the use of miRanda,
mySQL and Python. Help from Veronika Kiss-Toth in the preparation of the mutants was also
greatly appreciated. Sumeet Deshmukh contributed to this work by providing me with the
bioinformatics analysis of a publicly available transcriptomic dataset. Finally, a huge thanks to
Dr Stephen Hamby (University of Leicester) who provided me with the analysis of a
monocyte/macrophage RNA microarray dataset, used for the identification of eQTLs.
Abstract
Non-coding single nucleotide polymorphisms (SNPs) are the most common variation in the
human genome, affecting mRNA stability and disease susceptibility. SNPs in regulatory
regions of the genome, can alter gene expression in a tissue-specific manner, acting as
Expression Quantitative Trait Loci (eQTLs). The TRIB1 gene, a key regulator of cancer,
inflammation and lipid metabolism, is characterised by a highly unstable transcript, it is
enriched in non-coding variants and it is subject to post-transcriptional regulation with a
context-dependent function. However, the role of non-coding SNPs in the post-transcriptional
regulation of TRIB1 has not been investigated. We hypothesised that an association between
TRIB1 non-coding variants and miRNA-binding sites exists as a mechanism of gene
expression regulation. To investigate this, we took advantage of both computational and
experimental approaches. In this chapter, we showed that TRIB1 genetic variants affect
miRNA-target sites, by creating new binding sites. When tested in vitro, rs62521034 and
rs56395423 significantly impaired TRIB1 gene stability (p=0.002, p=0.01) and rs62521034,
but not the reference allele, was able to bind to miR-29a-3p (p=0.03), a miRNA implicated in
cancer, inflammation and cardiovascular disease. By using an RNA microarray dataset
generated within the Cardiogenics Consortium, we found that rs3201475 and rs62521034,
located in the 5’UTR and 3’UTR of TRIB1, respectively, are associated with a significant
reduction in the expression of distant genes (NLRC4, p=1.34E-07 and MRPS21, p =3.70E-06),
151
acting as trans-eQTLs. Although we demonstrated that TRIB1 non-coding SNPs have an effect
on post-transcriptional regulation of TRIB1 itself and other genes, additional work is needed
to investigate the impact of TRIB1 SNPs particularly in the context of disease.
5.1. Introduction
Single-Nucleotide Polymorphisms (SNPs) represent the most abundant genetic variation in the
human genome, responsible for the diversity among individuals, such as differences in
response to drugs, microorganisms, vaccines and other agents, as well as disease susceptibility
and outcome. For this reason, SNPs are subject of intense genetic investigations for the
development of personalised medicine (Laing et al., 2011). By definition, SNPs are
substitutions of a single nucleotide in specific positions of the genome, estimated to occur
approximately every 100-300 bases and present in more than 1% of the population; small
insertions and deletions (INDELs) are also classified as SNPs (Brookes et al., 1999, Orr and
Chanock, 2008). It has been reported that the majority of SNPs occur in non-coding regions of
the genome. The main function of these non-coding variants is to regulate gene expression
(Ward et al., 2012, Tak et al., 2015). Several studies reported that genetic variants in the 5’
untranslated region (5’UTR) of protein-coding genes affect translation. For example, Khan and
colleagues found that a SNP in the 5’UTR of p53, the “guardian” of the genome, impairs
translation by compromising internal ribosome entry sites (IRES) and ribosomal assembly
(Khan et al., 2013). A number of SNPs have been also identified to affect the Kozak consensus
sequence (containing the initiation codon required for translation) and impair translational
outputs (Xu et al., 2010). Moreover, it is well established that regulatory SNPs can account for
tissue-specific differential gene expression: these are named Expression Quantitative Trait Loci
(eQTLs). By definition, eQTLs are genetic variants affecting local (cis-acting) and distal (trans-
acting) gene expression by mechanisms that are still not fully understood (Gilad et al., 2008,
The GTEx Consortium, 2013). To date, multiple cis- and trans-eQTLs have been discovered:
for example, the intronic SNP rs3129934, associated with an increased risk of multiple
sclerosis (Comabella et al., 2008), is a cis-eQTL for several HLA transcripts (Wellcome Trust
Case Control Consortium, 2007). Mangravite and colleagues identified the SNP rs9806699 as
cis-eQTL for the gene glycine amidinotransferase (GATM) and they observed that there is an
association with statin exposure and the risk of statin-induced myopathy (Mangravite et al.,
2013). Interestingly, the variation in gene expression mediated by SNPs is often due to the
activity of endogenous microRNAs (miRNAs). miRNAs are abundant and critical in

152
maintaining the transcriptional profile of all tissues, therefore SNPs affecting miRNA-target
sequences can perturbate gene expression and lead to disease traits (Sethupathy et al., 2008).
For example, a SNP found in the oncogene MDM4 (rs4245739) creates new binding sites for
miR-191 and miR-887-3p and this has been associated with decreased viability and
proliferation of prostate cancer cells in vitro (Stegeman et al., 2015). Similarly, a SNP found
in the 3’UTR of apolipoprotein C-III (APOC3) has been shown to create a binding site for
miR-4271, increasing the risk of hypertriglyceridemia and coronary heart disease (CHD), due
to APOC3 accumulation (Hu et al., 2016). SNPs can also abolish miRNA-binding sites: for
instance, a single nucleotide substitution found in the 3’UTR of the heparin binding epidermal
growth factor (HBEGF) has been shown to destroy the binding site for miR-1207-5p, leading
to HBEGF dysregulation, which in turn aggravates C3-glomerulopathy (Papagregoriou et al.,
2012). Besides these, many other SNP/miRNA axes have been characterized, particularly in
cancer (Wilk et al., 2018).
The TRIB1 gene is a regulator of inflammation, metabolism and cancer and its function has
been intensively investigated in the context of myeloid disorders and metabolic diseases (Satoh
et al., 2013, Eyers et al., 2017). Multiple studies have reported that TRIB1 is characterized by
a highly unstable transcript and a context-dependent expression (Sharova et al., 2009,
Soubeyrand et al.,2016). Previously, we have shown that TRIB1 undergoes miRNA-mediated
post-transcriptional regulation. According to different miRNA-target prediction tools, TRIB1
is a potential target of multiple miRNAs; by knocking down DICER1 and blocking miRNA
biogenesis in human macrophages, we observed that TRIB1 RNA expression tends to increase
(see Chapter 3). Interestingly, genome-wide association studies (GWAS) have identified
several SNPs in the TRIB1 gene linked to high plasma lipids, high cholesterol and triglycerides
and the risk of cardiovascular disease (Kathiresan et al., 2008, Aulchenko et al., 2009, Wang
et al, 2015). However, to date there is no information about the role of non-coding SNPs in the
post-transcriptional regulation of TRIB1, as well as their impact on miRNA-binding sites and
disease traits. Therefore, we investigated the association between 3’UTR SNPs and miRNAs,
as well as the existence of regulatory eQTLs, employing both bioinformatics and experimental
tools. We showed, for the first time, that TRIB1 non-coding variants influence miRNA-
mediated gene regulation, by creating multiple 3’UTR binding sites. We experimentally
validated a non-canonical miRNA-target interaction (offset seed, 3-9) between a 3’UTR SNP
(rs62521034) and miR-29a-3p. Also, we identified cis- and trans-eQTLs that have not been
reported before. Overall, our results provide new insights into TRIB1 post-transcriptional
regulation, suggesting that both SNPs and miRNAs play a role; however, due to the limitations

153
of this study, more experimental validation is needed (see Section 5.4. Limitations of this
study).
5.2. Hypothesis and aim of this study
We hypothesised that an association between TRIB1 non-coding variants and miRNAs exists
as a mechanism of gene expression regulation. Therefore, the aim of this study was to identify
SNPs affecting miRNA-binding sites and investigate whether they associate with gene
expression regulation by using target prediction tools and existing transcriptomic datasets.

154
5.3. Results
5.3.1. Impact of the 3’UTR of TRIB1 on mRNA stability
We first evaluated the impact of the 3’UTR of TRIB1 on mRNA stability, by using a dual
luciferase reporter assay. We used two renilla luciferase reporter plasmids: a control plasmid
with the renilla luciferase gene and a TRIB1 3’UTR reporter (consisting of the same plasmid
with the 3’UTR of TRIB1 cloned downstream of the renilla luciferase gene). These were co-
transfected in HEK293T cell line in combination with a firefly luciferase reporter, used as
internal control for data normalisation. The result is shown in Figure 5.1.: the presence of the
3’UTR of TRIB1 significantly impaired (p = 0.0004) the gene reporter activity, causing a 42%
reduction; this suggests that the 3’UTR of TRIB1, downstream of the renilla gene, exert a
negative translational effect. We are not sure whether this is due to post-transcriptional
regulation of TRIB1 by endogenous miRNAs expressed by HEK293T cells. However, we have
previously showed that the 3’UTR of TRIB1 is enriched in miRNA-binding sites and inhibiting
DICER1 in human macrophages resulted in the increase of TRIB1 mRNA and protein levels
(see Chapter 3). Therefore, we do not exclude that the reduction of the reporter activity is due
to the presence of endogenous miRNAs in HEK293T cells.
Figure 5.1. Impact of the 3’UTR of TRIB1 on mRNA stability
Relative luciferase activity measured in HEK293T cell line after 24 hours co-transfection of a
renilla luciferase reporter (control plasmid, no UTR) and a TRIB1 3’UTR reporter with a firefly
luciferase control (required for normalisation). Total DNA transfected 100 ng/well (96-well
plate). Data are presented as mean SEM (unpaired t-test, n = 12, *** p < 0.001).

155
5.3.2. Identification of TRIB1 non-coding variants affecting miRNA-binding
sites
To determine whether TRIB1 3’UTR variants have an impact on miRNA-binding sites, we
used the miRNA-target prediction algorithm miRanda to align human mature miRNA
sequences with TRIB1 non-coding variants. The algorithm was downloaded and used as an
independent script (http://microrna.org, August 2010 release). We applied a score cutoff of
140 and a free energy threshold of 1 kcal/mol (default settings). These are considered non-
stringent parameters (Marin et al., 2011). As input files for the algorithm, we used TRIB1
reference sequence (transcript variant 1, NM_025195.4) and 90 variants affecting the 3’UTR
of TRIB1, downloaded from NCBI database (https://www.ncbi.nlm.nih.gov/snp). The TRIB1
SNPs were downloaded as short sequences containing IUPAC ambiguity codes, therefore we
pre-processed them using Python (Python v3.6.2/BioPython v1.70) to generate the full-length
3’UTR sequences carrying each SNP (see Chapter 8, Appendix IV). An example of a SNP
before and after the processing in Python in shown in Figure 5.2., while the complete list of
TRIB1 variants is provided in Chapter 8 (Appendix IV). After executing miRanda, we used
Python to organise the output file into tables. We created a table for the reference transcript
and a table for all the SNPs; we then imported the tables in mySQL (pgAdmin tools version 4)
and used structural queries to intersect each dataset and find, for example, common interactions
and non-common interactions. By using this approach, we found that 62 of 90 3’UTR variants
create new miRNA-binding sites for 135 distinct miRNAs which have not been detected for
the reference allele (Table 5.1.); most of these variants are associated with a minor allele
frequency (MAF) of less than 1% and only 6 SNPs are present in more than 1% of the
population. We did not find any abolished interaction but we found that a number of SNPs
modify the alignment score and the free energy values for multiple miRNAs, compared to the
reference transcript. Possibly, those SNPs are predicted to modify the affinity of miRNAs for
the 3’UTR of TRIB1, by either enhancing or weakening the interaction. However, as
mentioned earlier, we used miRanda algorithm relying on relaxed parameters, therefore we do
not exclude the possibility of abolished interactions. Next, we compared our output with the
output generated by PolymiRTS (Version 3.0, http://compbio.uthsc.edu/miRSNP/) an online
database, based on the miRNA-target prediction algorithm TargetScan (Bhattacharya et al.,
2014). The output from PolymiRTS is shown in Table 5.2.: 13 distinct 3’UTR SNPs create
new binding sites for 29 miRNAs; the SNPs and miRNAs highlighted in yellow are those
which are overlapping with our analysis. TargetScan is usually more stringent than miRanda

156
and it also considers the phylogenetic conservation of miRNA-target interaction. Therefore, it
is not surprising that, using miRanda, we found a greater number of SNPs creating novel target
sites. However, miRanda allowed us to detect also non-canonical binding sites which are
discussed further in the next sections.
Figure 5.2. Example of SNP sequence before and after Python processing
SNP in TRIB1 downloaded as IUPAC ambiguity code (Y, C>T) flanked by two small
sequences (A) was pre-processed in Python before the use of miRanda algorithm in order to
generate the 3’UTR full-sequence containing the SNP (B).
gnl|dbSNP|rs62521034|allelePos=256|totalLen=511|taxid=9606|snpclass=1|alleles='C/T'|mol=Genomic|build=151
CCTACTGCAC CCCTGGTTTG AGTCCGTCTT GGAACCCGGG TACATCGACT CAGAAATAGGAACTTCAGAC CAGATTGTTC CAGAGTACCA GGAGGACAGT GACATTAGTT CCTTCTTCTG
CTAATCCCCA AAACCTCAGA AACCTCATAA TTCTTAACAC CTGGCATTTC CATTTCTAAAGATGGACAGG CCCTTTGGCG TGGTACCAAC CAGATAATGA CTGCATCAGG ATGAAAGCTG
CTGAACTCGG CATGG
YGCCTCCTCTT CTCTGTTGGG ATGAGTGACT TTATTGATTT GAGCAGCATA TGCTGTGATTGGCTGCCCTG CAAATTTGTT TCCCTTAAGG AACCCTCACC AACTATCTCT GCTGGATTTGGGAGTTCCGC ATCTTTTGTG GAGGGCAGAG TATGGACATC TTACACCCGG TGGTCAAGTG
TGTAATAAAC TTGAGCATTC GAATGGGAGA AAAAGCAAAT CGCACAATGA CATATTTTGAGTAATAACCG TATTT
>gnl|dbSNP|rs62521034rs=62521034|pos=256|len=511|taxid=9606|mol="genomic"|class=snp|alleles="C/T"|build
=150|suspect=?|GMAF=T:303:0.0605
TCCCCAAAACCTCAGAAACCTCATAATTCTTAACACCTGGCATTTCCATTTCTAAAGATGGACAGGCCCTTTGGCGTGGTACCAACC
AGATAATGACTGCATCAGGATGAAAGCTGCTGAACTCGGCATGGTGCCTCCTCTTCTCTGTTGGGATGAGTGACTTTATTGATTTGA
GCAGCATATGCTGTGATTGGCTGCCCTGCAAATTTGTTTCCCTTAAGGAACCCTCACCAACTATCTCTGCTGGATTTGGGAGTTCCG
CATCTTTTGTGGAGGGCAGAGTATGGACATCTTACACCCGGTGGTCAAGTGTGTAATAAACTTGAGCATTCGAATGGGAGAAAAAGCAAATCGCACAATGACATATTTTGAGTAATAACCGTATTTTTCACAGGGTGACAAATTGGGCCAATAAATCTGCCATCTTTGAACTC
ATCTTTGGTGGCTAGACTGCTACGGCAGCTTCTCTGATGGGAAAGTTCCTTTTTTGGCTTAACACTCACCCTTTCTTCACACTCACATTTACCAATGACTCTGCTCCGTTTTTGGAGCAGACTGTTTTAAGTTGCTCAGGAGCCTGATGGAACCATGAACCGAGACTCTTCTCTGTTTCCTGCCAAGACCTCATCTGCACTAATGCCTTCTCCCTGACCTTGACACTTCCCCCTTTAGCTATAAAAGCACTTACCAGCCGAAC
GTGGAACAGTATCACAAAAGATTCCATCTCCCAACGATTTCAGAACTCTGAGCTCAGAGAGACTCCAGATTTTAAAAAATAATTTGAGTGCTTGGAAACTATTAGCTTTTTAAGTTCCTTCCAAATATGTTAGTACCTACCCTTTACTTTTTCCCCAAGACCATCTCAGGGTGGA
GCATTCTGTCTAAGAGAAGAAAGATAAGGAGGCTCCCACCCACCTCTCCCAAGAGCAGACATTAAACATCTTTGTGCTTTGAAGAGAGTGAATTTTGGATAGTCTTGTGATTCTCAGACTAACTTCCAGAATTATACTTTAACCCCTCCCAGATATGGTCCGCCTTTGGCATTGTGTGTACATCTGCAGTTTTGCATGGTGGGTTGTTAATATTTCAAATGTGTGGTTTATGAATACGTCTGTATAATCGGCTTCTGGAGTGA
AACAGCAAACCCCAAATCTTCAAAGTTGGAAGGAACTTTAAAAATCATCCGGTCCAATCTCTTTCCTCTTTCTGCCACCTCCCAAGGCAGAAATCCCCTCTTCAGCTTCTTTTGTAGGTGGGAATCCAGCCTCTGTTAGATATGTCCAGAGATGGAAACTCACTCCCCTACAAA
AGATGGAGCTTAATGGAGAAATTGCAACTTTCATTAAAAAACAAATTCAGATGAAATATCAGTAACTGTCTTGGACAGTGCTGAAATCAGGTGGTTAAACGGGTAAACAAAATATACTGTATTTTGAGAAATGGCACAAAAACAGGCAGTCATCTTTAAGGGCTATGCCTAGGCAAACTACTAACATGCATTGTGAGAATGCCGTGTATACCTCACGTACTGTGTACTTTGTACATATATTTTACCTTTTATACCTATGTTCGATTTTGTTTTGTTTTGTTTTGTTCTGGCTTTGAGGCTTGTTTTGTTGTCTGTGTCTGTCTGAATAACCTGCGTGTCTAAAACCACGTGAAATGTGAATGATTATTGGCAATATTACCTTGACAGAATCATGGGACTTTGAGAAGAGGGAGGACAGAGGCCTCTGTCGCACTAACGCTCTCGTGGTTGCTCGACTGTTGTATCTGTGATACATTATCCGACTAAGGACTCTGGGCTGGCAGGGCCTTCTGCCGGGAAAGCTAGAAACACTAGGTTCTTCCTGTACATACGTGTATATATGTGAACAGTGAGATGGCCGTTTCTGACTTGTAGAGAAATTTTAATAAACCTGGTTTCGTAAATAAAAAAAAAAAAAAA
A
B

157
Table 5.1. List of TRIB1 3’UTR SNPs creating new miRNA-binding sites
List of TRIB1 non-coding SNPs creating new miRNA-binding sites, not detected for the reference
allele. Highest population MAF refers to the highest Minor Allele Frequency observed in a population,
taken from Ensembl database (https://www.ensembl.org). The prediction analysis was carried out using
the algorithm miRanda (http://www.microrna.org/microrna/home.do); score cut off 140; free energy
threshold 1 kcal/mol.
SNP ID Allele Highest
MAF Associated miRNAs
rs751789944 C/- <1% miR-6508-5p, miR-8067, miR-4683
rs754065243 A>T <1% miR-452-5p, miR-4719
rs755860381 C>G <1% miR-6721-5p, miR-3126-3p, miR-4776-5p
rs756175087 -/G <1% miR-652-3p, miR-6847-5p
rs756397904 T>C <1% miR-3944-3p
rs757344260 G>A <1% miR-7159-3p
rs758576660 C/A/G <1% miR-544b
rs758819773 A>G <1% miR-4685-3p, miR-4755-5p, miR-4287
rs367637074 C>T < 1% miR-487a-3p, miR-3678-5p
rs372324007 C>T < 1% miR-4477b
rs375565353 A>G < 1% miR-4477b
rs530681133 C>T < 1% miR-6508-3p
rs533208547 C>G < 1% miR-6504-3p
rs546479447 C>T < 1% miR-6797-5p, miR-4428, miR-4726-5p, miR-4776-5p
rs550939781 C>T < 1% miR-130a-3p, miR-130b-3p, miR-301b-3p, miR-3666, miR-4295, miR-
454-3p
rs557685029 G>A>C < 1% miR-659-3p
rs560408937 C>T < 1% miR-6861-5p, miR-1229-5p, miR-3140-3p
rs564442600 C>G < 1% miR-6841-5p
rs72647345 C>T < 1% miR-454-3p
rs72647346 C>G < 1% miR-4491, miR-4657
rs72647347 G>A < 1% miR-145-3p
rs759347835 C>G>T < 1% miR-190a-3p, miR-466, miR-500a-3p, miR-502-3p, miR-5580-3p
rs761444485 G>A < 1% miR-6886-3p
rs762994344 T>C < 1% miR-184
rs764779399 T>A < 1% miR-211-5p, miR-4287, miR-4685-3p
rs765360657 T>C < 1% miR-629-5p
rs767431696 C>T < 1% miR-3121-3p
rs768403240 G>A < 1% miR-4729, miR-181c-5p
rs770137661 A>G>T < 1% miR-4653-3p, miR-3159
rs772580999 C>G < 1% miR-4520-5p
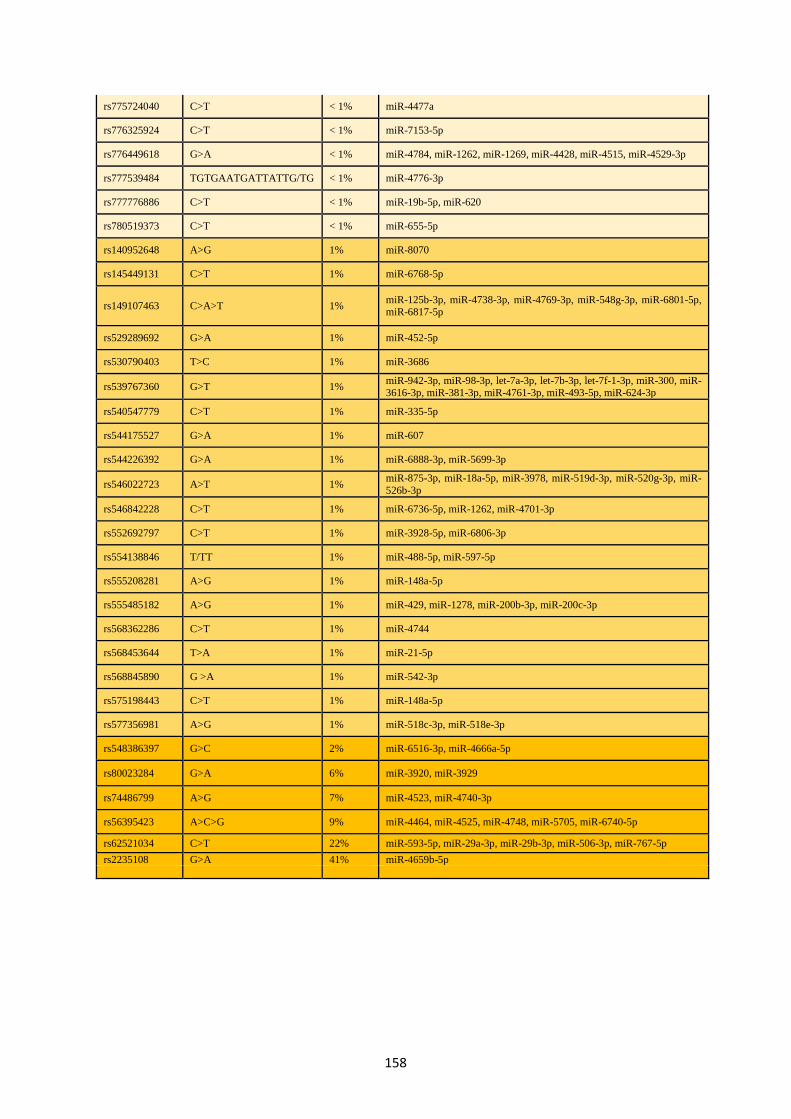
158
rs775724040 C>T < 1% miR-4477a
rs776325924 C>T < 1% miR-7153-5p
rs776449618 G>A < 1% miR-4784, miR-1262, miR-1269, miR-4428, miR-4515, miR-4529-3p
rs777539484 TGTGAATGATTATTG/TG < 1% miR-4776-3p
rs777776886 C>T < 1% miR-19b-5p, miR-620
rs780519373 C>T < 1% miR-655-5p
rs140952648 A>G 1% miR-8070
rs145449131 C>T 1% miR-6768-5p
rs149107463 C>A>T 1% miR-125b-3p, miR-4738-3p, miR-4769-3p, miR-548g-3p, miR-6801-5p, miR-6817-5p
rs529289692 G>A 1% miR-452-5p
rs530790403 T>C 1% miR-3686
rs539767360 G>T 1% miR-942-3p, miR-98-3p, let-7a-3p, let-7b-3p, let-7f-1-3p, miR-300, miR-3616-3p, miR-381-3p, miR-4761-3p, miR-493-5p, miR-624-3p
rs540547779 C>T 1% miR-335-5p
rs544175527 G>A 1% miR-607
rs544226392 G>A 1% miR-6888-3p, miR-5699-3p
rs546022723 A>T 1% miR-875-3p, miR-18a-5p, miR-3978, miR-519d-3p, miR-520g-3p, miR-
526b-3p
rs546842228 C>T 1% miR-6736-5p, miR-1262, miR-4701-3p
rs552692797 C>T 1% miR-3928-5p, miR-6806-3p
rs554138846 T/TT 1% miR-488-5p, miR-597-5p
rs555208281 A>G 1% miR-148a-5p
rs555485182 A>G 1% miR-429, miR-1278, miR-200b-3p, miR-200c-3p
rs568362286 C>T 1% miR-4744
rs568453644 T>A 1% miR-21-5p
rs568845890 G >A 1% miR-542-3p
rs575198443 C>T 1% miR-148a-5p
rs577356981 A>G 1% miR-518c-3p, miR-518e-3p
rs548386397 G>C 2% miR-6516-3p, miR-4666a-5p
rs80023284 G>A 6% miR-3920, miR-3929
rs74486799 A>G 7% miR-4523, miR-4740-3p
rs56395423 A>C>G 9% miR-4464, miR-4525, miR-4748, miR-5705, miR-6740-5p
rs62521034 C>T 22% miR-593-5p, miR-29a-3p, miR-29b-3p, miR-506-3p, miR-767-5p
rs2235108 G>A 41% miR-4659b-5p

159
Table 5.2. Output generated by PolymiRTS database 3.0
List of TRIB1 non-coding SNPs creating new miRNA-binding sites according to PolymiRTS database
(version 3.0). Function class C=created, D=deleted (deleted binding sites are shown only for the
ancestral allele, so no SNPs is found to abolish miRNA-binding sites).
dbSNP ID Variant
type
Ancestral
Allele Allele miR ID miRSite
Function
Class
rs2235108 SNP G A hsa-miR-6872-3p hsa-miR-7153-3p
tttGGCATGGtac tttggCATGGTAc
C C
rs62521034 SNP C
C hsa-miR-3197 gcatgGCGCCTCc D
T
hsa-miR-3612 hsa-miR-593-5p
hsa-miR-650
hsa-miR-767-5p
gcatggTGCCTCC gcaTGGTGCCtcc
gcatggTGCCTCC
gcATGGTGCctcc
C C
C
C
rs72647345 SNP C
C hsa-miR-147b
hsa-miR-210-3p
gcaaatCGCACAA
gcaaatCGCACAA
D
D
T hsa-miR-19a-3p hsa-miR-19b-3p
gcaaaTTGCACAa gcaaaTTGCACAa
C C
rs140952648 SNP G
G hsa-miR-147b hsa-miR-210-3p
caaatCGCACAAt caaatCGCACAAt
D D
A
hsa-miR-147a
hsa-miR-6818-5p
hsa-miR-8070
caaatCACACAAt
caaaTCACACAAt
caAATCACAcaat
C
C
C
rs72647346 SNP G
G hsa-miR-4668-3p
hsa-miR-516b-5p
actccaGATTTTA
aCTCCAGAtttta
D
D
C
hsa-miR-3662
hsa-miR-4491
hsa-miR-4657 hsa-miR-7847-3p
actccaCATTTTA
acTCCACATttta
acTCCACATttta aCTCCACAtttta
C
C
C C
rs74486799 SNP A A
hsa-miR-125a-5p
hsa-miR-125b-5p
hsa-miR-1273f
hsa-miR-143-3p
hsa-miR-3620-3p
hsa-miR-4319 hsa-miR-4324
hsa-miR-4708-5p
hsa-miR-4770 hsa-miR-6088
catCTCAGGGtgg
catCTCAGGGtgg
CATCTCAgggtgg
CATCTCAgggtgg
catctCAGGGTGg
catCTCAGGGtgg caTCTCAGGgtgg
CATCTCAgggtgg
CATCTCAgggtgg CATCTCAgggtgg
D
D
D
D
D
D D
D
D D
G hsa-miR-4740-3p caTCTCGGGgtgg C
rs80023284 SNP G A hsa-miR-3920 aTAATCAGcttct C
rs76707681 SNP A
A hsa-miR-4709-3p TCTTCAAagttgg D
G hsa-miR-146a-3p
hsa-miR-4714-5p
tcTTCAGAGttgg
tctTCAGAGTtgg
C
C
rs72647347 SNP G
G
hsa-miR-1224-3p
hsa-miR-1260a
hsa-miR-1260b hsa-miR-188-3p
hsa-miR-3156-3p
gtAGGTGGGAatc
gtaGGTGGGAAtc
gtaGGTGGGAAtc gtagGTGGGAAtc
gtagGTGGGAAtc
D
D
D D
D
A
hsa-miR-145-3p
hsa-miR-155-3p hsa-miR-3685
gtaggtAGGAATC
gtagGTAGGAAtc gtagGTAGGAAtc
C
C C
rs72647348 SNP C
C hsa-miR-135b-3p hsa-miR-3674
cCCCTACAAaaga cccCTACAAAaga
D D
A
hsa-miR-2909
hsa-miR-4278
hsa-miR-6789-5p hsa-miR-6824-5p
cCCCTAAAaaaga
CCCCTAAaaaaga
CCCCTAAaaaaga CCCCTAAaaaaga
C
C
C C
rs72647349 SNP G G
hsa-miR-205-3p hsa-miR-452-3p
tcagaTGAAATAt tCAGATGAAatat
D D
A hsa-miR-3200-5p TCAGATAaaatat C
rs201361138 SNP G G
hsa-miR-3065-5p hsa-miR-3529-3p
tgtTTTGTTGtct tgttTTGTTGTct
D D
T hsa-miR-3613-3p tgtTTTTTTGtct C
rs145449131 SNP C C hsa-miR-657 AACCTGCgtgtct D
T hsa-miR-6768-5p aaCCTGTGTgtct C

160
5.3.3. Effect of TRIB1 3’UTR SNPs on gene reporter activity
For experimental validation, we selected the two SNPs listed in Table 5.3. that we have
generated in vitro through site-directed mutagenesis. Figure 5.3. shows the confirmation of
3’UTR mutants by Sanger sequencing. We have chosen a triallelic (rs56395423) and a biallelic
(rs62521034) SNP with a population frequency higher than 1% and associated with more than
one miRNA. Moreover, both SNPs have not been linked to any clinical trait or disease
susceptibility and they have not been investigated in the context of miRNA-mediated gene
regulation. Therefore, we tested the impact of these two SNPs on the regulatory function of the
3’UTR, using the reporter assay. We found that both rs56395423 and rs62521034 caused a
small, significant reduction in the luciferase activity (17% reduction, p=0.01 and 20%
reduction, p=0.002, respectively) (Figure 5.4.). However, for the triallelic SNP rs56395423
only one allele (C), the less frequent in the population, had a negative effect on TRIB1 mRNA,
while the other one (G) did not show any significant effect, compared to the reference sequence.
In fact, the minor allele C is associated with 5 new miRNAs, whereas the allele G is predicted
to create only 1 novel miRNA binding site. However, we cannot conclude that the negative
impact of rs56395423 and rs62521034 is specifically due to the activity of endogenous
miRNAs, because of the lack of experimental evidence. As they caused a reduction in the gene
reporter activity and then in TRIB1 expression itself, rs56395423 (A>C) and rs62521034
(C>T) are likely to be cis-eQTLs, which are tissue-dependent. This suggests that the assay
could give different results in a different cell line/environment.
Table 5.3. TRIB1 non-coding variants selected for experimental validation
Triallelic and biallelic SNPs in TRIB1 3’UTR predicted to create new miRNA-binding sites
and selected for experimental validation.
SNP ID Allele Highest MAF Associated miRNAs
rs56395423 A>C <1% miR-4464, miR-4525, miR-4748, miR-5705, miR-6740-5p
rs56395423 A>G 9% miR-5705
rs62521034 C>T 22% miR-506-3p, miR-29a-3p, miR-29b-3p, miR-593-5p, miR-3612, miR-650, miR-767-5p

161
Figure 5.3. Confirmation of TRIB1 3’UTR mutants: Sanger sequencing results
TRIB1 3’UTR mutagenesis to generate rs62521034 (A) and rs5695423 (B) was confirmed by
forward Sanger sequencing (screenshots taken from SeqMan Pro alignment software,
DNAStar).

162
Figure 5.4. Effect of TRIB1 non-coding SNPs on gene reporter activity
Relative luciferase activity measured in HEK293T cell line after 24 hours co-transfection of
TRIB1 3’UTR reporter (reference allele and 3 minor alleles) with a firefly luciferase control
(required for normalisation). Total DNA transfected 100 ng/well (96-well plate). Data are
presented as mean SEM (One Way ANOVA with Dunnett’s multiple comparison test n = 4-
12, ** p < 0.002, * p < 0.05, ns p > 0.05).
163
5.3.4. Experimental validation of rs62521034/miR-29a-3p interaction
For the experimental validation of SNP/miRNA interaction, we selected rs62521034, as it is
the SNP with the biggest impact on the luciferase reporter activity. According to our in-silico
analysis, rs62521034 creates novel binding sites for miR-29a-3p, miR-29b-3p, miR-506-3p,
miR-593-5p, miR-3612, miR-650, miR-767-5p. The alignment of these miRNAs with the SNP
and the reference transcript are shown in Figure 5.5, along with the algorithm score, free-
energy values and seed-region type. Despite the fact we used the algorithm applying non-
stringent parameters (score threshold 140, free-energy threshold 1 kcal/mol), the predicted
interactions between rs62521034 and miRNAs show an optimal alignment score (>140) and
free energy (≤ -15). Interestingly, the seed region pairs for miR-29a/b-3p and miR-593-5p are
non-canonical matches, as they start from the 3rd miRNA nucleotide and end with the 9th
(“offset” 7-mer, 3-9). This seed region type is not widespread and it has not been investigated.
However, there are a few studies showing that offset seed matches are functional in repressing
the expression of target genes (Manzano et al., 2015, Broughton et al., 2016). Therefore, we
experimentally validated the non-canonical interaction between rs62521034 and miR-29a-
3p/miR-29b-3p which belong to the same miRNA family and have the same seed region,
despite small changes in the sequence. We performed a luciferase reporter assay and we used
miR-29a-3p mimic in combination with the reporter plasmids, thus causing an overexpression
of the miRNA within the host cell line. In line with our prediction, miR-29a-3p caused a small,
significant reduction (15%, p=0.03) of the luciferase activity only when co-transfected with
the rs62521034 reporter plasmid. No effect was observed for the reference allele (p=0.7)
(Figure 5.6.). This confirms that off-set 3-9 non-canonical binding sites are functional. By
using published literature, we identified some biological conditions in which both miR-29 and
TRIB1 are active players, often with opposing roles (Table 5.4.). In fact, miR-29a/b is an
established tumour suppressor, while TRIB1 is known to be overexpressed in cancer, acting as
an oncogene. Moreover, both miR-29 and TRIB1 have been implicated in hepatic lipid
metabolism and cardiovascular disease. Therefore, the interaction between miR-29 and the
TRIB1 SNP rs62521034 could be further investigated in the context of these diseases.
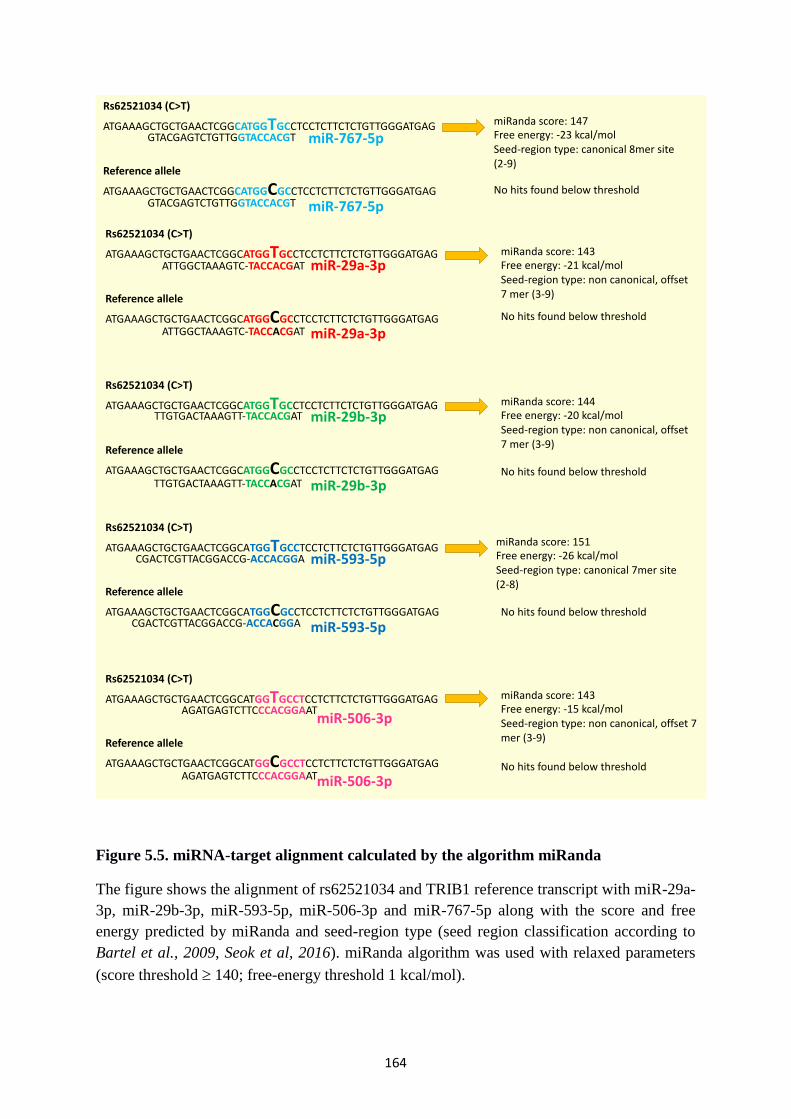
164
Figure 5.5. miRNA-target alignment calculated by the algorithm miRanda
The figure shows the alignment of rs62521034 and TRIB1 reference transcript with miR-29a-
3p, miR-29b-3p, miR-593-5p, miR-506-3p and miR-767-5p along with the score and free
energy predicted by miRanda and seed-region type (seed region classification according to
Bartel et al., 2009, Seok et al, 2016). miRanda algorithm was used with relaxed parameters
(score threshold 140; free-energy threshold 1 kcal/mol).
Rs62521034 (C>T)
ATGAAAGCTGCTGAACTCGGCATGGTGCCTCCTCTTCTCTGTTGGGATGAG
Reference allele
ATGAAAGCTGCTGAACTCGGCATGGCGCCTCCTCTTCTCTGTTGGGATGAG
miRanda score: 151Free energy: -26 kcal/molSeed-region type: canonical 7mer site(2-8)
No hits found below threshold
Rs62521034 (C>T)
ATGAAAGCTGCTGAACTCGGCATGGTGCCTCCTCTTCTCTGTTGGGATGAG
Reference allele
ATGAAAGCTGCTGAACTCGGCATGGCGCCTCCTCTTCTCTGTTGGGATGAG
miRanda score: 143Free energy: -15 kcal/molSeed-region type: non canonical, offset 7 mer (3-9)
No hits found below threshold
CGACTCGTTACGGACCG-ACCACGGA miR-593-5p
CGACTCGTTACGGACCG-ACCACGGA miR-593-5p
miR-506-3p
miR-506-3p
AGATGAGTCTTCCCACGGAAT
AGATGAGTCTTCCCACGGAAT
Rs62521034 (C>T)
ATGAAAGCTGCTGAACTCGGCATGGTGCCTCCTCTTCTCTGTTGGGATGAGATTGGCTAAAGTC-TACCACGAT miR-29a-3p
Reference allele
ATGAAAGCTGCTGAACTCGGCATGGCGCCTCCTCTTCTCTGTTGGGATGAGATTGGCTAAAGTC-TACCACGAT miR-29a-3p
miRanda score: 143Free energy: -21 kcal/molSeed-region type: non canonical, offset 7 mer (3-9)
No hits found below threshold
Rs62521034 (C>T)
ATGAAAGCTGCTGAACTCGGCATGGTGCCTCCTCTTCTCTGTTGGGATGAGTTGTGACTAAAGTT-TACCACGAT miR-29b-3p
Reference allele
ATGAAAGCTGCTGAACTCGGCATGGCGCCTCCTCTTCTCTGTTGGGATGAGTTGTGACTAAAGTT-TACCACGAT miR-29b-3p
miRanda score: 144Free energy: -20 kcal/molSeed-region type: non canonical, offset 7 mer (3-9)
No hits found below threshold
Rs62521034 (C>T)
ATGAAAGCTGCTGAACTCGGCATGGTGCCTCCTCTTCTCTGTTGGGATGAG
Reference allele
ATGAAAGCTGCTGAACTCGGCATGGCGCCTCCTCTTCTCTGTTGGGATGAG
miRanda score: 147Free energy: -23 kcal/molSeed-region type: canonical 8mer site(2-9)
No hits found below threshold
miR-767-5p
miR-767-5p
GTACGAGTCTGTTGGTACCACGT
GTACGAGTCTGTTGGTACCACGT

165
Figure 5.6. Experimental validation of rs62521034/miR-29a-3p interaction
Relative luciferase activity measured in HEK293T cell line after 24 hours co-transfection of
TRIB1 3’UTR reporter (reference allele and rs62521034) with a firefly luciferase control
(required for normalisation) and miR-29a-3p mimic/negative control. Total DNA transfected
was 100 ng/well, total RNA transfected was 50 nM/well (96-well plate). Data are presented as
mean SEM (One Way ANOVA with Bonferroni’s multiple comparison test n = 5, * p < 0.05,
ns p > 0.05).
Table 5.4. miR-29a/b and TRIB1 involvement in cancer and metabolism
The table lists some of the biological processes and diseases in which both miR-29a/b and
TRIB1 are actively involved, often with opposing roles.
miR-29a/b-3p TRIB1
Biological Process/Disease Status/Effect Biological Process/Disease Status/Effect
Acute myeloid leukemia
(Wang et al., 2012)
Downregulated Acute myeloid leukemia
(Röthlisberger et al., 2007)
Upregulated
Prostate cancer
(Ru et al., 2012, Zhu et al., 2018)
Downregulated Prostate Cancer
(Mashima et al., 2014, Moya et al.,
2018)
Upregulated
Hepatocellular carcinoma
(Wang et al., 2017)
Downregulated Hepatocellular carcinoma
(Ye et al., 2017)
Upregulated
Lung cancer
(Liu et al., 2018)
Downregulated Lung cancer
(Wang et al., 2017)
Upregulated
Hepatic lipogenesis
(Kurtz et al., 2015)
Increased lipogenesis Hepatic lipogenesis
(Bauer et al., 2015)
Decreased
lipogenesis
Atherosclerosis
(Chen et al., 2011, Huang et al.,
2016)
Anti-inflammatory
Upregulated
Atherosclerosis
(Sung et al., 2012, Johnston et al.,
2019)
Anti-
inflammatory
Increased lipid
uptake
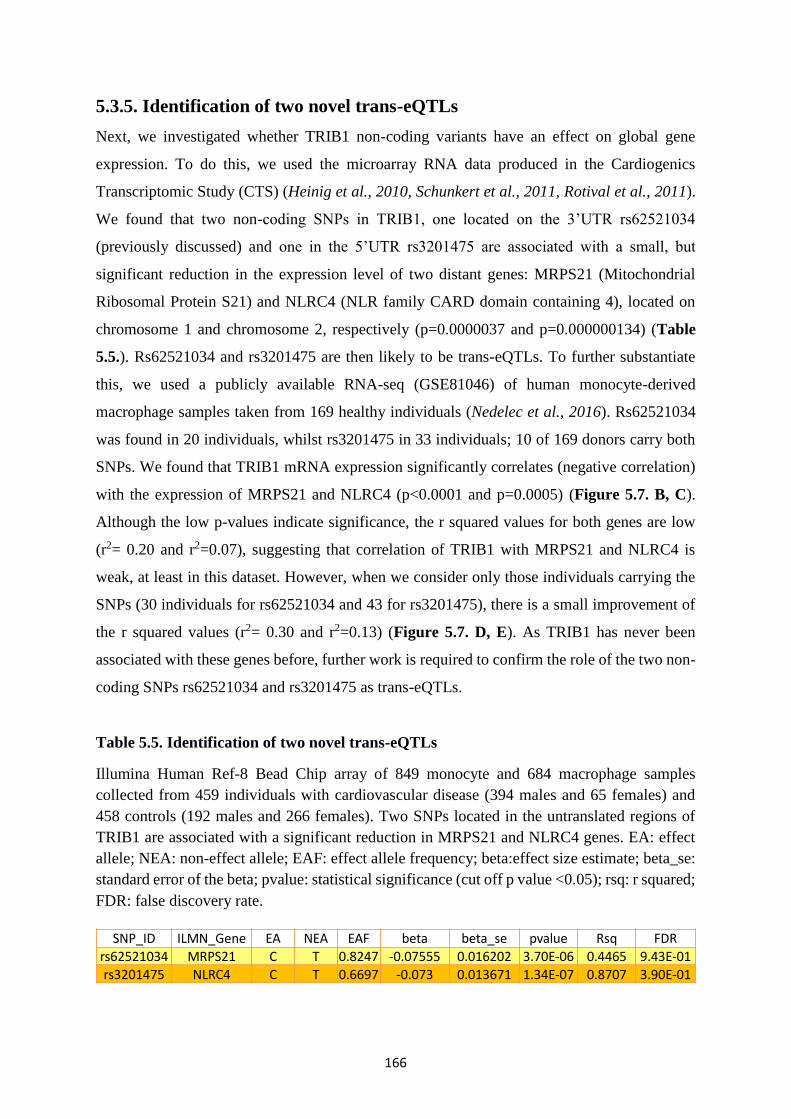
166
5.3.5. Identification of two novel trans-eQTLs
Next, we investigated whether TRIB1 non-coding variants have an effect on global gene
expression. To do this, we used the microarray RNA data produced in the Cardiogenics
Transcriptomic Study (CTS) (Heinig et al., 2010, Schunkert et al., 2011, Rotival et al., 2011).
We found that two non-coding SNPs in TRIB1, one located on the 3’UTR rs62521034
(previously discussed) and one in the 5’UTR rs3201475 are associated with a small, but
significant reduction in the expression level of two distant genes: MRPS21 (Mitochondrial
Ribosomal Protein S21) and NLRC4 (NLR family CARD domain containing 4), located on
chromosome 1 and chromosome 2, respectively (p=0.0000037 and p=0.000000134) (Table
5.5.). Rs62521034 and rs3201475 are then likely to be trans-eQTLs. To further substantiate
this, we used a publicly available RNA-seq (GSE81046) of human monocyte-derived
macrophage samples taken from 169 healthy individuals (Nedelec et al., 2016). Rs62521034
was found in 20 individuals, whilst rs3201475 in 33 individuals; 10 of 169 donors carry both
SNPs. We found that TRIB1 mRNA expression significantly correlates (negative correlation)
with the expression of MRPS21 and NLRC4 (p<0.0001 and p=0.0005) (Figure 5.7. B, C).
Although the low p-values indicate significance, the r squared values for both genes are low
(r2= 0.20 and r2=0.07), suggesting that correlation of TRIB1 with MRPS21 and NLRC4 is
weak, at least in this dataset. However, when we consider only those individuals carrying the
SNPs (30 individuals for rs62521034 and 43 for rs3201475), there is a small improvement of
the r squared values (r2= 0.30 and r2=0.13) (Figure 5.7. D, E). As TRIB1 has never been
associated with these genes before, further work is required to confirm the role of the two non-
coding SNPs rs62521034 and rs3201475 as trans-eQTLs.
Table 5.5. Identification of two novel trans-eQTLs
Illumina Human Ref-8 Bead Chip array of 849 monocyte and 684 macrophage samples
collected from 459 individuals with cardiovascular disease (394 males and 65 females) and
458 controls (192 males and 266 females). Two SNPs located in the untranslated regions of
TRIB1 are associated with a significant reduction in MRPS21 and NLRC4 genes. EA: effect
allele; NEA: non-effect allele; EAF: effect allele frequency; beta:effect size estimate; beta_se:
standard error of the beta; pvalue: statistical significance (cut off p value <0.05); rsq: r squared;
FDR: false discovery rate.
SNP_ID ILMN_Gene EA NEA EAF beta beta_se pvalue Rsq FDR
rs62521034 MRPS21 C T 0.8247 -0.07555 0.016202 3.70E-06 0.4465 9.43E-01rs3201475 NLRC4 C T 0.6697 -0.073 0.013671 1.34E-07 0.8707 3.90E-01

167
Figure 5.7. TRIB1 expression negatively correlates with MRSP21 and NLRC4 in
GSE81046 dataset
Total number of individuals and number of individuals carrying TRIB1 SNPs in GSE81046
dataset (A); XY correlation between TRIB1 and MRSP21 (Counts per Million, n = 169,
Pearson r test, **** p < 0.0001, r2=0.20) (B); XY correlation between TRIB1 and NLRC4
(Counts per Million, n = 169, Pearson r test, *** p = 0.0005, r2=0.07) (C); XY correlation
between TRIB1 and MRSP21 (Counts per Million, n = 30, Pearson r test, ** p < 0.003, r2=0.30)
(D); XY correlation between TRIB1 and NLRC4 (Counts per Million, n = 43, Pearson r test, *
p < 0.02, r2=0.13) (E).
2 4 6 8
2
3
4
5
6
TRIB1
MR
PS
21
****r squared= 0.20
2 4 6 8
2
3
4
5
6
TRIB1
NL
RC
4
***r squared= 0.07
B C
3 4 5 6 7
0
2
4
6
8
TRIB1
MR
PS
21
**r squared= 0.30
D E
2 4 6 8
2
3
4
5
6
TRIB1
NL
RC
4
*r squared= 0.13
A
n = 169 n = 43n = 30
GSE81046

168
5.4. Summary
It is well appreciated that the 3’UTR of mRNA is fundamental in controlling the post-
transcriptional fate of protein-coding genes (Pesole et al., 2001). It is also well known that any
mutation in this regulatory region further impact gene expression outcomes, by either
enhancing and inhibiting post-transcriptional events (Chatterjee and Pal, 2009). The
importance of the 3’UTR relies on the presence of multiple regulatory sequences, including
miRNA-binding sites, AU-rich elements and a poly(A) tail which mediate export, stability,
decay and expression of a transcript (Matoulkova et al., 2012). Interestingly, what happens to
the 3’UTR of a gene influence the expression of other genes (Skeeles et al., 2013) and this has
been often linked to the presence of genetic polymorphisms and the activity of endogenous
miRNAs (Wilk et al., 2018). Therefore, investigating the association between SNPs and
miRNAs is essential to unravel the molecular mechanisms underlying the complex post-
transcriptional regulation of eukaryotic genes. In this study, we focused on the TRIB1 gene.
TRIB1 is characterized by a long (1934 bp) and conserved 3’UTR sequence and its mRNA has
a half-life of less than 1 hour, hinting it is highly unstable and post-transcriptionally regulated
(Sharova et al., 2009). In fact, we have previously reported that TRIB1 is negatively regulated
by miR-101-3p, miR-132-3p and miR-214-5p in macrophages and in prostate cancer (see
results Chapter 3 and Chapter 6). Here, we have shown that polymorphisms in the 3’UTR of
TRIB1 has an impact on miRNA-mediate gene regulation, by creating novel binding-sites and
modifying the affinity of existing ones. Using a luciferase reporter assay, we observed that the
regulatory region of TRIB1 itself exerts a negative effect on gene stability and expression,
causing a 42% reduction in the luciferase activity (see Figure 5.1.). The presence of two SNPs
(rs62521034 and rs56395423) further reduces the reporter activity, suggesting that these
variants confer more instability to the TRIB1 gene (see Figure 5.2.). Both SNPs have been
predicted to create novel miRNA-binding sites, characterised by good alignment scores and
free energy values (see Figure 5.3.). As they affect TRIB1 expression, they are likely to be cis-
eQTLs but we need more experimental evidence to make a conclusion. Also, in our experiment
the negative effect of the TRIB1 SNPs is relatively small (17-20%) and this could depend on
the endogenous expression level of regulatory proteins and factors (including miRNAs) within
the host cell line, which have not been investigated in the present work. Moreover, performing
this assay using a different microenvironment and employing multiple cell lines would perhaps
give us more answers about the impact of rs62521034 and rs56395423 on TRIB1 expression
and whether it strictly depends on the presence and level of tissue-specific regulators. In

169
addition, we identified a non-canonical seed region match between rs62521034 and miR-29a/b-
3p and experimentally validated it as functional (see Figure 5.4.). This type of seed region is
rare and to date only a few cases have been described (Manzano et al., 2015). According to
published literature, either TRIB1 or miR-29a/b is implicated in acute myeloid leukemia
(Röthlisberger et al., 2007, Wang et al., 2012) and in prostate cancer (Moya et al., 2018, Zhu
et al., 2018), with contrasting roles: miR-29 is a tumour suppressing miRNA and it is usually
downregulated, while TRIB1 plays the oncogene role. Whether they are correlated and whether
their interaction is involved in these diseases, still remains to be investigated. Lastly, by using
a published microarray dataset from myeloid cells, we identified two trans-eQTLs: TRIB1 non-
coding SNPs rs3201475 (5’UTR, highest MAF 48%) and rs62521034 (3’UTR, highest MAF
22%) cause a small, but significant reduction in the expression of two distant genes (NLRC4
and MRPS21, respectively). By using a public transcriptomic dataset carried out on human
monocyte-derived macrophages, we found that TRIB1 expression negatively correlates with
these genes (see Figure 5.5). However, the low r squared values indicate that the correlation is
weak and there is no previous association of TRIB1 with NLRC4 and MRPS21. Therefore, a
deeper investigation is required.
5.5. Limitations of the study
Although the association between TRIB1 SNPs and miRNAs has not been investigated before,
the work presented in this Chapter has some limitations. First, we used only one miRNA-target
prediction tool, miRanda, employing “relaxed” settings. On one hand, this allowed us to detect
non-canonical binding sites which are recently emerging as functional. In fact, the non-
canonical interaction that we have tested in vitro were functional, despite the small effect on
the gene reporter activity (approximately 15%). On the other hand, miRanda is usually
associated with a high number of false positives, so applying stringent parameters (i.e. reduce
free energy threshold) and a second screening with a different algorithm (i.e. TargetScan) could
improve the accuracy of the output, by reducing the number of positive interactions and
narrowing down the list of SNPs and miRNAs. This will perhaps add a number of miRNA-
binding sites abolished by the presence of SNPs, which we have not detected using miRanda
algorithm. However, also the output generated by PolymiRTS do not show any abolished
interaction for any of the minor alleles. We could further improve this analysis, by filtering the
list of miRNA sequences and selecting only high-confidence miRNAs, which have been
recently added in miRbase database, the “home” of miRNAs

170
(ftp://mirbase.org/pub/mirbase/CURRENT/). In fact, some of the novel miRNAs associated
with TRIB1 SNPs are not confidentially annotated and often there is no knowledge about them.
The second limitation of this study was the limited access to publicly available data and, above
all, the lack of web-based tools enabling the correlation between miRNAs and their targets in
a given tissue/disease using pre-existing data. For this reason, we could not investigate whether
a correlation between TRIB1/rs62521034 and miR-29a-3p exists and if it could have an impact
in acute myeloid leukaemia or in other types of cancer (see Table 5.4). Moreover, despite being
confident about the identification of the two novel trans-eQTLs, we need more robust and
convincing data. A good pilot experiment to understand whether those genes are somehow
related will be a siRNA-mediated knockdown of TRIB1, followed by RT-qPCR and western
blot for NLRC4 and MRPS21 gene and protein expression. Also, it would be useful to correlate
the mRNA expression of TRIB1, NLRC4 and MRPS21 using different public transcriptomic
data and perform an eQTL mapping.
171
Chapter 6. miRNAs targeting TRIB1 in Prostate Cancer
Declaration
The work presented in this chapter came from my own idea of integrating my PhD project into
the main interest of the TRAIN ITN Consortium: investigating the role of Tribbles in the
biology of prostate cancer. Both the in silico and in vitro part of this chapter have been entirely
performed by me. A huge thanks to Swapna Satam and Ziyanda Shologu for sending me RNA
samples from prostate cancer cell lines and also to Dr Alessandra Iscaro for giving me prostate
tissues from mice.
Abstract
Prostate cancer (PCa) is one of the most common male cancers in the western world with a
poor long-term prognosis. Current treatment for PCa is based on a combination of endocrine
therapy, radical prostatectomy, standard cycles of chemotherapy and radiotherapy. However,
as the disease progresses the majority of patients experience relapse. Hence, the identification
of new molecular targets and the development of new therapeutic strategies is critical. It is well
established that microRNAs (miRNAs) have pivotal roles in PCa development and
progression, as they are frequently silenced by epigenetic modifications, thus perturbing the
expression of multiple genes. Recent studies have shown that the pseudo-kinase Tribbles-1
(TRIB1) plays a crucial role in the proliferation and propagation of PCa. TRIB1 mRNA is
overexpressed in PCa and regulates the ER chaperone GRP78, essential for prostate
tumorigenesis. However, the mechanisms behind TRIB1 upregulation remain unclear. Here we
investigate the potential association between TRIB1 overexpression and miRNA silencing in
PCa, using both bioinformatics and experimental tools. Our results confirmed that TRIB1 is
overexpressed in PCa cell lines, compared to cells derived from normal prostatic epithelium,
as well as in a murine prostate cancer model. We identified 140 downregulated miRNAs in
PCa and 21 of them are predicted to target the 3’UTR of TRIB1. We showed that miR-132-3p,
an onco-suppressor miRNA, has two functional binding sites for the 3’UTR of TRIB1. miR-
132-3p was able to negatively modulate TRIB1 expression in vitro, inducing a gene expression
profile that recapitulated the TRIB1 knockdown phenotype. The latter was associated with
changes in the expression of pro-inflammatory cytokines and tumour-related genes. The
overexpression of TRIB1 in PCa may be explained by the downregulation of endogenous
miRNAs, thus offering an interesting, novel therapeutic target. Further work is needed to
investigate the role of additional microRNAs and their impact on PCa biology.

172
6.1. Introduction
PCa overview
Prostate cancer (PCa) is one of the most common solid cancers in elderly males worldwide.
Each year over 1,500,000 men are diagnosed with PCa and over 360,000 men die (Rawla et
al., 2019). Established risk factors for PCa are age, genetics and family history, bad eating
habits, sedentary life and lack of physical activity and also ethnicity. It has been reported that
for African-American men both the incidence and mortality rates are higher compared to white
men (Rawla et al., 2019). The causes of this are not fully understood, but likely due to genetic
diversity (Huang et al., 2017). PCa is a slow-growing tumour: it starts in the prostate gland but
over time it can spread throughout the body, most often in the bones and in lymph nodes. In
patients affected by PCa, metastasis is the main cause of death (Rycaj et al., 2017). From a
pathological point of view, the majority of PCa (>95%) consist of adenocarcinomas, which is
a tumour developing in the gland cells (Alizadeh et al., 2014). Although the majority of cases
are asymptomatic, patients suffering from PCa mainly experience urinary symptoms and sexual
dysfunction (Merriel et al., 2018). Treatment of PCa usually depends on the stage of the
disease. For years, androgen deprivation therapy (ADT), via both surgery and drugs, was the
gold standard for the treatment of both early stages and advanced metastatic PCa and it has
also been successfully combined with radiation therapy (Gomella et al., 2010). However,
hormone suppression treatment inevitably leads to the development of castration-resistance
within 18-36 months (Nakazawa et al., 2017) and recently this treatment has also been
associated with the risk of developing dementia and Alzheimer disease (Jayadevappa et al.,
2019). Therefore, further treatments are needed. At the moment available options include
chemotherapy, radiotherapy, immunotherapy, cryosurgery and high-intensity focused
ultrasound therapy (HIFU) (Vieweg et al., 2007, Rodriguez et al., 2014, Chaussy et al., 2017,
Nakazawa et al., 2017). Immunotherapy and vaccines-based therapies are particularly
promising in the treatment of PCa, because it naturally progresses slowly and provides enough
time to activate immune responses (Janiczek et al., 2017): for example, the vaccine Sipuleucel-
T (Provenge®) has been associated with an increased survival of patients with castration-
resistant PCa, reducing the risk of mortality by 22% (Kantoff et al., 2010). The vaccine targets
the prostatic acid phosphatase (PAP) which is upregulated in PCa and correlates with a poor
prognosis and survival (Kantoff et al.,2010, Kong et al., 2013, Janiczek et al., 2017).
173
Genetics of PCa
PCa is one of the most heterogeneous cancers and no single gene is responsible for it (Yadav
et al., 2018). However, numerous genetic aberrations have been associated with primary and
metastatic tumours, including mutations in the genes coding for androgen receptor (AR),
phosphatase and tensin homolog (PTEN), proto-oncogene Myc (MYC), erythroblast
transformation specific (ETS)-transcription factor (ERG), Homeobox Protein NK-3 Homolog
A (NKX3-1), adenomatous polyposis coli (APC), breast cancer susceptibility genes (BRCA1
and BRCA2), ATM Serine/Threonine Kinase (ATM) and Speckle Type BTB/POZ Protein
(SPOP) (Wang et al., 2018). It has been reported that the mutational burden in PCa is lower
compared to other cancers. In fact, a recent genome cancer study showed that in PCa the
median mutation frequency per megabase is lower (0.7) when compared to other malignancies
(i.e. for bladder cancer is 7.1) (Lawrence et al., 2014). Besides genetic mutations, a large
number of epigenetic modifications, including DNA and histone modifications, have been
identified in PCa (Baumgart et al., 2017), as well as SNPs (Benafif et al., 2018). Interestingly,
SNPs have been associated not only with the risk of developing PCa but also with cancer
aggressiveness, survival and mortality (Sullivan et al., 2015, Benafif et al., 2018, Moya et al.,
2018).
Downregulation of microRNAs in PCa
Aberrant expression of microRNAs (miRNAs) has been implicated in the development and
progression of many cancers, including PCa (Vanacore et al., 2017). miRNAs control the
expression of genes involved in proliferation and apoptosis, thus acting as oncogenes and
tumour suppressors (Zhang et al., 2007). However, in PCa the majority of miRNAs appear to
be downregulated and most often silenced by epigenetic modifications (Ozen et al., 2007,
Coppola et al., 2010, Ramassone et al., 2018). Formosa and colleagues observed that miR-18b,
miR-132, miR-34b/c, miR-148a, miR-450a and miR-542-3p were downregulated in PCa
specimens compared to control samples and this was associated with promoter CpG island
methylation, unmasked by 5-aza-2′-deoxycytidine treatment (Formosa et al., 2013). In
particular, miR-132-3p has been shown to simultaneously target the 3’UTR of heparin-binding
epidermal growth factor (HB-EGF) and TALIN2, thus impairing cellular motility, adhesion
and proliferation (Formosa et al., 2013). HB-EGF and TALIN2 are usually overexpressed in
PCa supporting invasion and metastasis (Ongusaha et al., 2004, Desiniotis et al., 2011)
Similarly, the miR-145 promoter region is methylated in both tumour samples and prostate
cancer cell lines and its loss correlates with a poor survival of PCa patients (Zaman et al., 2010,

174
Avgeris et al., 2013). Other examples of silenced miRNAs in PCa are miR-338-5p and miR-
421, which have been shown to target the 3’UTR of SPINK1 (Serine Peptidase Inhibitor Kazal
Type 1) (Bhatia et al., 2019), a gene usually upregulated in PCa and responsible for a more
aggressive cancer subtype (Tomlins et al., 2008). The downregulation of miRNAs can be an
important mechanism underlying the overexpression of genes involved in the prostate
carcinogenesis, which are not necessarily altered by genetic mutations. Therefore, identifying
and restoring the expression of de-regulated miRNAs could be a good approach to reduce the
level of oncogenes and increase the expression of tumour suppressor genes.
The potential role of TRIB1 in PCa
As briefly explained in Chapter 1 (General Introduction), the TRIB1 gene has been implicated
in PCa. To date only a few studies have been published covering this topic. Mashima and
colleagues reported that TRIB1 was upregulated in prostate clinical tissues and in PCa cell line
spheroid cultures (3D condition), compared to adherent cultures (2D condition). TRIB1
knockdown was associated with a decrease in cell proliferation, while TRIB1 overexpression
increased tumour cells growth; by employing a soft agar assay, they also showed that TRIB1
knockdown impaired colony formation, while its overexpression significantly enhanced it.
Moreover, overexpression of TRIB1 was linked to a significant reduction in the expression
level of endoplasmic reticulum (ER) chaperones, including GRP78, GRP94 and GRP170
(Mashima et al., 2014). These are well known to promote carcinogenesis (Gutiérrez et al.,
2014). Taken together these data suggest a fundamental role for TRIB1 in the growth and
survival of PCa. However, no mutations in the gene have been described as causative of PCa
and no mechanisms have been found responsible for its upregulation. However, a short tandem
repeat (STR) was found in the 3’UTR of TRIB1 and it was significantly associated with
prostate cancer risk and aggressiveness (Moya et al., 2018). The authors suggested that this
STR could alter TRIB1 mRNA structure and stability, which in turn could affect TRIB1
expression in an allelic-dependent manner and it could also be linked to miRNA activity (Moya
et al., 2018). Other evidence supporting the role of TRIB1 in PCa comes from the work
published by Lin and colleagues in 2014: they found that TRIB1 is a direct target of miR-224,
a miRNA downregulated in PCa. By forcing the expression of miR-224 in PCa cell lines, they
observed a decrease in cell proliferation, invasion and migration which was TRIB1-dependent
(Lin et al., 2014).

175
6.2. Hypothesis and aim of the study
The dysregulation of onco-suppressor miRNAs plays a central role in the development and
progression of PCa. This is particularly true for miRNAs silenced by epigenetic modifications
(i.e. promoter hypermethylation) that, in turn, cause the overexpression of their target genes.
TRIB1 exerts an oncogenic role in PCa but the mechanisms underlying its upregulation are
still unknown. Therefore, we hypothesize that the overexpression of TRIB1 gene in PCa is due
to the downregulation of multiple microRNAs. The purpose of this study is to in silico identify
and characterize downregulated miRNAs that potentially binds to the 3’UTR of TRIB1, post-
transcriptionally regulating the gene.

176
6.3. Results
6.3.1. Data mining of PCa datasets: cBioPortal for Cancer Genomics
To understand the extent of TRIB1 contribution to PCa, we first carried out a data mining
analysis using the cBioPortal for Cancer Genomics (https://www.cbioportal.org/). We
investigated TRIB1 genomic alterations frequency, mRNA expression and overall survival in
PCa patients, selecting 20 different studies for a total of 5051 patients and 5315 samples (details
listed in Table 6.1.). 4952 of 5051 patients were profiled and TRIB1 alterations were found in
383 patients and in 414 samples, thus accounting for the 8% of the integrated dataset (Figure
6.1.). TRIB1 genomic alteration frequency was calculated in 15 of 20 datasets and ranged from
40% (Neuroendrocrine Prostate Cancer, Multi-Institute, Nat Med 2016) to 1.75% (Prostate
Adenocarcinoma, Broad/Cornell, Cell 2013) (Figure 6.2. A). When we filtered based on
cancer type, TRIB1 was mostly mutated in castration-resistant PCa (41.43%) and
neuroendrocrine PCa (31.48%) (Figure 6.2. B) However, in all cases the most abundant
alteration was genomic amplification. Transcriptomic data were available for 3 of 20 selected
studies, consisting of tumour/normal pairs (baseline, normal = 0) and showed overexpression
of TRIB1 mRNA, even in the absence of genomic amplification (Figure 6.2. C). Finally, the
overall survival (Kaplan-Meier estimate, calculated in 7 of 20 studies) showed a significant (p
= 2.27e-13) decrease in the survival of TRIB1 positive patients, compared to TRIB1 negative
patients (Figure 6.3.).

177
Table 6.1. cBioPortal for Cancer genomics: selected studies
Twenty published studies were selected from cBioPortal for Cancer Genomics (2012-2019),
they include genomic, transcriptomic and clinical data obtained from metastatic prostate
carcinoma, metastatic prostate adenocarcinoma, prostate adenocarcinoma-derived organoids
and neuroendocrine prostate cancer (https://www.cbioportal.org/).
Combined Studies from cBioPortal for Cancer Genomics Number of Patients
Metastatic Prostate Adenocarcinoma (MCTP, Nature 2012) 119
Metastatic Prostate Adenocarcinoma (SU2C/PCF Dream Team, PNAS 2019) 429
Metastatic Prostate Cancer (SU2C/PCF Dream Team, Cell 2015) 150
Neuroendocrine Prostate Cancer (Multi-Institute, Nat Med 2016) 81
Prostate Adenocarcinoma (Broad/Cornell, Cell 2013) 82
Prostate Adenocarcinoma (Broad/Cornell, Nat Genet 2012) 123
Prostate Adenocarcinoma (CPC-GENE, Nature 2017) 477
Prostate Adenocarcinoma (Fred Hutchinson CRC, Nat Med 2016) 63
Prostate Adenocarcinoma (MSKCC, Cancer Cell 2010) 238
Prostate Adenocarcinoma (MSKCC, PNAS 2014) 104
Prostate Adenocarcinoma (MSKCC/DFCI, Nature Genetics 2018) 1013
Prostate Adenocarcinoma (SMMU, Eur Urol 2017) 65
Prostate Adenocarcinoma (TCGA, Cell 2015) 334
Prostate Adenocarcinoma (TCGA, Firehose Legacy) 500
Prostate Adenocarcinoma (TCGA, PanCancer Atlas) 494
Prostate Adenocarcinoma Organoids (MSKCC, Cell 2014) 7
Prostate Cancer (DKFZ, Cancer Cell 2018) 292
Prostate Cancer (MSK, 2019) 10
Prostate Cancer (MSKCC, JCO Precis Oncol 2017) 451
The Metastatic Prostate Cancer Project (Provisional, December 2018) 19

178
Figure 6.1. Screenshot of cBioPortal for Cancer Genomics showing the summary of
TRIB1 alterations in PCa
The figure is a screenshot taken from cBioPortal for Cancer Genomics: 4952 of 5051 patients
were profiled for TRIB1 and alterations were found in 383 patients and in 414 samples (8%).
The major alteration is gene amplification (https://www.cbioportal.org/).

179
Figure 6.2. Data mining of PCa datasets show TRIB1 gene amplification
TRIB1 gene frequency alterations in 19 of 20 selected studies (A); TRIB1 gene frequency
alterations filtered base on cancer types (4 of 5 categories shown) (B); TRIB1 RNA expression
profile (RNA-seq) of 6 of 20 studies also showing the type of mutations (C). Graphs generated
by cBioPortal for Cancer Genomics. CNA: copy number alterations; VUS: variance of
uncertain significance (https://www.cbioportal.org/).
A B
C

180
Figure 6.3. Overall Survival Kaplan-Meier estimate
Overall survival Kaplan-Meier estimate of prostate cancer cases with (red) and without (blue)
TRIB1 alterations, calculated by cBioPortal for Cancer Genomics, shows a significant decrease
in survival of patients between the two groups. However, the survival data of patients coming
from different studies may have been defined by different criteria. Graph generated by
cBioPortal for Cancer Genomics (https://www.cbioportal.org/).

181
6.3.2. Assessment of TRIB1 gene expression in human and mouse models of
PCa by RT-qPCR
Next, we characterized the endogenous expression of TRIB1 mRNA in a panel of prostate
cancer cell lines (described briefly in Table 6.2.) by using RT-qPCR. TRIB1 expression was
significantly higher in PC3 (4-fold change, p < 0.0001), 22RV1 (3-fold change, p = 0.03) and
LNCAP (2-fold change, p = 0.02) but not in DU145, which shows a TRIB1 expression similar
to the controls (p > 0.9) (Figure 6.4. A) We also measured the level of murine Trib1 mRNA,
isolated from prostate tumour of wild-type NU/J mice injected with either LNCAP cells or PBS
as control (intra-prostatic injections). The cancer was allowed to grow for 30 days and prior to
the RNA isolation, tumour development was assessed by gross examination. Despite LNCAP
being human cells, Trib1 mRNA levels were significantly increased in LNCAP injected mice,
compared to PBS control (p = 0.03) (Figure 6.4. B), suggesting that the tumour development
and growth itself in the prostate gland may be responsible for upregulating Trib1 mRNA. We
also checked the murine Trib1 RT-qPCR primers’ target specificity by using the web-based
tool BLAST (https://www.ncbi.nlm.nih.gov/tools/primer-blast/). As shown in Figure 6.5.,
Trib1 primers specifically amplified the Trib1 mouse gene and not the human one, which does
not come up as “predicted” off-target. A predicted off target activity of the primers is for the
transcript variant X7 of the human gene FER1L6, but with 4 nucleotides mis-matches in both
the forward and the reverse strands, therefore this is unlikely to happen.
Table 6.2. Overview of the human prostate cell lines used in the present study
A total of seven cell lines has been used: three metastatic cancer cells (PC3, DU145 and
LNCAP), one xenograft (22RV1) and three immortalised epithelial cells derived from normal
prostatic tissue (PWRE1, RWPE1 and PNT1A). PC3, DU145 and PNT1A do not express or
express at low levels the androgen receptor. LNCAP cells have also been used to generate a
prostate cancer mouse model (see Figure 6.3 C).
Cell line Characteristics Androgen Receptor
PC3 Human Prostatic Adenocarcinoma, Bone Metastasis -
DU145 Human Prostatic Adenocarcinoma, Brain Metastasis -
LNCAP Human Prostate Carcinoma, Lymph Nodes Metastasis +
22RV1 Human Prostate Carcinoma, Xenograft +
PWRE1 Human Prostatic Epithelial Cells, Normal +
RWPE1 Human Prostatic Epithelial Cells, Normal +
PNT1A Human Prostatic Epithelial Cells, Normal -

182
Figure 6.4. Assessment of TRIB1 RNA expression in human and mouse models of PCa
Relative level of TRIB1 RNA normalised to the housekeeping GAPDH in a panel of prostate
cell lines (normal vs cancer) (mean ± SEM, Ordinary One Way Anova, n =3-6 , **** p<0.0001
** p<0.002, * p<0.05, ns p>0.05) (A); relative level of murine Trib1 RNA normalised to the
housekeeping Gapdh in prostate tissue from control mice and prostate tumour from mice
injected with LNCAP cells (normal vs tumour) (mean ± SEM, unpaired t-test, n =4-11, *
p<0.05) (B); schematic illustration of the prostate cancer mouse model, obtained by injecting
human cancer cells (LNCaP) in wild-type NU/J mice (C).
Control Mice PCa Mice0
1
2
3
4
Tri
b1 R
NA
Levels
Rela
tive t
o G
ap
dh
*
PWRE1
RW
PE-1
PNT1A
PC3
DU145
LNCA
P
22RV1
0
1
2
3
4
5
TR
IB1 R
NA
Levels
Rela
tive t
o G
AP
DH
ns
****
Normal prostatic epithelium Cancer
**
*
7 weeks old male mice
LNCaP cells injected into prostate gland
300 DAYS
Mice culled;prostate gland and prostatetumour collected for RNA isolation
A B
C

183
Figure 6.5. Assessment of murine Trib1 primers’ target specificity using BLAST Primers
tool
The figure is a screenshot taken from the BLAST Primers tool
(https://www.ncbi.nlm.nih.gov/tools/primer-blast/), showing the specificity of murine Trib1
RT-qPCR primers.

184
6.3.2. Identification of downregulated miRNAs potentially targeting TRIB1
Once established that TRIB1 is amplified and overexpressed in different PCa datasets and
upregulated at the RNA level in human and mouse models of PCa, we investigated whether
miRNAs downregulated in PCa target the 3’UTR of TRIB1, causing its overexpression. We
used miRCancer database (October 2019 release) (http://mircancer.ecu.edu/index.jsp) and
found that a total of 168 distinct miRNAs are dysregulated in different models of PCa: 133 of
168 are downregulated, while 51 are upregulated (complete list is in Chapter 8, Appendix V).
However, 16 miRNAs are listed as either down or up-regulated, according to different studies.
We focused on the downregulated miRNAs and among them we found 21 miRNAs predicted
to target TRIB1 according to three different miRNA-target prediction tools (miRanda,
TargetScan and StarBase), as explained in Chapter 2 (Figure 6.6.). Table 6.3. lists the
candidate miRNAs targeting TRIB1 and relevant publications. To understand the potential
biological impact of these miRNAs on TRIB1, we further analysed the output generated by
TargetScan (version 7.2, released in March 2018), shown in Table 6.4. with a description of
the scores and the main parameters of the algorithm in the table legend. All miRNAs are
predicted to bind to the 3’UTR of TRIB1 and some of them have two different binding sites
(let-7a-3p, miR-23a-3p, miR-101-3p, miR-130a-5p, miR-132-3p, miR-150-3p, miR-212-3p).
They are characterized by a seed region pairing of 7-8 nucleotides (7-8mers) with different
conformations (7mers 1A and M8). These two types of seed region strongly correlate with
targeting efficiency and are selectively conserved (Friedman et al., 2009). The context++ and
the weighted context++ scores, which are predictive of the efficicacy of the sites (Agarwal et
al., 2015) are low, negative numbers, suggesting a great predicted activity for all miRNAs. In
addition, all the miRNAs, expect for let-7a-3p, show a good context++ score percentile ranging
from 62 to 99, suggesting that these sites on TRIB1 are more favourable than other sites of the
same miRNA family. In fact, the context++ score percentile represents the percentile rank of
each site compared to all sites of the same miRNA family: values between 50 and 100 indicates
that that specific site is more favourable than most other sites of the same miRNA family. The
context++ branch length, representing the site conservation, is also good, particularly for miR-
23a-3p, miR-23b-3p, miR-101-3p, let-7a-5p, let-7c-5p and miR-144-3p (threshold: 8mer >=
1.8; 7mer-m8 >= 2.6; 7mer-1A >= 3.6). Finally, the PCT, calculated from the context++ branch
length, indicates that some interactions are conserved due to their biological relevance.
However, the algorithm calculates this only for highly conserved miRNA families. We
previously have showed that miR-132-3p and miR-101-3p are able to modulate TRIB1

185
expression in both human and murine macrophages and miR-101/TRIB1 interaction was
experimentally validated in our lab (see Chapter 3). Similarly, miR-224 was shown to modulate
TRIB1 in a 3D model of PCa by Lin and colleagues (Lin et al., 2014). Therefore, we assessed
the expression of these three miRNAs in prostate cancer cell lines by RT-qPCR. Consistent
with published data, all the miRNAs were downregulated in cancer cells compared to control
cells. miR-132-3p and miR-224-5p downregulation was the most robust in all cancer cell lines
and miR-224-5p was not detected in PC3 and 22RV1 cell lines. miR-101 was significantly
downregulated in PC3 (p = 0.04), but not in DU145, LNCAP and 22RV1 (p = 0.7, p = 0.10, p
= 0.09) (Figure 6.7.). We next focused on the validation of miR-132-3p/TRIB1 interaction.
Figure 6.6. Identification of downregulated miRNAs targeting TRIB1
miRCancer database was used to identify dysregulated miRNAs in PCa. A total of 162
miRNAs was found to be altered: 133 of 168 are downregulated, 51 of 168 are upregulated and
16 have been reported by several groups to be either down- or upregulated. Among the
downregulated miRNAs, we found 21 potential regulators of TRIB1 gene, which have been
previously associated with other targets in PCa. The miR-target prediction analysis was carried
out considering interactions present in three different databases (miRanda, TargetScan and
StarBase).
168 dysregulated
miRNAs
miRCancer2019
133 downregulated
miRNAs
51 upregulated
miRNAs
21 miRNAs targeting
TRIB1
miRandaTargetScanStarBase
16Down- and
upregulated

186
Table 6.3. Candidate miRNAs downregulated in PCa and predicted to target the 3’UTR
of TRIB1
List of miRNAs downregulated in PCa, predicted to target TRIB1 according to three different
prediction tools (miRanda, TargetScan, StarBase) and relevant publications.
miRNAs Cancer Status Publications
hsa-let-7a Prostate Cancer Downregulated Dong et al., 2010, Tang et al., 2018
hsa-let-7c Prostate Cancer Downregulated Nadiminty et al., 2012
hsa-miR-101 Prostate Cancer Downregulated Hao et al., 2011, Chakravarthi et al., 2016, Huang et al., 2017
hsa-miR-10a Prostate Cancer Downregulated Mu et al., 2019
hsa-miR-129 Prostate Cancer Downregulated Xu et al., 2015, Xu et al., 2017
hsa-miR-130a Prostate Cancer Downregulated Ramalho-Carvalho et al., 2017
hsa-miR-132 Prostate Cancer Downregulated Formosa et al., 2013, Qu et al., 2016, Li et al., 2018
hsa-miR-144-3p Prostate Cancer Downregulated Zheng et al., 2018
hsa-miR-150 Prostate Cancer Downregulated Hong et al., 2019
hsa-miR-154 Prostate Cancer Downregulated Zhu et al., 2014
hsa-miR-212 Prostate Cancer Downregulated Borrego-Diaz et al., 2014, Ramalinga et al., 2015
hsa-miR-22 Prostate Cancer Downregulated Xin et al., 2016
hsa-miR-224 Prostate Cancer Downregulated Fu et al., 2015, Lin et al., 2014, Goto et al., 2014
hsa-miR-23a Prostate Cancer Downregulated Cai et al., 2015
hsa-miR-23b Prostate Cancer Downregulated Majid et al., 2012
hsa-miR-302a Prostate Cancer Downregulated Zhang et al., 2015
hsa-miR-330 Prostate Cancer Downregulated Lee et al., 2009, Mao et al., 2013
hsa-miR-3619-5p Prostate Cancer Downregulated Li et al., 2017
hsa-miR-372 Prostate Cancer Downregulated Kong et al., 2016
hsa-miR-373-3p Prostate Cancer Downregulated Qu et al., 2018
hsa-miR-382 Prostate Cancer Downregulated Zhang et al., 2016

187
Table 6.4. TargetScan miRNA-TRIB1 analysis output
TargetScan Human 7 output for candidate miRNAs targeting TRIB1 showing the binding site position
on the 3’UTR, the seed region type, the context++ score (CS), the context++ score percentile (CSP),
the weighted context++ score (WCS), the conserved branch length (CBL) and the probability of
conserved targeting (PCT). The CS for a specific site is the sum of the contribution of 14 features,
described by Agarwal et al., 2015: the lowest CS is the most favourable; the CSP is the percentile rank
of each site compared to all sites of the same miRNA family: values between 50 and 100 indicates that
that specific site is more favourable than most other sites of the same miRNA family. The WCS
represents the predicted efficacy of the sites: scores with lower negative values indicated greater
predicted activity (Nam et al., 2014). The CBL represents the site conservation (threshold: 8mer >= 1.8;
7mer-m8 >= 2.6; 7mer-1A >= 3.6). The PCT, calculated only for the highly conserved miRNA families,
ranges from 0 to 1 and it estimates that a site conserved to a particular branch length is conserved
because of its targeting activity; it is then a measurement of the biological relevance of the interactions,
as it correlates with the mean level of target destabilization, as reported by Friedman et al., 2009. The
higher the PCT, the higher the conservation and the biological relevance of the miRNA-target interaction.
miRNA 3'UTR position Seed type CS CSP WCS CBL Pct
hsa-let-7a-2-3p 1851-1857 7mer-m8 -0.14 86 -0.13 0.054 N/A
hsa-let-7a-3p 1113-1119 7mer-1A -0.01 25 -0.01 0.054 N/A
hsa-let-7a-5p 1518-1524 7mer-1A -0.22 78 -0.2 6.307 0.94
hsa-let-7c-3p 1538-1544 7mer-m8 -0.05 64 -0.05 1.01 N/A hsa-let-7c-5p 1518-1524 7mer-1A -0.22 78 -0.2 6.307 0.94
hsa-miR-101-3p.1 1526-1532 7mer-m8 -0.22 93 -0.21 4.444 0.84
hsa-miR-101-3p.1 1424-1430 7mer-1A -0.04 69 -0.04 3.274 0.22
hsa-miR-10a-5p 391-397 7mer-m8 -0.2 92 -0.2 1.351 < 0.1
hsa-miR-129-1-3p 1467-1474 8mer -0.43 99 -0.41 3.64 0.49
hsa-miR-130a-3p 630-636 7mer-1A -0.12 82 -0.11 1.817 < 0.1
hsa-miR-130a-5p 1662-1669 8mer -0.18 90 -0.17 6.643 0.63
hsa-miR-130a-5p 1869-1875 7mer-1A -0.08 74 -0.07 2.746 0.12
hsa-miR-132-3p 554-560 7mer-m8 -0.05 77 -0.05 1.369 < 0.1
hsa-miR-132-3p 1763-1769 7mer-m8 -0.1 86 -0.09 1.264 < 0.1
hsa-miR-144-3p 1423-1430 8mer -0.26 96 -0.24 3.196 0.28
hsa-miR-150-3p 79-85 7mer-1A -0.19 79 -0.19 0.054 N/A
hsa-miR-150-5p 250-256 7mer-m8 -0.15 95 -0.15 0.154 < 0.1
hsa-miR-150-5p 336-342 7mer-1A -0.2 97 -0.2 0.921 < 0.1
hsa-miR-154-5p 1635-1641 7mer-m8 -0.06 65 -0.05 2.541 N/A
hsa-miR-212-3p 554-560 7mer-m8 -0.03 67 -0.03 1.369 < 0.1
hsa-miR-212-3p 1763-1769 7mer-m8 -0.1 86 -0.09 1.264 < 0.1
hsa-miR-22-3p 458-464 7mer-m8 -0.13 78 -0.13 0 < 0.1
hsa-miR-224-5p 157-163 7mer-m8 -0.19 94 -0.19 2.321 N/A
hsa-miR-23a-3p 1662-1669 8mer -0.21 91 -0.19 6.643 0.63hsa-miR-23a-3p 1869-1875 7mer-1A -0.07 70 -0.06 2.746 0.12
hsa-miR-23a-5p 221-227 7mer-m8 -0.29 96 -0.29 0 N/A
hsa-miR-23b-3p 1662-1669 8mer -0.21 91 -0.19 6.643 0.63hsa-miR-23b-5p 221-227 7mer-m8 -0.3 93 -0.3 0 N/A
hsa-miR-302a-3p 680-687 8mer -0.18 91 -0.17 1.727 < 0.1
hsa-miR-330-3p 947-954 8mer -0.03 65 -0.03 0.091 N/A hsa-miR-330-5p 1281-1287 7mer-1A -0.07 68 -0.06 2.089 N/A
hsa-miR-3619-3p 1027-1033 7mer-m8 -0.1 81 -0.1 0 N/A
hsa-miR-3619-5p 114-120 7mer-1A -0.09 78 -0.09 0.348 N/A hsa-miR-372-3p 680-687 8mer -0.2 93 -0.19 1.727 < 0.1
hsa-miR-372-5p 169-175 7mer-m8 -0.02 63 -0.02 0.054 N/A
hsa-miR-373-3p 680-687 8mer -0.13 91 -0.12 1.727 < 0.1 hsa-miR-382-3p 1667-1673 7mer-m8 -0.16 93 -0.15 2.545 N/A

188
Figure 6.7. Assessment of candidate miRNAs expression in prostate cancer cell lines by
RT-qPCR
Relative abundance of miR-132-3p (A), miR-224-5p (B) and miR-101-3p (C) normalised to
the housekeeping U6 measured in a panel of prostate cancer cell lines by RT-qPCR (normal vs
cancer) (mean ± SEM, Ordinary One Way Anova, n =3-6, **** p<0.0001, *** p<0.0002, *
p<0.05, ns p>0.05). ND: not detected.
PW
RE1
RW
PE-1
PNT1A
PC3
DU14
5
LNCAP
22RV1
0.0
0.5
1.0
1.5
2.0
2.5
miR
-101 e
nd
og
en
ou
s e
xp
ressio
n
rela
tive t
o U
6 h
ou
sekeep
ing
Normal prostatic epithelium Cancer
*
ns
ns
ns
miR-101-3p
PW
RE1
RW
PE-1
PNT1A
PC3
DU14
5
LNCAP
22RV1
0.0
0.5
1.0
1.5
miR
-224 e
nd
og
en
ou
s e
xp
ressio
n
rela
tive t
o U
6 h
ou
sekeep
ing
Normal prostatic epithelium Cancer
**** ****
ND
ND
miR-224-5p
PW
RE1
RW
PE-1
PNT1A
PC3
DU14
5
LNCAP
22RV1
0.0
0.5
1.0
1.5
miR
-132 e
nd
og
en
ou
s e
xp
ressio
n
rela
tive t
o U
6 h
ou
sekeep
ing
Normal prostatic epithelium Cancer
**** **** *** ****
miR-132-3pA
C
B

189
6.3.3. Validation of miR-132-3p/TRIB1 interaction by gene reporter assay
According to TargetScan analysis, miR-132-3p has two binding sites for the 3’UTR of TRIB1.
Despite it not being well conserved (CBL is 1.3 for binding site 1 and 1.2 for binding site 2),
miR-132-3p/TRIB1 interaction shows a good CS; moreover, miR-132-3p is an established
onco-suppressor in PCa with multiple targets and it is normally silenced by promoter
hypermethylation. Table 6.5. lists the experimentally validated targets of miR-132-3p in the
context of PCa. To investigate whether miR-132-3p binds to the 3’UTR of TRIB1 we used a
dual luciferase reporter assay. We transiently transfected TRIB1 3’UTR renilla reporter
plasmid and a firefly reporter plasmid together with miR-132-3p mimic or miR-132-3p
inhibitor in HEK293T cell line. We observed that in the presence of the mimic the gene reporter
activity significantly decreased compared to the negative control (38% decrease, p=0.02)
(Figure 6.8. A), suggesting that the overexpression on miR-132-3p is responsible for TRIB1
3’UTR destabilization. Indeed, when miR-132-3p was inhibited there was a small increase of
the luciferase activity (10% increase), meaning that the inhibition of the endogenous miR-132-
3p enhanced TRIB1 expression. However, this was not statistically significant (p=0.09)
(Figure 6.8. B). We did not perform miR-132-3p binding site mutagenesis, therefore we
cannot conclude if the two binding sites are functional (see section 6.5. Limitations of the
study).

190
Table 6.5. Experimentally validated targets of miR-132-3p and their effect on PCa
The table lists miR-132-3p target genes which have been experimentally validated, along with
their biological effect in the context of PCa.
miR-132-3p target gene Downstream effect Reference
TALIN2 Impairment of cellular adhesion, cell death Formosa et al., 2013
HB-EGF Impairment of cellular adhesion, cell death Formosa et al., 2013
E2F5 Reduction of cancer cells viability, increase in apoptosis Li et al., 2018
GLUT1 Reduction of glycolysis and proliferation Qu et al., 2016
Figure 6.8. miR-132-3p/TRIB1 experimental validation
Relative luciferase activity measured in HEK293T cell line following 24 hours co-transfection
of TRIB1 3’UTR-renilla reporter, firefly reporter and miR-132-3p mimic (50nM) (A) and
inhibitor (25nM) (B) Total DNA transfected was 100ng/well (renilla/firefly readings, mean ±
SEM, unpaired t-test, n = 3-5, * p<0.05, ns p>0.05).
Control Mimic0
20
40
60
80
Rela
tive L
ucif
era
se A
cti
vit
y
(arb
itra
ry u
nit
s)
*
Control Inhibitor0
10
20
30
40
Rela
tive L
ucif
era
se A
cti
vit
y
(arb
itra
ry u
nit
s)
0.0908

191
6.3.4. Impact of miR-132-3p and TRIB1 on PC3 gene expression
To evaluate the impact of miR-132-3p on PCa, we transiently overexpressed the miRNA in
PC3 cell line by using a mimic and in parallel we knocked-down TRIB1 by using a siRNA.
Figure 6.9. shows the TRIB1 mRNA level following miR-132 overexpression (Figure 6.9. A)
and siRNA-mediated TRIB1 knockdown in PC3 cell line (Figure 6.9. B), which was reduced
by 60% (p=0.03) and 80% (p<0.0001), respectively. We then used the same RNA samples to
investigate the gene expression profile induced by either miR-132-3p mimic and TRIB1
knockdown and we found similar signatures. The genes we investigated are listed in Table
6.6.; all of them have been previously implicated in PCa biology, although the literature
presents opposing and controversial data. We chose IL-1, IL-6 and IL-8 to evaluate the
inflammatory status and PDL1, SPAR-C and VEGF as cancer-related genes for
immunoregulation, metastasis and angiogenesis. We observed that the mRNA levels of pro-
inflammatory cytokines IL-1, IL-6 and IL-8 increased in both conditions (Figure 6.10.).
Specifically, IL-1 significantly increased (1.4-fold change, p=0.004) in TRIB1 knockdown
cells and in PC3 overexpressing miR-132-3p (1.2-fold change, p=0.04) (Figure 6.10. A, D).
Both IL-6 and IL-8 mRNA expression was enhanced in TRIB1 knockdown samples (2.4-fold
change, p=0.001, 1.6-fold change, p=0.008, respectively) (Figure 6.10. E, F). This is in line
with what we have previously shown in macrophages in Chapter 3: TRIB1 manipulation
affected IL-6 and IL-8 expression and secretion. Similarly, in PC3 treated with miR-132-3p
mimic, IL-8 mRNA levels also increased (1.8-fold change, p=0.03), while the changes in IL-6
were not statistically significant (p=0.2). When we analysed the cancer genes, we also observed
similar signatures: the expression of SPAR-C was significantly increased in TRIB1 knockdown
cells by 1.6-fold change (p=0.01), but not in PC3 overexpressing miR-132-3p (p=0.5) (Figure
6.11. A, D); the expression of PD-L1 was significantly increased in both conditions
(knockdown 1.9-fold change, p=0.02; mimic 2-fold change, p=0.02) (Figure 6.11. B, E).
VEGF expression did not change in either condition (Figure 6.11. C, F).

192
Figure 6.9. Assessment of TRIB1 RNA expression by RT-qPCR after miR-132-3p
overexpression and TRIB1 knockdown in PC3 cell line
Relative TRIB1 RNA expression normalised to the housekeeping GAPDH, after 48 hours
overexpression of miR-132-3p (50 nM) (A) and 48 hours TRIB1 knockdown (50 nM) (B) in
PC3 cell line. Data are presented as mean SEM (n = 3-4, unpaired t-test, * p<0.05, **** p <
0.0001).
Table 6.6. List of genes analysed in transfected PC3 cell line
The table lists the genes we analysed in transfected PC3 cell line along with their expression
and function in PCa, according to published literature.
Gene Expression
in PCa
Role in PCa Reference
IL-1, Interleukin 1 +++ Pro-inflammatory, tumorigenic, pro-
metastatic
Liu et al., 2013,
Shahriari et al., 2017
IL-6, Interleukin 6 +++ Pro-inflammatory, multifunctional Culig et al., 2005, Nguyen
et al., 2014
IL-8, Interleukin 8 +++ Pro-inflammatory, tumorigenic and
pro-angiogenic
Kim et al., 2001, Guo et al.,
2017
SPAR-C, Secreted
Protein Acidic and
Cysteine Rich
Variable Controversial, inhibition/promotion of
metastasis
Thomas et al., 2000,
DeRosa et al., 2012, Ma et
al., 2017, Liu et al., 2018
PD-L1, Programmed
death-ligand 1
+++ Immunoregulatory, inhibition of anti-
tumour immunity
Gevensleben et al., 2015
VEGF, Vascular
Endothelial Growth
Factor
+++ Angiogenesis Botelho et al., 2010
Control Mimic0.00
0.01
0.02
0.03
0.04
0.05
TR
IB1 R
NA
Levels
Rela
tive to G
AP
DH
*
scramble siTRIB10.000
0.002
0.004
0.006
TR
IB1 R
NA
Levels
Rela
tive to G
AP
DH ****
A B

193
Figure 6.10. Impact of miR-132-3p and TRIB1 on pro-inflammatory cytokines in PC3
cell line
Relative RNA expression of pro-inflammatory cytokines IL-1, IL-6 and IL-8 normalised to
the housekeeping GAPDH, after 48 hours overexpression of miR-132-3p (50 nM) (A, B, C)
and 48 hours TRIB1 knockdown (50 nM) (D, E, F) in PC3 cell line. Data are presented as
mean SEM (n = 4, unpaired t-test, * p < 0.05, ** p < 0.005, **** p < 0.0001, ns p > 0.05).
IL-1b IL-8IL-6
A B C
D E F
Control Mimic0.045
0.050
0.055
0.060
0.065
IL-1
b R
NA
Levels
Rela
tive to G
AP
DH *
Control Mimic0.000
0.002
0.004
0.006
0.008
0.010
IL-6
RN
A L
evels
Rela
tive to G
AP
DH
p=0.2
Control Mimic0.0
0.1
0.2
0.3
IL-8
RN
A L
evels
Rela
tive to G
AP
DH
*
scramble siTRIB10.000
0.002
0.004
0.006
0.008
0.010
IL-6
RN
A L
evels
Rela
tive to G
AP
DH **
scramble siTRIB10.04
0.05
0.06
0.07
0.08
0.09
IL-1
b R
NA
Levels
Rela
tive to G
AP
DH **
scramble siTRIB10.00
0.05
0.10
0.15
IL-8
RN
A L
evels
Rela
tive to G
AP
DH
**

194
Figure 6.11. Impact of miR-132-3p and TRIB1 on cancer-related genes in PC3 cell line
Relative RNA expression of SPAR-C, PD-L1 and VEGF normalised to the housekeeping
GAPDH, after 48 hours overexpression of miR-132-3p (50 nM) (A, B, C) and 48 hours TRIB1
knockdown (50 nM) (D, E, F) in PC3 cell line. Data are presented as mean SEM (n = 4,
unpaired t-test, * p < 0.05, ** p < 0.005, ns p > 0.05).
Control Mimic0.00000
0.00002
0.00004
0.00006
0.00008
SP
AR
-C R
NA
Levels
Rela
tive to G
AP
DH p=0.5
scramble siTRIB10.00000
0.00005
0.00010
0.00015
SP
AR
-C R
NA
Levels
Rela
tive to G
AP
DH **
SPAR-C
scramble siTRIB10.0000
0.0002
0.0004
0.0006
0.0008
PD
L-1
RN
A L
evels
Rela
tive to G
AP
DH *
PDL-1
scramble siTRIB10.000
0.005
0.010
0.015
VE
GF
RN
A L
evels
Rela
tive to G
AP
DH p=0.5
VEGF
Control Mimic0.0000
0.0002
0.0004
0.0006
PD
L-1
RN
A L
evels
Rela
tive to G
AP
DH *
Control Mimic0.000
0.002
0.004
0.006
0.008
0.010
VE
GF
RN
A L
evels
Rela
tive to G
AP
DH p=0.8
A B C
D E F

195
6.4. Summary
Considering the high rates of incidence and mortality of PCa, the identification of new
molecular targets and therapeutic strategies appears critical (Rawla et al., 2019). A growing
number of cancer studies highlight the potential of miRNAs: given their ability to
simultaneously control the expression of multiple genes in virtually all animal tissues, miRNAs
represent attractive candidates through which we can modulate the expression of oncogenes
and tumour suppressor genes (Shah et al., 2016). It has been shown that in PCa the majority of
miRNAs are downregulated and often silenced by epigenetic modifications (Ozen et al., 2007,
Coppola et al., 2010, Ramassone et al., 2018). As a consequence, the expression of their target
genes increases. Here, we showed that TRIB1, an established oncogene in acute myeloid
leukemia (Röthlisberger et al., 2007) and in hepatocellular carcinoma (Ye et al., 2017), is
overexpressed in PCa and is a direct target of multiple downregulated/silenced miRNAs.
Previous work showed that TRIB1 is upregulated in PCa both in vitro and in vivo and it
supports prostate tumorigenesis via regulating ER chaperones (Lin et al., 2014, Mashima et al.,
2014, Moya et al., 2018). A short tandem repeat (STR) found in the 3’UTR of TRIB1 has also
been linked to PCa risk, aggressiveness and survival (Moya et al., 2018). Still, what is upstream
of TRIB1 overexpression in PCa remains unclear. In this study, we hypothesised that the
overexpression of TRIB1 in PCa can be explained by the downregulation of endogenous
miRNAs. Our bioinformatics analysis of published cancer datasets showed that the most
frequent alteration in TRIB1 is in genomic amplification; however, the gene is upregulated
even in the absence of amplification. This was consistent with what was observed by Mashima
and colleagues (Mashima et al., 2014). We showed that TRIB1 mRNA is overexpressed in
PC3, LNCAP and 22RV1 cancer cell lines, but not in DU145, compared to non-tumour
controls (PWRE1, RWPE1 and PNT1A); interestingly, we also found that murine Trib1 mRNA
tends to increase in mice injected with LNCAP cells, compared to control mice. LNCAP is a
human derived cell line and this suggests that there might be intrinsic, environmental factors
in the developed prostate tumour that, in turn, increase Trib1 transcription. However, this
should be investigated further, using different models and also by looking at Trib1 protein
levels. By using the miRCancer database and TargetScan prediction algorithm, we identified
21 downregulated miRNAs, predicted to target the 3’UTR of TRIB1 gene. The majority of
predicted interactions are characterized by good score alignment, free energy and phylogenetic
conservation, suggesting a potential biological relevance. We confirmed the downregulation
of two candidate miRNAs (miR-132-3p and miR-224-5p) in a panel of PCa cell lines and
196
controls by using RT-qPCR and we further substantiated the interaction between miR-132-3p
and TRIB1 through a luciferase gene reporter assay. We selected miR-132-3p as its expression
was significantly downregulated in all cancer cell lines and we previously showed that it is able
to modulate TRIB1 expression in human and murine macrophages (see Chapter 3). Moreover,
miR-132-3p is well appreciated to be a tumour suppressor miRNA and several targets in PCa
have already been experimentally validated (see Table 6.5). The gene reporter assay confirmed
that miR-132-3p mimic exerts a negative effect on the 3’UTR of TRIB1. However, inhibiting
miR-132-3p had no significant effect on gene reporter activity. This may be explained by the
variability of transfection efficiency and the low number of biological replicates (n = 3).
Although our in- silico prediction and luciferase assay data strongly suggest that miR-132-3p
binds to the 3’UTR of the pseudo-kinase, we cannot conclude that the 2 binding sites are
functional, due to the lack of mutagenesis experiment. Last, we evaluated the effect of both
miR-132-3p overexpression and TRIB1 knockdown on PC3 gene expression profile and
observed similar signatures. Specifically, the mRNA expression of IL-1, IL-6, IL-8, PD-L1
and SPAR-C is enhanced, suggesting that these genes might specifically respond to TRIB1
changes. We previously showed that overexpressing TRIB1 in human macrophages results in
the reduction of IL-6 and IL-8 and we observed the opposite effect in cells treated with miR-
101-3p mimic, regulator of TRIB1 (see Chapter 3). Furthermore, miR-132-3p has been already
shown to increase IL-8 expression, via directly targeting SirT1 (nicotinamide adenine
dinucleotide-dependent deacetylase) and modulating nuclear factor (NF) in adipocytes
(Strum et al., 2009). The expression of IL-1, IL-6, IL-8 is usually upregulated in PCa patients
and it has been associated with poor prognosis of PCa and tumorigenic activity (Kim et al.,
2001, Culig et al., 2005, Liu et al., 2013, Nguyen et al., 2014, Guo et al., 2017, Shahriari et
al., 2017). The immunoregulatory protein PD-L1 is also highly expressed in prostate cancer,
enabling the tumour to escape the immune system surveillance (Gevensleben et al., 2015),
while the role of SPAR-C appears to be controversial. In fact, SPAR-C has been implicated in
PCa and breast cancer bone metastasis with opposite effects: in PCa high expression of SPAR-
C is correlated with a bad prognosis and predicts metastasis progression (Thomas et al., 2000,
Derosa et al., 2012); in breast cancer it has been shown to inhibit migration and invasion (Ma
et al., 2017). Interestingly, Liu and colleague observed that SPAR-C is downregulated in PCa
by promoter hypermethylation and lower levels of SPAR-C mRNA and protein correlate with
a poorer prognosis (Liu et al., 2018).

197
In conclusion, we demonstrated that TRIB1 is a target of multiple downregulated miRNAs in
PCa that might represent the mechanisms behind TRIB1 overexpression. We experimentally
demonstrated that miR-132-3p is able to negatively modulate TRIB1 expression. Although we
observed similar transcriptional changes induced by miR-132-3p overexpression and TRIB1
knockdown, further experimental validation is needed to understand whether modulating
TRIB1 can be beneficial or detrimental for the biology of PCa. In fact, the genes we analysed
are considered “bad” for patient outcomes, despite the existence of controversial data (Said et
al., 2009, Kapinas et al., 2012, Shin et al., 2013). Considering the context-dependent function
of Tribbles proteins (see Chapter 1, section 1.3.3.) we do not exclude the possibility of a dual
role for TRIB1, as well as “stage” dependent function. Therefore, in vivo experiments are also
needed.
6.5. Limitations of the study
The work presented in this Chapter has some limitations. First of all, we have only tested miR-
132-3p, but it would be interesting to investigate the activity of additional miRNAs targeting
TRIB1, which are downregulated and/or silenced in PCa. This study was focussed on gene
expression and RNA, but in future it should be also supported with protein data. The interaction
between miR-132-3p and TRIB1 should be fully validated by involving the use of binding sites
mutants, as well as a target-site blocker. In addition, the impact of miR-132-3p and TRIB1
manipulation on gene expression should be tested in animal models to see whether it changes
in in vivo environments. More relevant genes should be included, as well as in vitro-based
assay (proliferation, invasion, metastasis) to investigate the influence of miRNAs and TRIB1
on cancer behaviour.

198
Chapter 7. General discussion and conclusions
The work described in this thesis explored, for the first time, the post-transcriptional regulation
of TRIB1 by miRNAs, with the main focus on macrophage and prostate cancer. By taking
advantage of bioinformatics and miRNA-target prediction tools, we identified multiple
miRNAs that could potentially target the 3’UTR of TRIB1, thus contributing to its variable
expression in different tissues, as well as its short half-life and context-dependent function.
Below we discuss the main findings of this research and their potential biological impact.
However, further work should be performed in the future, focussing on more mechanistic
investigations and in vivo models.
TRIB1 is recognised to play a major role in polarising macrophages, by regulating the
activation of the MAPK cascade and modulating the induction of inflammatory genes (Satoh
et al., 2013, Arndt et al., 2018). More recently, the pseudo-kinase has been associated with the
development and progression of prostate cancer (Lin et al., 2014, Mashima et al., 2014, Moya
et al., 2018, Liu et al., 2019). In fact, TRIB1 is highly expressed in prostate cancer, compared
to other types of malignancies (Su et al., 2001, Ramaswamy et al., 2003). It has been suggested
that the mechanism by which TRIB1 affects prostate tumorigenesis involves the regulation of
endoplasmic reticulum chaperone expression (Mashima et al., 2014). Nevertheless, whilst the
downstream effectors of TRIB1 are well characterised, the molecular mechanisms by which
TRIB1 expression itself is regulated are still largely unknown. TRIB1 mRNA has an unusually
long 3’UTR and has previously been reported to be highly unstable, having a half-life shorter
than 1 hour (Sharova et al., 2009, Soubeyrand et al., 2016). Therefore, we carried out a
systematic analysis and experimental validation of the concept that TRIB1 expression is
regulated via multiple miRNAs and that this, in turn, controls the expression of inflammatory
genes. We have focussed our research on macrophages and prostate cancer models. We have
shown that both human and murine TRIB1 are negatively regulated by miR-101-3p and miR-
132-3p. To address the biological impact of these miRNAs, we performed an enrichment
pathway analysis, using their predicted target genes. Among the top 10 enriched terms for miR-
101-3p target genes we observed MAPK and chemokines mediated signalling pathways; for
the genes targeted by miR-132-3p one of the most enriched term was prostate cancer. In fact,
miR-132-3p is a well-established onco-suppressor miRNA and in prostate cancer has been
shown to be silenced by DNA methylation (Formosa et al., 2013). Similarly, miR-101-3p has
been documented to play important roles in macrophages, for example by direct interaction

199
with ABCA1 (Zhang et al., 2015) and DUSP1 (Wei et al. 2015), thus controlling metabolic
and inflammatory responses. Both miRNAs have not been associated with the TRIB1 gene
before. We demonstrated that, via regulating TRIB1 expression, miR-101-3p and miR-132-3p
affect inflammatory gene induction in both cellular systems. Specifically, miR-101-3p caused
a significant increase in the expression of M1 macrophage markers, such as IL-6, IL-8, CD80
and CD86. However, it did not alter the levels of M2 polarisation markers. This suggests that
the negative effect of miR-101-3p on TRIB1 is enough to drive an inflammatory phenotype,
but not to switch off the genetic signatures typical of alternatively-activated macrophages. In
fact, it is believed that the knockdown effect exerted by miRNAs on their target genes is small
and seed region dependent (Liu et al., 2019). On the contrary, the experimental overexpression
of TRIB1 led to a robust increase of M2 macrophage markers, including CD163 and MSR-1.
On one hand this confirms the crucial transcriptional role of the pseudo-kinase in M2
polarisation; on the other hand, low levels of TRIB1 promote the induction of M1 genes.
Similarly, in PC3 cell line, forced expression of miR-132-3p led to an increase of pro-
inflammatory genes, including IL-8 and the cancer related gene PD-L1. We confirmed that this
was TRIB1-dependent, as the same directional changes were observed in cells treated with a
TRIB1 siRNA. It has already been shown that TRIB1 overexpression affects the immune
microenvironment of prostate cancer, promoting the infiltration of CD163+ macrophages (Liu
et al., 2019), but it has never been linked to the activity of PD-L1, which enables the tumour
to escape the immune system surveillance (Gevensleben et al., 2015). Therefore, our
preliminary findings should be validated in the future to address whether TRIB1 has a role in
influencing the immune escape, which is a well-known obstacle in cancer treatment.
Overall, the most consistent and robust effect of miRNAs regulating TRIB1 expression was
the upregulation of IL-8, assessed in both cellular systems. Previously, Kiss-Toth and
colleagues observed that TRIB1 was able to regulate the activity of the IL-8 promoter in a gene
reporter assay, but this was not explored further (Kiss-Toth et al., 2006). Similar to TRIB1, the
IL-8 gene is a key player in numerous inflammatory diseases and cancers (Russo et al., 2014,
Alfaro et al., 2017). Finding a link between the regulation of TRIB1 and IL-8 might be
beneficial for the development of novel therapeutics, including miRNA-based strategies.

200
Figure 7.1. miRNAs targeting TRIB1 in macrophages and prostate cancer
The figure summarises the main findings described in this thesis. The 3’UTR of TRIB1 is
enriched in miRNAs binding sites, detected by a systematic miRNA-target prediction analysis
(1); miR-101-3p, miR-132-3p and miR-214-3p regulate TRIB1 expression and function in
macrophages, thus altering the levels of pro-inflammatory cytokines (2); the onco-suppressor
miR-132-3p regulates TRIB1 expression and function in prostate cancer, altering the levels of
inflammatory and cancer-related genes (3).

201
A short research was conducted to investigate the impact of TRIB1 non-coding variants on
miRNA-binding sites. TRIB1 variants have been associated with plasma triglycerides and
cardiovascular disease risk by numerous independent studies (Kathiresan et al., 2008, Willer
et al., 2008, Teslovich et al., 2010, Deloukas et al., 2013, Nikpay et al., 2015, van der Harst et
al., 2018). However, nothing is known about the role of TRIB1 non-coding variants. The
majority of SNPs in the GWAS catalogue are located in non-coding regions of the genome
(Tak et al., 2015) and have been reported to be regulators of gene expression at the post-
transcriptional level (Hudson et al., 2003). It has been demonstrated that non-coding SNPs can
alter miRNA-mRNA interaction, by creating, abolishing or modifying their binding sites
(Moszyńska et al., 2017). This has been often linked to human diseases or traits, such as prostate
cancer (Stageman et al., 2015), coronary heart disease (Hu et al., 2016) and type 2 diabetes
(Goda et al., 2015). Here we reported that multiple SNPs located in the 3’UTR of TRIB1 are
predicted to alter miRNAs sites. By using a reporter assay, we demonstrated that 2 minor
alleles, rs62521034 C>T and rs56395423 A>C, have a significant negative impact on TRIB1
mRNA stability, thus potentially acting as cis-eQTLs for the TRIB1 gene. In fact, rs62521034
and rs56395423 are predicted to create novel binding sites for 10 miRNAs, which have not
been predicted to bind to the reference alleles. We validated as functional the interaction
between rs62521034 C>T and miR-29a/b. This could have a biological impact in the
pathogenesis and progression of multiple cancers, including acute myeloid leukaemia. In acute
myeloid leukaemia, TRIB1 acts as an oncogene by promoting the degradation of C/EBPα
(Dedhia et al., 2010). On the contrary, miR-29a/b is dysregulated and has been reported to
have an onco-suppressor role, targeting apoptosis, cell cycle and proliferation (Garzon et al.,
2009). Due to the lack of tools enabling the correlation between miRNAs and their targets in
a given tissue/disease using pre-existing data, we could not investigate whether a correlation
between TRIB1/rs62521034 and miR-29a/b exists and if it could have an impact in acute
myeloid leukaemia or in other types of cancer. Therefore, further investigations are needed.
In addition, by using the RNA microarray data produced by the Cardiogenics Consortium, we
identified two potential TRIB1 trans-eQTLs: rs3201475 (5’UTR) and rs62521034 (3’UTR)
were significantly associated with a small reduction in distant genes: NLRC4, activator of the
inflammasome and MRPS21, a mitochondrial ribosomal protein. So far, there is no association
between TRIB1 and these genes. However, considering the role of TRIB1 in inflammation
(Johnston et al., 2015) and mitochondrial dysfunction (Soubeyrand et al., 2013), this should
be further explored in the future.

202
Lastly, as a collaborative work, we performed a comprehensive, simultaneous analysis of
miRNAs and mRNAs in human polarised macrophages by using multiple RNA sequencing
experiments and downstream bioinformatics analysis. In fact, it is well established that
miRNAs are master regulators of macrophage polarisation and inflammatory responses,
controlling hundreds of key genes at the same time (Essandoh et al., 2010). However, the extent
of miRNA-mRNA networks in macrophage polarisation have not been explored in a
systematic, integrative manner. Here we have focussed on pro-inflammatory M1-like
macrophage transcriptomic signatures, looking at both miRNAs and mRNAs. First, by using a
small RNA seq, we detected 73 differentially expressed miRNAs between M0 and M1
macrophages, of which 47 were downregulated and 26 were upregulated. Among the
upregulated miRNA we observed miR-155-5p, which has been previously reported to play a
major role in regulating M1 macrophage polarisation (Jablonski et al., 2016). After identifying
candidate miRNAs differentially expressed between M0 and M1 macrophages, we performed
a target prediction analysis by using TargetScan. We filtered the list of target genes, selecting
only those expressed by macrophages, using an RNA seq previously generated in our group.
Interestingly, we found that 1573 genes upregulated in M1 polarised cells were predicted
targets of 44 miRNAs, which were rather downregulated. Similarly, 1790 downregulated genes
were predicted to be targeted by 26 upregulated miRNAs. This suggests that miRNAs
contribute to the dysregulation of more than half of the genes differentially expressed between
M0 and M1 polarised macrophages. Our pathway enrichment analysis indicated that the target
genes of downregulated miRNAs participate to cytokine and chemokine signalling pathways,
antigen presentation, T cell receptor signalling pathway, apoptosis, MAPK signalling pathway.
On the contrary, the target genes of miRNAs upregulated in M1 cells are involved in DNA
replication, cell cycle and metabolic pathways. Therefore, miRNAs control the two major
events of the M1 macrophage activation: immune response and cell cycle. This was also
consistent with a murine model of macrophage polarisation (Jiang et al., 2017), suggesting that
the target genes of the differentially expressed miRNAs are conserved between human and
mouse. In addition, our systematic approach allowed us to identify 9 miRNAs targeting more
than 500 genes, which we named “super regulators”. None of them have been associated with
this number of targets before. Therefore, we explored the effect of the experimental
overexpression of two “super regulators” (miR-125a-3p and miR-186-5p), including miR-155-
5p as a positive control, followed by an RNA-seq experiment. This was carried out on
unpolarised macrophage and compared to the differential expression analysis previously done
between M0 and M1 polarised cells. Although we did not observe many statistically significant

203
changes in gene expression, we did find gene overlapping and same directional changes. Gene
Ontology analysis confirmed that the genes downregulated in response to “super regulators”
miRNAs take part to the regulation of cell cycle and chromatin segregation. Taken together,
our results indicate the existence of a macrophage-specific targetome that underlie many of the
critical biological pathways involved in inflammation and in the classical activation of
macrophages. Future work will focus on the experimental validation of these findings. This
could certainly have an impact on the discovery and development of new strategies in the
treatment of chronic inflammatory diseases using miRNA-based therapies.

204
References
Abraham, S.M. and Clark, A.R. (2006). Dual-specificity phosphatase 1: a critical
regulator of innate immune responses. Biochem Soc Trans. 34(Pt 6), pp.1018-1023.
Agarwal, V., Bell, G.W., Nam, J.W. and Bartel, D.P. (2015). Predicting effective
microRNA target sites in mammalian mRNAs. Elife. 4.
Akira, S., Misawa, T., Satoh, T. and Saitoh, T. (2013). Macrophages control innate
inflammation. Diabetes Obes Metab. 15 Suppl 3, pp.10-18.
Alfaro, C., Sanmamed, M.F., Rodríguez-Ruiz, M.E., Teijeira, Á., Oñate, C., González,
Á., Ponz, M., Schalper, K.A., Pérez-Gracia, J.L. and Melero, I. (2017). Interleukin-8 in
cancer pathogenesis, treatment and follow-up. Cancer Treat Rev. 60, pp.24-31.
Alizadeh, M. and Alizadeh, S. (2014). Survey of clinical and pathological
characteristics and outcomes of patients with prostate cancer. Glob J Health Sci. 6(7
Spec No), pp.49-57.
Ambros, V. and Lee, R.C. (2004). Identification of microRNAs and other tiny
noncoding RNAs by cDNA cloning. Methods Mol Biol. 265, pp.131-158.
Ambros, V., Lee, R.C., Lavanway, A., Williams, P.T. and Jewell, D. (2003).
MicroRNAs and other tiny endogenous RNAs in C. elegans. Curr Biol. 13(10), pp.807-
818.
Arab, A., Karimipoor, M., Irani, S., Kiani, A., Zeinali, S., Tafsiri, E. and Sheikhy, K.
(2017). Potential circulating miRNA signature for early detection of NSCLC. Cancer
Genet. 216-217, pp.150-158.
Ardekani, A.M. and Naeini, M.M. (2010). The Role of MicroRNAs in Human Diseases.
Avicenna J Med Biotechnol. 2(4), pp.161-179.
Arndt, L., Dokas, J., Gericke, M., Kutzner, C.E., Müller, S., Jeromin, F., Thiery, J. and
Burkhardt, R. (2018). Tribbles homolog 1 deficiency modulates function and
polarization of murine bone marrow-derived macrophages. J Biol Chem. 293(29),
pp.11527-11536.
Aulchenko, Y.S., Ripatti, S., Lindqvist, I., Boomsma, D., Heid, I.M., Pramstaller, P.P.,
Penninx, B.W., Janssens, A.C., Wilson, J.F., Spector, T., Martin, N.G., Pedersen, N.L.,
Kyvik, K.O., Kaprio, J., Hofman, A., Freimer, N.B., Jarvelin, M.R., Gyllensten, U.,

205
Campbell, H., Rudan, I., Johansson, A., Marroni, F., Hayward, C., Vitart, V., Jonasson,
I., Pattaro, C., Wright, A., Hastie, N., Pichler, I., Hicks, A.A., Falchi, M., Willemsen,
G., Hottenga, J.J., de Geus, E.J., Montgomery, G.W., Whitfield, J., Magnusson, P.,
Saharinen, J., Perola, M., Silander, K., Isaacs, A., Sijbrands, E.J., Uitterlinden, A.G.,
Witteman, J.C., Oostra, B.A., Elliott, P., Ruokonen, A., Sabatti, C., Gieger, C.,
Meitinger, T., Kronenberg, F., Döring, A., Wichmann, H.E., Smit, J.H., McCarthy,
M.I., van Duijn, C.M., Peltonen, L. and Consortium, E. (2009). Loci influencing lipid
levels and coronary heart disease risk in 16 European population cohorts. Nat Genet.
41(1), pp.47-55.
Avgeris, M., Stravodimos, K., Fragoulis, E.G. and Scorilas, A. (2013). The loss of the
tumour-suppressor miR-145 results in the shorter disease-free survival of prostate
cancer patients. Br J Cancer. 108(12), pp.2573-2581.
Bardi, G.T., Smith, M.A. and Hood, J.L. (2018). Melanoma exosomes promote mixed
M1 and M2 macrophage polarization. Cytokine. 105, pp.63-72.
Bartel, D.P. (2004). MicroRNAs: genomics, biogenesis, mechanism, and function. Cell.
116(2), pp.281-297.
Bartel, D.P. (2009). MicroRNAs: target recognition and regulatory functions. Cell.
136(2), pp.215-233.
Bauer, R.C., Yenilmez, B.O. and Rader, D.J. (2015). Tribbles-1: a novel regulator of
hepatic lipid metabolism in humans. Biochem Soc Trans. 43(5), pp.1079-1084.
Baumgart, S.J. and Haendler, B. (2017). Exploiting Epigenetic Alterations in Prostate
Cancer. Int J Mol Sci. 18(5).
Benafif, S., Kote-Jarai, Z., Eeles, R.A. and Consortium, P. (2018). A Review of Prostate
Cancer Genome-Wide Association Studies (GWAS). Cancer Epidemiol Biomarkers
Prev. 27(8), pp.845-857.
Bernstein, E., Kim, S.Y., Carmell, M.A., Murchison, E.P., Alcorn, H., Li, M.Z., Mills,
A.A., Elledge, S.J., Anderson, K.V. and Hannon, G.J. (2003). Dicer is essential for
mouse development. Nat Genet. 35(3), pp.215-217.
Betel, D., Wilson, M., Gabow, A., Marks, D.S. and Sander, C. (2008). The
microRNA.org resource: targets and expression. Nucleic Acids Res. 36(Database issue),
pp.D149-153.

206
Bhatia, V., Yadav, A., Tiwari, R., Nigam, S., Goel, S., Carskadon, S., Gupta, N., Goel,
A., Palanisamy, N. and Ateeq, B. (2019). Epigenetic Silencing of miRNA-338-5p and
miRNA-421 Drives SPINK1-Positive Prostate Cancer. Clin Cancer Res. 25(9),
pp.2755-2768.
Bhattacharya, A., Ziebarth, J.D. and Cui, Y. (2014). PolymiRTS Database 3.0: linking
polymorphisms in microRNAs and their target sites with human diseases and biological
pathways. Nucleic Acids Res. 42(Database issue), pp.D86-91.
Billack, B. (2006). Macrophage activation: role of toll-like receptors, nitric oxide, and
nuclear factor kappa B. Am J Pharm Educ. 70(5), p102.
Bolger, A.M., Lohse, M. and Usadel, B. (2014). Trimmomatic: a flexible trimmer for
Illumina sequence data. Bioinformatics. 30(15), pp.2114-2120.
Borchert, G.M., Lanier, W. and Davidson, B.L. (2006). RNA polymerase III transcribes
human microRNAs. Nat Struct Mol Biol. 13(12), pp.1097-1101.
Borrego-Diaz, E., Powers, B.C., Azizov, V., Lovell, S., Reyes, R., Chapman, B.,
Tawfik, O., McGregor, D., Diaz, F.J., Wang, X. and Veldhuizen, P.V. (2014). A
potential regulatory loop between Lin28B:miR‐212 in androgen-independent prostate
cancer. Int J Oncol. 45(6), pp.2421-2429.
Bronte, V. and Zanovello, P. (2005). Regulation of immune responses by L-arginine
metabolism. Nat Rev Immunol. 5(8), pp.641-654.
Brookes, A.J. (1999). The essence of SNPs. Gene. 234(2), pp.177-186.
Broughton, J.P., Lovci, M.T., Huang, J.L., Yeo, G.W. and Pasquinelli, A.E. (2016a).
Pairing beyond the Seed Supports MicroRNA Targeting Specificity. Mol Cell. 64(2),
pp.320-333.
Bruno, A.E., Li, L., Kalabus, J.L., Pan, Y., Yu, A. and Hu, Z. (2012). miRdSNP: a
database of disease-associated SNPs and microRNA target sites on 3'UTRs of human
genes. BMC Genomics. 13, p44.
Bubendorf, L., Schöpfer, A., Wagner, U., Sauter, G., Moch, H., Willi, N., Gasser, T.C.
and Mihatsch, M.J. (2000). Metastatic patterns of prostate cancer: an autopsy study of
1,589 patients. Hum Pathol. 31(5), pp.578-583.

207
Caescu, C.I., Guo, X., Tesfa, L., Bhagat, T.D., Verma, A., Zheng, D. and Stanley, E.R.
(2015). Colony stimulating factor-1 receptor signaling networks inhibit mouse
macrophage inflammatory responses by induction of microRNA-21. Blood. 125(8),
pp.e1-13.
Cai, S., Chen, R., Li, X., Cai, Y., Ye, Z., Li, S., Li, J., Huang, H., Peng, S., Wang, J.,
Tao, Y., Wen, X., Mo, J., Deng, Z., Zhang, Y. and Gao, X. (2015). Downregulation of
microRNA-23a suppresses prostate cancer metastasis by targeting the PAK6-LIMK1
signaling pathway. Oncotarget. 6(6), pp.3904-3917.
Calin, G.A. and Croce, C.M. (2006). MicroRNA signatures in human cancers. Nat Rev
Cancer. 6(11), pp.857-866.
Chakravarthi, B.V., Goswami, M.T., Pathi, S.S., Robinson, A.D., Cieślik, M.,
Chandrashekar, D.S., Agarwal, S., Siddiqui, J., Daignault, S., Carskadon, S.L., Jing, X.,
Chinnaiyan, A.M., Kunju, L.P., Palanisamy, N. and Varambally, S. (2016). MicroRNA-
101 regulated transcriptional modulator SUB1 plays a role in prostate cancer.
Oncogene. 35(49), pp.6330-6340.
Chatterjee, S. and Pal, J.K. (2009). Role of 5'- and 3'-untranslated regions of mRNAs
in human diseases. Biol Cell. 101(5), pp.251-262.
Chaussy, C.G. and Thüroff, S. (2017). High-Intensity Focused Ultrasound for the
Treatment of Prostate Cancer: A Review. J Endourol. 31(S1), pp.S30-S37.
Chen, K., Song, F., Calin, G.A., Wei, Q., Hao, X. and Zhang, W. (2008).
Polymorphisms in microRNA targets: a gold mine for molecular epidemiology.
Carcinogenesis. 29(7), pp.1306-1311.
Chen, K.C., Wang, Y.S., Hu, C.Y., Chang, W.C., Liao, Y.C., Dai, C.Y. and Juo, S.H.
(2011). OxLDL up-regulates microRNA-29b, leading to epigenetic modifications of
MMP-2/MMP-9 genes: a novel mechanism for cardiovascular diseases. FASEB J.
25(5), pp.1718-1728.
Chen, Y. and Wang, X. (2020). miRDB: an online database for prediction of functional
microRNA targets. Nucleic Acids Res. 48(D1), pp.D127-D131.
Clària, J., González-Périz, A., López-Vicario, C., Rius, B. and Titos, E. (2011a). New
insights into the role of macrophages in adipose tissue inflammation and Fatty liver

208
disease: modulation by endogenous omega-3 Fatty Acid-derived lipid mediators. Front
Immunol. 2, p49.
Cobos Jiménez, V., Bradley, E.J., Willemsen, A.M., van Kampen, A.H., Baas, F. and
Kootstra, N.A. (2014). Next-generation sequencing of microRNAs uncovers expression
signatures in polarized macrophages. Physiol Genomics. 46(3), pp.91-103.
Comabella, M., Craig, D.W., Camiña-Tato, M., Morcillo, C., Lopez, C., Navarro, A.,
Rio, J., Montalban, X., Martin, R. and Group, B.S. (2008). Identification of a novel risk
locus for multiple sclerosis at 13q31.3 by a pooled genome-wide scan of 500,000 single
nucleotide polymorphisms. PLoS One. 3(10), pe3490.
Consortium, G. (2013). The Genotype-Tissue Expression (GTEx) project. Nat Genet.
45(6), pp.580-585.
Consortium, W.T.C.C. (2007). Genome-wide association study of 14,000 cases of
seven common diseases and 3,000 shared controls. Nature. 447(7145), pp.661-678.
Coppola, V., De Maria, R. and Bonci, D. (2010). MicroRNAs and prostate cancer.
Endocr Relat Cancer. 17(1), pp.F1-17.
Cui, C., Yang, W., Shi, J., Zhou, Y., Yang, J. and Cui, Q. (2018). Identification and
Analysis of Human Sex-biased MicroRNAs. Genomics Proteomics Bioinformatics.
16(3), pp.200-211.
Culig, Z., Steiner, H., Bartsch, G. and Hobisch, A. (2005). Interleukin-6 regulation of
prostate cancer cell growth. J Cell Biochem. 95(3), pp.497-505.
Curtale, G., Rubino, M. and Locati, M. (2019a). MicroRNAs as Molecular Switches in
Macrophage Activation. Front Immunol. 10, p799.
Dai, R. and Ahmed, S.A. (2014). Sexual dimorphism of miRNA expression: a new
perspective in understanding the sex bias of autoimmune diseases. Ther Clin Risk
Manag. 10, pp.151-163.
Davies, L.C. and Taylor, P.R. (2015). Tissue-resident macrophages: then and now.
Immunology. 144(4), pp.541-548.
de Gaetano, M., Crean, D., Barry, M. and Belton, O. (2016). M1- and M2-Type
Macrophage Responses Are Predictive of Adverse Outcomes in Human
Atherosclerosis. Front Immunol. 7, p275.

209
de la Morena, M.T., Eitson, J.L., Dozmorov, I.M., Belkaya, S., Hoover, A.R.,
Anguiano, E., Pascual, M.V. and van Oers, N.S.C. (2013). Signature MicroRNA
expression patterns identified in humans with 22q11.2 deletion/DiGeorge syndrome.
Clin Immunol. 147(1), pp.11-22.
Dedhia, P.H., Keeshan, K., Uljon, S., Xu, L., Vega, M.E., Shestova, O., Zaks-
Zilberman, M., Romany, C., Blacklow, S.C. and Pear, W.S. (2010). Differential ability
of Tribbles family members to promote degradation of C/EBPalpha and induce acute
myelogenous leukemia. Blood. 116(8), pp.1321-1328.
Deiuliis, J.A. (2016). MicroRNAs as regulators of metabolic disease: pathophysiologic
significance and emerging role as biomarkers and therapeutics. Int J Obes (Lond).
40(1), pp.88-101.
Deloukas, P., Kanoni, S., Willenborg, C., Farrall, M., Assimes, T.L., Thompson, J.R.,
Ingelsson, E., Saleheen, D., Erdmann, J., Goldstein, B.A., Stirrups, K., König, I.R.,
Cazier, J.B., Johansson, A., Hall, A.S., Lee, J.Y., Willer, C.J., Chambers, J.C., Esko,
T., Folkersen, L., Goel, A., Grundberg, E., Havulinna, A.S., Ho, W.K., Hopewell, J.C.,
Eriksson, N., Kleber, M.E., Kristiansson, K., Lundmark, P., Lyytikäinen, L.P., Rafelt,
S., Shungin, D., Strawbridge, R.J., Thorleifsson, G., Tikkanen, E., Van Zuydam, N.,
Voight, B.F., Waite, L.L., Zhang, W., Ziegler, A., Absher, D., Altshuler, D., Balmforth,
A.J., Barroso, I., Braund, P.S., Burgdorf, C., Claudi-Boehm, S., Cox, D., Dimitriou, M.,
Do, R., Doney, A.S., El Mokhtari, N., Eriksson, P., Fischer, K., Fontanillas, P., Franco-
Cereceda, A., Gigante, B., Groop, L., Gustafsson, S., Hager, J., Hallmans, G., Han,
B.G., Hunt, S.E., Kang, H.M., Illig, T., Kessler, T., Knowles, J.W., Kolovou, G.,
Kuusisto, J., Langenberg, C., Langford, C., Leander, K., Lokki, M.L., Lundmark, A.,
McCarthy, M.I., Meisinger, C., Melander, O., Mihailov, E., Maouche, S., Morris, A.D.,
Müller-Nurasyid, M., Nikus, K., Peden, J.F., Rayner, N.W., Rasheed, A., Rosinger, S.,
Rubin, D., Rumpf, M.P., Schäfer, A., Sivananthan, M., Song, C., Stewart, A.F., Tan,
S.T., Thorgeirsson, G., van der Schoot, C.E., Wagner, P.J., Wells, G.A., Wild, P.S.,
Yang, T.P., Amouyel, P., Arveiler, D., Basart, H., Boehnke, M., Boerwinkle, E.,
Brambilla, P., Cambien, F., Cupples, A.L., de Faire, U., Dehghan, A., Diemert, P.,
Epstein, S.E., Evans, A., Ferrario, M.M., Ferrières, J., Gauguier, D., Go, A.S., Goodall,
A.H., Gudnason, V., Hazen, S.L., Holm, H., Iribarren, C., Jang, Y., Kähönen, M., Kee,
210
F., Kim, H.S., Klopp, N., Koenig, W., Kratzer, W., Kuulasmaa, K., Laakso, M.,
Laaksonen, R., Lind, L., Ouwehand, W.H., Parish, S., Park, J.E., Pedersen, N.L., Peters,
A., Quertermous, T., Rader, D.J., Salomaa, V., Schadt, E., Shah, S.H., Sinisalo, J.,
Stark, K., Stefansson, K., Trégouët, D.A., Virtamo, J., Wallentin, L., Wareham, N.,
Zimmermann, M.E., Nieminen, M.S., Hengstenberg, C., Sandhu, M.S., Pastinen, T.,
Syvänen, A.C., Hovingh, G.K., Dedoussis, G., Franks, P.W., Lehtimäki, T., Metspalu,
A., Zalloua, P.A., Siegbahn, A., Schreiber, S., Ripatti, S., Blankenberg, S.S., Perola,
M., Clarke, R., Boehm, B.O., O'Donnell, C., Reilly, M.P., März, W., Collins, R.,
Kathiresan, S., Hamsten, A., Kooner, J.S., Thorsteinsdottir, U., Danesh, J., Palmer,
C.N., Roberts, R., Watkins, H., Schunkert, H., Samani, N.J., Consortium, C.D.,
Consortium, D., Consortium, C., Consortium, M. and Consortium, W.T.C.C. (2013).
Large-scale association analysis identifies new risk loci for coronary artery disease. Nat
Genet. 45(1), pp.25-33.
Derosa, C.A., Furusato, B., Shaheduzzaman, S., Srikantan, V., Wang, Z., Chen, Y.,
Seifert, M., Siefert, M., Ravindranath, L., Young, D., Nau, M., Dobi, A., Werner, T.,
McLeod, D.G., Vahey, M.T., Sesterhenn, I.A., Srivastava, S. and Petrovics, G. (2012).
Elevated osteonectin/SPARC expression in primary prostate cancer predicts metastatic
progression. Prostate Cancer Prostatic Dis. 15(2), pp.150-156.
Desiniotis, A. and Kyprianou, N. (2011). Significance of talin in cancer progression and
metastasis. Int Rev Cell Mol Biol. 289, pp.117-147.
Di Pietro, V., Porto, E., Ragusa, M., Barbagallo, C., Davies, D., Forcione, M., Logan,
A., Di Pietro, C., Purrello, M., Grey, M., Hammond, D., Sawlani, V., Barbey, A.K. and
Belli, A. (2018). Salivary MicroRNAs: Diagnostic Markers of Mild Traumatic Brain
Injury in Contact-Sport. Front Mol Neurosci. 11, p290.
Doench, J.G., Petersen, C.P. and Sharp, P.A. (2003). siRNAs can function as miRNAs.
Genes Dev. 17(4), pp.438-442.
Dong, Q., Meng, P., Wang, T., Qin, W., Wang, F., Yuan, J., Chen, Z., Yang, A. and
Wang, H. (2010). MicroRNA let-7a inhibits proliferation of human prostate cancer cells
in vitro and in vivo by targeting E2F2 and CCND2. PLoS One. 5(4), pe10147.

211
Dong, S., Xia, J., Wang, H., Sun, L., Wu, Z., Bin, J., Liao, Y., Li, N. and Liao, W.
(2016). Overexpression of TRIB3 promotes angiogenesis in human gastric cancer.
Oncol Rep. 36(4), pp.2339-2348.
Du, K., Herzig, S., Kulkarni, R.N. and Montminy, M. (2003). TRB3: a tribbles homolog
that inhibits Akt/PKB activation by insulin in liver. Science. 300(5625), pp.1574-1577.
Du, T. and Zamore, P.D. (2005). microPrimer: the biogenesis and function of
microRNA. Development. 132(21), pp.4645-4652.
Duffield, J.S. (2010). Macrophages and immunologic inflammation of the kidney.
Semin Nephrol. 30(3), pp.234-254.
Dugast, E., Kiss-Toth, E., Soulillou, J.P., Brouard, S. and Ashton-Chess, J. (2013). The
Tribbles-1 protein in humans: roles and functions in health and disease. Curr Mol Med.
13(1), pp.80-85.
Dweep, H. and Gretz, N. (2015). miRWalk2.0: a comprehensive atlas of microRNA-
target interactions. Nat Methods. 12(8), p697.
Dweep, H., Sticht, C., Pandey, P. and Gretz, N. (2011). miRWalk--database: prediction
of possible miRNA binding sites by "walking" the genes of three genomes. J Biomed
Inform. 44(5), pp.839-847.
El-Brolosy, M.A. and Stainier, D.Y.R. (2017). Genetic compensation: A phenomenon
in search of mechanisms. PLoS Genet. 13(7), pe1006780.
Elefant, N., Berger, A., Shein, H., Hofree, M., Margalit, H. and Altuvia, Y. (2011a).
RepTar: a database of predicted cellular targets of host and viral miRNAs. Nucleic Acids
Res. 39(Database issue), pp.D188-194.
Epelman, S., Lavine, K.J. and Randolph, G.J. (2014). Origin and functions of tissue
macrophages. Immunity. 41(1), pp.21-35.
Erlich, Y., Mitra, P.P., delaBastide, M., McCombie, W.R. and Hannon, G.J. (2008).
Alta-Cyclic: a self-optimizing base caller for next-generation sequencing. Nat Methods.
5(8), pp.679-682.
Essandoh, K., Li, Y., Huo, J. and Fan, G.C. (2016). MiRNA-Mediated Macrophage
Polarization and its Potential Role in the Regulation of Inflammatory Response. Shock.
46(2), pp.122-131.
212
Ewels, P., Magnusson, M., Lundin, S. and Käller, M. (2016). MultiQC: summarize
analysis results for multiple tools and samples in a single report. Bioinformatics. 32(19),
pp.3047-3048.
Eyers, P.A., Keeshan, K. and Kannan, N. (2017). Tribbles in the 21st Century: The
Evolving Roles of Tribbles Pseudokinases in Biology and Disease. Trends Cell Biol.
27(4), pp.284-298.
Fan, X., Zhang, H., Cheng, Y., Jiang, X., Zhu, J. and Jin, T. (2016). Double Roles of
Macrophages in Human Neuroimmune Diseases and Their Animal Models. Mediators
Inflamm. 2016, p8489251.
Fang, Z. and Rajewsky, N. (2011). The impact of miRNA target sites in coding
sequences and in 3'UTRs. PLoS One. 6(3), pe18067.
Faruq, O. and Vecchione, A. (2015). microRNA: Diagnostic Perspective. Front Med
(Lausanne). 2, p51.
Fernández-Hernando, C. (2013). Emerging role of microRNAs in the regulation of lipid
metabolism. Hepatology. 57(2), pp.432-434.
Fontana, L., Pelosi, E., Greco, P., Racanicchi, S., Testa, U., Liuzzi, F., Croce, C.M.,
Brunetti, E., Grignani, F. and Peschle, C. (2007). MicroRNAs 17-5p-20a-106a control
monocytopoiesis through AML1 targeting and M-CSF receptor upregulation. Nat Cell
Biol. 9(7), pp.775-787.
Formosa, A., Lena, A.M., Markert, E.K., Cortelli, S., Miano, R., Mauriello, A., Croce,
N., Vandesompele, J., Mestdagh, P., Finazzi-Agrò, E., Levine, A.J., Melino, G.,
Bernardini, S. and Candi, E. (2013). DNA methylation silences miR-132 in prostate
cancer. Oncogene. 32(1), pp.127-134.
Friedman, R.C., Farh, K.K., Burge, C.B. and Bartel, D.P. (2009). Most mammalian
mRNAs are conserved targets of microRNAs. Genome Res. 19(1), pp.92-105.
Fu, H., He, H.C., Han, Z.D., Wan, Y.P., Luo, H.W., Huang, Y.Q., Cai, C., Liang, Y.X.,
Dai, Q.S., Jiang, F.N. and Zhong, W.D. (2015). MicroRNA-224 and its target
CAMKK2 synergistically influence tumor progression and patient prognosis in prostate
cancer. Tumour Biol. 36(3), pp.1983-1991.

213
Fu, Y., Zhao, Y. and Huang, B. (2017). Tribbles homolog 1 enhances cholesterol efflux
from oxidized low-density lipoprotein-loaded THP-1 macrophages. Exp Ther Med.
14(1), pp.862-866.
Fujisaka, S., Usui, I., Nawaz, A., Takikawa, A., Kado, T., Igarashi, Y. and Tobe, K.
(2016). M2 macrophages in metabolism. Diabetol Int. 7(4), pp.342-351.
Fuxman Bass, J.I., Diallo, A., Nelson, J., Soto, J.M., Myers, C.L. and Walhout, A.J.
(2013). Using networks to measure similarity between genes: association index
selection. Nat Methods. 10(12), pp.1169-1176.
Garzon, R., Heaphy, C.E., Havelange, V., Fabbri, M., Volinia, S., Tsao, T., Zanesi, N.,
Kornblau, S.M., Marcucci, G., Calin, G.A., Andreeff, M. and Croce, C.M. (2009).
MicroRNA 29b functions in acute myeloid leukemia. Blood. 114(26), pp.5331-5341.
Geng, Q., Fan, T., Zhang, B., Wang, W., Xu, Y. and Hu, H. (2014). Five microRNAs
in plasma as novel biomarkers for screening of early-stage non-small cell lung cancer.
Respir Res. 15, p149.
Gevensleben, H., Dietrich, D., Golletz, C., Steiner, S., Jung, M., Thiesler, T., Majores,
M., Stein, J., Uhl, B., Müller, S., Ellinger, J., Stephan, C., Jung, K., Brossart, P. and
Kristiansen, G. (2016). The Immune Checkpoint Regulator PD-L1 Is Highly Expressed
in Aggressive Primary Prostate Cancer. Clin Cancer Res. 22(8), pp.1969-1977.
Ghani, S., Riemke, P., Schönheit, J., Lenze, D., Stumm, J., Hoogenkamp, M.,
Lagendijk, A., Heinz, S., Bonifer, C., Bakkers, J., Abdelilah-Seyfried, S., Hummel, M.
and Rosenbauer, F. (2011). Macrophage development from HSCs requires PU.1-
coordinated microRNA expression. Blood. 118(8), pp.2275-2284.
Gilad, Y., Rifkin, S.A. and Pritchard, J.K. (2008). Revealing the architecture of gene
regulation: the promise of eQTL studies. Trends Genet. 24(8), pp.408-415.
Gomella, L.G., Singh, J., Lallas, C. and Trabulsi, E.J. (2010). Hormone therapy in the
management of prostate cancer: evidence-based approaches. Ther Adv Urol. 2(4),
pp.171-181.
Gordon, S., Plüddemann, A. and Martinez Estrada, F. (2014). Macrophage
heterogeneity in tissues: phenotypic diversity and functions. Immunol Rev. 262(1),
pp.36-55.

214
Goto, Y., Nishikawa, R., Kojima, S., Chiyomaru, T., Enokida, H., Inoguchi, S.,
Kinoshita, T., Fuse, M., Sakamoto, S., Nakagawa, M., Naya, Y., Ichikawa, T. and Seki,
N. (2014). Tumour-suppressive microRNA-224 inhibits cancer cell migration and
invasion via targeting oncogenic TPD52 in prostate cancer. FEBS Lett. 588(10),
pp.1973-1982.
Grimson, A., Farh, K.K., Johnston, W.K., Garrett-Engele, P., Lim, L.P. and Bartel, D.P.
(2007). MicroRNA targeting specificity in mammals: determinants beyond seed
pairing. Mol Cell. 27(1), pp.91-105.
Guan, H., Shuaib, A., Leon, D.D., Angyal, A., Salazar, M., Velasco, G., Holcombe, M.,
Dower, S.K. and Kiss-Toth, E. (2016). Competition between members of the tribbles
pseudokinase protein family shapes their interactions with mitogen activated protein
kinase pathways. Sci Rep. 6, p32667.
Guo, Y., Zang, Y., Lv, L., Cai, F., Qian, T., Zhang, G. and Feng, Q. (2017). IL‐8
promotes proliferation and inhibition of apoptosis via STAT3/AKT/NF‐κB pathway in
prostate cancer. Mol Med Rep. 16(6), pp.9035-9042.
Gutiérrez, T. and Simmen, T. (2014). Endoplasmic reticulum chaperones and
oxidoreductases: critical regulators of tumor cell survival and immunorecognition.
Front Oncol. 4, p291.
Hao, Y., Gu, X., Zhao, Y., Greene, S., Sha, W., Smoot, D.T., Califano, J., Wu, T.C. and
Pang, X. (2011). Enforced expression of miR-101 inhibits prostate cancer cell growth
by modulating the COX-2 pathway in vivo. Cancer Prev Res (Phila). 4(7), pp.1073-
1083.
Hatfield, S.D., Shcherbata, H.R., Fischer, K.A., Nakahara, K., Carthew, R.W. and
Ruohola-Baker, H. (2005). Stem cell division is regulated by the microRNA pathway.
Nature. 435(7044), pp.974-978.
He, L. and Hannon, G.J. (2004). MicroRNAs: small RNAs with a big role in gene
regulation. Nat Rev Genet. 5(7), pp.522-531.
Hegedus, Z., Czibula, A. and Kiss-Toth, E. (2006). Tribbles: novel regulators of cell
function; evolutionary aspects. Cell Mol Life Sci. 63(14), pp.1632-1641.
Hegedus, Z., Czibula, A. and Kiss-Toth, E. (2007). Tribbles: a family of kinase-like
proteins with potent signalling regulatory function. Cell Signal. 19(2), pp.238-250.

215
Heinig, M., Petretto, E., Wallace, C., Bottolo, L., Rotival, M., Lu, H., Li, Y., Sarwar,
R., Langley, S.R., Bauerfeind, A., Hummel, O., Lee, Y.A., Paskas, S., Rintisch, C.,
Saar, K., Cooper, J., Buchan, R., Gray, E.E., Cyster, J.G., Erdmann, J., Hengstenberg,
C., Maouche, S., Ouwehand, W.H., Rice, C.M., Samani, N.J., Schunkert, H., Goodall,
A.H., Schulz, H., Roider, H.G., Vingron, M., Blankenberg, S., Münzel, T., Zeller, T.,
Szymczak, S., Ziegler, A., Tiret, L., Smyth, D.J., Pravenec, M., Aitman, T.J., Cambien,
F., Clayton, D., Todd, J.A., Hubner, N., Cook, S.A. and Consortium, C. (2010). A trans-
acting locus regulates an anti-viral expression network and type 1 diabetes risk. Nature.
467(7314), pp.460-464.
Hong, X. and Yu, J.J. (2019). MicroRNA-150 suppresses epithelial-mesenchymal
transition, invasion, and metastasis in prostate cancer through the TRPM4-mediated β-
catenin signaling pathway. Am J Physiol Cell Physiol. 316(4), pp.C463-C480.
Hornung, V., Bauernfeind, F., Halle, A., Samstad, E.O., Kono, H., Rock, K.L.,
Fitzgerald, K.A. and Latz, E. (2008). Silica crystals and aluminum salts activate the
NALP3 inflammasome through phagosomal destabilization. Nat Immunol. 9(8),
pp.847-856.
Hsu, J.B., Chiu, C.M., Hsu, S.D., Huang, W.Y., Chien, C.H., Lee, T.Y. and Huang,
H.D. (2011). miRTar: an integrated system for identifying miRNA-target interactions
in human. BMC Bioinformatics. 12, p300.
Hu, S.L., Cui, G.L., Huang, J., Jiang, J.G. and Wang, D.W. (2016a). An APOC3 3'UTR
variant associated with plasma triglycerides levels and coronary heart disease by
creating a functional miR-4271 binding site. Sci Rep. 6, p32700.
Hua, F., Shang, S., Yang, Y.W., Zhang, H.Z., Xu, T.L., Yu, J.J., Zhou, D.D., Cui, B.,
Li, K., Lv, X.X., Zhang, X.W., Liu, S.S., Yu, J.M., Wang, F., Zhang, C., Huang, B. and
Hu, Z.W. (2019). TRIB3 Interacts With β-Catenin and TCF4 to Increase Stem Cell
Features of Colorectal Cancer Stem Cells and Tumorigenesis. Gastroenterology.
156(3), pp.708-721.e715.
Huang, F.W., Mosquera, J.M., Garofalo, A., Oh, C., Baco, M., Amin-Mansour, A.,
Rabasha, B., Bahl, S., Mullane, S.A., Robinson, B.D., Aldubayan, S., Khani, F., Karir,
B., Kim, E., Chimene-Weiss, J., Hofree, M., Romanel, A., Osborne, J.R., Kim, J.W.,
Azabdaftari, G., Woloszynska-Read, A., Sfanos, K., De Marzo, A.M., Demichelis, F.,

216
Gabriel, S., Van Allen, E.M., Mesirov, J., Tamayo, P., Rubin, M.A., Powell, I.J. and
Garraway, L.A. (2017). Exome Sequencing of African-American Prostate Cancer
Reveals Loss-of-Function. Cancer Discov. 7(9), pp.973-983.
Huang, S., Yang, Z., Ma, Y., Yang, Y. and Wang, S. (2017). miR-101 Enhances
Cisplatin-Induced DNA Damage Through Decreasing Nicotinamide Adenine
Dinucleotide Phosphate Levels by Directly Repressing Tp53-Induced Glycolysis and
Apoptosis Regulator Expression in Prostate Cancer Cells. DNA Cell Biol. 36(4),
pp.303-310.
Huang, S., Zou, C., Tang, Y., Wa, Q., Peng, X., Chen, X., Yang, C., Ren, D., Huang,
Y., Liao, Z., Zou, X. and Pan, J. (2019). miR-582-3p and miR-582-5p Suppress Prostate
Cancer Metastasis to Bone by Repressing TGF-β Signaling. Mol Ther Nucleic Acids.
16, pp.91-104.
Huang, Y.Q., Cai, A.P., Chen, J.Y., Huang, C., Li, J. and Feng, Y.Q. (2016). The
Relationship of Plasma miR-29a and Oxidized Low Density Lipoprotein with
Atherosclerosis. Cell Physiol Biochem. 40(6), pp.1521-1528.
Hudson, T.J. (2003). Wanted: regulatory SNPs. Nat Genet. 33(4), pp.439-440.
Hutvágner, G. and Zamore, P.D. (2002). A microRNA in a multiple-turnover RNAi
enzyme complex. Science. 297(5589), pp.2056-2060.
Iizuka, M., Ogawa, T., Enomoto, M., Motoyama, H., Yoshizato, K., Ikeda, K. and
Kawada, N. (2012). Induction of microRNA-214-5p in human and rodent liver fibrosis.
Fibrogenesis Tissue Repair. 5(1), p12.
Ismail, N., Wang, Y., Dakhlallah, D., Moldovan, L., Agarwal, K., Batte, K., Shah, P.,
Wisler, J., Eubank, T.D., Tridandapani, S., Paulaitis, M.E., Piper, M.G. and Marsh, C.B.
(2013). Macrophage microvesicles induce macrophage differentiation and miR-223
transfer. Blood. 121(6), pp.984-995.
Iwakawa, H.O. and Tomari, Y. (2015a). The Functions of MicroRNAs: mRNA Decay
and Translational Repression. Trends Cell Biol. 25(11), pp.651-665.
Izrailit, J., Berman, H.K., Datti, A., Wrana, J.L. and Reedijk, M. (2013). High
throughput kinase inhibitor screens reveal TRB3 and MAPK-ERK/TGFβ pathways as
fundamental Notch regulators in breast cancer. Proc Natl Acad Sci U S A. 110(5),
pp.1714-1719.

217
Jablonski, K.A., Amici, S.A., Webb, L.M., Ruiz-Rosado, J.e.D., Popovich, P.G.,
Partida-Sanchez, S. and Guerau-de-Arellano, M. (2015). Novel Markers to Delineate
Murine M1 and M2 Macrophages. PLoS One. 10(12), pe0145342.
Jablonski, K.A., Gaudet, A.D., Amici, S.A., Popovich, P.G. and Guerau-de-Arellano,
M. (2016). Control of the Inflammatory Macrophage Transcriptional Signature by miR-
155. PLoS One. 11(7), pe0159724.
Jackute, J., Zemaitis, M., Pranys, D., Sitkauskiene, B., Miliauskas, S., Vaitkiene, S. and
Sakalauskas, R. (2018). Distribution of M1 and M2 macrophages in tumor islets and
stroma in relation to prognosis of non-small cell lung cancer. BMC Immunol. 19(1), p3.
Janiczek, M., Szylberg, Ł., Kasperska, A., Kowalewski, A., Parol, M., Antosik, P.,
Radecka, B. and Marszałek, A. (2017). Immunotherapy as a Promising Treatment for
Prostate Cancer: A Systematic Review. J Immunol Res. 2017, p4861570.
Jayadevappa, R., Chhatre, S., Malkowicz, S.B., Parikh, R.B., Guzzo, T. and Wein, A.J.
(2019). Association Between Androgen Deprivation Therapy Use and Diagnosis of
Dementia in Men With Prostate Cancer. JAMA Netw Open. 2(7), pe196562.
Jiang, L., Li, X., Zhang, Y., Zhang, M., Tang, Z. and Lv, K. (2017). Microarray and
bioinformatics analyses of gene expression profiles in BALB/c murine macrophage
polarization. Mol Med Rep. 16(5), pp.7382-7390.
Jiang, L., Schlesinger, F., Davis, C.A., Zhang, Y., Li, R., Salit, M., Gingeras, T.R. and
Oliver, B. (2011). Synthetic spike-in standards for RNA-seq experiments. Genome Res.
21(9), pp.1543-1551.
Johnston, J.M., Angyal, A., Bauer, R.C., Hamby, S., Suvarna, S.K., Baidžajevas, K.,
Hegedus, Z., Dear, T.N., Turner, M., Wilson, H.L., Goodall, A.H., Rader, D.J.,
Shoulders, C.C., Francis, S.E., Kiss-Toth, E. and Consortium, C. (2019). Myeloid
Tribbles 1 induces early atherosclerosis via enhanced foam cell expansion. Sci Adv.
5(10), peaax9183.
Jonas, S. and Izaurralde, E. (2015). Towards a molecular understanding of microRNA-
mediated gene silencing. Nat Rev Genet. 16(7), pp.421-433.
Jones, G.E. (2000). Cellular signaling in macrophage migration and chemotaxis. J
Leukoc Biol. 68(5), pp.593-602.

218
Kantoff, P.W., Higano, C.S., Shore, N.D., Berger, E.R., Small, E.J., Penson, D.F.,
Redfern, C.H., Ferrari, A.C., Dreicer, R., Sims, R.B., Xu, Y., Frohlich, M.W.,
Schellhammer, P.F. and Investigators, I.S. (2010). Sipuleucel-T immunotherapy for
castration-resistant prostate cancer. N Engl J Med. 363(5), pp.411-422.
Kapinas, K., Lowther, K.M., Kessler, C.B., Tilbury, K., Lieberman, J.R., Tirnauer, J.S.,
Campagnola, P. and Delany, A.M. (2012). Bone matrix osteonectin limits prostate
cancer cell growth and survival. Matrix Biol. 31(5), pp.299-307.
Karagkouni, D., Paraskevopoulou, M.D., Chatzopoulos, S., Vlachos, I.S., Tastsoglou,
S., Kanellos, I., Papadimitriou, D., Kavakiotis, I., Maniou, S., Skoufos, G., Vergoulis,
T., Dalamagas, T. and Hatzigeorgiou, A.G. (2018b). DIANA-TarBase v8: a decade-
long collection of experimentally supported miRNA-gene interactions. Nucleic Acids
Res. 46(D1), pp.D239-D245.
Kathiresan, S., Melander, O., Guiducci, C., Surti, A., Burtt, N.P., Rieder, M.J., Cooper,
G.M., Roos, C., Voight, B.F., Havulinna, A.S., Wahlstrand, B., Hedner, T., Corella, D.,
Tai, E.S., Ordovas, J.M., Berglund, G., Vartiainen, E., Jousilahti, P., Hedblad, B.,
Taskinen, M.R., Newton-Cheh, C., Salomaa, V., Peltonen, L., Groop, L., Altshuler,
D.M. and Orho-Melander, M. (2008). Six new loci associated with blood low-density
lipoprotein cholesterol, high-density lipoprotein cholesterol or triglycerides in humans.
Nat Genet. 40(2), pp.189-197.
Keeshan, K., He, Y., Wouters, B.J., Shestova, O., Xu, L., Sai, H., Rodriguez, C.G.,
Maillard, I., Tobias, J.W., Valk, P., Carroll, M., Aster, J.C., Delwel, R. and Pear, W.S.
(2006). Tribbles homolog 2 inactivates C/EBPalpha and causes acute myelogenous
leukemia. Cancer Cell. 10(5), pp.401-411.
Kertesz, M., Iovino, N., Unnerstall, U., Gaul, U. and Segal, E. (2007). The role of site
accessibility in microRNA target recognition. Nat Genet. 39(10), pp.1278-1284.
Khan, A.A., Betel, D., Miller, M.L., Sander, C., Leslie, C.S. and Marks, D.S. (2009).
Transfection of small RNAs globally perturbs gene regulation by endogenous
microRNAs. Nat Biotechnol. 27(6), pp.549-555.
Khan, D., Sharathchandra, A., Ponnuswamy, A., Grover, R. and Das, S. (2013). Effect
of a natural mutation in the 5' untranslated region on the translational control of p53
mRNA. Oncogene. 32(35), pp.4148-4159.

219
Kim, S.J., Uehara, H., Karashima, T., Mccarty, M., Shih, N. and Fidler, I.J. (2001).
Expression of interleukin-8 correlates with angiogenesis, tumorigenicity, and
metastasis of human prostate cancer cells implanted orthotopically in nude mice.
Neoplasia. 3(1), pp.33-42.
Kim, V.N. (2004). MicroRNA precursors in motion: exportin-5 mediates their nuclear
export. Trends Cell Biol. 14(4), pp.156-159.
Kim, V.N. and Nam, J.W. (2006). Genomics of microRNA. Trends Genet. 22(3),
pp.165-173.
Kinne, R.W., Bräuer, R., Stuhlmüller, B., Palombo-Kinne, E. and Burmester, G.R.
(2000). Macrophages in rheumatoid arthritis. Arthritis Res. 2(3), pp.189-202.
Kishi, H., Sato, M., Shibata, Y., Sato, K., Inoue, S., Abe, S., Kimura, T., Nishiwaki, M.,
Yamauchi, K., Nemoto, T., Igarashi, A., Tokairin, Y., Nakajima, O. and Kubota, I.
(2016). Role of chemokine C-C motif ligand-1 in acute and chronic pulmonary
inflammations. Springerplus. 5(1), p1241.
Kiss-Toth, E. (2011). Tribbles: 'puzzling' regulators of cell signalling. Biochem Soc
Trans. 39(2), pp.684-687.
Kiss-Toth, E., Bagstaff, S.M., Sung, H.Y., Jozsa, V., Dempsey, C., Caunt, J.C., Oxley,
K.M., Wyllie, D.H., Polgar, T., Harte, M., O'neill, L.A., Qwarnstrom, E.E. and Dower,
S.K. (2004). Human tribbles, a protein family controlling mitogen-activated protein
kinase cascades. J Biol Chem. 279(41), pp.42703-42708.
Kiss-Toth, E., Wyllie, D.H., Holland, K., Marsden, L., Jozsa, V., Oxley, K.M., Polgar,
T., Qwarnstrom, E.E. and Dower, S.K. (2006). Functional mapping and identification
of novel regulators for the Toll/Interleukin-1 signalling network by transcription
expression cloning. Cell Signal. 18(2), pp.202-214.
Kloosterman, W.P., Wienholds, E., Ketting, R.F. and Plasterk, R.H. (2004). Substrate
requirements for let-7 function in the developing zebrafish embryo. Nucleic Acids Res.
32(21), pp.6284-6291.
Koh, T.J. and DiPietro, L.A. (2011). Inflammation and wound healing: the role of the
macrophage. Expert Rev Mol Med. 13, pe23.
Kong, H.Y. and Byun, J. (2013). Emerging roles of human prostatic Acid phosphatase.
Biomol Ther (Seoul). 21(1), pp.10-20.

220
Kong, X., Qian, X., Duan, L., Liu, H., Zhu, Y. and Qi, J. (2016). microRNA-372
Suppresses Migration and Invasion by Targeting p65 in Human Prostate Cancer Cells.
DNA Cell Biol. 35(12), pp.828-835.
Kozomara, A., Birgaoanu, M. and Griffiths-Jones, S. (2019). miRBase: from
microRNA sequences to function. Nucleic Acids Res. 47(D1), pp.D155-D162.
Kubota, Y., Takubo, K., Shimizu, T., Ohno, H., Kishi, K., Shibuya, M., Saya, H. and
Suda, T. (2009). M-CSF inhibition selectively targets pathological angiogenesis and
lymphangiogenesis. J Exp Med. 206(5), pp.1089-1102.
Kurtz, C.L., Fannin, E.E., Toth, C.L., Pearson, D.S., Vickers, K.C. and Sethupathy, P.
(2015). Inhibition of miR-29 has a significant lipid-lowering benefit through
suppression of lipogenic programs in liver. Sci Rep. 5, p12911.
Lagos-Quintana, M., Rauhut, R., Lendeckel, W. and Tuschl, T. (2001). Identification
of novel genes coding for small expressed RNAs. Science. 294(5543), pp.853-858.
Lahortiga, I., De Keersmaecker, K., Van Vlierberghe, P., Graux, C., Cauwelier, B.,
Lambert, F., Mentens, N., Beverloo, H.B., Pieters, R., Speleman, F., Odero, M.D.,
Bauters, M., Froyen, G., Marynen, P., Vandenberghe, P., Wlodarska, I., Meijerink, J.P.
and Cools, J. (2007). Duplication of the MYB oncogene in T cell acute lymphoblastic
leukemia. Nat Genet. 39(5), pp.593-595.
Laing, R.E., Hess, P., Shen, Y., Wang, J. and Hu, S.X. (2011). The role and impact of
SNPs in pharmacogenomics and personalized medicine. Curr Drug Metab. 12(5),
pp.460-486.
Landthaler, M., Yalcin, A. and Tuschl, T. (2004). The human DiGeorge syndrome
critical region gene 8 and Its D. melanogaster homolog are required for miRNA
biogenesis. Curr Biol. 14(23), pp.2162-2167.
Langmead, B. and Salzberg, S.L. (2012). Fast gapped-read alignment with Bowtie 2.
Nat Methods. 9(4), pp.357-359.
Laoui, D., Van Overmeire, E., Movahedi, K., Van den Bossche, J., Schouppe, E.,
Mommer, C., Nikolaou, A., Morias, Y., De Baetselier, P. and Van Ginderachter, J.A.
(2011). Mononuclear phagocyte heterogeneity in cancer: different subsets and
activation states reaching out at the tumor site. Immunobiology. 216(11), pp.1192-1202.

221
Laviron, M. and Boissonnas, A. (2019). Ontogeny of Tumor-Associated Macrophages.
Front Immunol. 10, p1799.
Lawrence, M.S., Stojanov, P., Mermel, C.H., Robinson, J.T., Garraway, L.A., Golub,
T.R., Meyerson, M., Gabriel, S.B., Lander, E.S. and Getz, G. (2014). Discovery and
saturation analysis of cancer genes across 21 tumour types. Nature. 505(7484), pp.495-
501.
Lee, K.H., Chen, Y.L., Yeh, S.D., Hsiao, M., Lin, J.T., Goan, Y.G. and Lu, P.J. (2009).
MicroRNA-330 acts as tumor suppressor and induces apoptosis of prostate cancer cells
through E2F1-mediated suppression of Akt phosphorylation. Oncogene. 28(38),
pp.3360-3370.
Lee, R.C., Feinbaum, R.L. and Ambros, V. (1993). The C. elegans heterochronic gene
lin-4 encodes small RNAs with antisense complementarity to lin-14. Cell. 75(5),
pp.843-854.
Lee, Y.C., Wang, W.L., Chang, W.C., Huang, Y.H., Hong, G.C., Wang, H.L., Chou,
Y.H., Tseng, H.C., Lee, H.T., Li, S.T., Chen, H.L., Wu, C.C., Yang, H.F., Wang, B.Y.
and Chang, W.W. (2019). Tribbles Homolog 3 Involved in Radiation Response of
Triple Negative Breast Cancer Cells by Regulating Notch1 Activation. Cancers (Basel).
11(2).
Leinders, M., Üçeyler, N., Pritchard, R.A., Sommer, C. and Sorkin, L.S. (2016).
Increased miR-132-3p expression is associated with chronic neuropathic pain. Exp
Neurol. 283(Pt A), pp.276-286.
Lewis, B.P., Shih, I.H., Jones-Rhoades, M.W., Bartel, D.P. and Burge, C.B. (2003).
Prediction of mammalian microRNA targets. Cell. 115(7), pp.787-798.
Li, H., Handsaker, B., Wysoker, A., Fennell, T., Ruan, J., Homer, N., Marth, G.,
Abecasis, G., Durbin, R. and Subgroup, G.P.D.P. (2009). The Sequence
Alignment/Map format and SAMtools. Bioinformatics. 25(16), pp.2078-2079.
Li, H., Jiang, T., Li, M.Q., Zheng, X.L. and Zhao, G.J. (2018). Transcriptional
Regulation of Macrophages Polarization by MicroRNAs. Front Immunol. 9, p1175.
Li, J.H., Liu, S., Zhou, H., Qu, L.H. and Yang, J.H. (2014a). starBase v2.0: decoding
miRNA-ceRNA, miRNA-ncRNA and protein-RNA interaction networks from large-
scale CLIP-Seq data. Nucleic Acids Res. 42(Database issue), pp.D92-97.

222
Li, J.H., Liu, S., Zhou, H., Qu, L.H. and Yang, J.H. (2014b). starBase v2.0: decoding
miRNA-ceRNA, miRNA-ncRNA and protein-RNA interaction networks from large-
scale CLIP-Seq data. Nucleic Acids Res. 42(Database issue), pp.D92-97.
Li, S., Wang, C., Yu, X., Wu, H., Hu, J., Wang, S. and Ye, Z. (2017). miR-3619-5p
inhibits prostate cancer cell growth by activating CDKN1A expression. Oncol Rep.
37(1), pp.241-248.
Li, S.L., Sui, Y., Sun, J., Jiang, T.Q. and Dong, G. (2018). Identification of tumor
suppressive role of microRNA-132 and its target gene in tumorigenesis of prostate
cancer. Int J Mol Med. 41(4), pp.2429-2433.
Li, Y. and Kowdley, K.V. (2012). MicroRNAs in common human diseases. Genomics
Proteomics Bioinformatics. 10(5), pp.246-253.
Lin, Z.Y., Huang, Y.Q., Zhang, Y.Q., Han, Z.D., He, H.C., Ling, X.H., Fu, X., Dai,
Q.S., Cai, C., Chen, J.H., Liang, Y.X., Jiang, F.N., Zhong, W.D., Wang, F. and Wu,
C.L. (2014a). MicroRNA-224 inhibits progression of human prostate cancer by
downregulating TRIB1. Int J Cancer. 135(3), pp.541-550.
Lindow, M. and Kauppinen, S. (2012). Discovering the first microRNA-targeted drug.
J Cell Biol. 199(3), pp.407-412.
Lingel, A. and Sattler, M. (2005). Novel modes of protein-RNA recognition in the
RNAi pathway. Curr Opin Struct Biol. 15(1), pp.107-115.
Litwin, M.S. and Tan, H.J. (2017). The Diagnosis and Treatment of Prostate Cancer: A
Review. JAMA. 317(24), pp.2532-2542.
Liu, J., Wu, X., Franklin, J.L., Messina, J.L., Hill, H.S., Moellering, D.R., Walton, R.G.,
Martin, M. and Garvey, W.T. (2010). Mammalian Tribbles homolog 3 impairs insulin
action in skeletal muscle: role in glucose-induced insulin resistance. Am J Physiol
Endocrinol Metab. 298(3), pp.E565-576.
Liu, Q., Russell, M.R., Shahriari, K., Jernigan, D.L., Lioni, M.I., Garcia, F.U. and
Fatatis, A. (2013). Interleukin-1β promotes skeletal colonization and progression of
metastatic prostate cancer cells with neuroendocrine features. Cancer Res. 73(11),
pp.3297-3305.
Liu, R., Zhang, C., Hu, Z., Li, G., Wang, C., Yang, C., Huang, D., Chen, X., Zhang, H.,
Zhuang, R., Deng, T., Liu, H., Yin, J., Wang, S., Zen, K., Ba, Y. and Zhang, C.Y.

223
(2011). A five-microRNA signature identified from genome-wide serum microRNA
expression profiling serves as a fingerprint for gastric cancer diagnosis. Eur J Cancer.
47(5), pp.784-791.
Liu, T., Qiu, X., Zhao, X., Yang, R., Lian, H., Qu, F., Li, X. and Guo, H. (2018).
Hypermethylation of the SPARC promoter and its prognostic value for prostate cancer.
Oncol Rep. 39(2), pp.659-666.
Liu, W. and Wang, X. (2019). Prediction of functional microRNA targets by integrative
modeling of microRNA binding and target expression data. Genome Biol. 20(1), p18.
Liu, X., Lv, X., Yang, Q., Jin, H., Zhou, W. and Fan, Q. (2018). MicroRNA-29a
Functions as a Tumor Suppressor and Increases Cisplatin Sensitivity by Targeting
NRAS in Lung Cancer. Technol Cancer Res Treat. 17, p1533033818758905.
Liu, Y.H., Tan, K.A., Morrison, I.W., Lamb, J.R. and Argyle, D.J. (2013). Macrophage
migration is controlled by Tribbles 1 through the interaction between C/EBPβ and TNF-
α. Vet Immunol Immunopathol. 155(1-2), pp.67-75.
Liu, Z.Z., Han, Z.D., Liang, Y.K., Chen, J.X., Wan, S., Zhuo, Y.J., Cai, Z.D., Deng,
Y.L., Lin, Z.Y., Mo, R.J., He, H.C. and Zhong, W.D. (2019). TRIB1 induces
macrophages to M2 phenotype by inhibiting IKB-zeta in prostate cancer. Cell Signal.
59, pp.152-162.
Logothetis, C.J. and Lin, S.H. (2005). Osteoblasts in prostate cancer metastasis to bone.
Nat Rev Cancer. 5(1), pp.21-28.
Lohan, F. and Keeshan, K. (2013). The functionally diverse roles of tribbles. Biochem
Soc Trans. 41(4), pp.1096-1100.
Lorenz, R., Bernhart, S.H., Höner Zu Siederdissen, C., Tafer, H., Flamm, C., Stadler,
P.F. and Hofacker, I.L. (2011a). ViennaRNA Package 2.0. Algorithms Mol Biol. 6, p26.
Love, M.I., Huber, W. and Anders, S. (2014). Moderated estimation of fold change and
dispersion for RNA-seq data with DESeq2. Genome Biol. 15(12), p550.
Low, H., Hoang, A. and Sviridov, D. (2012). Cholesterol efflux assay. J Vis Exp. (61),
pe3810.
Lytle, J.R., Yario, T.A. and Steitz, J.A. (2007). Target mRNAs are repressed as
efficiently by microRNA-binding sites in the 5' UTR as in the 3' UTR. Proc Natl Acad
Sci U S A. 104(23), pp.9667-9672.

224
Ma, J., Gao, S., Xie, X., Sun, E., Zhang, M., Zhou, Q. and Lu, C. (2017). SPARC
inhibits breast cancer bone metastasis and may be a clinical therapeutic target. Oncol
Lett. 14(5), pp.5876-5882.
Majid, S., Dar, A.A., Saini, S., Arora, S., Shahryari, V., Zaman, M.S., Chang, I.,
Yamamura, S., Tanaka, Y., Deng, G. and Dahiya, R. (2012). miR-23b represses proto-
oncogene Src kinase and functions as methylation-silenced tumor suppressor with
diagnostic and prognostic significance in prostate cancer. Cancer Res. 72(24), pp.6435-
6446.
Mangravite, L.M., Engelhardt, B.E., Medina, M.W., Smith, J.D., Brown, C.D.,
Chasman, D.I., Mecham, B.H., Howie, B., Shim, H., Naidoo, D., Feng, Q., Rieder, M.J.,
Chen, Y.D., Rotter, J.I., Ridker, P.M., Hopewell, J.C., Parish, S., Armitage, J., Collins,
R., Wilke, R.A., Nickerson, D.A., Stephens, M. and Krauss, R.M. (2013). A statin-
dependent QTL for GATM expression is associated with statin-induced myopathy.
Nature. 502(7471), pp.377-380.
Mantovani, A., Allavena, P. and Sica, A. (2004). Tumour-associated macrophages as a
prototypic type II polarised phagocyte population: role in tumour progression. Eur J
Cancer. 40(11), pp.1660-1667.
Mantovani, A. and Locati, M. (2013). Tumor-associated macrophages as a paradigm of
macrophage plasticity, diversity, and polarization: lessons and open questions.
Arterioscler Thromb Vasc Biol. 33(7), pp.1478-1483.
Mantovani, A., Sica, A. and Locati, M. (2005). Macrophage polarization comes of age.
Immunity. 23(4), pp.344-346.
Manzano, M., Forte, E., Raja, A.N., Schipma, M.J. and Gottwein, E. (2015a). Divergent
target recognition by coexpressed 5'-isomiRs of miR-142-3p and selective viral
mimicry. RNA. 21(9), pp.1606-1620.
Mao, Y., Chen, H., Lin, Y., Xu, X., Hu, Z., Zhu, Y., Wu, J., Zheng, X. and Xie, L.
(2013). microRNA-330 inhibits cell motility by downregulating Sp1 in prostate cancer
cells. Oncol Rep. 30(1), pp.327-333.
Martin, C.J., Peters, K.N. and Behar, S.M. (2014). Macrophages clean up: efferocytosis
and microbial control. Curr Opin Microbiol. 17, pp.17-23.

225
Martinez, F.O. and Gordon, S. (2014). The M1 and M2 paradigm of macrophage
activation: time for reassessment. F1000Prime Rep. 6, p13.
Martinez, F.O., Gordon, S., Locati, M. and Mantovani, A. (2006). Transcriptional
profiling of the human monocyte-to-macrophage differentiation and polarization: new
molecules and patterns of gene expression. J Immunol. 177(10), pp.7303-7311.
Martinez, F.O., Sica, A., Mantovani, A. and Locati, M. (2008). Macrophage activation
and polarization. Front Biosci. 13, pp.453-461.
Marín, R.M. and Vanícek, J. (2011). Efficient use of accessibility in microRNA target
prediction. Nucleic Acids Res. 39(1), pp.19-29.
Mashima, T., Soma-Nagae, T., Migita, T., Kinoshita, R., Iwamoto, A., Yuasa, T.,
Yonese, J., Ishikawa, Y. and Seimiya, H. (2014). TRIB1 supports prostate
tumorigenesis and tumor-propagating cell survival by regulation of endoplasmic
reticulum chaperone expression. Cancer Res. 74(17), pp.4888-4897.
Mata, J., Curado, S., Ephrussi, A. and Rørth, P. (2000). Tribbles coordinates mitosis
and morphogenesis in Drosophila by regulating string/CDC25 proteolysis. Cell. 101(5),
pp.511-522.
Mathews, D.H., Burkard, M.E., Freier, S.M., Wyatt, J.R. and Turner, D.H. (1999).
Predicting oligonucleotide affinity to nucleic acid targets. RNA. 5(11), pp.1458-1469.
Matoulkova, E., Michalova, E., Vojtesek, B. and Hrstka, R. (2012). The role of the
3' untranslated region in post-transcriptional regulation of protein expression in
mammalian cells. RNA Biol. 9(5), pp.563-576.
Merriel, S.W.D., Funston, G. and Hamilton, W. (2018). Prostate Cancer in Primary
Care. Adv Ther. 35(9), pp.1285-1294.
Mills, C.D. (2012). M1 and M2 Macrophages: Oracles of Health and Disease. Crit Rev
Immunol. 32(6), pp.463-488.
Mitsi, E., Kamng'ona, R., Rylance, J., Solórzano, C., Jesus Reiné, J., Mwandumba,
H.C., Ferreira, D.M. and Jambo, K.C. (2018). Human alveolar macrophages
predominately express combined classical M1 and M2 surface markers in steady state.
Respir Res. 19(1), p66.

226
Monteleone, K., Selvaggi, C., Cacciotti, G., Falasca, F., Mezzaroma, I., D'Ettorre, G.,
Turriziani, O., Vullo, V., Antonelli, G. and Scagnolari, C. (2015). MicroRNA-29 family
expression and its relation to antiviral immune response and viro-immunological
markers in HIV-1-infected patients. BMC Infect Dis. 15, p51.
Moore, K.J., Sheedy, F.J. and Fisher, E.A. (2013). Macrophages in atherosclerosis: a
dynamic balance. Nat Rev Immunol. 13(10), pp.709-721.
Mosser, D.M. and Edwards, J.P. (2008). Exploring the full spectrum of macrophage
activation. Nat Rev Immunol. 8(12), pp.958-969.
Moszyńska, A., Gebert, M., Collawn, J.F. and Bartoszewski, R. (2017). SNPs in
microRNA target sites and their potential role in human disease. Open Biol. 7(4).
Moya, L., Lai, J., Hoffman, A., Srinivasan, S., Panchadsaram, J., Chambers, S.,
Clements, J.A., Batra, J. and BioResource, A.P.C. (2018). Association Analysis of a
Microsatellite Repeat in the. Front Genet. 9, p428.
Mu, H., Xiang, L., Li, S., Rao, D., Wang, S. and Yu, K. (2019). MiR-10a functions as
a tumor suppressor in prostate cancer via targeting KDM4A. J Cell Biochem. 120(4),
pp.4987-4997.
Munshi, S.U., Panda, H., Holla, P., Rewari, B.B. and Jameel, S. (2014). MicroRNA-
150 is a potential biomarker of HIV/AIDS disease progression and therapy. PLoS One.
9(5), pe95920.
Murray, P.J. (2017). Macrophage Polarization. Annu Rev Physiol. 79, pp.541-566.
Nadiminty, N., Tummala, R., Lou, W., Zhu, Y., Shi, X.B., Zou, J.X., Chen, H., Zhang,
J., Chen, X., Luo, J., deVere White, R.W., Kung, H.J., Evans, C.P. and Gao, A.C.
(2012). MicroRNA let-7c is downregulated in prostate cancer and suppresses prostate
cancer growth. PLoS One. 7(3), pe32832.
Naiki, T., Saijou, E., Miyaoka, Y., Sekine, K. and Miyajima, A. (2007). TRB2, a mouse
Tribbles ortholog, suppresses adipocyte differentiation by inhibiting AKT and
C/EBPbeta. J Biol Chem. 282(33), pp.24075-24082.
Nakazawa, M., Paller, C. and Kyprianou, N. (2017). Mechanisms of Therapeutic
Resistance in Prostate Cancer. Curr Oncol Rep. 19(2), p13.

227
Nam, J.W., Rissland, O.S., Koppstein, D., Abreu-Goodger, C., Jan, C.H., Agarwal, V.,
Yildirim, M.A., Rodriguez, A. and Bartel, D.P. (2014). Global analyses of the effect of
different cellular contexts on microRNA targeting. Mol Cell. 53(6), pp.1031-1043.
Nguyen, D.P., Li, J. and Tewari, A.K. (2014). Inflammation and prostate cancer: the
role of interleukin 6 (IL-6). BJU Int. 113(6), pp.986-992.
Nguyen, N., Vishwakarma, B.A., Oakley, K., Han, Y., Przychodzen, B., Maciejewski,
J.P. and Du, Y. (2016). Myb expression is critical for myeloid leukemia development
induced by Setbp1 activation. Oncotarget. 7(52), pp.86300-86312.
Nikpay, M., Goel, A., Won, H.H., Hall, L.M., Willenborg, C., Kanoni, S., Saleheen, D.,
Kyriakou, T., Nelson, C.P., Hopewell, J.C., Webb, T.R., Zeng, L., Dehghan, A., Alver,
M., Armasu, S.M., Auro, K., Bjonnes, A., Chasman, D.I., Chen, S., Ford, I.,
Franceschini, N., Gieger, C., Grace, C., Gustafsson, S., Huang, J., Hwang, S.J., Kim,
Y.K., Kleber, M.E., Lau, K.W., Lu, X., Lu, Y., Lyytikäinen, L.P., Mihailov, E.,
Morrison, A.C., Pervjakova, N., Qu, L., Rose, L.M., Salfati, E., Saxena, R., Scholz, M.,
Smith, A.V., Tikkanen, E., Uitterlinden, A., Yang, X., Zhang, W., Zhao, W., de
Andrade, M., de Vries, P.S., van Zuydam, N.R., Anand, S.S., Bertram, L., Beutner, F.,
Dedoussis, G., Frossard, P., Gauguier, D., Goodall, A.H., Gottesman, O., Haber, M.,
Han, B.G., Jalilzadeh, S., Kessler, T., König, I.R., Lannfelt, L., Lieb, W., Lind, L.,
Lindgren, C.M., Lokki, M.L., Magnusson, P.K., Mallick, N.H., Mehra, N., Meitinger,
T., Memon, F.U., Morris, A.P., Nieminen, M.S., Pedersen, N.L., Peters, A., Rallidis,
L.S., Rasheed, A., Samuel, M., Shah, S.H., Sinisalo, J., Stirrups, K.E., Trompet, S.,
Wang, L., Zaman, K.S., Ardissino, D., Boerwinkle, E., Borecki, I.B., Bottinger, E.P.,
Buring, J.E., Chambers, J.C., Collins, R., Cupples, L.A., Danesh, J., Demuth, I., Elosua,
R., Epstein, S.E., Esko, T., Feitosa, M.F., Franco, O.H., Franzosi, M.G., Granger, C.B.,
Gu, D., Gudnason, V., Hall, A.S., Hamsten, A., Harris, T.B., Hazen, S.L.,
Hengstenberg, C., Hofman, A., Ingelsson, E., Iribarren, C., Jukema, J.W., Karhunen,
P.J., Kim, B.J., Kooner, J.S., Kullo, I.J., Lehtimäki, T., Loos, R.J.F., Melander, O.,
Metspalu, A., März, W., Palmer, C.N., Perola, M., Quertermous, T., Rader, D.J.,
Ridker, P.M., Ripatti, S., Roberts, R., Salomaa, V., Sanghera, D.K., Schwartz, S.M.,
Seedorf, U., Stewart, A.F., Stott, D.J., Thiery, J., Zalloua, P.A., O'Donnell, C.J., Reilly,
M.P., Assimes, T.L., Thompson, J.R., Erdmann, J., Clarke, R., Watkins, H., Kathiresan,
228
S., McPherson, R., Deloukas, P., Schunkert, H., Samani, N.J. and Farrall, M. (2015). A
comprehensive 1,000 Genomes-based genome-wide association meta-analysis of
coronary artery disease. Nat Genet. 47(10), pp.1121-1130.
Nishida, N., Mimori, K., Fabbri, M., Yokobori, T., Sudo, T., Tanaka, F., Shibata, K.,
Ishii, H., Doki, Y. and Mori, M. (2011). MicroRNA-125a-5p is an independent
prognostic factor in gastric cancer and inhibits the proliferation of human gastric cancer
cells in combination with trastuzumab. Clin Cancer Res. 17(9), pp.2725-2733.
Nédélec, Y., Sanz, J., Baharian, G., Szpiech, Z.A., Pacis, A., Dumaine, A., Grenier,
J.C., Freiman, A., Sams, A.J., Hebert, S., Pagé Sabourin, A., Luca, F., Blekhman, R.,
Hernandez, R.D., Pique-Regi, R., Tung, J., Yotova, V. and Barreiro, L.B. (2016).
Genetic Ancestry and Natural Selection Drive Population Differences in Immune
Responses to Pathogens. Cell. 167(3), pp.657-669.e621.
O'Brien, J., Hayder, H., Zayed, Y. and Peng, C. (2018). Overview of MicroRNA
Biogenesis, Mechanisms of Actions, and Circulation. Front Endocrinol (Lausanne). 9,
p402.
Odegaard, J.I. and Chawla, A. (2013). The immune system as a sensor of the metabolic
state. Immunity. 38(4), pp.644-654.
Odegaard, J.I., Ganeshan, K. and Chawla, A. (2013). Adipose tissue macrophages:
Amicus adipem? Cell Metab. 18(6), pp.767-768.
Ohoka, N., Hattori, T., Kitagawa, M., Onozaki, K. and Hayashi, H. (2007).
Critical and functional regulation of CHOP (C/EBP homologous protein)
through the N-terminal portion. J Biol Chem. 282(49), pp.35687-35694.
Ohoka, N., Yoshii, S., Hattori, T., Onozaki, K. and Hayashi, H. (2005). TRB3, a
novel ER stress-inducible gene, is induced via ATF4-CHOP pathway and is
involved in cell death. EMBO J. 24(6), pp.1243-1255.
Ohri, C.M., Shikotra, A., Green, R.H., Waller, D.A. and Bradding, P. (2009).
Macrophages within NSCLC tumour islets are predominantly of a cytotoxic M1
phenotype associated with extended survival. Eur Respir J. 33(1), pp.118-126.
Ongusaha, P.P., Kwak, J.C., Zwible, A.J., Macip, S., Higashiyama, S., Taniguchi, N.,
Fang, L. and Lee, S.W. (2004). HB-EGF is a potent inducer of tumor growth and
angiogenesis. Cancer Res. 64(15), pp.5283-5290.
229
Orr, N. and Chanock, S. (2008). Common genetic variation and human disease. Adv
Genet. 62, pp.1-32.
Ostertag, A., Jones, A., Rose, A.J., Liebert, M., Kleinsorg, S., Reimann, A.,
Vegiopoulos, A., Berriel Diaz, M., Strzoda, D., Yamamoto, M., Satoh, T., Akira, S. and
Herzig, S. (2010a). Control of adipose tissue inflammation through TRB1. Diabetes.
59(8), pp.1991-2000.
Ozen, M., Creighton, C.J., Ozdemir, M. and Ittmann, M. (2008). Widespread
deregulation of microRNA expression in human prostate cancer. Oncogene. 27(12),
pp.1788-1793.
Papagregoriou, G., Erguler, K., Dweep, H., Voskarides, K., Koupepidou, P.,
Athanasiou, Y., Pierides, A., Gretz, N., Felekkis, K.N. and Deltas, C. (2012). A miR-
1207-5p binding site polymorphism abolishes regulation of HBEGF and is associated
with disease severity in CFHR5 nephropathy. PLoS One. 7(2), pe31021.
Paraskevopoulou, M.D., Georgakilas, G., Kostoulas, N., Vlachos, I.S., Vergoulis, T.,
Reczko, M., Filippidis, C., Dalamagas, T. and Hatzigeorgiou, A.G. (2013). DIANA-
microT web server v5.0: service integration into miRNA functional analysis workflows.
Nucleic Acids Res. 41(Web Server issue), pp.W169-173.
Parker, J.S., Roe, S.M. and Barford, D. (2004). Crystal structure of a PIWI protein
suggests mechanisms for siRNA recognition and slicer activity. EMBO J. 23(24),
pp.4727-4737.
Patro, R., Duggal, G., Love, M.I., Irizarry, R.A. and Kingsford, C. (2017). Salmon
provides fast and bias-aware quantification of transcript expression. Nat Methods.
14(4), pp.417-419.
Pattabiraman, D.R. and Gonda, T.J. (2013). Role and potential for therapeutic targeting
of MYB in leukemia. Leukemia. 27(2), pp.269-277.
Pesole, G., Mignone, F., Gissi, C., Grillo, G., Licciulli, F. and Liuni, S. (2001).
Structural and functional features of eukaryotic mRNA untranslated regions. Gene.
276(1-2), pp.73-81.
Peterson, S.M., Thompson, J.A., Ufkin, M.L., Sathyanarayana, P., Liaw, L. and
Congdon, C.B. (2014a). Common features of microRNA target prediction tools. Front
Genet. 5, p23.

230
Petrov, A.I., Kay, S.J.E., Kalvari, I., Howe, K.L., Gray, K.A., Bruford, E.A., Kersey,
P.J., Cochrane, G., Finn, R.D., Bateman, A., Kozomara, A., Griffiths-Jones, S.,
Frankish, A., Zwieb, C.W., Lau, B.Y., Williams, K.P., Chan, P.P., Lowe, T.M.,
Cannone, J.J., Gutell, R., Machnicka, M.A., Bujnicki, J.M., Yoshihama, M., Kenmochi,
N., Chai, B., Cole, J.R., Szymanski, M., Karlowski, W.M., Wood, V., Huala, E.,
Berardini, T.Z., Zhao, Y., Chen, R., Zhu, W., Paraskevopoulou, M.D., Vlachos, I.S.,
Hatzigeorgiou, A.G., Ma, L., Zhang, Z., Puetz, J., Stadler, P.F., McDonald, D., Basu,
S., Fey, P., Engel, S.R., Cherry, J.M., Volders, P.J., Mestdagh, P., Wower, J., Clark,
M.B., Quek, X.C., Dinger, M.E. and The RNAcentral Consortium. (2017).
RNAcentral: a comprehensive database of non-coding RNA sequences. Nucleic Acids
Res. 45(D1), pp.D128-D134.
Pfeiffer, F., Gröber, C., Blank, M., Händler, K., Beyer, M., Schultze, J.L. and Mayer,
G. (2018). Systematic evaluation of error rates and causes in short samples in next-
generation sequencing. Sci Rep. 8(1), p10950.
Pratt, A.J. and MacRae, I.J. (2009). The RNA-induced silencing complex: a versatile
gene-silencing machine. J Biol Chem. 284(27), pp.17897-17901.
Pyonteck, S.M., Gadea, B.B., Wang, H.W., Gocheva, V., Hunter, K.E., Tang, L.H. and
Joyce, J.A. (2012). Deficiency of the macrophage growth factor CSF-1 disrupts
pancreatic neuroendocrine tumor development. Oncogene. 31(11), pp.1459-1467.
Qi, L., Heredia, J.E., Altarejos, J.Y., Screaton, R., Goebel, N., Niessen, S., Macleod,
I.X., Liew, C.W., Kulkarni, R.N., Bain, J., Newgard, C., Nelson, M., Evans, R.M.,
Yates, J. and Montminy, M. (2006). TRB3 links the E3 ubiquitin ligase COP1 to lipid
metabolism. Science. 312(5781), pp.1763-1766.
Qian, B.Z. and Pollard, J.W. (2010). Macrophage diversity enhances tumor progression
and metastasis. Cell. 141(1), pp.39-51.
Qu, H.W., Jin, Y., Cui, Z.L. and Jin, X.B. (2018). MicroRNA-373-3p inhibits prostate
cancer progression by targeting AKT1. Eur Rev Med Pharmacol Sci. 22(19), pp.6252-
6259.
Qu, W., Ding, S.M., Cao, G., Wang, S.J., Zheng, X.H. and Li, G.H. (2016). miR-132
mediates a metabolic shift in prostate cancer cells by targeting Glut1. FEBS Open Bio.
6(7), pp.735-741.

231
Quatromoni, J.G. and Eruslanov, E. (2012). Tumor-associated macrophages: function,
phenotype, and link to prognosis in human lung cancer. Am J Transl Res. 4(4), pp.376-
389.
Ramalho-Carvalho, J., Martins, J.B., Cekaite, L., Sveen, A., Torres-Ferreira, J., Graça,
I., Costa-Pinheiro, P., Eilertsen, I.A., Antunes, L., Oliveira, J., Lothe, R.A., Henrique,
R. and Jerónimo, C. (2017). Epigenetic disruption of miR-130a promotes prostate
cancer by targeting SEC23B and DEPDC1. Cancer Lett. 385, pp.150-159.
Ramalinga, M., Roy, A., Srivastava, A., Bhattarai, A., Harish, V., Suy, S., Collins, S.
and Kumar, D. (2015). MicroRNA-212 negatively regulates starvation induced
autophagy in prostate cancer cells by inhibiting SIRT1 and is a modulator of
angiogenesis and cellular senescence. Oncotarget. 6(33), pp.34446-34457.
Ramassone, A., Pagotto, S., Veronese, A. and Visone, R. (2018). Epigenetics and
MicroRNAs in Cancer. Int J Mol Sci. 19(2).
Ramaswamy, S., Ross, K.N., Lander, E.S. and Golub, T.R. (2003). A molecular
signature of metastasis in primary solid tumors. Nat Genet. 33(1), pp.49-54.
Rath, M., Müller, I., Kropf, P., Closs, E.I. and Munder, M. (2014). Metabolism via
Arginase or Nitric Oxide Synthase: Two Competing Arginine Pathways in
Macrophages. Front Immunol. 5, p532.
Rawla, P. (2019). Epidemiology of Prostate Cancer. World J Oncol. 10(2), pp.63-89.
Reczko, M., Maragkakis, M., Alexiou, P., Grosse, I. and Hatzigeorgiou, A.G. (2012).
Functional microRNA targets in protein coding sequences. Bioinformatics. 28(6),
pp.771-776.
Remmerie, A. and Scott, C.L. (2018). Macrophages and lipid metabolism. Cell
Immunol. 330, pp.27-42.
Riffo-Campos, Á., Riquelme, I. and Brebi-Mieville, P. (2016). Tools for Sequence-
Based miRNA Target Prediction: What to Choose? Int J Mol Sci. 17(12).
Ritchie, M.E., Phipson, B., Wu, D., Hu, Y., Law, C.W., Shi, W. and Smyth, G.K.
(2015). limma powers differential expression analyses for RNA-sequencing and
microarray studies. Nucleic Acids Res. 43(7), pe47.

232
Rodríguez, S.A., Arias Fúnez, F., Bueno Bravo, C., Rodríguez-Patrón Rodríguez, R.,
Sanz Mayayo, E., Palacios, V.H. and Burgos Revilla, F.J. (2014). Cryotherapy for
primary treatment of prostate cancer: intermediate term results of a prospective study
from a single institution. Prostate Cancer. 2014, p571576.
Rotival, M., Zeller, T., Wild, P.S., Maouche, S., Szymczak, S., Schillert, A., Castagné,
R., Deiseroth, A., Proust, C., Brocheton, J., Godefroy, T., Perret, C., Germain, M.,
Eleftheriadis, M., Sinning, C.R., Schnabel, R.B., Lubos, E., Lackner, K.J., Rossmann,
H., Münzel, T., Rendon, A., Erdmann, J., Deloukas, P., Hengstenberg, C., Diemert, P.,
Montalescot, G., Ouwehand, W.H., Samani, N.J., Schunkert, H., Tregouet, D.A.,
Ziegler, A., Goodall, A.H., Cambien, F., Tiret, L., Blankenberg, S. and Consortium, C.
(2011). Integrating genome-wide genetic variations and monocyte expression data
reveals trans-regulated gene modules in humans. PLoS Genet. 7(12), pe1002367.
Roy, S. (2016). miRNA in Macrophage Development and Function. Antioxid Redox
Signal. 25(15), pp.795-804.
Ru, P., Steele, R., Newhall, P., Phillips, N.J., Toth, K. and Ray, R.B. (2012). miRNA-
29b suppresses prostate cancer metastasis by regulating epithelial-mesenchymal
transition signaling. Mol Cancer Ther. 11(5), pp.1166-1173.
Russo, R.C., Garcia, C.C., Teixeira, M.M. and Amaral, F.A. (2014). The CXCL8/IL-8
chemokine family and its receptors in inflammatory diseases. Expert Rev Clin Immunol.
10(5), pp.593-619.
Rycaj, K. and Tang, D.G. (2017). Molecular determinants of prostate cancer metastasis.
Oncotarget. 8(50), pp.88211-88231.
Ryder, M., Gild, M., Hohl, T.M., Pamer, E., Knauf, J., Ghossein, R., Joyce, J.A. and
Fagin, J.A. (2013). Genetic and pharmacological targeting of CSF-1/CSF-1R inhibits
tumor-associated macrophages and impairs BRAF-induced thyroid cancer progression.
PLoS One. 8(1), pe54302.
Röthlisberger, B., Heizmann, M., Bargetzi, M.J. and Huber, A.R. (2007). TRIB1
overexpression in acute myeloid leukemia. Cancer Genet Cytogenet. 176(1), pp.58-60.
Said, N., Frierson, H.F., Chernauskas, D., Conaway, M., Motamed, K. and
Theodorescu, D. (2009). The role of SPARC in the TRAMP model of prostate
carcinogenesis and progression. Oncogene. 28(39), pp.3487-3498.

233
Salazar, M., Lorente, M., García-Taboada, E., Pérez Gómez, E., Dávila, D., Zúñiga-
García, P., María Flores, J., Rodríguez, A., Hegedus, Z., Mosén-Ansorena, D., Aransay,
A.M., Hernández-Tiedra, S., López-Valero, I., Quintanilla, M., Sánchez, C., Iovanna,
J.L., Dusetti, N., Guzmán, M., Francis, S.E., Carracedo, A., Kiss-Toth, E. and Velasco,
G. (2015). Loss of Tribbles pseudokinase-3 promotes Akt-driven tumorigenesis via
FOXO inactivation. Cell Death Differ. 22(1), pp.131-144.
Satoh, T., Kidoya, H., Naito, H., Yamamoto, M., Takemura, N., Nakagawa, K.,
Yoshioka, Y., Morii, E., Takakura, N., Takeuchi, O. and Akira, S. (2013). Critical role
of Trib1 in differentiation of tissue-resident M2-like macrophages. Nature. 495(7442),
pp.524-528.
Schulz, C., Gomez Perdiguero, E., Chorro, L., Szabo-Rogers, H., Cagnard, N., Kierdorf,
K., Prinz, M., Wu, B., Jacobsen, S.E., Pollard, J.W., Frampton, J., Liu, K.J. and
Geissmann, F. (2012). A lineage of myeloid cells independent of Myb and
hematopoietic stem cells. Science. 336(6077), pp.86-90.
Schunkert, H., König, I.R., Kathiresan, S., Reilly, M.P., Assimes, T.L., Holm, H.,
Preuss, M., Stewart, A.F., Barbalic, M., Gieger, C., Absher, D., Aherrahrou, Z., Allayee,
H., Altshuler, D., Anand, S.S., Andersen, K., Anderson, J.L., Ardissino, D., Ball, S.G.,
Balmforth, A.J., Barnes, T.A., Becker, D.M., Becker, L.C., Berger, K., Bis, J.C.,
Boekholdt, S.M., Boerwinkle, E., Braund, P.S., Brown, M.J., Burnett, M.S.,
Buysschaert, I., Carlquist, J.F., Chen, L., Cichon, S., Codd, V., Davies, R.W.,
Dedoussis, G., Dehghan, A., Demissie, S., Devaney, J.M., Diemert, P., Do, R., Doering,
A., Eifert, S., Mokhtari, N.E., Ellis, S.G., Elosua, R., Engert, J.C., Epstein, S.E., de
Faire, U., Fischer, M., Folsom, A.R., Freyer, J., Gigante, B., Girelli, D., Gretarsdottir,
S., Gudnason, V., Gulcher, J.R., Halperin, E., Hammond, N., Hazen, S.L., Hofman, A.,
Horne, B.D., Illig, T., Iribarren, C., Jones, G.T., Jukema, J.W., Kaiser, M.A., Kaplan,
L.M., Kastelein, J.J., Khaw, K.T., Knowles, J.W., Kolovou, G., Kong, A., Laaksonen,
R., Lambrechts, D., Leander, K., Lettre, G., Li, M., Lieb, W., Loley, C., Lotery, A.J.,
Mannucci, P.M., Maouche, S., Martinelli, N., McKeown, P.P., Meisinger, C.,
Meitinger, T., Melander, O., Merlini, P.A., Mooser, V., Morgan, T., Mühleisen, T.W.,
Muhlestein, J.B., Münzel, T., Musunuru, K., Nahrstaedt, J., Nelson, C.P., Nöthen,
M.M., Olivieri, O., Patel, R.S., Patterson, C.C., Peters, A., Peyvandi, F., Qu, L.,

234
Quyyumi, A.A., Rader, D.J., Rallidis, L.S., Rice, C., Rosendaal, F.R., Rubin, D.,
Salomaa, V., Sampietro, M.L., Sandhu, M.S., Schadt, E., Schäfer, A., Schillert, A.,
Schreiber, S., Schrezenmeir, J., Schwartz, S.M., Siscovick, D.S., Sivananthan, M.,
Sivapalaratnam, S., Smith, A., Smith, T.B., Snoep, J.D., Soranzo, N., Spertus, J.A.,
Stark, K., Stirrups, K., Stoll, M., Tang, W.H., Tennstedt, S., Thorgeirsson, G.,
Thorleifsson, G., Tomaszewski, M., Uitterlinden, A.G., van Rij, A.M., Voight, B.F.,
Wareham, N.J., Wells, G.A., Wichmann, H.E., Wild, P.S., Willenborg, C., Witteman,
J.C., Wright, B.J., Ye, S., Zeller, T., Ziegler, A., Cambien, F., Goodall, A.H., Cupples,
L.A., Quertermous, T., März, W., Hengstenberg, C., Blankenberg, S., Ouwehand,
W.H., Hall, A.S., Deloukas, P., Thompson, J.R., Stefansson, K., Roberts, R.,
Thorsteinsdottir, U., O'Donnell, C.J., McPherson, R., Erdmann, J., Samani, N.J.,
Cardiogenics and Consortium, C. (2011a). Large-scale association analysis identifies
13 new susceptibility loci for coronary artery disease. Nat Genet. 43(4), pp.333-338.
Seok, H., Ham, J., Jang, E.S. and Chi, S.W. (2016a). MicroRNA Target Recognition:
Insights from Transcriptome-Wide Non-Canonical Interactions. Mol Cells. 39(5),
pp.375-381.
Sethupathy, P. and Collins, F.S. (2008). MicroRNA target site polymorphisms and
human disease. Trends Genet. 24(10), pp.489-497.
Shah, M.Y., Ferrajoli, A., Sood, A.K., Lopez-Berestein, G. and Calin, G.A. (2016).
microRNA Therapeutics in Cancer - An Emerging Concept. EBioMedicine. 12, pp.34-
42.
Shahriari, K., Shen, F., Worrede-Mahdi, A., Liu, Q., Gong, Y., Garcia, F.U. and Fatatis,
A. (2017). Cooperation among heterogeneous prostate cancer cells in the bone
metastatic niche. Oncogene. 36(20), pp.2846-2856.
Shaked, I., Meerson, A., Wolf, Y., Avni, R., Greenberg, D., Gilboa-Geffen, A. and
Soreq, H. (2009). MicroRNA-132 potentiates cholinergic anti-inflammatory signaling
by targeting acetylcholinesterase. Immunity. 31(6), pp.965-973.
Sharda, D.R., Yu, S., Ray, M., Squadrito, M.L., De Palma, M., Wynn, T.A., Morris,
S.M. and Hankey, P.A. (2011). Regulation of macrophage arginase expression and
tumor growth by the Ron receptor tyrosine kinase. J Immunol. 187(5), pp.2181-2192.

235
Sharova, L.V., Sharov, A.A., Nedorezov, T., Piao, Y., Shaik, N. and Ko, M.S. (2009).
Database for mRNA half-life of 19 977 genes obtained by DNA microarray analysis of
pluripotent and differentiating mouse embryonic stem cells. DNA Res. 16(1), pp.45-58.
Sheedy, F.J. (2015). Turning 21: Induction of miR-21 as a Key Switch in the
Inflammatory Response. Front Immunol. 6, p19.
Shen, M.M. and Abate-Shen, C. (2010). Molecular genetics of prostate cancer: new
prospects for old challenges. Genes Dev. 24(18), pp.1967-2000.
Shin, M., Mizokami, A., Kim, J., Ofude, M., Konaka, H., Kadono, Y., Kitagawa, Y.,
Miwa, S., Kumaki, M., Keller, E.T. and Namiki, M. (2013). Exogenous SPARC
suppresses proliferation and migration of prostate cancer by interacting with integrin
β1. Prostate. 73(11), pp.1159-1170.
Shiohama, A., Sasaki, T., Noda, S., Minoshima, S. and Shimizu, N. (2003). Molecular
cloning and expression analysis of a novel gene DGCR8 located in the DiGeorge
syndrome chromosomal region. Biochem Biophys Res Commun. 304(1), pp.184-190.
Sinha, P., Clements, V.K. and Ostrand-Rosenberg, S. (2005). Interleukin-13-regulated
M2 macrophages in combination with myeloid suppressor cells block immune
surveillance against metastasis. Cancer Res. 65(24), pp.11743-11751.
Skeeles, L.E., Fleming, J.L., Mahler, K.L. and Toland, A.E. (2013). The impact of
3'UTR variants on differential expression of candidate cancer susceptibility genes.
PLoS One. 8(3), pe58609.
Song, J.J., Smith, S.K., Hannon, G.J. and Joshua-Tor, L. (2004). Crystal structure of
Argonaute and its implications for RISC slicer activity. Science. 305(5689), pp.1434-
1437.
Soubeyrand, S., Martinuk, A., Lau, P. and McPherson, R. (2016). TRIB1 Is Regulated
Post-Transcriptionally by Proteasomal and Non-Proteasomal Pathways. PLoS One.
11(3), pe0152346.
Soubeyrand, S., Naing, T., Martinuk, A. and McPherson, R. (2013). ERK1/2 regulates
hepatocyte Trib1 in response to mitochondrial dysfunction. Biochim Biophys Acta.
1833(12), pp.3405-3414.
236
Starczynowski, D.T., Kuchenbauer, F., Wegrzyn, J., Rouhi, A., Petriv, O., Hansen,
C.L., Humphries, R.K. and Karsan, A. (2011). MicroRNA-146a disrupts hematopoietic
differentiation and survival. Exp Hematol. 39(2), pp.167-178.e164.
Stark, A., Brennecke, J., Bushati, N., Russell, R.B. and Cohen, S.M. (2005). Animal
MicroRNAs confer robustness to gene expression and have a significant impact on
3'UTR evolution. Cell. 123(6), pp.1133-1146.
Stegeman, S., Moya, L., Selth, L.A., Spurdle, A.B., Clements, J.A. and Batra, J.
(2015a). A genetic variant of MDM4 influences regulation by multiple microRNAs in
prostate cancer. Endocr Relat Cancer. 22(2), pp.265-276.
Steggerda, S.M., Bennett, M.K., Chen, J., Emberley, E., Huang, T., Janes, J.R., Li, W.,
MacKinnon, A.L., Makkouk, A., Marguier, G., Murray, P.J., Neou, S., Pan, A., Parlati,
F., Rodriguez, M.L.M., Van de Velde, L.A., Wang, T., Works, M., Zhang, J., Zhang,
W. and Gross, M.I. (2017). Inhibition of arginase by CB-1158 blocks myeloid cell-
mediated immune suppression in the tumor microenvironment. J Immunother Cancer.
5(1), p101.
Sticht, C., De La Torre, C., Parveen, A. and Gretz, N. (2018). miRWalk: An online
resource for prediction of microRNA binding sites. PLoS One. 13(10), pe0206239.
Strum, J.C., Johnson, J.H., Ward, J., Xie, H., Feild, J., Hester, A., Alford, A. and Waters,
K.M. (2009). MicroRNA 132 regulates nutritional stress-induced chemokine
production through repression of SirT1. Mol Endocrinol. 23(11), pp.1876-1884.
Su, A.I., Welsh, J.B., Sapinoso, L.M., Kern, S.G., Dimitrov, P., Lapp, H., Schultz, P.G.,
Powell, S.M., Moskaluk, C.A., Frierson, H.F. and Hampton, G.M. (2001). Molecular
classification of human carcinomas by use of gene expression signatures. Cancer Res.
61(20), pp.7388-7393.
Sullivan, J., Kopp, R., Stratton, K., Manschreck, C., Corines, M., Rau-Murthy, R.,
Hayes, J., Lincon, A., Ashraf, A., Thomas, T., Schrader, K., Gallagher, D., Hamilton,
R., Scher, H., Lilja, H., Scardino, P., Eastham, J., Offit, K., Vijai, J. and Klein, R.J.
(2015). An analysis of the association between prostate cancer risk loci, PSA levels,
disease aggressiveness and disease-specific mortality. Br J Cancer. 113(1), pp.166-172.

237
Sumner, R., Crawford, A., Mucenski, M. and Frampton, J. (2000). Initiation of adult
myelopoiesis can occur in the absence of c-Myb whereas subsequent development is
strictly dependent on the transcription factor. Oncogene. 19(30), pp.3335-3342.
Sung, H.Y., Francis, S.E., Arnold, N.D., Holland, K., Ernst, V., Angyal, A. and Kiss-
Toth, E. (2012). Enhanced macrophage tribbles-1 expression in murine experimental
atherosclerosis. Biology (Basel). 1(1), pp.43-57.
Sung, H.Y., Francis, S.E., Crossman, D.C. and Kiss-Toth, E. (2006). Regulation of
expression and signalling modulator function of mammalian tribbles is cell-type
specific. Immunol Lett. 104(1-2), pp.171-177.
Sung, H.Y., Guan, H., Czibula, A., King, A.R., Eder, K., Heath, E., Suvarna, S.K.,
Dower, S.K., Wilson, A.G., Francis, S.E., Crossman, D.C. and Kiss-Toth, E. (2007).
Human tribbles-1 controls proliferation and chemotaxis of smooth muscle cells via
MAPK signaling pathways. J Biol Chem. 282(25), pp.18379-18387.
Tak, Y.G. and Farnham, P.J. (2015a). Making sense of GWAS: using epigenomics and
genome engineering to understand the functional relevance of SNPs in non-coding
regions of the human genome. Epigenetics Chromatin. 8, p57.
Tak, Y.G. and Farnham, P.J. (2015b). Making sense of GWAS: using epigenomics and
genome engineering to understand the functional relevance of SNPs in non-coding
regions of the human genome. Epigenetics Chromatin. 8, p57.
Takahashi, Y., Ohoka, N., Hayashi, H. and Sato, R. (2008). TRB3 suppresses adipocyte
differentiation by negatively regulating PPARgamma transcriptional activity. J Lipid
Res. 49(4), pp.880-892.
Tang, G., Du, R., Tang, Z. and Kuang, Y. (2018). MiRNALet-7a mediates prostate
cancer PC-3 cell invasion, migration by inducing epithelial-mesenchymal transition
through CCR7/MAPK pathway. J Cell Biochem. 119(4), pp.3725-3731.
Teijeiro, V., Yang, D., Majumdar, S., González, F., Rickert, R.W., Xu, C., Koche, R.,
Verma, N., Lai, E.C. and Huangfu, D. (2018). DICER1 Is Essential for Self-Renewal
of Human Embryonic Stem Cells. Stem Cell Reports. 11(3), pp.616-625.
Teslovich, T.M., Musunuru, K., Smith, A.V., Edmondson, A.C., Stylianou, I.M.,
Koseki, M., Pirruccello, J.P., Ripatti, S., Chasman, D.I., Willer, C.J., Johansen, C.T.,
Fouchier, S.W., Isaacs, A., Peloso, G.M., Barbalic, M., Ricketts, S.L., Bis, J.C.,

238
Aulchenko, Y.S., Thorleifsson, G., Feitosa, M.F., Chambers, J., Orho-Melander, M.,
Melander, O., Johnson, T., Li, X., Guo, X., Li, M., Shin Cho, Y., Jin Go, M., Jin Kim,
Y., Lee, J.Y., Park, T., Kim, K., Sim, X., Twee-Hee Ong, R., Croteau-Chonka, D.C.,
Lange, L.A., Smith, J.D., Song, K., Hua Zhao, J., Yuan, X., Luan, J., Lamina, C.,
Ziegler, A., Zhang, W., Zee, R.Y., Wright, A.F., Witteman, J.C., Wilson, J.F.,
Willemsen, G., Wichmann, H.E., Whitfield, J.B., Waterworth, D.M., Wareham, N.J.,
Waeber, G., Vollenweider, P., Voight, B.F., Vitart, V., Uitterlinden, A.G., Uda, M.,
Tuomilehto, J., Thompson, J.R., Tanaka, T., Surakka, I., Stringham, H.M., Spector,
T.D., Soranzo, N., Smit, J.H., Sinisalo, J., Silander, K., Sijbrands, E.J., Scuteri, A.,
Scott, J., Schlessinger, D., Sanna, S., Salomaa, V., Saharinen, J., Sabatti, C., Ruokonen,
A., Rudan, I., Rose, L.M., Roberts, R., Rieder, M., Psaty, B.M., Pramstaller, P.P.,
Pichler, I., Perola, M., Penninx, B.W., Pedersen, N.L., Pattaro, C., Parker, A.N., Pare,
G., Oostra, B.A., O'Donnell, C.J., Nieminen, M.S., Nickerson, D.A., Montgomery,
G.W., Meitinger, T., McPherson, R., McCarthy, M.I., McArdle, W., Masson, D.,
Martin, N.G., Marroni, F., Mangino, M., Magnusson, P.K., Lucas, G., Luben, R., Loos,
R.J., Lokki, M.L., Lettre, G., Langenberg, C., Launer, L.J., Lakatta, E.G., Laaksonen,
R., Kyvik, K.O., Kronenberg, F., König, I.R., Khaw, K.T., Kaprio, J., Kaplan, L.M.,
Johansson, A., Jarvelin, M.R., Janssens, A.C., Ingelsson, E., Igl, W., Kees Hovingh, G.,
Hottenga, J.J., Hofman, A., Hicks, A.A., Hengstenberg, C., Heid, I.M., Hayward, C.,
Havulinna, A.S., Hastie, N.D., Harris, T.B., Haritunians, T., Hall, A.S., Gyllensten, U.,
Guiducci, C., Groop, L.C., Gonzalez, E., Gieger, C., Freimer, N.B., Ferrucci, L.,
Erdmann, J., Elliott, P., Ejebe, K.G., Döring, A., Dominiczak, A.F., Demissie, S.,
Deloukas, P., de Geus, E.J., de Faire, U., Crawford, G., Collins, F.S., Chen, Y.D.,
Caulfield, M.J., Campbell, H., Burtt, N.P., Bonnycastle, L.L., Boomsma, D.I.,
Boekholdt, S.M., Bergman, R.N., Barroso, I., Bandinelli, S., Ballantyne, C.M.,
Assimes, T.L., Quertermous, T., Altshuler, D., Seielstad, M., Wong, T.Y., Tai, E.S.,
Feranil, A.B., Kuzawa, C.W., Adair, L.S., Taylor, H.A., Borecki, I.B., Gabriel, S.B.,
Wilson, J.G., Holm, H., Thorsteinsdottir, U., Gudnason, V., Krauss, R.M., Mohlke,
K.L., Ordovas, J.M., Munroe, P.B., Kooner, J.S., Tall, A.R., Hegele, R.A., Kastelein,
J.J., Schadt, E.E., Rotter, J.I., Boerwinkle, E., Strachan, D.P., Mooser, V., Stefansson,
K., Reilly, M.P., Samani, N.J., Schunkert, H., Cupples, L.A., Sandhu, M.S., Ridker,

239
P.M., Rader, D.J., van Duijn, C.M., Peltonen, L., Abecasis, G.R., Boehnke, M. and
Kathiresan, S. (2010). Biological, clinical and population relevance of 95 loci for blood
lipids. Nature. 466(7307), pp.707-713.
Testa, U., Castelli, G. and Pelosi, E. (2019). Cellular and Molecular Mechanisms
Underlying Prostate Cancer Development: Therapeutic Implications. Medicines
(Basel). 6(3).
Thomas, A.C. and Mattila, J.T. (2014). "Of mice and men": arginine metabolism in
macrophages. Front Immunol. 5, p479.
Thomas, S.L., Alam, R., Lemke, N., Schultz, L.R., Gutiérrez, J.A. and Rempel, S.A.
(2010). PTEN augments SPARC suppression of proliferation and inhibits SPARC-
induced migration by suppressing SHC-RAF-ERK and AKT signaling. Neuro Oncol.
12(9), pp.941-955.
Tomari, Y. and Zamore, P.D. (2005). MicroRNA biogenesis: drosha can't cut it without
a partner. Curr Biol. 15(2), pp.R61-64.
Tomlins, S.A., Rhodes, D.R., Yu, J., Varambally, S., Mehra, R., Perner, S., Demichelis,
F., Helgeson, B.E., Laxman, B., Morris, D.S., Cao, Q., Cao, X., Andrén, O., Fall, K.,
Johnson, L., Wei, J.T., Shah, R.B., Al-Ahmadie, H., Eastham, J.A., Eggener, S.E., Fine,
S.W., Hotakainen, K., Stenman, U.H., Tsodikov, A., Gerald, W.L., Lilja, H., Reuter,
V.E., Kantoff, P.W., Scardino, P.T., Rubin, M.A., Bjartell, A.S. and Chinnaiyan, A.M.
(2008). The role of SPINK1 in ETS rearrangement-negative prostate cancers. Cancer
Cell. 13(6), pp.519-528.
Trombetta, A.C., Soldano, S., Contini, P., Tomatis, V., Ruaro, B., Paolino, S.,
Brizzolara, R., Montagna, P., Sulli, A., Pizzorni, C., Smith, V. and Cutolo, M. (2018).
A circulating cell population showing both M1 and M2 monocyte/macrophage surface
markers characterizes systemic sclerosis patients with lung involvement. Respir Res.
19(1), p186.
Tugal, D., Liao, X. and Jain, M.K. (2013). Transcriptional control of macrophage
polarization. Arterioscler Thromb Vasc Biol. 33(6), pp.1135-1144.
Valinezhad Orang, A., Safaralizadeh, R. and Kazemzadeh-Bavili, M. (2014).
Mechanisms of miRNA-Mediated Gene Regulation from Common Downregulation to
mRNA-Specific Upregulation. Int J Genomics. 2014, p970607.
240
van Dalen, F.J., van Stevendaal, M.H.M.E., Fennemann, F.L., Verdoes, M. and Ilina,
O. (2018). Molecular Repolarisation of Tumour-Associated Macrophages. Molecules.
24(1).
van der Harst, P. and Verweij, N. (2018). Identification of 64 Novel Genetic Loci
Provides an Expanded View on the Genetic Architecture of Coronary Artery Disease.
Circ Res. 122(3), pp.433-443.
Vanacore, D., Boccellino, M., Rossetti, S., Cavaliere, C., D'Aniello, C., Di Franco, R.,
Romano, F.J., Montanari, M., La Mantia, E., Piscitelli, R., Nocerino, F., Cappuccio, F.,
Grimaldi, G., Izzo, A., Castaldo, L., Pepe, M.F., Malzone, M.G., Iovane, G., Ametrano,
G., Stiuso, P., Quagliuolo, L., Barberio, D., Perdonà, S., Muto, P., Montella, M.,
Maiolino, P., Veneziani, B.M., Botti, G., Caraglia, M. and Facchini, G. (2017).
Micrornas in prostate cancer: an overview. Oncotarget. 8(30), pp.50240-50251.
Vasudevan, S., Tong, Y. and Steitz, J.A. (2007). Switching from repression to
activation: microRNAs can up-regulate translation. Science. 318(5858), pp.1931-1934.
Veremeyko, T., Siddiqui, S., Sotnikov, I., Yung, A. and Ponomarev, E.D. (2013). IL-
4/IL-13-dependent and independent expression of miR-124 and its contribution to M2
phenotype of monocytic cells in normal conditions and during allergic inflammation.
PLoS One. 8(12), pe81774.
Vieweg, J. (2007). The evolving therapeutic landscape of prostate cancer. Curr Opin
Urol. 17(3), p156.
Viola, A., Munari, F., Sánchez-Rodríguez, R., Scolaro, T. and Castegna, A. (2019). The
Metabolic Signature of Macrophage Responses. Front Immunol. 10, p1462.
Wang, G., Zhao, D., Spring, D.J. and DePinho, R.A. (2018). Genetics and biology of
prostate cancer. Genes Dev. 32(17-18), pp.1105-1140.
Wang, N., Liang, H. and Zen, K. (2014). Molecular mechanisms that influence the
macrophage m1-m2 polarization balance. Front Immunol. 5, p614.
Wang, S., Wang, L., Wu, C., Sun, S. and Pan, J.H. (2018). E2F2 directly regulates the
STAT1 and PI3K/AKT/NF-κB pathways to exacerbate the inflammatory phenotype in
rheumatoid arthritis synovial fibroblasts and mouse embryonic fibroblasts. Arthritis Res
Ther. 20(1), p225.

241
Wang, X., Liu, S., Cao, L., Zhang, T., Yue, D., Wang, L., Ping, Y., He, Q., Zhang, C.,
Wang, M., Chen, X., Gao, Q., Wang, D., Zhang, Z., Wang, F., Yang, L., Li, J., Huang,
L., Zhang, B. and Zhang, Y. (2017). miR-29a-3p suppresses cell proliferation and
migration by downregulating IGF1R in hepatocellular carcinoma. Oncotarget. 8(49),
pp.86592-86603.
Wang, X.S., Gong, J.N., Yu, J., Wang, F., Zhang, X.H., Yin, X.L., Tan, Z.Q., Luo,
Z.M., Yang, G.H., Shen, C. and Zhang, J.W. (2012). MicroRNA-29a and microRNA-
142-3p are regulators of myeloid differentiation and acute myeloid leukemia. Blood.
119(21), pp.4992-5004.
Wang, Z., Brandt, S., Medeiros, A., Wang, S., Wu, H., Dent, A. and Serezani, C.H.
(2015). MicroRNA 21 is a homeostatic regulator of macrophage polarization and
prevents prostaglandin E2-mediated M2 generation. PLoS One. 10(2), pe0115855.
Wang, Z., Sha, H.H. and Li, H.J. (2019). Functions and mechanisms of miR-186 in
human cancer. Biomed Pharmacother. 119, p109428.
Ward, L.D. and Kellis, M. (2012). HaploReg: a resource for exploring chromatin states,
conservation, and regulatory motif alterations within sets of genetically linked variants.
Nucleic Acids Res. 40(Database issue), pp.D930-934.
Wei, R., Yang, F., Urban, T.J., Li, L., Chalasani, N., Flockhart, D.A. and Liu, W.
(2012). Impact of the Interaction between 3'-UTR SNPs and microRNA on the
Expression of Human Xenobiotic Metabolism Enzyme and Transporter Genes. Front
Genet. 3, p248.
Wei, X., Tang, C., Lu, X., Liu, R., Zhou, M., He, D., Zheng, D., Sun, C. and Wu, Z.
(2015a). MiR-101 targets DUSP1 to regulate the TGF-β secretion in sorafenib inhibits
macrophage-induced growth of hepatocarcinoma. Oncotarget. 6(21), pp.18389-18405.
Wienholds, E., Koudijs, M.J., van Eeden, F.J., Cuppen, E. and Plasterk, R.H. (2003).
The microRNA-producing enzyme Dicer1 is essential for zebrafish development. Nat
Genet. 35(3), pp.217-218.
Wightman, B., Ha, I. and Ruvkun, G. (1993). Posttranscriptional regulation of the
heterochronic gene lin-14 by lin-4 mediates temporal pattern formation in C. elegans.
Cell. 75(5), pp.855-862.

242
Wilk, G. and Braun, R. (2018a). regQTLs: Single nucleotide polymorphisms that
modulate microRNA regulation of gene expression in tumors. PLoS Genet. 14(12),
pe1007837.
Willer, C.J., Sanna, S., Jackson, A.U., Scuteri, A., Bonnycastle, L.L., Clarke, R., Heath,
S.C., Timpson, N.J., Najjar, S.S., Stringham, H.M., Strait, J., Duren, W.L., Maschio,
A., Busonero, F., Mulas, A., Albai, G., Swift, A.J., Morken, M.A., Narisu, N., Bennett,
D., Parish, S., Shen, H., Galan, P., Meneton, P., Hercberg, S., Zelenika, D., Chen, W.M.,
Li, Y., Scott, L.J., Scheet, P.A., Sundvall, J., Watanabe, R.M., Nagaraja, R., Ebrahim,
S., Lawlor, D.A., Ben-Shlomo, Y., Davey-Smith, G., Shuldiner, A.R., Collins, R.,
Bergman, R.N., Uda, M., Tuomilehto, J., Cao, A., Collins, F.S., Lakatta, E., Lathrop,
G.M., Boehnke, M., Schlessinger, D., Mohlke, K.L. and Abecasis, G.R. (2008). Newly
identified loci that influence lipid concentrations and risk of coronary artery disease.
Nat Genet. 40(2), pp.161-169.
Wynn, T.A., Chawla, A. and Pollard, J.W. (2013). Macrophage biology in
development, homeostasis and disease. Nature. 496(7446), pp.445-455.
Xi, J., Huang, Q., Wang, L., Ma, X., Deng, Q., Kumar, M., Zhou, Z., Li, L., Zeng, Z.,
Young, K.H., Zhang, M. and Li, Y. (2018). miR-21 depletion in macrophages promotes
tumoricidal polarization and enhances PD-1 immunotherapy. Oncogene. 37(23),
pp.3151-3165.
Xie, B., Ding, Q., Han, H. and Wu, D. (2013). miRCancer: a microRNA-cancer
association database constructed by text mining on literature. Bioinformatics. 29(5),
pp.638-644.
Xin, H., Zhang, C., Herrmann, A., Du, Y., Figlin, R. and Yu, H. (2009). Sunitinib
inhibition of Stat3 induces renal cell carcinoma tumor cell apoptosis and reduces
immunosuppressive cells. Cancer Res. 69(6), pp.2506-2513.
Xin, M., Qiao, Z., Li, J., Liu, J., Song, S., Zhao, X., Miao, P., Tang, T., Wang, L., Liu,
W., Yang, X., Dai, K. and Huang, G. (2016). miR-22 inhibits tumor growth and
metastasis by targeting ATP citrate lyase: evidence in osteosarcoma, prostate cancer,
cervical cancer and lung cancer. Oncotarget. 7(28), pp.44252-44265.

243
Xu, G., Zhang, Z., Xing, Y., Wei, J., Ge, Z., Liu, X., Zhang, Y. and Huang, X. (2014).
MicroRNA-149 negatively regulates TLR-triggered inflammatory response in
macrophages by targeting MyD88. J Cell Biochem. 115(5), pp.919-927.
Xu, H., Wang, P., You, J., Zheng, Y., Fu, Y., Tang, Q., Zhou, L., Wei, Z., Lin, B., Shu,
Y., Zhu, Y., Hu, L. and Kong, X. (2010). Screening of Kozak-motif-located SNPs and
analysis of their association with human diseases. Biochem Biophys Res Commun.
392(1), pp.89-94.
Xu, S., Ge, J., Zhang, Z. and Zhou, W. (2017). MiR-129 inhibits cell proliferation and
metastasis by targeting ETS1 via PI3K/AKT/mTOR pathway in prostate cancer.
Biomed Pharmacother. 96, pp.634-641.
Xu, S., Yi, X.M., Zhou, W.Q., Cheng, W., Ge, J.P. and Zhang, Z.Y. (2015).
Downregulation of miR-129 in peripheral blood mononuclear cells is a diagnostic and
prognostic biomarker in prostate cancer. Int J Clin Exp Pathol. 8(11), pp.14335-14344.
Xuan, W., Qu, Q., Zheng, B., Xiong, S. and Fan, G.H. (2015). The chemotaxis of M1
and M2 macrophages is regulated by different chemokines. J Leukoc Biol. 97(1), pp.61-
69.
Yadav, S.S., Stockert, J.A., Hackert, V., Yadav, K.K. and Tewari, A.K. (2018).
Intratumor heterogeneity in prostate cancer. Urol Oncol. 36(8), pp.349-360.
Yamamoto, M., Uematsu, S., Okamoto, T., Matsuura, Y., Sato, S., Kumar, H., Satoh,
T., Saitoh, T., Takeda, K., Ishii, K.J., Takeuchi, O., Kawai, T. and Akira, S. (2007).
Enhanced TLR-mediated NF-IL6 dependent gene expression by Trib1 deficiency. J Exp
Med. 204(9), pp.2233-2239.
Yang, J.K., Liu, H.J., Wang, Y., Li, C., Yang, J.P., Yang, L., Qi, X.J., Zhao, Y.L., Shi,
X.F., Li, J.C., Sun, G.Z. and Jiao, B.H. (2019). Exosomal miR-214-5p Released from
Glioblastoma Cells Modulates Inflammatory Response of Microglia after
Lipopolysaccharide Stimulation through Targeting CXCR5. CNS Neurol Disord Drug
Targets. 18(1), pp.78-87.
Yang, L. and Zhang, Y. (2017). Tumor-associated macrophages, potential targets for
cancer treatment. Biomark Res. 5, p25.

244
Ye, Y., Wang, G., Zhuang, J., He, S., Song, Y., Ni, J., Xia, W. and Wang, J. (2017).
The Oncogenic Role of Tribbles 1 in Hepatocellular Carcinoma Is Mediated by a
Feedback Loop Involving microRNA-23a and p53. Front Physiol. 8, p789.
Yokoyama, T. and Nakamura, T. (2011). Tribbles in disease: Signaling pathways
important for cellular function and neoplastic transformation. Cancer Sci. 102(6),
pp.1115-1122.
Yona, S., Kim, K.W., Wolf, Y., Mildner, A., Varol, D., Breker, M., Strauss-Ayali, D.,
Viukov, S., Guilliams, M., Misharin, A., Hume, D.A., Perlman, H., Malissen, B.,
Zelzer, E. and Jung, S. (2013). Fate mapping reveals origins and dynamics of monocytes
and tissue macrophages under homeostasis. Immunity. 38(1), pp.79-91.
Yoshida, A., Kato, J.Y., Nakamae, I. and Yoneda-Kato, N. (2013). COP1 targets
C/EBPα for degradation and induces acute myeloid leukemia via Trib1. Blood. 122(10),
pp.1750-1760.
Young, M.D., Wakefield, M.J., Smyth, G.K. and Oshlack, A. (2010). Gene ontology
analysis for RNA-seq: accounting for selection bias. Genome Biol. 11(2), pR14.
Yu, J.M., Sun, W., Wang, Z.H., Liang, X., Hua, F., Li, K., Lv, X.X., Zhang, X.W., Liu,
Y.Y., Yu, J.J., Liu, S.S., Shang, S., Wang, F., Yang, Z.N., Zhao, C.X., Hou, X.Y., Li,
P.P., Huang, B., Cui, B. and Hu, Z.W. (2019a). TRIB3 supports breast cancer stemness
by suppressing FOXO1 degradation and enhancing SOX2 transcription. Nat Commun.
10(1), p5720.
Yue, D., Liu, H. and Huang, Y. (2009a). Survey of Computational Algorithms for
MicroRNA Target Prediction. Curr Genomics. 10(7), pp.478-492.
Zaman, M.S., Chen, Y., Deng, G., Shahryari, V., Suh, S.O., Saini, S., Majid, S., Liu, J.,
Khatri, G., Tanaka, Y. and Dahiya, R. (2010). The functional significance of
microRNA-145 in prostate cancer. Br J Cancer. 103(2), pp.256-264.
Zeng, Y. and Cullen, B.R. (2003). Sequence requirements for micro RNA processing
and function in human cells. RNA. 9(1), pp.112-123.
Zeng, Y., Wagner, E.J. and Cullen, B.R. (2002). Both natural and designed micro RNAs
can inhibit the expression of cognate mRNAs when expressed in human cells. Mol Cell.
9(6), pp.1327-1333.

245
Zeng, Y., Yi, R. and Cullen, B.R. (2003). MicroRNAs and small interfering RNAs can
inhibit mRNA expression by similar mechanisms. Proc Natl Acad Sci U S A. 100(17),
pp.9779-9784.
Zhang, B., Pan, X., Cobb, G.P. and Anderson, T.A. (2007). microRNAs as oncogenes
and tumor suppressors. Dev Biol. 302(1), pp.1-12.
Zhang, B., Pan, X., Wang, Q., Cobb, G.P. and Anderson, T.A. (2006). Computational
identification of microRNAs and their targets. Comput Biol Chem. 30(6), pp.395-407.
Zhang, D.E., Hetherington, C.J., Chen, H.M. and Tenen, D.G. (1994). The macrophage
transcription factor PU.1 directs tissue-specific expression of the macrophage colony-
stimulating factor receptor. Mol Cell Biol. 14(1), pp.373-381.
Zhang, F., Parayath, N.N., Ene, C.I., Stephan, S.B., Koehne, A.L., Coon, M.E., Holland,
E.C. and Stephan, M.T. (2019). Genetic programming of macrophages to perform anti-
tumor functions using targeted mRNA nanocarriers. Nat Commun. 10(1), p3974.
Zhang, G.M., Bao, C.Y., Wan, F.N., Cao, D.L., Qin, X.J., Zhang, H.L., Zhu, Y., Dai,
B., Shi, G.H. and Ye, D.W. (2015). MicroRNA-302a Suppresses Tumor Cell
Proliferation by Inhibiting AKT in Prostate Cancer. PLoS One. 10(4), pe0124410.
Zhang, N., Lei, J., Lei, H., Ruan, X., Liu, Q., Chen, Y. and Huang, W. (2015).
MicroRNA-101 overexpression by IL-6 and TNF-α inhibits cholesterol efflux by
suppressing ATP-binding cassette transporter A1 expression. Exp Cell Res. 336(1),
pp.33-42.
Zhang, W., Liu, J., Qiu, J., Fu, X., Tang, Q., Yang, F., Zhao, Z. and Wang, H. (2016).
MicroRNA-382 inhibits prostate cancer cell proliferation and metastasis through
targeting COUP-TFII. Oncol Rep. 36(6), pp.3707-3715.
Zhang, X., Zhong, N., Li, X. and Chen, M.B. (2019a). TRIB3 promotes lung cancer
progression by activating β-catenin signaling. Eur J Pharmacol. 863, p172697.
Zhang, Y., Sui, J., Shen, X., Li, C., Yao, W., Hong, W., Peng, H., Pu, Y., Yin, L. and
Liang, G. (2017). Differential expression profiles of microRNAs as potential
biomarkers for the early diagnosis of lung cancer. Oncol Rep. 37(6), pp.3543-3553.
Zhang, Y., Zhang, M., Zhong, M., Suo, Q. and Lv, K. (2013). Expression profiles of
miRNAs in polarized macrophages. Int J Mol Med. 31(4), pp.797-802.

246
Zhao, G.J., Yin, K., Fu, Y.C. and Tang, C.K. (2012). The interaction of ApoA-I and
ABCA1 triggers signal transduction pathways to mediate efflux of cellular lipids. Mol
Med. 18, pp.149-158.
Zhou, H., Luo, Y., Chen, J.H., Hu, J., Luo, Y.Z., Wang, W., Zeng, Y. and Xiao, L.
(2013). Knockdown of TRB3 induces apoptosis in human lung adenocarcinoma cells
through regulation of Notch 1 expression. Mol Med Rep. 8(1), pp.47-52.
Zhu, C., Hou, X., Zhu, J., Jiang, C. and Wei, W. (2018). Expression of miR-30c and
miR-29b in prostate cancer and its diagnostic significance. Oncol Lett. 16(3), pp.3140-
3144.
Zhu, C., Shao, P., Bao, M., Li, P., Zhou, H., Cai, H., Cao, Q., Tao, L., Meng, X., Ju, X.,
Qin, C., Li, J. and Yin, C. (2014). miR-154 inhibits prostate cancer cell proliferation by
targeting CCND2. Urol Oncol. 32(1), pp.31.e39-16.
Zhu, Y., Herndon, J.M., Sojka, D.K., Kim, K.W., Knolhoff, B.L., Zuo, C., Cullinan,
D.R., Luo, J., Bearden, A.R., Lavine, K.J., Yokoyama, W.M., Hawkins, W.G., Fields,
R.C., Randolph, G.J. and DeNardo, D.G. (2017). Tissue-Resident Macrophages in
Pancreatic Ductal Adenocarcinoma Originate from Embryonic Hematopoiesis and
Promote Tumor Progression. Immunity. 47(3), p597.
Zonari, E., Pucci, F., Saini, M., Mazzieri, R., Politi, L.S., Gentner, B. and Naldini, L.
(2013). A role for miR-155 in enabling tumor-infiltrating innate immune cells to mount
effective antitumor responses in mice. Blood. 122(2), pp.243-252.

247
Chapter 8, Supporting Information
Appendix I, Chapter 2, General Materials and Methods
A1.1. List of reagents and kits
Reagent/Kit Company Cat. No
iScript cDNA Synthesis Kit Biorad 1708891
miRCURY LNA RT Kit Qiagen 339340
miRCURY LNA SYBR Green PCR Kit Qiagen 339345
miRNeasy Mini Kit Qiagen 217004
RNase-Free DNase Set Qiagen 79256
Precision Plus 2x qPCR Master Mix with SYBR
Green
Primer Design PPLUS-SY-20ML
GenElute™ HP Plasmid Midiprep Kit Sigma-Aldrich NA0200-1KT
GenElute™ HP Plasmid Miniprep Kit Sigma-Aldrich NA0160
Dual Luciferase Reporter Assay Kit Promega E1910
Human IL-8 DuoSet ELISA R & D DY208
RealTime-Glo™ MT Cell Viability Assay Promega G9711
QuikChange II-Site-directed mutagenesis Agilent 200521
pENTR/D-TOPO directional cloning Invitrogen K240020
Gateway LR Clonase II enzyme mix Invitrogen 11791020
E.Coli C2987H NEB C2987I
Human Recombinant M-CSF PrepoTech 300-25
Human Recombinant IL-4 PrepoTech 200-04
Human Recombinant IL-10 PrepoTech 200-10
Human Recombinant IFN-γ PrepoTech 300-02
Human Recombinant M-CSF ImmunoTools 11343117
E.Coli Lipopolysaccaride Enzo Life Sciences ALX-581-007-L001
miR-101-3p mimic Horizon Discovery C-300518-07-0005
miR-132-3p mimic Horizon Discovery C-300599-06-0005
miR-214-5p mimic Horizon Discovery C-301153-01-0005
miR-101-3p inhibitor Horizon Discovery IH-300518-08-0005
miR-132-3p inhibitor Horizon Discovery IH-300599-05-0005
Mimic Negative Control Horizon Discovery CN-001000-01-05
Inhibitor Negative Control Horizon Discovery IN-001005-01-05
miR-155-5p primer mix Qiagen 339306
miR-125a-3p primer mix Qiagen 339306
miR-186-5p primer mix Qiagen 339306
miR-149-5p primer mix Qiagen 339306
miR-766-3p primer mix Qiagen 339306
miR-1343-3p primer mix Qiagen 339306
TRIB1 siRNA Horizon Discovery L-003633-00-0005
DICER1 siRNA Horizon Discovery L-003483-00-0005
AGO2 siRNA Horizon Discovery L-004639-00-0005
siRNA negative control (scramble) Horizon Discovery D-001810-01-05
siGLO Green Transfection Indicator Horizon Discovery D-001630
MIR-101/TRIB1 Target Site Blocker Qiagen 339199
Negative Control Target Site Blocker Qiagen 339199
Viromer Green Cambridge Bioscience VG-01LB-01
Viromer Blue Cambridge Bioscience VG-01LB-01
Dharmafect DUO Horizon Discovery T-2010-03

248
Lipofectamine 3000 Reagent Invitrogen L3000008,
L3000015
Ficoll Paque Plus GE Healthcare 171440-02
DMEM media Gibco 11885084
RMPI 1640 media Gibco 21875034
Keratinocyte SF media Gibco 17005042
NEAA Gibco 11140050
Sodium Pyruvate Gibco 11360070
Penicillin/Streptomycin Gibco 15070-063
L-glutamine Gibco 17-605E
Trypsin Lonza BE02-007E
Low-endotoxin heat inactivated FBS PAN Biotech P40-37500
Bovine Serum Albumin Sigma-Aldrich A7906
Bovine Serum Albumin, fatty acid free Sigma-Aldrich A8806
Protease Inhibitor Cocktail Sigma-Aldrich P8340
RIPA Lysis Buffer Sigma-Aldrich R0278
Pierce BCA Protein Assay Thermo Fisher
Scientific
23225
Tris Buffered Saline pH 8.0, powder Sigma-Aldrich T6664-10PAK
MOPS SDS Running Buffer (20X) Invitrogen NP0001
MES SDS Running Buffer (20X) Invitrogen NP0002
NuPAGE 4-12% Bis-Tris Protein Gels
10 wells, 15 wells
Invitrogen NP0323PK2,
NP0335PK2
NuPAGE Antioxidant Invitrogen NP0005
Protein Ladder Invitrogen LC5925
Re-blot stripping solution Merck 2504
TopFluor Cholesterol Avanti Polar Lipids 810255
CD14+ microbeads Miltenyi Biotech 130-050-201
High Density Lipoprotein Biorad 5685-2004
Substrate Reagent ELISA R & D DY999

249
A1.2. List of machines and equipment
Machine/Equipment Company
Nanodrop Spectrophotometer Thermo Fisher Scientific
Flow Cytometer, LSR II BD Bioscience
CFX384 C1000 Touch Thermal Cycler Biorad
ChemiDoc TM XRS+ Biorad
C-DiGit ® Blot Scanner, LI-COR LI-COR Biosciences
Microplate Reader, Varioskan Flash Thermo Fisher Scientific
Transilluminator UV InGenius3 Syngene
A1.3. List of antibodies used in western blot and immunofluorescence
Antibody Company and Cat. Number Working Dilution
Trib1 Millipore, 09-126 1:1000 WB, 1:200 IF
Alpha-tubulin Santa Cruz Biotech, sc-5286 1:5000 WB, 1:500 IF
Heat Shock Protein 90 Abcam, ab13495 1:5000 WB
Mouse IgG, Isotype Control Invitrogen, 10400C 1:500 IF
Rabbit IgG, Isotype Control Invitrogen, 10500C 1:500 IF
Anti-Mouse Dako, P0447 1:5000 WB, 1:1000 IF
Anti-Rabbit Dako, P0448 1:5000 WB, 1:1000 IF
DAPI solution Thermo Fisher Scientific, 62248 1:1000 IF

250
A1.4. Plasmids maps
Plasmids were generated in our lab, as described in Chapter 2. Entry plasmids and destination
vectors were purchased by Prof. Endre Kiss-Toth. Below the maps of each plasmid used in this
thesis.
A1.4.1. Firefly reporter plasmid map
Firefly reporter plasmid used in the dual luciferase reporter assay, as internal control, for data
normalisation. Map generated using DNAStar, Laser gene (https://www.dnastar.com).
A1.4.2. Renilla reporter plasmid map
Renilla reporter plasmid used in the dual luciferase reporter assay, as “NO UTR” control. Map
generated using DNAStar, Laser gene (https://www.dnastar.com).
Firefly Reporter plasmid
CMV promoter
Firefly luciferase gene
Destination vector pcDNA4 TO luc-mychis
pEFBOS promoter
Renillaluciferase gene
Renilla Reporter plasmid
Destination vector pGL4.rLuc EF1alpha

251
A1.4.3. TRIB1 3’UTR renilla reporter plasmid map
TRIB1 3’UTR renilla reporter plasmid used in the dual luciferase reporter assay, as test
plasmid. The same plasmid was used to generate miRNA-binding site mutant and SNPs. Map
generated using DNAStar, Laser gene (https://www.dnastar.com).
A1.4.4. Plasmids used for overexpression experiment
Expression plasmid used for overexpressing GFP (left) and TRIB1 (right) in MDMs by
transient transfection (https://www.dnastar.com)
TRIB1 3’UTR Renilla Reporter plasmid
TRIB1 3’UTR Full length
Renilla luciferase gene
pEFBOS promoter
GFP overexpression plasmid hTRIB1 overexpression plasmid

252
A1.5. List of RT-qPCR primers
Gene Forward primer Reverse primer
hTRIB1 CTCCACGGAGGAGAGAACCC GACAAAGCATCATCTTCCCCC
hGAPDH ATTGCCCTCAACGACCACTTT CCCTGTTGCTGTAGCCAAATTC
hIL-4 TCCGATTCCTGAAACGGCTC TGGTTGGCTTCCTTCACAGG
hIL-6 ACCCCCAGGAGAAGATTCCA GATGCCGTCGAGGATGTACC
hIL-8 TGCCAAGGAGTGCTAAAG CTCCACAACCCTCTGCAC
hMSR-1 CGAGGTCCCACTGGAGAAAGT CAATTGCTCCCCGATCACCTTT
hCD36 TCTGTCCTATTGGGAAAGTCACT
G
GAACTGCAATACCTGGCTTTTC
TC
hCD163 AGGAGAGAACTTAGTCCACCA TCAGAATGGCCTCCTTTTCCA
hSPAR-C TGATGGTGCAGAGGAAACCG TGTTCTCATCCAGCTCGCAC
hPD-L1 AGGGCATTCCAGAAAGATGAGG GGTCCTTGGGAACCGTGAC
hVEGF ATGCGGATCAAACCTCACCA GCTCTATCTTTCTTTGGTCTGC
hTNF- CCTGCTGCACTTTGGAGTGA CTTGTCACTCGGGGTTCGAG
hCD80 TGCCTGACCTACTGCTTTGC GGCGTACACTTTCCCTTCTCA
hCD86 CCCAGACCACATTCCTTGGAT TCCCTCTCCATTGTGTTGGT
hFAM26
F
GAGGGCTCGCATCCAAAAGA GTACTGGCCCTTCGGATTGAA
hDICER1 ACCAATCTCAACCAGCCACT TCAAAAGGCAGTGAAGGCGA
hAGO2 GTCACCAAACATTCCCGCTG GTGTTTCTGCTCCTGTCCGA
hABCA1 TACATCTCCCTTCCCGAGCA GGGCCAGAGTCCCAAGACTA
hDUSP1 CCCCACTCTACGATCAGGGT CCTTGCGGGAAGCGTGATA
mTrib1 CTTACATCCAGCTGCCGTCC GTAGGCCTTGCTCTCACCAA
mGapdh TGGCAAAGTGGAGATTGTTGCC AAGATGGTGATGGGCTTCCCG
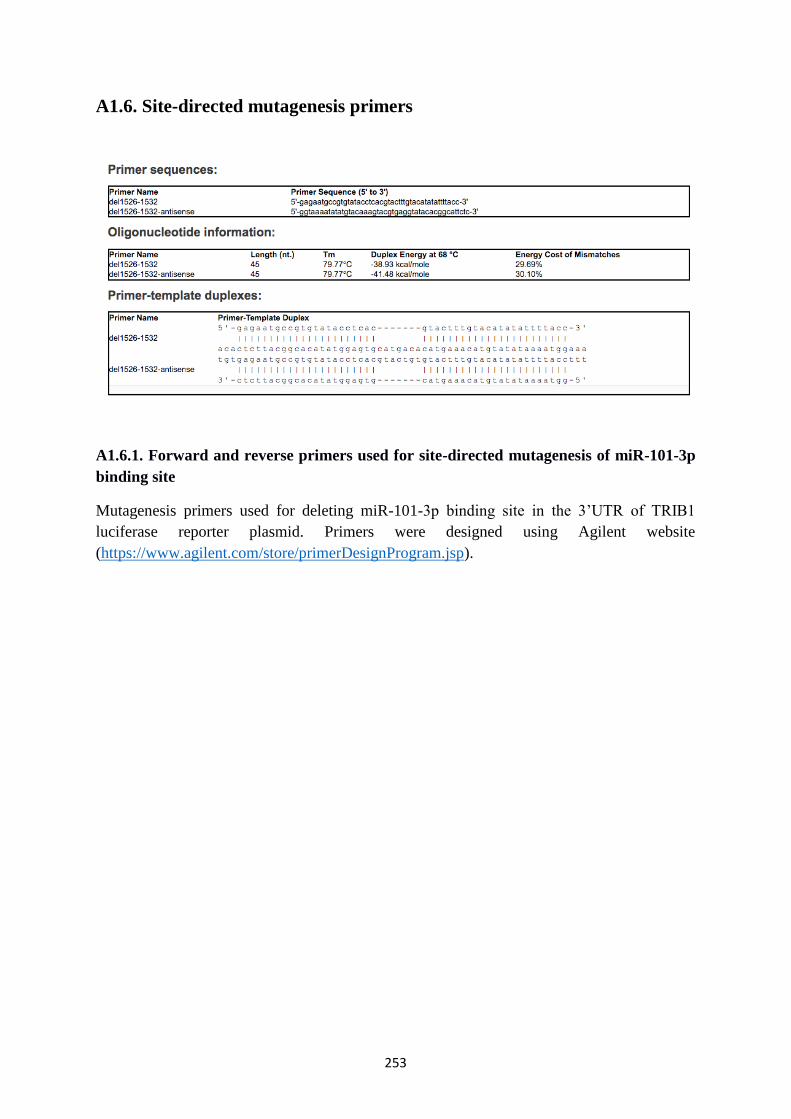
253
A1.6. Site-directed mutagenesis primers
A1.6.1. Forward and reverse primers used for site-directed mutagenesis of miR-101-3p
binding site
Mutagenesis primers used for deleting miR-101-3p binding site in the 3’UTR of TRIB1
luciferase reporter plasmid. Primers were designed using Agilent website
(https://www.agilent.com/store/primerDesignProgram.jsp).

254
A1.6.2. Forward and reverse primers used to generate SNPs in the 3’UTR of TRIB1
Mutagenesis primers used for generating rs62521034(A) and rs56395423 (B, C) in 3’UTR of
TRIB1 renilla luciferase reporter plasmid. Primers were designed using Primer X
(https://www.bioinformatics.org/primerx/).

255
Appendix II, Supplementary data for Chapter 3
This section contains supporting data for Chapter 3, miR-101-3p negatively regulates Tribbles-
1 expression in primary human macrophages.
A2.1. Assessment of CD14+ monocyte purity: flow cytometry
The specificity of the PBMCs isolation protocol was previously confirmed in our group by
using Flow Cytometry (LSR II flow cytometer, BD Bioscience). Monocytes were stained for
both purity and activation by Dr Yang Li (PhD thesis submitted in 2019). More than 90% of
monocytes were detected in total CD14+ PBMCs fraction with minor proportions of cell debris,
lymphocytes and monocyte doublets. Figure 8.2.1. shows the proportion of CD14+ monocytes
(>90%) isolated by myself from two different donors.
A2.1. Assessment of CD14+ monocyte population purity
Flow Cytometry was performed after the positive selection of CD14+ monocytes (human
CD14+ beads- conjugated antibody) to assess the purity of the isolated population (> 90 %).
The figures show two representative experiments. Gating was performed using the intrinsic
parameters of cell size and granularity (SSC and FSC), according to previous gating generated
in our lab.

256
A2.2. Immunofluorescence: isotype controls
For each condition tested in the immunofluorescence we included isotype controls that did not
show any strong signal. Below images taken from a representative sample, the same showed
in Chapter 3.
A2.2. Immunofluorescence isotype controls
Representative immunofluorescence images for Donor B showing polarised MDMs stained for
dapi (blue) mouse Igg (green), rabbit Igg (red). Images were acquired using a 20x objective
magnification.
MU
NM
1 (L
PS+IN
F-γ)
M2a
(IL-
4)
M2c(I
L-10)
DAPIGreen ChannelMouse Igg
Red ChannelRabbit Igg
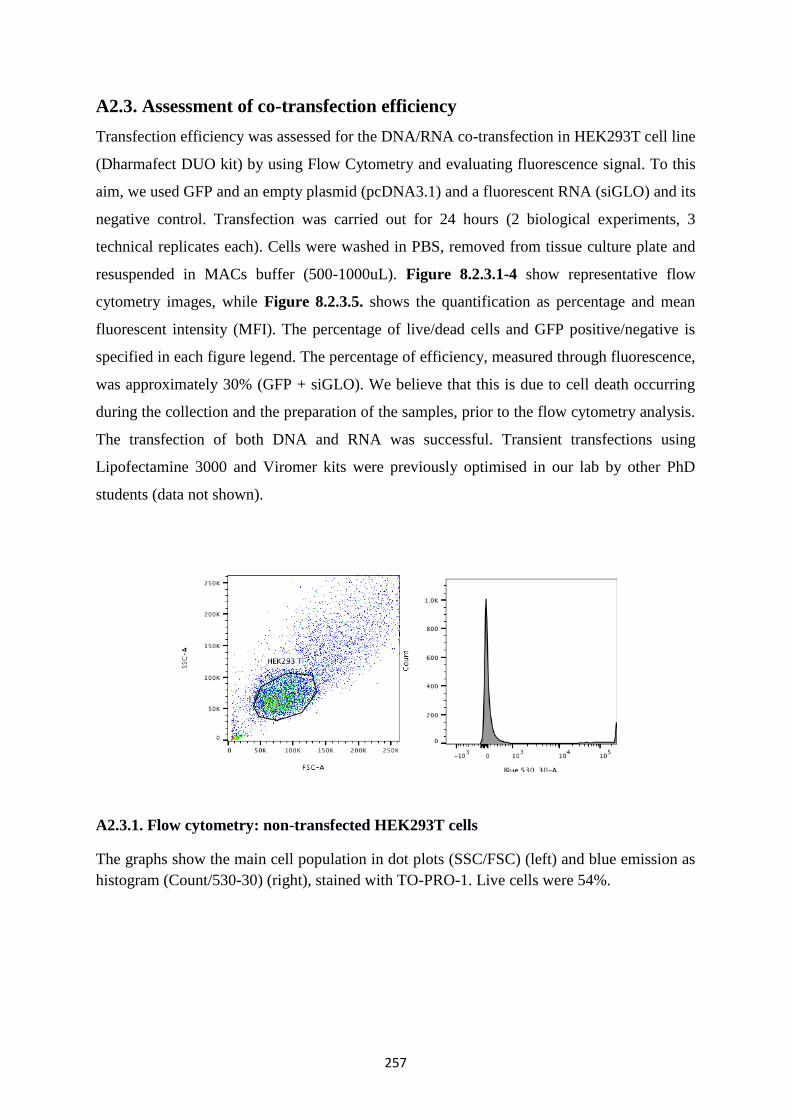
257
A2.3. Assessment of co-transfection efficiency
Transfection efficiency was assessed for the DNA/RNA co-transfection in HEK293T cell line
(Dharmafect DUO kit) by using Flow Cytometry and evaluating fluorescence signal. To this
aim, we used GFP and an empty plasmid (pcDNA3.1) and a fluorescent RNA (siGLO) and its
negative control. Transfection was carried out for 24 hours (2 biological experiments, 3
technical replicates each). Cells were washed in PBS, removed from tissue culture plate and
resuspended in MACs buffer (500-1000uL). Figure 8.2.3.1-4 show representative flow
cytometry images, while Figure 8.2.3.5. shows the quantification as percentage and mean
fluorescent intensity (MFI). The percentage of live/dead cells and GFP positive/negative is
specified in each figure legend. The percentage of efficiency, measured through fluorescence,
was approximately 30% (GFP + siGLO). We believe that this is due to cell death occurring
during the collection and the preparation of the samples, prior to the flow cytometry analysis.
The transfection of both DNA and RNA was successful. Transient transfections using
Lipofectamine 3000 and Viromer kits were previously optimised in our lab by other PhD
students (data not shown).
A2.3.1. Flow cytometry: non-transfected HEK293T cells
The graphs show the main cell population in dot plots (SSC/FSC) (left) and blue emission as
histogram (Count/530-30) (right), stained with TO-PRO-1. Live cells were 54%.
A

258
A2.3.2. Flow cytometry: DNA transfection in HEK293T cells
Histogram and dot plot for GFP (left) and an empty plasmid vector pcDNA3.1 (right). GFP
positive cells were 20%. No blue emission for pcDNA3.1 transfected cells.
A2.3.3. Flow cytometry: DNA and RNA co-transfection in HEK293T cells
Histogram and dot plot for GFP and RNA negative control (left) and an empty plasmid vector
pcDNA3.1 and RNA negative control (right). GFP positive cells were 20%. No blue emission
for pcDNA3.1/RNA control transfection.
GFP pcDNA3.1
B
C
DN
A o
nly
GFP+RNANC pcDNA3.1+RNANC
E
D
DN
A +
RN
A
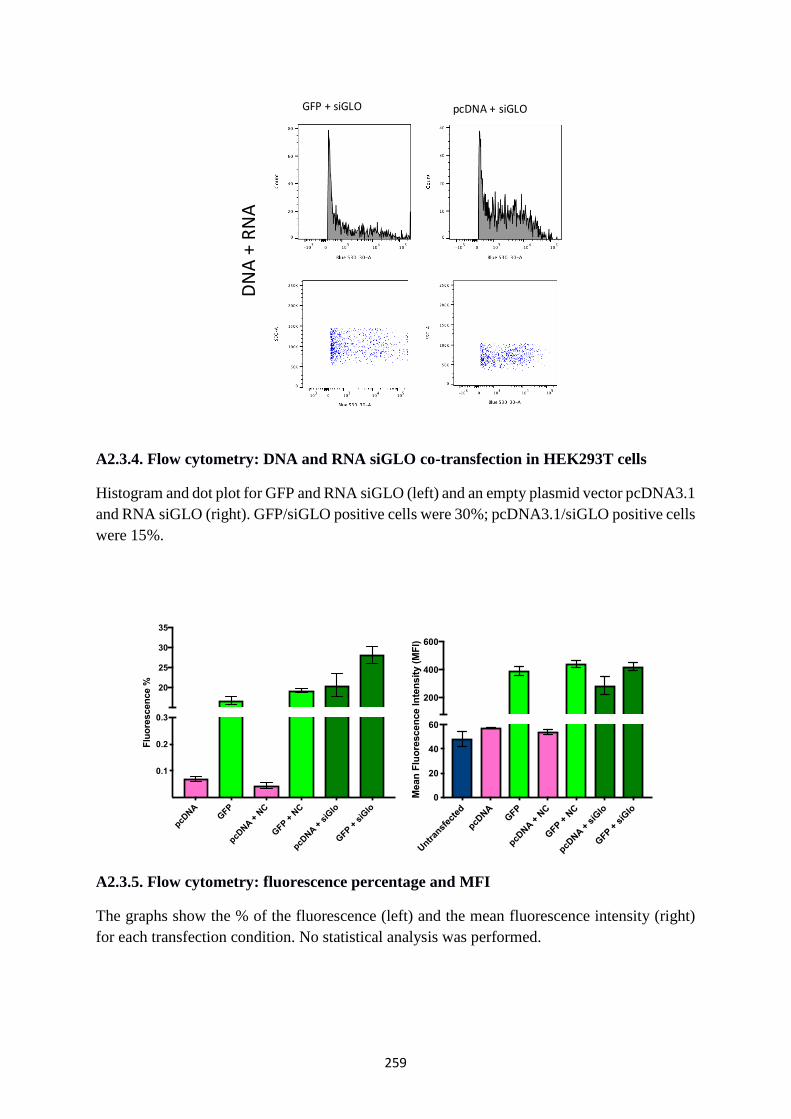
259
A2.3.4. Flow cytometry: DNA and RNA siGLO co-transfection in HEK293T cells
Histogram and dot plot for GFP and RNA siGLO (left) and an empty plasmid vector pcDNA3.1
and RNA siGLO (right). GFP/siGLO positive cells were 30%; pcDNA3.1/siGLO positive cells
were 15%.
A2.3.5. Flow cytometry: fluorescence percentage and MFI
The graphs show the % of the fluorescence (left) and the mean fluorescence intensity (right)
for each transfection condition. No statistical analysis was performed.
GFP+siGLO pcDNA +siGLO
G
F
DN
A +
RN
A
Untr
ansf
ecte
d
pcDNA
GFP
pcDNA +
NC
GFP +
NC
pcDNA +
siG
lo
GFP +
siG
lo
0
20
40
60
200
400
600
Mean
Flu
ore
scen
ce In
ten
sit
y (
MF
I)
pcDNA
GFP
pcDNA +
NC
GFP +
NC
pcDNA +
siG
lo
GFP +
siG
lo
0.1
0.2
0.3
20
25
30
35
Flu
ore
scen
ce %

260
Appendix III, Supplementary data for Chapter 4
This section contains supporting data for Chapter 4, Integrated transcriptome analysis of small
non-coding RNAs and mRNAs in pro-inflammatory macrophages.
A3.1. RNA quality and concentration: representative samples
Prior to RNA-seq experiments, RNA was checked for quality and concentration by the
company Novogene, using agarose gel electrophoresis, nanodrop and the bioanalyser Agilent
2100. Below some representative samples.
A3.1.1. RNA agarose gel electrophoresis: RNA quality assessment
Agarose gel electrophoresis of RNA samples isolated from MDMs and sent for small non-
coding RNA sequencing experiment (GelConc:1%; Voltage:180v; Run Time:16min). The 18S
and 28S ribosomal are clear and RNA appears intact (no additional bands).

261
A3.1.2. Agilent 2100 bioanalyser: RNA quality assessment
RNA quality assessment of a representative sample sent for small non-coding RNA sequencing
experiment: the plot, generated by Agilent 2100 bioanalyser, shows two distinct peaks
corresponding to the S18 and S28 ribosomal subunits. The small peak between 20s and 25s
represents the marker. The RNA Integrity Number (RIN) is 9.5 and indicates that the sample
is intact (RIN is a number between 1 and 10, 1 being the most degraded and 10 the most intact).

262
A3.2. miRNA-seq: overrepresented sequence
As mentioned in Chapter 4, before analysing the small RNA seq, we removed an
overrepresented sequence, corresponding to miR-21. The plot below, generated during the
quality check, shows the % of miR-21 sequence in samples before and after the trimming phase.
A3.2. MultiQC report: overrepresented sequences
MultiQC report plot showing overrepresented sequences in small RNA sequencing experiment.
Blue bars represent miR-21, which was removed from the analysis.
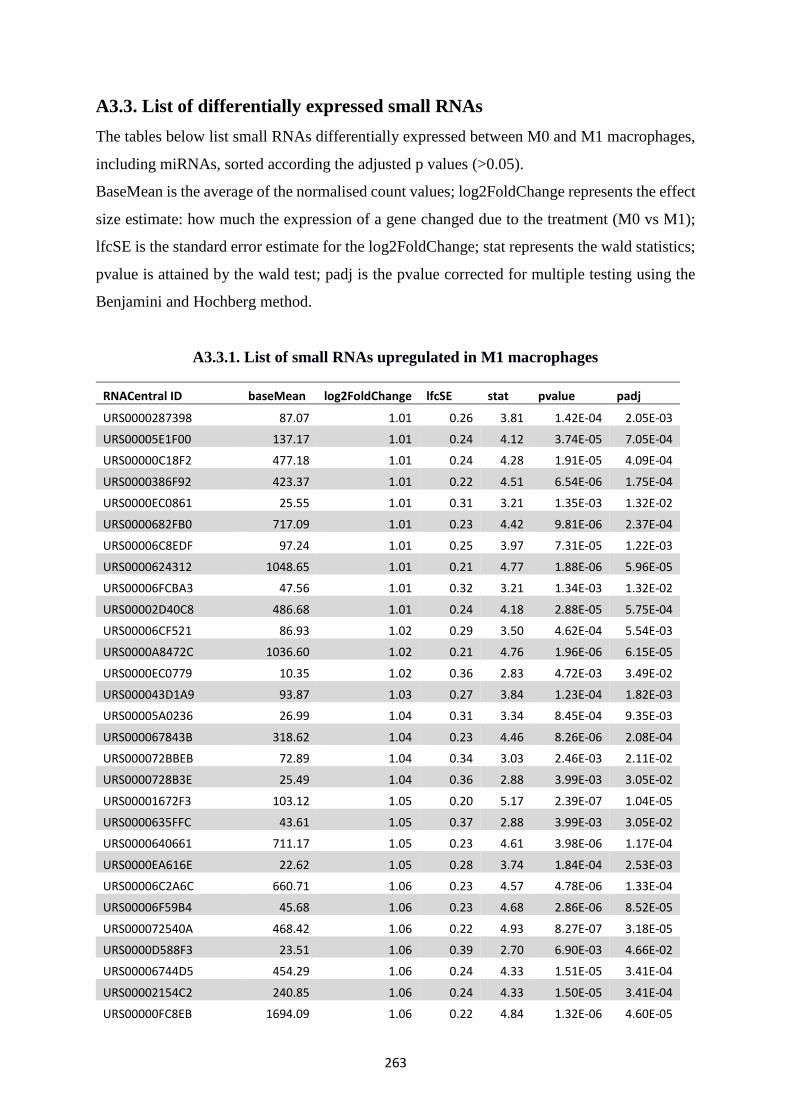
263
A3.3. List of differentially expressed small RNAs
The tables below list small RNAs differentially expressed between M0 and M1 macrophages,
including miRNAs, sorted according the adjusted p values (>0.05).
BaseMean is the average of the normalised count values; log2FoldChange represents the effect
size estimate: how much the expression of a gene changed due to the treatment (M0 vs M1);
lfcSE is the standard error estimate for the log2FoldChange; stat represents the wald statistics;
pvalue is attained by the wald test; padj is the pvalue corrected for multiple testing using the
Benjamini and Hochberg method.
A3.3.1. List of small RNAs upregulated in M1 macrophages
RNACentral ID baseMean log2FoldChange lfcSE stat pvalue padj
URS0000287398 87.07 1.01 0.26 3.81 1.42E-04 2.05E-03
URS00005E1F00 137.17 1.01 0.24 4.12 3.74E-05 7.05E-04
URS00000C18F2 477.18 1.01 0.24 4.28 1.91E-05 4.09E-04
URS0000386F92 423.37 1.01 0.22 4.51 6.54E-06 1.75E-04
URS0000EC0861 25.55 1.01 0.31 3.21 1.35E-03 1.32E-02
URS0000682FB0 717.09 1.01 0.23 4.42 9.81E-06 2.37E-04
URS00006C8EDF 97.24 1.01 0.25 3.97 7.31E-05 1.22E-03
URS0000624312 1048.65 1.01 0.21 4.77 1.88E-06 5.96E-05
URS00006FCBA3 47.56 1.01 0.32 3.21 1.34E-03 1.32E-02
URS00002D40C8 486.68 1.01 0.24 4.18 2.88E-05 5.75E-04
URS00006CF521 86.93 1.02 0.29 3.50 4.62E-04 5.54E-03
URS0000A8472C 1036.60 1.02 0.21 4.76 1.96E-06 6.15E-05
URS0000EC0779 10.35 1.02 0.36 2.83 4.72E-03 3.49E-02
URS000043D1A9 93.87 1.03 0.27 3.84 1.23E-04 1.82E-03
URS00005A0236 26.99 1.04 0.31 3.34 8.45E-04 9.35E-03
URS000067843B 318.62 1.04 0.23 4.46 8.26E-06 2.08E-04
URS000072BBEB 72.89 1.04 0.34 3.03 2.46E-03 2.11E-02
URS0000728B3E 25.49 1.04 0.36 2.88 3.99E-03 3.05E-02
URS00001672F3 103.12 1.05 0.20 5.17 2.39E-07 1.04E-05
URS0000635FFC 43.61 1.05 0.37 2.88 3.99E-03 3.05E-02
URS0000640661 711.17 1.05 0.23 4.61 3.98E-06 1.17E-04
URS0000EA616E 22.62 1.05 0.28 3.74 1.84E-04 2.53E-03
URS00006C2A6C 660.71 1.06 0.23 4.57 4.78E-06 1.33E-04
URS00006F59B4 45.68 1.06 0.23 4.68 2.86E-06 8.52E-05
URS000072540A 468.42 1.06 0.22 4.93 8.27E-07 3.18E-05
URS0000D588F3 23.51 1.06 0.39 2.70 6.90E-03 4.66E-02
URS00006744D5 454.29 1.06 0.24 4.33 1.51E-05 3.41E-04
URS00002154C2 240.85 1.06 0.24 4.33 1.50E-05 3.41E-04
URS00000FC8EB 1694.09 1.06 0.22 4.84 1.32E-06 4.60E-05

264
URS000015A6F8 483.64 1.06 0.25 4.18 2.97E-05 5.89E-04
URS0000521091 497.31 1.07 0.23 4.57 4.77E-06 1.33E-04
URS0000685E74 43.95 1.07 0.27 4.01 6.08E-05 1.06E-03
URS000064074C 84.35 1.08 0.33 3.27 1.08E-03 1.14E-02
URS0000739B5B 81.70 1.08 0.32 3.38 7.29E-04 8.22E-03
URS000020CB8F 473.69 1.08 0.25 4.35 1.33E-05 3.11E-04
URS00006100A0 30.79 1.08 0.33 3.23 1.23E-03 1.23E-02
URS000069A1F2 26.78 1.09 0.30 3.66 2.52E-04 3.32E-03
URS00001AD596 762.43 1.09 0.37 2.94 3.32E-03 2.63E-02
URS000062AA63 30.47 1.10 0.38 2.86 4.25E-03 3.21E-02
URS0000EC1AE8 21.81 1.11 0.39 2.88 3.93E-03 3.02E-02
URS0000659544 397.57 1.11 0.29 3.79 1.53E-04 2.18E-03
URS0000AA94DC 8.77 1.12 0.38 2.94 3.27E-03 2.59E-02
URS0000E82BA2 586.88 1.12 0.29 3.84 1.21E-04 1.80E-03
URS00006F4537 48.47 1.13 0.23 4.83 1.40E-06 4.64E-05
URS000061B694 12821.77 1.13 0.19 5.86 4.72E-09 3.13E-07
URS00006E7A67 36.36 1.13 0.27 4.16 3.24E-05 6.34E-04
URS00002F039B 123.40 1.13 0.41 2.78 5.44E-03 3.88E-02
URS0000311FB0 78.60 1.14 0.23 4.92 8.60E-07 3.26E-05
URS000029EF95 559.55 1.14 0.27 4.21 2.53E-05 5.10E-04
URS00000A8253 123.43 1.14 0.42 2.69 7.12E-03 4.77E-02
URS00006F58F8 27.10 1.14 0.37 3.10 1.94E-03 1.74E-02
URS000022B8AA 557.92 1.14 0.25 4.48 7.35E-06 1.88E-04
URS000065EBC0 32.18 1.14 0.36 3.17 1.50E-03 1.43E-02
URS0000D5EDDD 13.50 1.15 0.35 3.26 1.13E-03 1.17E-02
URS00008B5862 34.04 1.15 0.38 3.03 2.46E-03 2.11E-02
URS00006174C2 167.42 1.15 0.35 3.33 8.70E-04 9.54E-03
URS00004F5239 90.36 1.16 0.30 3.79 1.50E-04 2.15E-03
URS00004A2461 588.86 1.17 0.27 4.29 1.80E-05 3.89E-04
URS0000D5C559 988.23 1.17 0.26 4.54 5.69E-06 1.55E-04
URS000005A7A9 21.94 1.18 0.33 3.62 2.99E-04 3.87E-03
URS00005F7694 770.70 1.18 0.37 3.15 1.62E-03 1.52E-02
URS000045533A 125.06 1.18 0.43 2.74 6.15E-03 4.26E-02
URS000044BAE3 842.59 1.18 0.31 3.78 1.59E-04 2.23E-03
URS0000EA7AA7 248.63 1.18 0.23 5.07 3.89E-07 1.64E-05
URS00000FB60D 171.46 1.18 0.25 4.70 2.56E-06 7.70E-05
URS00004DC6D6 874.55 1.19 0.31 3.87 1.10E-04 1.66E-03
URS0000EBEE05 903.19 1.19 0.33 3.61 3.10E-04 3.98E-03
URS00002F2AEC 896.33 1.19 0.31 3.87 1.09E-04 1.66E-03
URS000006E1E3 906.31 1.20 0.33 3.69 2.28E-04 3.08E-03
URS0000527A9F 238.06 1.21 0.27 4.49 7.24E-06 1.87E-04
URS00006D74B2 106.96 1.21 0.38 3.18 1.49E-03 1.43E-02
URS0000815951 119.39 1.21 0.42 2.86 4.26E-03 3.22E-02

265
URS00003177B8 125.08 1.22 0.40 3.08 2.04E-03 1.81E-02
URS0000DC002B 118.26 1.22 0.45 2.74 6.09E-03 4.24E-02
URS00006C58BC 472.72 1.23 0.34 3.64 2.70E-04 3.52E-03
URS00003E8921 120.23 1.23 0.46 2.70 7.02E-03 4.71E-02
URS000069B369 963.37 1.25 0.29 4.32 1.57E-05 3.48E-04
URS00000A7517 113.71 1.25 0.45 2.75 5.98E-03 4.20E-02
URS000001A289 451.63 1.25 0.32 3.91 9.09E-05 1.45E-03
URS000065BD15 408.85 1.25 0.21 5.89 3.94E-09 2.76E-07
URS00004F76B3 30.79 1.25 0.46 2.74 6.16E-03 4.26E-02
URS0000AEC348 119.35 1.26 0.44 2.86 4.20E-03 3.18E-02
URS000064FAB6 12.52 1.26 0.37 3.40 6.74E-04 7.71E-03
URS000029D0D3 113.47 1.26 0.43 2.95 3.21E-03 2.57E-02
URS0000E53B55 119.19 1.27 0.45 2.79 5.32E-03 3.84E-02
URS00004B70B9 114.28 1.27 0.44 2.87 4.04E-03 3.08E-02
URS000062C4DE 124.52 1.27 0.28 4.57 4.80E-06 1.33E-04
URS00001C308D 1258.45 1.28 0.29 4.34 1.44E-05 3.30E-04
URS00006B2647 21.86 1.28 0.38 3.38 7.27E-04 8.22E-03
URS00005C3DDD 119.56 1.29 0.42 3.09 1.98E-03 1.77E-02
URS00003ECA54 106.19 1.29 0.38 3.40 6.64E-04 7.63E-03
URS00006C8412 10.30 1.29 0.40 3.25 1.17E-03 1.21E-02
URS00006C721A 36.46 1.30 0.36 3.59 3.29E-04 4.15E-03
URS00006C06E6 33.15 1.30 0.40 3.24 1.19E-03 1.21E-02
URS00006914B1 7.58 1.31 0.48 2.71 6.80E-03 4.61E-02
URS0000DC92B6 121.89 1.32 0.44 2.96 3.07E-03 2.49E-02
URS00006A9AE8 128.39 1.33 0.28 4.73 2.22E-06 6.89E-05
URS000064A807 20.27 1.33 0.48 2.81 4.99E-03 3.64E-02
URS0000EBF1EC 998.21 1.34 0.21 6.26 3.95E-10 2.95E-08
URS000066C003 478.34 1.34 0.23 5.73 1.02E-08 6.21E-07
URS0000677B31 16.23 1.34 0.33 4.02 5.90E-05 1.04E-03
URS0000190FE5 275.18 1.35 0.26 5.24 1.59E-07 7.62E-06
URS000074CBFD 760.51 1.36 0.21 6.41 1.48E-10 1.17E-08
URS00006D1B55 32.18 1.36 0.40 3.38 7.37E-04 8.27E-03
URS000040DCFF 1826.38 1.36 0.17 8.09 6.10E-16 1.11E-13
URS000068668E 21.52 1.36 0.36 3.83 1.29E-04 1.90E-03
URS000042F13F 169.74 1.37 0.24 5.69 1.28E-08 7.61E-07
URS0000B01320 114.06 1.38 0.44 3.13 1.72E-03 1.59E-02
URS00000AA464 22.03 1.39 0.40 3.50 4.59E-04 5.53E-03
URS00003361F9 21.05 1.39 0.52 2.69 7.14E-03 4.77E-02
URS000063FB43 2232.93 1.40 0.52 2.71 6.68E-03 4.57E-02
URS00005EA0AD 137.27 1.41 0.29 4.83 1.36E-06 4.61E-05
URS00001123BD 24.72 1.41 0.33 4.24 2.20E-05 4.59E-04
URS0000147B41 24.96 1.42 0.30 4.72 2.39E-06 7.26E-05
URS0000AC252C 107.78 1.43 0.45 3.14 1.67E-03 1.55E-02

266
URS0000591950 298.69 1.44 0.21 6.80 1.07E-11 1.08E-09
URS00003496BE 71.05 1.44 0.25 5.82 5.88E-09 3.81E-07
URS00006E357A 31.67 1.45 0.36 4.05 5.18E-05 9.40E-04
URS0000A9690B 8.42 1.46 0.46 3.17 1.51E-03 1.43E-02
URS0000158189 7.96 1.46 0.49 2.99 2.78E-03 2.32E-02
URS00007362AD 32.78 1.46 0.32 4.55 5.36E-06 1.48E-04
URS00007063CB 7.55 1.46 0.49 2.98 2.86E-03 2.35E-02
URS00006A9C77 15.10 1.47 0.35 4.23 2.29E-05 4.67E-04
URS0000244A71 5.05 1.47 0.55 2.67 7.57E-03 4.97E-02
URS0000757938 33.15 1.47 0.38 3.83 1.31E-04 1.91E-03
URS00004B1671 1602.06 1.48 0.31 4.83 1.34E-06 4.61E-05
URS0000E13005 60.86 1.49 0.51 2.93 3.39E-03 2.66E-02
URS00006B6C08 5.28 1.51 0.52 2.91 3.61E-03 2.80E-02
URS00006CFACA 32.52 1.51 0.46 3.27 1.07E-03 1.13E-02
URS000013899F 122.72 1.53 0.30 5.05 4.36E-07 1.77E-05
URS0000758A62 26.41 1.55 0.40 3.90 9.43E-05 1.48E-03
URS0000648E1F 27.93 1.56 0.38 4.08 4.54E-05 8.28E-04
URS0000DEEC0E 16.29 1.58 0.52 3.02 2.54E-03 2.15E-02
URS000068FD04 697.14 1.60 0.28 5.63 1.79E-08 1.02E-06
URS00004208C5 1644.39 1.60 0.18 8.89 5.88E-19 1.77E-16
URS000038D768 14.98 1.60 0.41 3.90 9.81E-05 1.51E-03
URS000073124E 82.23 1.61 0.29 5.63 1.82E-08 1.02E-06
URS0000697465 79.61 1.61 0.28 5.78 7.31E-09 4.64E-07
URS000069E2A5 4.75 1.62 0.60 2.69 7.17E-03 4.78E-02
URS000047C79B 15.64 1.62 0.34 4.81 1.53E-06 4.97E-05
URS000068C733 7.54 1.63 0.51 3.17 1.51E-03 1.43E-02
URS000071ED2F 32.58 1.65 0.44 3.75 1.74E-04 2.42E-03
URS00004F0321 6947.27 1.67 0.39 4.24 2.19E-05 4.59E-04
URS00005402A5 14.84 1.67 0.63 2.67 7.54E-03 4.95E-02
URS000011CFE8 5919.12 1.67 0.45 3.70 2.18E-04 2.97E-03
URS0000635088 6939.36 1.69 0.39 4.31 1.66E-05 3.61E-04
URS0000593537 178.13 1.70 0.26 6.48 9.34E-11 7.58E-09
URS0000282AB2 17.19 1.70 0.40 4.24 2.27E-05 4.67E-04
URS00001B460B 13.16 1.72 0.43 3.99 6.67E-05 1.14E-03
URS000037F5E2 14.04 1.73 0.38 4.51 6.39E-06 1.73E-04
URS0000D6E1B0 13.80 1.74 0.47 3.71 2.11E-04 2.87E-03
URS00007F742E 17.76 1.76 0.65 2.70 6.89E-03 4.66E-02
URS00007EC19C 15.95 1.77 0.66 2.69 7.23E-03 4.81E-02
URS000057E781 11.63 1.78 0.63 2.83 4.69E-03 3.47E-02
URS0000DE23D7 20.05 1.81 0.67 2.70 6.91E-03 4.66E-02
URS0000381B86 5.17 1.82 0.60 3.05 2.32E-03 2.02E-02
URS000038C474 12.65 1.85 0.45 4.14 3.41E-05 6.60E-04
URS0000804A0D 17.53 1.86 0.69 2.71 6.76E-03 4.60E-02

267
URS000031B6ED 8.28 1.87 0.45 4.13 3.58E-05 6.78E-04
URS0000807EA6 15.59 1.89 0.61 3.10 1.93E-03 1.74E-02
URS00004AC6E6 12.04 1.92 0.64 3.02 2.56E-03 2.16E-02
URS00004AA2F0 16.02 1.92 0.66 2.91 3.61E-03 2.80E-02
URS00003130BD 257.42 1.93 0.42 4.60 4.25E-06 1.23E-04
URS0000DDA3BB 18.37 1.93 0.64 3.01 2.64E-03 2.21E-02
URS000042B8BF 8.61 1.94 0.48 4.03 5.55E-05 9.88E-04
URS0000DC3018 15.45 1.97 0.72 2.75 5.90E-03 4.15E-02
URS00007E8E68 16.95 2.01 0.65 3.10 1.91E-03 1.73E-02
URS00006D3DD2 13.22 2.03 0.45 4.50 6.89E-06 1.83E-04
URS000034E9D0_63221 17.02 2.08 0.65 3.19 1.42E-03 1.38E-02
URS0000DE2957 15.57 2.09 0.65 3.23 1.26E-03 1.25E-02
URS000075BEBE 35.93 2.09 0.37 5.64 1.75E-08 1.02E-06
URS0000E339B7 232.38 2.09 0.41 5.11 3.31E-07 1.42E-05
URS000048FEBE 16.21 2.16 0.58 3.75 1.80E-04 2.48E-03
URS00001F5B39 15.61 2.16 0.42 5.18 2.17E-07 9.59E-06
URS00008EE2B1 9.42 2.20 0.68 3.24 1.21E-03 1.22E-02
URS000070BF11 7.11 2.27 0.56 4.03 5.51E-05 9.88E-04
URS00001F0C23 55.30 2.32 0.35 6.70 2.05E-11 1.93E-09
URS00006E19EA 397.35 2.33 0.30 7.85 4.14E-15 6.72E-13
URS0000424278 300.29 2.37 0.32 7.37 1.69E-13 2.15E-11
URS000023FB43 6.16 2.45 0.72 3.42 6.19E-04 7.17E-03
URS0000338542 35900.61 2.52 0.22 11.34 8.78E-30 8.54E-27
URS000019676E 23.14 2.83 0.42 6.72 1.88E-11 1.83E-09
URS0000D54CAD 211862.08 2.83 0.23 12.05 1.89E-33 2.76E-30
URS00002198F3 16.15 2.95 0.45 6.58 4.59E-11 3.83E-09
URS0000199B53 6.45 2.95 0.90 3.27 1.08E-03 1.14E-02
URS00006E0DAF 5.89 3.11 0.68 4.60 4.20E-06 1.23E-04
URS0000688DD3 32.64 3.13 0.43 7.29 3.17E-13 3.70E-11
URS0000CFBCCA 6.30 3.16 0.64 4.93 8.17E-07 3.18E-05
URS00006BACE4 33.42 3.24 0.36 8.92 4.66E-19 1.70E-16
URS000034309A 8.34 3.31 0.87 3.79 1.54E-04 2.18E-03
URS00003D4175 66.96 3.59 0.44 8.17 3.01E-16 5.87E-14
URS0000054224 69.14 3.77 0.45 8.30 1.06E-16 2.21E-14
URS0000EBB7A5 4.98 3.90 0.95 4.10 4.20E-05 7.81E-04
URS000001C659 7.14 4.50 0.93 4.83 1.40E-06 4.64E-05
URS00002DABEA 13.47 4.97 0.74 6.67 2.56E-11 2.27E-09
URS0000410073 11.84 6.73 0.86 7.82 5.47E-15 8.40E-13

268
A3.3.2. List of small RNAs downregulated in M1 macrophages
RNACentral ID baseMean log2FoldChange lfcSE stat pvalue padj
URS00002B2B5C 15.60 -4.75 0.61 -7.85 4.02E-15 6.72E-13
URS000002103A 11.92 -4.60 0.63 -7.33 2.22E-13 2.70E-11
URS00000DA3DF 8.82 -4.13 0.79 -5.24 1.65E-07 7.75E-06
URS000056B04E 240.87 -3.61 0.30 -
12.13 7.05E-34 2.06E-30
URS00006E0B8F 14.77 -3.30 0.55 -5.95 2.64E-09 1.93E-07
URS00004FCB5F 6.12 -3.24 0.72 -4.48 7.60E-06 1.93E-04
URS00001C770D 15.83 -3.04 0.41 -7.47 8.12E-14 1.08E-11
URS000075E96D 35.02 -2.97 0.39 -7.62 2.60E-14 3.62E-12
URS00006E020B 15.90 -2.86 0.45 -6.36 2.00E-10 1.54E-08
URS000007ACA1 6.30 -2.71 0.69 -3.91 9.36E-05 1.48E-03
URS000064426B 5.29 -2.62 0.62 -4.24 2.27E-05 4.67E-04
URS0000237FB8 64.70 -2.52 0.28 -9.01 2.06E-19 8.58E-17
URS00008B5FCF 5.79 -2.40 0.76 -3.15 1.61E-03 1.51E-02
URS000003ABC4 22.32 -2.37 0.55 -4.32 1.56E-05 3.47E-04
URS0000E9F36E 6.20 -2.32 0.62 -3.78 1.60E-04 2.23E-03
URS00006F9520 5.46 -2.25 0.65 -3.44 5.79E-04 6.82E-03
URS000005D4F5 407.73 -2.21 0.24 -9.16 5.00E-20 2.43E-17
URS00001597DC 11.68 -2.18 0.39 -5.57 2.56E-08 1.41E-06
URS000067E5FF 5.14 -2.17 0.64 -3.38 7.23E-04 8.21E-03
URS0000CB6503 11.29 -2.16 0.51 -4.25 2.16E-05 4.58E-04
URS00006C0B51 371.11 -2.13 0.23 -9.24 2.44E-20 1.43E-17
URS0000CA62EF 12.80 -2.00 0.38 -5.32 1.07E-07 5.27E-06
URS000075AEBC 5.52 -1.99 0.60 -3.32 9.02E-04 9.76E-03
URS0000564C39 76.06 -1.93 0.20 -9.55 1.33E-21 9.70E-19
URS00002CBC6D 280.84 -1.87 0.21 -8.72 2.78E-18 7.38E-16
URS00006E4867 9.68 -1.85 0.63 -2.95 3.19E-03 2.57E-02
URS00003FFA6C 20.68 -1.84 0.33 -5.51 3.51E-08 1.90E-06
URS0000045DBD 163.60 -1.80 0.20 -8.89 6.07E-19 1.77E-16
URS0000D55DFB 14.74 -1.73 0.52 -3.33 8.53E-04 9.40E-03
URS000075C34D 288.28 -1.71 0.29 -5.89 3.97E-09 2.76E-07
URS00004E57E7 65.82 -1.66 0.23 -7.11 1.16E-12 1.28E-10
URS0000BB15D5 18.11 -1.66 0.39 -4.25 2.12E-05 4.52E-04
URS0000241987 172.07 -1.65 0.29 -5.76 8.52E-09 5.29E-07
URS00006DF24F 39564.84 -1.64 0.25 -6.67 2.57E-11 2.27E-09
URS0000080D0A 809.22 -1.63 0.20 -8.32 8.94E-17 2.01E-14
URS00002F8148 9.54 -1.62 0.45 -3.58 3.43E-04 4.29E-03
URS0000384021 23.54 -1.60 0.29 -5.45 5.04E-08 2.67E-06
URS00005092C2 8.62 -1.59 0.41 -3.86 1.12E-04 1.69E-03
URS00001012BC 58.79 -1.56 0.22 -7.11 1.19E-12 1.28E-10
URS0000EA6322 11.91 -1.56 0.43 -3.64 2.75E-04 3.57E-03

269
URS0000065D58 18.51 -1.52 0.42 -3.60 3.18E-04 4.05E-03
URS00006CE6B7 10.59 -1.50 0.42 -3.55 3.88E-04 4.78E-03
URS000052AB63 14.50 -1.49 0.38 -3.90 9.82E-05 1.51E-03
URS0000EBB075 6.86 -1.47 0.50 -2.93 3.35E-03 2.64E-02
URS000075C652 7.78 -1.46 0.49 -2.99 2.79E-03 2.32E-02
URS00006AFF4E 8.22 -1.43 0.46 -3.10 1.96E-03 1.76E-02
URS000008230A 7.19 -1.40 0.51 -2.75 6.05E-03 4.22E-02
URS000015D23B 22.22 -1.39 0.31 -4.50 6.96E-06 1.83E-04
URS00004B2A47 49.73 -1.37 0.29 -4.81 1.51E-06 4.96E-05
URS0000079D48 196.05 -1.36 0.28 -4.90 9.73E-07 3.55E-05
URS000066288D 8.32 -1.36 0.43 -3.14 1.67E-03 1.55E-02
URS0000662807 466.45 -1.33 0.15 -8.64 5.50E-18 1.34E-15
URS00000BD1DE 24.48 -1.30 0.36 -3.66 2.54E-04 3.33E-03
URS00001C85C7 12.23 -1.29 0.42 -3.04 2.34E-03 2.02E-02
URS00004C9052 100.63 -1.26 0.28 -4.45 8.43E-06 2.09E-04
URS000023BE29 154.63 -1.26 0.30 -4.14 3.41E-05 6.60E-04
URS000044EF2B 29.80 -1.25 0.42 -2.96 3.05E-03 2.48E-02
URS0000424D74 25.17 -1.24 0.25 -4.89 1.01E-06 3.65E-05
URS000060AABB 428.54 -1.22 0.16 -7.63 2.36E-14 3.45E-12
URS00000CF1D2 827.74 -1.22 0.18 -6.63 3.38E-11 2.90E-09
URS0000EABDD4 23.02 -1.21 0.30 -4.03 5.59E-05 9.88E-04
URS000062982B 12.85 -1.18 0.42 -2.83 4.63E-03 3.44E-02
URS0000383E7F 9.07 -1.18 0.44 -2.68 7.44E-03 4.91E-02
URS00003E16E5 140.82 -1.15 0.23 -5.07 4.08E-07 1.68E-05
URS0000246356 23.42 -1.14 0.34 -3.32 8.91E-04 9.70E-03
URS0000554A4F 33.16 -1.09 0.28 -3.93 8.49E-05 1.38E-03
URS00002CDFCA 32.60 -1.08 0.30 -3.59 3.34E-04 4.21E-03
URS000023133F 31.81 -1.08 0.34 -3.16 1.58E-03 1.49E-02
URS000003F252 1081.27 -1.07 0.20 -5.35 8.95E-08 4.58E-06
URS000071E3CB 24.12 -1.06 0.33 -3.24 1.20E-03 1.22E-02
URS00000451A1 131428.28 -1.05 0.21 -5.07 3.93E-07 1.64E-05
URS0000679788 220.26 -1.04 0.24 -4.31 1.63E-05 3.58E-04
URS0000156390 43.49 -1.04 0.35 -2.99 2.80E-03 2.32E-02
URS0000629ECF 14.16 -1.03 0.37 -2.74 6.18E-03 4.27E-02
URS0000259CF4 116.17 -1.02 0.21 -4.90 9.60E-07 3.55E-05
URS000050E4BA 1798.91 -1.00 0.19 -5.22 1.81E-07 8.37E-06
URS0000644074 2342.84 -1.00 0.19 -5.35 8.87E-08 4.58E-06

270
A3.4. List of differentially expressed genes
The tables below list the genes differentially expressed in response to miRNAs overexpression,
sorted according to the adjusted p values (>0.05).
LogFC represents the log2 fold change, AveExpr is the average expression over all samples
(CPM values); stat represents the wald statistics; pvalue is attained by the wald test; padj is the
pvalue corrected for multiple testing using the Benjamini and Hochberg method.
A3.4.1. List of genes significantly downregulated in miR-155-5p overexpressing
macrophages
Gene logFC AveExpr stat P.Value adj.P.Val
SLC1A3 -1.02 8.12 -11.97 1.47E-10 4.62E-07 ARHGAP18 -1.14 6.22 -10.84 8.33E-10 9.56E-07 CSF1R -1.20 7.47 -10.61 1.19E-09 1.19E-06 MOCS2 -1.34 4.19 -10.50 1.44E-09 1.27E-06 MPEG1 -2.30 6.53 -10.48 1.47E-09 1.27E-06 MARCHF1 -1.62 6.33 -9.63 6.07E-09 3.35E-06 PICALM -1.13 8.00 -9.16 1.39E-08 5.73E-06 ANXA2 -0.81 11.04 -9.01 1.83E-08 6.60E-06 PTPN22 -1.64 4.00 -8.71 3.15E-08 9.17E-06
SPRED1 -1.65 4.28 -8.71 3.11E-08 9.17E-06 GATM -1.51 4.00 -8.19 8.32E-08 1.75E-05 TBC1D14 -1.19 5.54 -8.00 1.20E-07 2.22E-05 MARVELD1 -1.32 3.46 -7.97 1.26E-07 2.27E-05 NRP1 -1.12 7.36 -7.90 1.44E-07 2.48E-05 CSE1L -0.65 5.42 -7.90 1.45E-07 2.48E-05
NME4 -0.95 3.70 -7.83 1.66E-07 2.68E-05 IKBIP -1.23 3.72 -7.79 1.78E-07 2.76E-05 ABHD6 -1.31 4.13 -7.68 2.22E-07 2.98E-05 MRPS27 -0.75 4.73 -7.64 2.42E-07 3.13E-05 MEX3B -1.29 1.98 -7.58 2.69E-07 3.38E-05
TM6SF1 -1.32 5.12 -7.46 3.43E-07 3.93E-05 TGFBR1 -1.30 5.53 -7.36 4.17E-07 4.54E-05 OPRL1 -1.79 0.28 -7.24 5.36E-07 5.31E-05 FMNL2 -0.46 7.31 -6.97 9.21E-07 7.88E-05 S1PR3 -2.86 -2.86 -6.95 9.68E-07 8.14E-05 POLE3 -0.63 5.17 -6.90 1.08E-06 8.87E-05 SLC25A43 -0.70 4.58 -6.84 1.22E-06 9.39E-05 RCBTB2 -0.57 6.46 -6.78 1.38E-06 1.03E-04 CD36 -1.08 9.03 -6.66 1.79E-06 1.26E-04 BACH1 -0.86 6.54 -6.59 2.05E-06 1.36E-04 FGD5 -2.51 2.00 -6.54 2.30E-06 1.48E-04 AGTRAP -0.71 6.09 -6.35 3.43E-06 1.93E-04

271
RAB6A -0.35 6.98 -6.29 3.92E-06 2.11E-04
AP1B1 -0.49 7.30 -6.28 3.99E-06 2.13E-04 NBPF1 -0.83 5.37 -6.19 4.88E-06 2.44E-04 GPD1L -1.28 2.67 -5.98 7.72E-06 3.31E-04 CDC25A -2.83 -0.45 -5.93 8.46E-06 3.53E-04 UROS -0.65 5.05 -5.94 8.46E-06 3.53E-04 FITM2 -0.97 1.99 -5.92 8.69E-06 3.58E-04 E2F2 -2.53 -1.26 -5.75 1.27E-05 4.70E-04 IL16 -1.82 3.25 -5.74 1.31E-05 4.80E-04 PFKFB2 -0.87 3.48 -5.73 1.33E-05 4.86E-04 RXRA -0.74 6.21 -5.67 1.52E-05 5.37E-04 RGS18 -2.53 -0.16 -5.65 1.60E-05 5.56E-04
CIAO1 -0.53 6.12 -5.63 1.66E-05 5.72E-04 DUSP10 -0.56 5.23 -5.63 1.66E-05 5.72E-04 VWA8 -0.58 4.86 -5.62 1.70E-05 5.78E-04 TGFBR2 -0.84 6.01 -5.59 1.81E-05 6.05E-04 NDUFV3 -0.58 4.76 -5.57 1.91E-05 6.28E-04 LGI2 -3.03 -1.97 -5.54 2.04E-05 6.54E-04 CLINT1 -0.47 5.94 -5.51 2.17E-05 6.88E-04 PARVB -0.75 5.99 -5.46 2.41E-05 7.40E-04 HMGCR -0.92 5.67 -5.37 2.98E-05 8.57E-04 PCCA -1.11 3.30 -5.37 2.99E-05 8.59E-04 MYO1D -0.80 4.96 -5.36 3.05E-05 8.71E-04
BRI3BP -0.87 4.38 -5.34 3.16E-05 8.95E-04 SORL1 -1.34 3.76 -5.34 3.20E-05 9.03E-04 DIS3L -0.91 3.88 -5.34 3.22E-05 9.07E-04 INPP5A -1.02 2.34 -5.30 3.46E-05 9.59E-04 PTDSS1 -0.34 6.63 -5.27 3.72E-05 1.01E-03 PRKDC -1.01 6.51 -5.22 4.18E-05 1.09E-03 SPARC -1.12 8.18 -5.20 4.42E-05 1.13E-03 HSPA5 -0.61 9.61 -5.19 4.46E-05 1.14E-03 SGK3 -0.71 6.76 -5.15 4.94E-05 1.23E-03 SGK3 -0.71 6.76 -5.15 4.94E-05 1.23E-03 ANKH -1.17 3.96 -5.11 5.36E-05 1.30E-03
FXN -0.98 2.36 -5.11 5.44E-05 1.32E-03 RNF166 -1.08 4.28 -5.10 5.47E-05 1.32E-03 RAB11FIP2 -0.62 4.19 -5.09 5.60E-05 1.34E-03 MXI1 -0.62 3.76 -5.04 6.25E-05 1.46E-03 RRM2 -2.21 1.69 -5.04 6.35E-05 1.47E-03 USP31 -0.68 3.16 -4.99 7.09E-05 1.58E-03 SFXN2 -1.84 1.13 -4.92 8.38E-05 1.78E-03 MRS2 -0.54 5.27 -4.90 8.71E-05 1.84E-03 SNX29 -0.58 5.18 -4.81 1.06E-04 2.10E-03 TP53INP1 -0.54 4.76 -4.78 1.14E-04 2.21E-03 MBNL3 -0.93 3.51 -4.75 1.23E-04 2.32E-03
HACD1 -1.12 0.95 -4.64 1.58E-04 2.80E-03

272
SLC26A11 -0.51 8.52 -4.63 1.64E-04 2.87E-03
LRP12 -0.77 5.14 -4.60 1.75E-04 3.02E-03 HLTF -1.09 3.20 -4.59 1.77E-04 3.04E-03 EEPD1 -0.99 4.98 -4.57 1.88E-04 3.17E-03 CCT2 -0.35 6.55 -4.56 1.92E-04 3.22E-03 MMD -1.09 3.38 -4.51 2.13E-04 3.48E-03 RBFA -0.63 2.75 -4.48 2.30E-04 3.64E-03 FASTKD1 -0.56 4.84 -4.48 2.31E-04 3.65E-03 EEFSEC -0.61 3.64 -4.47 2.35E-04 3.70E-03 OTULINL -1.20 2.89 -4.36 3.06E-04 4.49E-03 SLC7A11 -0.88 7.33 -4.34 3.23E-04 4.68E-03 DOK2 -1.20 2.82 -4.33 3.26E-04 4.72E-03
TM7SF3 -0.53 5.89 -4.31 3.42E-04 4.90E-03 CYP7B1 -1.93 -2.26 -4.23 4.10E-04 5.67E-03 DENND2B -1.55 1.89 -4.23 4.12E-04 5.70E-03 OXA1L -0.39 6.66 -4.23 4.14E-04 5.72E-03 STRN3 -0.55 4.22 -4.23 4.15E-04 5.73E-03 NOLC1 -0.38 5.26 -4.22 4.23E-04 5.82E-03 RAB32 -0.65 4.78 -4.21 4.31E-04 5.89E-03 EPAS1 -0.69 7.17 -4.20 4.45E-04 6.01E-03 CMTM4 -0.88 2.81 -4.20 4.48E-04 6.04E-03 SYT1 -2.77 -1.98 -4.15 4.96E-04 6.53E-03 LIN7A -3.05 -0.96 -4.15 5.02E-04 6.59E-03
CRHBP -1.53 -1.27 -4.13 5.17E-04 6.72E-03 AMIGO1 -1.70 -0.05 -4.10 5.64E-04 7.17E-03 ACVR1 -0.39 4.81 -4.08 5.87E-04 7.39E-03 EBPL -0.79 1.32 -4.06 6.19E-04 7.70E-03 ARFGAP3 -0.33 6.40 -4.05 6.23E-04 7.74E-03 MPI -0.75 3.59 -4.05 6.31E-04 7.82E-03 TMED3 -0.56 6.39 -4.03 6.63E-04 8.09E-03 ELL2 -0.50 6.26 -3.98 7.44E-04 8.81E-03 HIF1A -0.32 7.18 -3.96 7.68E-04 9.04E-03 TRIM32 -0.59 2.20 -3.94 8.05E-04 9.35E-03 ABHD2 -0.74 7.87 -3.86 9.80E-04 1.08E-02
ABAT -0.82 2.52 -3.83 1.05E-03 1.13E-02 TMEM218 -0.53 3.96 -3.79 1.17E-03 1.23E-02 CD84 -0.67 9.68 -3.78 1.17E-03 1.23E-02 CHAF1A -0.67 3.63 -3.77 1.21E-03 1.26E-02 GRHPR -0.43 5.04 -3.74 1.29E-03 1.33E-02 RNF26 -0.34 4.42 -3.74 1.30E-03 1.33E-02 DTNA -1.02 1.70 -3.66 1.55E-03 1.52E-02 PCLAF -1.60 -0.42 -3.65 1.58E-03 1.55E-02 KDM5B -0.52 4.98 -3.63 1.66E-03 1.60E-02 SLC2A9 -0.60 3.54 -3.63 1.67E-03 1.61E-02 CLCN4 -1.85 -1.36 -3.58 1.89E-03 1.78E-02
ANTXR1 -2.26 -2.39 -3.56 1.98E-03 1.84E-02

273
DUSP7 -0.86 4.56 -3.54 2.05E-03 1.89E-02
PSMG1 -0.46 3.84 -3.51 2.23E-03 2.01E-02 KCNJ1 -0.71 3.96 -3.46 2.49E-03 2.17E-02 KLHL32 -1.58 0.01 -3.42 2.70E-03 2.31E-02 MEGF6 -0.95 1.94 -3.39 2.90E-03 2.44E-02 GMNN -0.62 2.85 -3.39 2.92E-03 2.45E-02 METRN -0.65 2.24 -3.37 3.07E-03 2.54E-02 ZHX3 -1.12 3.40 -3.36 3.15E-03 2.59E-02 ATP5F1A -0.45 8.59 -3.35 3.20E-03 2.62E-02 CTDSPL -0.79 3.32 -3.32 3.46E-03 2.78E-02 TNIK -0.39 6.21 -3.31 3.50E-03 2.81E-02 CDCA3 -1.45 -0.95 -3.31 3.53E-03 2.83E-02
GATB -0.37 4.60 -3.29 3.64E-03 2.89E-02 TMEM236 -1.47 -0.75 -3.29 3.65E-03 2.90E-02 PPP5C -0.28 5.17 -3.22 4.33E-03 3.30E-02 NME2 -0.40 7.37 -3.21 4.36E-03 3.31E-02 ITGAV -0.52 6.69 -3.21 4.42E-03 3.34E-02 PLXDC2 -0.45 7.19 -3.20 4.52E-03 3.40E-02 RAPH1 -0.62 3.64 -3.17 4.87E-03 3.60E-02 NDUFAF6 -0.60 2.91 -3.14 5.20E-03 3.79E-02 RASSF8 -0.72 2.43 -3.13 5.28E-03 3.83E-02 VKORC1L1 -0.24 5.36 -3.12 5.40E-03 3.89E-02 TRIP13 -1.25 0.30 -3.10 5.60E-03 4.00E-02
OTUB2 -0.66 2.90 -3.10 5.66E-03 4.04E-02 GOLGA3 -0.42 6.13 -3.09 5.81E-03 4.11E-02 GFPT1 -0.47 5.76 -3.07 6.09E-03 4.27E-02 PLD1 -0.43 5.61 -3.05 6.32E-03 4.40E-02 DHFR -0.64 3.04 -3.02 6.76E-03 4.63E-02 METAP1 -0.27 5.14 -3.00 7.02E-03 4.77E-02 MECR -0.52 2.74 -3.00 7.04E-03 4.78E-02 LGALSL -0.69 2.52 -2.99 7.18E-03 4.85E-02 PDHX -0.24 4.90 -2.98 7.46E-03 4.99E-02 MMP8 -1.79 -2.61 -2.98 7.47E-03 4.99E-02 UBXN2B -0.49 4.48 -2.98 7.47E-03 4.99E-02

274
A3.4.2. List of genes significantly downregulated in miR-125a-3p overexpressing
macrophages
Gene logFC AveExpr stat P.Value adj.P.Val
DTX4 -0.57 6.31 -5.51 2.20E-05 1.77E-02 DUSP1 -0.80 5.64 -5.39 2.84E-05 2.10E-02 INF2 -0.29 6.69 -5.05 6.23E-05 3.60E-02 EHD1 -0.81 5.84 -4.92 8.38E-05 3.99E-02
A3.4.3. List of genes significantly downregulated in miR-186-5p overexpressing
macrophages
Gene logFC AveExpr stat P.Value adj.P.Val
CRTAP -0.73 6.05 -5.65 1.58E-05 1.59E-02

275
Appendix IV, Supplementary data for Chapter 5
This section contains supporting data for Chapter 5, miRNAs targeting TRIB1 non-coding
variants and identification of two novel eQTLs.
A4.1. TRIB1 non-coding variants
TRIB1 non-coding variants affecting the 3’UTR were downloaded from
https://www.ncbi.nlm.nih.gov/snp. Table A4.1.1. lists the ID of the 90 SNPs/INDELs analysed
in Chapter 5. We selected the following parameters:
annotations: nucleotide;
functional class: 3’UTR;
validation status: by frequency.
A4.1. List of TRIB1 non-coding variants
rs544226392 rs17405319 rs762994344 rs564442600 rs145010344 rs777776886
rs546022723 rs56395423 rs764331355 rs566209806 rs145449131 rs780519373
rs546479447 rs62521034 rs764779399 rs568362286 rs149107463 rs777112667
rs546842228 rs72647345 rs765360657 rs568453644 rs367637074 rs575452977
rs548263380 rs72647346 rs766250927 rs568845890 rs372324007 rs372022826
rs548386397 rs72647347 rs767431696 rs570838123 rs375565353 rs144434073
rs550925842 rs72647348 rs768403240 rs573109640 rs529150647 rs756175087
rs550939781 rs72647349 rs770137661 rs575121683 rs529289692 rs756397904
rs552692797 rs73704997 rs771645792 rs575198443 rs530681133 rs757344260
rs554138846 rs74486799 rs772580999 rs577356981 rs530790403 rs757466992
rs554972862 rs80023284 rs775715767 rs751789944 rs533208547 rs758576660
rs555208281 rs138055464 rs775724040 rs754065243 rs536284997 rs758819773
rs555485182 rs140611687 rs776325924 rs755860381 rs537301973 rs759347835
rs557685029 rs140952648 rs776449618 rs540547779 rs539767360 rs761444485
rs560408937 rs143673595 rs777539484 rs544175527 rs2235108 rs761488304

276
A4.2. SNPs analysis with miRanda algorithm: workflow and scripts
I. Input files pre-processing scripts
miRanda algorithm works with sequences printed in one line. Alignment of FASTA sequences
(TRIB1 3’UTR, reference sequence) was performed using the following command:
awk '!/^>/ { printf "%s", $0; n = "\n" } /^>/ { print n $0; n = "" }END { printf "%s", n }'
input_file.txt > output_file.txt
SNPs sequences were pre-processed using the Python scripts. These scripts require Biopython
as extension (http://biopython.org/wiki/Download). Pre-processing was performed in order to
generate sequences of the same length as the reference sequence. As mentioned in Chapter 5,
SNPs were downloaded as short sequences containing IUPAC ambiguity codes. The first script
uses the TRIB1 3’UTR reference sequence to complete the regions flanking the polymorphism;
warning messages will alert the user that the flanking region (upstream or downstream or both)
contains errors due to poor annotations. Those sequences have been generated manually.

277
The second script adds a flag at the end of the header of each sequence (i.e. ‘trib1_hsa’):
The third script reads the header of each sequence (the header contains information about the
SNP/INDEL) and replaces the IUPAC letters with the correspondent nucleotides. The
nucleotide inserted in the sequence is also added at the end of the header.

278
II. Output file post-processing script
After generating the input files, we run miRanda algorithm, following default settings. The
output generated contains all the information about the target-prediction scan, but it does not
have a specific format.
For this reason, we post-processed the original output to organise the data in a table, using the
script below.

279

280
After applying the script, miRanda output looks like a table that can be exported in different
formal, including .xlsx, .txt and .csv. It contains the miRNA name (column 1), the target region
(column 2), the start and the end of the alignment (column 3, 4), the sequence aligned with the
miRNA (column 5), the score (column 6) and the free energy value (column 7).
III. Output analysis: mySQL
Post-processed outputs from miRanda algorithm were imported as tables in mySQL and
analysed by SELECT, INTERSECT, EXCEPT and UNION functions. These allow the users
to select distinct interactions using desired parameters (score, energy etc..) and intersect data
from different datasets (different tables), for example intersection of miRNAs targeting the
reference allele and miRNAs targeting SNPs to find shared interactions. Below a screenshot of
MySQL database containing miRanda post-processed output.

281
Appendix V, Supplementary data for Chapter 6
This section contains supporting data for Chapter 6, miRNAs targeting TRIB1 in Prostate
Cancer.
A5.1. miRCancer database output
The output of miRCancer database can be accessed at this link
http://mircancer.ecu.edu/search.jsp?mirId=&logic=&condition=Or&cancerName=prostate+c
ancer&buttonSearch. The tables below list the dysregulated miRNAs in PCa, based on
published literature (downregulated miRNAs are shown in red, upregulated in green). Some
miRNAs have been identified as either down- or upregulated in different studies. The number
of distinct miRNAs is 168.
A5.1. miRCancer Output: dysregulated miRNAs in PCA
hsa-miR-3619-5p hsa-let-7a-3p hsa-miR-218 hsa-miR-628-5p hsa-miR-615 hsa-miR-125b hsa-miR-21
hsa-miR-486-5p hsa-let-7c hsa-miR-221 hsa-miR-642a-5p hsa-miR-1246 hsa-miR-1301 hsa-miR-210-3p
hsa-miR-382 hsa-miR-100 hsa-miR-222 hsa-miR-7 hsa-miR-493-3p hsa-miR-1301-3p hsa-miR-22
hsa-miR-1297 hsa-miR-101 hsa-miR-224 hsa-miR-765 hsa-miR-132 hsa-miR-1307 hsa-miR-221
hsa-miR-372 hsa-miR-105 hsa-miR-23a hsa-miR-940 hsa-miR-491-5p hsa-miR-141 hsa-miR-222
hsa-miR-186 hsa-miR-124 hsa-miR-23b hsa-miR-223 hsa-miR-185-5p hsa-miR-141-3p hsa-miR-223-3p
hsa-miR-27a hsa-miR-128 hsa-miR-25 hsa-miR-125b hsa-miR-1266-5p hsa-miR-146b hsa-miR-301a
hsa-miR-509-5p hsa-miR-1296 hsa-miR-26a hsa-miR-573 hsa-miR-126 hsa-miR-150 hsa-miR-301b
hsa-miR-802 hsa-miR-130b hsa-miR-26b hsa-miR-340 hsa-miR-1 hsa-miR-152-3p hsa-miR-30d
hsa-miR-466 hsa-miR-133b hsa-miR-29b hsa-miR-378 hsa-miR-152 hsa-miR-153 hsa-miR-30e*
hsa-miR-141 hsa-miR-135a hsa-miR-302a hsa-miR-135b hsa-miR-29c hsa-miR-155 hsa-miR-31
hsa-miR-34b-3p hsa-miR-143 hsa-miR-30a hsa-miR-24 hsa-miR-17 hsa-miR-181a hsa-miR-323
hsa-miR-130a hsa-miR-145 hsa-miR-30b hsa-miR-421 hsa-miR-452-5p hsa-miR-181b hsa-miR-429
hsa-miR-194 hsa-miR-146a hsa-miR-30d hsa-miR-103 hsa-miR-206 hsa-miR-181c hsa-miR-454
hsa-miR-1271 hsa-miR-154 hsa-miR-30e hsa-miR-613 hsa-miR-1180 hsa-miR-181d hsa-miR-483-5p
hsa-miR-501-3p hsa-miR-15a hsa-miR-31 hsa-miR-335 hsa-miR-211 hsa-miR-182 hsa-miR-486-5p
hsa-miR-196a-5p hsa-miR-15b hsa-miR-323 hsa-miR-543 hsa-miR-144-3p hsa-miR-182-5p hsa-miR-500
hsa-miR-33a hsa-miR-16 hsa-miR-330 hsa-miR-146b hsa-miR-202 hsa-miR-183 hsa-miR-543
hsa-miR-618 hsa-miR-187 hsa-miR-331-3p hsa-miR-129 hsa-miR-133a-3p hsa-miR-18a hsa-miR-588
hsa-miR-30c hsa-miR-188-5p hsa-miR-345 hsa-miR-138 hsa-miR-99a hsa-miR-191 hsa-miR-590-3p
hsa-let-7a hsa-miR-195 hsa-miR-34a hsa-miR-204-5p hsa-miR-410-3p hsa-miR-192 hsa-miR-652
hsa-miR-199a hsa-miR-199b hsa-miR-34b hsa-miR-26a-5p hsa-miR-139-5p hsa-miR-194 hsa-miR-671
hsa-miR-141-3p hsa-miR-200b hsa-miR-34c hsa-miR-204 hsa-miR-519d hsa-miR-204
hsa-miR-205-5p hsa-miR-203 hsa-miR-374b hsa-miR-22 hsa-miR-150 hsa-miR-206
hsa-miR-193a-3p hsa-miR-205 hsa-miR-449a hsa-miR-154-5p hsa-miR-373-3p hsa-miR-20a
hsa-miR-493-5p hsa-miR-212 hsa-miR-4723-5p hsa-miR-452 hsa-miR-744 hsa-miR-20b
hsa-miR-539 hsa-miR-497 hsa-miR-503 hsa-miR-10a hsa-miR-93 hsa-miR-96