Gabbott - White Rose eTheses Online
181
ity of Sheffield Beating the Trade-off between Granule Strenth! ý. d Dissolution Time Gabbott A thep . submitted in partial fulllltnent of the requirements for the degree of V OCtor of Philosophy *OR
-
Upload
khangminh22 -
Category
Documents
-
view
0 -
download
0
Transcript of Gabbott - White Rose eTheses Online

ity of Sheffield
Beating the Trade-off between Granule Strenth! ý. d Dissolution Time
Gabbott
A thep . submitted in partial fulllltnent of the requirements for the degree of
V OCtor of Philosophy
*OR

University of Sheffield, Department of Chemical & Process Engineering
Abstract
Designer Granules: Beating the Trade-off between Granule Strength and Dissolution Time
by Ian Gabbott
The production of strong, porous granules is a big challenge, desirable in many
applications and especially in the food, pharmaceutical and detergent industries.
Furthermore, it is extremely desirable to be able to `design' a granule that possesses
advantageous properties and characteristics, such as strength, porosity, binder content, size and dissolution time, particularly for applications such as tabletting. Currently
there is surprisingly little research available in the published literature concerning not only strong, porous granules and granule design, but also the inherent trade-off between granule strength and dissolution time (which has been shown in this research to be directly related to porosity) for any given formulation, using conventional granulation processes.
The initial stages of this research were concerned with proof of concept for the
granule strength - dissolution time trade-off for a given formulation. Powdered Calcium Carbonate and a Polyethylene Glycol (PEG) binder were chosen as the main
granulation materials since they represented a crude model system for a more complex detergent formulation. Several early innovative attempts in this project at overcoming the strength-dissolution trade-off, including an attempt to combine high shear and fluidized bed granulation, were unsuccessful. It was decided at this point to set a typical high shear granule as the benchmark for strength, and fluidized bed granules as the benchmark for dissolution time. The inclusion of pharmaceutical tablet excipients, or
super-disintegrants, for which there was found to be an optimum level, yielded only limited success, and there were several drawbacks.
The production of strong, porous granules was eventually realized on discovering
that the binder content of granules cannot be directly controlled by manipulating mixer
parameters alone, since the amount of binder added to the mixer has no bearing on
granule binder content. Instead, in order to produce a granule having a lower
saturation state, a proportion of binder was removed post granulation. Normally this
would result in a reduction in the strength of the granule, since the number of bonds
able to transmit load under stress have been reduced. However, the strength of each individual bond can be increased by increasing the molecular weight of the PEG
binder, which results in preservation of the granule strength.
ll

Table of Contents
Acknowledgements vi
Summary viii
Chapter 1 Introduction 1 1.1 Product Engineering 2 1.2 Structure of this Thesis 3
1.3 Objectives 3
1.4 Introduction to Granulation 4
1.5 Detergent Powders 5
1.6 The Model System 6
Chapter 2 Literature 7 2.1 Granule Strength 8 2.2 Granule Dissolution 19 2.3 Literature Discussion and Conclusions 26
Chapter 3 Experimental Methods 29
3.1 High Shear Granulation 29 3.2 Fluidised Bed Granulation 32 3.3 Granule Strength 33 3.4 Dissolution Time 47 3.5 Composition 52 3.6 Size 58 3.7 X-Ray Tomography 59
Chapter 4 The Strength/Dissolution Trade-off Line 61
4.1 Processing Time 61 4.2 Agitation Intensity 64
4.3 Primary Particle Size 66 4.4 Mixer Load 71 4.5 Binder Content 73 4.6 Fluidised Bed Air Temperature 80
4.7 Binder Viscosity 82
Chapter 5 Product Engineering 85
5.1 Combining Granulation Methods 85
5.2 Operational Protocols 89
5.3 Binder Form 92
5.4 Sodium Hydrogen Carbonate 94
5.5 Pharmaceutical Disintegrants: A Review 98
5.6 Disintegrants in Granules 110
5.7 Novel Dissolution Aids: A Review 118
5.8 Two-Component Binder Solution 133
iii

Chapter 6 Conclusions 144
6.1 Experimental Results 145 6.2 Product engineering 146
Chapter 7 Future Work 148
Appendix A- Materials Specifications: Powder 150
Appendix B- Materials Specifications: Binder 151
Appendix C- Dissolution Testing 152
Appendix D- Statistics 156
References 158
iv

The mere formulation of a problem is far more often essential than its solution, which
may be merely, a matter of mathematical or experimental skill
Albert Einstein

ACKNOWLEDGEMENTS
Firstly I'd like to thank Prof. Agba Salman and Prof. Mike Hounslow for their excellent supervision and guidance, for supporting me and motivating me when things weren't going well (which is quite often when you're doing a PhD... ) and also for making me go to Thailand (even if I did have to spend a month in the same room as a crazy Spaniard - see below)! Without them, I couldn't have done it, and I'm eternally grateful.
My thanks also go to Dr Gavin Reynolds, who first introduced me to the experimental side of granulation and helped me take my first steps in high shear granulation! Similar thanks must also go to Amir Azadehnia and Hong Sing Tan for their help in teaching me the ropes with the fluidised bed, including the very high levels of patience required when trying to spray PEG!
I must also thank Mr (soon to be Dr! ) Daniel Barrera-Medrano, who helped me with
some of the granule images used in this work, and for spending rainy days in Liverpool
on our behalft I'm also very grateful to Bob Sochon for spending a few days at Unilever research and development with me and for teaching me the finer aspects of the Skyscan X-ray tomography machine! More than that, he's also been there (or in the
pub) for useful discussions and opinions whenever I've needed it. Thanks Bob - much appreciated!
I'm trying to keep this to a minimum but I can't not mention one special friend, and 3
year long office companion - David Hernandez-Atonal, or, as I liked to call him `Mexican Dave'. I'm not entirely sure whether he liked his nickname but it didn't stop us having a great time during our PhDs, particularly whenever a bit of light relief was the order of the day! Thanks also go to my other office mates: Kevin (for his eternal requests for cups of tea and inability to play chess), Kelwin, Anh, Will and David Poole. I should also mention those across the corridor from me who put up with my intrusions whenever I was bored, so thank you Mathieu, Selassie, Heledd, Joe and Dicky.
Thanks to the Engineering and Physical Sciences Research Council (EPSRC) for funding this work, and to Unilever research and development (in particular Judith Bonsall and Lee Brennan) for helping me with materials and use of their Skyscan
microtomograph.
Lastly, special thanks are reserved for my family, for their constant support and help as always so thanks Mum, Dad, Phil and Jon. Love you always.
vi

Blank page
vii

SI'IN IINIARY
Current low shear granulation methods applied to detergent powder manufacture
for the handwash market produce granules which, although capable of fast
dissolution due to their open structure, are weak and friable
and require careful handling and storage if they are not to break
down into their primary particulate constituents.
High shear granulation methods
applied to the manufacture of compact, high bulk
density detergent powders for
use in automatic machines results in strong, dense
granules which are slow to dissolve and
disperse.
This is thought to happen largely because of one property: porosity. Porosity
controls how easily the dissolution medium can penetrate the granule, and so begin the dissolution process internally as well as externally. Porosity can also be used to interpret the particle packing density and binder content, with both contribute to
granule strength. The porosity of a granule is in turn strongly influenced by the intensity of the granulation process, which is why low intensity fluidised bed
granulation produces more porous granules than high intensity, mechanically mixed high shear granulation.
Aim
This research attempts to address this problem by investigating whether it is possible to create a granule that is both strong and capable of fast dissolution. Despite the
common consensus that porosity is the controlling factor for both properties, no definitive answer exists in the publicly available literature. In fact, there is very little
granulation research to date which concerns both strength and dissolution
performance.
Viii

Experimental approach
A simplified `model system' comprising Calcium Carbonate powder of various sizes and a Polyethylene Glycol binder of various molecular weights were used to replace the more complex detergent formulation so that the effect of processing variables could be better analysed and understood.
A range of high shear and fluidised bed granulation experiments were then carried out to determine the effect of processing parameters on the strength and dissolution of the resultant granules. The performance of the granules in compression strength and dissolution tests was then related to the granule properties through binder content, porosity and structure analyses. It was found that a trade-off existed between granule strength and dissolution time. For example, reducing the mixing speed of a high shear mixer lowered the dissolution time but also reduced granule strength due to higher
porosity. It was found that the effects of binder content, consolidation, porosity and particle size were complex, but the majority of cases showed that a decrease in porosity
corresponded with an increase in strength and dissolution time.
Product engineering
A range of different approaches to engineering a way off the strength-dissolution
time trade-off line were investigated.
Application of pharmaceutical disintegrants (chemicals used by the pharmaceutical industry to speed up the disintegration of tablets) proved to be mildly successful for
granules, for which there was found to be an optimum concentration of around 5% by
mass. It was demonstrated that disintegrants could speed up dissolution time by
around 10 seconds (approximately 10-15%), with no adverse affect on granule strength. Attempts to manufacture strong, fast dissolving granules by controlling only the
granule structure had very mixed results. Granules made partly using high shear mixing and partly using a fluidised bed simply fell along the trade-off line, their position corresponding to the amount of time spent in the high shear mixer.
However, a discovery was made that all granules of equal size (above 600 µm) contained almost exactly the same binder content, and therefore were displaying the
same strength and dissolution characteristics. This suggested that if the binder content could be manipulated somehow, that the internal structure of the granule could be
more accurately controlled. In practice, this was done using a two-component binder
(Polyethylene Glycol (PEG) dissolved in water), with the most volatile component, water, being removed post-granulation in a drying oven. Because full control was then
attained over both the number of binder bridges (by varying the concentration of PEG in the binder solution) and the strength of those bridges (by varying the molecular weight of PEG used), the production of strong, fast dissolving, porous granules is
possible.
ix

Blank page

CHAPTER
1
INTRODUCTION
This project is first a feasibility study to see whether it is possible to produce a granule that possesses both strength and the ability to dissolve quickly. Of course, this
all depends on the definitions of `strength' and `quickly'!
The driving force for this study originates in Brazil, where handwashing of clothes using detergent powder is common. Because of this, the parameter by which the various detergents are judged is their dissolution time, since it is readily apparent when handwashing (especially considering that their powders are coloured or dyed for
marketing reasons! ) which ones dissolve quickly and most completely. For this market, detergent powders (or, more specifically, granules) are commonly produced by fluidised bed granulation since this is the process that produces granules capable of the quickest dissolution times.
Great! Except that fluidised bed granules are also typically very weak. During
subsequent post-production handling and storage, these granules undergo breakage and attrition, reducing a proportion back to their primary particle constituents. To the customer, this translates as ̀dust'.
These detergent granules could be produced by other granulation methods; spray drying, high shear mixing, both of which result in stronger granules, and indeed they are where the product is used in automatic washing machines where dissolution time is not of primary importance, since it cannot be observed. And herein lies the problem; the processes which go towards increasing the strength of a granule also seem to result in increased dissolution times.
Given this information, the following points should be borne in mind when reading this thesis:
1

3ised bed granules will provide the benchmark for dissolution performance. This is definition of `quickly'. They are currently accepted as having good dissolution
Drmance, it is their ability to resist breakage and attrition which is in question.
High shear granules will provide a benchmark for granule strength. This is the definition for `strength'. It is generally accepted that granules made in this way possess the highest strength characteristics compared with other granulation methods.
It is generally acknowledged that in terms of granules, strength and fast dissolution do
not go hand in hand. However, there is, to date, no publicly available literature that
says:
1. Whether the production of strong, fast dissolving granules is possible
2. If it isn't possible, what the reason is
3. There is also no work currently published that directly plots granule (or even tablet)
strength against dissolution performance.
There does seem to be a general consensus that granule porosity is the controlling factor in resultant granule strength or dissolution performance, ie that high porosity
yields fast dissolution but low strength, and vice versa. However, since there is no work which directly compares or measures both strength and dissolution performance, this
assumption, for the moment, cannot be upheld.
1.1 Product Engineering
The `products' in product engineering include consumer products such as toothpaste, controlled release drugs, paint and detergents, to name but a few. Common
to all of these products are the fact that they are structured, and contain many substances, each with its own purpose and that they are judged on their performance
and not on their composition. Detergent powder (which is actually granular) is a
product that, when dissolved in water, releases the active ingredient it contains, and has
properties suitable for use in a dry laundry detergent formulation. These properties include the aforementioned strength, so that the product may resist deformation, breakage and attrition during transit, handling and storage, and dissolution
performance, which in this case should be as fast as possible, with the aim of matching fluidised bed granules.
The `engineering' in product engineering is comprised of everything related to the design, development and manufacture of the product. It requires a technical and scientific understanding of the manufacturing process and product properties. In this

case, this involves an in-depth understanding of granulation techniques and mechanisms and their effect on subsequent granule structure and performance.
Since this research is essentially product engineering, it will be primarily experimental rather than mathematical (modelling) in approach to solving the problem of strong, fast dissolving granules.
1.2 Structure of this Thesis
This thesis begins with a short introduction to granulation, with reference in
particular to product engineering in the detergent industry. What is granulation, why is it used, and why do we need to understand more about the processes involved? Chapter 2 will provide an overview of relevant work in granulation, and its
shortcomings, currently available in the literature. With this knowledge in mind, chapter 3 then explains the experimental methods employed in this work to produce and test granules according to a selection of characterisation procedures.
Chapter 4 details an experimental approach to determining the effect of granulation parameters on the strength and dissolution time of the resultant granules. Granule
characteristics including strength, dissolution time, composition and structure will then be analysed as described in chapter 3 in order to determine why the granules behave as they do, and to conclude whether porosity is indeed the controlling factor for granule strength and dissolution performance. Chapter 5 then takes this a step further, to look
at various ways of producing strong, fast-dissolving granules.
1.3 Objectives
The aims of this study are to investigate the granulation processes taking place in a high shear mixer and a fluidised bed with the goal of producing a granular product having comparable strength to a `typical' high shear granule whilst being capable of fast
dissolution (equivalent to a `typical' fluidised bed granule). The first objective was to decide upon a standard granulation procedure in order to be able to compare
granulation methods so that the definitions of `typical' granules for each may be
defined. Once this was completed then deviation of results from these `norms' could then be identified with respect to standard granulation variables and parameters. This information is given in detail in chapters 3 and 4.
3
1.4 Introduction to Granulation
Granules
A granule is a group of powder particles bound together by a binder. The binder
acts to form liquid or solid bridges between particles, giving the granule added strength depending on the amount and type of forces involved. Granules are produced since they have better flow and handling properties along with reduced dustiness and
resistance to segregation (where two or more different powders are agglomerated together) than their base powders. Some active components in detergents (for instance
enzymes and bleaches) can be potentially hazardous to human health and so reduced dustiness and granule strength are important properties. The size difference between
granules and (powder) particles plays a significant role in the improvement of some of these properties.
Granulation
Liquid binder
+ Granules Powder particles
I Granulation
Figure 1.1: Schematic diagram of the granulation process in which a binder liquid and dry
powder are brought into contact to form granules.
The process of joining particles together using a binder to form granules is known as
granulation. Granulation methods can be divided into two types; wet and dry.
Detergents are produced by wet granulation, since the binder is in liquid form when it is
introduced into the granulating vessel. Wet granulation can be carried out in a variety
of different equipment including high shear mixers, fluidised beds, pan granulators and drum granulators. The fundamental difference between these types lies in the forces
involved during particle-particle and particle-binder contacts. High shear mixers
commonly exert the largest forces, since they rely on a mechanical mechanism in the form of a large impeller to bring particles and binder into contact with each other. Fluidised beds on the other hand, exert the smallest forces, since the binder is
commonly added in the form of a fine spray, while the powder particles are agitated
pneumatically.
4

The number of variables which affect the final properties of a granular product is huge. It is difficult to understand the effect of one variable since very often the variables are inter-dependent on each other. Granulation variables can be divided into three main groups:
" Equipment variables: mixer, impeller, etc " Process variables: agitation intensity (speed), processing time, temperature, etc " Formulation variables: liquid to solids ratio, binder viscosity, etc
In this research a variety of these variables are investigated with respect to their
effects on resultant granule strength and dissolution performance. Both high shear and fluidised bed methods have been used to produce granules, with the most significant variables with respect to their effect on granule strength and dissolution performance investigated.
1.5 Detergent Powders
The material involved at the industrial level is a Unilever detergent mix comprised of Zeolite 4A powder, Sodium Carbonate (light ash, Na2CO3(. )) and Linear Alkylbenzene Sulphonate (LAS). Modern fabric detergents are typically a mixture of up to 20 different compounds and substances, each with a specific function. Their purpose,
when combined in suitable quantities, is to deliver a high standard of cleaning while being safe for people, fabrics and equipment and also minimising harm to the
environment. It should be noted that the term `detergent powder' refers to a granulated product and as such consists of granules containing the base substances listed above in
addition to smaller quantities of other active ingredients.
The granulation process is recommended when a medium bulk density detergent
powder is required. The basic process is the neutralisation of Sulphonic Acid as active
matter of the detergent by Sodium Carbonate. Modern detergent powder
manufacturing processes are moving away from spray drying and concentrating on so-
called `non-tower' routes. The non-tower route usually involves a primary high speed
mixer/densifier followed by a medium speed (Ploughshare) mixer and finally a
continuous fluidised bed for drying and cooling. Hand-wash detergent powders can be
the exception to this rule, and are produced using low shear methods such as fluidised
bed granulation, since the dissolution rate of the powder is the factor by which the
product is evaluated. However, this method of production produces granules which
are weak and require careful handling if they are not to break down into their primary
powder particle constituents. Their non-uniform structure also leads to coalescence of the granules during storage and transit, which again is undesirable. It is this problem
which will be addressed (indirectly, since the actual materials are replaced by a model
5

system) in this research, as it attempts to answer the question; can two properties that are normally mutually exclusive (strength and porosity) co-exist in agranularproduct?
1.6 The Model System
The actual detergent materials are replaced in this work by a simplified `model
system' consisting of Calcium Carbonate powder (CaCO3) in place of the Sodium Carbonate and Zeolite powders and Polyethylene Glycol (PEG) binder, (C2H40)
n. H20, in place of the LAS acid. The use of this model system helps to make experiments and interpretation of results less complex and is easier to work with because of the non-reactive nature of the binder (PEG) and easier product analysis. Key similarities between the two systems include the presence of soft-solid bridges between primary powder particles and a binder that plays a crucial role in determining
granule strength and dissolution time. The Calcium Carbonate used in the majority of these experiments (trade name Durcal) has been supplied by Unilever Research and Development, Port Sunlight. The Durcal/PEG granules are made by high shear mixer or fluidised bed granulator typically using a binder/solid ratio of 0.13. This value, or 1% either side of this value, is used because it results in steady growth during
granulation, giving sufficient numbers of larger granules without becoming an over-wet mass.
The Calcium Carbonate powder (trade name Durcal, produced by Omya, France) is
available in different grades, with respect to their different size distributions. In order from smallest mean particle size to largest these include; OmyaCarb, Durcal 5, Durcal 15, Durcal 40 and Durcal 65.
Polyethylene Glycol is a water-soluble, waxy polymer available in a number of different molecular weights, from 200 to 20000 Daltons. The melting point and viscosity of PEG rise with its molecular weight. Polyethylene Glycol (PEG) behaves as a Newtonian fluid [1], with strain rates proportional to applied stress. PEG weights of 600 and below are supplied as a viscous liquid, while PEG weights above 1000 are supplied as waxy solid flakes, in accordance with their state at room temperature. More information about Calcium Carbonate and PEG can be found in appendices A and B
respectively.
6

CHAPTER
2
LITERATURE
There is no work freely available in the literature to date concerned with the
production of strong, fast dissolving agglomerates (granules, tablets etc). Indeed,
research even mentioning both agglomerate strength and dissolution performance is
lacking. Of the research that does mention strength and dissolution, it is often the case that high strength corresponds to slow dissolution, and fast dissolution corresponds to low strength. The property frequently used to explain this is porosity, or air volume fraction [2-5]. Iveson and Litster [4] reported that "granule porosity controls granule
strength", while Iveson et al. [5] state that for many products it is desirable that the
granules be porous to facilitate fast dissolution and dispersion. Farber and co-workers [3] agree, and state that the "presence of pores controls such basic properties as wet and dry strength, dissolution, and disintegration in a liquid medium".
However, while porosity initially appears to be an important property to control and optimise, there is no direct experimental evidence to support these claims in the
references listed above. The commonly quoted reference in support of this porosity based argument is that of Rumpf [6], who theorised back in 1962 that the tensile
strength of an agglomerate is inversely proportional to the porosity of that agglomerate. There are several limitations Rumpfs theory though (discussed later in this chapter), and the lack of direct evidence, ie a plot of strength against dissolution time means that
a more thorough investigation is required, which will form a basis for this work. This chapter reviews the relevant literature concerning firstly agglomerate strength
and secondly dissolution, with particular emphasis on the factors responsible for these two characteristics. Is granule porosity ultimately responsible for strength and dissolution rate?
7

2.1 Granule Strength
Firstly, it is important to define what is meant by the word strength when talking about granules. On a macroscopic scale, strength can be interpreted as the resistance to permanent deformation and fracture during a stressing event. When fracture occurs, it is common to attribute strength to be a maximum allowable stress value before
catastrophic failure. Granule strength is a very important parameter since it is a measure of the quality of
bonding of the granule constituents. Intimate bonding and good mixing are both
reflected in high granule strength. Relatively simple strength measurements can also be
used to provide a measure of other granule properties that would otherwise require sophisticated instrumentation and procedures to obtain.
Which strength?
The strength of a granule can be measured in different ways. Fundamentally, these
methods differ in the strain rates involved. Diametric compression tests are typically
performed at around 1 mm/min, but using the Zwick/Roell testing machine used in
this research, values between 0.001 mm/min and 100 mm/min are possible. For
higher strain rates drop impact testing is used, whereby the granules are dropped
vertically from a height onto a rigid base. Drop impact velocities typically range from
0.3 to 6 m/s. For higher strain rates still, the impact test can be performed by
launching the granules using a compressed gas gun. Velocities for these high speed impact tests usually range from 6 to 100 m/s. Analysis of impact testing is typically done using a high speed camera to measure impact and rebound velocities, from which
coefficients of restitution can be calculated. It is usually also possible to calculate from
the images parameters such as contact ratio (the area of granule in direct contact with the target) and impact radius from which the amount of granule deformation during
impact can be gauged. Granule impact testing is discussed in more detail by Fu and co-
workers [7]. In compression testing, load is measured using a load cell, while the displacement is measured by a voltage displacement transducer. These sensors are linked to a computer so that a complete record of the load-displacement behaviour is
obtained for each test. In order to determine which method of strength measurement is most appropriate,
the conditions under which the strength will be required must be considered. Impact
strength would be the most appropriate measure for wet granules inside a high shear
mixer. However, for detergent granules which must survive storage and transit, and
whose production involves no pneumatic transportation, compression strength is the
most relevant measure, and is what will be measured in this work. The precise details
regarding the actual measurement of this strength will be given in chapter 3 with the
other experimental information, so for now we will look at what is responsible for
giving granules the ability to resist compression.
8

Unconfined uniaxial compression The quasi-static uniaxial compression test is a popular technique used when studying
the strength of single granules [8-12]. The technique, in which a granule is crushed between two opposing rigid platens, provides an indirect measure of the tensile strength of a granule. During crushing, the generation of a tensile hoop stress is responsible for
splitting the granule and it is this stress which is reported as the granule tensile stress. This test is considered more representative of actual granule strength than methods which require specimen preparation such as the three point bending test.
The energy used in granule fracture can be estimated from load-displacement data, but Bika and co-workers [8] argue that granule compression strength measured in this way must be interpreted with caution as it is only accurate for highly brittle and isotropic materials.
In addition to strength testing, compression has also been used to visualise the sequence of crack formation in fertiliser granules under impact loading [13]. The
primary fracture of these granules into two hemispheres was observed in these tests followed by secondary fracture of the hemispheres to produce quadrants and eventually segments.
Confined uniaxial compression Adams et al. [14] consider the disadvantages of such single granule compression
tests. Firstly, there exists within any batch of granules a variation in the measured failure loads, which sometimes requires a large sample size for a statistically acceptable average can be obtained. Secondly, the failure loads for single granules can be very small, depending on size and binder type. This can lead to the need for increased
measurement accuracy. They present an alternative system using a confined bed of granules in a cylinder which are compressed by a piston. From the bulk compression data they then derive a simple first-order expression enabling the single granule
strengths to be estimated from the behaviour of the bed under compression. In testing
a range of quartz sand based granules they found that the estimated single granule failure loads from the bulk data were approximately proportional to experimentally determined single granule failure loads.
Solid bridge strength
The formation and strength of liquid bridges between powder particles is well documented [15]. However, solid bridges have received far less attention. Pietsch [16]
and Shinohara [17] both assumed in their work on solid bridges that the bridge material
was the same or very similar to that of the bulk powder. It was later discovered by
Tardos and co-workers [18] that the properties of solid bridges depend strongly on the
composition and drying rate of the bridge itself. Farber et al. [19] found that
solidification of liquid bridges and formation of dry bridges from saturated solutions are
complex, multi-step processes. They also say that bridge strength is characteristic for
9

each system and that it depends largely on the amount of liquid present in the original bridge, so that large liquid bridges form stronger dry bridges. For the study of an ethanol-based system in which the base powders were not soluble in the binder, Tardos
and co-workers [20] found that the main binding agent was the polymer. In the system, bonds between powder particles were reported to be very strong when the polymer (HydroxyPropylCellulose, HPC or PolyVinylPyrrolidone, PVP) was present.
Rumpfs theory
A now widely-quoted model for predicting the tensile static strength of a granule was proposed by Rumpf [6], in which he assumed the constituent particles to be a matrix of spheres of the same size. The failure mechanism was taken to be the strength required to break all of the bridges between every particle across the fracture plane. The tensile strength of a granule, Q. is given by:
)dZ Ri)
where:
eis the granule porosity (air volume fraction) dis the particle diameter Fb is the binding force
Rumpfs equation predicts that granule strength is proportional to the binding force, increases with decreasing porosity and is inversely proportional to the square of the particle size. This holds true for granules made from relatively large, mono-sized particles. However, quantitatively the theory is incorrect. For large, mono-sized particles the theory over-predicts granule strength. This is thought to be because the theory fails to take into account the presence of extensive pore networks within the
granule structure [21]. Granules fail by crack growth along the pore networks, rather than sudden failure across the whole plane. The role of porosity was further investigated by Chan and co-workers [22], who found that reduced porosity results in
stronger granules through smaller particle separation distances and therefore increased friction forces between particles.
Equation (2.1) also underestimates the strength of granules produced from fine
particles with wide size distribution and also incorrectly predicts the effect of binder
content. Kapur [23] shows that particles with a wide size variation play a significant role in increasing granule strength. The shape of particles has also been shown to be important [24]. In fine particle systems, increasing binder content increases the granule strength up to a maximum strength which occurs between 20 and 30% liquid
10

saturation, beyond which the strength decreases rapidly [25]. This is summarised by
Figure 2.1 below.
.., _ __9 NwCrr
!2
Cy S= 36%
S=58% 0-
Ss 70%
012345 Strain AUL M)
Figure 2.1: Stress versus strain relationships for uniaxial compression of liquid bound
granules showing the effect of increasing binder content in altering behaviour from brittle to
plastic (source: Holm et aL [25])
Kendall's theory
The shortcomings in Rumpf's theory were addressed by Kendall [21]. Kendall
suggests that fracture of an agglomerate is a result of crack propagation through the flaws in the granule structure. Failure in this case is then a result of sequential breakage
of bonds rather than the simultaneous bond rupture theory proposed by Rumpf [6].
Kendall [21] applied the fracture mechanics approach developed by Griffith [26] to derive the following expression for granule strength, as., with respect to the
equilibrium surface energy, F:
Qf =15.604F 61-1i6 (Dc)-1/2 (2.2)
where 0 is the solid fraction, D is the constituent particle diameter and c is the flaw
size in the assembly. According to this theory then, even greater emphasis is placed on the solid fraction (ie decreasing porosity resulting in increased strength) in comparison
with Rumpfs theory, and while the effect of particle size is less pronounced the
theoretical strength still increases with decreasing particle size. Kendall's theory also
suggests that granules having many, smaller pores will be stronger than a granule with similar overall porosity but having fewer, larger pores.
11

Controlling granule strength
Much of the literature on granule strength concerns liquid bridges. While the Polyethylene Glycol (PEG) in our system turns to solid on cooling, this knowledge on liquid bridges is still relevant since the structure of a granule is determined while the binder is in the liquid phase.
Granules may exist in a range of saturation states, first described by Newitt and Conway Jones [27] and are illustrated in Figure 2.2.
Pendala- FunkQIv Capýilary Droplet Psoudo-Drppýet
Figure 2.2: Different saturation states of granules bound by hquid (Newitt and Conway-. ) ones [27] and expanded upon by Kapur [23] and York and Rowe 128])
During granulation, it is possible for the saturation state of a granule to shift through the different phases from pendular to droplet, due to further addition of binder or a reduction in granule porosity brought about by consolidation of the particles.
Since the PEG binder used in our system is solid at room temperature, and thus
provides the bulk of the granule strength, the structure obtained before the PEG
solidifies is of prime importance. Thus, in this system, the strength of a granule is
controlled by three parameters:
" Bridge strength, which can be controlled by altering the molecular weight of the PEG binder
" The saturation state of the granule, ie its porosity, or extent of consolidation, which is a function of the granulation processing conditions
" The structure of the granule, which can be influenced by the granulation mechanism
Since changing the molecular weight to increase bridge strength is fairly trivial (since
its effects on the granulation process are restricted to binder viscosity), this literature
review will now focus on the granulation variables responsible for granule structure and
extent of consolidation.
Granule consolidation
Granule consolidation happens as a result of collisions. This reduces their size, and
squeezes out air and binder liquid [5]. Several researchers have looked at the evolution
of granule porosity during granulation [27,29-32] and all have reported that granule
12

porosity decreases quickly from a starting value before levelling out with time (Figure 2.3).
0.38
0.37
O
ILO 0.36
d 0.35
0.34
Glass Ballomi
*10 micron f 19 micron 037 micron O'O-O.
O'*"O. O-0. ý.
r%29 0 1000 2000 3000 4000 5000
Drum Revolutions (Revs. )
Figure 2.3: Evolution of granule porosity with number of revolutions of a drum granulator [29].
The effects of granule consolidation are complex. On the one hand, granule strength generally increases with decreasing porosity [6], decreasing the amount of deformation which happens when two granules collide, which in turn decreases the likelihood of successful coalescence. On the other hand, consolidation also increases
the granule pore saturation [33], which increases the availability of binder liquid at the
granule surface, increasing the chance of successful coalescence.
Mixing Speed and Type
The effect of equipment speed on granule consolidation is varied. Increasing the impeller speed of a high shear granulator has been found to increase the rate of granule consolidation [34,35], resulting in lower porosity at higher mixing speeds leading to increased granule strength [36]. A similar effect was reported for pan granulation [37]. In general the mixing or agitation intensity is the dominant factor regarding consolidation when comparing different granulation equipment. Both Sherrington [38],
using coarse sand and Ganderton and Hunter [39], using Calcium Phosphate powder
compared low and high intensity granulation devices, and found that the higher intensity processes resulted in denser granules. Samimi and co-workers [40] studied the impact breakage of two types of detergent granules made using different processes. The denser, more spherical type made using a higher intensity process displayed less breakage than the other, more porous type.
In addition, use of the chopper found in most high shear mixers results in
significantly lower porosity granules [41]. However, for other systems, Schaefer and co- workers [42] reported that there was no significant difference in granule porosity when the chopper was used. There are other conflicting reports, too. For example,
13

Vertommen and Kinget [43] reported an increase in the width of the granule size distribution with chopper use, while Kinget and Kernel [44] found that the chopper improved granule homogeneity and resulted in a lower amount of fines. Hoornaert and co-workers [45] found that the shape and design of the chopper is important, with some choppers promoting densification while others tend more towards granule breakage.
However, Eliasen et al. [46] found that with low viscosity binders in a high shear mixer increasing the impeller speed increased the amount of breakage and shear which delayed densification, giving instead granules with lower sphericity and higher porosity. For the case of lactose powder, Ganderton and Hunter [39] discovered that a mixer granulator provided higher porosity granules than a low intensity pan granulator [39]. The authors speculate that the reason for this phenomenon is that the shear forces in
the mixer granulator are sufficient to cause dilation of the granules.
The effect of different types of granulator is most apparent when comparing the
relative intensity of the different processes, since granule consolidation is assisted by the intensity of a process. The effect of equipment size on granule consolidation depends
on the strength of the formulation and the average impact forces incident on the
granules. This in turn is dependent on the heuristic scale used in scale-up of the
equipment speed [47]. Schafer et al. [35] found that less consolidation occurred during
scale-up of high shear mixers due to a lower relative swept volume.
Mixing time It is generally accepted that, in line with Rumpfs theory [6], increased granulation
time leads to a greater extent of consolidation and reduced granule porosity [48,49]. However, Fu and co-workers [49] showed that the critical impact (failure) velocity of
granules consistently increased with increasing granulation times, despite, at later times,
constant porosity and binder content. They argue that this consistent (approximately
linear) increase in strength is due to ever loser and more efficient powder particle
packing (and thus increased frictional forces), which is not accounted for in Rumpfs
model.
Particle site The rate of granule consolidation decreases as a result of decreasing the primary
particle size [4,50], as smaller particles increase the volume density of inter-particle
contacts. This also decreases the pore size through which liquid must be squeezed during consolidation. It is reported that smaller particle sizes lead to increased granule
porosity due to greater strength [4,39]. The absolute value of this minimum granule
porosity is a factor of particle shape and size distribution. This was investigated by
Johansen and Schaefer [51] who concluded that more spherical powder particles and
narrower particle size distributions both act to decrease granule strength due to lower
particle packing efficiencies. The increase in granule strength with smaller particle sizes
14
was also reported by van den Dries et al. [52], while Fu et al. [7] found that the
coefficient of restitution of wet granules decreased with increasing particle size. Fu and co-workers explained their result using a similar argument to that of Iveson and Litster [4], that of increasing particle-particle contacts with decreasing particle size in a given volume.
Binder Content Increasing the amount of water and water-based binders (low viscosity) has been
found to increase the initial rate and the final extent of granule consolidation [53]. The
additional moisture acts as a lubricant and facilitates increased particle mobility, thus
allowing them to rearrange into more compact configurations [54,55]. The effect of viscous binders is more uncertain. Schaefer and co-workers [50] found that increased
amounts of PEG 6000 led to increased granule consolidation during high shear granulation, whereas Iveson et al. [29] reported a decrease in consolidation when using increasing amounts of a glycerol binder in a tumbling drum granulator. Iveson and co-
workers suggest that for their system, the increased resistance to consolidation brought
about by increasing amounts of a highly viscous binder outweigh any decrease in inter-
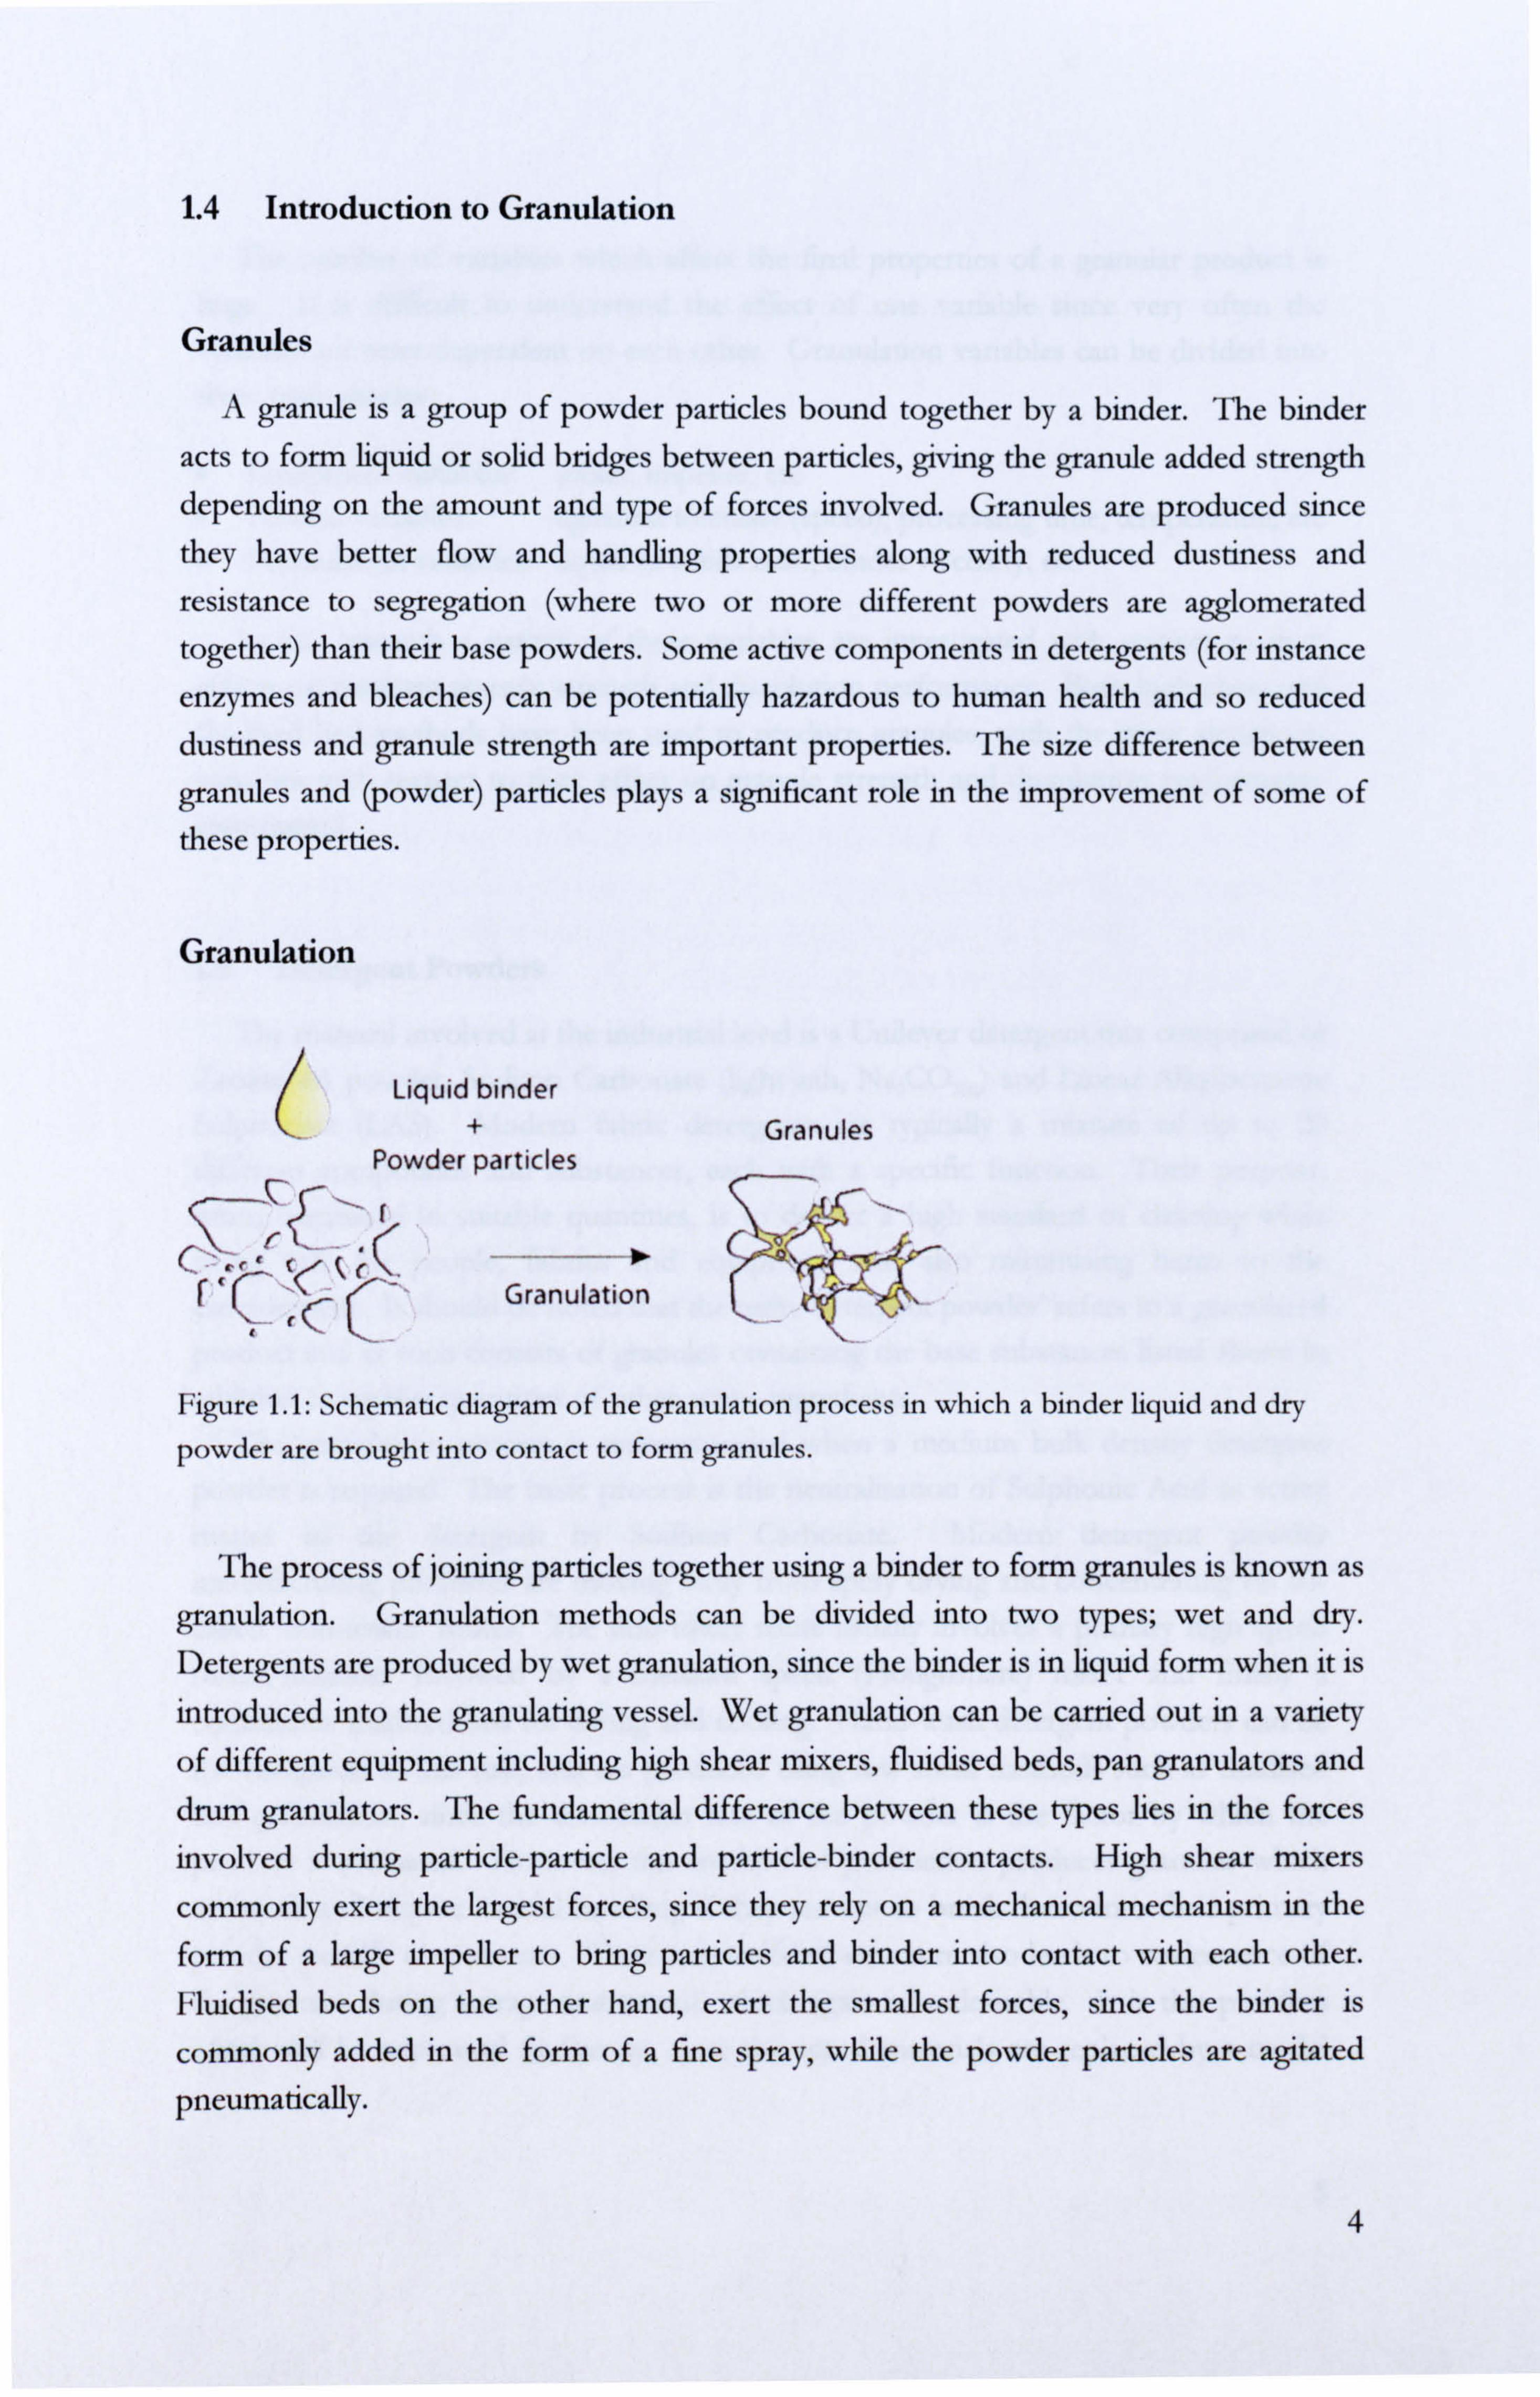
particle friction forces due to binder lubrication of the particles. The relationship between granule strength and saturation state was investigated by
Schubert back in 1975 [56]. He proposed that the granule strength would change depending on the granule saturation state as depicted by Kapur (Figure 2.2) [23], in the
manner shown in Figure 2.4. In this figure, Sp indicates the end of the pendular state
and S, denotes the start of the capillary state, where the granule is completely saturated. In between Sp and Sc is the funicular state, in which agglomerate strength is expected to increase steadily with increasing saturation as liquid bridges replace air voids.
at
Saturation, S
Figure 2.4: Schubert's proposed relationship between granule tensile strength, q,, and
granule saturation state, S [56].
15
0 Sp sc 1

Iveson and Litster [57] found that for water-bound granules, at low moisture contents, increasing the amount of water increased the granule yield strength. However, at higher moisture contents, increasing the amount of water decreased the yield strength. For similar experiments, but with glycerol as a binder, they reported that increasing the binder content always resulted in increased yield strength. Fu and co- workers [7] reported that the critical impact velocity for granules containing a PEG binder decreased with increasing binder content. Iveson and Litster [57] go further to suggest that the complex behaviour observed is a result of changing contributions of three forces: inter-particle friction, capillary and viscous forces, which all resist granule consolidation.
Binder viscosity Increasing the binder viscosity increases the viscous forces between particles and so
generally decreases the rate of consolidation [29,58-60]. In general an increase in
binder viscosity reduces binder mobility in granules, increasing the forces required to force binder migration to areas of voidage or the granule surface. Experimental results
point to the existence of a critical value of binder viscosity below which the viscosity of the binder has no effect on the consolidation rate. Knight and Seville [61] reported this
value to be around 1 Pa. s for high shear granulation. Below this critical value it is
suggested that inter-particle friction is the dominant consolidation resistance force. It is
even suggested that below the critical value the more viscous binders act as better
lubricants by keeping particle surfaces apart and so actually increase the consolidation rate [62].
Fu et al. [7] reported that higher viscosity binders led to decreased coefficients of restitution (the ratio of rebound to original drop height), which translates as higher
granule plastic deformation. This finding was supported by increasing contact ratios (the radius of granule and target contact area divided by the granule radius) with increasing viscosity. To explain these findings, they used the model developed by Lian
and co-workers [63], in which the dependence of the coefficient of restitution was
expressed in terms of the Stokes number. Given that the Stokes number is the dominant parameter, they reason that the energy dissipated on impact will increase with the viscosity of the liquid bridges. In addition, Eliasen et al. [64] found that low
viscosity binders reduce granule strength for high shear granulation. Work by Iveson et
al. [29] supported these findings, and went further to say that increasing binder viscosity
results in reduced deformation through stronger bridges, hence increasing granule
strength. One aspect of increased granule strength through higher viscosity binders not
mentioned so far is that of mixing, or granule homogeneity. van den Dries et al. [52]
found that binder viscosity had a profound effect on granule breakage and that the
extent of breakage was key in determining granule homogeneity. Higher viscosities
resulted in stronger granules but less breakage and therefore lower homogeneity.
It has also been reported that for any given powder particle size, there exists a
minimum binder viscosity necessary to form granules at all [59,61]. Keningley and co-
16

workers [59] also report that this value of minimum viscosity increases with increasing
powder particle size. Several researchers [44,45] have found that a higher binder
viscosity also results in larger granules, with a wide size distribution. Binder viscosity also affects the granule growth rate. Schaefer and Mathiesen [60] and Johansen and Schaefer [51] discovered that the initial growth rate was lower for high viscosity binders, but that subsequent growth rate was higher. They also reported that lower binder
viscosities gave more spherical granules and improved binder distribution, in line with the findings of van den Dries et al [52].
Binder surface tension Capillary forces of liquid bridges in granules play a key part in determining overall
granule strength. These capillary forces are strongly affected by the surface tension of the liquid in question. Capes and Danckwerts [65] discovered that a minimum surface tension is necessary to form any granules at all for a given powder particle size. Iveson
and co-workers [4,57] found that binders with lower surface tension resulted in lower
dynamic yield strength and increased granule porosity. The decrease in dynamic yield
strength was attributed to lower capillary forces acting to hold the granule together with decreasing binder surface tension.
Granule structure
Golchert looked at the compression failure of two granules with different structures both experimentally and using Discrete Element Method (DEM) modelling [66,67]. They found that the spherical granule fractured, but remained intact with fracture along distinct planes, while the irregular shaped granule shattered under low compression displacement. The behaviour of the non-spherical granule was a result of non-uniform loading which prevented breakage from proceeding along fracture planes.
Subero and co-workers [68,69] looked at the breakage characteristics of agglomerates with controlled bond properties and different void distributions. A high
macro-void density resulted in a weak structure. However, the extensive local deformation resulting from impact spread out to provide a cushioning effect, protecting the rest of the granule. For granules with low numbers of small voids, the structure is
stronger and can transmit loads through the bulk of the material, increasing the probability of failure by crack propagation [68].
It is the size and position of binder and air voids that primarily sets granule consolidation apart from granule structure. Granule consolidation is characterised by
average numbers for these properties, while structure is characterised by size distributions and imaging techniques. Literature on granule consolidation is far more plentiful owing to its ease of characterisation. For granule structures to be analysed requires more sophisticated techniques, for example X-ray tomography in imaging of internal granule structure. Unfortunately, there is little work to date which focuses on
17

both the specifics of granule structure and its strength and dissolution performance, hence the need for this research.
Further factors affecting the structure of granules are discussed below.
Binder addition method The method of binder addition is assumed to have a fairly significant effect on the
granulation process and properties (including structure) of the granules produced [70- 72]. The three main binder addition methods are:
" Pouring
" Spraying
" Melting
Holm and co-workers [70] found that atomisation of the binder in a high shear
mixer improved liquid distribution, while other methods resulted in poor distribution,
particularly at low impeller speeds. However, Knight et al. [71] reported that granule binder distribution was size, not method of addition, dependent initially and tended
towards a uniform distribution with increasing granulation time. If breakage rates are high, such as in high shear granulation, the method of binder addition is unlikely to have a profound effect, so long as the granulation time is long enough for breakage to
occur. This is supported by observations from low shear fluidised bed experiments [73-75], in which the droplet size distribution and spray rate both have significant effects on the final granule properties.
Schaefer and Mathiesen [76] investigated the difference in binder particle size for
melt granulation of lactose monohydrate with PEG binders in the form of flakes and coarse and fine powders. They found that the distribution of binder was dependent
only on granule size and not on the addition method, which appeared to affect only the granule growth rate.
Equipment variables The effects of mixer construction and design on the properties of granules are
difficult to determine, partly because of their complexity [77] and partly owing to the difficulty in quantifying the unique design characteristics and nature of each piece of equipment. To complicate matters, granulator capacity is a scaling issue rather than mixer design and construction.
Schaefer and co-workers [42] found that curved impeller blades resulted in more spherical granules while flat-faced impeller blades resulted in more irregularly shaped granules.
Holm [78] found that chopper size and rotation speed played a large part in determining granule strength, while the size of the chopper apparently had little effect on the granule size distribution.
18

2.2 Granule Dissolution
Granule dissolution testing is often overlooked; the majority of the literature on dissolution is related to tablets, especially those containing some form of drug
substance. After all, you rarely get a bottle of granules from the pharmacist, while the strength of your coffee or powdered soup granules rarely gets tested in practice. However, in addition to the motivation for this project (handwash detergent granules), the dissolution of automatic machine detergent powders is also suffering because of a recent switch to high shear granulation production methods as a means of producing so-called ̀compact powders' with high bulk density [79].
The dissolution of granules and, where appropriate to the discussion, tablets, will be discussed here from a chemical engineering perspective rather than that of pure chemistry, except to say that for the dissolution process to take place, the solute and solvent must be in contact. Because of this, the key factor in how fast the process of dissolution can take place is dependent first and foremost on the area of the solute- solvent interface [80]. For a non-porous solid, the dissolution process would be described by a shrinking particle model [81] which accounts for the reduction in surface area as dissolution proceeds. However, agglomerates are often porous, and so the surface area of the pores accessible to the dissolution medium must also be taken into account.
Measuring dissolution performance
Spectmphotomety Due to the highly regulated nature of the pharmaceutical industry, many tests
involving the dissolution of drug substances are performed in accordance with the necessary guidelines. For example, the Food and Drug Administration (FDA) in the US outlines two main methods of dissolution testing; the basket method and the paddle method. The basket method involves placing a tablet in a `basket' made of fine mesh and gently agitating under water until the tablet disintegrates and falls through the mesh of the basket [82]. The paddle method involves stirring a solution in a glass vessel and testing samples taken at regular time intervals. The many guidelines and regulations regarding drug dissolution testing are outlined in the various ̀ Pharmacopoeias', which are essentially books containing instructions for the identification and preparation of drug samples and medicines. The British Pharmacopoeia is published annually and lists
quality standards for UK medicinal substances. Often the dissolution testing of drug
substances is performed at physiological conditions, ie in an acidic solution, at 37 °C to
enable a more accurate prediction of the dissolution process inside the body. Devay et al. [83] studied the dissolution of pellets containing theophylline drug in
900 ml deionised and degassed water. They used a paddle apparatus (essentially a beaker and stirrer) at 100 rpm and measured the concentration of dissolved drug
spectrophotometrically. A spectrophotometer measures the light intensity and colour
19

(or wavelength) of light absorbed (or in some cases reflected) from a sample. Adebayo
and co-workers [84] followed the British Pharmacopoeia procedures [85] to measure the dissolution of paracetamol from tablets made from high shear granules. This involved taking 5 ml samples of the dissolution medium at regular time intervals and measuring the dissolved concentration of paracetamol using a spectrophotometer. Specifically, they mention that the absorbance readings were taken at the paracetamol absorption maximum of 257 nm. The amount of drug in solution is then determined from prepared calibration curve. Other very similar spectrophotometrical methods were used by Bolhuis et al. [86] Dhumal et al. [87] Alvarez-Lorenzo et al. [88] Ishikawa
et al. [89] Souto et al. [90] Albertini et al. [91] Corveleyn and Remon [92,93] Keleb et al. [94,95] and Passerini et al [96] to name a few. One notable difference in these methods was developed and used by Song and co-workers [97], who instead of taking samples at long time intervals, used a peristaltic pump to circulate the dissolution
medium through the UV spectrometer to give an `on the fly' measurement of the amount of drug dissolved. The dissolving tablets were held in a wire mesh cage to prevent solids from entering the pump and spectrometer. A similar method was used by Perissutti et al. [98] with a beaker and stirrer to measure the dissolution rate of carbamazepine from tablets made with high shear melt granules.
However, since the materials involved in this work are not drug related, this allows us a great deal of freedom in selecting a reliable and sufficiently accurate method of dissolution testing for the dissolution of granules. A general overview of the techniques
used by other researchers follows.
Conductivity Bajpai and Giri [99] used a conductivity based approach to measure the release of
Potassium Nitrate (KNO3) from hydrogel substances in water. They used unstirred conditions and measured the conductivity of the solution at regular time intervals and then related this to the total dissolved solids content of the solution through a calibration plot. Chateau and co-workers [100] measured the dissolution speed of high
shear detergent granules and tablets by taking conductivity readings of a1L water- based dissolution medium every 10 seconds. The dissolution medium was agitated during the dissolution process at 200 rpm by a dispersion impeller. Complete dissolution of the constituents is characterised by a plateau on the time vs conductivity curve. Kok [101] again used conductivity measurements to monitor the dissolution
process of a detergent formulation, this time in 1L of demineralised water at constant stirring speed and a controlled temperature of 25 T. This method was chosen due to its ease of performance and its small experimental error. They also used a more accurate meter to measure very small changes in conductivity when using smaller volumes for the dissolution of small single granules.
20

Other methods Another method used to measure dissolution time is that of refractive index. Ansari
and Stepanek [102] measured the extent of dissolution of sugar spheres and D-mannitol
granules by measuring the refractive index of 300 ml of distilled water at 20 °C using an immersion refractometer. Cowley and co-workers also used a refractive index based
measurement to determine the concentration of a dextran-water solution [103]. Alvarez-Lorenzo et al. [104] used differential scanning calorimetry to measure the
rate of water uptake by polymer based tablets. Crowley [2] used high performance liquid chromatography to analyse 5 nil samples of a dissolution medium (purified water) for drug content over a 12 hour period.
Shih et al. [105] used the stoichiometry of the reaction between limestone and Hydrogen Chloride to measure the dissolution rate of the limestone in the solution. The pH of the solution was kept constant by adding 0.1 M HCI, with the volume added
vs time being recorded. The fraction of dissolution was obtained by the ratio of acid
volume added to that required for complete dissolution.
Reporting results There are two main ways of reporting dissolution results. The first is a measure of
the dissolution (be it the original absorbance or conductivity, or some conversion to a
percentage) versus time (Figure 2.5). This method of displaying dissolution results can be useful with regard to information about the structure of the granules or tablets involved. For example, if the curve is initially very shallow and becomes steep, the
outside of the object is dissolving slowly with respect to the inside, meaning that the
granule or tablet has some form of consolidated, non-porous or poorly soluble `shell'.
This information can be valuable in the absence of other structure determining
methods such as porosimetry or X-ray computed tomography.
21

ä M
Figure 2.5: Drug release profiles of tablets prepared with 10 mg nifedipine and various concentrations of HPMC from 0 (fastest) to 50% (slowest). The shape of the curves reveals information about the release of the drug with time, from which information about the
structure of the granule or tablet can be inferred. (Source: Ishikawa et al. [89])
The second way of reporting dissolution results is as a value of the amount dissolved
at a given time or as a time taken to achieve a certain level of dissolution. Ohno and co-workers [106] reported their dissolution results as the percentage of complete dissolution obtained after 15 minutes, referred to as D15. The dissolution
characteristics of the materials involved was such that 15 minutes provided the most discrimination between different granules. Perissutti and co-workers [98] reported their dissolution results both as a percentage dissolution versus time curve and a value for
the time taken to reach 90% dissolution, dubbed `t90'. Inghelbrecht and Remon [107]
and Keleb et al. [94] also reported the t90 value for their dissolution results. Kok [101]
went a step further to include the values for 10% and 50% dissolution as well (t10 and t50 respectively), in order to gauge the performance of several different granule coatings. In this case, t10 was referred to as the `lag-time' since it represents
approximately the time taken for any granule coating to dissolve.
Factors affecting dissolution of agglomerates
Porosity In his communication on product engineering, Knight [79] lists the capillary-driven
penetration time, t,, of a single spherical granule as:
t` = 25(1-e)
d17 y (7.3)
s, v
22
02468 10 Time (h)

cohere c is the granule porosity, q is the viscosity of the penetrating liquid, d, ,
is the
surface volume mean diameter of the particles within the granule and y is the liquid
surface tension. Immediately it is clear that the time taken for complete penetration is inversely proportional to the granule porosity. Other factors, such as the surface tension and viscosity are fixed with regard to this work since the dissolution medium is
water. Equation (2.3) assumes that the air in the granule is able to escape during liquid
penetration. Heertjes and Witvoet [108] found that if the capillaries differ in size and are interconnected then this assumption should hold true and that the air would escape at the larger openings in the granule surface. However, this is dependent on the spedfic granule structure involved and is particularly sensitive to low viscosity fluids. It has been reported in some instances that if the powder particle size is small enough and the penetrating liquid surface tension high enough the resulting pressure of the trapped air can be sufficient to fracture a granule [108,109]. In practice, this is most likely to occur with dry or bindcrless granules, since the bond strength in granules containing solid or liquid bridges would usually be sufficient to prevent fracture [79].
The penetration time of a granule is the primary step in the disintegration process [110-112]. Cavallari et aL [113] compared the wet granulation of a granular drug formulation to granules made using steam granulation. They found that the higher
porosity of the steam granules led to increased dissolution rate of the drug substance due to the higher porosity of the granules. Other researchers showed experimentally [114] and theoretically [115] that granules with higher porosity dissolve faster than those with lower porosity. Souto and co-workers [90] reported that the drying process of microcrystalline cellulose (MCC) pellets made by extrusion-spheronization led to contraction of the pellet, reducing pellet porosity and hindering the dissolution rate. They look at the effect of several disintegrant substances on drug dissolution rate and the positive effect noticed was largely attributable to an increase in micropore volume. Short disintegration times due to higher porosities are also reported by Adebayo et al. [84] Ohno et al. [106] Kleinbudde et aL [116] and Carli et al [112].
Young et al. [117] investigated the release of drug from pellets made by hot-melt
extrusion-spheronization. They found that pellets prepared in this way had a slower dissolution rate than pellets made by more conventional methods due to lower porosity and higher pore tortuosity. Riippi and co-workers [118] studied the correlation between dissolution rate and porosity for compressed pharmaceutical tablets. They conclude that porosity and pore size distribution can only partly describe the dissolution behaviour of erythromycin from the tablet structure. This was thought to be because
the type of erythromycin used, erythromycin acistrate, is hydrophobic. This highlights
the importance of surface chemistry in the dissolution process, particularly where hydrophobic materials are concerned.
Alvarez-Lorenzo and co-workers [104] attribute the greater water sorption abilities of Low-substituted hydroxypropyl cellulose (L-HPC) over hydroxypropyl cellulose
23

(HPC) to the greater porosity of the L-HPC particles. The same authors also state in a different piece of work that the "slower disintegration of LH-31 (a grade of IrHPC)
compacts is doubtless due to their smaller total porosity". Ferrero et al. [119] displayed tablet dissolution results that were less porosity
dependent. It was shown in some cases that tablets having lower porosity also had
lower disintegration times. However, later in the paper, they say that for the majority of
the tablets produced, the disintegration time increases as the total porosity decreases.
Decreasing porosity and disintegration times with increasing tablet compaction pressure
was also previously reported by Selmeczi and Kedvessy [120], Borzunov and Shevchenko [121], and Fox et al. [122]. More recently, other researchers working with
tablets have reported that the rapid disintegration of tablets with high porosity is due to
rapid water absorption [89,123].
Pon unidun The basic form of the Washburn equation (2.4) tells us that the size of pores is
important to the rate of intrusion of the dissolution medium into a pore network.
L2=yDt (2.4) 4
where 1 is the time taken for a liquid of viscosity 11 and surface tension y to penetrate
a distance L into a fully wettable, porous material with average pore diameter D. This
means that if the mean pore diameter is doubled, the time taken for complete
penetration would be approximately halved.
In their discussion on granule surface topography, Stanley-Wood and Shubair [124]
emphasize the importance of granule characterisation. They state that since surface
area is "of paramount importance" to dissolution, the characterisation of surfaces and
pores within granules is of great importance to understanding disintegration and dissolution behaviour. Riippi et al. [118] also share the view that the pore size distribution, showing the differences in pore structure, is more informative than the
total volume. Van Veen and co-workers [110] also discuss the importance of pore structure on
drug dissolution from tablets. In particular, they mention the existence of a critical
transition porosity from a continuous pore network to discontinuous dusters, known as
the percolation threshold of air. This percolation threshold is reported to be at
approximately 10"/o porosity for tablets [125,126]. Van Veen and co-workers also discuss the effects of particle size on granule pore size distributions, and found that
there was no significant difference in pore size distribution for tablets with different
particle size fractions but equal total porosity. They implied that fracture of the larger
particles during compression resulted in similar particle size distributions for all tablets,
and therefore that the differences in initial particle size distribution were not
24

responsible for the differences observed in dissolution rate. Particle deformation during compression aas also reported by Stanley-Wood and Johanson [127] and Ferrero et al. [119], who found that the largest pores suffered the largest relative reduction because of primary particle fracture.
Westermarck and co-workers [128] used mercury porosimetry and nitrogen adsorption to measure the surface area and determine the pore structure of mannitol powder, granules and tablets. They found pore sizes with diameters in the range 40-300
nm in granules made by wet granulation. They also found markedly higher specific surface area for the granules compared with the powder using nitrogen adsorption. Since this method can detect even the smallest pores and surfaces, the authors suggest that it is likely that the increased surface area is due to dissolution and recrystallisation of mannitol from the binder.
Farber et al. [3] studied the pore shape, spatial distribution and connectivity of pharmaceutical granules using X-ray computed tomography (XRCT). XRCT was found to be less precise than mercury porosimetry with regard to measuring total porosity and pore size distribution, but nevertheless allows for image reconstruction of the internal microstructure of granules. The granules studied were found to have
relatively large pore cavities interconnected by narrow pore `necks'. The size of these pore necks was also found to be the main structural difference between granules made under different conditions.
Panicle st, --e and rhape To be able to design granules with the required end-use characteristics (such as fast
dissolution), it is important to understand the effect of formulation and processing variables on granule microstructure [102,129]. The microstructure of a granule includes everything to do with the spatial distribution and quantity of powder particles, binder and voidage. Katikaneni and co-workers [130,131] and Upadrashta and co- workers [132] investigated the release of drug from ethyl cellulose tablets prepared by direct compression. They found that drug release rate decreased due to a reduction in
porosity and increased tortuosity at high compaction pressures and also due to smaller powder particle size of ethyl cellulose.
Ohno and co-workers [106] found that while particle size did have an effect on the dissolution of tablets made from high shear granules, the pore size distribution, determined quantitatively by X-ray computed tomography, had a much more significant effect. However, Ansati and Stepanek [102], found both experimentally and theoretically that primary particle size plays an important role in granule dissolution due
to its effect on the packing density. They also claim that it should be possible using careful selection of primary particle size, to modify granule porosity while keeping the binder to solids ratio constant.
Adebayo et al. [84] investigated the use of breadfruit and cornstarch as disintegration
aids in tablets. They found that the unexpected longer dissolution times of breadfruit
25

starch, despite its higher hydrophilicity, were attributable to the close packing afforded by the shape of the particles, resulting in reduced tablet porosity.
Albertini et al. [91] found that the surface morphology of the granules being dissolved was important. They compared the dissolution of smooth-surfaced steam granules with granules having a much higher surface roughness and found that the steam granules dissolved much more slowly. This was thought to be partly due to their lower surface area but also their lower porosity.
Binder In their generalised paper on particle products, Edwards and Instone [133] state that
sometimes the skeletal structure formed by solidification of a binder, either from a melt or by precipitation or chemical reaction, can have major effects on the disintegration
and dissolution behaviour. In extreme cases, they say, a precipitating solid from the binder solution can chemically bond to the primary particles, limiting the dissolution to a shrinking-core process, with no scope for disintegration.
Wells and Walker [134] reported that for a pharmaceutical formulation, drug release rate was strongly affected by the solubility of the drug in the binder solution. They found that for high drug solubility in the binder, the resultant tablets were strong but displayed poor drug release characteristics.
Juppo and Yliruusi [135] investigated the amount of granulation liquid on the pore
volume and size distribution of lactose, mannitol and glucose granules. They found
that higher binder contents resulted in lower pore volume, particularly in the 14 to 220
µm range. For smaller pore sizes (6 nm to 14 µm) it was found that the amount of binder had no effect for lactose and glucose granules, while for mannitol granules the pore volume in this size range actually increased.
2.3 Literature Discussion and Conclusions
Strength
The strength of a granule is achieved as a result of anything that helps to resist the
movement of a particle held in the granule assembly, including particle-particle friction
and binder bridge forces. Since the Calcium Carbonate/PEG model system (and indeed detergent granules) is held together with solid bridges, it is these that are expected to contribute the greatest resistance to particle movement. Therefore, the properties (number, morphology, material) of these solid bridges are arguably the most important factor when considering granule strength.
Rumpf [6] and Kendall [21] tell us that the strength of a granule is proportional to the bridge and particle density, and inversely proportional to porosity. Kendall [21] also predicts that for the same total porosity, small particle size with high bridge number
26

density will result in a stronger assembly than fewer, larger particles and bridges: So,
strictly speaking, porosity does not control the strength of a granule; it is the morphology of the solid fraction that controls granule strength. However, the value of granule porosity does give an indirect indication of the morphology of the solid fraction, since porosity is inversely proportional to the bridge length, width and particle packing density. For a given set of materials, it is also therefore the value of total or overall porosity which gives the strongest indication of granule strength without measuring it directly.
Furthermore, the porosity (and therefore packing density and bridge morphology, or granule consolidation) can be influenced by many process parameters including
agitation type and intensity, binder content, binder viscosity, mixing time, particle size and binder surface tension. However, the exact effects of these parameters on the structure of the resultant granules is not clear, and seems to vary depending on the exact type of mixer used or the particle/binder system in question. There are conflicting results for almost all of the parameters listed above and so the effects of these variables on the Calcium Carbonate/PEG system used in this work cannot be
predicted beforehand. They must therefore be determined experimentally.
Dissolution and disintegration
Since the contents of this model system include Calcium Carbonate, which is insoluble in water, it is effectively the disintegration time which will be measured in this work (although the PEG binder does dissolve). This means that the effects of particle size are omitted from the dissolution results, allowing us to concentrate on and analyse only the effects of granule structure. Because of this, porosity and pore size distribution, which are proportional to the solvent intrusion time of a granule [79], are expected to play a key role in determining dissolution behaviour. More specifically, this means that factors such as whether pores are interconnected and binder bridge
morphology will be important due to their direct effects on the time taken for the water to reach the PEG binder bridges.
Unlike work on granule strength, there is no extensive literature on the effects of granulation variables on resulting agglomerate dissolution rate. The closest literature is
that regarding the dissolution of tablets, which is commonly the result of a two-stage
process (penetration of intra-granular pores followed by inter-granular pore penetration) and involve much more complicated systems, making it hard to judge the
effect of a single parameter on the mechanisms involved. Of the limited relevant literature that is available, the most interesting statement comes from Edwards and Instone [133], who reported that the skeletal structure formed by solidification of a binder can have quite significant effects on the disintegration and dissolution behaviour.
In general, then, it seems that granule porosity will be an important parameter
regarding disintegration and dissolution, with perhaps more emphasis on pore . structure
and pore rzze distribution than for granule strength. However, there is no direct
27

experimental evidence to suggest how strong these dependencies will be, nor how they vary with a range of different experimental variables.
Conclusion
Therefore, the effect of granulation variables on both strength and dissolution of the resultant granules must be determined experimentally as a first step in this investigation. The aim of these preliminary experiments (the methods of which are given in chapter 3
and the results and discussion for which are given in chapter 4) is therefore to see whether porosity is the defining factor for both granule strength and dissolution time, as suggested, but not directly proven, by the currently available literature.
28
CHAPTER
3
EXPERIMENTAL METHODS
This chapter gives details of the granule production methods and explains how each of the characterisation parameters are measured and why they are important to the
overall scope and aims of the project and the context in which the results obtained can be used. The granules referred to in this chapter are made from Calcium Carbonate
powder (trade name Durcal, normally of grade 40, indicative of the mass mean particle
size - see Table 4.1) and a Polyethylene Glycol (PEG) binder, normally of average molecular weight 1500 Daltons. More information about these materials is available in
the appendices A and B respectively.
3.1 High Shear Granulation
High shear granules are produced experimentally in batches of 1 to 3 kg in a Zanchetta Roto junior vertical axis granulator while smaller batches (circa 600 g) were made in a Bosch food processor with a modified impeller designed to emulate that of the larger Roto Junior. The Roto junior has a 3-bladed main impeller which rotates in
the base of the bowl and a high speed chopper offset from the centre of the mixer suspended from the lid of the bowl (Figure 3.1). A temperature probe also extends down from the lid of the granulator and sits in the moving toroidal powder mass during
granulation. The main impeller and chopper have computer-controlled variable speeds with
maxima of 800 and 1400 rpm respectively. There is also an integral heating jacket
which surrounds the side of the bowl and is commonly used to heat the powder before
29

an experiment involving the use of a PEG binder (since the binder must be liquid in
order to granulate, and PEG 1500 melts at around 45 °C).
Figure 3.1: schematic diagram of a vertical axis high shear mixer with 3- bladed impeller.
Since the granulated powder can be hot where PEG is used as the binder (a jacket
temperature of 60 °C is typically used for PEG 1500), it must be cooled down in order to solidify the PEG binder. If the granules are simply left out on a tray to dry then liquid bridges form between individual granules whilst the binder is solidifying, resulting in an agglomerated mass. To avoid this, the cooling method used involves gently agitating the granules until the surface of the granules has cooled to below the melting range of the PEG binder. In practise this point is easily identifiable since the flowability
of the granular mass greatly increases as the granules lose their stickiness which results from the presence of molten PEG binder at their surface. The presence of molten PEG at the granule periphery is a result of the consolidation of granules made by the immersion mechanism (Figure 3.2) first proposed by Schaefer and Mathiesen [136],
since the size of the primary PEG flakes (which melt to form droplets in the hot
granulator) is much larger than that of the primary powder particles.
006 000 0 : 0
0 4D %j ® 0 ® Solid Binder Distribution Coalescence
0 cd- -11. Solid Binder Immersion
Figure 3.2: The nucleation formation mechanism is dependent on the ratio of droplet to
particle size [136].
30

Experimental repeatability
The intrinsic variation in any given granulation process [14,68,137-139] results in individual agglomerates with different properties. It is therefore reasonable to assume that two different batches made under the same conditions may also exhibit different
characteristics. Whether or not this difference is significant must be determined by
experiment. The experiments were repeated in order to investigate differences between batches
made on the same day and also between batches made on the same day of the week but
on different weeks during the month of October 2004.
8 Z
0 w6
w C) 14 rn C) C c N G1 2 C1
C) >
0
Dissolution time (t90), sec
Figure 3.3: The experimental repeatability of high shear granulation. 10 separate batches of granules made with the same formula in exactly the same way show very little difference in
terms of the resultant granule strength and dissolution.
Figure 3.3 shows the experimental repeatability results. Granules were made each time in accordance with the `standard recipe' used in this work, which to summarise includes 2kg pre-warmed Durcal 40 with 260 g solid PEG 1500 flakes, granulated for 10 minutes at 400 rpm with a 60°C granulator jacket temperature. All ten batches were made using this formulation and carried out in exactly the same way.
The results show good correlation between the batches. The majority of results show single granule failure load within 1N and dissolution time (W within approximately 5 seconds. These levels of variation are within the strength (assuming 20
single granules are tested) and dissolution (assuming dissolution of 1g granules) experimental error limits and so are unlikely to be improved using current methods and equipment.
31
0 20 40 60 80 100

In summary, the experimental repeatability has been shown to be good, with the
results of identical experiments all occupying the same small region on a plot of average single granule failure load against dissolution time.
3.2 Fluidised Bed Granulation
Fluidised bed granules are produced in an Aeromatic bench-top fluidised bed
granulator. The body of the fluidised bed is transparent plastic which is useful for
observing the conditions inside the granulator. Where PEG is used as the binder, it is heated and kept molten prior to spraying through a nozzle, and then cools down and solidifies shortly after contact with the fluidising air. The rate of cooling can be
controlled (and even prevented) by the temperature of the air used to fluidise the bed.
Figure 3.4: Fluidised bed granulator setup (Source: GI-, 'A Aeromatic-Fielder, www. aeromatic- fielder. com).
The fluidised bed can also be used as a cooler after fluid bed or high shear
granulation by fluidising without binder addition using cold air.
Comparison of high shear and fluidised bed granules
Granules made in a high shear mixer are typically denser with a far greater extent of
consolidation than granules made in a fluidised bed. The difference between the
granule structures is largely due to the difference between the forces acting on the
powder/binder/granule mixture in each vessel. Mixing in a high shear granulator is
32

done by a mechanical impeller and thus the process is much more intense and- the forces are larger. Mixing in a fluidised bed is achieved using an air flow, which is
compressible and so the forces on the solids are much lower. Therefore, granules made in high shear mixers are typically fairly spherical, dense
solids while those made using a fluidised bed are light and airy with a much more random, open structure having large air gaps between powder particles.
3.3 Granule Strength
The strength of a granular product is crucial, since it determines how the product should be handled, stored and transported. There are many different ways of defining
strength, such as:
" Compressive strength " Tensile strength " Abrasive strength
The compressive strength of the granules is the most relevant here, since it is the performance of the product which is the driving factor for this research. The ability to withstand compressive forces determines how the granular product will behave whilst in storage and transit.
Compressive strength
In granulation processes it is often important to know the strength of the product being produced, since it has a profound effect on its behaviour and characteristics [40,
140,141]. The first and most conventional approach to compression strength
measurement involves crushing single granules between two platens and recording the load-displacement behaviour to determine the fracture load. The second method involves the use of a uniaxial confined compression test, whereby the single granule is
replaced by a bed of similar granules held in a cylinder which are then compressed by a dose-fitting piston [142]. The average single granule strength can then be estimated from the behaviour of the whole bed under compression using compression models by
Heckel [143], Kawakita and Lüdde [144] and Adams et al [14]. Each of these methods
will be discussed in more detail shortly.
It is possible to measure the compression strength of the granules because they are semi-brittle, meaning that when a granule is subjected to compressive strain (displacement), there is a point where the granule cracks resulting in a marked drop in a load-displacement plot (Figure 3.6). The remainder of the load/strain curve after the
crack point, which represents the compression of granule fragments and eventually powder particles, is of little use since no meaningful result can be obtained from it.
33

Compression testing is performed using a Zwick/Roell Z0.5 material testing
machine connected to a PC for real time data logging and result analysis (Figure 3.5).
The crosshead travel is accurate to 0.226 µm which provides sufficient resolution for
this purpose, while force measurement is provided by a load cell. Two load cells with maximum force ratings of 10 N and 500 N are available, and are selected accordingly depending on the subject matter. However, even the 500 N load cell is sufficiently
accurate for use in the range below 10 N with force measurement accurate to 0.001 N.
The 10 N load cell provides additional accuracy with 0.00001 N precision.
I for cc
0,4Vý k" ,
: v, r
{ test
Data logging PC
Figure 3.5: Uniaxial compression test equipment used to determine granule failure load.
Single granule compressive strength
Testing single granules is the simplest way of determining the compressive force that
a granule can withstand before failure. The test is performed by compressing a granule
at a constant rate between two stainless steel platens. The test is complete once the
granule has fractured, or has been compressed to half of its original size. The need for
this secondary condition highlights the main problem regarding the testing of single
granules, in that each and every one has a different internal structure and composition. This results in a unique behaviour under test conditions for each granule, and so the
test must be repeated for a number of granules to achieve an average single granule
strength for each batch.
The main practical complication concerning the testing of single granules is the size
of the granules to be tested. Granules in the size range 1.0 to 1.4 mm were tested as a basis to start from since there are usually sufficient numbers of granules within this size
range to accommodate the various tests. This size range also ensures that the granules
can be easily handled and tested using the single granule compression strength method,
, -- -ý
34

while being as close as possible to the size range involved in the industrial manufacture of detergents, for which this represents a simplified model system.
8
6
Z
" 0 J
2
Displacement, mm
Figure 3.6: Load-displacement behaviour for a single solidified Durcal 40/PEG 1500 granule of diameter 1.3 mm under uniaxial compression.
Figure 3.6 shows a typical load-displacement curve for a single Calcium
Carbonate/PEG granule of 1.3 mm diameter under uniaxial compression, with failure
(macroscopic fracture, the mechanics of which are described in more detail by Bika et
al, [8] and others [139,145]) occurring at 6.4 N, having compressed the granule by a little over 0.1 mm. The region after fracture (region B) represents the compression of broken granule fragments and their rearrangement under the moving piston, resulting in a fluctuating force. At the point where the fragments are completely compacted and
the piston senses the base plate below the force will begin to rise again steeply [146].
Pitchumani et al. [146] reported similar behaviour for spray-dried sodium benzoate
granules in the size range 1.2 to 1.9 mm, which showed irreversible plastic deformation
after unloading that could not be described by Hertzian theory. Despite this inelastic
behaviour, they argue that the breakage can be classed as semi-brittle because of the brittle fracture of the granules, denoted by a sharp drop in the force, similar to that in
Figure 3.6. They also suggest that "local inhomogeneities inside of the particles
promote microcracking and result eventually in the growth of a median macroscopic
crack that splits the particles into two fragments". Where the word `strength' is used in the experimental results sections of this
document (chapters 4 and 5), it refers to this method of single granule compression strength measurement, to find the (average) failure load at which macroscopic fracture
35
0 0.00 0.02 0.04 0.06 0.08 0.10 0.12 0.14 0.16 0.18 0.20

occurs, using 20 single granules in the size range 1.0-1.4 mm. For instances where the procedure used deviates from this method, it will be clearly stated in the text.
Failure mode Compression tests performed on Calcium Carbonate granules with a solid polymeric
binder (Polyethylene Glycol, average molecular weight 1500 Da) formed by high shear granulation using a Zwick/Roell materials tester and Red Lake high-speed video camera showed a range of different failure characteristics. Typically such granules undergo elastic deformation, followed by plastic deformation and eventually fail by meridian crack propagation.
Figure 3.7 shows the range of failure modes of Calcium Carbonate granules that have been carefully removed post failure and examined under a microscope from
above. Failure is most commonly by catastrophic failure along meridian planes, denoted by a sharp drop in the load-displacement curve, plotted live by the materials tester (Figure 3.6). These granules typically split into halves, triple segments or quadrants. The flattened area in the centre of the granules is indicative of the level of plastic deformation that has occurred during compression, prior to catastrophic failure. Because of this localized plastic deformation, the failure of these granules is classed as semi-brittle.
Figure 3.7: Plain view of Calcium Carbonate granules having a solid polymeric binder typically fail by catastrophic failure along meridian planes. Granules commonly split into halves, triple
segments or quadrants. The white areas in the centres of each granule indicate the contact area between the granule and the compressing platen.
Errors
The inconsistent nature of the uniaxial confined compression test results means that
single granule compression testing is the only remaining reliable way of determining the
compression strength of these granules. Figure 3.8 shows stabilisation of the mean single granule failure load with increasing
number of granules tested. There is very little difference between the mean value of failure load for 40 granules and that for 80, indicating that this value is very close to the
real mean for the sample of granules in question. A t-test on this data set also showed that as few as 5 single granules would give a result that is statistically representative of
36

the actual mean at the a=0.05 level. This means that statistically just 5 granules are
needed to get 95°ßo of failure load values within 5" o of the actual mean value.
7
6 z 0s 0
a
4 w a C3 ýo öý aZ
C
1
0
Mean Median Standard deviation
Figure 3.8: variation of mean, median and standard deviation of the mean of single granule
compression strength with number of granules tested.
Possible I'ariation during Testing
8
z"" "" v"y"
"""f""f"""""
"
°' 3" ti o"
.5z _C) C
1
0}tr"t
0 20 40 60 80
Sample number
Figure 3.9: Spread of failure load results obtained during the testing of 80 granules in the size
range 1-1.4 mm.
37
5 10 20 40 80
Number of single granules tested

The plot above shows that there was no identifiable trend in the failure load during
testing, where the granules tested last (the test was performed in order, from number 1
to number 80) had been exposed to the atmosphere (typically 35-55% Relative
Humidity and 20-25 °C) for the duration of the test (approximately 4 hours).
Crosshead . speed In order to determine how the crosshead speed affects Calcium Carbonate/PEG
granules under compression, 40 single granules in the size range 1.0-1.4 mm were
crushed at different crosshead speeds from 0.001 to 10 mm/min.
7 Z
A 0 2! 6
2 a,
5
v C c N
w4 rn 0, a
3
Crosshead speed, mm/min
Figure 3.10: Effect of compression speed on the average single granule failure load. Data
points are the mean of 40 single granules and error bars represent the standard error.
Figure 3.10 shows that the crosshead speed used during a uniaxial compression test has quite a significant effect on the reported average failure load of single granules. As
the crosshead speed is increased from 0.001 mm/min up to 10 mm/min the average failure load increases from approximately 4 to 6 N. At faster crosshead speeds the
reporting interval frequency of the load cell is insufficient to record the load-
displacement behaviour accurately, while 0.001 mm/min was the lower limit of the displacement drive unit.
There have been a number of experimental investigations on deformation rate
effects in particulate materials. Yashima and co-workers [147] carried out the most
comprehensive investigation on the subject to date. By using a number of single-
particle breakage testing equipment (slow compression press, instrumented drop-weight
tester and Hopkinson pressure bar) they were able to measure the response of spheres of various materials to loading at different rates, from low speed (0.025 kg/s) to
38
0.001 0.01 0.1 1 10

dynamic loading (500 kg/s) under two-point loading. They observed that materials respond more rigidly (with higher stiffness) when subject to higher loading rates. It was also found that materials present higher particle strength at higher rates.
During the compression testing of Calcium Carbonate granules with a (solid) PEG binder it was noted that the failure mode changes with the speed of compression. While the failure mode remains by meridian crack propagation, the number of large
cracks along meridian planes increases with compression speed. The amount of plastic deformation of the granule prior to catastrophic failure also increases. This can be dearly seen in Figure 3.11, in which the flattened area seen on the plan view of the
granules increases in area, supported by side-on images showing that the width of the
granules (at fracture point) compressed at higher speeds is significantly lower.
39

(a) 0.001 mm/min
(b) 0.01 mm/min
(c) 0.1 mm/min
(d) 1.0 mm/min
(e) 10 mm/min
Figure 3.11: Calcium Carbonate granules compressed at increasing crosshead speeds show both enhanced levels of plastic deformation and number of large meridian cracks at the point
of catastrophic failure.
40
Plan Vicyv Side V'icwww

Multiple granule compression testing
An alternative to single granule testing involves replacing the single granule with a
confined bed of similar granules whereby the average single granule strength can be
estimated from the behaviour of the whole bed under compression using compression
models by Heckel [143], Kawakita and Lüdde [144] and Adams et al [14]. The more
recent method developed by Adams et al was used in this work to relate the bulk
compression data to the single granule failure load. This is done experimentally by
using a piston in a cylinder and is thus referred to as a uniaxial confined compression test (UCCT) (Figure 3.12).
Relating the macroscopic strain of the bed under load to the single granule properties in a quantitative way is not trivial. Adams et al [14] provides a suitable method in which an expression for the load-strain relationship is developed and proves to be a good approximation of experimental behaviour. This theory then facilitates the
calculation of the average shear strength of a single granule, which is related to the
single granule crushing strength through a proportionality factor.
Cross sectional area A.
P
Figure 3.12: Uniaxial confined compression test
nitial bed ieight h
In Adams' model, the compression of granules in the bed is modelled on a series of parallel load-bearing columns, within which single granule failure is due to the uniaxial bed compression pressure (P, Pa) which is constrained by the radial stress (P, ) that
acts laterally due to neighbouring columns of granules. Mohr-Coulomb failure criterion
explains the macroscopic failure stress, in which the shear failure stress (r) of the
granules in the bed is characterised as:
r=zo+aP, (3.1)
ý- 41
44.

where to is the cohesive shear strength of single granules (Pa) and a is the lateral
pressure coefficient from Mohr-Coulomb failure criterion.
The average single granule failure load (F) is given by equation (3.2), where d, is
the granule diameter and tö (rp =Z zo) is determined by fitting equation (3.3) to the k3
data points obtained from the uniaxial confined compression test on a least squares basis, and plotted in the form of In P against the natural strain, r (E = In (ho / h)
, where h is the bed height). A value for the average single granule failure load can then
be expressed in the form Fc, N.
_ 'cda2 Z_
7rdp2 k3 FCC
4°4kTo (3.2)
z
1nP=1n(zö/a')+a's+In[1-exp(-a's)] (3.3)
where a' = k2a .
Within any given batch of granules there will be an inherent variation in the failure
loads measured, even when granules of the same size are considered [8]. This is due to
the heterogeneity of high shear granulation [148] and the non-uniformity of binder
distribution [149]. For single granule compression strength measurement this means that multiple granules must be tested for a statistically acceptable average to be
obtained. This can be time consuming and in some cases difficult if the individual
granule failure loads are small and/or the accuracy with which measurements can be
made is low. However, testing single granules also means that a distribution of the failure loads can be obtained, which is impossible to extract from multiple granule
testing. This failure load distribution can prove to be very useful in determining the
quality of granules made by a given granulation process. In addition, problems in
handling and storage are caused by the weakest and the strongest granules, not the
average [137].
Testing multiple granules simultaneously using uniaxial confined compression
provides a convenient solution to the time consuming nature of single granule testing,
since a range of granule strengths and sizes can be averaged out during a single test [14,
150]. However, it is the analysis of the results - relating the macroscopic behaviour of
the bed to the single granule properties in a quantitative way - that is the difficult step. The full solution to this problem could perhaps be achieved by using a highly detailed
computer simulation [151] if sufficient computing power was available. The
mechanisms thought to be responsible for the bulk compression of granules are
outlined by Denny et al. [152]. An evaluation of bulk compression models by Heckel,
42

Kawakita and Lüdde and Adams et al. has been carried out by Samimi et al. - [153] and related where possible to single granule properties such as yield pressure and Young's
modulus and DEM simulations for detergent granules.
Results For the uniaxial confined compression test, the granules were placed inside a
stainless steel cylinder of internal diameter 30 mm and tapped to reduce packing irregularities. An initial bed depth of approximately 16 mm was used throughout. The
method developed by Adams et al [14], involves an approximate first-order lumped-
parameter approach. In this method an expression for the stress-strain relationship is
developed which was proved to be a good approximation of experimental behaviour
for large quartz sand and polyvinyl-pyrrolidone (PVP) agglomerates with low binder
content. This theory then allows for the calculation of the average shear strength of a single granule, which is in turn related to the single granule compression strength through a proportionality factor (k2 / k3 ), which is impossible to determine numerically
without considering the details of the mechanisms which lead to single granule failure
(failure is assumed to occur only by oblique shear and not by tensile crack opening, due
to granules being constrained by radial stresses induced by neighbouring granules and walls).
It can be seen from Table 3.1 that at lower binder concentrations the difference between the mean single granule failure load and the calculated value from the multiple
granule `pot' test increases. Indeed, the authors [14] go further to state that
agglomerates with less than 0.5% binder gave unreliable results. This suggests that factors such as granule composition and therefore failure mode may strongly influence
the applicability of such a method. Unfortunately the authors make no mention of the failure mode of their agglomerates in either the single granule or the multiple granule
compression tests.
43

Table 3.1: Results of uniaxial confined compression tests and single granule crushing tests performed by Adams et al [14] on quartz sand/PVP agglomerates.
Binder content Agglomerate diameter, Single agglomerate (k2 /k3) Fcacc (%) do (µm) crushing load, F (N) (N)
0.5 2580 0.7 ± 0.2 2.7
1.0 2580 3.1 ± 0.9 8.1
2.0 1850 5.7 ± 0.8 9.2
2.0 2180 6.9 ± 1.9 10.1
2.0 2580 7.4 ± 1.3 10.7
3.2 1440 6.2±1.1 8.2
3.2 1850 6.9±1.8 13.1
3.2 2180 10.8 ± 2.0 14.1
3.2 2580 14.0 ± 2.9 15.7
In practice using smaller 1 mm (approximately half the size of the quartz sand/PVP agglomerates used by Adams et al in their work) Calcium Carbonate/PEG granules (also having a much higher binder content of 10 - 15%) this method was found to give a similar trend within a series of experimental results to single granule testing but the
actual values of force were found to vary widely between different sets of granules and in some cases could be up to 10 times greater than the values recorded by single granule testing. Incidentally, the `pot' used in multiple granule compression had a 30 mm inside diameter, around 80% of the size of the pot used by Adams et al in their experiments, meaning that the granule size to pot size ratio could be considered similar. Early
experimental results suggested a promising correlation between the single granule compression test and the time-saving multiple granule `pot' test (Figure 3.13). In Figure
3.13 two sets of granules made with different molecular weight PEG binders were compared using the two tests, and showed reasonable similarity, despite the factor of 10 difference between the actual values reported.
With regard to the difference in the reported values from each method, studies by Samimi [154] for high. shear granules and Bashaiwoldu et al. [155] for
extrusion/spheronization pellets under bulk compression using the method developed by Adams et al [14], in addition to work by Berggren et al. [156] using the Kawakita
equation, have resulted in similarly large variations in the reported values to those presented here.
44

14 200 Z
-ä 12 0
0 10
8 c
6 c c A4 rn >2
0
I o single granule compression test
(average of 20 granules) Uniaxial confined compression test
1500 6000
Average molecular weight of binder, Da
150
Z V J
i o0 N
Y
50
0
Figure 3.13: comparison of granule strength results given by uniaxial confined compression test and single granule compression test for different molecular weights of binder. Binder
content is 13% of powder mass.
Further experimental investigation, however, began to raise concern over the
suitability and, more importantly the reliability of the multiple granule `pot' test. Figure 3.14 is an example of a different set of granules, this time having been manufactured using different amounts of binder, where the results of the single granule test and the
multiple granule test do not agree. The results of single granule testing show that the
strengths of these granules did not vary significantly with increasing binder amount. However, the multiple granule `pot' test results suggest that the granule strength decreases significantly (by over half) with increasing binder amount. The reason for
this is as yet undetermined, but it is suggested that varying levels of binder at the
granule periphery will play a role in granule-granule interactions during compression in
the confined space of the pot. It is thought that the varying levels of friction involved
in these granule-granule interactions would play a key role in determining how the bed
behaves under compression, and therefore has the potential to influence the shape of the curve and the numerical result obtained from it.
45

Z
0 v6
F
rn
c N
0)
I
o single granule compression test (average of 20 granules)
uniaxial confined compression test
12 14 16
Binder content, % of powder mass
120
100
80
60
YM
40
20
Figure 3.14: Comparison of strength results given by uniaxial confined compression test and single granule compression test for granules made with different overall binder (PEG 1500)
contents.
The second problem with the confined multiple granule test is highlighted by the
presence of error bars on the results in Figure 3.14. For a test which is intended to be
used to give a mean failure load result, the presence of error bars here indicates that
repeat tests using the same batch of granules do contain some variation. The
repeatability of the multiple granule `pot' test was not investigated by Adams and co-
workers [14] but nevertheless, this is something which only adds to the uncertainty of the results obtained using these granules.
The fit of the Adams equation was the same for all data, whether the bulk trend agreed with single particle trend or not. In addition, for the compression of granules with the aim of extracting single granule data, wall friction is not generally considered [14,143,144,157-160], unlike for the compaction of pharmaceutical powders [161, 162]. Also, work by Samimi et al [154] has directly shown that wall friction has a negligible effect on the bulk compression of granules and the inferred single granule failure load from compaction equations.
Adams' equation was used because it gives a more accurate value of inferred single granule failure load over Kawakita and Ludde equation [14,154]. In addition, unlike the models of Adams and Kawakita, the Heckel model is not sensitive to changes in
granule porosity or composition, resulting in less reliable results [154]. Roberts and Rowe [163] also reported significant deviations from the Heckel relationship for brittle
materials, limiting the value of the technique for granules with solid binders. The
suitability of the Heckel and Kawakita equations for this purpose is also questioned by Denny [152].
46

For these reasons, in addition to the fact that information about the statistical variation of single granule failure loads from a given batch is lost, the multiple granule confined compression test has not been used in the analysis of experimental results.
" Granule size 1.0-1.4 mm
" Compression speed 1.0 mm/min
3.4 Dissolution Time
Dissolution time and porosity are linked, since granules of high porosity will dissolve
more quickly than those with very low porosity. This can be seen when comparing granules made in a high shear mixer (low porosity, slow dissolution) to those made in a low shear mixer or fluidised bed (higher porosity, faster dissolution rate). Dissolution
time is used as an indirect measure of porosity, and can be a better indication of the
actual performance of the product. The dissolution time of a granular product is important since the vast majority of
granules end their life by being dissolved in solution, whether it is a pharmaceutical product being dissolved in the stomach or detergent powder being dissolved in a washing machine. This research is focussed on making the dissolution time as quick as possible, since it is the performance parameter by which the consumer judges the
product, especially when hand washing.
The dissolution time of a granular product is determined by the time taken for 90° 0 of 1 gram of granules in a chosen size range to dissolve (dubbed t,,,, ). The t,,, was a pre- defined test requirement for this work since it represents a good approximation of the
point at which the product is perceived, by the end-user, to have dissolved. Figure 3.16
shows that also there would be little advantage in changing to a value of t7� or t8� in
terms of clarity of results. The extent of dissolution is measured by the change in
conductivity of 600 ml of distilled water whilst the granules are dissolving. The test is
performed in a1 litre beaker positioned on a hot plate with a magnetic stirrer set to 600
rpm and kept at a constant temperature of 20 °C. These values were chosen as they limit mechanical breakage of the granules by the stirrer whilst ensuring good mixing of the dissolution medium. Frenning et al. [164] have used a similar conductivity-based technique to measure the drug release rate from single agglomerates. The conductivity
and dissolution of PEG-based systems has also been documented [165,166].
47

s$ I$$ 1
figure 3.1 -): dissolution test
Magnetic stirrer/hotplate
The conductivity' of the solution is monitored by aI lanna Instruments I-II9932
conductivity meter with real time data logging by a PC. The conductivity meter sends conductivity (automatically temperature compensated by the meter), time and temperature readings to the PC every 10 seconds during real-time data logtg*ing. Testing
of a sample is stopped when three consecutive measurements of the conductivity have been the same, indicating that the dissolution process is complete.
100
80
60 ö
40
20
Figure 3.16: calculation of t90
90%
48
0 f" i 0 50 100 150 200
Time, sec

Dissolution errors
The standard dissolution time test involves monitoring the change in conductivity with time of a 1.0 gram sample of granules dissolving in 600 ml of distilled water. To determine the accuracy and reliability of these results, ten 1 gram samples in the size
range 1.0-1.4 mm from a single granulation batch were tested in series. No special
sampling techniques were employed to select granules from this narrow size class.
100
80
60 ö N
40
20
0
Time, sec
Figure 3.17: Extent of dissolution versus time shows that all ten identical samples perform consistently under testing.
The results of these tests show that the dissolution profiles for the ten identical
samples have very consistent profiles (Figure 3.17) and little variation in the value of t,, (Figure 3.18) with the ten samples having a mean of 64.6 seconds and a standard deviation of 2.4 seconds. Similar tests on granules made under slightly different
conditions showed slightly better consistency within results, with a standard deviation
of only 1.4 seconds from a mean t,, of 67.3 seconds.
49
0 50 100 150 200

100
80 v O Q1
60 v E
°- 40
ö
20
0
Mean
Figure 3.18: Plot of t,,,, values shows only a small variation for ten identical samples. The
standard deviation from the mean of the data set is 2.4 seconds.
Granule samples are stored in sealed sample bags in an air conditioned laboratory
after sieving into the 1.0-1.4 mm size fraction, and are exposed to the atmosphere for
exactly the same amount of time whilst they are weighed and awaiting dissolution
testing.
Effect of temperature
The temperature of the water in which the dissolution test is performed has a
profound effect on the dissolution time. Figure 3.19 shows the dissolution time plotted
against the temperature at which the test was performed for a number of identical
batches.
It can be seen (Figure 3.19) that a temperature increase of 10°C will reduce the
average dissolution time (t,,, value) by up to around 15 seconds. It is therefore imperative that the dissolution test always be performed at the same temperature, as
this effect goes some way towards explaining the different results obtained from
identical batches. The dissolution tests were performed within ± 0.5 °C to minimise
the error due to dissolution medium temperature. This results in an error due to
temperature of approximately ±1 second.
50
12345678
Sample number

60
50 (L)
O
40 E c 0 30
0 N
20
104- 20 25 30 35 40 45 50
Temperature, °C
Figure 3.19: The effect of temperature on the mean and S. D. of the dissolution time for high
shear granules.
500
400 N
v 300 E
c ° 200 ö
N
100
I
Figure 3.20: Effect of the size of magnetic stirrer bar used on mean granule dissolution time. Error bars denote the standard deviation of 3 repeats.
Dissolution time also decreases with increasing stirrer bar size (Figure 3.20) and
stirring speed (Figure 3.21). This is due to increased mixing of the medium with both
size and speed, thus raising the repeatability through more accurate reporting of the
conductivity of the solution.
51
0 12345
Stirrer bar size, cm

300
250 u
200
E 150
0
ö 100 VI 0
50
Stirring speed, rpm
Figure 3.21: Effect of stirring speed of dissolution medium on reported mean granule dissolution time. Error bars show SD of 3 repeats.
Box 3.2: Granule Dissolution Testing
" 1.0 gram of granules
" Granule size 1.0-1.4 mm
" Stirring speed 600 rpm
"Water temperature 20 °C
3.5 Composition
Binder content
To determine the average granule binder content a thermo-gravimetric approach
was used. Granules in the size range 1.0-1.4 mm were heated in a furnace to 600°C,
following the method described by Knight et al. [71]. This process results in the
removal of the PEG binder, but causes no reduction in the mass of Calcium Carbonate
powder. The recorded change in mass (using an analytical balance with an accuracy of ±0.1 mg) is then representative of the average granule binder content.
This method has shown very good repeatability (±0.1%) in testing a number of
samples from the same granulation batch (Table 3.2). In order to minimise any error in
52
0 "T I1I71IT
100 200 300 400 500 600 700 800 900

weighing the mass of the residual dry ash caused by the adsorption of water from the
atmosphere, the ash is weighed immediately on removal from the furnace.
Table 3.2: Repeatability data for the thermogravimetric analysis method of determining
average granule binder content using the method outlined by Knight et al F11.
Sample number Water content, °/(, Binder (PEG 1500) content, ", 0
1 0.07 12 .2
2 0.04 12 .2
3 0.08 12.2
4 0.07 12.1
5 0.07 12.1
6 0.03 12.3
7 0.04 12.3
8 0.04 12.2
9 0.04 12.2
1() 0.05 12.1
Average 0.05 12.20
SD 0.02 0.06
Box 3.3: Granule Binder Content
" Thermogravimetric approach (mass loss)
" Approx. 4 grams of granules
" Granule size 1.0-1.4 mm
"2 Hours at 100 C determines average water content
"2 Hours at 600 C determines average PEG content
Porosity
Porosity data can be used to verify the dissolution data and provide important
information about granule structure. It can also provide valuable information regarding
the role of porosity in the trade-off between granule strength and dissolution.
53

1lercun, porosimetrjy The porosity of a sample of granules can be measured by a mercury porosimeter.
This works by forcing mercury (a non-wetting liquid of known surface tension and wetting angle) into the pores of a granule under increasing pressure and measuring the
corresponding volume of mercury needed to fill these pores 1167. The range of pressures allows for a pore volume versus pore size distribution to be obtained. Mercury porosimetrv is a very accurate way of determining the porosity of granules, and typically has a resolution of 0.1 µL.
Fill with Apply Evacuate
mercury pressure
4 ý l The relationship between the applied pressure and the smallest filled pores is defined by the Washburn equation:
2acosB
r
a= Surface tension WAS N/m) 0= Wetting angle (140°) p= Pressure r= Pore radius
Po=0 < Pi < P2
I; igurc 3.22: Schematic diagram and principle of operation of mercury porosimetry.
The pressure difference across the interface is a function of the surface tension of the liquid, the radius of curvature and the contact angle between the liquid and the
capillary walls. It is given by the Young and Laplace equations [5]:
AP=a + cosB (3.4)
54

where o is the surface tension of the liquid, r, and r2 are mutually perpendicular pore radii and 0 is the contact angle between the liquid and the capillary walls.
If the capillary is very thin and has a circular cross-section, the meniscus will be
approximately hemispherical. The two radii of curvature will be equal to each other and to the radius of the capillary. Equation (3.4) then reduces to the Washburn
equation (Figure 3.22).
A summary of the limitations of mercury porosimetry are listed below [167]:
1. The pores are not usually circular in shape, which is assumed by the Washburn equation and this affects the absolute accuracy of the results
2. The technique assumes a constant value for the surface tension of mercury 3. A constant value of contact angle is assumed. Contact angle can be affected by
surface roughness and may be different during intrusion and extrusion 4. The effect of compressibility of mercury, sample container, sample and residual
air at high pressure are not accounted for.
liquid displacement The average porosity (pore volume fraction qp) of a sample of granules can be
determined by dividing the apparent density of the sample, po , calculated by liquid displacement, by the true density, p, , obtained from L/S ratio data using the following
relationship [29]:
O=1-Pa P,
(3.5)
The true density of the granules is calculated using the measured binder mass fraction, 01, the solid mass fraction, Ob
, the binder density, pb and the solid particle density, p,, in the following relationship [29]:
P PbP3 (3.6) ý- Pbd3 + Pddb
The apparent density of the granules is calculated by using the liquid displacement
technique, a quick and easy method similar to that described by Iveson and co-workers [29]. The liquid used in this method was Evolve CH15', a formulation of refined non-
aromatic hydrocarbons (Chlor-Chemicals, UK), the properties of which are given in
Table 3.3 [49]. Previous workers have measured the granule apparent density by benzene displacement [65] or kerosene displacement [168]. The choice of liquid used for this purpose is not critical, so long as the following criteria are met:
55

" The surface tension is sufficiently low to accurately follow the contours of the individual granules (so as to give an accurate value of granule volume), without penetrating into the pores of the granule.
" The liquid density is lower than the granule density, otherwise the granules will float
on the surface of the liquid. " The viscosity of the liquid is low enough so that the granules sink through the liquid
and are fully submerged.
Table 3.3: Properties of Evolve CH15' solvent used for liquid displacement experiments [49].
Property Value Units
Surface tension 17.6 mN/m Viscosity 1.05 mPa. s Density 0.747 g/ml
A known mass of granules in the size range 1-1.4 mm were introduced into a small
capacity precision burette containing a known volume of the liquid. The volume of liquid displaced by the known mass of granules is used to calculate the apparent granule density (the density assuming there are no pores - equation (3.7)).
Pa = MR
(3.7) V2 - V,
where Mg is the mass of granules, and V is the volume change in the burette. There
are two important points to note with this method:
1. The accuracy with which the change in volume can be measured is directly
related to the accuracy and repeatability of the value obtained for the pore fraction. A change in volume was measured rather than the mass of liquid displaced by the granules since the solvent can evaporate, leading to greater errors in the mass-based approach.
2. It is assumed that no liquid penetrates into the granule pores. This was tested and confirmed by adding a blue dye to the liquid and then disecting the granules after the test to inspect for traces of the blue colourant. There is also no chemical interaction between the solvent and either of the granule constituents; Polyethylene Glycol and Calcium Carbonate.
This technique is not suitable for the measurement of a single granule, since the number of granules tested directly influences the volume change in the burette, and therefore the accuracy of the pore fraction value obtained. However, due to the relatively high numbers of granules involved in this procedure, a good approximation of the mean porosity value for the sample is obtained.
56

0.06
0.05
v 0.04
° 0.03 a c F) 0.02
w
0.01
0.00
Mass of granules used, g
Figure 3.23: The error in measuring the apparent granule density by liquid displacement and therefore the error in calculating granule porosity decreases with increasing numbers of
granules.
The precision burette used to determine the granule volume and therefore the
apparent density of the granules has a capacity of 5.4 ml. Using this burette, changes in
volume as small as 0.01 ml can be recorded. When 5g or more of granules are used the
technique is precise up to ±0.4°'o (Figure 3.23). A similar level of accuracy could be
obtained using a larger standard burette, but this would require over 40 g of granules,
which in certain cases is not feasible within the narrow size range of 1-1.4 mm.
Box 3.4: Granule Porosity
" 5-6 grams of granules
" Granule size 1.0-1.4 mm
" Approx. 3 ml suitable liquid
" Granule binder content must be known
Microscopy It was attempted to measure the volume of a sample of granules using a stereo
microscope (Zeiss V12) and image analysis software with a view to calculating the
apparent granule density. This method would assume that the granules are spherical, and uses the average of the maximum and minimum Feret diameter values. The main drawbacks with this method are the number (and therefore mass) of granules that can
57
02468 10

be analysed at any one time, even when using a moving stage. This, coupled with the inaccuracies associated with the assumption of spherical granules, meant that this method was too inaccurate to be given serious consideration. The apparent density of Calcium Carbonate/PEG granules by liquid displacement was typically found to be in
the range 2.0-2.3 g/ml, while microscopy resulted in values of around 1.2 g/ml.
Considering the shortcomings of the microscopy-based method, and the time- consuming nature of mercury porosimetry, the chosen method for measuring average granule porosity was liquid displacement. The Liquid displacement method provides more than adequate accuracy when over 5g of granules are used, and the procedure is fast and requires no special equipment.
3.6 Size
Sieve analysis Sieving is a relatively low-cost and reliable technique for the measurement of
particles larger than around 40 . im. Recording the mass of particles or agglomerates on each sieve in a series or stack results in a mass distribution according to the sieve mesh sizes. Modern sieves are most commonly available in sizes such that the ratio of
adjacent sieves is the fourth root of two. The drawbacks of sieving include its time consuming nature and the care required to
minimise errors due to spillage and weighing, however it does allow for more detailed
analysis of particles and agglomerates in individual size fractions. It is also difficult to
measure dry powders below 40 µm, particularly for cohesive powders. There is also the
possibility of particle and granule attrition and breakage during the sieving process,
which would introduce errors into the recorded size distribution.
Optical siding Granule size is one of the most important characterisation parameters since it
directly affects the performance of the granule. For example, a large granule will dissolve more slowly than a smaller granule but will usually require more force to fracture. For properties such as these which scale with size, it is important when
characterising a granular product to test granules within the same size range. Granule
size distribution is measured using a Retsch Camsizer which uses an optical sizing process (Figure 3.24). This works by taking images of a sample of granules which are falling in front of a light source and calculating the projected area of each granule to
give a size distribution. Particle sizes from 30 µm to 30 mm can be accurately measured by the Camsizer since there are two cameras inside the system, a basic one for the larger
particles and a zoom camera for the smaller granules. The problem with measuring smaller particles in the region of 30 µm is that they can tend to coalesce as they travel
58

along the chute and fall past the light screen and into the hopper. This can potentially result in inaccuracies when measuring very small particles. Since the granulation processes and materials used in this work typically result in fairly large granules with a
number based mean size of over 100 µm, the limitations of this technique at lower
particle sizes (of the order of the primary particle size) can be overlooked.
Zoom camera for Vibrating feeder smaller particles
a ý.
Backlit window 0. a"'"
Camera captures number and area of particle silhouettes against a backlit screen
Figure 3.24: The principle of optical sizing apparatus such as the Camsizer.
Box 3.5: Granule Size Distribution
" Sample mass: approx 20 9
" Granule size: Batch representative size distribution obtained by using a sample splitter
3.7 X-Ray Tomography
X-ray tomography is a technique which is relatively new to the application of particle
technology, and has an advantage over other methods in that it is a non-destructive
method of observing the internal structure of granules 13,169-171]. The method works by using a set of two-dimensional X-ray images of an object to reconstruct the three- dimensional structure using a mathematical algorithm [172,173]. The development of
new smaller X-ray sources has allowed for the production of tabletop systems,
advancing the technique into the microscopy category. The greyscale intensity of the
resultant images is related to the attenuation coefficient of each material within the
sample. Mathematical algorithms then reconstruct the attenuation factors within a two- dimensional plane to give an image showing the spatial distribution of each material. In
this work, Calcium Carbonate has the highest attenuation coefficient, and so shows up
59

darkest in the images, while air has a low attenuation coefficient, and shows up as white or very faint grey.
Image reconstruction gives 2D slices through specimen
Figure 3.25: schematic diagram of the X-Ray tomography technique.
Non-invasive 3D X-ray microscopy techniques allow us to see inside a granule, which in turn helps in understanding the internal structure, from which clues about how the granule was formed, the distribution of binder and pores and reasons for its
performance in other tests can be inferred. The tomography procedure was performed using a SkyScan microtomograph (Skyscan, Belgium) at Unilever research and development, Port Sunlight, and has been used here where possible to give additional information about the granules produced under different conditions. A schematic diagram of the procedure is given in Figure 3.25.
Limitations of the equipment used include a resolution restriction of approximately 4 µm, however, this is sufficient for detecting larger regions of unmixed binder and pores within granules over 1 mm in diameter. It should be noted that, due to the time
consuming nature of this technique, the x-ray tomography analysis carried out here
focuses on a limited number of granules from a batch and therefore it is possible that
results uncharacteristic of the batch as a whole could be obtained.
Box 3.6: Granule Structure - XRT
" Granule size: 1.0-1.4 mm - no special sampling within this size range
" Single granule tested
60

CHAPTER
4
THE STRENGTH/DISSOLUTION TRADE-OFF LINE
This chapter outlines initial experiments undertaken with the aim of investigating a
wide range of granulation parameters with respect to their effects on granule strength
and dissolution time. Secondary analyses such as composition (binder content,
porosity) and structure (optical microscopy, X-ray tomography) were also performed
where it was deemed appropriate to gain an insight into the reasoning behind the results
of the primary analysis (strength and dissolution). Values of water content have been
omitted from composition data for clarity where it is less than 0.5%. For the high
shear-only experiments, the majority of the experiments are based upon a standard set
of production parameters, in order to facilitate direct comparison of results. This
standard Roto Junior high shear ̀ recipe' is outlined below.
Powder Binder
Granulator temperature Main impeller speed Chopper speed Granulation time
4.1 Processing Time
2 kg powder (Calcium Carbonate: Durcal 40) 260 g (13% of powder mass) solid PEG 1500 flakes 60 °C 400 rpm 1400 rpm 10 minutes
The effect of high shear mixer processing time was investigated by producing five
identical batches of granulated powder in terms of processing conditions, quantities and
materials, varying only the length of time spent in the mixer. Granulation times of 2.5,
61

5,10,15 and 20 minutes were chosen for this experiment, using 1.5 kg of pre-heated Durcal 40 with 195 g (13%) of solid PEG 1500 flakes in each case (this series is an exception to the standard recipe since it uses a slightly lower granulator load of 1.5 kg
and also a lower main impeller speed of 300 rpm - both of these factors are investigated separately later in this chapter). New and separate batches were made each time rather than sampling from a single batch for two reasons; the first being that it was thought that a decreasing granulator load may affect the granulation process, and the second being that it is necessary to sieve a relatively large sample of granules in order to
achieve sufficient numbers in the desired size range for testing (1.0-1.4 mm, as is the
case for all experiments in this chapter). It was expected that the longer the time spent in the mixer the greater the extent of
granule consolidation and therefore the higher the granule strength (o, ) at the expense
of porosity (E), as classically predicted by Rumpf [6], equation (4.1).
1-c Q, oc
s
10 2
ö8
d6
c A
v4 v+ c "N
0
Dissolution time (tgp), sec
Strength: 20 single granules 1.0-1A mm
Dissolution: 1g granules 1.0-1.4 mm
(4.1)
Figure 4.1: Granulation time - average failure load versus dissolution time shows trade-off between the two.
Figure 4.1 shows that the critical load for granule fracture increases with granulation time. Values of average failure load increase from approximately 3N for two and a half
minutes granulation time to around 8N for a twenty minute granulation. In
accordance with the theory, this is thought to be due to increasing granule consolidation (and thus reduced porosity) of the granules with processing time. This
results in an increase in the dissolution time for the granules, thought to be a direct
62
0 20 40 60 80 100

result of decreasing porosity, forcing the dissolution process to follow a strict `shrinldng
core' mechanism. The magnitude of the changes involved are significant over the course of the maximum investigated 20 minute processing time. Granule strength grows from an average of 3N at 2.5 minutes to over 8N at 20 minutes. This is
counteracted by an increase of approximately 20 seconds for the dissolution time. Figure 4.1 represents the first example of a strength/dissolution time trade-offline.
The strength and dissolution data for the granulation time series of experiments suggests that there is relatively little difference between granules for processing times over 5 minutes. The greatest change in the results occurs during the early stages of the process. This is highlighted not only in the difference between the mean values, but
also the diminishing values of the standard deviation from the mean, right from 2.5
minutes all the way up to 20 minutes.
0.175
cc 0.170
0.165 a,
0.160 d
0.155
0.150 2
0.145
0.140
Mixing time, mins
Figure 4.2 Granule composition analysis for these granules shows that binder content decreases with increasing mixing time.
Figure 4.2 supports the earlier conclusion that the extent of granule consolidation increases with mixing time. Mean granule binder content is shown to decrease from 17% at 5 minutes to 14.5% at 20 minutes. Considering that the batch as a whole has a binder to solids ratio of 13%, these granules have a higher than average binder content, which means that others must have a lower than average binder content. Reynolds and co-workers [149] discovered that granule binder content is size dependent, with smaller granules having less binder than the batch average, while larger granules contain more binder than the batch average. The crossover between the two is reported to be
approximately 500 µm.
63
os 10 is 20 25

4.2 Agitation Intensity
This experiment was designed to investigate the effect of mixer speed on granule quality and performance. Four separate batches were made with the main impeller
speed being increased in 200 rpm increments from 200 rpm up to a maximum of 800
rpm (the maximum speed of the main impeller of the mixer). All other parameters, including a chopper speed of 1400 rpm and a granulation time of 10 minutes, were kept
constant for each batch. The theory states that consolidation rate scales with agitation intensity [34], although
a conflicting relationship has been reported depending on binder viscosity [174]. Even
so, with the relatively high viscosity of all liquid or molten PEGs, it was expected that
granules produced at the higher speeds would be much more consolidated within the time allowed for granulation compared to granules made at lower speeds and thus have higher compression strength but slower dissolution rate.
Tests on granules in the 1-1.4 mm size range showed that in general the prediction holds true. The results also seem to suggest that granules made at 400 rpm or above have roughly the same dissolution characteristics, suggesting that the porosity of these
granules is roughly equal. The results for 600 and 800 rpm occupy almost exactly the
same position on the plot, suggesting that the structures of these granules are very similar, and that the 10 minute granulation time is sufficient at these speeds to reach maximum consolidation (or minimum porosity). The fact that the result for 400 rpm is
slightly to the right of those for 600 and 800, suggesting a slightly faster dissolution time is thought to be due to the error in dissolution testing (see section 3.4).
10 Z
a
d
A
N d
A V
Q
Dissolution time (tgp), sec
Figure 4.3: Relationship between average failure load and dissolution time for granules
produced at different impeller speeds.
64
0 20 40 60 80 100

0.19
ö 0.18
0.17
c
v 0.16 c A
0.15 rn
Q 0.14
0.13
Binder fraction o Pore fraction
200 400 600 800
Impeller speed, rpm
0.09
0.08
0.07 0.06
0.05
0.04
0.03
0.02
0.01
C 0
U v
0 a a,
75 c
v m a,
Figure 4.4: Granule composition analysis for granules made at different impeller speeds shows that granules made at 400,600 and 800 rpm have similar composition, while granules made at 200 rpm have both high porosity and binder content
Secondary analysis of these granules to include binder content and porosity (Figure 4.4) reveals that both quantities decrease with increasing agitation intensity. The
conclusions inferred from the previous figure are supported here. The faster dissolution of the granules made at 200 rpm is supported by a high granule pore fraction (7.5%), while the similar dissolution results for higher impeller speeds are supported by similar and low porosity values. Increasing granule strength with impeller
speed is again supported by decreasing porosities, but also by decreasing binder
contents, as the extent of granule consolidation is increased at higher agitation intensity. It is also interesting to note that the decrease in porosity at high impeller speeds is less
marked than the decrease in binder content. X-ray tomography images (Figure 4.5) showing approximate centre cross-sections of
granules made at different impeller speeds support the theory that granules made at lower impeller speeds are less consolidated. The granules in the images above have identical processing times, which suggests that the rate of consolidation scales with impeller speed. This supports the observed increase in granule failure load and corresponding decrease in dissolution time, in addition to what has been reported in the literature by Ritala et al [34]. The XRT image for the granule made at 200 rpm is also interesting because it shows a large central area of unmixed PEG 1500 binder. This
shows the granule growth immersion mechanism in action, since nucleation for these granules begins as the relatively large (compared to the Calcium Carbonate powder particles) PEG flakes begin to melt in the hot mixer. The forces inflicted by the impeller of the mixer then push additional powder particles further into the PEG flake
65

as it continues to melt. Figure 4.5 helps to further support the theory that the rate at which this happens scales with impeller speed (or aintadon intensity).
200 rpm
600 rpm 800 rpm
Figure 4.5: X-ray tomography images taken through the centres of granules in the size range 1.0-1.4 mm made at different impeller speeds. Because the granulation time is 10 minutes for
each case these pictures show that consolidation rate increases with impeller speed.
4.3 Primary Particle Size
The Calcium Carbonate powder used in these experiments is available in four
different grades, termed Durcal 5, Durcal 15, Durcal 40 and Durcal 65 (Omva, France),
based upon the mass mean size of the particles. The median particle size, measured by
laser light scattering equipment [49], of each grade is summarised in Table 4.1, which
suggests that the median sizes of each grade are approximately 10 µm apart.
66
400 rpm

Table 4.1: Powder particle sizes of different grades of Calcium Carbonate (trade name Durcal) [49].
Durcal number Median size, µm Span
5 6 3.36 15 15 3.25 40 23 3.40 65 35 2.66
Four batches of granules were made in accordance with the standard recipe, varying the grade of Durcal used in each case, from Durcal 5 up to Durcal 65. The granules
were produced using 2 kg of powder, 260 g solid PEG 1500 flakes for 10 minutes and a 400 rpm main impeller speed.
8
z
0
w C) C4 m C) C c N
m2 01
0, a
0
Durcal 65
Durcal 40
Durcal 15
Durcal5
0 20 40 60 80 100
Dissolution time (tgo), sec
Figure 4.6: Effect of primary particle size (Durcal number) on failure load and dissolution
time.
The first thing that is evident from Figure 4.6 is that there is a dear and direct trade- off between failure load and dissolution rate as the primary particle size is increased. Granules made with Durcal 5 and PEG 1500 were found to dissolve (t in around 45
seconds, while having an average failure load of less than 2 N. As the Durcal number, and hence primary particle size, is increased, the granules become stronger but also take
much longer (tom up to 80 seconds) to dissolve. The difference in terms of strength and dissolution between Durcal 5 and Durcal 15 also appears to be much greater than the difference at higher Durcal numbers, certainly Durcal 40 and 65 show quite similar characteristics.
67

The composition results (Figure 4.7), aren't quite so clear-cut. Granules made with Durcal 15 have the highest binder content, which steadily decreases from over 16% to around 14% for granules made with Durcal 65, suggesting a steady increase in granule consolidation with increasing particle size. This supports the increase in strength and dissolution time (Figure 4.6). The anomaly to this set of results comes from granules made with Durcal 5, which contain a similarly low amount of binder as the Durcal 65
granules, at just over 14%. Such a low value (in comparison with the binder content of Durcal 15 granules) would normally indicate a high degree of consolidation, however
the high value of porosity for these granules suggests otherwise. In terms of porosity, the result for Durcal 15 is a similar misfit. Values of porosity generally decrease from high (6%, Durcal 5) to low (1.7%, Durcal 65). Durcal 15 bucks the trend with an equally low value to that of Durcal 65 at less than 2%.
0.170 0.07
c 0.165 0 Id
0.160 v
0.155
0.150 rn
0.145
0.140
0.135
Binder fraction o Pore fraction
I
i
iE
5 15 40 65
Durcal grade (particle size)
0.06 C
0.05
0.04 .
0.03
a, 0.02
a,
0.01
0.00
Figure 4.7: Composition analysis of granules made with increasing powder particle sizes reveal mixed results, particularly for small particle sizes.
68

Figure 4.8: Optical microscope (Zeiss V12) images of granules approximately 1 mm in
diameter and made with different grades of Durcal powder show visibly increasing particle
size at the granule periphery.
From optical microscopy images of the different granules (Figure 4.8), it is clear to
see the increasing particle sizes at the granule periphery. The powdery, irregular shaped Durcal 5 granules also support their low binder content and high porosity data.
Unfortunately, the other granules look very similar in external structure, which is where
the X-ray tomography technique comes into its own. Figure 4.9 shows a central internal cross-section from a single granule made from each of the different powder
grades.
69

Figure 4.9: Tomographical images of granules from primary particle size (Durcal number)
series of experiments showing cross sections of granules made with various Durcal grades.
Firstly, the decreasing consolidation from the Durcal 40 granules to the Durcal 65
granules is evident, the lighter areas in the centre of the granules showing unmixed binder (PEG 1500), which is less dense than Calcium Carbonate and therefore shows
up lighter in greyscale value. Conversely, the high porosity and low binder content of the Durcal 5 granules, and
the low porosity and high binder content of the Durcal 15 granules is not supported by
these images. There are two possible reasons for this, the first being that these images
represent only one single granule from an entire size class (1.0-1.4 mm) and therefore
there is a distinct possibility that they are not an accurate representative of the other
granules in this size class. The second reason may be due to the 4 µm resolution limit
of the XRT equipment (very close to the mean particle size of Durcal 5 powder), which
would lead to small areas of binder or air being `averaged out' with neighbouring Calcium Carbonate particles or indeed any combination of the three. One thing that is
noticeable is the lack of an area of high consolidation (dark grey) around the periphery
of the Durcal 5 granule. This supports the powdery nature of these granules noticed during handling (also evident in Figure 4.8) which would contribute to the high porosity
value and also support the low value of binder content.
70
Dural 5 DurL, ll 15
Durcal 40 Durcal 65

Iveson and Litster [4] reported that for the same number of drum revolutions (or
time spent in the mixer), granules made with smaller particle (glass ballotini) sizes had
higher porosity. This is in agreement with the results in this work (Figure 4.7), with the
exception of Durcal 15 granules. They argue that the consolidation rate is proportional
to particle size since capillary, viscous and friction forces all decrease per unit area with increasing particle size due to decreasing particle-particle contacts and increasing gap distances. This would support the theory that there are many, small pores within Durcal 5 granules that are too small to be resolved by current commercial X-ray
tomography methods, resulting in a more uniform medium-grey image (Figure 4.9).
However, Iveson and Litster [4] and others [39] also suggest that the reason for the increase in porosity for granules with smaller primary particle sizes is due to the greater
strength of the assembly, something which is not only not supported by this work, but
in fact the opposite trend is revealed: strength increases with increasing particle size (Figure 4.6). The difference between the sets of research may be due to the differences
in binder (solid vs liquid) or granule strength testing methods. Their work [4] was also
restricted to systems for which "granule growth was slow or zero", which limits the
applicability to industrial or production systems (particularly involving high shear or fluidised bed granulation), the possible exception being extrusion-spheronization. The
overall effect of primary particle size on the resultant granule properties then is quite dear for systems such as this where a solid polymeric binder is used. However, the
mechanisms responsible for these properties, and the role which granule composition
and structure plays in influencing these mechanisms and properties, are certainly non- trivial.
4.4 Mixer Load
Mixer load is not a widely studied granulation variable. An investigation into the
effect of mixer load (high shear granulation) was conducted after noticing that different loads used in previous experiments resulted in different mixing patterns inside the
granulator, including a change in the volume of granulate in contact with the chopper and temperature probe (which extends down from the lid of the granulator).
Schaefer and co-workers [77] had previously reported that decreased mixer loads
resulted in smaller mean granule sizes. This implies lower consolidation and growth, or a higher breakage rate, which could be a result of weaker agglomerates.
The investigation into mixer loading was done using Durcal 40 powder in 1,2 and 3 kg amounts with the same binder-to-solids ratio in each case (13% PEG 1500) with an impeller speed of 400 rpm and a granulation time of 10 minutes. The most notable difference between the experiments in practice is that the lower the granulator load, the less the material in the mixer comes into contact with the chopper and the temperature
probe. It was observed at higher loading that the temperature probe can act as an
71

additional mixing device by separating some of the material flow and directing it down
towards the main impeller blades.
Z
0 0 G) 3
w N
C C R O1 u!
CC N u1 01 a.
Q
Dissolution time (t90), sec
Figure 4.10: Effect of high shear mixer load on resultant granule failure load and dissolution
time. Error bars represent the standard deviation of 20 single granule failure load results.
The results of these experiments show that increasing the mixer load increases the
average granule failure load from just above 4N to approximately 6 N. The dissolution
time displays very little change, despite this apparent increase in strength. It is
suspected that the larger jump in strength between the loads 2 kg and 3 kg is due to increased mixing of the material as it is only with a3 kg load that the chopper becomes fully immersed within the material flow. The added influence of chopper and the role that the temperature probe plays in directing some material towards the main impeller
suggests that there would be an increase in the breakage rate with higher granulator loads and so to achieve a size of approximately 1 mm a granule must be relatively
strong. Figure 4.11 shows that average granule binder content decreases, albeit only slightly,
with increasing mixer load. This suggests a slight increase in granule consolidation, and therefore particle packing density with increasing mixer load. The lack of any significant change in granule porosity, explains the similar dissolution results for each of the 3 mixer loadings.
72
0 20 40 60 80 100

0.148
C 0
0.146
G) c 2z a 0.144 C
G1 CJ 01 2 0.142 a,
0.140
Binder fraction o Pore fraction
I 23
Mixer load, kg
0.10
0.08 ö t 10 a, 0.06 0 a a c
0.04 ö
rn ä,
0.02 .
0.00
Figure 4.11: Average granule binder content and pore fraction for granules made under different mixer loads shows a decrease in granule binder content but little change in porosity.
4.5 Binder Content
The amount of binder is a principal parameter in controlling granulation [175]. Granulation rate and the mean size of the granular product both generally increase with increasing binder content. In addition, it has been shown that the porosity decreases
with increasing binder content due to pores being filled with binder [29,176,177]. Typically, a reduction in porosity results in a higher resistance to breakage (demonstrated by the increase in mean granule size), and therefore an increase in
granule strength. This series of experiments was designed to investigate the effect of increasing the
amount of binder available during the granulation process on the resultant granule strength and dissolution. The same mass of powder was used in each case (2 kg Durcal 40), increasing only the amount of solid PEG 1500 flakes added for granulation. This
system is quite binder-sensitive and so the amount of binder was increased in relatively small 2% increments, from 10% to 16%. This resulted in the full range of granule growth regimes due to increasing pore saturation, as defined by Iveson and Litster [178] (Figure 4.13), from very powdery (10% binder) to rapid growth (16% binder) (Figure 4.12).
Visually, this meant that the batch made with only 10% binder remained white and powdery (Figure 4.12), the granulation process proceeding relatively slowly, resulting in
a smaller mean granule size (Table 4.2), while the batch made with 16% binder
granulated into large yellow granules extremely quickly and had begun to `snowball' by
73

the end of the ten minutes (Figure 4.12). More detailed information regarding the
granule size distribution is shown in Figure 4.14.
Figure 4.12: Representative samples from batches made with different binder contents reveal
the change in granule growth rate (time spent in the mixer is equal at 10 minutes for each
value of binder content, shown in percent).
Increasing Deformation
Number, De =p9U 212Yo
0
pry. "Crumb ® Y,, Slurry/
Free- - No 16 Over-We Flowing
... ........ .... ....... _.... .............: Mass Powder: Rapid
Steady Growth Growth
Nucleation'. Only Induction
100% Maximum Pore Saturation,
a... = NP. if{. rte, E. M
Figure 4.13: Granule growth regime map helps in understanding the reasons for the change in
granule growth rate and subsequent size distribution with increasing binder content (Source:
Iveson and Litster [175]).
74

0.010
0.008
0.006
0.004
0.002
0.000
v
" 10% " 12%
--ý 14%
-O- 16%
VA
Er t> a1Q0b
0-
100 <I> mm
1000
Figure 4.14: Granule number-based (n(1)) size distribution measured by Camsizer (Retsch,
German), ) shows increasing modal granule size (1) with amount of binder used for
granulation. Size distribution for 16° o binder is shown to be bimodal.
Table 4.2: Number-length (arithmetic) and mass mean average diameters for granules made
with different binder contents.
Binder Content, o/o Number mean, Y, ,, µm Mass mean, µm
10 162 629
12 177 611
14 266 1173
16 515 13 7?
Strength and dissolution results from this series of experiments (Figure 4.15) show
that increasing the binder ratio from 10 to 14 °, o inclusive gives rise to another trade-off line; higher granule failure loads but poorer dissolution times. It was important that this
experiment was carried out since there are conflicting reports in the literature, even
when restricted to viscous binders. Schaefer and co-workers, also using a PEG binder
based system [50], reported that increasing the binder content increased the
consolidation of the granules from a high shear mixer. However, Iveson et al. 129]
reported a decrease in the extent of consolidation for higher binder contents when
using glass ballotini in a drum granulator.
75

8 Z v A 0
w a, '4 rn v C c N
a2 ý1
R a,
0
Dissolution time (t90), sec
Figure 4.15: Effect of binder content on average single granule failure load and dissolution
time.
The result for 16% binder looks to be an anomalous result in an otherwise linear increase in granule strength as binder content is increased from 10% to 14%. It is
expected that there would be an optimum binder content with regard to granule strength, or that a maximum would be reached at some point, however research by
Holm et al [25] suggests that would most likely occur between 20 and 30% saturation. The increasing binder content results in different granule saturation levels, as first
proposed by Newitt and Conway Jones [27] (Figure 2.2), from pendular, through funicular and capillary to droplet and pseudo-droplet states. It is expected that granules
which are in the droplet saturation state would grow rapidly, since they have an
abundance of excess binder at their surface. Evidence of this can be seen in Figure
4.16. While this rapid growth mechanism due to increasing binder at the granule
periphery is widely accepted in the literature it is shown directly in these images.
76
0 20 40 60 80 100

Figure 4.16: Optical microscopy images of granules in the size class 1.0-1.4 mm made with different binder contents show increasing levels of binder (PEG 1500) at the granule periphery.
Regarding the anomaly of the result for 16% binder content, another possible explanation is that the granule failure mechanism is influenced by the increased binder
content. It was observed during testing that granules made with 10% and 16% binder displayed less-brittle behaviour during fracture than those formulated with 12 and 14% binder. This behaviour may have influenced the strength results. The standard deviation of the strength results along with the mean and median average sizes are summarised in 'fable 4.3. It can be seen that the observations seen during testing are supported by higher standard deviation of results than the granules produced with 12
and 14% binder.
Table 4.3: Mean and median sizes and standard deviation of failure load results for binder
content experiments.
Binder Content
Average (mean) single granule failure load, N
Median single granule failure load, N
Standard deviation
of failure loads, N
10% 4.11 4.23 1.16
12% 5.52 5.51 0.70
14% 6.14 6.08 0.74
16% 5.26 5.16 1.53
77

8
6
2 Ä4 0 J
2
0
10%
6
z
0 J
Z
12%
0.05 0.10 0.15
Displacement, mm
0.00
B
6
2 14 0 J
2
0
0.05 0.10 0.15 0.20 0.00
Displacement, mm
14%
6
z
J
2
ý%
0.00 0.05 0.10 0.15 0.20 0.00 0A5 0.10 0.15
Displacement, mm Displacement, mm
Figure 4.17: Granules made with 10% and especially 16% binder display a less-marked drop in the load-displacement curve during fracture than those made with 12 or 14% binder.
0.25 E E N
0.20 u 0 d
0.15
u t 3 0.10 .v c v E
0. V.
0.00 10 12 14 16
Binder content, % of powder mass
Figure 4.18: Mean granule failure displacement (and standard deviation) increases with increasing binder content.
0.20
78

The graphs in Figure 4.17 suggest that there is also a shift in the displacement at which granule failure occurs as well as the load. The average of the failure displacement
values is summarised in Figure 4.18. There is a small increase in the displacement at which failure occurs (and therefore strain, since all granules tested are roughly the same size) with increasing granule binder content. The result for granules made with 16% binder again shows a comparatively wide variation of values, especially in contrast to the result for 14%, which shows a very small standard deviation of values.
0.152
c 0.150 0 ü 0.148
0.146
0.144
rn 0.142
a 0.140
0.138
Binder fraction o Pore fraction
10 12 14 16
Batch binder content (% of powder mass)
0.08
0.07 0.06
0.05
0.04
0.03
0.02
0.01
0.00
C
_O to
w d O a a, C A oý v rn .a .. v
Figure 4.19: Average granule binder content and porosity both decrease with increasing
amount of binder available for granulation.
Composition data for these granules (Figure 4.19) shows a reduction in both granule binder content and porosity with increasing amount of binder added for granulation. This suggests an increase in granule consolidation with binder: solids ratio, a conclusion widely supported in the literature [29,30,39,50], and thought to be the result of increased lubrication between particle-particle contacts during the granulation process. However, the difference in granule fracture behaviour under compression (Figure 4.17) has not been previously reported. It can also be seen that there is a slight increase in
reported binder content from 14% to the 16% granules - which is thought to be a result of the increased level of binder present at the granule periphery (Figure 4.16),
rather than throughout the granule. Two sample cross-sections of granules from this
experiment are shown in the X-ray tomography images below. The two values of binder content referred to in this section are not to be confused -
the binder content discussed in Figure 4.19 is the average binder content of individual
granules in the size range 1.0-1.4 mm. The values 10,12,14 and 16% represent the
79

binder: solid ratio of the batch as a whole, as a percentage of the total powder mass used in each experiment (? kg).
Tomography results
10% 16%
Figure 4.20: Tomography results showing the cross section of two granules in the size range 1.0-1.4 mm made with 10°/ö binder and 16', 'o binder.
The figures above show granules in the size range 11.4 mm taken from the batches
made with 10°/b and 16°'h binder respectively. The granule made with 10`% binder looks
to have relatively smooth edges and a potato-shaped outline, whereas the granule with higher binder content is rougher around the edges and appears lumpy. This is probably due to the presence of PEG binder at the periphery, indicated by the lighter greyscale
areas. Theory suggests that granules made with higher binder content should be more
consolidated since the binder acts as a particle lubricant 1179]. However, this is not
obvious from the images above, which means that either the actual binder contents of these granules are similar (ie that one or both is perhaps unrepresentative of the batch
mean given by Figure 4.19), or that the high binder content and porosity values for the 10% granule are present in volumes smaller than can be resolved by the XRT
technique.
4.6 Fluidised Bed Air Temperature
The rate of PEG cooling can be controlled by changing the fluidising air
temperature in fluidised bed spray granulation. The binder solidification rate is
important since this affects the structure F3] and therefore the performance of the
granules. Since it is very difficult to fluidise the Durcal (Calcium Carbonate) powder due to its
small particle size and high cohesiveness, the powder was pre-granulated in the high
shear mixer before being introduced into the fluidised bed. The idea behind this
80

method is two-fold; to improve fluidisation as discussed above and also to attempt to bind several smaller, relatively strong high shear granules together in an open structure, typical of fluidised bed granulation.
The mixture of Durcal 40 and PEG 1500 was first pre-granulated in the high shear mixer for five minutes using a 12% binder: solids ratio. A large batch (3kg powder) was made so that this single batch of granules from the high shear mixer could then be split up (using a sample splitter) into four smaller representative batches of 600 g suitable for fluidised bed granulation. This ensured a fair comparison of the products after secondary fluidised bed granulation.
Having been split, these smaller batches of 600g were then in turn introduced into
the fluidised bed granulator and fluidised gently for around five minutes to allow the fluidising air temperature to adjust and stabilise. Immediately prior to spray granulation the air flowrate was increased until good mixing of the granules was achieved whilst not being so aggressive as to lose material entrained in the exit air stream. A suitable air flowrate for this purpose was found to be approximately 50 m3/h. The mass of (molten PEG 1500) binder added is monitored using an electronic balance during the
experiment, while the binder spray rate was held constant at approximately 7 g/min. The overall binder content of the resulting granular material after both high shear and fluidised bed granulation was 16%.
Z
to 0 v6
42 a, C rn m C c N2 01 10
Dissolution time (t90), sec
Figure 4.21: effect of fluidising air temperature on the average single granule failure load and dissolution rate of granules in the size range 1-1.4mm.
Granule strength and dissolution results (Figure 4.21) show that although the effect
of changing the fluidising air temperature is small, the trend suggests that granules made at cooler fluidising temperatures are generally stronger. The close proximity of the
81
0 20 40 60 80

results to one another prompted an investigation into the variation in the bulk density
of the granules with temperature since most of the granules in the tested size range (1.0-
1.4 mm) appeared to be fairly large high shear granules with smaller granules, powder
and solidified PEG droplets layered onto the surface. In essence, the granules in the
tested size range were behaving more like high shear granules than fluidised bed
granules, owing largely to the pre-granulation of the powder prior to fluidised bed
granulation.
1.4
1.2
1.0 rn
0.8
v
Y 0.6 Z
s 2 0.4
0.2
0.0
Granulation conditions (temp in Celsius)
Figure 4.22: Variation in granule bulk density With fluidising air temperature. Key: I IS - High
shear, FB xxC - Fluidised bed and air temperature in degrees Celsius. Error bars show SD of 3 repeats.
Figure 4 . 22 summarises the results of the variation in bulk density with fluidising air temperature and compares the fluidised bed granules with those straight from the high
shear mixer after pre-granulation. The figure shows very little difference in bulk density
as the temperature increases, which suggests that the structures of the granules produced at different temperatures are very similar, and this is certainly supported by
the fairly close proximity of the strength and dissolution results.
4.7 Binder Viscosity
Three batches of granules were made in the Roto junior high shear mixer using Durcal 40 powder and PEG of molecular weights 600,1500,6000 and 20000. PEG
600 is a viscous liquid at room temperature, whereas PEG 1500,6000 and 20000 are
waxy solids in the form of flakes. The solid PEG binders were melted prior to
granulation in order to keep the binder addition method and granulation conditions
82
HS Only FB 20C FB 26C FB 32C FB 38C

consistent over the whole experiment. The binder was added by pouring the liquid at an even rate onto the solid powder mass as the impeller of the granulator was rotating. The granules were made over a ten minute period, using 2 kg of powder with 260 g (13%) of liquid PEG binder in each case.
Table 4.4: Mean values of physical properties of Polyethylene Glycols used as binders in
pour-on granulation experiments. (viscosity is at 70 °C)
Name Av. Molecular Appearance (at
° 7. '"P
(°C) 17 (niPa. s) weight [180] 25 C)
PEG 600 570 - 630 Viscous liquid 20 6
PEG 1500 1350 - 1650 Waxy solid 46 65
PEG 6000 5600 - 6400 Solid 58 800
PEG 20000 15000 - 20000 Solid 63 24000
14
z - 12 0
10 a, 8 c
O1 6 rn
4 rn
2
0 PEG 600
0 20 40
PEG 6000
PEG 20000
PEG 1500
60 80 100
Dissolution time (tgp), sec
Figure 4.23: Effect of increasing the binder viscosity on mean failure load and dissolution
time of granules made in a laboratory scale high shear mixer.
Figure 4.23 shows dearly that increasing the binder viscosity has a much greater
effect on the granule strength than it does on the dissolution time. Nevertheless, there is still a trade-off between the two. PEG 600 is still liquid at room temperature and
pressure, and so the compression strength of these granules is understandably very low.
Increasing the binder viscosity to include PEG 1500 and 6000, which have a much higher average molecular weight and so are solids at room temperature results in
83

granules with much greater strength, having failure loads of approximately 6 and 8.5 N
respectively. The result obtained for PEG 20000 is perhaps misleading, since it was very difficult
to melt the PEG in this case without burning it, and even once molten was found to be
extremely viscous. The resultant granules produced using PEG 20000 were non- spherical and flake-like in shape, suggesting that the high binder viscosity has hindered
granule deformation and consolidation. This has resulted in a strength measurement which is perhaps lower than a spherical granule would give, and the dissolution time is
perhaps slightly faster, since the flat shape would give rise to a higher surface-area to volume ratio.
84

CHAPTER 5
PRODUCT ENGINEERING
This chapter details attempts to engineer a granular product away from the
strength/dissolution time trade-off line so frequently demonstrated in the previous chapter (through changing of standard granulation conditions and variables). The most obvious places to start when attempting to create a strong, fast dissolving granule are to improve the dissolution of high shear granules, or to improve the strength of fluidised bed granules. The majority of this chapter focuses on ideas and attempts to improve
the dissolution time of high shear granules. A range of granulation equipment was used in this work and will be specified where
it deviates from the Roto junior laboratory scale (10 L) high shear mixer used for
experiments in the previous chapter. Other granulation equipment used includes a Bosch food processor with a modified impeller and bowl shaped to closely emulate the design used in the larger Roto junior, and a laboratory bench-scale fluidised bed
granulator (see 3.2 Fluidised Bed Granulation). Since neither the food processor nor the fluidised bed has an integral heating jacket, where PEG 1000 or higher is used (added as a liquid) the rate of binder solidification can be relatively fast.
5.1 Combining Granulation Methods
Following on from previous high shear and fluidised bed granulation experiments, this experiment was devised to investigate how the amount of time spent in each granulator (fluidised bed and high shear mixer) would affect granule properties, with the aim of incorporating the best properties of both types of granule, ie joining smaller, strong high shear granules together in a fluidised bed leaving sufficient macropores to
85

aid dissolution. Fluidised bed granules are typically porous and weak, whereas high
shear granules are typically non-porous and strong. High shear only and fluidised bed
only granules are included in the results for comparison. A total granulation time of 20 minutes was used for each case, in addition to a
constant overall binder content of 13%. The binder content was used in the same ratio as the time spent in each granulator, so that a batch made for 5 minutes in the high
shear mixer and 15 minutes in the fluidised bed would have a quarter of the binder
added in the high shear mixer and the remaining three quarters added in the fluidised bed. The three batches made using both high shear and fluidised bed granulators were:
"5 minutes high shear/15 minutes fluidised bed granulation (HS 5/FB 15) " 10 minutes high shear/10 minutes fluidised bed granulation (HS 10/FB 10)
" 15 minutes high shear/5 minutes fluidised bed granulation (HS 15/FB 5)
The results of these experiments are summarised in Figure 5.1. It can be clearly seen that increasing the fraction of time spent in the high shear mixer increases the failure
load of the resultant granules quite considerably (albeit at the expense of dissolution
time). However, compression strength testing of single fluidised bed granules can be
complicated, since the characteristic fracture point seen on the load-strain curve for a high shear granule is not present (Figure 5.2). Further, the inherent large variation in
the structures of fluidised bed granules results in a wider variation in individual granule
strength. Figure 5.1 also shows that increasing the amount of time spent in a high shear
mixer increases overall granule consolidation, which leads to increased granule dissolution times.
10 13 FB 15
Z " HS 5/FB 15 ö 8 " HS 10/FB 10 ý' HS 15/FB 5
HS 20 6-
rn a 4- rn
" N
m 2 G1 i Q
0 0 20 40 60 80
Dissolution time (t90), sec
100
Figure 5.1: effect of time split between high shear and fluidised bed granulators on average single granule failure load and dissolution time.
86

4
Z
0 J2
0
Displacement, mm
Figure 5.2: single granule compression profile showing absence of a definite fracture point often seen when testing semi-brittle high shear granules.
Figure 5.2 highlights the problem with measuring the strength of fluidised bed
granules using the single granule compression test. The absence of a definite fracture
of the granule means that the failure load must be approximated by observing changes in the load-displacement relationship. The region highlighted in the figure above marks the point where the granule has failed and can no longer provide much resistance to the force compressing it. It should also be noted that the failure of the granule happens
after a considerable amount of deformation has taken place (compared with a PEG- bound high shear granule). This happens because of the nature of fluidised bed
granules and the way in which this experimental procedure results in the open structure of fluidised bed granules being appended to the more spherical and consolidated structure of high shear granules. Under compression testing, it is the open fluidised bed granule structure which fails first, and eventually it is the compact and consolidated high shear granule structure(s) within the granule that provide any significant resistance to compression.
87
0.0 0.1 0.2 0.3 0.4

0.30
c 0 0.25
a, c
v 0.20
c .o
a 'O 0.15 ä,
0.10
Binder fraction
": o Pore fraction
0^0,0$10,, ý
0\111,01,
Vessel time ratio, mins
0.14
0.12
0.10
0.08 ä
0.06 q
a, 0.04 .ö
0.02
0.00
Figure 5.3: Binder content and porosity values for granules made in a fluidised bed, high
shear mixer or both. Decreasing binder content and porosity implies increasing granule consolidation.
Binder content and porosity analyses were carried out on these granules, with varying levels of success. Granule binder content analysis by thermo-gravimetric
methods shows a quite significant decrease in granule binder content with time spent in
a high shear granulator. This implies a straightforward increase in granule consolidation, however the mechanism of fluidised bed granulation should also be
considered here. During fluidised bed granulation not every droplet of PEG binder
that lands on a particle or granule will go on to form a bond with neighbouring particles
or granules. Some droplets will not have collided successfully in the time taken for the droplet to cool and solidify (since the fluidising air temperature is below the melting
point of the PEG binder) and so will remain on the surface of a granule or particle
unbonded. These solidified droplets will however contribute to the overall granule size, thus helping to increase its binder content. Higher breakage rates and collision energies in a high shear mixer mean that there is very little `free' binder and that almost all of it
goes into forming bridges between particles, resulting in higher consolidation, lower
porosities, lower binder contents and higher strength. The porosity results given in Figure 5.3 are less accurate, but this is no fault of the
method used to measure it. Measuring the porosity of fluidised bed granules is
notoriously tricky, and a direct result of their open, non-uniform structure. Since their
structure has no recognised `shell', it is difficult for the eye, let alone a liquid medium to be able to detect where the border between a granule's external and internal pore space lies. In general it can be seen that the porosity of the granules decreases quite
88

significantly with increasing time spent in the high shear mixer, which is expected for the reasons of increased consolidation and decreased binder content outlined above.
5.2 Operational Protocols
This section refers to a series of non-conventional high shear granulation experiments devised in an attempt, while still using conventional materials (the
previously used Calcium Carbonate ̀Durcal' powder and Polyethylene Glycol binder) to break away from the strength/dissolution trade-off line. Due to the non-uniformity of these experiments, the details regarding each specific production method are summarised in Table 5.1 below.
Table 5.1: Summary of granule production details. All granules produced using a high shear mixer, Durcal 40 and PEG 1500 unless otherwise stated.
Label Production method D65 PEG6000 Sieved Durcal 65 using a 53 µm sieve to remove fines and sieved 800 rpm PEG 6000 using a 1.0 mm sieve to remove large flakes were
mixed in a heated (70°C) high shear mixer at 800 rpm for 10 minutes.
The idea of this experiment was to create high porosity (through low binder content - only 10% binder and poor particle packing facilitated by the removal of fines from Durcal 65) with high
strength (by using PEG 6000 and good binder distribution brought about by high mixing speed).
Growth regime The granulation was initiated with some of the powder and all of control the binder, the remaining powder being added 4 minutes into the
10 minute granulation process. The powder amounts were divided to give a 20% binder-to-solids ratio in the initial stage (rapid growth regime) which would then be reduced to 13% on the addition of the remaining powder (steady growth regime).
Step addition of Powder and binder added into the granulator in three equal materials batches (1 kg Durcal 40 and 130 g PEG 1500 flakes) in five
minute intervals, giving a total granulation time of 15 minutes and a total mixer load of 3.39 kg. A granulator temperature of 60 °C
was used throughout the granulation, with impeller and chopper speeds of 400 and 1400 rpm respectively. The idea here was to create a layered granule structure with a view to being able to control each layer.
89

Label Production method
Low temperature The granulation process was started at room temperature while
the heated jacket was gradually warming up toi a preset 50°C.
PEG 1500 has a melting range of 44-48 °(: (Appendix B) and
granulation was first detected at 44 °C (by the ability to see the base of the mixer bowl). From this point the granulation was run for a further 10 minutes at 400 rpm. Durcal 40 and PEG 1500
were used in the binder to solids ratio 0.13.
The aim of this experiment was to control granule consolidation rate through melting rate of the PEG binder.
800 rpm 2.5mins Granulation at high impeller speeds is faster, due to higher
collision and breakage rates. This experiment was designed to investigate early granules (removed after 2.5 minutes) from a high
speed experiment (800 rpm). Durcal 40 and PEG 1500 were used with a binder to solids ratio of 0.13.
10 Z
0 a,
w v
rv ö) a
c
v rn v
Dissolution time (t90), sec
" D65 PEG6000 800rpm
" Growth regime control Step addition of materials
o Low temperature " 800rpm 2.5mins
Figure 5.4: Strength and dissolution results of granules made under different operational
protocols in a high shear mixer. All granules are made from Calcium Carbonate/PEG and
analysed in the size range 1.0-1.4 mm.
The first thing to note in Figure 5.4 is that once again a trade-off line is evident. It
seems, even with these non-conventional methods and operational procedures that they
simply move along the trade-off line corresponding to their extent of consolidation.
90
0 20 40 60 80 100 120

The `growth regime control' method results show a mean failure load and dissolution time fairly typical of normal high shear granules (ie according to the method outlined at the start of chapter 4), suggesting there is no significant difference in the structure of the granules produced in this way. The batch also contained a number of very large granules around 10 mm in diameter which were produced during the initial
stage of the experiment when the binder to powder ratio was 20%. This could be
avoided in future by adding the second batch of powder earlier, or by increasing the processing time or mixer speed since this would increase the chance of breakage.
The results for the `step addition of materials' indicate that this method has resulted in strong, slowly dissolving granules. This implies that the structure of these granules is
consolidated with little porosity. It is not possible to say with any certainty what mechanism is responsible here, but only that it is probably either layering, created by
the staged addition of the constituents, or the normal immersion mechanism, as happens when all powder and binder is added together and as the PEG melts to create nucleation sites. It was noticed during strength testing that the force-displacement
relationships of the granules were very similar, resulting in a low standard deviation from the mean (Figure 5.4).
Similarly, granules made at the lower temperature of 50°C and with a slow heating
rate from the point of binder melting (Low temperature' in Figure 5.4) show that while granule consolidation was indeed controlled and effectively slowed down, it does not facilitate deviation from the trade-off line. It could be perhaps described as a good compromise between strength and dissolution time for a high shear granule, but it is a compromise nevertheless.
That leaves the two high mixer speed experiments; `800 rpm 2.5 mins' and `D65 PEG6000 800 rpm'. Firstly, both methods are common in that they result in a wide spread of failure load results. This suggests a similarly wide range in granule structures, something which would not have been concluded had granule (number-based) size distribution been the primary focus, since it was observed that granules produced at high impeller speeds contained much less fines than batches produced at lower speeds. This increase in structure variation could be brought about by increased breakage rates,
collision rates or both, but it is not possible to determine which mechanism is
responsible without a more specific investigation. To summarise these experiments, the
result for `800 rpm 2.5 mins' shows fairly low consolidation, giving similarly low
strength and average dissolution times. In contrast, the experiment originally intended
to produce strong, porous granules (D65 PEG6000 800 rpm) in fact does nothing of the sort; the granules displaying immense strength but, in conform to the trade-off line,
very long dissolution times. Table 5.2 summarises the performance and composition analyses for this batch, in which the average granule porosity is shown to be very low
(below 2%). This lack of porosity is what the experiment was originally designed to
prevent, however it seems that the intense collision energies and breakage rates brought
91

about by such a high mixer speed seem to have overcome any design intentions and
resulted in very efficiently packed agglomerates. So, while the intention of having a lower amount of well-distributed binder was achieved, it was at the expense of granule
porosity, resulting in yet another (very high! ) position on the trade-off line.
Table 5.2: Summary of granule performance and composition data for granules made at high
impeller speeds with sieved Durcal 65 and PEG 6000. Size range analysed: 1.0-1.4 mm.
D65 PEG6000 800rpm granule data
Value (Standard deviation)
Mean granule failure load, N (20 single granules) 7.18 (1.90)
Dissolution time, sec (1 gram) 98.6 (2.2)
Average pore fraction, ml/ml 0.018 ±0.006
Average binder content, g/g 0.115 ±0.001
5.3 Binder Form
These experiments were designed to evaluate the effect on granule performance of different forms of binder; namely gels, pastes and foams. The performance of the
granules in the strength and dissolution tests (on the mesoscopic scale) is an indicator
of changes in granule structure and what is happening at the single particle level
(microscopic scale). Granules for these experiments were all made with Durcal 40 and PEG 1500, although the level of binder used in each experiment may vary, since these
experiments were designed to be early experimental `proof of concepts'. Details of
production methods for each of the batches are given in the table below.
Table 5.3: Production details for granules made with binder in different forms.
Label Production method
Gel A volatile alcohol-based gel was used as part of a binder
solution in an attempt to engineer increased high shear granule
porosity. The alcohol gel was added first and pre-granulated
with the aim of producing porous nuclei, with the PEG binder
being added shortly afterwards. Granulation conditions were the same as for the other experiments here: 10 minutes, 400
rpm and Durcal 40 powder. The overall binder to solids ratio
was kept at 13 %.
92

Label Production method
Foam The binder used for this experiment was a 25 art",, aqueous PEG 1500 solution with a small amount (approx 10", o) of
surfactant added as a foaming agent. The foam binder was
observed to integrate with the powder almost instantaneously,
and enhanced the sticking of the granulate to the mixer walls.
Paste ;1 binder paste was made by hand using Durcal 40 and a 25wt° o aqueous PEG 1500 solution. This wet mass was then
added to the high shear mixer containing Durcal 40 powder
and granulated for ten minutes. The strength of these granules (after drying in an oven) was so
weak that granules could not withstand handling with tweezers. Complete disintegration resulted to produce powder again.
8
Z
0 v
J 4
rn a, rn
Qi 2 ß
a
0
Dissolution time (tgp), sec
" Gel
" Foam ® Paste
Figure 5.5: Granule performance results for batches made with different forms of binder
including gel, foam and paste.
Figure 5.5 shows the results of this experiment in terms of mean granule strength
and dissolution time. In this instance, there is no clear trade-off line for the results,
except for perhaps the granules made with a foam binder which lie close to the trade-
off line given in Figure 5.4. In all cases, granules made with these binder forms appear to be very weak, all having mean failure loads below 2 N. Granules made using the
paste binder were found to be extremely weak and, along with the poorly performing
93
0 20 40 60 80 100

gel-based granules, suggest poor and inefficient internal structures. It is difficult to take any positives from this particular set of results, but the reason(s) for the poor performance of these granules is thought to be a result of the attempt to incorporate
the (liquid) PEG binder with a different medium, be it foam, alcohol gel or as a paste. The original idea behind this set of experiments was to change the binder distribution
method within a granule structure, which seems to have been achieved, but
unfortunately for the worse in terms of the key performance indicators; failure load and dissolution time.
5.4 Sodium Hydrogen Carbonate
This is the first of a set of experiments which looks at incorporating `active
ingredients'. In this case, sodium hydrogen carbonate (Sodium Bicarbonate, NaHCO3)
was chosen, for its ability to undergo a neutralisation reaction to form carbon dioxide
gas in the presence of an acid (equation (5.1)).
NaHC03 + Acid -> Na-Salt + H2O + CO2) (5.1)
In the experiments here, baking powder was used as a source of sodium hydrogen Carbonate, since it also contains a dry acid in the form of salt crystals (most commonly potassium hydrogen tartrate, KC4HSO6), which when dissolved in water allows the
acid and the alkali (sodium hydrogen Carbonate) to react and produce carbon dioxide
gas. The intended effect of this is two-fold; the first being to help physically break up the bonds between particles as the granules undergo dissolution, and also in some circumstances (where water is used as a binder) encourage extra inter-granular porosity during granulation while the binder medium is in the liquid phase.
These high shear granulation experiments were performed in the smaller modified Bosch food processor since the amount of active ingredient (baking powder) was limited. The main difference with this method is the absence of any heating jacket,
which in the larger Roto junior mixer is used to melt the PEG binder. However, since sodium hydrogen carbonate begins to decompose at 60°C, granulation using this (melt- in) would not have been appropriate. Therefore, due to the inability to heat the
granulator, the pour-on technique was used for all binders. It is not expected that the pour-on and melt-in methods would result in any major difference in granule structure after a ten minute granulation period (Figure 5.6).
94

10 Z
ö8
a,
rD v6 C
v4 C c
2 Pour on (liquid)
vo Melt in (solid flakes)
0 0 20 40 60 80 100
Dissolution time (t90), sec
Figure 5.6: Comparison of granules made with Pour-on and Melt-in methods. Both granules
show similar results and will both be made by the immersion granulation mechanism (Figure
3.2).
Each batch of granules was produced over a ten minute period in a Bosch food
processor using 400 g of Durcal 40,60 ml of binder (1 5°ýo) and 20 g of baking powder in each case. The second batch (labelled Bicarbonate paste) was unique in that the baking powder was premixed with the molten PEG 1500 (at less than 60°C) in a beaker beforehand to make a paste, since it was thought that the smaller, lighter baking powder
particles could potentially escape into the air during the early stages of granulation, and
also as a way of attempting to ensure that the baking powder was present throughout
the granule structure. The third batch was made using water as a binder to compare the
attributes of water and PEG bound granules. Granulation using water as a binder
would mean that the baking powder becomes active, producing carbon dioxide during
the granulation process. These water-bound granules were also dried in an oven (at
60°C for one hour) after granulation to remove the majority of the water to provide
extra granule strength and porosity.
Table 5.4: Key to granule batch references in below.
Reference Constituents Notes
PEG 1500 Durcal 40, PEG 1500, baking
powder
95

Rcfcrcncc (; fl huch is
PF, (; llurcal 40, PI ý'(; 1500, haking
1500/Bicarbonate powder
paste
Water llurcal 4U, Water, baking
powder
Control I)urcal 40, Water OR PFG
1500
10 10 PEG1500 Zv PEG1500/bicarbonate paste
08 Water
a, I" Control: water o Control: PEG1500
6
C rn a, 4
7& C
vT
21
>II 0
Notes
Baking powder 1)1c-niixccl
with III(; prior to
granulaticm
Control Samples N'. 'itll()Llt baking; powder for
comparison
0 20 40 60 80 100
Dissolution time (t90), sec
Figure 5.7: Mean granule failure load and dissolution time for granules made in a Bosch food
processor with baking powder as an additional active constituent.
The strength and dissolution results of granules containing sodium hydrogen
Carbonate as a gas-producing agent are shown in Figure 5.7. The dissolution of the
water-bound granules is very fast, which is expected, especially since most of the water has been removed from these granules meaning that their porosity is likely to be very high. However, their relatively high strength is unexpected, and may be due to some
recrvstallisation of any unrcacted acid or alkali contained in the baking powder or the
sodium salt produced by the neutralisation reaction, which could provide additional
solid bridges between primary particles. Whatever the reason for their performance,
they are a mild success nevertheless since they perform similarly to fluidised bed
granules in terms of dissolution (Figure 5.1) but display a marked improvement in
96

strength; up from 0.1 to almost 2.0 N. However, one noticeable drawback with these granules is their powdery nature, meaning that in a production situation attrition and wear could become a real problem. It could also be argued that for granules having (had) a water binder there is a separate trade-off line, shifted to the left (in terms of dissolution time) of those having a PEG based binder.
The batch of granules made with water as a binder show comparable strength with those made using PEG 1500, with the average mean granule failure load of the water bound granules down by approximately 0.5 N. The dissolution, however, shows quite a
remarkable difference over the PEG-bound granules, the water-bound granules taking
under 40 seconds to reach 90% dissolution. Observations made during testing of these
granules include a much higher sphericity than those made with PEG binders and also
a much more brittle behaviour under compression strength testing. The
load/displacement relationship of these granules under compression testing compared
with those using PEG 1500 as the binder shows failure at a much lower displacement
(Figure 5.8). When handled, the water-bound granules are strong enough to roll gently between the fingers, but disintegrate completely once cracked.
4
Z
1 0 J
0
Displacement, mm
Figure 5.8: Comparison of load-displacement curves for granules made in a small scale high
shear mixer shows that those having (had) water as a binder fail at much lower displacements,
while failure load remains comparable. Granules approx 1.0 mm in size.
The results for the PEG 1500 bound granules are less promising. They occupy a
region on the strength/dissolution plot which is dose to a position on the trade-off line, as with other granules made with PEG thus far. This means that there is some
compromise in the structure of the granule which allows for moderate strength and dissolution times, namely increased porosity over conventional PEG 1500 based
97
0.00 0.02 0.04 0.06 0.08 0.10 0.12 0.14 0.16

granules. The results of the mean single granule failure load tests and the dissolution
experiments show that there is little difference in the performance of the granules made using different methods of baking powder addition. Although this is disappointing in
terms of results, it shows that two batches of granules made using essentially the same binder and powder to occupy similar space on a plot of mean granule failure load and dissolution time, indicating that experimental repeatability is good (these two experiments were performed on the same day and so variations in moisture content, humidity etc are assumed to be negligible).
Comparisons of these granules with those made in the larger high shear granulator
shows that those made in the food processor are weaker and dissolve slightly faster.
The reduced strength of the food processor granules is most likely to be due to the
rapid cooling of the PEG binder on contact with the cooler powder (since there is no heated jacket, although the powder was warmed to 40°C prior to granulation to
maintain similarity as much as possible), resulting in granules with visually lower
sphericity. This also would explain the faster dissolution times, since less spherical
granules would have a larger surface-area to volume ratio.
5.5 Pharmaceutical Disintegrants: A Review
Disintegrants have been used in the pharmaceutical industry successfully for many years, particularly in the field of tabletting, to improve dissolution performance and characteristics. The disintegrants most commonly used are discussed below, and work by swelling on contact with water, which helps to mechanically break up the tablet into
many smaller pieces. Adebayo et al. [84] even recently reported that the inclusion of breadfruit starch inbetween granules (exo-disintegrant) in a tablet formulation increased both strength and dissolution performance. But while they compared the performance of tablets containing exo-disintegrant with those containing intergranular (endo, or internal) disintegrant, they, like so many others researching tablets, neglected to
measure the performance of the granules themselves. The hygroscopicity of disintegrants (ability to absorb water from the atmosphere) is
relatively unimportant in tabletting due to the relatively large size of tablets and their
consolidated nature which helps to resist moisture penetration, and also the fact that
most pharmaceutical products come in sealed packaging.
Croscarmellose sodium Croscarmellose sodium is a cross-linked polymer of carboxymethylcellulose sodium.
Cross-linking makes it insoluble, hydrophilic and highly absorbent which results in
swelling when it comes into contact with water. It exists in its dry powder form as deformed fibre-shaped particles which swell primarily radially and tend to straighten
out. Its effectiveness as a disintegrant has been studied in detail by the pharmaceutical industry. Ferrero et al [119] evaluated the use of croscarmellose sodium in tabletting in
98

a direct compression formulation. They concluded that the optimum concentration of croscarmellose sodium in a direct compression formulation was between 5 and 8%
w/w, since this resulted in the best compromise between dissolution time and tablet strength. At higher concentrations of super-disintegrant, they reported that the decrease in dissolution time is not only less significant but may even begin to increase.
Sodium starch Glycolate Sodium starch Glycolate is the sodium salt of a carboxymethyl ether of starch. The
molecular weight is typically between 500 000 and 11 000 000 Da. It exists as a fine free flowing odourless white powder, with particle size ranging from 10 to 100 pm in diameter and is practically insoluble in water and most organic solvents. Sodium starch Glycolate relies solely on its swelling as a disintegration mechanism [181]; Table 5.5
shows that the swelling behaviour of sodium starch Glycolate when immersed in water is much greater than that of some other commonly used disintegrants.
Table 5.5: Swelling of disintegrant particles in water at 20°C [181].
Disintegrant Volume increase, cm3/cm3
Sodium starch Glycolate 30
Croscarmellose sodium 11
Crospovidone 1.2
Microcrystalline cellulose 0.4
Despite a substantial increase in volume during swelling over croscarmellose sodium, both disintegrants have been shown to produce similar results in terms of dissolution and disintegration performance [86] (Figure 5.9). The lower performance of tablets having crospovidone as the disintegrant is attributed to its much lower
swelling power compared with croscarmellose sodium and sodium starch Glycolate (Table 5.5).
99

Parosntap. drug rs *u. d
100f
3
0
4
2
Tree (min)
Figure 5.9: release of nifedipine tablets containing 10 mg (6" o) mfedipine and 93° o disintegrant. Key: (-X-) sodium starch Glvcolate, (.. X... ) croscarmellose sodium, (- -X- - ) crospovidone 186].
Parostape drug r. Iew. d
too -
so
x 4a 7k iR '
>M
05 10 15 20 25 30
Tlmr (mlK)
Figure x. 10: release of nifedipine from tablets containing 10 mg (6° o) nifedipine. Key: (-
) 4% sodium starch Glycolate, (... *... ) 4% croscarmellose sodium, (- -*- -) no disintegrant
[86].
Figure 5.10 shows that the performance of tablets containing 4°-o croscarmellose
sodium and sodium starch Glycolate is similar during the first 10 minutes of
100

dissolution, after which the performance of the tablet containing croscarmellose
sodium deteriorates until its performance matches that of a tablet containing no disintegrant.
Cro. rpovidom- Crospovidone is a synthetic homopolvmer of cross-linked N-vinyl-2-pvrrolidonc,
and is completely insoluble in water, acids, alkalis, and all organic solvents. Crospovidone is hygroscopic and disperses and swells rapidly in water, although the
extent of swelling is low in comparison to croscarmellose sodium and sodium starch Glvcolate (Table 5.5). The primary mechanism of disintegration for crospovidone is
the recovery of shape on wetting 11821. As the particles try to regain their original shape they exert pressure on the surrounding particles which helps to overcome the binding forces holding them together in a granule or tablet matrix. The complex, porous structure of a typical crospovidonc particle is shown in Figure 5.11.
Figure 5.11: scanning electron micr<ýscop% image of a crcýspovicione particle I 18? 1.
Figure 5.12 shows once more that crospovidone is less effective than croscarmellose sodium or sodium starch Glycolate when used at the same concentration to aid the dissolution of aspirin tablets. However, the difference is less marked than the previous
case for the release of nifedipine (Figure 5.9). Figure 5.12 also indicates a higher
performance from croscarmellose sodium over sodium starch Gh'colate [183], which is
not supported by the data in either Table 5.5 or Figure 5.10. This means that the
composition and manufacturing method of tablets are capable of strongly influencing
the performance of disintegrants used within them, and subsequently the choice of disintegrant used should be made very carefully in order to optimise the tablet or granule disintegration performance.
101

100
80 JtQ
60 e
40
20
ý- DMP 504 "-U Crospovidane --"'o'-- Explotab '-'S Ac-Di-3o(
20 40 60 Timt (min)
Figure 5.12: Dissolution profiles for Aspirin tablets containing 1.0% disintegrant. Disintegrants include croscarmellose sodium (Ac-Di-Sol®), sodium starch Glycolate (Explotab®), crospovidone (Polyplasdone XL®) and DMP 504 (a cross-linked polyalkylammonium polymer) [183].
Low-substituted hydmxypropyl cellulose (L-HPC) L-HPC is a low-substituted hydroxypropyl ether of cellulose which swells on contact
with water but is insoluble in both water and alcohols [88]. L-HPC is used as an
excipient in granulation and tabletting because of its good binding and disintegrating
properties [184]. The application of the various forms of L-HPC depends, at least to
some extent, on their physical and chemical characteristics, and particularly on the degree of substitution, which greatly affects the strength of the interaction with water [104,185].
The swelling rate and performance of L-HPC is dependent on the degree of hydroxypropyloxy substitution and the particle size of the polymer (Figure 5.13) [88, 186,187]. When tablets containing L-HPC are immersed in water, water molecules insert themselves into the hydrogen-bonded links between the polymer chains and the drug molecules. This uptake of water causes the polymer to swell and exert a pressure on surrounding particles, helping to break up the tablet [104].
It is thought by some researchers that the heat of hydration plays an important role in the dissolution efficiency [88]. When L-HPC varieties with different particle size are
considered (LH2O, LH21 and LH22) (Figure 5.13) it can be seen that the variant with the lowest heat of hydration (LH22) (Table 5.6) is also the most efficient in terms of theophylline dissolution rate.
102

100 e-o--42
' > :::
o LH-11 40 1" -+F- LH-20
ä --+-- LH-21 20 LH-22
-"o"""" LH-31 0
0 10 20 30 40 50 60
Time (min)
Figure 5.13: Dissolution profiles of theophylline, L-HPC tablets for different grades of L- HPC [88]. The first number in LH-xx represents the average particle size, where 1 is large
and 3 is small, and the second number represents the level of substitution, where 0 is high
and 2 is low.
Table 5.6: Physical and structural properties of different grades of L-HPC [88].
Property LH-11 LH-20 LH-21 LH-22 LH-31
Moisture content, % 2.05 2.83 2.22 3.82 3.56
Hydroxypropyloxy content, % 10.84 13.15 10.61 7.50 11.05
Enthalpy of hydration, J/g -70.92 -69.97 -69.95 -62.86 -71.35 Mean surface diameter, µm 12.54 12.31 11.81 11.51 8.35
Di integrant concentration The amount of disintegrant used in a formulation often depends on the method of
manufacture and the performance characteristics of the disintegrant in question, since
some disintegrants can actually slow down the dissolution process if added to excess [119,188]. Bolhuis et al [86] used tablets made of super-disintegrants including
croscarmellose sodium and sodium starch Glycolate in order to promote the release of poorly soluble drugs by depositing them onto the surface of the disintegrant (Figure 5.9) and compared the results to tablets containing a more conventional amount of disintegrant (Figure 5.10).
103

P*rwnaipe dnq nioaffl
--*. r
ýýf
00- )K"
.r
40- ," ,x
rr
2° r` X
os 10 Is 20 ss 30 Time {min»
Figure 5.14: Release of methylprednisolone from tablets containing 40 mg drug as granulate with different concentrations of sodium starch Glycolate. Key: (-* ) 0%, (- *- -) 20%, (- X-) 35%, (- -X- -) 80% [86].
Figure 5.14 shows the effect of the addition of increasing the sodium starch Glycolate concentration in a formulation on the release of methylprednisolone from
tablets over thirty minutes. The release of the drug increases with increasing
disintegrant concentration up to 35%. For the case of 80% disintegrant, the initial stage
of dissolution is slowed over lower concentrations, but then catches up after 15-20
minutes to reach a performance level similar to that of 35% disintegrant. In addition, the performance of the tablets containing 20 and 35% disintegrant offer massive gains in terms of dissolution rate over tablets having no disintegrant in them. After 30
minutes a tablet containing 35% disintegrant has had almost 100% of its drug content dissolved, while a tablet containing no disintegrant has barely 5% of its drug content dissolved.
Figure 5.15 shows a similar tablet release profile for the use of varying levels of sodium starch Glycolate, but for a different drug, in this case phenylbutazone. The rate of phenylbutazone release increases with increasing sodium starch Glycolate
concentration from 0 up to 30%, where the release rate is seen to reach a maximum, since the release rate from tablets containing 40% disintegrant is lower. The optimum disintegrant concentration in this case is therefore somewhere dose to 30%. It can also be seen that big improvements can be made to the dissolution of a drug with as little as 5 or 10% disintegrant in comparison to tablets containing no disintegrant.
The different performances of the two drugs during dissolution from tablets manufactured in identical ways (using the same apparatus and operating conditions)
104

with the same disintegrant shows that the interaction of the drug with the disintegrant
plays an important role in determining the choice and amount of disintegrant to use. For granules and tablets containing excess disintegrant the dissolution rate may be
slowed, due to the formation of a viscous barrier of the disintegrant in the granules during the dissolution process [86].
P«wntag. drug rniw. d
loo x.. - 1C
,--
X
SO rr ý31E'
r ri
r r
,, rý
40
20
0S 10 15 20 25 30
Tim. (mk)
Figure 5.15: Release of phenylbutazone from tablets containing 60 mg drug as granulate with different concentrations of sodium starch Glycolate. Key: (-* ) 0%, (... *... ) 5%, (- *- -) 10%, (-X-) 20%, (... X... ) 30%, (- -X- -) 40% [86].
SWUM$1NPCH ratrccuIE CROSC tº Lcse sMw
100
80
eo 9
40 Y'
20
L c*
Figure 5.16: Hydrochlorothiazide release profiles for extrusion/spheronization pellets having different disintegrant concentrations. Key: 0 0%, o 2.5%, A 5% [90].
105
D 60 s 0180 2 4O 300 3O 420 4s0
T. (min)
0 60 120 183 240300 360420 4B0
ram (no")

Figure 5.16 compares the release of hvdrochlorothiazide frotn pellets made by
extrusion and spheronization containing different amounts of two super-disintegrants 1901. It can be seen that for both disintegrants, the drug release rate increases with increasing disintegrant content, and that the performance difference between U and .
5"'o disintegrant is more significant for sodium starch Glvcolate than it is for croscarmellose sodium. It is argued that for pellets made in this way the increase in dissolution rate is
attributable to an observed increase in microporc volume (Figure 5.17) rather than the
swelling effect of the disintegrant 1901.
ý- r
Figure 5.17: Scanning electron microscopy- of extrusion/spheronization pellets containing different levels of croscarmellose sodium (901.
Data obtained by Ferrero et al (Table 5.7) [119] shows that the introduction of the disintegrant croscarmellose sodium in a direct compression formulation has a marked effect on the tablet disintegration time. The inclusion of just 5° o croscarmellose sodium in a formulation reduces the time taken to disintegrate from approximately 350
seconds and above for higher compaction pressures, down to just 15 seconds or better.
Table 5.7: Disintegration time (seconds) for tablets made in a direct compression formulation
at a range of compression pressures and croscarmellose sodium concentrations [119].
Compaction pressure (NIPa) Disintegrant
100 200 300 concentration (%)
0 346 1800 1800 5 15 11 3
10 3 14 24
It is also interesting to note that increasing the pressure of compaction for the case
of 5°/o disintegrant results in a decrease in the disintegration time, but increases when the disintegrant level is increased to 10°ßö. Ferrero et al [119] concluded that the
relationship between mixture composition and compression and disintegration
behaviour is non-linear. They used interpolation to suggest that the optimum
106

concentration of croscarmellose sodium in this formulation is in the region 5 to 8%
w/w.
1000 tsoo
ö600 400
0
Dtsi ant ped e (%)
Figure 5.18: Disintegration time as a function of the amount of disintegrant used for tablets
made with croscarmellose sodium (Ac-Di-Sol®), sodium starch Glycolate (Explotab®) and cross-linked cellulose (CLC-25) with spray-dried lactose as the tablet filler [82].
A comparison of the commercially available super-disintegrants with cross-linked
cellulose (Figure 5.18) by Chebli et al [82] shows that not only are croscarmellose
sodium and sodium starch Glycolate more effective than cross-linked cellulose at aiding dissolution, but do so at much smaller quantities. There also appears to be little adverse
effect of adding excess disintegrant, while the dissolution time using cross-linked
cellulose steadily decreases with increasing amounts of disintegrant. As a result of their investigation, Chebli et al. [82] also suggest that the mechanism of disintegration is
governed first by capillary action as the disintegrants suck water into the tablet or
granule matrix, followed by the mechanical breaking of interparticle bonds. This means
that tablet dissolution time is partly governed by the solubility of the filler and any other formulated ingredients in addition to the water uptake of the disintegrant.
xygroscopidy The importance of fast granule and tablet disintegration and dissolution to ensure
rapid availability of the active ingredients for absorption is well recognised by many industries. Only a few disintegrants (the so-called super-disintegrants) are currently
acceptable to the pharmaceutical industry due to modern industry standards relating to
tablet disintegration time [183].
The reason that these modern super-disintegrants are not employed in other applications and industries is their high hygroscopicity, an ability to readily absorb
107
os 10 is 20

moisture from the atmosphere. This means that any product not having hermetically
sealed packaging is susceptible to deterioration over time. Furthermore, this hygroscopicity is a large part of the reason why these super-disintegrants are so effective. It is their ability to conduct or wick' water to the centre of a granule or tablet in which they find themselves before the granule has dissolved so that their swelling behaviour can be more effective in breaking inter-particle bonds [82].
Figure 5.19 shows the equilibrium water uptake isotherms for four different disintegrants. The high performance of these disintegrants has been shown previously (Figure 5.12) and so it is reasonable to conclude that the performance of these
substances in aiding granule and tablet dissolution is at least partly due to their hygroscopicity.
60
50
40 yr
30
20
10
0 0 20 40 60 80 too
% Relative Humidity
Figure 5.19: Equilibrium water vapour uptake by Ac-Di-Sol® (croscarmell ose sodium), Explotab® (sodium starch Glycolate), Crospovidone and DMP 504 (cross-linked
polyalkylammonium polymer) as a function of relative humidity. The water percentage values
are 3 week values. Error bars and data points represent standard deviation of three replicates
and mean respectively [183].
However, research by Lopez-Solis et al [189] suggests that the correlation between
hygroscopicity and disintegrant performance may not be so strongly linked. Their
results (summarised in Figure 5.20) suggest that croscarmellose sodium, which has a lower hygroscopicity than pregelatinized starch (Starch 1500) is still able to perform
significantly better at aiding the dissolution of Norfloxacin. Indeed, it is widely agreed
that starch based products are highly water sensitive and will readily absorb and desorb
moisture from the atmosphere [190].
-a- Ac-Di-Sol ---t- Crospovidone
---o-- Expbtab ý- DMP 504
108

100
N
80 E 0 M
60 f6
O
40 N
C
20 X O
0
Z Q+ 0 5 10 15 20
Disintegrant Concentration, %
Figure 5.20: The effect of disintegrant concentration on the extent of dissolution of Norfloxacin tablets after 30 minutes 11891.
Table 5.8: Comparison of different disintegrants with respect to their hygroscopicity (abilitt-
to absorb moisture from the atmosphere) [189].
Starch 1500
Croscarmellose
Sodium
Crospovidone
(P\T XL 10®)
Estimated loss on drying (Wade and
Feller [ 1911)
<15°-o
Loss on drying (Löpez-Solis et al
[189])
10.50o
Hygroscopicity
(Lopez-Solis et al. 11891)
High
C10%
<50/o
2.0°rä
4.7°%
Moderate
Low
However, despite these differences in disintegrant hygroscopicity, all are affected
quite severely during storage over time, both in terms of dissolution performance and tablet strength, especially if the conditions are humid [192]. Therefore, the hygroscopicity of a disintegrant is just one of a range of factors affecting its
performance during dissolution and also its ability to resist change over time. The
effect of tablet formulation hygroscopicity and solubility on the dissolution efficiency of these super-disintegrants has been studied by Johnson et al [193], who conclude that
the greater the hygroscopicity and solubility of the tablet formulation, the less efficiently the disintegrants perform.
,r ---. ýýýý ýý
t Starch 1500 " Croscarmellose Sodium ý- Crospovidone
109

5.6 Disintegrants in Granules
There is, to date, no publicly available work detailing the effect of pharmaceutical disintegrants on granules, as outlined by the review in section 5.5. Therefore, it has been investigated experimentally here.
Using a total powder mass of 2 kg in each case to keep the binder-to-solids ratio
constant, the amount of disintegrant was increased from 0 through 1,5,10 and up to 20%. The disintegrant used was low-substituted hydroxypropylcellulose, grade LH-22
in each case.
8 Z to 0 v6
a
rn m C c N
01 Z 01
0
Dissolution time, tgp, sec
Figure 5.21: Effect of disintegrant (L-HPC, LH-22) concentration on granule strength and dissolution. Percentages represent the disintegrant level as a fraction of total powder mass.
Figure 5.21 shows that as the concentration of L-HPC (LH-22) is increased from 0
to 5%, the granule dissolution rate decreases from almost 90 seconds to less than 80
seconds, without any significant effect on granule strength. As the disintegrant
concentration is increased further to 10% the dissolution rate is actually slowed, while granule failure load is also affected and decreases from around 5.5 to 4 N. With further increase in disintegrant to 20%, the dissolution rate is slowed to a level similar to
granules containing no disintegrant, while granule strength is severely affected with a low average failure load of approximately 1N (Table 5.9). This is adverse effect on dissolution performance is thought to be caused by the formation of a viscous layer [86]
when excessive disintegrant is used, impeding the penetration of water into the granule structure. The dissolution test in a separate study was found to be accurate to ±1.36
seconds from 6 repeats, each using 1.0 gram of granules in the size range 1.0-1.4 mm.
110
75 80 85 90 95

Table 5.9: Mean and standard deviation of single granule strength testing for 20 single granules in the size range 1.0-1.4 mm as a function of disintegrant (L-HPC) concentration.
% Disintegrant Mean single granule failure S. D. (N) load, N(n=20)
0 5.34 0.75 1 5.72 1.49 5 5.22 1.60 10 4.12 1.90 20 1.38 2.26
111

"'^'"ý` . : ýw 'W.
_'`ý' Y, ý
rp .:
'.
Figure 5.22: Optical microscope images of granules containing different levels of L-HPC LH- 22 undergoing dissolution in water.
Figure 5.22 shows a sample of granules undergoing dissolution in a Petri dish
containing water, viewed under a stereo microscope (Zeiss Stereo Discovery V12).
Granules with 0 and 5% L-HPC LH-22 disintegrant undergo a similar dissolution
112
"+q
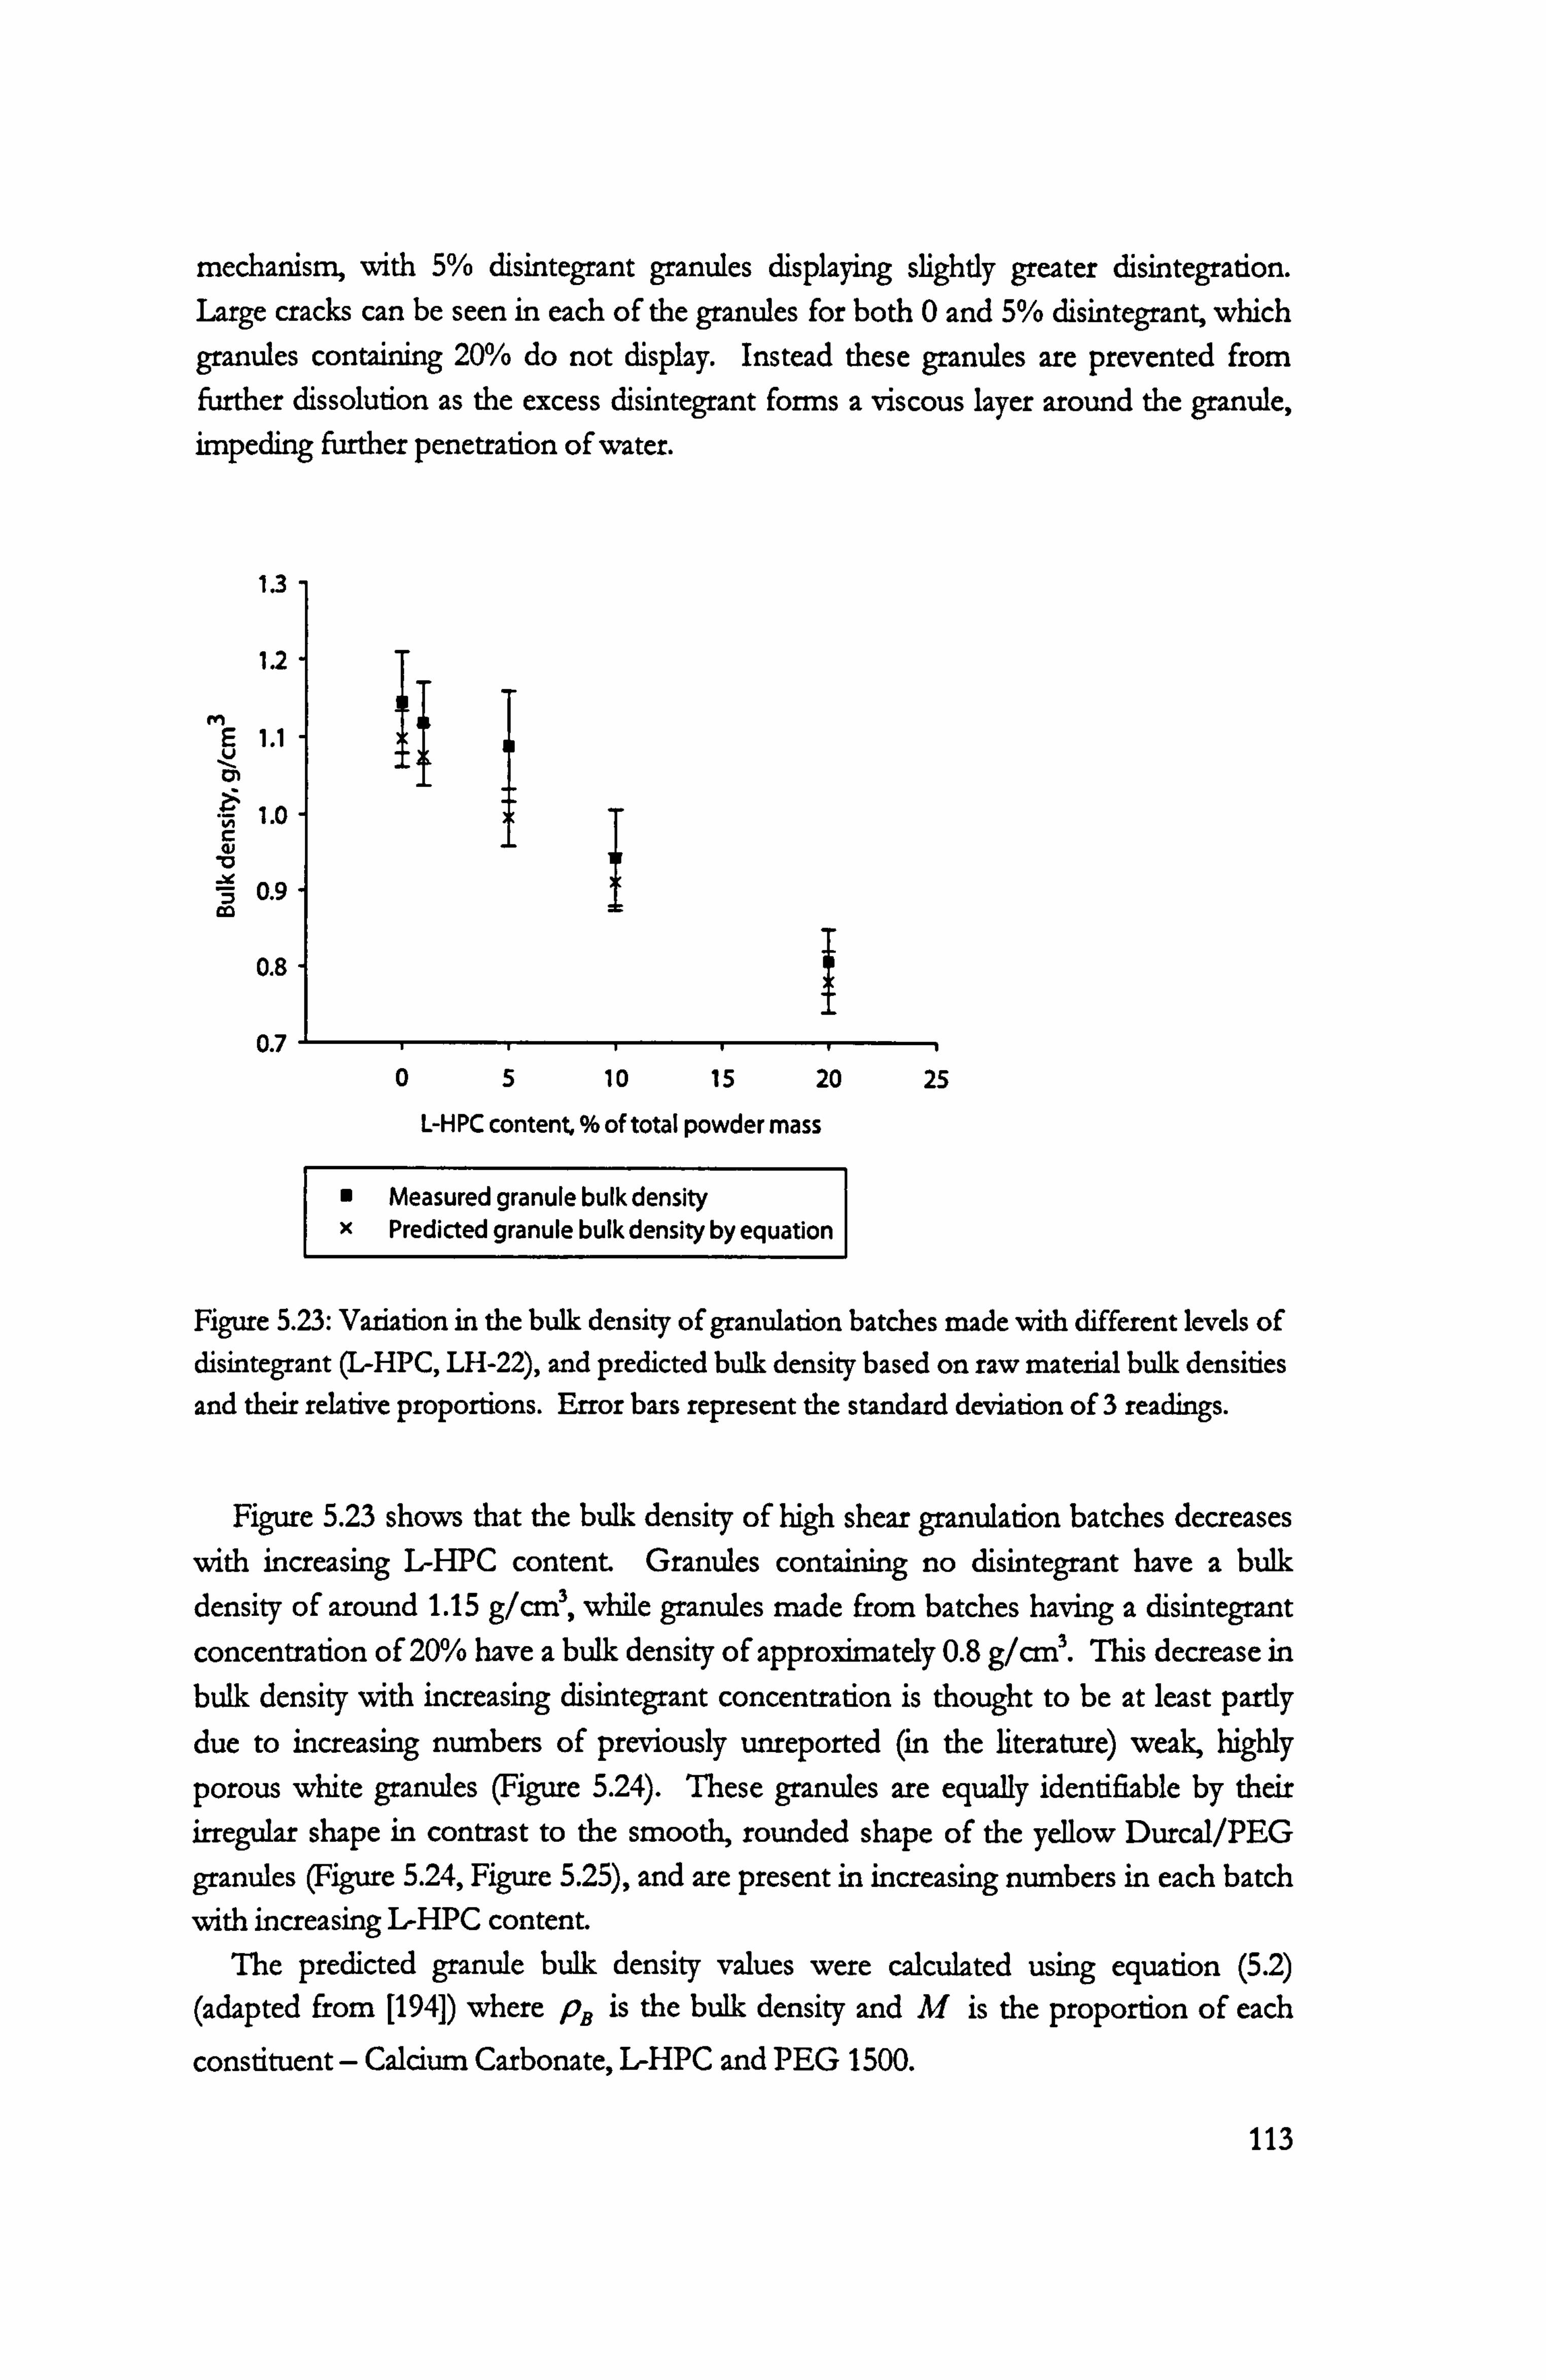
mechanism, with 5% disintegrant granules displaying slightly greater disintegration. Large cracks can be seen in each of the granules for both 0 and 5% disintegrant, which granules containing 20% do not display. Instead these granules are prevented from further dissolution as the excess disintegrant forms a viscous layer around the granule, impeding further penetration of water.
1.3
1.2 M
E 1.1 V 01
v 1.0
C N
0.9 Co
0.8
0.7
L-H PC content, % of total powder mass
Measured granule bulk density X Predicted granule bulk density by equation
Figure 5.23: Variation in the bulk density of granulation batches made with different levels of disintegrant (L-HPC, LH-22), and predicted bulk density based on raw material bulk densities
and their relative proportions. Error bars represent the standard deviation of 3 readings.
Figure 5.23 shows that the bulk density of high shear granulation batches decreases
with increasing L-HPC content. Granules containing no disintegrant have a bulk
density of around 1.15 g/cm', while granules made from batches having a disintegrant
concentration of 20% have a bulk density of approximately 0.8 g/cm'. This decrease in
bulk density with increasing disintegrant concentration is thought to be at least partly due to increasing numbers of previously unreported (in the literature) weak, highly
porous white granules (Figure 5.24). These granules are equally identifiable by their irregular shape in contrast to the smooth, rounded shape of the yellow Durcal/PEG
granules (Figure 5.24, Figure 5.25), and are present in increasing numbers in each batch
with increasing I-HPC content. The predicted granule bulk density values were calculated using equation (5.2)
(adapted from [194]) where pB is the bulk density and M is the proportion of each
constituent - Calcium Carbonate, L-HPC and PEG 1500.
113
05 10 15 20 25

1
PH , PH1 - (5.2)
The data points and error bars in Figure 5.23 represent the mean and standard deviation of 3 repeats, respectively.
Table 5.10: Measured bulk densities (mean and standard deviation of 3 repeats) of individual
granule components.
Bulk density g/cm' S. D.
Calcium Carbonate (Durcal 40) 1.08 0.036 L-HPC LH-22 0.35 0.040 11FG 1500 (solid) 1.26 0.011
Figure 5.24: Optical microscope images of two separate batches of granules made with (a) 0%
disintegrant and (b) 20% disintegrant. The 20"o disintegrant batch shows much higher
numbers of highly porous, irregular-shaped white granules.
114

Figure 5.25: Rounded yellow and irregular porous white granules produced in the same batch
during granulation with 20% disintegrant, viewed at 25x magnification.
Figure 5.25 shows a higher magnification view of the two distinctly different types
of granule produced when 20% L-HPC is used in the granulation mix. It was thought initially that these weaker white granules were responsible for the improvement in
dissolution time. However, while the number of these weaker granules increases
substantially with L-HPC content, the dissolution time reaches an optimum value at 5%
L-HPC (Figure 5.21), where numbers of these weaker granules are still very low (Figure
5.26).
115

10 20 rounded, yellow granules
Z 8 \
" 5 rounded, v " yellow granules ö
"0 " ý 6 '1 "
Ö1 '
N 15 Irregular, white granules
0 °
05 10 15 20 25
L-H PC content (% of total powder mass)
Figure 5.26: Granule failure load results for 20 single granules, size 1-1.4 mm from batches
made with different disintegrant concentrations. Key: Irregularly shaped white granules, "- Rounded yellow granules.
The irregularly shaped white granules (as opposed to the consolidated, rounded yellow Durcal/PEG granules) are also much weaker than their yellow counterparts (Figure 5.26). Figure 5.26 plots each value (not the average) of single granule failure load
recorded for each of the 20 granules tested for each batch and value of L-HPC content. Strength values for the irregularly shaped white granules correspond to the values of failure load below 1N (shown with a* symbol), while the rounded yellow granules gave strength values of between 3 and 8N (0 symbol). Relative numbers of each
granule type in the 20 chosen at random for strength testing are given in Table 5.11.
Table 5.11: Relative numbers of each granule type (rounded, yellow and irregular, white) in 20
single granules chosen at random for strength testing.
% Disintegrant Rounded, yellow granules Irregular, white granules
o 20 0 1 19 1 5 19 1 10 17 3 20 5 15
This relative strength difference between the two granule types can be explained by
their vastly different internal structures. The weaker, white granules (Figure 5.27b) have
116

a very open structure with high porosity, while the stronger, yellow granules (Figure 5.27a) have a very consolidated structure with low porosity.
ßa7
ý. I . ,, ý, sN
t
(b) -
fit. s
Figure 5.27: XRT images reveal a dense and compact structure, with very little porosity for
the yellow granules (a) and a much more open internal structure for the white granules (b).
100
80 i i
i 60
ö
40 i /
/ / Rounded, yellow granules
20 Irregular, white granules / --- Batch-representative mixture
0 0 20 40 60 80 100 120 140
time, s
Figure 5.28: Dissolution profiles of the two different granule types found in granulation batch
made with 20% L-HPC LH-22. The dissolution profile of the batch is included for
comparison.
The dissolution profiles for both of the granule types found in the batch containing 20% L-IIPC, along with a batch representative mixture are given in Figure 5.28.
During the first 40 seconds the irregularly shaped white granules have a faster
dissolution rate than either the rounded yellow granules or the batch representative
117

mixture. I lowever, beyond this time frame the dissolution rate of the irregularly shaped
white granules is slowed to less than that of either the rounded yellow granules or the batch mixture. Table 5.12 shows a summary of the t,,,, and t�, data for each granule type
and the batch representative. The difference between the t and the t,, values for the Irregular, \\ hite ranulcs, as
well as the retardation of dissolution rate with increasing L-l IP(' concentration above 5% is thought to he due to the formation of a gel phase which results from the contact
of excess IA I PC with water (figure 5.29), which slows down the dissolution rate by
blocking intergranular pores and preventing further penetration of the dissolution
medium 187,1921.
Table 5.12: Summan, of t( and t, ) data for each granule type present in a batch made with 20% 1.1 IPC LI 1-22 along with the batch representative.
t(fl Sec t', ', sec
Rounded vcllow granules 36.5 80.4 Irregular shaped white granules 27.0 87.6 Batch representative mixture 33.3
_802
Figure 5.29: Optical microscopy images of I. -IIP(. in contact with water. formation of a Gel
phase resulting from the contact between L-1 1PC and water. (a) large mass and (b) thin layer
of I. -I IP(; particles swollen and in the gel phase on saturation with , eater. The original clrv L-
[ IPC particles can be seen at the top of figure (b) in white.
5.7 Novel Dissolution Aids: A Review
The use of pharmaceutical disintegrants has all<ow-%wed for mild success, in that the dissolution time can be shortened by approximately 100 o, with no adverse effect on
granule strength. However, these materials are very hygroscopic, resulting in poor
118

storage conditions as outlined in the previous rev-iexv. In this section, a range of other substances and materials are investigated with a view to aiding granule disintegration
and dissolution through swelling and other mechanisms.
Hydrogels
A hvdrogel is a three-dimensional polymer network containing a large amount of water, perhaps as much as 991% by weight [1961. Many studies have concentrated on the swelling properties of a range of hvdrogels, and neutral polymer gels in particular
which include polvacrylamide or poly(1\N-isopropvlacrvlamide) [P(\-iP_ Am) J 1197,
1981. The fundamental properties of these gels have been well documented, and they
are of considerable importance as materials for the future application of hvdrogels. In
the present day, hvdrogels are being used as retainers of water and solutes in many industries, including medicine, foods and agriculture [199]. For these industries it is
also important to understand the physical and chemical principles that govern the
swelling degree and speed under different conditions. "These principles though are not well documented and must be investigated if these hvdrogels are to have a possible future application in the manufacture of granules and tablets.
Hydrogel structure
Monomer
0 Comonome;
Crosstmker
Figure 5.30: Schematic representation of a hvdrogel matrix (without water) 1200].
A hvdrogel matrix is made up of a very large number of long polymer chains or `backbones', which are interconnected to each other by crosslinks. Crosslinks help
reduce the solubility of the long polymer chains and also improve the mechanical strength of the matrix [200]. The long molecular chains are comprised of smaller units called monomers and co-monomers which are joined to each other during chemical
synthesis of the polymer network (Figure 5.30).
119

Temperature-sensitive hydroge1s The N-isopropylacrylamide (N-iPAAm) monomer has sidechains which interact
favourably with water in the form of hydrogen bonds. This causes hydrogels made from this monomer, [Poly(N-iPAAm)], to attract water molecules and swell at around
room temperature. The efficiency of this hydrogen bonding process has a negative temperature dependency, and above the lower critical solution temperature (LCST) the hydrogen bonding is increasingly disrupted by the increasing temperature. The long
polymer chain backbones of the matrix are hydrophobic, and reduce their surface area
exposed to water by aggregating together, causing the matrix as a whole to shrink [201,
202]. Below this LCST, the hydrogen bonding holding the water molecules in place is
stronger than the backbone chain interactions, and so the matrix swells to
accommodate the water molecules (Figure 5.31) [202]. The structure changes
experienced by such gels as they swell and contract have been investigated in more detail by Evmenenko et al [201].
120

Figure 5.31: SEM pictures of a carboxvvmethvldextran/P(N-iPAAm) hydrogel in swollen and
unswollen states [202].
Figure 5.32 shows the temperature-dependent behaviour of a typical hvdrogel. At
high temperatures the hydrogen bonding of water molecules to the sidechains is
discouraged and so the interactions between the hydrophobic long polymer chain `backbones' cause the polymer matrix to shrink [203]. At lower temperatures hydrogen
bonding is encouraged and so the polymer swells to accommodate the water molecules. The extent of swelling is shown here to be dependent on the amount of crosslinker in
the matrix. Since the crosslinks add mechanical strength to the matrix, it is
understandable that the lower the amount of crosslinks there are, the more the matrix is
allowed to swell to absorb water at lower temperatures [203].
121
( ýI liýcitu ri to '` i
(B) hydrogel in 3 71

m
0 IL
O) C
°) 1 3 cl)
mol % of crosslinker ý0 ....
""B0.1 %
"C0.15% 0- 4"D0.25 %
". E0.50% fF1.00 %
10 ..
0
10 15 20 25 30 35 40 45 50 55 60
Temperature (°C)
Figure 5.32: Swelling ratio dependence on temperature for hvdrogels with differing amounts
of crosslinker [203].
N-iPAAm based hydrogels are currently being developed as drug delivery systems due to the LCST being close to the human body temperature [204,205]. As Figure 5.32 shows, the swelling range spans 25 to 40°C, depending on crosslink concentration.
pfl-sensitive hydrogels
Hydrogels that respond to pH or ion concentration contain monomers with weak acidic or weak basic sidegroups. These sidegroups are ionisable and their charge is a function of pH.
122

1.8
1.6
1.4
1.2
1.0
-e- Copolymer NIPAAM/SA -s- Pure PNIPAAM --ý- Na-MLSIPNIPAAM
composite
ý,,, ýýýa-=-. ý =aua a 0
pH 10
Figure 5.33: pH sensitivity of N-iPAAm-SA copolymer, pure P(N-iPAAm) and Na- MLS/P(N-iPAAm) composite gels [206].
Figure 5.33 shows that while pure P(N-iPAAm) gels exhibit very little response to
changes in pH, copolymer gels comprising N-iPAAm and sodium acrylate (SA) are
sensitive to a pH change [206,207]. The swelling of a pH sensitive gel is the result of the influence of the pH and the ionic strength of the solution in which the gel finds
itself. The ionisable monomers inside the matrix will dissociate as a function of pH and
the resulting free counterions in the gel exchange with salt ions from the solution [200].
Resulting from this process, a counterion concentration will develop inside the gel,
resulting in an osmotic pressure difference between the gel and the solution. This
pressure difference causes the gel to swell, until the elastic forces inside the gel equal the
osmotic pressure forces [200].
123

75.0 f Ns3PO4 Na2GO3 0 HadI
60.0 ö o. ä 45 JD
N
41 cr- 15.0
0.01 0.05 0.1
Salt Concentration (M)
Figure 5.34: The effect of the ionic strength of the solution on the swelling ratio of a
carboxymethylcellulose-g-polyacrylamide polymer [99].
The concentration of ions in solution has a significant effect on the swelling of the hydrogel (Figure 5.34). Increasing the ionic strength of the solution from 0.01 M to 0.10 M reduces the mobile ion concentration difference between the gel and the solution and thus the osmotic swelling pressure [99].
New advances in hydrogel technology The rate of polymer swelling has been the subject of research by Ornidian et al, in
their work on superporous hydrogels (SPHs) [208]. These are similar to superabsorbent polymers (SAPs) in that they are structurally cross-linked hydrophilic
polymers that have the ability to absorb considerable amounts of water, up to thousands of times their original weight or volume in relatively short periods of time [209,210]. The fast swelling rate of SAPs is based on their small sample size, whereas the swelling of SPHs is always fast regardless of the final product size. SAPs and SPHs both have porous structures, but the initial wetting of SAPs is slow, whereas SPHs swell immediately on contact with water regardless of their size in the dry state. This is
attributed to their highly porous structure (Figure 5.35) which allows for the rapid absorption of water into the centre of the matrix.
124

Figure 5.33: SEM images of a nonporous superabsorbent polymer (A) and corresponding
superporous hvdrogel (B and C) 12081.
The same monomer solution is capable of producing different types of water- absorbing polymer networks including porous, nonporous and superporous, depending
on the use of foaming agents, foaming aids and foaming stabilizers (Figure 5.36). A
combination of sodium bicarbonate and acetic or acrylic acid is commonly used to
make a foam structure [208].
4- Foaming aid 5- Oxidant
3- Crosslinker Thermal initiator
2- Neutralization 6- Reductant
1- Monomer dilution 7- BI icarbonate ---7 :ý
4- Foaming aid, Foam stabilizer
3- Crosslinker 5- Oxidant
2- Neutralization 6- Reductant
I- Monomer dilution 7- Bicarbonate -]
II
SAP SPH
Figure 5.36: steps involved in the production of superabsorbent polymers and superporous hvdrogels [208].
125
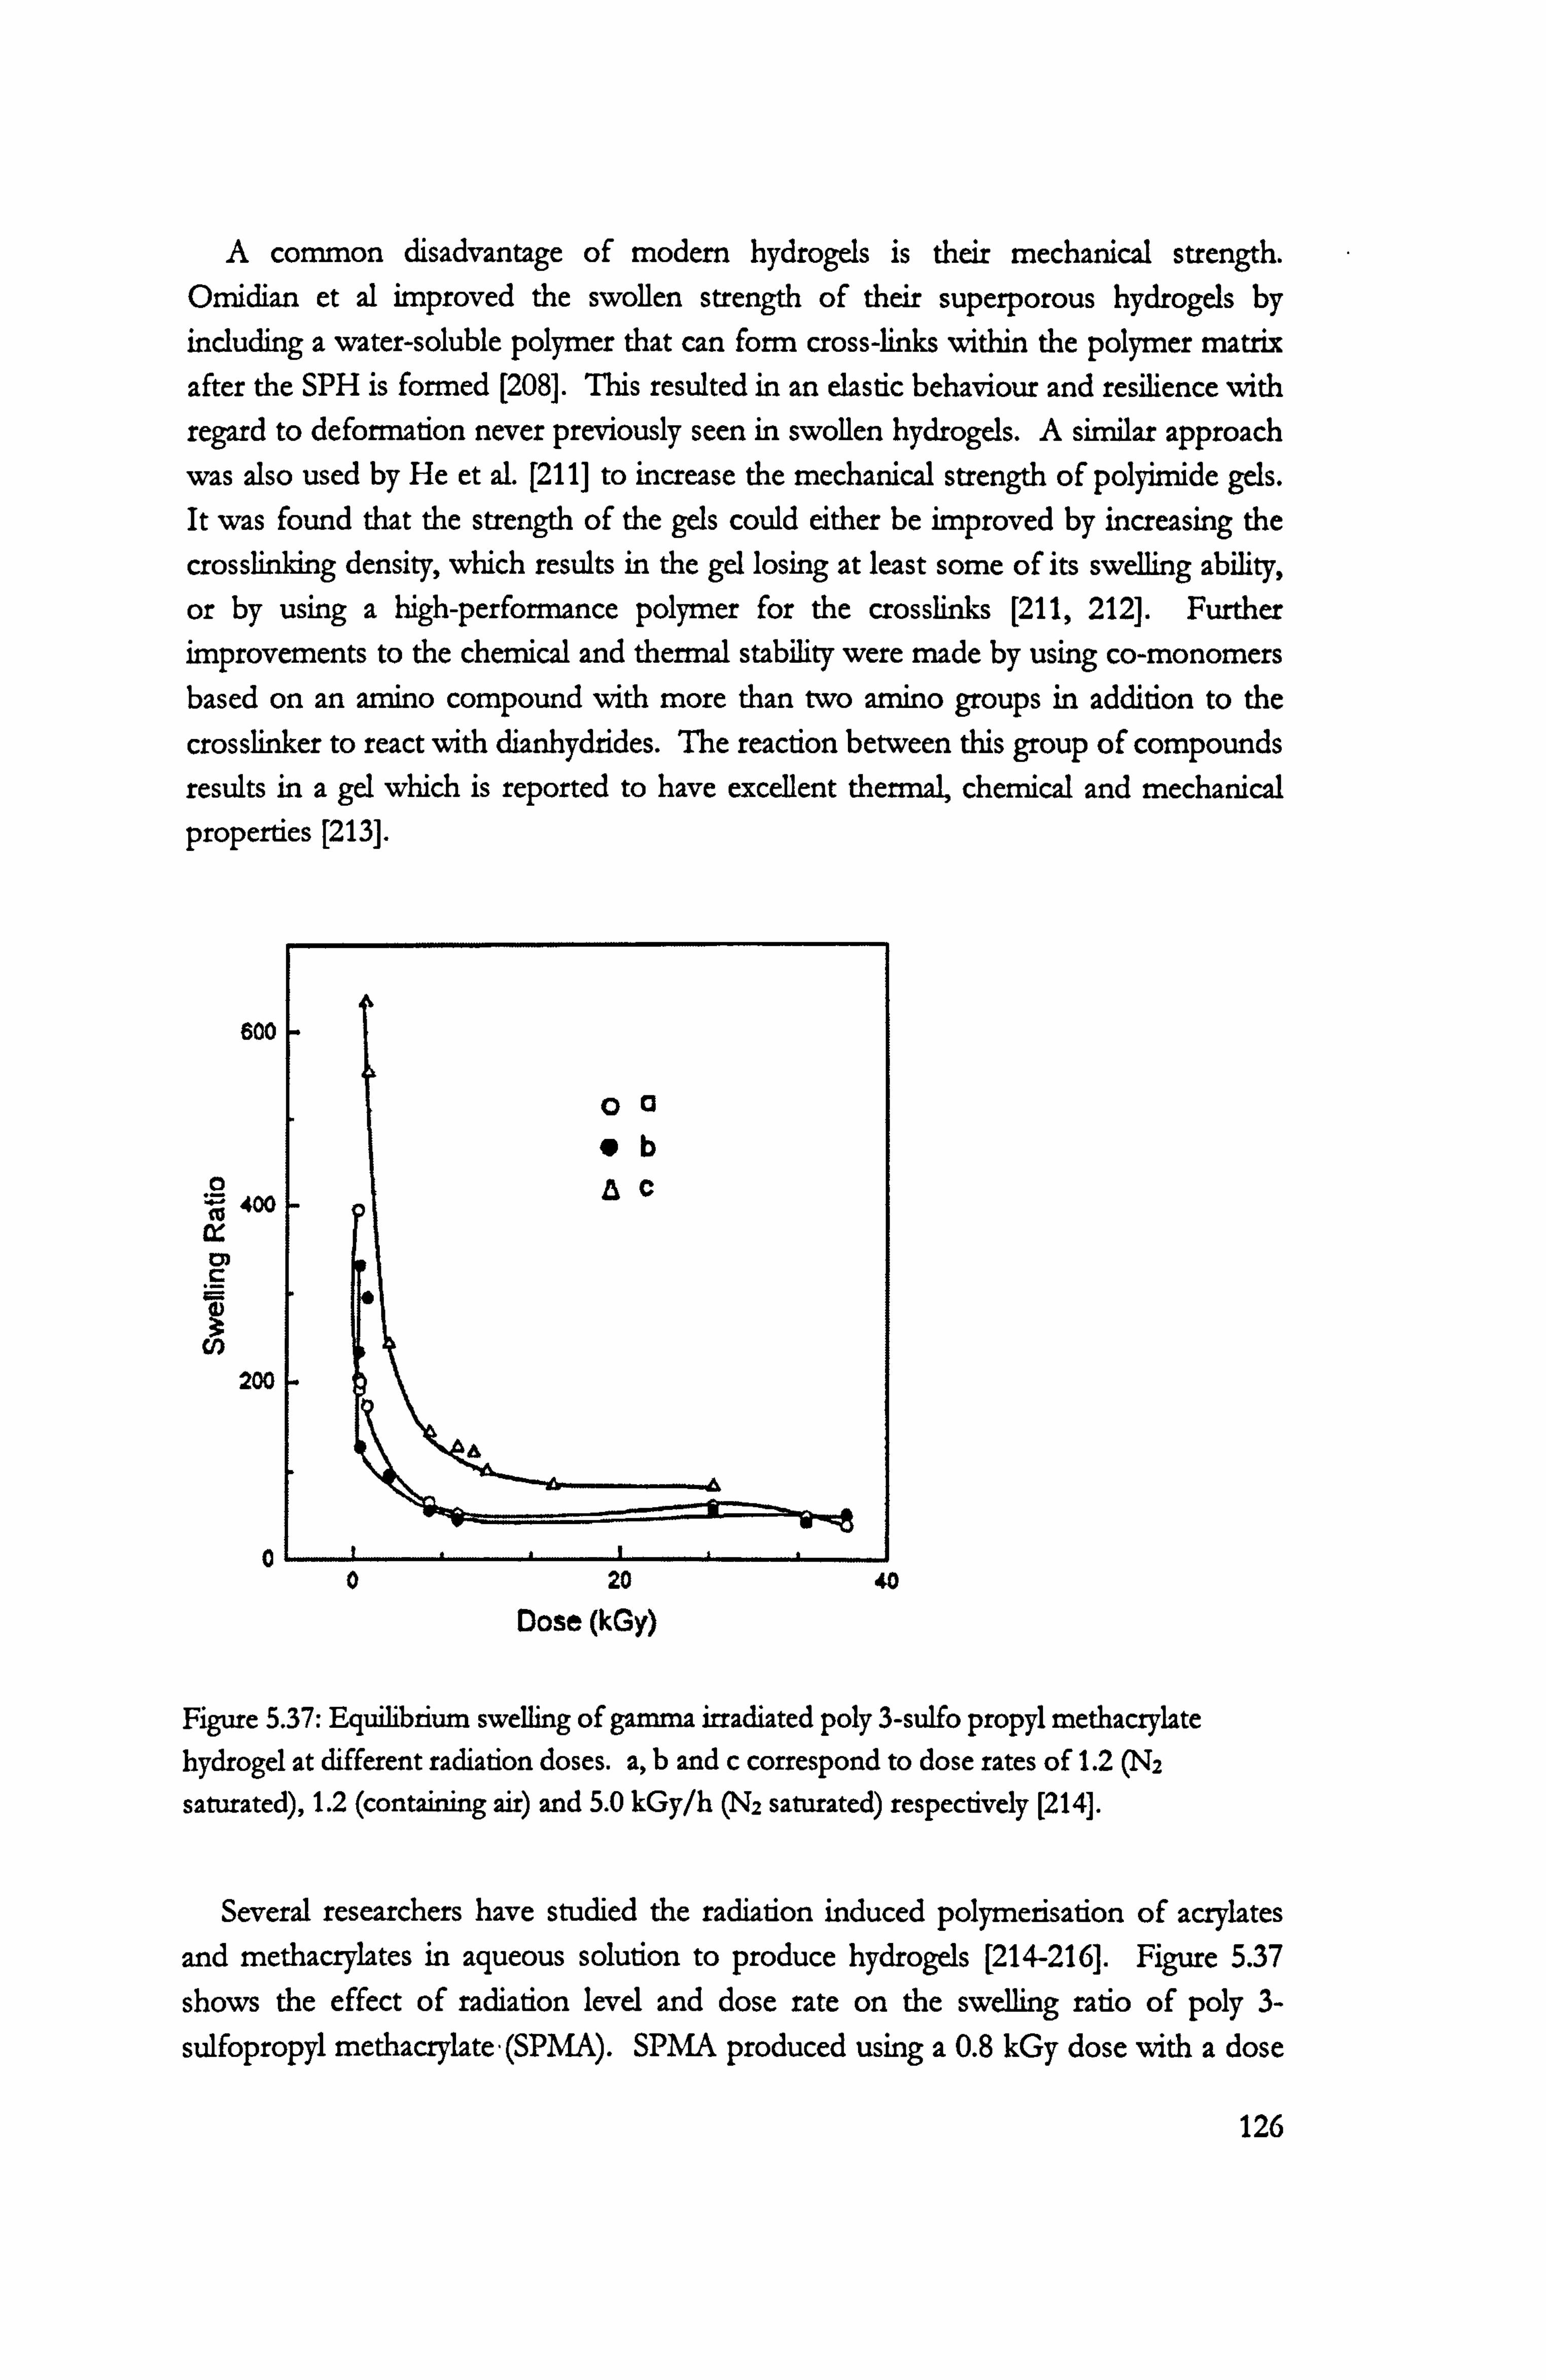
A common disadvantage of modem hydrogels is their mechanical strength. Omidian et al improved the swollen strength of their superporous hydrogels by including a water-soluble polymer that can form cross-links within the polymer matrix after the SPH is formed [208]. This resulted in an elastic behaviour and resilience with regard to deformation never previously seen in swollen hydrogels. A similar approach
was also used by He et al. [211] to increase the mechanical strength of polyimide gels. It was found that the strength of the gels could either be improved by increasing the
crosslinking density, which results in the gel losing at least some of its swelling ability, or by using a high-performance polymer for the crosslinks [211,212]. Further improvements to the chemical and thermal stability were made by using co-monomers based on an amino compound with more than two amino groups in addition to the
crosslinker to react with dianhydrides. The reaction between this group of compounds
results in a gel which is reported to have excellent thermal, chemical and mechanical properties [213].
600
0 400
cm C
200
0 0 20 40 Dose (kGy)
Figure 5.37: Equilibrium swelling of gamma irradiated poly 3-sulfo propyl methacrylate hydrogel at different radiation doses. a, b and c correspond to dose rates of 1.2 (N2
saturated), 1.2 (containing air) and 5.0 kGy/h (N2 saturated) respectively [214].
Several researchers have studied the radiation induced polymerisation of acrylates and methacrylates in aqueous solution to produce hydrogels [214-216]. Figure 5.37
shows the effect of radiation level and dose rate on the swelling ratio of poly 3-
sulfopropyl methacrylate-(SPMA). SPMA produced using a 0.8 kGy dose with a dose
126

rate of 5 kGy/h swells to 634 times its dry weight, while SPMA produced as lower dose
rates fares less well. This is thought to be due to the formation of intramolecular
crosslinks at higher dose rates, compared with intermolecular crosslinldng at lower dose
rates. This results in an increase in the osmotic swelling pressure of the ions in the polymer.
Work on composite materials carried out by Hron et al. [217] has resulted in the combination of a silicone rubber matrix with a particulate, lightly crosslinked polyacrylamide hydrogel to give a material which resembles common silicone rubber but which is hydrophilic and swells in water like hydrogels.
Table 5.13: Mechanical properties of the dry and equilibrium water-swollen rubber-hydrogel composite [217].
Dry Equilibrium swollen
Tensile strength (MPa) 3.1 1.1 Break elongation (%) 220 320
Hardness (°Shore A) 58 25
Resilience (%) 19 38
A summary of some of the mechanical properties of the composite as given by Hron et al. [217] are listed in Table 5.13. The composite retains good strength and resistance to breakage even when swollen. Further, it was found that the mechanical properties of the swollen composite are better than those of either the base silicone matrix or a methacrylate hydrogel with the same water content. In addition, the swelling rate of the composite was reported to be 70 wt% of the equilibrium in 24 hours at room temperature, however Figure 5.38 suggests a slower swelling rate, and possibly one which would have to be improved if such a material was to be applied in
granulation or tabletting.
127

Water 80
content in 70 composite material 60 (wt. %) 50
40
30
20
l0
0 20 40 60 80 100 120 140
Swclling time (hours)
Figure 5.38: Dependence of swelling time on the water content of the rubber-hydrogel composite material [217].
Hydrogel response triggers
The synthesis of copolymer gels whose swelling behaviour responds to different
external stimuli provides a unique opportunity to tailoring multifunctional materials for
specific applications. A polymer network may be collapsed or indeed expanded by
changing stimuli such as temperature, solvent composition, pH, ionic strength and
surfactants [198].
Temperature There are many hydrogels that are sensitive to changes in temperature. Common
applications of thermo-sensitive hydrogels include drug delivery systems [204,218],
separation processes [219,220], immobilisation of enzymes [221] and immunoassays [222]. Both swelling behaviour and mechanical properties of such hydrogels are important, although the latter has only recently begun to receive as much research attention as the former [223]. Hydrogels currently have inadequate strength and durability for some applications such as drug delivery, and hence researchers are now turning their attention to improving mechanical strength [209,224,225].
PH Along with temperature, pH is one of the more common triggers for the
swelling/shrinking of hydrogels. With increasing pH of the dissolution media, the swelling volume of anionic polymers is expected to increase while that of cationic polymers would decrease. With increasing ionic strength the swelling volume of both
anionic and cationic polymers would decrease [226]. Excipients which are sensitive to pH and ionic strength of the medium in which they find themselves are commonly used in drug formulations in order to make the drug delivery site-specific [227,228].
128

Solvent composition Some gels swell and shrink with changes in solvent ratio [229,230]. Figure 5.39
shows how a gel made from acetic acid lignin and Polyethylene Glycol diglycidyl ether in the ratio 0.57 swells with increasing ethanol concentration up to a maximum at around 45% ethanol and then begins to shrink with further increase in ethanol concentration [231].
0
eo
3
0 20 40 60 80 100 Ethanol concentration (%, v/v)
Figure 5.39: Swelling ratio of Acetic acid lignin (AL)-Polyethylene Glycol diglycidyl ether (PE-
13) gels in aqueous ethanol solutions. f AL-PE-13 (0.57), 0 AL-PE-13 (1.5), A AL-PE-13 (3.0) [231]. Bracketed numbers represent PE-13/AL ratio in gel structure.
Electricity Electrically responsive hydrogels can be prepared from polyelectrolytes; polymers
containing high concentrations of ionisable groups along the backbone chain, and are
therefore pH responsive as well as electrically responsive [232,233]. When an electric field is applied, electrically responsive gels generally shrink, while a small proportion
either swell or erode. Volume changes of responsive hydrogels is quite slow, unless gel
micro-particles are used, since the process is diffusion-controlled [234].
129

0.8
0.6
0.4
0.2
0 10 20 30' 40 50 60
t/nit
Figure 5.40: Hydrogel shrinking with time upon electrical stimulation. Rw = weight of gel after electrical stimulation/weight of gel before stimulation. The shrinking of two different
gels is shown [235].
Electrically responsive gels have been used as drug delivery mechanisms as drug is forced out of the gel when the matrix contracts and shrinks (or erodes). Gels which swell are often used where the drug molecules are large to allow diffusion of the drug from the gel matrix.
The limitations of electrically responsive hydrogels include slow response times, gel fatigue with time and a non-linear relationship between gel response and electrical voltage.
Other novel approaches
Pore formers Pore formers are water soluble compounds that aid the release of drugs from
polymer networks by dissolving to form channels, causing the drug to leach out of the polymer.
Figure 5.41 shows that three different pore formers are effective in enhancing the dissolution rate of cefadroxil from a polyurethane matrix [236]. For the most effective pore former, BSA, the amount of drug released in four hours is increased from 40% to
almost 70%.
130

80
60 d
40
20
0 02468 10 12
Time (hour)
Figure 5.41: The effect of different pore formers on the release of cefadroxil from a
polyurethane matrix. 0 BSA (bovine serum albumin), A D-mannitol, El PEG 1450, " no
pore former [236].
However, the main problem with the use of pore formers is not their effectiveness, but the fact that they are used in conjunction with polymer networks, which are themselves used as dissolution rate controllers. Unless a new compound can be found
which is capable of dissolving faster than Polyethylene Glycol, in order to act as a pore former for PEG, then this mechanism is of limited use.
Ca pules Capsules are used in the pharmaceutical industry in conjunction with disintegrants to
deliver drugs quickly and effectively. A protective capsule helps to keep the sensitive disintegrants from coming into contact with moisture prior to the site of dissolution.
In a similar way, capsules could potentially be used to protect disintegrants and granules used for other applications. However, the dissolution of the capsule material in water is likely to be very slow, counteracting any advantage gained by the inclusion of disintegrants.
l ipidr
Lipids are a group of hydrophobic molecules that includes fats, oils and waxes. While the bulk of their structure is non-polar and therefore hydrophobic, most lipids have some polar character within their structure. When placed in water, lipids can form
a bilayer, where the hydrophobic `tails' of the molecule line up against each other to form a membrane with the hydrophilic `heads' extending out into the water (Figure
131

5.42) [237]. Due to the oily bilaver core formed by the long hydrocarbon tails of the molecules, a lipid bilaver is permeable to small hydrophobic solutes but is almost impermeable to inorganic ions and other hydrophilic molecules. Water is an exception to this rule and crosses freely.
Iýigure 5.42: A molecular dynamics computer simulation of the lipid DPPC (dipalmitovl
phosphatidvl choline) showing the hydrophobic tails lined up together in the centre with the hydrophilic heads sticking out into the aqueous solution above and below [237].
Neutral lipids will take up approximately 50 wt°/ö water from a liquid [238,239], but
will only take up 30 wt° o from a 1000, 'o relative-humidity vapour [240,241]. However,
Parsegian et al have reported that charged lipid Mayers immersed in distilled water display swelling behaviour and will take up essentially infinite amounts of water [103,
242,243], yet multilavers of these lipids on a solid surface will absorb only a small amount of water from a vapour, even at 100°/o RH [240-242].
However, because the lipids are essentially hydrophobic, the swelling mechanism
would not be nearly as strong as that in a hydrophilic disintegrant. Charged lipids will
swell to whatever dilution is allowed by the situation that they find themselves in [242]; however there is no available information to suggest what the rate of this swelling is, or how strong the swelling force is. In addition, the inclusion of lipids into a powder and binder granulation mix is likely to reduce the strength of the granules due to their waxy nature, and could possibly even be destroyed bv the shear forces experienced during
granulation.
132

Weak gels Xanthan gum was the first polysaccharide (long chain polymer made of different
sugars) to be discovered which combines gel-like rheology at rest with the ability to flow freely under stress [244]. It hydrates rapidly in water and is commonly used as a thickener, stabilizer and emulsifier.
Welan polysaccharide has weak gel properties similar to xanthan, and so aqueous solutions of welan show gel-like rheology [244]. It is thought that substances with such behaviour could potentially be used to increase the strength of wet granules. The effect of using weak gels as binders on dissolution rate and drying are as yet unknown. The
properties of granules made with weak gels after drying is important since there are very few applications for wet granules. One possible obstacle to the future use of weak gels is that they are usually quite expensive materials.
Aerogels Silica aerogels have fascinating properties, among which are transparency, porosity
and an extremely high strength to weight ratio. Formed by CO2 supercritical drying,
they are essentially gels with the solvent removed to leave the lattice of silica behind.
They have low hydrophobicity, and hence the structure collapses on the re-introduction
of water. They are also extremely brittle, due to the delicate lattice arrangement of the
atomic structure. The hair-like structures that make up an aerogel lattice are only a
nanometre in diameter and separated by only 20 nanometres, and so aerogels possess
unique insulating properties, since the air molecules within the lattice find that there is
little room for vibration. If an aerogel or similar structured material could be incorporated into a granule or
tablet, the results would be very interesting, since aerogels possess both the strength (if
they are too brittle presently) and the porosity which is so often compromised. However, owing to their unique properties and method of manufacture they are still
very expensive materials to produce.
5.8 Two-Component Binder Solution
The inspiration for this experiment came after further, much more detailed analysis
of the granules made for the 'binder content' experiment outlined in the previous
chapter (section 4.5, page 73). In this analysis, the composition of granules over the full
range of size classes was investigated, in addition to the previously analysed range of 1.0-1.4 mm.
The correlation between granule size and the binder content of granules in a particular size range has been documented before by Reynolds and co-workers [149]. They reported that "there is a definite trend of small granules containing less than
average proportions of binder and larger granules containing more, with a sharp, almost stepchange, between the two regimes". Figure 5.43 shows that this `step change' occurs
133

between 200 and 400 µm. A similar `step change' can also be seen in Figure 5.44,
which shows the variation in granule binder content with size for granules made with different binder: solids ratios.
However, Figure 5.44 contains other information relevant to this work which is of much more importance; namely that granules over approximately 600 tm in size all have essentially 'I'1-IE SAME binder content, no matter how much binder is added at the start of the granulation process.
This information is important because it says that under these conditions the binder
content of a granule cannot be effectively controlled. There are small differences
between the binder contents of larger granules from each batch, with higher binder-to-
solids ratios resulting in lower granule binder contents as a result of increased lubrication and consolidation, and these small differences are partly responsible for the
observed changes in strength and dissolution behaviour. So, in order to be able to
manipulate large changes in granule strength and dissolution behaviour, a (more drastic)
method of controlling granule binder content, and therefore composition, is required.
0.25
0.20
16 0.15 -
----------- -- to /
0 10 jo i
d min 8 min
t-- 16 mm 0.05
0.00 - 100 200 300 400 500 1000
Sieve aperture (µm)
Figure 5.43: size-averaged liquid-to-solids ratio for granules at different processing times (Source: Reynolds et al. 1149]).
f 24 mm 30 mm
-- Sample Average (L'S=0.13)
134

16
14 0_.. _ _:: Jº_ . ý.. v, výýr__r".
i «r
12
10- v c
j
10 8 12
---'--- 14 6 _.. -0. _.. 16
4+ 0 200 400 600 800 1000 1200
Granule size, µm
Figure 5.44: Granules over a certain size (in this case 600 µm) all contain the same level of binder, regardless of the amount available for granulation (shown here as a percentage of the 2 kg powder mass).
Binder solution concentration
The answer came in the form of a two-component binder solution, with the more volatile component being removed post-granulation. This allows the granulation process to proceed as normal, with the added benefit of no longer requiring elevated temperatures to melt the (now dissolved) Polyethylene Glycol binder. Figure 5.45
shows that granule binder content can be successfully manipulated by varying the PEG
concentration of an aqueous PEG binder solution. The solution is used in place of pure PEG for the granulation process, with the more volatile component, water, being
removed by drying afterwards. This leaves granules containing only PEG and Calcium Carbonate (Durcal), with increased voidage in place of the water (Table 5.14).
135

Z
14
" Averge failure load o Granule binder content
a
0
12 0
0 10 8
75 c O1 6 w rn c
4 a, rn .a
0
14
12
10 ö V GJ ý
8 -o C .DQ N C)
6 . o¢
4 a, rn v 2
0 0 20 40 60 80 100
Binder solution concentration, % PEG 6000
Figure 5.45: Granule binder content can be controlled by controlling the concentration of an aqueous PEG 6000 solution and removing the most volatile component (m this case water) after the granulation process is stopped. Strength results show mean and standard deviation
of 20 single granules in the size class 1.0-1.4 mm.
Figure 5.45 also shows that the strength of a granule is linearly dependent on the concentration of PEG in an aqueous PEG solution. That is, granule strength is directly
proportional to the number of bridges between primary particles. So, now that the
number of binder bridges can be controlled, and therefore the porosity and the dissolution behaviour, all that remains is to strike a balance between the number of bridges and the bridge strength. Fortunately, bridge strength can be directly controlled in this model system by changing the molecular weight of the PEG binder. As
previously discussed, the higher the molecular weight of the PEG binder, the stronger the resultant granules will be.
An additional feature of the aqueous PEG solution binder system is that the higher
the concentration of PEG in solution, the more viscous the solution becomes. It is
well documented that increasing the binder viscosity results in a slower consolidation
rate [29,58-60]. This is also demonstrated by this system by the decreasing powder
content of the granules (Table 5.14), despite reports in the literature that a binder
viscosity of over 1 Pa. s is required to have this effect [61]. It is this decrease in
consolidation with increasing binder viscosity that prevents the trend in porosity values from being a corresponding linear decrease. In fact, at high PEG concentrations (50%), the porosity begins to rise again due to poor particle packing brought about by
resistance to consolidation during granulation. It is worth mentioning that all granule porosities here, with the exception of granules made using a 100% PEG binder, are significantly higher than those obtained for any previous high shear granulation
136

experiment. The viscosities of the various aqueous PEG solutions measured by a
proRheo R180 viscometer are given in Figure 5.46.
Table 5.14: Composition data for granules made with an aqueous PEG 6000 binder solution before and after drying.
Wet mass basis Dry mass basis PEG 6000
concentration, Water Binder Porosity,
Powder Binder Porosity,
wt% Content, Content, Content, Content, vol% V010/0 wt% wt% wt% wt%
5 9.77 0.9 2.82 89.3 1.0 10.20 15 8.62 2.1 1.69 89.2 2.3 7.53
25 7.86 3.4 1.31 88.8 3.7 7.41 35 6.77 4.8 0.62 88.4 5.1 7.09
50 5.22 7.0 2.51 87.7 7.4 9.77
100 0.02 12.2 - 87.8 12.2 -
05
a 0.4
N
$ 0.3
0
0.2 0 41
üJ 0.1
0.0
Figure 5.46: The viscosity of an aqueous PEG 6000 solution increases with increasing PEG
concentration.
Molecular weight of PEG
With increasing molecular weights of Polyethylene Glycol (PEG), we get stronger bridge strength, and also higher solution viscosity. The effects of these on the resultant
137
0 10 20 30 40 50 60
Solution concentration, wt% PEG 6000

granule strength and porosity are shown in Figure 5.47. Three different molecular weight PEGs are shown; 1500,6000 and 20000 Da, each one in two concentrations; 25
and 50% aqueous solution. It is dear to see that increasing the molecular weight of the PEG has two effects; the first being to increase the strength of the granules, through
stronger individual bridges. The second effect is to increase granule porosity, which is
thought to be a direct result of increasing solution viscosity, which increases with both PEG concentration and molecular weight of PEG used. The results for 50% by weight solutions of PEG 6000 and PEG 20000 result in granule porosities of around 12% and 14% respectively. For high shear granules, these porosity values are exceptionally high,
and even more impressive considering the values of strength recorded.
By balancing the effects of solution concentration and molecular weight of the PEG, which together are responsible for binder viscosity, consolidation rate, binder
content and binder bridge strength and therefore also strength, dissolution behaviour
and porosity, it is possible to engineer strong, fast-dissolving, porous granules (Figure 5.48). The values of strength and dissolution time are shown for typical high shear and fluid bed granules as a comparison, along with the modest improvement afforded by disintegrants and the trade-off line seen so commonly in the results of previous
expenments.
Z
8
0 0
ao0
Average failure load o Porosity
0
a,
a, C c N
a1 2 G1 10
i
0
JI)PI , 2,115 C ') up", OsP us, -I'llp boll (013 lp lp
PEG molecular weight, Da/concentration, %
16
14
12
10
8
6
4
2
0
N C V 0
a v C A v+ C) DI .o C, >
Figure 5.47: Increasing the molecular weight of the PEG paradoxically increases both granule strength, owing to stronger bridges, and porosity, due to higher viscosities and lower
consolidation rates.
138
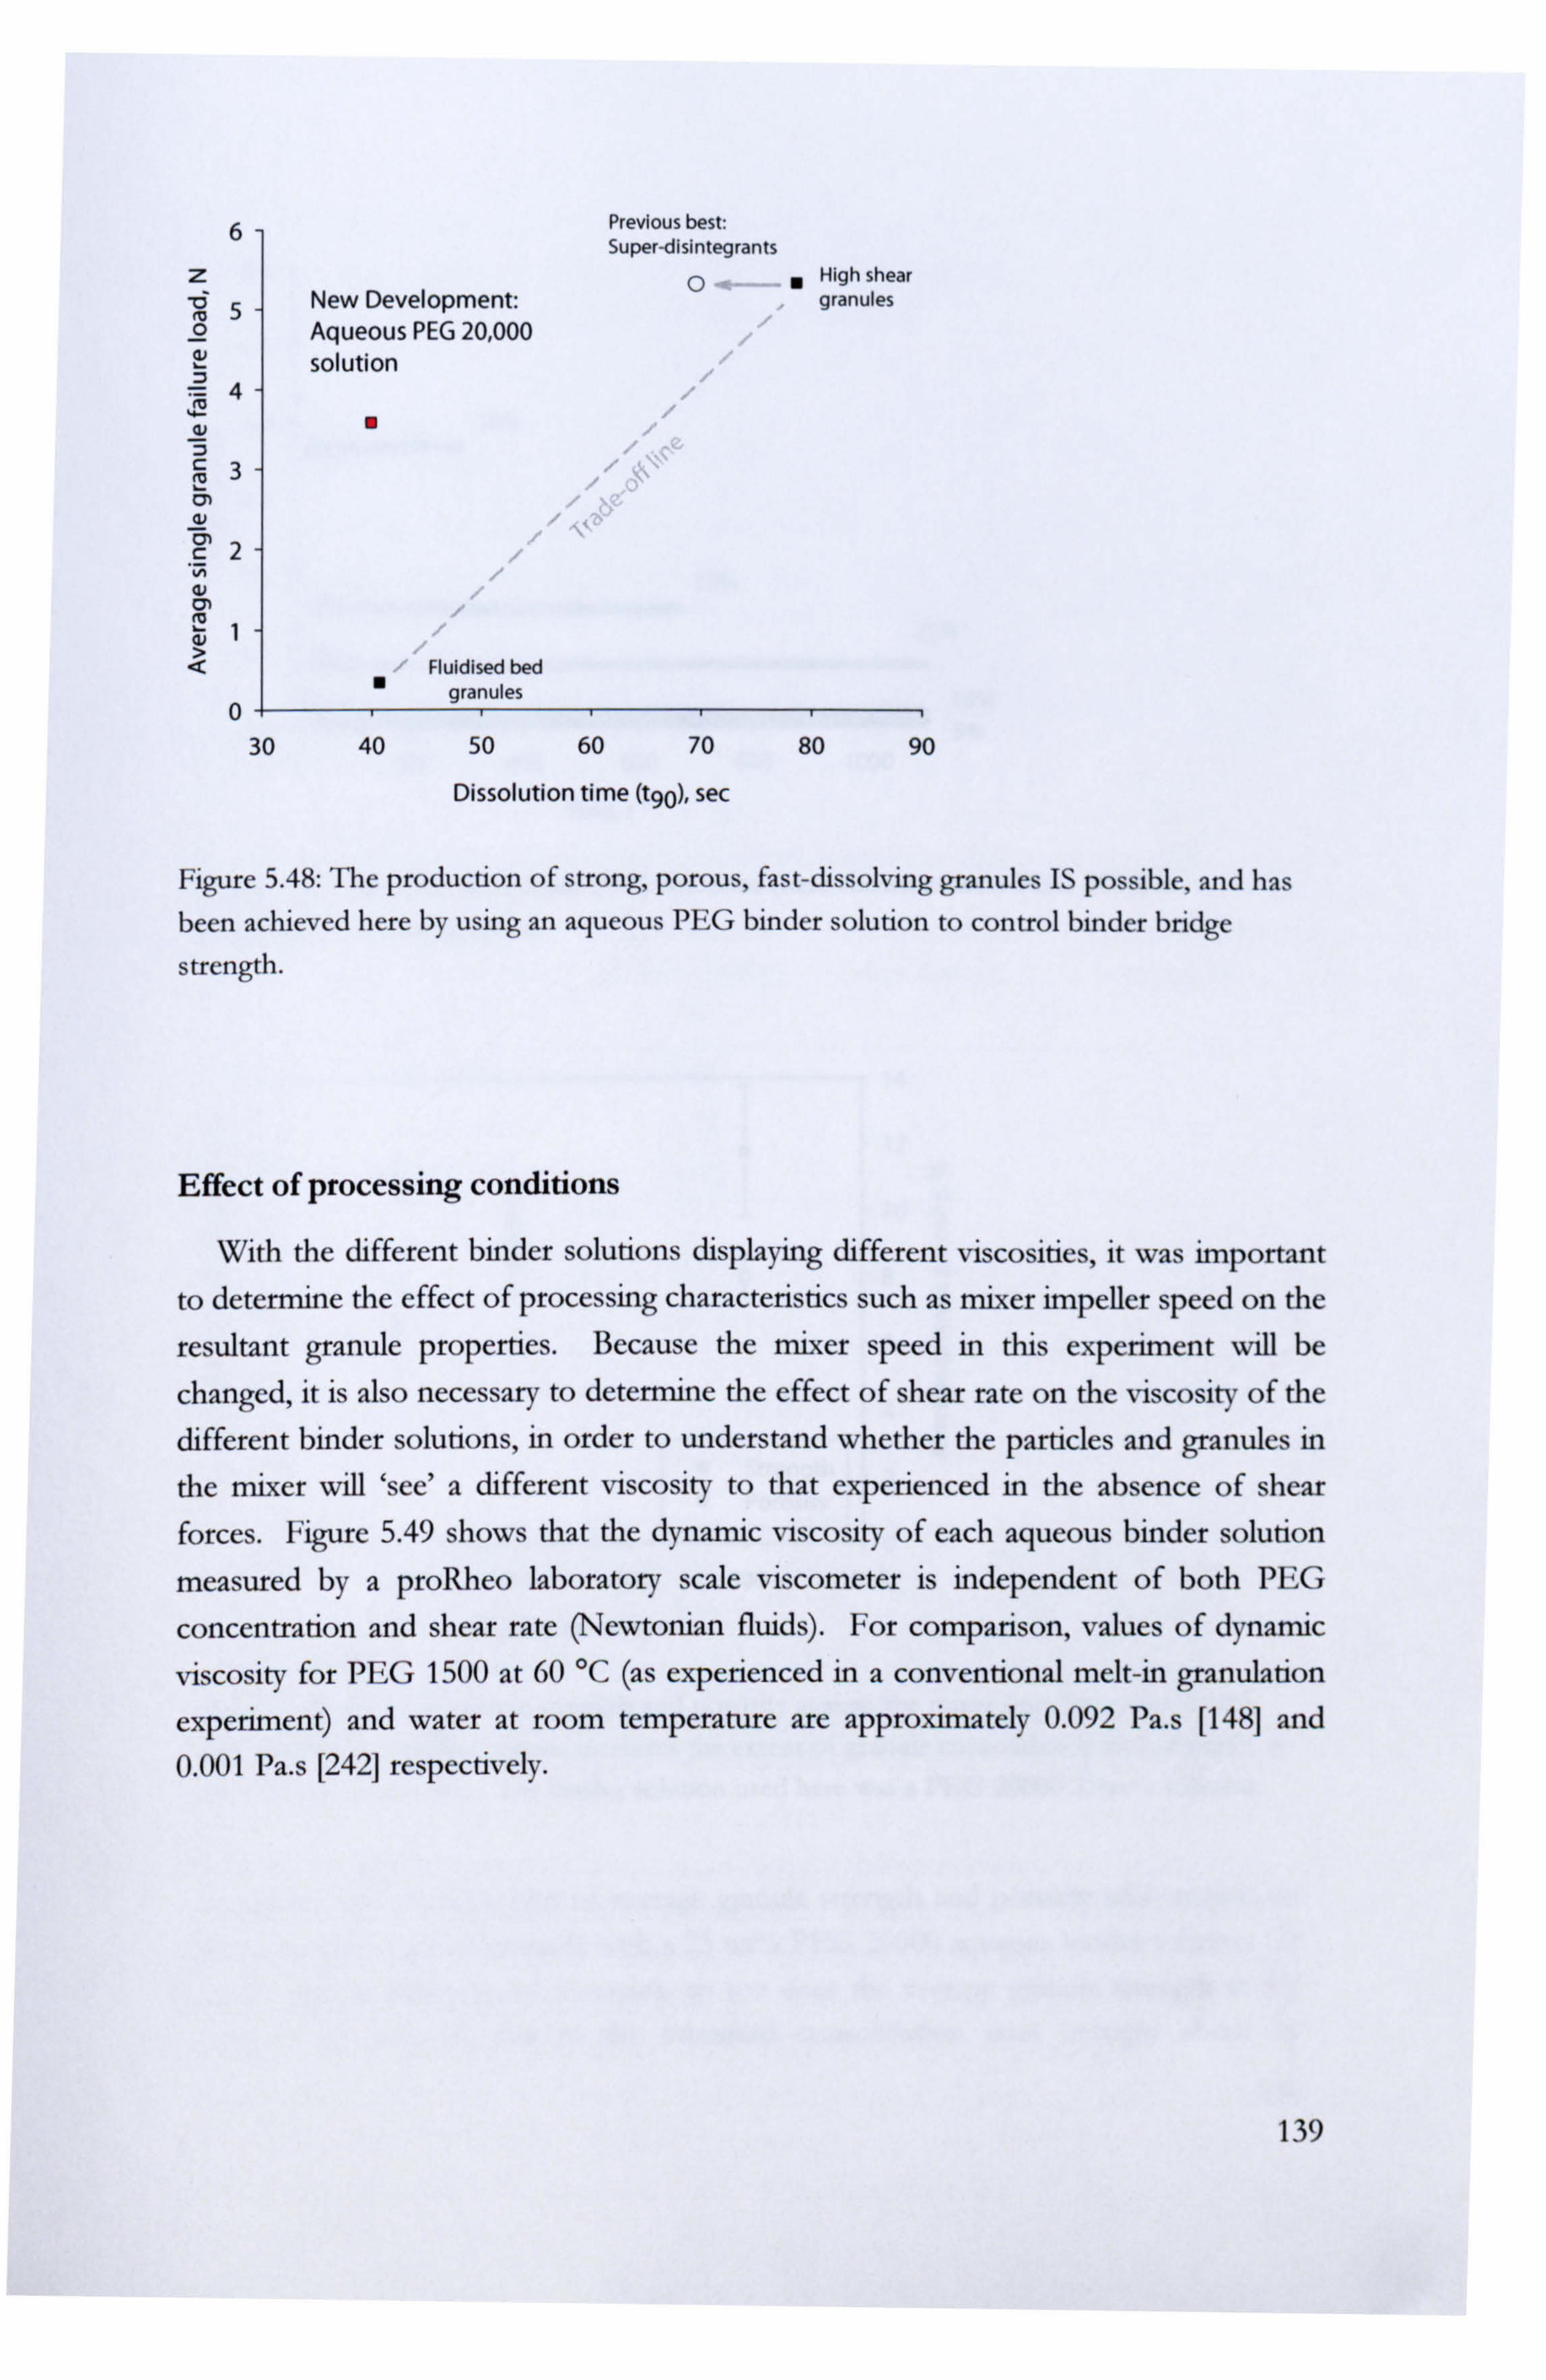
6 Previous best: Super-disintegrants
Z 0" High shear
5 New Development: granules o Aqueous PEG 20,000 2 solution
4
v "
3 rn a, c 2
a rn 1 a,
Fluidised bed " granules
0 30 40 50 60 70 80 90
Dissolution time (t90), sec
Figure 5.48: The production of strong, porous, fast-dissolving granules IS possible, and has
been achieved here by using an aqueous PEG binder solution to control binder bridge
strength.
Effect of processing conditions
With the different binder solutions displaying different viscosities, it was important
to determine the effect of processing characteristics such as mixer impeller speed on the
resultant granule properties. Because the mixer speed in this experiment will be
changed, it is also necessary to determine the effect of shear rate on the viscosity of the different binder solutions, in order to understand whether the particles and granules in
the mixer will `see' a different viscosity to that experienced in the absence of shear forces. Figure 5.49 shows that the dynamic viscosity of each aqueous binder solution
measured by a proRheo laboratory scale viscometer is independent of both PEG
concentration and shear rate (Newtonian fluids). For comparison, values of dynamic
viscosity for PEG 1500 at 60 °C (as experienced in a conventional melt-in granulation
experiment) and water at room temperature are approximately 0.092 Pa. s [148] and 0.001 Pa. s [242] respectively.
139

0.6
0.5
0.4
T 0.3
0 V
0.2
0.1
0.0 15%
5%
0 200 400 600 800 1000
Rate, s'
Figure 5.49: Viscosity of aqueous PEG solutions (here shown as wt° (. PEG 6000) is
independent of mixing speed.
6
z -0 0
34
v
3 m a, c
v1
0
Strength 0 Porosity
14
12
10 .N 0 ö
8a a, c
6 öý
4 'O v Q
2
0 0 200 400 600 800 1000
Impeller speed, rpm
Figure 5.50: Plotting granule strength and porosity against the mixer impeller speed reveals
that increasing impellers speeds increases the extent of granule consolidation and strength, at
the expense of porosity. The binder solution used here was a PEG 20000 25wt° o solution.
Figure 5.50 shows a plot of average granule strength and porosity with respect to
mixer speed for granules made with a 25 wt°jö PEG 20000 aqueous binder solution. It
shows that as mixer speed increases, so too does the average granule strength at the
expense of porosity, due to the increased consohdauon rates brought about by
140

increased shear forces acting on the granules. I'hc trends in strength and porosity with respect to mixer speed are linear, and while granule porosity decreases with increasing
mixer speed, it remains high in high shear granule terms.
Granule failure mode
To investigate the effect of binder content on failure mode, granules with different
binder contents were made by granulating using polyethylene Glycol and water binder
solutions. The binder content could be altered by changing the PEG concentration (PEG wt°%o) in the solution, since the more volatile component (water) was removed
after the granulation by drying in an oven. The resulting properties of these granules
are given in Table 5.15.
Table 5.15: Properties of granules having different binder (PEG 6000) contents.
PEG Average single wt° 0 granule failure load,
N (S. D. )
Water content PEG content Porosity (after (before drying), (after drying), drying), 0/
ý/ 0
15 2.50 (0.56) 8.62 2.1 7.8
35 5.16 (1.14) 6.77 4.8 7.5
100 9.77 (2 28) 0.02 12.2 1.8
A comparison of these granules using a high speed camera to record the failure
pattern reveals that the granule binder content has little or no effect on the failure
mode. Each of the granules shown in Figure 5.51 reveals catastrophic failure by vertical
meridian crack propagation, splitting the granule into two halves. There also appears to be little difference in the particle deformation and contact area prior to failure.
Figure 5.51: Compression of dry granules containing different Polyethylene Glycol binder
contents (Table 5.15) reveals no significant difference in failure mode. Each of the granules fails by meridian crack propagation, splitting the granule into two halves.
141
(a) 1; «t"ýý H vý; H1 ýiýý vvý

Drying method
Drying methods have been compared previously in the literature by Bataille et al. [246], Kleinebudde et al. [116,247] and Bashaiwoldu et al. [248] to name a few. Within the granule drying processes investigated there are two main categories: fast (microwave, freeze-drying) and slow (hot air oven drying, desiccation). In general, these drying processes are focussed on extrusion-spheronization pellets, for which it is
generally reported that the fast drying processes prevent agglomerate shrinkage and result in more porous, weaker structures. Both of the methods investigated here in the drying of granules with an aqueous PEG binder solution are classed as ̀ slow' methods: hot oven and desiccation.
During normal oven or furnace drying at an elevated temperature to drive off the
water (here a temperature of 110°C was used in order to vaporise the water) the PEG
which is left behind as the granule binder melts during the process. It was anticipated that this could have an effect on the resultant granule strength, since the PEG has an
opportunity to move and bonds between particles rearrange during its molten phase.
Z 6
0 aS
a4 75 c
3 v rn c "N 2 C1
i
0
PEG concentration in binder solution, wt%
Figure 5.52: Comparison of volatile removal methods - low humidity (9% RH) atmosphere and hot oven/furnace (110°C). The key difference between these methods apart from speed is that the PEG binder melts during drying in the oven but not in the desiccator.
Granules made with different concentrations of aqueous PEG solutions were dried
using two methods; in a furnace at 110 °C for 2 hours, and in a low relative humidity
atmosphere in a desiccator for 14 days, both in shallow-filled Petri dishes to avoid potential sheltering of granules at the bottom. 14 days was found to be sufficient time for the granules in the desiccator to reach a comparable level of moisture reduction as those having undergone furnace drying and was tested by recording mass loss. Clearly,
142
5 15 25 35 50

during drying in the desiccator, the PEG in the granules has no opportunity to melt and therefore the PEG bridges in these granules form by crystalization of the PEG out of solution.
Granules dried in the furnace generally show higher average single granule strength than those dried at room temperature, although differences between the two are fairly
small (Figure 5.52). Values of standard deviation vary, and are generally seen to increase with increasing PEG content. The exception is granules made with a 50 wt% PEG binder solution, for which there seems to be quite a significant difference in the reported average values, while the standard deviation of the results is comparable. The
structure of drying material bridges (mainly lactose in its various forms) is discussed by Farber and co-workers [19] but they do not compare the morphology with the form
produced by a solidifying polymer, nor do they consider the strength of the bridges.
143

CHAPTER 6
CONCLUSIONS
Current literature suggests that the production of strong, fast dissolving granules is
at the very least non-trivial. It is widely believed that the strength and dissolution
performance of agglomerates is dependent on granule porosity. Porosity provides the means for the dissolution medium to penetrate the agglomerate structure and begin the dissolution process. Porosity is also in effect a measure of the granule saturation state, and so the number of binder bridges able to contribute to the strength of the agglomerate.
However, the effects of granulation process variables on the strength, dissolution
and structure of agglomerates is varied, seemingly depending on the actual materials being used in each case. This means that our Calcium Carbonate/Polyethylene Glycol
system should first be evaluated experimentally with respect to the effect of a range of granulation variables on the resultant granule strength and dissolution time. In order to do this, proper characterisation of the processes and their errors or repeatability statistics is also necessary, in order to be able to distinguish between the error in the
process and the effect of the variable being investigated. The results of the
experimental investigation of granulation variables is summarised in section 6.1 below, followed by the conclusions drawn from the experimental attempts to engineer strong, fast dissolving granules in section 6.2.
To summarise the details of the experimental methods given in chapter 3, the
granulation methods involved in this work were found to be acceptably consistent and repeatable. The tests used to evaluate the performance of the granules made were also found to have very good repeatability and in the case of strength measurement, 20
single granules was found to be more than adequate for a statistically acceptable approximation of the true mean.
144

6.1 Experimental Results
The investigation of the effect of a set of granulation variables on the strength and dissolution performance of the resultant granules revealed some interesting results, which can be broadly split into two categories, depending on whether or not a strength- dissolution time trade-off is displayed.
Variables displaying a clear and distinct trade-off between granule strength and dissolution time include: mixing time, mixing speed, batch binder content, binder
viscosity and primary (or powder) particle size. This trade-off means that the granules produced under different conditions are either strong and slow dissolving or weak and fast dissolving, or somewhere in between. In all of these cases, increasing strength at the expense of increasing dissolution times is a result of decreasing granule binder
content, a result of increased granule consolidation. However, the reasons for this increasing consolidation are varied depending on the parameter being investigated. For
example, increasing mixer speeds results in increased collision forces and therefore increased consolidation rates, while for increased mixing times the consolidation rate remains constant, but there is extended time available for consolidation to take place. In many cases the case for increased consolidation is also supported by reduced granule porosity. The results for other variables are sometimes not so obvious. For example it is thought that increasing the batch binder content increases the lubrication between
particles, thus increasing the consolidation rate. It was also found that increasing the powder particle size results in stronger, slower
dissolving granules. The reasons for this trend, a result which shows the opposite trend to many reported in the literature, are believed to be complex. In general there is believed to be increasing consolidation, but the levels of both granule binder content and granule porosity show no simple trend with increasing particle size. This mix of results seems to be exacerbated at low particle sizes; Durcal 5 shows very high porosity but low binder content, while Durcal 15 gives granules with very high binder content but low porosity.
Granulation batches carried out at different mixer loads revealed that not all granules had to conform to the trade-off brought about by a reduction in porosity. Granules
made in higher mixer loads displayed a small but fairly significant increase in strength (approx 2 N) without any change to the dissolution characteristics. The porosity of these granules was found to be equal, which supports the dissolution results, while there was found to be a decrease in granule binder content with increasing mixer loading. This could be due to increased consolidation forces brought about by the
extra mass involved, however it was also noticed that at higher mixer loads the action of the chopper and the temperature probe (which served to divert the flow of a section
of the material down towards the main impeller) were more pronounced. This would
also mean increased impact forces leading to increased consolidation rates.
145

Similar results were observed for the granules -made at different fluidised bed
temperatures after pre-granulation in a high shear mixer. The increase in strength observed was slightly less significant with a difference of approximately 1.5 N between
the highest and lowest mean failure loads.
In general, then, it appears that the majority of granulation variables serve only to affect the rate or extent of granule consolidation. This consolidation process then leads
to granules with decreasing levels of both porosity and binder content, until a plateau is
reached, at which point particle-particle contacts are the dominant force in resisting further consolidation.
6.2 Product engineering
Several different methodologies were used in trying to break away from the
strength/dissolution trade-off line, including mechanical, structural and chemical. The first of these, which involved a combination of high and low shear granulation
apparatus, proved to be unsuccessful. Granules made using a combination of fluidised
bed and high shear mixer apparatus in various time-based ratios simply resulted in
another trade-off line, with granule strength and dissolution time scaling with time
spent in the high shear mixer. This was found to be due to the increased consolidation rates of the high shear mixer, resulting in decreasing binder content and porosity with high shear mixer time fraction.
The use of several unconventional operational protocols (including stepwise addition of granulation materials into the mixer, control of the granule growth regime through staged powder addition, low granulation temperatures and granules from early granulation times) were all found to fall along the trade-off line in terms of strength and dissolution time.
An investigation of different binder forms including paste, foam and gel was also unsuccessful. Granules made by foam granulation fell along the strength-dissolution trade-off line, while those made by paste and gel granulation fell below the trade-off line and had low strength and long dissolution times.
The use of chemical `active ingredients' was first examined in this work by using Sodium Bicarbonate as a gas-producing agent in an attempt to engineer increased
granule porosity. however, using this method it was found that still a trade-off exists,
although granules having water as the binder were found to display more promising
results. The strength displayed by these water bound granules (mean failure load
approx 2 N) is likely to be enhanced by the dissolution and recrystallisation (on
subsequent drying) of the Sodium Bicarbonate from the water binder. Even so, the
result for these granules gives a strong indication that with careful control of granule
structure a strong, porous and fast dissolving granule is possible.
146

The use of `actives' was further investigated using substances known to the
pharmaceutical industry as Disintegrants. These substances, which swell or change
shape on contact and absorbance of water, are used in drug tablets to aid disintegration
and dissolution, however no previous work has focussed on their effect on the granules (even though granules are commonly used in the tabletting process). Inclusion of a disintegrant (Low-Substituted Hydroxypropyl Cellulose was investigated most thoroughly here) in granulation batches with levels ranging from 1 to 20% revealed interesting results. Up to 5% disintegrant (as a percentage of the total powder amount), granules were found to decrease dissolution time with no consequent loss of strength, and so moving off the trade-off line. However granules made with increasing levels (10
and 20%) of disintegrant were found to lose strength and start to increase dissolution
times again. This is thought to be due to `over-swelling', which causes the formation of
a gel layer of water-saturated disintegrant which prevents further penetration of the
granule core by the dissolution medium. There is therefore an optimum disintegrant
concentration, which was found to be approximately 5% for these granules and the
particular disintegrant used.
A breakthrough was achieved on the discovery that the high shear granulation process is effectively uncontrollable with respect to the resultant granule binder
content, in that granules above a certain size fraction (600 µm) all have the same binder
content, no matter what the level of binder added to the batch at the start of the
process. This prompted the idea of post-granulation binder content control, which was
achieved by the removal of a proportion of the binder from the granules after
granulation. Different batches of granules were made using a two-component binder
(Polyethylene Glycol and water) from which the most volatile component (water) was
removed after the granulation was complete. This enabled direct control of the number
of solid binder bridges and therefore the resultant granule porosity (by varying the
concentration of the Polyethylene Glycol and water solution) and the strength of those bridges (by varying the molecular weight of the Polyethylene Glycol used). Using this
method, and a low concentration of a high molecular weight binder, the production of
strong, fast dissolving granules is possible. A major advantage of this method is that no expensive or sensitive materials are
required, only control of the granule structure through engineering of the solid bridges
and the granule porosity. Using this method, the granule strength is not necessarily dependent on the granule porosity, but the disintegration and dissolution is. It is also conceivable that the results obtained here could be further enhanced by introduction of disintegrants or other dissolution enhancing substances without loss of granule strength.
147

CHAPTER 7
FUTURE WORK
The final section of this thesis considers the limitations of the work done so far and
explores future research options in this area. The most obvious criticism of this work is
that so far it is purely experimental. The development of strong, porous granules by
controlling granule porosity and strength through a two-component binder solution is a prime opportunity for further development through modelling. This could perhaps be
achieved through a modification of Rumpf's [6] or Kendall's [21] model for granular
strength in which the strength is related to the porosity, binding force and constituent
particle size. This would require quantification of the different bridge strengths
provided by different molecular weight polyethylene glycols and their concentration in
an aqueous solution. The strength of individual bridges could be measured
experimentally using a method similar to that of Farber et al. [249] who formed bridges
(on a larger scale) between two glass slides and used a compression strength tester to
pull them apart. A successful model for this system would then enable system
optimisation - ie balancing of the bridge number, strength and porosity and therefore
strength and dissolution. The next step in the optimisation of this system would be to
look at the factors affecting the pore size distribution (which could be investigated
experimentally using mercury porosimetry and/or improved X-ray tomography) which
could then be included in the model discussed previously.
Another criticism of this work lies in the fact that as yet some of the reasons for
observed behaviour are undetermined. The most notable example of this is in the
particle size experiment in chapter 4, which discovered increasing granule strength with
particle size. Reports to date in the literature suggest that the trend should be the
opposite to that observed here, probably largely due to a comparison of solid and liquid
148

binders. However, how the interaction between particle size and solid/liquid binders is
again as yet undetermined.
In a wider scope, it was noted when writing the review of pharmaceutical disintegrants, that little research is done by the pharmaceutical industry on the properties of the granules used prior to tabletting. Since the properties of these
granules presumably have a significant impact on the properties of the resultant tablets, this is surprising. There is also little publicly available literature concerning the type of granule needed to make a `good' tablet, or in other words, how (in terms of mechanism) granule properties affect tablet properties. This area of research has begun
to be addressed, for example by N'Dri-Stempfer et al. [250] who investigated the compression of fluidised bed and high shear granules to produce tablets, and Michrafy
et al. [251] who looked at predicting the tensile strength of tablets using the properties of microcrystalline cellulose and lactose in a direct compression formulation. However, there is still a lot of work to be done in this area, which is still treated as something of a `black box'.
149

APPENDIX A- POWDER SPECIFICATIONS
Calcium Carbonate Data
Supplier Omya, France. Trade name Durcal.
Various grades, numbers indicate median particle size in
microns.
Chemical analysis of CaCO3 98%
raw materials MgCO3 1.5%
Fe203 0.05%
HCl insoluble content 0.3%
Physical properties' Form: Ground crystalline calcium carbonate powder, manufactured from a high purity white marble Stability: Stable Melting point: 825 °C Specific gravity: 2.71
Principal hazards Dust may irritate the eyes
Safe handling Wear safety glasses.
Emergency Eye contact Flush the eye with plenty of water. Skin contact: Wash off with water. If swallowed: Seek medical advice.
Disposal Small amounts of Calcium Carbonate can be disposed of with normal laboratory waste, unless local rules prohibit this.
'Source: Omya product data sheet, Omya AG
150

Cl)
z 0 H U w U W w Cl)
W Q
z aý
Q z w a a
Q 0 U
V U L. 1
U
O ß+
`1 eý A U
U v
H
44 V
ö Oý
t41 d
0
I
0 0 .8 41 Cd o A
0 U
Ü Z. /
0 oA
aý
Q N \ Ln ý ý
9 O
NNO cc cl N iO M
[, ý 2 -' ÖÖÖ . -+ NM .-IN ON O
ý--ý NNN N
N
00 CD en Co N
le 'd Ln r1111111
a '-+ M
Ln ºl Vo
qm cl
CL4 00 vn cn . bam
. 'ý m
O O O O O CD CD CD 1-rl Lo CD CD C> CD en ý ' 0 N Q 0 O 00
O O O C) O O O O CO 0 C) 0 Le)
M o 0 %J
LO Ö Cl% M in t- LO
O O O O O O O
C> 0 CD CD C) C: ) CD CD O O O O 0 N t o - T- pt 0 0
C7
(U x u
u
V
t°
u u 'C O
0 U
U
41
41
O P-4
O
u
O P4 v u N O
N
Ui

APPENDIX C- DISSOLUTION TESTING
The dissolution test is performed by measuring the change in conductivity of 600 ml of distilled water. The impurities (MgCO3) in the calcite powder (see appendix A)
contribute to the increase in conductivity readings observed, and essentially give an indication of the rate of increase of particle surface area as a granule disintegrates. Care
must be taken to ensure that the granules are entered into the water solution immediately after a reading of conductivity has been taken (every 10 seconds), otherwise this could lead to inaccurate results. Since the readings of conductivity also span the small range of 5 to 40 µS/cm, care must also be taken to ensure that the
equipment is clean and rinsed thoroughly with distilled water before each measurement. The conductivity values and profiles for the base powder and binders and a selection of granules is given below.
PEG
5.0
45 E U N
5 4.0
u
cc 0 U 3.5
3.0
time, sec
Fig A: Conductivity profiles for 0.15 g of PEG 1500 and PEG 6000 during dissolution in
water. Very little of the final conductivity reading is contributed to by the PEG component
of a granule.
152
0 50 100 150 200

100 pVo .o
80 0
0 ... 0 ý 60 O
40 od
--f- PEG 1500 20 d 0"" PEG 6000
0
0 50 100 150 200
time, sec
Fig B: Normalised values of the conductivity readings given in the previous figure show that the dissolution of the PEG is measureable, but that there is some error in the readings at these low values of conductivity, approximately ± 10%, or ± 0.4 µS/cm.
Durcal (calcium carbonate)
50
40 ö d. n a-n as-n"aam as as an
E ar°ý
=. 30
� -- S Durcal 5 ä 20 0 ..... Durcal 15 v ---"--- Durcal40
-°-d -"" Durcal 65 10
0 0 50 100 150 200 250 300
time, sec
Fig C: Conductivity readings for 1.0 g of the Durcal powders indicates that a smaller particle size gives a slightly higher conductivity reading, due to increased exposure (surface area) of the MgC03 impurity per unit mass. The conductivity of the distilled water at around 4.5
µS/cm is shown previous to the insertion of the powder.
153

120
100
80
0 60 0 le
40
20
0 0
0 Durcal5 o"" "" Durcal15
--v- Durcal 40 - -a - Durcal 65
50 100 150 200 250
time, sec
Fig D: Normalised values for each grade of Durcal plotted against time reveals that the
smaller powders dissolve slightly faster than larger powders due to their particle size. Normalisation is done by calculating the percentage difference between the lowest value (that
of the distilled water) and the largest value (obtained by 3 or 4 consecutive identical readings).
Granules: Durcal size
50
40 00000000000.0.000.00
p3 ý E 30
" d ý
20 Qc -"- Durcal 5
ý ""°.... 0. """°. Durcal15 ü
iý ---r-- Durcal40
10 - -o - Durcal 65
0 0 50 100 150 200 250 300
time, sec
Fig E: Conductivity profiles for 1g of granules in the size range 1-1.4 mm composed of different grades of Durcal and PEG 1500. In this case, the conductivity is additionally
affected by granule composition, structure, size and shape.
154

120
100
80 p
0 60 LIN ö
40 !ý
20
50
+ Durcal5
" ". o... """ Durcal 15 Durca140
- °d - Durcal 65
100 150 200 250 300
time, sec
Fig F: Normalising the values above to give a% value allows us to compare the results of
each set of granules fairly against each other. From this data it is evident that granule dissolution time scales with particle size.
155

APPENDIX D- STATISTICAL ANALYSIS
Compression Strength Data
Data given here represents a statistical analysis (ANOVA - analysis of variance) with respect to several granulation experiments. This statistical analysis was performed on the compression strength data (failure load, N) of 20 single granules for each variable measured. This analysis was performed to test whether two or more values of mean failure load are in fact significantly different.
The comparison algorithm used in this case was that of Tukey, which is one of several tests which can be used to determine which means amongst a set of means differ from
the rest. If there were only two groups of results then a simple t-test could be used, but for more than two groups the correct method to use is a one-way analysis of variance (ANOVA). If the ANOVA concludes that there is evidence that the means of the populations differ, the Tukey multiple comparison test can be used to compare the difference between each pair of means with appropriate adjustment for multiple testing. The results are presented as a p-value or a confidence interval [252].
Mixer load
60
Failure load by mixer load n Mean SD SE
1 2 4.261 0.81 0.1823
2 2 4.73 0.992 0.2218
3 2 6.111 1.04 0.2341
Source of variation SS DF MS F
mixer load 36.977 2 18.48 20.21
Within cell 52.14 5 0.91
Total 89.122 5
Tukey
Contras Difference 95% Cl
1v2 -0.472 -1.200 to 0.255
1v3 -1.85 -2.578 to -1.123 (significant) 2v3 -1.37 -2.106 to -0.650 (significant)
<0.0001
Fig G: One-way ANOVA of mixer load strength results reveals that 1 kg and 2 kg when
compared with the values for 3 kg are significantly different, but that the difference between
the mean failure loads of 1 kg and 2 kg are not significantly different.
156

Binder content
nj 80
failure displacement b)
binder content
10
12
14
16
Source of
binder content Within cell
10v12
10v14
10v16
12v14
12v16
14v16
an SD SE
0.0836 0.0268 0.00600
0.104 0.028 0.00638
0.121 0.014 0.00331
0.126 0.049 0.01113
DF I MSa IF
7.15 0.0003
0.08 7 0.00111
0.1031 7
Tukey
'ence 95% Cl
-0.0204 -0.0474 to 0.0066
-0.037 -0.0649 to -0.0108 (significant)
-0.043 -0.0700 to -0.0160 (significant)
-0.017 -0.0445 to 0.0096
-0.022 -0.0496 to 0.0044
-0.0051 -0.0322 to 0.0219
Fig H: A one-way ANOVA for granules made with different binder contents reveals that the
strength results for 10% binder are significantly different to the means of both 14 and 16%
binder. The other results have means which are too close when compared to each other to be declared statistically different, based on a 95% confidence interval.
157

REFERENCES
1. Ascanio, G., P . J. Carreau, and P. A. Tanguy, High-. peed roll coating with complex rheologyfluids Experiments in Fluids, 2006. V40(1): p. 1-14.
2. Crowley, M. M., et al., Physicochemical properties and mechanism of drug release fmm
ethyl cellulose matrix tablets pm pared by direct compression and hot-melt extrusion. International Journal of Pharmaceutics, 2004.269(2): p. 509-522.
3. Farber, L., G. Tardos, and J. N. Michaels, Use of X-ray tomography to study the porosity and morphology ofgranules. Powder Technology, 2003.132(1): p. 57-63.
4. Iveson, S. M., J. D. Litster, Fundamental studies of granule consolidation: Part 2. Quanting the effects of particle and binder properties. Powder Technology, 1998. 99: p. 243-250.
5. Iveson, S. M., et al., Nucleation, growth and breakage phenomena in agitated wet granulation processes: a review. Powder Technology, 2001.117(1-2): p. 3-39.
6. Rumpf, H. The Strength of Granules and Agglomerate , in Agglomeration - Proceedings of the First International Symposium on Agglomeration. 1962. Philadelphia: Wiley Interscience.
7. Fu, J., et al., Impact deformation and rebound of wet granules. Powder Technology, 2004.140(3): p. 248-257.
8. Bika, D. G., M. Gentzler, and J. N. Michaels, Mechanical properties of agglomerates. Powder Technology, 2001.117(1-2): p. 98-112.
9. Coury, J. R. and M. L. Aguiar, Rupture of dry agglomerates Powder Technology, 1995.85(1): p. 37-43.
10. Jaeger, J. C., Failure of rocks under tensile conditions International Journal of Rock Mechanics and Mining Science & Geomechanics Abstracts, 1967. 4(2): p. 219-227.
11. Wynnyckyj, J. R., The correlation between the strength factor and the true tensile strength of agglomerate spheres Canadian Journal of Chemical Engineering, 1985.63(4):
p. 591-597. 12. Yoshikawa, H. and T. Sata, Measurement of tensile strength of granular brittle
materials. Scientific Papers of the Institute of Physical and Chemical Research, 1960.54: p. 389-393.
13. Salman, A. D., et al., Impact breakage of fertiliser granules Powder Technology, 2003.130(1-3): p. 359-366.
14. Adams, M j., M. A. Mullier, and J. P. K. Seville, Agglomerate strength measurement using a uniaxial confined compression test. Powder Technology, 1994.78: p. 5-13.
15. Ennis, B j., et al., The influence of viscosity on the strength of an axially strained pendular liquid bridge. Chemical Engineering Science, 1990.45(10): p. 3071- 3088.
16. Pietsch, W., Size Enlargement byAgglomeration. 1991, New York: Wiley. 17. Shinohara, K., Chapter 4, in Handbook of Powder Science and Technology, M. E.
Fayed and L. Otten, Editors. 1997, Chapman & Hall. p. 119-120. 18. Tardos, G. I. and R. Gupta, Forces generated in solidifying liquid bridges between two
. small particle... Powder Technology, 1996.1: p. 29-35. 19. Farber, L., G. I. Tardos, and J. N. Michaels, Evolution and structure of drying
material bridges of pharmaceutical excipients: studies on a microscope slide. Chemical Engineering Science, 2003.58(19): p. 4515-4525.
158

20. Tardos, G. I., et al., Morphology and strength development in solid and solidi interparticle bridges in granules of pharmaceutical powders, in Handbook of Particle Breakage, A. D. Salman and M. Ghadiri, Editors. 2007, submitted to Elsevier, 02 2007.
21. Kendall, K., Agglomerate strength. Powder Metallurgy, 1988.31: p. 28-31. 22. Chan, S. Y., N. Pilpel, and D. C. -H. Cheng, The tensile strengths of . ringle powders
and binary mixtures. Powder Technology, 1983.34(2): p. 173-189. 23. Kapur, P. C., Balling and Granulation. Adv in Chem Eng, 1978.10: p. 55-123. 24. Cheng, D. C. -H., The tensile strength of powders. Chemical Engineering Science,
1968.23(12): p. 1405-1420. 25. Holm, P., T. Schaefer, H. G. Kristensen, Granulation in high-speed mixers: Part
V. Powder consumption and temperature changes during granulation. Powder Technology, 1985.43: p. 213-223.
26. Griffith, A., Philosophical Transactions of the Royal Society of London Series A 221. 1921: p. 163-198.
27. Newitt, D. M., Conway Jones, J. M., A contribution to the theory and practice of granulation. Trans. I. Chem. Eng., 1958.36: p. 422-441.
28. York, P., Rowe, R. C. Monitoring granulation site enlargement processes using mincer torque rheomety. in First International Particle Technology Forum. 1994. Denver, USA.
29. Iveson, S. M., J. D. Litster, and B . J. Ennis, Fundamental studies of granule consolidation Part 1: Effects of binder content and binder viscosity. Powder Technology, 1996.88(1): p. 15-20.
30. Kapur, P. C. and D. W. Fuerstenau, A coalescence model for granulation. I&EC Process Design Development, 1969.8: p. 56-62.
31. Sastry, K, S. Panigraphy, and D. Fuerstenau, Effect of wet grinding and dry grinding on the batch balling behaviour of particulate materials. Trans. Soc. Mining Engineers, 1977.262: p. 325-330.
32. Holm, P., et al., Granulation in high speed mixers: Part 1. Effects of process variables during kneading. Pharm. Ind., 1983.45: p. 806-811.
33. Holm, P., T. Schaefer, and H. G. Kristensen, Granulation in high-speed mixers Part V. Power consumption and temperature changer during granulation. Powder Technology, 1985.43(3): p. 213-223.
34. Ritala, M., P. Holm, T. Schafer, H. G. Kristensen, Influence of liquid bonding strength on power consumption during granulation in a high shear mixer. Drug Dev. Ind. Pharm., 1988.14: p. 1041-1060.
35. Schafer, T., Holm, P., Kristensen, H. G., Comparison between granule growth in a horizontal and a vertical high speed mixer. I. Granulation of dicalcium phosphate. Arch. Pharm. Chemi, Sci. Ed., 1986.14: p. 209-224.
36. Oulahna, D., et al., Wet granulation: the effect of shear ongranule pmpertier. Powder Technology, 2003.130(1-3): p. 238-246.
37. Ouchiyama, N. and T. Tanaka, Pmbability of coalescence in granulation kinetics. Ind Eng Chem Process Des Dev, 1975.14(3): p. 286-289.
38. Sherrington, P j-, The granulation of sand as an aid to understanding fertilizer
granulation. The relationsh p between liquid phase content and average granule rile. Chem. Eng., 1968Quly/August): p. CE201-CE215.
39. Ganderton, D. and B. M. Hunter, A comparison of granules prepared by pan
granulation and by massing and screening J. Pharm. Pharmacol, 1971(23): p. 1-10.
159

40. Samimi, A., et al., Effect of structural characteristics on impact breakage of agglomerates Powder Technology, 2003.130(1-3): p. 428-435.
41. Schaefer, T., et al., Granulation in different typen of high speed mixers: Part 2. Comparisons between mixers. Pharm. Ind., 1987.49: p. 297-304.
42. Schaefer, T., et al., Melt pelletiZation in a high shear mixer. V. Effects of appartus variables European Journal of Pharmaceutical Sciences, 1993.1(3): p. 133- 141.
43. Vertommen, J. and R. Kinget, The influence of five selected processing and formulation variables on the particle site distribution and friability of pellets produced in a mtaryprocessor. Drug Dev Ind Pharm, 1997.23: p. 39-46.
44. Kinget, R. and R. Kernel, Preparation and properties of granulates containing solid dispersions. Acta Pharmaceutica Technologica, 1985.31: p. 57-62.
45. Hoornaert, F., et al., Agglomeration behaviour of powders in a Lodige mixer granulator. Powder Technology, 1998.96(2): p. 116-128.
46. Eliasen, H., H. G. Kristensen, T. Schafer, Growth mechanisms in melt agglomeration witha low viscosity binder. Int. J. Pharm., 1999.186: p. 149-159.
47. Schafer, T., Melt agglomeration with polyethylene ycols in high shear mixers, in Department of Pharmaceutics 1997, The Royal Danish School of Pharmacy. Copenhagen.
48. Schaefer, T., Growth mechanisms in melt agglomeration in high shear mixers. Powder Technology, 2001.117: p. 68-82.
49. Fu, J. S., et al., An experimental study, of the variability in the properties and quality of wetgranules. Powder Technology, 2004.140(3): p. 209-216.
50. Schafer, T., Holm, P., Kristensen, H. G., Melt granulation in a laboratory scale high shear mixer. Drug Dev. Ind. Pharm., 1990.16: p. 1249-1277.
51. Johansen, A. and T. Schaefer, Effects of interactions between powderparticle site and binder viscosity on agglomerate growth mechanisms in a high shear mixer. European Journal of Pharmaceutical Sciences, 2001.12(3): p. 297-309.
52. van den Dries, K., et al., Granule breakage phenomena in a high shear mixer, influence of process and formulation variables and consequences on granule homogeneity. Powder Technology, 2003.133(1-3): p. 228-236.
53. Iveson, S. M., J. D. Litster, B j. Ennis, Fundamental studies ofgranule consolidation: Part 1. Effects of binder viscosity and binder content. Powder Technology, 1996.88: p. 15-20.
54. Kristensen, H. G., P. Holm, T. Schcfer, Mechanical properties of moist agglomerates in relation to granulation mechanisms: Part 1. Deformability of moist, densified agglomerates. Powder Technology, 1985.44: p. 227-238.
55. Rumpf, H., in The Strength of Granules and Agglomerates, W. A. Knepper, Editor. 1962, Interscience: New York. p. 379-418.
56. Schubert, H., Tensile strength of agglomerates Powder Technology, 1975.11(2): p. 107-119.
57. Iveson, S. M. and J. D. Litster, Liquid-bound granule impact deformation and coefficient of restitution. Powder Technology, 1998.99(3): p. 234-242.
58. Ennis, B . J., G. Tardos, and R. Pfeffer, A micmlevel-based characterization of granulation phenomena. Powder Technology, 1991.65(1-3): p. 257-272.
59. Keningley, S. T., P. C. Knight, and A. D. Marson, An investigation into the effects of binder viscosity on agglomeration behaviour. Powder Technology, 1997.91(2): p. 95-103.
160

60. Schaefer, T. and C. Mathiesen, Melt pelletiZation in a high shear mixer. VIII. Effects of binder viscosity. International Journal of Pharmaceutics, 1996.139(1 - 2): p. 125-138.
61. Knight, P. C. and J. P. K. Seville, Effect of binder viscosity on agglomeration processes, in World Congress on Particle Technology 3.1998, paper no. 118.
62. Ritala, M., 0. Jungersen, P. Holm, T. Schafer, H. G. Kristensen, A comparison between binders in the wet phase ofgranulation in a high shear mixer. Drug Dev. Ind. Pharm., 1986.12: p. 1685-1700.
63. Lian, G., M j. Adams, and C. Thornton, Elastohydrodynamic collisions of solid spheres Journal of Fluid Mechanics, 1996.311: p. 141-152.
64. Eliasen, H., T. Schaefer, and H. Gjelstrup Kristensen, Effects of binder rheology on melt agglomeration in a high shear mixer. International Journal of Pharmaceutics, 1998.176(1): p. 73-83.
65. Capes, C. and P. Danckwerts, Granule formation by the agglomeration of damp powders. Part I: the mechanism ofgranulegrowth. Trans. I. Chem. Eng., 1965.43: p. T116-T124.
66. Golchert, D., N. D. 2003, University of Queensland, Australia. 67. Golchert, D., et al., Effect of granule morphology on breakage behaviour during
compression. Powder Technology, 2004.143-144: p. 84-96. 68. Subero, J. and M. Ghadiri, Breakage patterns of agglomerates. Powder
Technology, 2001.120(3): p. 232-243. 69. Subero, J., D. Pascual, and M. Ghadiri, Production of agglomerates of well-defined
structures and bond properties using a novel technique. Chemical Engineering Research and Design, Transactions of the Institute of Chemical Engineers, Part A, 2000.78(1): p. 55-60.
70. Holm, P., et al., Granulation in high speed mixers. Part 1. Effects of process variables during kneading. Pharmaceutical Industry, 1983.46: p. 97-101.
71. Knight, P. C., et al., An investigation into the kinetics of liquid distribution and growth in high shear mixer agglomeration. Powder Technology, 1998.97(3): p. 246-257.
72. Wauters, P. A. L., et al., liquid distribution as a means to describing the granule growth mechanism. Powder Technology, 2002.123(2-3): p. 166-177.
73. Tan, H. S., A. D. Salman, and M . J. Hounslow, Kinetics of fluidised bed melt granulation III: Tracer studies. Chemical Engineering Science, 2005.60(14): p. 3835-3845.
74. Waldie, B., Growth mechanism and the dependence ofgranule site on the dm 'p
site in fluidized-bed granulation. Chemical Engineering Science, 1991.42: p. 2781- 2785.
75. Wauters, P. A. L., et al. Batch and continuous drum granulation of copper concentrate: the influence of binder content and binder distribution. in Control of Particulate Processes W. 1999. Fraser Island, Australia.
76. Schaefer, T., C. Mathiesen,, Melt pelktiZation in a high shear mixer. IX. Effects of binderparticle site. Int. J. Pharm., 1996.139: p. 139-148.
77. Schaefer, T., et al., Melt pelletiration in a high shear mi. wr. Part in Effects of process variables in a laboratory scale mixer. European Journal of Pharmaceutical Sciences, 1993.1: p. 125-131.
78. Holm, P., Effect of impeller and chopper design on granulation in a highspeed mixer. Drug Development and Industrial Pharmacy, 1987.13: p. 1675-1701.
79. Knight, P. C., Structuring agglomerated products for improved performance. Powder Technology, 2001.119(1): p. 14-25.
161

80. McLeod, A. S., S. Bordia, and L. F. Gladden, Interface roughening during the dissolution ofporous media. Europhysics Letters (EPL), 1999.46: p. 571-576.
81. Levenspiel, 0., Chemical reaction engineering. 2nd ed. 1972, New York: John Wiley and Sons.
82. Chebli, C. and L. Cartilier, Cross-linked cellulose as a tablet excipient: A binding/disintegrating agent. International Journal of Pharmaceutics, 1998. 171(1): p. 101-110.
83. Devay, A., et al., Investigation on drug dissolution and particle characteristics of pellets related to manufacturing process variables of high-shear granulation. Journal of Biochemical and Biophysical Methods, 2006.69(1-2): p. 197-205.
84. Adebayo, S. A., E. Brown-Myrie, and O. A. Itiola, Comparative disintegrant activities of bread
. fruit starch and official corn starch. Powder Technology, 2007. In
Press, Corrected Proof. 85. British Pharmacopoeia. Vol. 1&2.1998: HMSO, London. 86. Bolhuis, G. K, K. Zuurman, and G. H. P. to Wierik, Improvement of dissolution of
poorly soluble drugs by solid deposition on a super disintegrant. II. The choice of super disintegrants and effect of granulation. European Journal of Pharmaceutical Sciences, 1997.5(2): p. 63-69.
87. Dhumal, R. S., et al., Evaluation of a drug with wax-like properties as a melt binder. Acta Pharm., 2006.56: p. 451-46 1.
88. Alvarez-Lorenzo, C., et al., Evaluation of low-substituted hydro. ye propV4, elluloses (L- HPCs) as filler-binders for direct compression. International Journal of Pharmaceutics, 2000.197(1-2): p. 107-116.
89. Ishikawa, T., et al., Preparation of rapidly disintegrating tablet using new types of microcystalline cellulose (PH M series) and low substituted hydroxypropylcellulose or . rßherical sugargranules by direct compression method Chem. Pharm. Bull., 2001.49: p. 134-139.
90. Souto, C., et al., A comparative study of the utility of two superdirintegrants in microcystalline cellulose pellets prepared by extrusion-sßheroniZation. European Journal of Pharmaceutics and Biopharmaceutics, 2005.61(1-2): p. 94-99.
91. Albertini, B., et al., Characterization and taste-masking evaluation of acetaminophen granules: comparison between diffe nt pre aration methods in a high -shear mixer. European Journal of Pharmaceutical Sciences, 2004.21(2-3): p. 295-303.
92. Corveleyn, S. and J. P. Remon, Formulation and production of rapidly disintegrating tablets by lyophilisation using hydmchlorothia jde as a model drug. International Journal of Pharmaceutics, 1997.152(2): p. 215-225.
93. Corveleyn, S. and J. P. Remon, Formulation of a lyophilitied dry emulsion tablet for the delivery of poorly, soluble drugs. International Journal of Pharmaceutics, 1998. 166(1): p. 65-74.
94. Keleb, E. I., et al., Continuous twin screw extrusion for the wet granulation of lactose. International Journal of Pharmaceutics, 2002.239(1-2): p. 69-80.
95. Keleb, E. I., et al., Twin screw granulation as as mple and efficient tool for continuous wet granulation. International Journal of Pharmaceutics, 2004.273(1-2): p. 183-194.
96. Passerini, N., et al., Preparation and characterisation of ibuprofen poloxamer 188 granules obtained by melt granulation. European Journal of Pharmaceutical Sciences, 2002.15(1): p. 71-78.
162

97. Song, B., S. L. Rough, and D. I. Wilson, Effects of drying technique on extrusion- sphemnisation granules and tablet properties. International Journal of Pharmaceutics, 2007.332(1-2): p. 38-44.
98. Perissutti, B., et al., Formulation design of carbamaZepinefast-release tablets prepared by melt granulation technique. International Journal of Pharmaceutics, 2003. 256(1-2): p. 53-63.
99. Bajpai, AX and A. Giri, Water sorption behaviour of highly swelling (wrboxy metylcellulose g polyacrylamide) bydmgelc and release of potassium nitrate as agrochemical. Carbohydrate Polymers, 2003.53(3): p. 271-279.
100. Chateau, M: E., et al., Processing a detergent powder formulation: Direct compression, and high shear wet granulation followed by compres ion. Powder Technology, 2005. 157(1-3): p. 191-198.
101. Kok, P J. A. H., Development and description of controlled release formulations for use in powder detergents, in Industrial Pharmacy. 2000, University of Groningen: Groningen. p. 166.
102. Ansari, M. A. and F. Stepanek, The eject of granule miavstnicture on dissolution rate. Powder Technology, 2007. In Press, Corrected Proof.
103. Cowley, A. C., et al., Measurement of repulsive forces between charged phospholipid bilayers. Biochemistry, 1978.17(15): p. 3163-3168.
104. Alvarez-Lorenzo, C., et al., Interactions between hyda pmpyhcelluloses and vapour/liquid water European Journal of Pharmaceutics and Biopharmaceutics, 2000.50(2): p. 307-318.
105. Shih, S. -M., J: P. Lin, and G: Y. Shiau, Dissolution rates of limestones of di/Jerrnt sources. Journal of Hazardous Materials, 2000.79(1-2): p. 159-171.
106. Ohno, I., et al., Importance of evaluating the consolidation ofgranuks manufactured by high shear mixer. International Journal of Pharmaceutics, 2007. In Press, Corrected Proof: p. 78.
107. Inghelbrecht, S. and J. P. Remon, Roller compaction and tableting of microgystalline cellulose/drug mixtures International Journal of Pharmaceutics, 1998.161(2): p. 215-224.
108. Heertjes, P. M. and W. C. Witvoet, Some aspects of the wetting of powders: Powder Technology, 1969.3: p. 339-343.
109. Levresse, P., et al., Observation and analysis of the infiltration of liquid polymerr in Calcium Carbonate agglomerates. Powder Technology, 1999.106: p. 62-70.
110. van Veen, B., et al., The effect of powder blend and tablet structure on drug release mechanisms of hydrophobic stanch acetate matrix tablets. European Journal of Pharmaceutics and Biopharmaceutics, 2005.61(3): p. 149-157.
111. Adolfsson, A. and C. Nystrom, Tablet strength, porosity, elasticity and solid statt structure of tablets compassed at high loads International Journal of Pharmaceutics, 1996.132(1-2): p. 95-106.
112. Carl, F., et al., The effect of compression on the capillary microstnecture of tablets Journal of Pharmacy and Pharmacology, 1981.33(3): p. 129-135.
113. Cavallari, C., et al., Improved dissolution behaviour of steamgranulated piro. cam. European Journal of Pharmaceutics and Biopharmaceutics, 2002.54(1): p. 65-73.
114. Schenck, L., et al. Application of correlation between granuk porosity and tablet dissolution to process development and scale-up of u'etgranulated fonrrulations in RAPS 2004 Annual Meeting 2004. Baltimore, USA.
163

115. Stepanek, F., Computer-aided product design: granule dissolution. Chem. Eng. Res. Des., 2004.82: p. 1458-1466.
116. Kleinebudde, P., Shrinking and swelling properties of pellets containing microcy rtalline cellulose and low substituted hydmxypropylcellulose: II. Swelling properties International Journal of Pharmaceutics, 1994.109(3): p. 221-227.
117. Young, C. R., J . J. Koleng, and J. W. McGinity, Production of spherical pellets by a hot-melt extrusion and spheroniZation process. Int. J. Pharm., 2002.242: p. 87-92.
118. Riippi, M., et al., Dependence between dissolution rate and poro. rity of compressed erythromycin acistrate tablets. European Journal of Pharmaceutics and Biopharmaceutics, 1998.46(2): p. 169-175.
119. Ferrero, C., et al., Disintegrating fcieny of croscarmellose sodium in a direct compression formulation. International Journal of Pharmaceutics, 1997.147(1): p. 11-21.
120. Selmeczi, B. and G. G. Kedvessy, Study of the influence of some new additives on the phyrical properties of tablets. Acta Pharma Hung., 1970.40: p. 124-127.
121. Borzunov, E. E. and S. M. Shevchenko, Role of starch in the mechanism of tablet disintegration. Farm. Zh., 1967.22: p. 45-48.
122. Fox, C. D., et al., Microcystalline cellulose in tabletting Drug Cosmet. Ind., 1974. 92: p. 258-261.
123. Koizumi, K., et al., New method of preparing high porosity rapidly saliva . voluble compressed tablets using mannitol with camphor, a subliming material International Journal of Pharmaceutics, 1997.152: p. 127-131.
124. Stanley-Wood, N. G. and M. S. Shubair, The variation of the surface topography of granules under compression with degree of binder addition. Powder Technology, 1980.25(1): p. 57-64.
125. Holman, L. E., The compaction behaviour ofparticulate materials. An elucidation based
on percolation theory. Powder Technology, 1991.66(3): p. 265-280. 126. Steendam, R., et al., Plastidsation of amylodextrin by moisture., Consequences for drug
release from tablets International Journal of Pharmaceutics, 2000.204(1-2): p. 23-33.
127. Stanley-Wood, N. G. and M. E. Johanson, Variation of intra- and interparticle pore ritt' with degree of compaction. Analyst, 1980.105: p. 1104-1112.
128. Westermarck, S., et al., Pore structure and surface area of mannitol powder, granules and tablets determined with meraiy porosimety and nitrogen adsorption. European Journal of Pharmaceutics and Biopharmaceutics, 1998.46(1): p. 61-68.
129. Alais, C. and G. Linden, Food Biochemistry. 1991, New York: Ellis Horwood. 130. Katikaneni, P. R., et al., Ethylcellulose matrix controlled release tablets of a water-
soluble drug. International Journal of Pharmaceutics, 1995.123(1): p. 119-125. 131. Katikaneni, P. R., et al., Consolidation of ethylcellulose: Effect of particle ske, press
speed, and lubricants. International Journal of Pharmaceutics, 1995.117(1): p. 13-21.
132. Upadrashta, S. M., et al., Compressibility and compactibility properties of ethylcellulore. International Journal of Pharmaceutics, 1994.112(2): p. 173-179.
133. Edwards, M. F. and T. Instone, Particulate products-their manufacture and use. Powder Technology, 2001.119(1): p. 9-13.
134. Wells, J. I. and C. V. Walker, The influence of granulating fluids upon granule and tablet properties: the role of secondary binding. International Journal of Pharmaceutics, 1983.15(1): p. 97-111.
164

135. Juppo, A. M. and J. Yliruusi, Effect of amount of granulation liquid on total pore volume and pore site distribution of lactose, glucose and manitol granules. European Journal of Pharmaceutics and Biopharmaceutics, 1994.40: p. 299-309.
136. Schaefer, T. and C. Mathiesen, Melt pelletiZation in a high shear mixer. VI1. Effects of product temperature. International Journal of Pharmaceutics, 1996. 134(1-2): p. 105-117.
137. Beekman, W j., et al., Failure mechanism determination for industrial granules using a repeated compression test. Powder Technology, 2003.130(1-3): p. 367-376.
138. Iveson, S. M. and N. W. Page, Brittle to Plastic Transition in the Dynamic Mechanical Behavior of Partially Saturated Granular Material: Transactions of the ASME. Journal of Applied Mechanics, 2004.71: p. 470-475.
139. Mullier, M. A., J. P. K. Seville, and M . J. Adams, A fracture mechanics approach to the breakage of particle agglomerates Chemical Engineering Science, 1987.42(4): p. 667-677.
140. Mullier, M. A., J. P. K. Seville, and M . J. Adams, The effect of agglomerate strength on attrition duringpmcessing. Powder Technology, 1991.65(1-3): p. 321-333.
141. Pierrot, P. and H. S. Coram, Tensile strength of wet granular materials. Powder Technology, 1997.91(2): p. 83-93.
142. Naito, M., et al., Microscopic analysis on the consolidation pmcess of granule beds. Powder Technology, 1998.95(3): p. 214-219.
143. Heckel, R. W., Density pressure relationship in powder compaction. Transaction of the Metallurgical Society of AIME, 1961.221: p. 671-675.
144. Kawakita, K. and K. -H. Ludde, Some considerations on powder compression equations. Powder Technology, 1971.4(2): p. 61-68.
145. Shinohara, K., C. E. Capes, and A. E. Fouda, A theoretical model of the effect of distributed loading on the tensile strength of agglomerates as measured in the diametral
compression test. Powder Technology, 1982.32(2): p. 163-171. 146. Pitchurnani, R., et al., Measurement and characterization of particle strength using a
new robotic compression tester. Powder Technology, 2004.143-144: p. 56-64. 147. Yashima, S., et al., Kagaka Kogaku, 1973.37: p. 1218 (in Japanese). 148. Scott, A. C., M . J. Hounslow, and T. Instone, Direct evidence of heterogeneit, y during
high-shear granulation. Powder Technology, 2000.113(1-2): p. 205-213. 149. Reynolds, G. K., et al., Non-uniformity of binder distribution in high-shear
granulation. Powder Technology, 2004.140(3): p. 203-208. 150. Kuno, H. and J. Okada, The compaction process and deformability of granules.
Powder Technology, 1982.33(1): p. 73-79. 151. Thornton, C., D . J. Barnes, Computer simulated deformation of compact granular
assemblies. Acta Mechanica, 1986.64: p. 45-61. 152. Denny, P . J., Compaction equations. " a comparison of the Heckel and Kawakita
equations. Powder Technology, 2002.127(2): p. 162-172. 153. Samin-d, A., A. Hassanpour, and M. Ghadiri, Single and bulk compressions of soft
granules: Experimental study and DEM evaluation. Chemical Engineering Science, 2005.60: p. 3993-4004.
154. Samimi, A., Characterisation of Deformation and Breakage of Agglomerates, in PhD Thesis. 2003, University of Surrey.
155. Bashaiwoldu, A. B., F. Podczeck, and J. M. Newton, Application of dynamic
mechanical analysis (DMA) to determine the mechanical pmperties of pellets. International Journal of Pharmaceutics, 2004.269(2): p. 329-342.
165

156. Berggren, J., G. Frenning, and G. Alderborn, Compression behaviour and tablet- fornring ability of sßray dried amorphous composite particles. European Journal of Pharmaceutical Sciences, 2004.22(2-3): p. 191-200.
157. Heckel, R. W., An analysis of powder compaction phenomena. Trans. Metall. Soc. AIME, 1961.221: p. 1001-1008.
158. Tsuwa, H. and Y. Aketa, Seimitsukikai Japan, 1963.29: p. 945. 159. Nishihara, T., T. Kohori, and T. Tani, Collection Trans. Mech. Japan, 1954.
20: p. 208. 160. Shapiro, I. and I. M. Kolthoff, J. Phys. Colloid. Chem., 1947.51: p. 483-493. 161. Michrafy, A., J. A. Dodds, and M. S. Kadiri, Wall friction in the compaction of
pharmaceutical powders: measurement and effect on the density distribution. Powder Technology, 2004.148(1): p. 53-55.
162. Briscoe, B J. and S. L. Rough, The effects of wall friction in powder compaction. Colloids and Surfaces A: Physicochemical and Engineering Aspects, 1998. 137(1-3): p. 103-116.
163. Roberts, R . J. and R. C. Rowe, The compaction of pharmaceutical and other model materials -a pragmatic approach. Chemical Engineering Science, 1987.42(4): p. 903-911.
164. Frenning, G., F. Fichtner, and G. Alderborn, A new method for characteritirng the release of drugs from single agglomerates. Chemical Engineering Science, 2005. 60(14): p. 3909-3918.
165. Siegmund, C. and H. Leuenberger, Pen olation theory, conductivity and dissolution of hydrophilic suppository bases (PEG systems). International Journal of Pharmaceutics, 1999.189(2): p. 187-196.
166. Binks, A. E. and A. Sharples, Electrical conduction in olefin oxide polymers. J. Polymer Science, 1968.6: p. 407-420.
167. Allen, T., Particle size measurement: surface area and pore site determination. 5th cd. Vol. 1.1996, London: Chapman & Hall. 552.
168. Hinckley, J., et al., Voidage of ferrous sinter beds- new measurement technique and dependence on feed characteristics Int. J. Mineral Processing, 1994.41: p. 53.
169. Gabbott, I. P., et al. Improvement of strength and dissolution of two phasegranules in 8th International Symposium on Agglomeration. 2005. Bangkok, Thailand.
170. Barrera-Medrano, D., et al. Application of x-ray tomography to the descri ption of single granules. in 8th International Symposium on Agglomeration. 2005. Bangkok, Thailand.
171. Bouwman, A. M., et at, The effect of the amount of binder liquid on the granulation mechanisms and structure of microcrystalline cellulose granules prepared by high shear granulation. International Journal of Pharmaceutics, 2005.290(1-2): p. 129- 136.
172. Flannery, B. P., et at, Thome-dimenrional X-ray micmtomography. Science, 1987. 237: p. 1439-1444.
173. Wellington, S. L. and HJ. Vinegar, X-ray computed tomography. J. Pet. Technol., 1987: p. 885-898.
174. Eliasen, H., H. G. Kristensen, and T. Schaefer, Growth mechanisms in melt agglomeration with a low viscosity binder. International Journal of Pharmaceutics, 1999.186(2): p. 149-159.
175. Sherington, P. and R. Oliver, Granulation. 1981, London: Heyden.
166

176. Schaefer, T., P. Holm, and H. Gjelstrup Kristensen, Meltpelletitiation in a high shear mixer. I. Effects of process variables and binder. ACTA PHARM. NORD., 1992.4(3): p. 133-140.
177. Vialatte, L., Mecanismes de granulation. application a la granulation par agitation mlcanique, in PhD Thesis. 1998, Universit de Technologie de Compiegne.
178. Iveson, S. M., J. D. Litster, Growth regime map for liquid-bound granules. AIChE, 1998.44: p. 1510-1518.
179. Kristensen, H. G., P. Holm, and T. Schaefer, Mechanical properties of moist agglomerates in relation to granulation mechanisms part I. Deformability of moist, densifred agglomerates. Powder Technology, 1985.44(3): p. 227-237.
180. Clariant-GmbH. Polyalkylene/Polyethylene Glycol. [Product information leaflet] Clariant GmbH, Division Functional Chemicals.
181. Bolhuis, G. K,, et al., On the mechanism of action of modern disintegrants. Acta Pharm. Technol., 1982.28: p. 111-114.
182. Fujii, M., et al., Preparation, characterization, and tableting of a solid dispersion of indomethacin with crospovidone. International Journal of Pharmaceutics, 2005. 293(1-2): p. 145-153.
183. Chang, R. -K, et al., Evaluation of the disinlegrant properties for an experimental, crosslinked polyalkylammonium polymer. International Journal of Pharmaceutics, 1998.173(1-2): p. 87-92.
184. Airaksinen, S., et al., Excipient selection can sign jcantly affect solid-state phase transformation in formulation during wet granulation. Pharm. Sci. Tech, 2005(In Press, corrected proof).
185. Joshi, H. N. and T. D. Wilson, Calorimetric studies of dissolution of hydroxypropyl methylcellulose E5 (HPAMC ES) in water. J Pharm Sci, 1993.82(10): p. 1033-8.
186. Kawashima, Y., et al., The effects of particle ü e, degree of hydroaypropyl substitution and moisture content of low substituted hydmxypropylcellulose on the compactability of acetaminophen and the drug release rate of the resultant tablets. S. T. P. Pharma. Sci, 1993.3: p. 170-177.
187. Kawashima, Y., et al., Pulverized low-substituted hydro gpropylcellulose and miemcgstalline cellulose modified with hydroxypropyl methylcellulose as a sustained drug release matrix base for direct tabletting Chin. Pharm. J., 1994.46(Taipei): p. 1-31.
188. Selkirk, A. B. and D. Ganderton, The influence of wet and dry granulation methods on the pore structure of lactose tablets. J Pharm Pharmacol, 1970: p. Suppl: 86S+.
189. Lopez-Solis, J. and L. Villafuerte-Robles, Eject of disintegrants with dijerent hygroscopicity on dissolution of Norfloxacin/Pharmatose DCL 11 tablets. International journal of Pharmaceutics, 2001.216(1-2): p. 127-135.
190. Finkenstadt, V. L. and J. L. Willett, A direct-cunt resistance technique for determining moisture content in native starches and starch-based plasticized material. Carbohydrate Polymers, 2004.55(2): p. 149-154.
191. Wade, A. and P . J. Weller, Handbook of Pharmaceutical Eacipients. 1994, Washington, USA: American Pharmaceutical Association.
192. Gordon, M. S., et al., The effect of aging on the dirsolution of wet granulated tablets containing super disintegrantr. International Journal of Pharmaceutics, 1993. 97(1-3): p. 119-131.
193. Johnson, J. R, et al., Effect of formulation solubility and hygroscopicity on distntegrant ecien y in tablets pnparted by wet granulation, in terms of dissolution. J. Pharm. Sci., 1991.80(5): p. 469-471.
167

194. Weidmann, G. and M. Buggy, Composite Materials, in Structural Materials, G. Weidmann, P. Lewis, and N. Reid, Editors. 1996, Butterworth-Heinemann Ltd: Oxford. p. 308-347.
195. Borgquist, P., et al., A model for the drug release firm a polymer matrix tablet--effects of swelling and dissolution. Journal of Controlled Release, 2006.113(3): p. 216- 225.
196. Kudela, V., in Encyclopedia of Polymer Science and Engineering. 1987, Wiley, New York. p. 783-807.
197. Harada, T., et al., Synthesis, swelling behavior and surface microstructure ofpoly(sodium acrylate) gels cross-linked by aluminum ions. European Polymer journal, 2005. 41(9): p. 2189-2198.
198. Diez-Pena, E., I. Quijada-Garrido, and J. M. Barrales-Rienda, On the water swelling behaviour of poly(N-isopropylacrylamide) [P(N-iPAAm)], poly(methacrylic acid) [P(M)J, their random copolymers and sequential interpenetrating polymer networks (IPNs). Polymer, 2002.43(16): p. 4341-4348.
199. Kokufuta, E. Biochemo-mechanical gels, in Gel Technologies. in Gel technology. 1997. Tokyo, Japan: Science Forum Inc.
200. Linden, H. J. v. d., et al., Stimulus-sensitive hydrogels and their applications in chemical (micro)analysis Analyst, 2003.128: p. 325-331.
201. Evmenenko, G., et al., Swelling-induced structure changes of polyelectroll to gels. Polymer, 1999.40(11): p. 2975-2979.
202. Zhang, R., Synthesis, characterization and reversible transport of thermo-sensitive carboxyl methyl dextran/poly (N-isopropylacrylamide) hydrogeL Polymer, 2005. 46(8): p. 2443-2451.
203. Ni, C. and X. -Y, Zhu, Synthesis and swelling behavior of thermosensi ive hydrogels based on N-substituted acylamides and sodium acrylate. European Polymer Journal, 2004.40(6): p. 1075-1080.
204. Bae, Y. H., et al., Thermo-sensitive polymers as on-off switches for drug release. Die Makromolekulare Chemie, Rapid Communications, 1987.8(10): p. 481-485.
205. Dong, L. -C. and A. S. Hoffman, Synthesis and application of thermally reversible beterogels for drug delivery. Journal of Controlled Release, 1990.13(1): p. 21-31.
206. Xia, X., et al., Swelling and mechanical behavior of poly(N-isopropylacrylamide)/Na- montmorillonite layered silicates composite gels. Polymer, 2003.44(11): p. 3389- 3393.
207. Motonaga, T. and M. Shibayama, Studies on pH and temperature dependence of the dynamics and heterogeneities in poly(N-isopropylacylamide-co-sodium acrylate) gels. Polymer, 2001.42(21): p. 8925-8934.
208. Omidian, H., J. G. Rocca, and K. Park, Advances in superpomus hydrogell. Journal of Controlled Release, 2005.102(1): p. 3-12.
209. Chen, J., H. Park, and K. Park, Synthesis of superporous hydrogels: hydrogels with fast swelling and superabsorbent properties J Biomed Mater Res, 1999.44(1): p. 53-62.
210. Kabiri, K, et al., Synthesis offast-swelling superabsorbent hydrogel :" effect of crosslinker type and concentration on porosity and absorption rate. European Polymer Journal, 2003.39(7): p. 1341-1348.
211. He, J., K. Horie, and R. Yokota, Characterization ofpolyimidegels crosslinked with hexamethylene diisocyanate. Polymer, 2000.41(13): p. 4793-4802.
212. Malay, K, K. Ghosh, and L. Mittal, Poyimides: Fundamentals & Applications. 1996, New York: Marcel Dekker.
168

213. He, J., et al., Preparation of end-crosslinked polyimide gels with high moduli. Polymer, 2001.42(9): p. 4063-4072.
214. Panda, A., H. Mohan, and S. Sabharwal, Pulse and gamma radiolysis studies of 3- sulfo pmpyl methaoylate in aqueous solutions. Radiation Physics and Chemistry, 2001.62(4): p. 317-324.
215. Raghunath, S., M. H. Rao, and K. N. Rao, Radiation initiated polymerisation of phenyl methacylate. Radiation Physics and Chemistry (1977), 1983.22(6): p. 1011-1022.
216. Sabharwal, S., et al., Mechanism of N-butyl acylate sensitization action in radiation vulcanization of natural rubber latex. Radiation Physics and Chemistry, 1998. 51(3): p. 309-315.
217. Hron, P., et al., Silicone rubber-hydrogel composites as polymeric biomaterials : IX. Composites containing powdery polyacglamide hydrogel Biomaterials, 1997.18(15): p. 1069-1073.
218. Hoffman, A. S., A. Afrassiabi, and L. C. Dong, Thermally reversible hydagelr: II. Delivery and selective removal of substances from aqueous solutions. Journal of Controlled Release, 1986.4(3): p. 213-222.
219. Freitas, R. F. S. and E. L. Cussler, Temperature sensitive gels as extraction solvents Chemical Engineering Science, 1987.42(1): p. 97-103.
220. Champ, S., W. Xue, and M. B. Huglin, A novel semi-automated apparatus to concentrate aqueous polymer solutions with a thermosen ritive hydrogel Polymer, 2001. 42(15): p. 6439-6445.
221. Dong, L. C. and A. S. Hoffman, Therrrmally, reversible hydrogelr: " III. Immobilitiation of enzymes for feedback traction control. Journal of Controlled Release, 1986.4(3): p. 223-227.
222. Monji, N. and A. S. Hoffman, A novel immunoassay system and bioseparation process based on thermal phase separating polymers. Applied Biochemistry And Biotechnology, 1987.14(2): p. 107-120.
223. Xue, W., M. B. Huglin, and T. G. J. Jones, Swelling and network parameters of crosslinked thermorzversible hydrogell of poly(N-ethylacylamide). European Polymer Journal, 2005.41(2): p. 239-248.
224. Johnson, B. D., D . J. Beebe, and W. C. Crone, Effects of swelling on the mechanical properties of a pH-sensitive hydrogel for use in micmfluidic devices Materials Science
and Engineering. C, 2004.24(4): p. 575-581. 225. Koob, T . J. and D j. Hernandez, Mechanical and thermal properties of novel
polymerized NDGAgelatin hydrogelr. Biomaterials, 2003.24(7): p. 1285-92. 226. Khare, A. R. and N. A. Peppas, Swelling/deswelling of anionic copolymer gels.
Biomaterials, 1995.16(7): p. 559-567. 227. Colombo, P., et al., Swellable matrices for controlled drug delivery: gel-layer behaviour,
mechanisms and optimal performance. Pharmaceutical Science & Technology Today, 2000.3(6): p. 198-204.
228. Mulhbacher, J., P. Ispas-Szabo, and M. A. I`iateescu, Cmss-linked high amylose starch derivatives for dnrg release: II. Swelling properties and mechanistic study. International Journal of Pharmaceutics, 2004.278(2): p. 231-238.
229. Sen, M. and 0. Guven, Determination of solubility parameter of poly(n-vinyl 2- pyrmlidon/ethylene glycol dimethacrylate) gels by swelling measurements. Journal of Polymer Science, Part B: Polymer Physics, 1998.36(2): p. 213-219.
230. Mukae, K, et al., Swelling of poly(N-isopropylacrylamide) gels in water-almho! (0- C4) mixed solvents. J. Phys. Chem., 1993.97(3): p. 737-741.
169

231. Nishida, M., Y. Uraki, and Y. Sano, Lignin gel with unique swelling properly. Bioresource Technology, 2003.88(1): p. 81-83.
232. Hou, X. and K. S. Siow, Novel interpenetrating polymer network electrolytes Polymer, 2001.42(9): p. 4181-4188.
233. Scranton, A. B., B. Rangarajan, and J. Klier, Biomedical applications of polyelectrolytes Adv. Polym. Sci, 1995.122: p. 1-54.
234. Gehrke, S. H., Synthesis, equilibrium swelling kinetics, permeability and applications of environmentally-responsivegelr. Adv. Polym. Sci, 1993.110: p. 81-144.
235. Yang, Y. and J. B. F. N. Engberts, Stimuli irsponse of polysoap hydrogels in aqueous solution and DC electric fields Colloids and Surfaces A: Physicochemical and Engineering Aspects, 2000.169(1-3): p. 85-94.
236. Kim, J. -E., et al., The effect of poreformers on the controlled release of cefadroxil from a polyurethane matrix. International Journal of Pharmaceutics, 2000.201(1): p. 29-36.
237. Feller, S. E., R. M. Venable, and R. W. Pastor, Computer Simulation of a DPPC Phospholzpid Bilqyer. Structural Changes as a Function of Molecular Surface Area. Langmuir, 1997.13(24): p. 6555-6561.
238. Rand, R. P. and V. A. Parsegian, Hydration forces between phospholipid bi/qyers Biochimica et Biophysica Acta (BBA) - Reviews on Biomembranes, 1989. 988(3): p. 351-376.
239. Rand, R. P. and V. A. Parsegian, Structure and Dynamics of Membranes, in Handbook of Biological Phyrics. 1995. p. 643-690.
240. Jendrasiak, G. L. and J. H. Hasty, The hydration of phospholipids. Biochimica et Biophysica Acta (BBA) - Lipids and Lipid Metabolism, 1974.337(1): p. 79- 91.
241. Jendrasiak, G. L., R. L. Smith, and W. Shaw, The water adsorption characteristics of charged phospholipidr. Biochimica et Biophysica Acta (BBA) - Biomembranes, 1996.1279(1): p. 63-69.
242. Parsegian, V . A. and R. Podgornik, Surface tension suppression of lamellar swelling on solid substrates. Colloids and Surfaces A: Physicochemical and Engineering Aspects, 1997.129-130: p. 345-364.
243. Loosley-Millman, M. E., R. P. Rand, and V. A. Parsegian, Elects of monovalent ion binding and screening on measured ekctrnstatic forces between charged phospholipid bilayers. Biophysical Jou. rnal, 1982.40(3): p. 221-232.
244. Member, M. W. N. and E. R. Morris, Solubility, solution rheology and salt-induced gelation of welan polysaccharide in organic solvents. Carbohydrate Polymers, 1995. 27(1): p. 23-36.
245. Liley, P. E., et al., Physical and chemical data, in Pe»y's Chemical Engineers' Handbook, D. W. Green and J. O. Maloney, Editors. 1999, McGraw-Hill. p. 2-322.
246. Bataille, B., et al., Study of the influence of spheronisation and drying conditions on the physico-mechanical prnperties of neutral spheroids containing Avicel PH 101 and lactose. Drug Dev Ind Pharm, 1993.19: p. 653-671.
247. Kleinebudde, P., Shrinking and swelling properties of pellets containing micmcystalline cellulose and low substituted hydmaypmpylcellulose: I. Shrinking properties. International Journal of Pharmaceutics, 1994.109(3): p. 209-219.
248. Bashaiwoldu, A. B., F. Podczeck, and J. M. Newton, A study on the effect of drying techniques on the mechanical properties of pellets and compacted pellet. European Journal of Pharmaceutical Sciences, 2004.21(2-3): p. 119-129.
170

249. Farber, L., G. I. Tardos, and J. N. Michaels, Micm-mechanical properties of drying
material bridges of pharmaceutical excipientr. International Journal of Pharmaceutics, 2005.306(1-2): p. 41-55.
250. N'Dri-Stempfer, B., et al., Binder granulation and compaction of coloured powders. Powder Technology, 2003.130(1-3): p. 247-252.
251. Michrafy, A., et al., Predictions of tensile strength of binary tablets using linear and power law mixing rules. International Journal of Pharmaceutics, 2007.333(1-2): p. 118-126.
252. Altman, D. G., Practical statistics for medical research. 1991, London: Chapman
and Hall.
171