
Year 2008-‐2010 - White Rose eTheses Online
358
Submitted for the degree of MD Year 20082010 Role of Computational Fluid Dynamics in the Analysis of Haemodynamic and Morphological Characteristics of Intracranial Aneurysms Pankaj Singh MBBS, MS, MRCS Departments of Cardiovascular Sciences, Medical Physics & Neurosurgery Royal Hallamshire Hospital, University of Sheffield Sheffield UK, S10 2JF LOG
-
Upload
khangminh22 -
Category
Documents
-
view
3 -
download
0
Transcript of Year 2008-‐2010 - White Rose eTheses Online

08 Fall
S u b m i t t e d f o r t h e d e g r e e o f M D
Year 2008-‐2010
Role of Computational Fluid Dynamics in the Analysis of Haemodynamic and Morphological Characteristics of Intracranial Aneurysms
Pankaj Singh MBBS, MS, MRCS Departments of Cardiovascular Sciences, Medical Physics & Neurosurgery Royal Hallamshire Hospital, University of Sheffield Sheffield UK, S10 2JF
LOGO


2
Contents
List of Abbreviations 3 List of Figures & Illustrations 4 List of Tables 7 Acknowledgements 9 Ethical Approvals 11 Abstract 12 Awards 14 Publications/ Abstracts/ Presentations 15 Chapter-1 Summary 21 Chapter-2 Review of Literature 29
Introduction 29 Materials and Methods 30 Understanding the Natural History and Aetiopathogenesis of Intracranial Aneurysms 30 Importance of Haemodynamic Factors 43 Management of Intracranial Aneurysms: the History of a Paradigm Shift 48 Computational fluid dynamics: the concept and need 59 How Long We Have Come So Far: A Focused Review of Literature of the Studies Published
on the Application of Computational Fluid Dynamics in the Field of Intracranial Aneurysms 62
Conclusions 78 Chapter-3 Materials & Methods 79 Introduction 79 Project @neurIST 69 Ethical Approvals 81 Recruitment of Patients 81 Data Collection and Organization 85 Software @neuFuse 87 Boundary Conditions used in different studies: Measured and 1D model 96 Statistical analysis 98 Designing and Performing Different CFD Studies 98 Chapter-4 Validation of the Common Concepts used in Computational Fluid Dynamics 99 Introduction 99 Effects of Different Velocity Profiles on the Haemodynamics of Intracranial Aneurysms 100 Effects of Measured vs. Modelled Boundary Conditions on the Haemodynamics of
Intracranial Aneurysms 120
Overall conclusions form this section 139 Chapter-5 Evaluations and Controlled Exposures of @neuFuse Tool-chain 140 Introduction 140 The role of computational fluid dynamics in the management of unruptured intracranial
aneurysms: a clinicians’ view 142
Background and Objectives 142 Material and methods 143 Results 148 Discussion 155 Conclusions 161 Appendix-1 162 Chapter-6 Computational Fluid Dynamics as a Tool to Explore the Aetipathogenesis of
Intracranial Aneurysms 165
Introduction 165 Effects of changing blood viscosity on computed wall shear stress and oscillatory shear index
at the site of intracranial aneurysm formation 167
Analysis of Different Haemodynamic Factors During Initiation and Rupture of an Intracranial Aneurysm and Possible Influence of Low Molecular Weight Heparin Mediated Change in the Blood Viscosity on Computed Values of These Haemodynamic Factors
180
The Effects of Aortic Coarctation on Cerebral Haemodynamics and its Possible Role in the Aetiopathogenesis of Intracranial Aneurysms
192
Chapter-7 Conclusions & Future Work 213 Chapter-8 References 216

3
SAH Subarachnoid hemorrhage POD Para-operational Device IA Intracranial Aneurysms TCVC Therapeutic transcatheter vessel-
occlusion UIAs Unruptured IAs GDC® Guglielmi detachable coils
CFD Computational Fluid Dynamics DMSO Dimethyl sulpoxide WSS Wall Shear Stress CAP Cellulose acetate polymer BCs Boundary Conditions TIAs Transient Ischemic Attacks BV Blood Viscosity ROI Region of Interest CoA Coarctation of Aorta VMTK Vascular Modeling Toolkit OSI Oscillatory Shear Index GAMBIT Geometry and Mesh Building
Intelligent Toolkit MRI Magnetic Resonance Imaging TCD Transcranial Doppler MRA Magnetic Resonance Angiogram LDV Laser Doppler Velocimetery MRFD Magnetic Resonance Fluid
Dynamics NA Not Available
pc-MR phase contrast MR CoW Circle of Willis NMR Nuclear Magnetic Resonance TOF Time-Of-Flight
3DRA 3 Dimensional Rotational
Angiography MIP Maximum intensity projections
DSA Digital Subtraction Angiogram CRIM Clinically Relevant Information Model
CTA CT Angiogram ANSYS®-ICEM™
Ansys CFD Software
ROI Region of Interest ANSYS®-CFX™
Ansys CFD Software
AVM Arteriovenous Malformations GB Gigabyte APKD Adult Polycystic Kidney Disease MB Megabyte EDRF Endothelial Derived Relaxation
Factors RAM Random Access Memory
ATP Adenosine triphosphate CAM-application
Computer-aided medicine-application
ICA Internal Carotid Artery IT system Information Technology system MCA Middle Cerebral Artery iNOS Inducible N2O synthase ACA Anterior Cerebral Artery eNOS Endothelial N2O synthase AComA Anterior Communicating Artery MABP Mean Arterial BP PComA Posterior Communicating Artery JAG Juxta apical groove BA Basilar Artery MMP-13 Matrixmetalloproteneases-13 PCA Posterior Cerebral Artery NO Nitric oxide PICA Posterior Inferior Cerebellar Artery t-pa Tissue plasminogen activator SCA Superior Cerebellar Artery ISUIA International Study of Unruptured
Intracranial Aneurysms CCA Common Carotid Artery ISAT International Subarachnoid
Aneurysm Trial AbCoA Abdominal Aortic Coarctation CT Computed Tomographic
LIST OF ABBREVIATIONS

4
PAGE Chapter-1 None Chapter-2 Figure-2.1: The common anatomical locations for IAs in cerebral vasculature. (Source: http://www.usmle-forums.com)
32
Figure-2.2: Graphs showing the average size of aneurysms at the time of rupture during follow-up (left) and the average aneurysm size as function of patient age (right). For high mean growth rates almost all aneurysms rupture in the first 40 years of follow-up but small rupture rates indicate towards the nonlinear pattern of the growth. Source: Koffijberg et al J Neurosurg 2008
39
Figure-2.3: Showing the intra-aneurysmal flow pattern inside an aneurysm before and after the growth. (Source: Tateshima et al)
40
Figure-2.4: Showing the endothelial cells losing their normal alignment when exposed to abnormally low WSS. (Source: Malek et al JAMA)
43
Figure-2.5: Thomas Willis (Source:http://www.accu-chek.com) 49 Figure-2.6: John Hunter (Source:http://citizenscientistsleague.com) 50 Figure-2.7: Sir Victor Horsley (Source: Medscape) 50 Figure-2.8: Walter Dandy (Source: Medscape) 50 Figure-2.9: Temporal Evolution of different surgical modalities Neurosurg Focus, 2006, © AANS
51
Figure-2.10: GDC® Detachable coils. Source: http://synapse.koreamed.org 57 Figure-2.11: Claude Navier -Source: Medscape 59 Figure-2.12: Equations for Poiseuille’s parabolic velocity profile Source: universe-review.ca
60
Figure-2.13: Discretization and generation of polygonal mesh in a pipe flow fluid region
61
Chapter -3 Figure-3.1: Project @neurIST 79 Figure-3.2: @neuQuest GUI (Graphical User Interface) 85 Figure-3.3: @neuQuest GUI –Data Collection 85 Figure-3.4: @neuBrowser- showing graphical representation of data 86 Figure-3.5: @neuFuse Software architecture 87 Figure-3.6: @neuFuse CFD processing toolchain. Form top right clockwise: DICOM images ate loaded and the vessel geometry segmented. Then a topologically correct geometric model is processed to extract vessel Centre line (axis). This information is then used to map 3D vessels with a 1D circulatory model. This mapping allows deriving flow boundary conditions for haemodynamic model.
89
Figure-3.7: Operation workflow from medical image to haemodynamic results. A) Orthoslice visualization of the 3DRA medical image in @neuFuse. B) Visualisation of the extracted vessel surface. C) Visualisation of reduced region of interest with location of inlet and outlet openings. D) 1D circulation model. E) Visualisation of predicted streamlines. F) Visualisation of predicted wall shear stress.
90
Figure-3.8: A snapshot of 3D volume generation, segmentation and clipping of the ROI
91
Figure-3.9: A typical example of geometric healing where an artifact (a) and (b)“kissing vessels” can cause distortion of real geometry due to lack of the image resolution. Two close vessels are glued together by the reconstruction algorithm, but in reality they are separate
92
LIST OF FIGURES & ILLUSTRATIONS
5
Figure-3.10: Process of defining the centre line and Skeletonization 93 Figure-3.11: Application of BCs at the inlets and outlets using 1D Model dictionary 94 Figure-3.12: Visualization of haemodynamic simulation in @neuFuse. On top right, flow particle tracing erythrocytes are animated according to the velocity field. On top left picture, streamlines represented with pressure-coded colouring. In the bottom left picture, WSS drawn on the vessel wall. On bottom right, complex visualization showing streamlines crossing an arbitrary plane coloured according a colour-code where red regions represent inward flow whilst represent outward flow regions.
95
Chapter -4 Figure-4.1: Representation in one of @neurIST application suites of a typical cerebral arterial tree, with locations of geom.1, geom.1b, geom.2, and geom.3 indicated by white spheres and black arrows.
101
Figure-4.2: Reconstructed geometries: geom.1, basilar artery aneurysm, geom.1b, basilar artery aneurysm including vertebral arteries, geom.2, internal carotid artery aneurysm, geom3, middle cerebral artery aneurysm. Black arrows show secondary smaller aneurysms, excluded from the study. Labels indicate the openings where boundary conditions were applied.
103
Figure-4.3: Flow-rate (top) and pressure waveforms (bottom) applied in geom.1 106 Figure-4.4: Flow-rate (top) and pressure waveforms (bottom) applied in geom.1 107 Figure-4.5: Flow-rate (top) and pressure waveforms (bottom) applied in geom.1 108 Figure-4.6: Flow-rate (top) and pressure waveforms (bottom) applied in geom.1 109 Figure-4.7: Velocity contours across the aneurysmal sac for a) Womersley BC at lowest Re during diastole, b) plug-flow BC at lowest Re during diastole, c) Womersley BC at highest Re during systole, d) plug-flow BC at highest Re during systole. From top to bottom: geom.1, geom.2, and geom.3. Grey arrows indicate areas of discrepancies.
111
Figure-4.8: WSS contours for a) Womersley BC at lowest Re during diastole, b) plug-flow BC at lowest Re during diastole, c) Womersley BC at highest Re during systole, d) plug-flow BC at highest Re during systole. From top to bottom: geom.1, geom.2, and geom.3
113
Figure-4.9: Time-averaged WSS contours for a) Womersley boundary conditions, b) plug-flow BC. From top to bottom: geom.1, geom.2, and geom.3.
114
Figure-4.10: OSI contours for a) Womersley BC, b) plug-flow BC. From top to bottom: geom.1, geom.2, and geom.3.
115
Figure-4.11: Velocity vectors on cross-sections along the afferent vessel at peak systole for geom.1 (a,b) and geom.1b (c). The distance between the cross-sections is 1.5D, where D is the diameter of the inlet boundary in geom.1.
116
Figure-4.12: Locations of aneurysms 1-5 in a typical cerebral vasculature (illustration generated using the @neurIST software)
122
Figure-4.13: Mesh particulars and BC types used. QMRI is the velocity-based boundary condition from MRI patient-specific measurements, Q1D is the velocity-based boundary condition from 1D model, Q1D-S is the WSS-scaled velocity-based boundary condition
124
Figure-4.14: Contour plots of tavWSS for method I (pc-MR), method II (1D-model), and method III (WSS-scaled).
128
Figure-4.15: Contour plots of normalized values of tavWSS (ntavWSS) for method I (pc-MR), method II (1D-model), and method III (WSS-scaled).
129
Figure-4.16: Contour plots of OSI for method I (pc-MR), method II (1D-model), and method III (WSS-scaled).
130
Figure-4.17: Boxplots showing the distribution percentage differences between methods I and II (top) and method I and III (bottom). Asterisks denote outliers above or below 1.5 times the inter quartile range.
132

6
Figure-4.18: VFR waveforms for a typical healthy individual and aneurysm patients included in this study, measured using pc-MR at internal carotid level. Typical waveform was taken from Radaelli et al 2008.
135
Chapter-5 Figure-5.1: Snapshot of a Questionnaire used to gather Feedback 141 Figure-5.2: Participants’ demographic constitution 143 Figure-5.3: Clinical Vignette: typical challenging case scenario 144 Figure-5.4: Operation workflow from medical image to haemodynamic results. A) Orthoslice visualization of the 3DRA medical image in @neuFuse. B) Visualization of the extracted vessel surface. C) Visualization of reduced region of interest with location of inlet and outlet openings. D) 1D circulation model. E) Visualization of predicted streamlines. F) Visualization of predicted wall shear stress.
146
Chapter-6 Figure-6.1: Reconstructed geometry of the IA and surrounding vasculature for patient-1 (A). Contours of WSS (B,C) and OSI (D,E) for µtypical (B,D) and µatypical (C,E) are displayed. Arrows indicate the site of IA along the parent vessel before removal.
171
Figure-6.2: Reconstructed geometry of the IA and surrounding vasculature for patient-2 (A). Contours of WSS (B,C) and OSI (D,E) for µtypical (B,D) and µatypical (C,E) are displayed. Arrows indicate the site of IA along the parent vessel before removal.
172
Figure-6.3: Reconstructed geometries showing the IAs and connecting vessels reconstructed with software @neuFUSE. Labels indicate the openings where boundary conditions were applied.
178
Figure-6.4: The qualitative differences in the patterns of t-av-WSS and OSI in pre (a,b) and post heparinized (c,d) blood. Top two rows are contour plots for t-av-WSS. Bottom two rows are contour plots for OSI. a&b; front views, c&d; back views. Row 1&3; Aneu-1, row 2&4; Aneu-2.
186
Figure-6.5: 24 hours ambulatory Non-invasive BP (NIBP) monitoring showing satisfactory BP control for both systolic and diastolic values.
195
Figure-6.6: Intracranial aneurysm included in the study shown in (a) circle of Willis (yellow sphere) and (b) in subclinoid part of ICA (arrow)
196
Figure-6.7: A comparison of VFR waveforms from CoA patient (marked-red) measured in proximal ICA and average VFR waveforms from healthy volunteers (marked-blue) in the same location. The flow-rates in presence of CoA are 1.5 times higher (5.44 ml/sec) as compared to the normal healthy individuals (3.62 ml/sec). Solid horizontal lines represent average values of VFR for CoA (red) and typical (blue).
199
Figure-6.8: Time-averaged WSS (top) and OSI (Oscillatory shear index) (bottom) contour plots in the left subclinoid intracranial aneurysm of CoA patient. Whereas, the areas affected by high WSS are increased in CoA patient (top, right) as compared to healthy volunteers (top, left) the OSI values are minimally changed
200
Figure-6.9: Transthoracic Doppler echocardiogram showing aortic coarctation with a diastolic tail. A coarctation gradient of 30-40 mmHg was seen (arrowhead) while the average aortic pressure was 16 mmHg. The peak velocity in aorta was 276 cm/sec.
202

7
Page Chapter-1 None Chapter-2 Table-2.1: The frequency of Intracranial Aneurysms as per different arterial locations (%)
31
Table-2.2: Classifications for Intracranial Arterial Aneurysms 33 Table-2.3: Aetiologies of Intracranial Arterial Aneurysms 35 Table-2.4: The factors involved in the initiation 35 Table-2.5: Activities or Events preceding Aneurysmal SAH 41 Table-2.6: The ratio of normal growth mediators is reversed in endothelial cells exposed to abnormally low WSS in right column. Source: Malek et al JAMA, 1999
44
Table-2.7: The literature-based evidence on the importance of haemodynamics in the aetiopathogenesis of IAs
47
Table-2.8: Showing the Journals publishing 2 and more papers in CFD in PubMed search
63
Table-2.9: CFD Analysis of Intracranial Aneurysms & Arteries: Some Main Studies, their Methodology and Results
69
Chapter -3 Table-3.1. Demographic details for all recruited cases in project @neurIST 83 Table-3.2. Main known risk factors for IA development and SAH in the recruited population
84
Table-3.3: Radiological characteristics of IAs included in the study along with the location, type and method of BC application
97
Chapter -4 Table-4.1: Geometrical properties of geom.1-3. 104 Table-4.2: Grid properties for geom.1-3 105 Table-4.3: Haemodynamic indices extracted for geom.1-3 and percentage error between Womersley and plug-flow results. 1) Elevation defined as 50% of peak pressure minus average pressure in the aneurysm at systole. 2) Elevation defined as 50% of maximum time-averag
117
Table-4.4: Patient demographics and aneurysm radiological features 123 Table-4.5: Boundary conditions location, type and method 125 Table-4.6: Time-average volumetric flow-rates and inlet radii for the 6 aneurysms in study
135
Table-4.7: A comprehensive review of the methods adapted by different authors while applying BCs
138
Chapter-5 Table-5.1: Aneurysm Radiological Characteristics 145 Table-5.2: Questionnaire sections and objectives 148 Table-5.3: General feedback 149 Table-5.4: Course design and conduct 150 Table-5.5: Experience with the software 151 Table-5.6: Haemodynamics understanding 152 Table-5.7: Impact of CFD in neurosurgery 153 Table-5.8: Bringing this software into routine use 154 Table-5.9: Attendees’ performance 155 Table-5.10: The literature-based evidence on the importance of haemodynamics in the aetiopathogenesis of IAs
159
LIST OF TABLES

8
Chapter-6 Table-6.1: Patients’ demography, clinical presentations of IAs included in the study, their management, and the known risk factors
168
Table-6.2: Quantitative comparison of areas and values of WSS the effects for µtypical and µatypical
170
Table-6.3: The literature-based evidence on the importance of WSS and OSI in the aetiopathogenesis of IAs
173
Table-6.4: WSS-induced vascular remodeling: an overview of some important mechanisms proposed
175
Table-6.5: Radiological characteristics of IAs 183 Table-6.6: Inter-aneurysmal comparison of haemodynamic indices in Aneu-1 and Aneu-2 for typical BV (μuntreated)
184
Table-6.7: The Quantitative comparison of effects of heparin on haemodynamic indices
185
Table-6.8: The literature-based evidence on the importance of haemodynamics in the aetiopathogenesis of IAs
188
Table-6.9: Radiological characteristics of the IA included in the study, the pc-MR measurements in CoA patient and healthy volunteers along with the locations, types and methods of BC application
198
Table-6.10: Absolute values of WSS, OSI, velocity and pressure for IA, obtained using BCs derived from healthy volunteers and measurements taken in CoA patient by pc-MR
201
Table-6.11: A comprehensive review of different mechanisms proposed for the increased incidence of IAs in CoA patients
208

9
First of all, I would like to thank the European Commission, VI Framework Program, Priority 2, Information Society Technologies, and Project @neurIST for allowing these studies as well as all their financial and logistic support. Words are not enough to express my gratitude to my friend and colleague Dr. Alberto Marzo. The studies included in this manuscript would have not been possible without his generous help and support. Alberto and me shared an excellent chemistry throughout my stay in the project, travelled the world together to present our work, came close to each other’s families, and in fact, started a lifelong friendship. Special thanks go to my supervisors Prof. Rod Hose and Mr. Umang Patel for their constant guidance and invaluable supervision. Rod has been much more than a mentor to me who showed great trust in my abilities, and has always been ready to go beyond his limits to help me out. In spite of holding such a high academic and research position, he is an amazingly approachable and humble person. He will be a role model to me for rest of my life for hard work, perseverance, and generosity. Being a neurosurgeon is busy enough. I am grateful to Umang who always took time from his extremely busy schedule to discuss a number of scientific hypotheses with me. He was always available for ‘brainstorming’ on any topic when I needed his invaluable input. I am also grateful to him for allowing me to approach patients from his Neurovascular Clinics, which played an instrumental role in our patient recruitment from Sheffield Center. Prof. Patricia Lawford and Dr. Stuart Coley deserve special mention for their support and time-to-time help they provided. Dr. Richard Lycett deserves special thanks for his support in conducting the CFD analyses on a number of cases. I would also like to extend my regards to Prof. Alex Frangi, Dr. Daniel Rufenacht, and Dr. Philippe Bijlenga for believing in my capabilities and giving me numerous opportunities to work in many key roles. I am also grateful to all members of @neurIST for their dedicated efforts in developing the software @neuFuse and other tools especially Dr. Mari-Cruz Villa-Uriol, Dr. Alessandro Chiarini, Dr. Inacho Larrabide, Dr. Juan Macho, and rest of the team. I duly acknowledge that the 1D circulation model used in a number of analyses here was a result of the work done by
ACKNOWLEDGEMENTS

10
Dr. Philippe Reymond and Dr. Nikos Stergiopulos from Laboratory of Haemodynamics and Cardiovascular Technology, Ecole Polytechnique, Fédérale de Lausanne EPFL, Switzerland. Whereas, Dr. Andy Narracott helped me in understanding in the basic principles of Computational Fluid Dynamics initially, Dr. Alan Waterworth and Dr. Steven Wood always made sure that anonymized patient images are available in time for my analyses. I gratefully acknowledge the help of Dr. Matt Gwilliam, Dr. Iain Wilkinson, and other members of MRI Department in Royal Hallamshire Hospital who helped me in performing Q-Flow pcMRI measurements that formed important basis for a number of studies included in this thesis. I must thank Dr. Guntram Berti and other members from NEC Laboratories Europe, for all their help and support. Acknowledgements will not be complete without thanking Dr. Keith McCormack who always made sure things went smoothly on a number of occasions especially during exposures and multicentric synchronization of @neuFuse. I am also grateful to my beloved wife Juhi Tomar for her help, motivation and support in preparing this draft as well as bearing with my absences during my regular visits to other countries to present my work and conduct @neuFuse workshops. Last but not least, I highly appreciate the help of a number of visiting fellows and BMedSci students including Ms. Alice Pitt, Mr. Kiyanouche Jash, Mr. Hannan Tahir, Mr. Tissa Weeratunge, Ms. Gwen Mulder and Ms. Sneha Varkey. I am also grateful to Mr. Steve Parkin for the technical support in the department. In retrospect, working in Project @neurIST was one of the best things I ever did in my life. It was like working in a big family of all incredibly supportive and kind people who will go beyond their limits to make you happy. Pankaj Singh Pankaj Singh 39, Aldrich Drive Milton Keynes MK15 9HP

11
The project has appropriate ethical approvals for the required research. All partners involved in the project took separate ethical approvals from their local ethical committees after satisfying their requirements. The ethical matters for UK managed by Project Ethical Committee, Oxford, UK (Oxfordshire Research Ethics Committee-A Study Number: 07/Q1604/53). The research was supported by a research grant from Project Aneurist (www.aneurist.org) - Research Grant Account Nº RU 110017. Registration Nº for MD is 070237465 while the RTP Nº is MED6950.
ETHICAL APPROVALS

12
ABSTRACT
Aneurysmal subarachnoid hemorrhage (SAH) carries a high morbidity and mortality. The current protocols used to treat the unruptured Intracranial Aneurysms (IAs) are inadequate underscoring the need of finding new descriptors. As demonstrated by the studies performed in this manuscript, haemodynamics plays an important role in the aetiopathogenesis of IAs. An evaluation of haemodynamic indices can provide a useful alternative to predict the behavior of an unruptured IA at an early stage. Studies performed by me demonstrate that Computational Fluid Dynamics (CFD) can be used successfully to predict haemodynamic indices where detailed in vivo measurement of haemodynamic flow variables is not possible owing to technical limitations. European Commission funded Project @neurIST was the first project of it’s kind that brought together a number of multidisciplinary professionals from 32 European institutions and made possible development of state-of-the-art tools for personalised risk assessment and treatment IAs using CFD. These tools have been constantly improved and amended in the light of feedback gathered from their controlled exposures conducted world over, as described in the manuscript. However, need of a well-designed Randomized Controlled Trial in this context cannot be overemphasized, before these tools can be accepted by clinicians and patients. In my study on the validation of different concepts used in CFD, I demonstrated that there is no added advantage of complex Womersley-‐flow-‐profile over the much simpler plug-‐flow profile. One of my studies on initiation and rupture of IAs showed that the haemodynamic patterns of IAs during these two phases are significantly different with values of supra-physiological Wall Shear Stress (WSS) being higher in initiation while lower in rupture phase. I also investigated the effects of pharmacological agents on the aetiopathogenesis of IAs and found that heparin induces significant derangements in the haemodynamics of both, pre-aneurysmal as well as ruptured IA. I propose that heparin (and its derivatives) can, on the one hand may facilitate the rupture of existing IAs, on the other hand they may suppress the formation of new IAs. I have also found significant differences in the results using patient-specific vs. Modeled Boundary Conditions and showed that the 1D

13
circulation model adopted by @neurIST performs better than other approaches found in the literature. I also proposed a novel mechanism of increase in Blood Viscosity leading to high WSS as one of the important underlying mechanisms responsible for the increased incidence of IA formation in smokers and hypertensive patients. In my study on patients with pre-existing Coarctation of Aorta (CoA) and Intracranial Aneurysms, I demonstrated that the cerebral flow-rates in CoA patients were significantly higher when compared to average flow-rates in healthy population. It was also seen that the values and the area affected by supraphysiological WSS (>15Pa) were exponentially higher in patients with CoA indicating the possible role of increased haemodynamic WSS secondary to the increased flow-rates playing an important role in the pathogenesis and rupture of IAs in CoA patients.

14
§ Codman Educational Fellowship and Grant: to present my work at 9th International Conference on Cerebrovascular Surgery, Nagoya, Japan in November 2009.
§ Young Neurosurgeon Award-2009: by American Association of Neurological Surgeons-World Federation of Neurosurgical Societies (AANS-WFNS), XVI World Congress of Neurological Surgery, for the study -Analysis of different haemodynamic factors during initiation and rupture of intracranial aneurysms and influence of various drugs on their natural history, presented at Boston, MA, in September 2009.
AWARDS

15
PUBLICATIONS As a first or second author 1. Singh PK, Marzo A, Kumar K, Tahir H, Weeratunge TF, Lycett R, Boutarbouch
M, Lawford P, Frangi A, Hose DR, Coley SC, Patel UJ. Effects of heparin on the haemodynamics of intracranial aneurysms. Published in J Neuroradiol (J Neuroradiol. 2010 Dec;37(5):300-1. Epub 2010 Apr 5.)
2. Singh PK, Marzo A, Lawford P, Frangi A, Patel UJ, Hose, DR, Coley SC. Effects
of smoking and hypertension on the wall shear stress and oscillatory shear index at the site of intracranial aneurysm formation. Clin Neurol Neurosurg. 2010 May;112(4):306-13. Epub 2010 Jan 21.
3. Singh PK, Marzo A, Staicu C, Gwilliam MN, Lawford P, Wilkinson I, Frangi A,
Patel UJ, Hose, DR, Coley SC. The effects of aortic coarctation on cerebral haemodynamic and its importance in the aetiopathogenesis of intracranial aneurysms. J Vascular and Interventional Neurology 2009;2(3):1-14
4. Singh PK, Marzo A, Coley SC, Berti G, Bijlenga P, Lawford PV, et al: The role of
computational fluid dynamics in the management of unruptured intracranial aneurysms: a clinicians' view. Comput Intell Neurosci:760364, 2009
5. Singh PK, Erlalil G, Nicolae L, Prakash S, Marzo A, Iyer V, Patel J, Hose R.
Management of Intracranial Aneurysms: History of a Paradigm Shift. Accepted for publication by J Cerebrovascular & Endovascular Neurosurgery: Nov 2013
6. Singh PK, Kumar K, Tarik, J, Marzo, A, Hose R, Coley S, Patel J. Superficial
Temporal Artery Aneurysm Associated With Paintball Injury Successfully Treated by Endovascular Glue: A Technical Case Report and Review of Literature. Accepted for publication by J Cerebrovascular & Endovascular Neurosurgery: Aug 2013
7. Marzo A, Singh P, Reymond P, Stergiopulos N, Patel U, Hose R: Influence of inlet
boundary conditions on the local haemodynamics of intracranial aneurysms. Comput Methods Biomech Biomed Engin 12:431-444, 2009
8. Marzo A, Singh PK, Radaelli A, Hose, DR, Reymond P, Lawford P, Stergiopulos
N, Gwilliam M, Wilkinson I, Frangi A, Patel UJ, Coley SC. Numerical Predictions of Haemodynamics in Intracranial Aneurysms: the Effects of Modeled versus Patient-Specific Boundary Conditions. Annals of Biomedical Engineering. (Ann Biomed Eng. 2011 Feb;39(2):884-96. Epub 2010 Oct 23.)
Other publications from collaborations 1. Risk of rupture of small anterior communicating artery aneurysms is similar
to posterior circulation aneurysms. Bijlenga P, Ebeling C, Jaegersberg M, Summers P, Rogers A, Waterworth A, Iavindrasana J, Macho J, Pereira VM,
PUBLICATIONS/ ABSTRACTS/ PRESENTATIONS

16
Bukovics P, Vivas E, Sturkenboom MC, Wright J, Friedrich CM, Frangi A, Byrne J, Schaller K, Rufenacht D, Narata AP, Clarke A, Yarnold J, Kover F, Schatlo B, Hudak S, Teta P, Blasco J, Gonzalez AM, Lovblad KO, Coley S, Doczi T, Risselada R, Sola T, Lawford P, Patel U, Singh P, Wickins J, Elger B, Beyleveld D, Wood S, Hasselmeyer P, Arbona A, Meyer R, Hose R, Lonsdale G, Hofmann-Apitius M. Stroke. 2013 Nov;44(11):3018-26. doi: 10.1161/STROKEAHA.113.001667. Epub 2013 Jul 30.
2. @neurIST Complex Information Processing toolchain for the integrated
management of cerebral aneurysms. Villa-Uriol MC, Berti G, Hose DR, Marzo, Chiarini A, Penrose J, Pozo J, Schmidt JG, Singh P, Lycett R, Larrabide I, Frangi AF. Interface Focus (official Journal of The Royal Society) April 6, 2011, doi: 10.1098/rsfs.2010.0033.
3. Genome-wide association study of intracranial aneurysms identifies 5 risk loci.
Katsuhito Yasuno, Kaya Bilguvar, Philip Bijlenga, Amanda Low Siew Kee, Boris Krischek, Georg Auburger, Matthias Simon, Dietmar Krex, Zulfikar Arlier, Nikhil Nayak, Ynte M Ruigrok, Mika Niemela, Atsushi Tajima, Mikael von und zu Fraunberg, Doczi Tamas, Florentina Wirjatijasa, Akira Hata, Blasco Jordi, Agi Oszvald, Hidetoshi Kasuya, Zilani Gulam, Beate Schoch, Singh Pankaj, Carsten Stüer, Risselada Roelof, Jürgen Beck, Teresa Sola, Filomena Ricciardi, Arpo Aromaa, Thomas Illig, Stefan Schreiber, Cornelia M van Duijn, Leonard H van den Berg, Perret Claire, Proust Carole, Constantin Roder, Ali K. Ozturk, Emilia Gaal, Wickins Jeremy, Daniela Berg, Christof Geisen, Friedrich Christoph, Summers Paul, Frangi Alex, Matthew W State, H Erich Wichmann, Monique M B Breteler, Cisca Wijmenga, Shrikant Mane, Leena Peltonen, Elio Vivas, Sturkenboom Miriam, Lawford Patricia, Byrne James, Macho Juan, I. Erol Sandalcioglu, Bernhard Meyer, Andreas Raabe, Rüfenacht Daniel, Juha E Jääskeläinen, Juha Hernesniemi, Gabriel J E Rinkel, Hitoshi Zembutsu, Ituro Inoue, Aarno Palotie, Francois Cambien, Yusuke Nakamura, Richard P Lifton, Murat Gunel. Published in Nature Genetics (Nat Genet. 2010 May;42(5):420-5. Epub 2010 Apr 4.)
4. MR derived volumetric flow rate waveforms at locations within the common
carotid, internal carotid, and basilar arteries. Gwilliam MN, Hoggard N, Capener D, Singh P, Marzo A, Verma PK, Wilkinson ID. J Cereb Blood Flow Metab (Nature Publishing Group). 2009 Dec;29(12):1975-82.
ABSTRACTS/ CONFERENCE PROCEEDINGS 1. Singh PK, Marzo A, Coley SC, Lawford P, Frangi A, Hose DR, Patel UJ. The
@neurist Project: Development of a Computational Model to Improve Management of Intracranial Aneurysms. Published in the Proceedings of XIV-AANS-WFNS (American Association of Neurological Surgeons-World Federation of Neurosurgical Societies), World Congress, Boston, MA, USA, 30th Aug – 4th Sep 2009, 1512-1520.
2. Singh PK, Marzo A, Coley SC, Lawford P, Frangi A, Hose DR, Patel UJ.
Computational Simulation of Haemodynamic Characteristics in Intracranial

17
Aneurysms with @neufuse. Published in the Proceedings of XIV-AANS-WFNS (American Association of Neurological Surgeons-World Federation of Neurosurgical Societies), World Congress, Boston, MA, USA, 30th Aug – 4th Sep 2009, 2505.
3. Singh PK, Marzo A, Lawford P, Frangi A, Patel UJ, Hose, DR, Coley SC. Effects
of smoking and hypertension on the wall shear stress and oscillatory shear index at the site of intracranial aneurysm formation. Published as an abstract in the Proceedings of 9th International Conference on Cerebrovascular Surgery, Nagoya, Japan, 08;2, 2009.
4. Singh PK, Marzo A, Tahir H, Weeratunge TF, Hose DR, Lawford P, Patel UJ,
Coley SC. Computational study of the effects of drugs on growth and rupture of intracranial aneurysms: Published in the Proceedings of VI International Conference on Computational Bioengineering, Bertinoro, Italy, 2009, p 67.
5. Singh PK, Marzo A, Tahir H, Weeratunge TF, Hose DR, Lawford P, Patel UJ,
Coley SC: A novel approach for computational haemodynamic characterisation of cerebral aneurysms. Proceedings of the VI International Conference on Computational Bioengineering, Bertinoro, Italy, 2009, p 67.
6. Singh PK, Pitt A, Chiarini A, Marzo A, Lawford P, Coley SC, Rufenacht DA,
Frangi A, Patel UJ, Hose, DR. Cerebral Aneurysms: from Carotid Ligations to Computational Fluid Dynamics: Published in 2nd Proceedings of ESMINT Society.
7. Marzo A, Singh PK, Lawford P, Patel UJ, Coley SC Hose DR. A novel approach
for computational haemodynamic characterisation of cerebral aneurysms. Published in the Proceedings of VI International Conference on Computational Bioengineering, Bertinoro, Italy, 2009, p 65.
8. Marzo A and Singh PK. Computational haemodynamics characterization of
intracranial aneurysms with @neuFuse. 1st Proceedings of the ESMINT (European Society of Minimally invasive Neurological Therapy) Conference, September 2008, Lisbon, Portugal.
9. Pitt A, Marzo A, Singh P, Larrabide I, Aguilar M, Lawford P, Coley SC, Frangi A,
Patel UJ, Hose, DR. Haemodynamics in intracranial aneurysms of the anterior and posterior circulation and its association with rupture. Abstract Published in Br J Neurosurg (Mar 2010).
10. Hose DR, Howard B, Marzo A, Singh PK, Lawford P. Haemodynamic
Characterization of Aneurysms by Computational Fluid Dynamics. Published in 2nd Proceedings of ESMINT Society.
18
PRESENTATIONS 1. Effects of smoking and hypertension on the wall shear stress at the site of
intracranial aneurysm formation: (Presenting Author) presented in 9th International Conference on Cerebrovascular Surgery, Nagoya, Japan 11th- 13th Nov 2009
2. Recent Advances and the Role of CFD in the Management of Unruptured
Intracranial Aneurysms: (Presenting Author) presented in Cardiovascular Surgery Meeting, Royal Hallamshire Hospital, Sheffield on 2nd Oct 2009
3. Recent Advances in the Management of Unruptured Intracranial Aneurysms:
(Presenting Author) presented during Sheffield Clinical Neurosurgery Meeting (B. Braun), 25, 26th Sept 2009
4. Computational study of the effects of drugs on growth and rupture of
intracranial aneurysms: (Presenting Author) presented in VI International Conference on Computational Bioengineering, Bertinoro, Italy, 16-18th Sept 2009
5. Computational Predictions to Improve Management of Intracranial
Aneurysms: (Presenting Author) Presented in American Association of Neurological Surgeons-World Federation of Neurosurgical Societies (AANS-WFNS), XVI World Congress of Neurological Surgery, Boston, MA, Sept 2009.
6. The effects of heparin on the natural history of intracranial aneurysms:
(Presenting Author) Presented in Young Neurosurgeons’ Forum as an Award winning paper during American Association of Neurological Surgeons-World Federation of Neurosurgical Societies (AANS-WFNS), XVI World Congress of Neurological Surgery, Boston, MA, Sept 2009.
7. The @neurist Project: Development of a Computational Model to Improve
Management of Intracranial Aneurysms: (Presenting Author) Presented in American Association of Neurological Surgeons-World Federation of Neurosurgical Societies (AANS-WFNS), XVI World Congress of Neurological Surgery, Boston, MA, Sept 2009.
8. A Computational Fluid Dynamics (CFD) Based Analysis of Different
Haemodynamic Factors in Six Patient-Specific, Typical, Saccular Intracranial Aneurysms at Common Locations in Circle of Willis: (Presenting Author) presented in Annual Research Day, University of Sheffield, UK, Aug 2009.

19
Publication used in thesis Journal/ Publisher Permission from Journal/ Publisher Effects of heparin on the haemodynamic characteristics of intracranial aneurysms
J Neuroradiol/ Elsevier Yes. Attached is the generalized permission that covers all articles published by Elsevier (parent publisher for J Neuroradiol)
Effects of smoking and hypertension on the wall shear stress and oscillatory shear index at the site of intracranial aneurysm formation
Clin Neurol Neurosurg/ Elsevier
Yes. Attached is the generalized permission that covers all articles published by Elsevier
The effects of aortic coarctation on cerebral haemodynamics and its importance in the aetiopathogenesis of intracranial aneurysms.
J Vascular and Interventional Neurology/ JVIN
Yes. Permissions granted by the Editor in Chief of JVIN. Proof attached
The role of computational fluid dynamics in the management of unruptured intracranial aneurysms: a clinicians' view.
Comput Intell Neurosci/ Hindawi
Yes. The paper was published as an Open Access Publication by Comput Intell Neurosci (Hindawi publishers)- As per Journal’s Policy- these articles are distributed under the terms of the Creative Commons Attribution License, which permits unrestricted use, distribution and reproduction in any medium, provided that the original work is properly cited. The Policy Statement form Journal’s website is enclosed.
Management of Intracranial Aneurysms: History of a Paradigm Shift.
J Cerebrovascular & Endovascular Neurosurgery/ Korea Med
Yes. Authors retain Copyright to use their own work for any non-commercial purposes. Policy statement form Korea Med attached.
Influence of inlet boundary conditions on the local haemodynamics of intracranial aneurysms.
Comput Methods Biomech Biomed Engin/ Taylor & Francis
Yes. Attached is the generalized permission that covers all articles published by Taylor & Francis (parent company for CMBBE)
Numerical Predictions of Haemodynamics in Intracranial Aneurysms: the Effects of Modeled versus Patient-Specific Boundary Conditions.
Annals of Biomedical Engineering/ Springer
Yes. Permission obtained from Springer (parent publisher for Annals of Biomedical Engineering) to reuse the full text of the article for the purpose of thesis, is attached
RELEVANT PERMISSIONS

20
Co-author Permission acquired Alberto Marzo Yes. Received on 23/03/2014 Rod Hose Yes. Received mail on 21/03/2014 Patricia Lawford Yes. Verbally Umang Patel Yes, verbally Alex Frangi Yes. Got the mail on 23/03/2014 Stuart Coley Yes, received mail Philippe Bijlenga Yes. Got the mail on 23/03/2014 Daniel Rufenacht Yes. Got the mail on 23/03/2014 Keith McCormack Mailed on 23/03/2014 Hannan Tahir Yes. Got the mail on 23/03/2014 Richard Lycett Yes, received email Matt Gwilliam Yes. Got the mail on 23/03/2014 Tissa Weeratunge Mail bounced back. Unable to contact! Ian Wilkinson Yes. Got the mail on 23/03/2014 Christina Staicu Mail bounced back. Unable to contact! Mari-Cruz Villa-Uriol Mailed on 23/03/2014 Alessandro Chiarini Yes, received email Guntram Berti Mail bounced back. Unable to contact! Alessandro Radaelli Mailed on 23/03/2014 Philippe Reymond Mailed on 23/03/2014 Nikos Stergiopulos Mailed on 23/03/2014 Kuldeep Kumar Yes, verbally Mahjouba Boutarbouch Yes. Got the mail on 23/03/2014 George Erlalil Yes, verbally Liviu Nicolae Yes, verbally Savithru Prakash Yes, verbally Ven Iyer Yes, verbally

21
Overview 1.1 Background 1.2 Dilemmas with current management plans 1.3 Importance of Haemodynamic Factors 1.4 Limitations of current technology in measuring haemodynamic indices and role of CFD in this context 1.5 CFD and its various applications in medicine 1.6 Application of CFD in the field of Intracranial Aneurysms 1.7 Validation of common concepts used in CFD 1.8 CFD as a tool to explore the aetiopathogenesis of Intracranial Aneurysms
1.1 Background An aneurysm is an abnormal dilatation or ballooning of a part of a blood vessel due to weakness in its walls. Whereas, we can find aneurysms virtually anywhere in the body, one of the most fatal locations to have one is inside the cerebral vasculature, known as intracranial aneurysms (IAs). The work presented in this thesis is focussed on addressing different aspects of aetiopathogenesis and management of this particular variety using Computational Fluid Dynamics (CFD). The term aneurysm, derived from Greek word aneúrysma (ana; throughout + eurus; wide), meaning ‘to dilate’, was introduced by Claudius Aelius Galen, a philosopher of Greek origin in 200 AD. The earliest description of the intracranial or subarachnoid haemorrhage (SAH) as a cause of death in human beings, dates back to the ancient Biblical times. The first anecdotal evidence of an intracranial aneurysm as well as the earliest attempt to treat it come from Egypt. It is recorded in Ebers Papyrus, one of the oldest preserved medical documents that in 2725 BC, Imhotep, who was an Egyptian architect cum physician, tried to treat an aneurysm by using a fire glazed instrument [Lippi 1990]. History as a whole plays a paramount role in motivating scientists as well as providing us a foundation for future work. The history of management of Intracranial Aneurysms, history of Computational Fluid Dynamics (CFD) and the current status of CFD in the field of Intracranial
CHAPTER 1.0: SUMMARY

22
Aneurysms, is therefore analyzed in detail by conducting a focused review of relevant literature in the section Review of Literature. 1.2 Dilemmas with current management plans In spite of recent advancements in the management, aneurysmal subarachnoid hemorrhage (SAH) remains a major cause of morbidity and mortality in neurosurgical patients [Hop et al. 1997]. Whereas, the treatment protocols for a ruptured intracranial aneurysm (IA) have become clearer with time, the management of unruptured IAs remains one of the most controversial topics in neurosurgery. These uncertainties are multi-factorial, owing mainly to incomplete and conflicting data about natural history of these lesions and the risks associated with the active management [ISUIA 1998, Raaymakers 1998, Rinkel 1998]. In order to offer the best possible treatment to the patient with the least side effects, formulation of a clear management protocols, directed by the natural history of unruptured IAs and, the risks associated with the active management, is required. Whereas, there are no strict guidelines, most of the studies [Juvela 2000, Komotar et al. 2008, Mayberg et al. 1994) including ISUIA trials [ISUIA 1998, Wiebers et al. 2003), almost unanimously recommend certain factors as indications of surgery or endovascular coiling in unruptured IAs: large aneurysmal size, symptomatic lesions, evidence of growth, multiple lesions, posterior circulation location, past history of SAH, history of smoking and hypertension, etc. All these criteria are found to have good correlation with increased risk of rupture and hence, active intervention is advocated in these situations to avoid the poor outcome. However, it is interesting to note that all of these factors also remain the underlying descriptors for poor surgical or endovascular outcome [Khanna et al. 1996, Solomon et al. 1994, Wirth et al 1983]. In other words, by the time we take a decision to treat an IA based on the current guidelines, the patient has already become predestined for a poor outcome. 1.3 Importance of Haemodynamic Factors Whereas, current evidence convincingly supports a multifactorial aetiology for IA formation, there is a growing body of literature underlining the importance of haemodynamic [Burleson et al. 1996, Byrne et al. 1998, Gao el al. 2008, Morimoto et al. 2002, Cebral et al. 2013, Sadasivan et al. 2013, Omodaka et al. 2012, Meng et al. 2013] and morphological [Lall et al. 2009, Sadatomo et al. 2008, Xu et al. 2013, Kashiwazaki et al. 2013] factors in this context. The haemodynamic variables often considered in these studies are wall shear stress (WSS), oscillatory shear index (OSI), blood pressure and other quantities used to

23
characterize blood flow, while important morphological indices are shape, aspect ratio, Zernike Moments, etc. An evaluation of these variables can provide a useful alternative to predict the behavior of an unruptured IA at an early stage before it changes in size, shape or becomes symptomatic. These factors therefore can guide us in selecting the IAs with greatest risk of rupture and thus warranting the active interventions before they join a cohort of IAs who are destined for a poor outcome if we take this decision based on current guidelines. At the same time, these factors can indicate the IAs with relatively low risk of rupture that can be safely monitored, thus avoiding the unnecessary interventions. I envision that, this prediction of risk of rupture in an Aneurysm-specific way will eventually revolutionize the treatment of Intracranial Aneurysms taking it to the next level. 1.4 Limitations of current technology in measuring haemodynamic indices and role of CFD in this context Whereas, haemodynamic and morphological indices show great potential in guiding the correct management of IAs, limitations in current technology greatly restrict our ability to measure these factors in patients. In spite of some recent studies [Boussel et al. 2008, Isoda et al. 2009, Rayz et al. 2009] showing possibility of measuring some of the haemodynamic quantities in-vivo using magnetic resonance fluid dynamics (MRFD), inherent limitations in the technology impede its use in large cohort studies and aneurysms of <5 mm diameter. It is therefore fair to say that, the detailed in-vivo measurements of these relevant flow variables in the regions affected by the disease are currently very difficult and impractical [Shojima et al. 2004, Steinman et al. 2003]. Computer modeling and simulation techniques are playing an increasingly important role in the way medicine is being practiced and has been successfully applied in a number of medical disciplines. 1.5 CFD and its various applications in medicine Computational fluid dynamics (CFD) is one of the most important tools used for computer modeling and simulation that can represent a valuable alternative to extract additional non-observable information from patient-specific data for IAs. CFD is the science of predicting fluid flow, heat and mass transfer, chemical reactions, and related phenomena by solving numerically the set of mathematical equations that govern a particular physical system

24
(conservation of mass, momentum, energy, species etc.). Since its early development in the 1960s and 1970s in the field of aerospace, where it was used mainly to improve the design and efficiency of aircrafts [Agarwal et al. 1999] CFD has been successfully used in many other clinical applications. One of the most important clinical areas where CFD is widely used is Circulatory System. It has been applied for assessing the blood flow through stenoses [Feng et al. 2011, Bark et al. 2010, Siouffi et al. 1998], analysis of physiology of blood flow through heart valves [Chan et al. 2013] as well as the turbulence through prosthetic heart valves [Kaufmann et al. 2011], flow and patency of aortic grafts [Vardoulis et al. 2011, Prasad et al. 2011] and mechanics of arterial diseases [Tang et al. 2013]. It has also been used for assessing the flow through Arterio Venous Fistulas [Ene-Iordache et al. 2011, Kharboutly et al. 2010] and modelling of thrombosis of blood [Corbett et al. 2010]. CFD has also been applied to the Respiratory System for the simulation of airflow and evaluation of respiratory functions [Malvè et al. 2011] as well as characterization of respiratory aerosol drug delivery [Lou et al. 2004, Tian et al. 2011]. Investigators have also applied numerical modelling to the fluid dynamics inside the human Gastrointestinal System [Ferrua et al. 2010], the urinary flow-rates through the Genitourinary System [Frawley et al. 2009] and the flow dynamics of Cerebrospinal Fluid (CSF) and its correlation with the development of hydrocephalus [Linge et al. 2011, Penn et al 2011]. 1.6 Application of CFD in the field of Intracranial Aneurysms Success of CFD in other medical disciplines played an important role in inspiring biomedical scientists and paved a path for its further application in the field of cerebral vasculature and intracranial aneurysms [Boussel et al. 2008, Castro et al. 2006, Cebral et al. 2005, Shojima et al. 2004, Singh et al. 2009, Steinman et al. 2003, Morales et al. 2011, Lu et al. 2011, Wong et al. 2011, Hassan et al. 2011, Marzo et al. 2011, Doenitz et al. 2010, Zeng et al. 2010, Sun et al. 2010, Sforza et al. 2010, Ford et al. 2005, Ford et al. 2008, Sun et al. 2012, Alfano et al. 2013, Weichert et al. 2013]. Apart form that; two other important factors behind the successful application of CFD in this field were; growing evidence emphasizing the important role played by haemodynamic indices in the aetiopathogenesis of Intracranial Aneurysms and difficulty of conducting detailed in-vivo measurement of these variables. The application of CFD in this relatively new field, however, was not without challenges. There were a number of prerequisites to be met and

25
hurdles to overcome, before the potential of CFD as a tool could be tapped, in predicting the risk of rupture in Intracranial Aneurysms. These challenges were met one by one in the project @neurIST. The initial step in computing these haemodynamic and morphological variables is building three-dimensional (3D) computer models of the Region of Interest (ROI) from patient specific medical images (e.g. 3D Rotational Angiograms, CT Angiograms, or MR Angiograms). This is achieved with the help of a software tool-chain (called herein tool-chain). First and foremost, prerequisite therefore was building a user-friendly robust tool-chain that is not observer dependent and can be used by a common user, consistently and repeatedly [Villa-Uriol et al. 2011]. This major breakthrough achieved by teams of dedicated biomedical scientists and computer engineers across a number of centers as a part of project @neurIST. This goal was accomplished in three main steps: a) development of software @aneuFuse or the tool-chain, b) continuing evaluation of the tool-chain by conducting its controlled exposures to the relevant audiences and users to collect useful feedback and, c) modifying the tool-chain by integrating this feedback as well as conducting a Multi-centric Synchronization. The tool-chain is described in detail under materials and methods section along with an overview of its development process as undertaken by different teams. 1.7 Validation of common concepts used in CFD After building a robust tool-chain, the next step was to establish the reliability of the common basic concepts applied while using CFD as a tool in the analysis of haemodynamic and morphological indices in the Cerebral Vasculature and Intracranial Aneurysms. Specification of Boundary Conditions is an important prerequisite for solving the governing equations in the extraction of these non-observable indices. As direct measurements of these flow-rate waveforms at the inlets and outlets of the domain are usually impracticable [Marzo et al. 2009], the Boundary Conditions are mostly derived using the available 1D Circulation models [Westerhof et al. 1969, Stergiopulos et al. 1992, Vignon-Clementel et al. 2006, Balossino et al. 2009, Bove et al. 2008]. A number of assumptions are made while applying these Boundary Conditions that can strongly perturb the numerical calculations. One such assumption is application of Womersley flow profile at inlet Boundary of the domain [Marzo et al. 2009]. The first study therefore was conducted to investigate the effects of different inlet velocity profiles on the

26
haemodynamics of IAs and compared them with the more important determinants of the haemodynamics like geometry of the domain. The study on the effects of Boundary Conditions on the haemodynamics of IAs further extended by taking phase contrast MR (pc-MR) measurements for flow-rates in 19 IAs from nine patients recruited in the study [Marzo et al. 2011]. The effects of the Boundary Conditions derived using these patient-specific pc-MR follow-rates and the traditional 1D-model, on the haemodynamic characterization of IAs, were then compared and analyzed in order to quantify the agreements and differences in the values of derived haemodynamic indices. 1.8 CFD as a tool to explore the aetiopathogenesis of Intracranial Aneurysms The final sections of this manuscript are devoted towards exploring the different factors that can influence the aetiopathogenesis of Intracranial Aneurysms by altering their haemodynamic environments. A number of studies were designed in this context and CFD was used to prove or refute the hypotheses. The first study in this section was conducted on the two well-known risk factors for Intracranial Aneurysm formation: smoking and hypertension. Whereas, smoking and hypertension are well-established risk factors in IA formation [Bonita 1986, de la Monte et al. 1985, Inci et al. 2000, Juvela 2000, Kondo et al. 1997] their roles in the mechanisms that regulate aneurysm formation are poorly understood and are essentially limited to their statistical associations. In this study, I hypothesized that smoking and hypertension lead to intracranial aneurysm formation by changing the haemodynamic environment of the cerebral vasculature secondary to their effect on Blood Viscosity. There is good evidence in the literature that smoking and hypertension increase the Blood Viscosity in individuals [de Simone et al. 2005, Letcher et al. 1983]. CFD was used to compute the effects of these risk factors on wall shear stress (WSS) and oscillatory shear index (OSI) at the site of IA initiation, two most important factors for the development of Intracranial Aneurysms [Burleson et al. 1996, Byrne et al. 1998, Gao et al. 2008, Morimoto et al. 2002]. In the next study, I analyze the differences in the haemodynamic environments of intracranial aneurysms during the stages of their initiation versus rupture. 3D Rotational Angiograms were used to build the three-dimensional computer models of aneurysms included in the study followed by their qualitative and quantitative comparisons. The study

27
further extended by investigating the effects of heparin (and enoxaparin) on the haemodynamic characteristics of aneurysms. Heparin (and its derivative enoxaparin) is a widely used injectable anticoagulant for preventing venous thrombosis and pulmonary embolism. It inhibits the factors involved in blood clotting (factor Xa), causing instantaneous inactivation of thrombin, thereby reducing Blood Viscosity [Hitosugi et al. 2001) and, in turn altering the haemodynamics of the blood circulation. Values of WSS and OSI were computed with the help of CFD in a ruptured Intracranial Aneurysm and compared with a tiny aneurysm in the stage of initiation. Possible link between the low Blood Viscosity, and alterations in values of WSS/ OSI, leading to the rupture of Intracranial Aneurysm was explored. Potential effects of other pharmacological agents on the aetiopathogenesis of intracranial aneurysms are also discussed. Another interesting study was conducted to analyze the haemodynamic changes in the cerebral circulation of patients with Coarctation of Aorta and its possible effects on the increased incidence and rupture of Intracranial Aneurysms in these patients. After a thorough search (PubMed®, Embase® and Google-Scholar™ searched from the year 1900 up to 2009) I could retrieve only two relevant studies. Whereas, Hafkenschiel et al [Hafkenschiel et al. 1949) demonstrated a significant increase in cerebral arterial flow-rates in patients with Coarctation of Aorta in 1949, Rowe and colleagues [Rowe et al. 1964] found no significant differences in the flow-rates before and after the repair of Coarctation of Aorta in their study performed in 1964. I therefore preformed pc-MR measurements in the cerebral arteries of a Coarctation of Aorta patient with coexisting IA and five healthy volunteers to establish the flow-rates at different locations in the cerebral vasculature. Amongst other aetiologies proposed, Coarctation of Aorta has been highlighted as a major risk factor in the aetiopathogenesis of IAs [Abbott 1928, Ahmetoğlu et al. 2003, Connolly et al. 2003, DuBoulay 1965, Eppinger 1871). Incidence of Intracranial Aneurysms among patients with CoA is approximately 5 times higher than that of the general population [Connolly et al. 2003]. The incidence of IA rupture in CoA patients (4.8%) [70,83 Mercado et al. 2002, Reifenstein et al. 1947] is also higher than the estimated rate of rupture in the general population, which is less than 1% [Weir et al. 1996]. In spite of CoA being a well-established risk factor for IA formation, [Abbott 1928, Ahmetoğlu et al. 2003, Connolly et al. 2003, DuBoulay 1965, Eppinger 1871] the exact underlying mechanisms for this association remain poorly understood. After measuring the flow-rates in the cerebral vasculature in patients with Coarctation of Aorta, an analysis of the different haemodynamic factors

28
inside Intracranial Aneurysms was performed. The possible role of haemodynamics is discussed in this context in a background of relevant literature. A better understanding of the aetiopathogenesis of the IA formation and rupture may help clinicians in preventing and treating the disease effectively. No study is perfect. It is therefore imperative to analyze the strengths and weaknesses of any work objectively. Towards the end of each section, limitations of the each study are discussed. This will provide readers and future workers a comprehensive insight in the methodology as well as enable them to reduplicate the studies, if required. Overall inferences and conclusions drawn from the work as a whole are given at the end of the manuscript along with scope for future work.

29
OVERVIEW 2.1: Introduction 2.2: Materials and Methods 2.3: Understanding the Natural History and Aetiopathogenesis of Intracranial Aneurysms 2.4: Importance of Haemodynamic Factors 2.5: Management of Intracranial Aneurysms: the History of a Paradigm Shift 2.6: Computational fluid dynamics: the concept and need 2.7: How Long We Have Come So Far: A Focused Review of Literature of the Studies Published on the Application of Computational Fluid Dynamics in the Field of Intracranial Aneurysms 2.8: Conclusions My contribution: I performed all literature reviews included in this chapter, independently. 2.1 Introduction In the first section of this chapter I have reviewed the pertinent literature exploring the natural history of Intracranial Aneurysms (IAs) including incidence, anatomical locations, and different classifications. The phenomenon of ‘initiation’, ‘growth’ and ‘rupture’ are addressed separately with their possible mechanisms and different theories behind them with a focus on the possible role played by different haemodynamic factors in each stage. History as a whole plays a paramount role in motivating scientists as well as providing us a foundation for future work. The history of management of Intracranial Aneurysms, the history of Computational Fluid Dynamics (CFD) and the current status of CFD in the field of Intracranial Aneurysms, is therefore analysed in detail by conducting a focused review of relevant literature in the later sections of this chapter. 2.2 Materials and Methods for Conducting Review of Literature A thorough search of different medical and non-medical databases was conducted. The databases searched were Pubmed®, Cochrane®, Medline®, Embase®, Experta Medica®, Cinahl®, Citation Index®, National Library for
CHAPTER 2.0: REVIEW OF LITERATURE

30
Health®. General-purpose search engines such as Google™, Google-scholar™, and AltaVista™ were also used to generate search leads, which were further followed, by searching specific medical databases. I searched the different databases from the years 1910 to 2014. Strings from the bibliographies and references used by different authors of the published papers were also followed to retrieve the articles. The full text articles sourced through Sheffield Health Sciences Library, Northern General Hospital Library, The British Library, British Medical Association Library and British Museum. The full-text of the required articles was also obtained from the concerned journals. The authors of some papers were contacted directly if I was unsuccessful in retrieving the paper from any other source. Help of professional translators was taken to translate the articles obtained in languages other than English. Some unpublished work is also included in the data analysis after obtaining the relevant permissions from the concerned authors. The different key words used for searching were: "intracranial/ cerebral + aneurysm + management", "intracranial/ cerebral + aneurysm + treatment", " intracranial/ cerebral + aneurysm + surgery", " intracranial/ cerebral + aneurysm + coiling", " intracranial/ cerebral + aneurysm + history", "intracranial/ cerebral + aneurysm + management + unruptured", "intracranial/ cerebral + aneurysm + aetiology", "intracranial/ cerebral + aneurysm + aetiopathogenesis" "intracranial/ cerebral + aneurysm + initiation" "intracranial/ cerebral + aneurysm + growth", "intracranial/ cerebral + aneurysm + rupture", "intracranial/ cerebral + aneurysm + natural + history", "computational + fluid + dynamics", “CFD”, “numeric simulations”, “CFD + validations”, “CFD + applications + medicine”, etc.
2.3: Understanding the Natural History and aetiopathogenesis of Intracranial Aneurysms
2.3.1: Incidence Depending upon the population sample, observers’ competence and the method used, the incidence of intracranial aneurysms varies in different autopsy series from 0.9% to 11% [Chason et al 1958, Cohen 1955, Jakubowski et al 1978]. The average annual prevalence of unruptured aneurysms in a population can be considered around 5% [ISUIA 1998, Kondo et al 1997]. The incidence is expectedly increasing with the advent of non-invasive techniques such as CTA, MRI and MRA. Intracranial aneurysms are rare in children, especially in first decade, with the incidence being highest during 4th, 5th and 6th decades [Kondo et al 1997]. The sex ratio changes with location. They are more common in women in

31
the internal carotid location (2:1) while the ratio is reversed in the middle cerebral artery (2:3). Multiple aneurysms can occur in 15 to 31% of the population [Kondo et al 1997]. The regional variations are reported with publications claiming higher incidence from Japan [Suzuki et al 1971].
2.3.2: Anatomic Location Most intracranial aneurysms arise in and around the circle of Willis, with peripheral aneurysms remaining a rarity. The frequency of IAs at different locations is given in Table-2.1. An aneurysm is usually formed at an arterial bifurcation or at the convexity of an arterial bend, the direction the axial blood stream would have taken if the curve were not there (Figure-2.1) [Rhoton 1980].
2.3.3: Classification of Intracranial Arterial Aneurysms Intracranial aneurysms are typically classified on the basis of their location (on the artery, anterior or posterior circulation), morphology (saccular, fusiform, dissecting), aetiology (traumatic, inflammatory, neoplastic), size etc., as given in Table-2.2 and Table-2.3. In addition, the microaneurysms of Charcot and Bouchard can be found on the small perforating arteries in hypertensive individuals.
Table 2.1: The frequency of Intracranial Aneurysms as per different arterial locations (%) Author/ Year Type of Study No. Of Cases MCA ACA ICA VA
Kassell et al 1990
Cooperative 3521 22 39 30 4
Sah et al 1969
Cooperative 2630 20 34 41 4
Stebehns 1972
Case Series 5267 20 31 38 5
Stebehns 1972
Autopsy 8000 33 30 24 12
NB: MCA; middle cerebral, ACA; anterior cerebral, ICA; internal carotid, VA; vertebro-‐basilar

32
Figure 2.1: The common anatomical locations for IAs in cerebral vasculature. (Source: http://www.usmle-forums.com)
2.3.4: Histopathological Considerations
An understanding of the histological structure of a cerebral arterial wall is essential before the exact aetiopathogenesis of intracranial aneurysms can be discussed. A typical cerebral artery contains three layers: an outer adventia, a prominent muscular media and, the inner most intima lined by a layer of endothelial cells. The intima is separated from media by means of an internal elastic lamina. However, contrary to the systemic arteries the external elastic lamina is absent in cerebral arteries. Intimal fat pads are localised thickening of intima seen around bifurcations mostly at lateral angles, face, dorsum and apex.

33
‘Medial defects of Forbus’, encountered occasionally, are the places where the muscularis media is deficient leaving the remaining two layers with elastic lamina. The important histopathological differences between the walls of an artery and an aneurysm are summarized in Table-2.3. The wall of an aneurysm is usually deficient in media, which ceases abruptly at the
neck. The aetiopathogenesis of an intracranial aneurysm can be divided in to three phases: initiation, growth and evolution and rupture.
2.3.5: The Initiation-Growth-Rupture Continuum The natural history of an intracranial aneurysm can be divided into three phases: initiation, growth and rupture. It is quite intuitive to speculate that the factors, which are responsible for the formation of an intracranial aneurysm, will promote its growth as well, eventually leading to its rupture. Current evidence suggests, that some continue to work on all three phases, there are other factors superimposed on these background forces that act exclusively on each phase. The different aetiological factors playing roles in the pathogenesis of an intracranial aneurysm are shown in Table-2.3. The important theories for each phase are discussed in detail in the following sections. Whereas trauma, infection, tumours, radiation and other factors can play a role in 1-2% intracranial aneurysms, most develop spontaneously.
Table 2.2: Classifications for Intracranial Arterial Aneurysms Morphology Size Location Aetiology Saccular Fusiform Dissecting
<3mm
3-6mm
7-10mm
11-25mm
e>25mm
Anterior Circulation Internal Carotid
a.Carotid canal b. Intracavernous c.Paraclinoid (Ophthalmic) d.Posterior Communicating Region e.Carotid Bifurcation
Anterior Cerebral
a.A1 (Main Branch) b.Anterior Communicating Region c.A2 (Distal Region)
Middle Cerebral
a.M1 (Main Branch) b.Bifurcation c.Peripheral
Posterior Circulation Vertebral
a.Main Trunk b.PICA Posterior Inferior Cerebeller Region
Basilar
a.Bifurcation b.Superior Cerebeller Region c.AICA (Anterior Inferior Cerebeller Region) d.Basilar Trunk e.Vertebrobasilar Junction Region
Posterior Cerebral
a.P1 (Proximal PCA) b.P2 (Distal PCA)
Idiopathic
Inflammatory
Neoplastic
Traumatic
Source: Wilkins RH, Rengachary SS. Neurosurgery. pp. 2198, 2nd ed, 1996, McGraw Hill, USA.

Table 2.3: Aetiologies of Intracranial Arterial Aneurysms Saccular Aneurysms
A. Hemodynamic B. Structural C. Genetic D. Traumatic a)Uneven pulsatile pressure head distribution e.g. at bifurcations/ branching/ convex surface of curves, leading to change in different hemodynmic factors b)Increased Blood Flow
i.AVM ii.Aplasia/Hypoplasia/Agenesis/ Contralateral vessel ligation iii.Persistent Foetal Circulation-
a)Carotid Basilar- Trigeminal/Otic/ Hypoglossal/ Proatlantal b)Basilar Middle Meningeal
iv.Increased Blood Pressure (+/-Vessel Wall Defects)
*Essential Hypertension *Coarctation of aorta *APKD *Fibromuscular Dysplasias *Renal Artery Stenosis
a)Combined Media/ Elastica defects
b)Preaneurysmal
lesions –Infundibula –Thin Areas -Microaneurysms
a) Familial intracranial aneurysms
a)Skull fracture
b)Syndromes Associated with Aneurysms *Ehlers-Danlos syndrome *Marfans’s syndrome *Pseudoxanthoma elasticum *Rendu-Osler-Weber
syndrome *Klipple-Trenaunay-
Weber syndrome *Type III collagen
deficiency
b)Penetrating Injuries c)Iatrogenic- in Surgery
E. Infectious F. Neoplastic G. Disorders affecting blood Vessels
G. Radiation
i.Bacterial ii.Fungal
i.Metastatic *Choriocarcinoma *Atrial Myxoma *Undifferentiated Ca ii.Primaary iii.Aneurysms associated with tumours – Pitutary adenomas
i.Giant Cell Angiitis ii.SLE iv.Moyamoya disease v.Sickle cell anaemia
Radian induced saccular aneurysms
Fusiform Aneurysms A. Atherosclerosis B. Structural C. Genetic D. Infectious
Most common cause of Fusiform Aneurysm
i.Loss of normal Elastica/ Media ii.Fibromuscular Dysplasias
*Marfans’s syndrome *Pseudoxanthoma
elasticum
Syphilis
E. Other disorders of Vs F. Hemodynamic G. Radiation Giant cell arteritis Coarctation of aorta Radian induced
saccular aneurysms
Source: Wilkins RH, Rengachary SS. Neurosurgery. pp. 2198, 2nd ed, 1996, McGraw Hill, USA.

35
2.3.5.1: The Initiation Different workers over a period of time have tried to explain the formation of intracranial aneurysms based on various factors. These factors can broadly be divided into congenital and acquired, as detailed in Table-2.4. The important theories, their positive points and limitations are discussed below. Medial defect theory: The theory is also known as congenital theory. Eppinger [Eppinger 1887] in 1887 was the first person to draw attention that the congenital defects in the elastic properties of an arterial wall can lead to aneurysm formation. Forbus [Forbus 1930] published his observations in 1930 describing the medial defects in detail. In his study involving 33 subjects (14 children, 19 adults), he found that the medial defects were present in two third of each group. He stated that the aneurysms are the acquired lesions arising at the sites these congenital medial defects due to continuous overstretching of the elastic membrane caused by the haemodynamic stresses and facilitated by the degenerative process of the elastic lamina itself. Elastic Lamellar Theory: In a case control study Glynn [Glynn 1940] compared the arterial walls from the healthy persons and the patients diagnosed with aneurysms and noted that the medial defects were present in about 80% of the arteries in both groups. As the medial defects were far more common than the incidence of aneurysms, he raised strong suspicion about the validity of medial defect theory. In order to assess the strength of the different arterial layers he created artificial defects in the arterial walls and noted that defects were able to withstand an intraluminal pressure of up to 600 mmHg exerted by an external pump without bulging. He consequently proposed degeneration of internal elastic lamina rather than the medial defects as a cause of aneurysms. Degenerative Theory: In an autopsy study, Stehbens [Stehbens 1959] found that apical and lateral angle defects were more common after the age of 6 years, suggesting a possible acquired nature, at least for some of them. He also observed that these medial defects were more common at the lateral angles of a bifurcation, whereas the most common location for an intracranial aneurysm is carina. Moreover, these defects are present in all extra and intracranial arteries of humans and animals in equal proportions but the aneurysms occur preferably in intracranial arteries of humans and remain rare in extracranial arteries and animals. He turned
Table 2.4: The factors involved in the initiation Congenital Factors Acquired Factors
Medial defects Elastic degeneration
Elastica defects Stehbens defects Origin of small vessels Inflammation
Failure of branch involution Atherosclerosis Hypertension Haemodynamic
stresses Source: Wilkins RH, Rengachary SS. Neurosurgery, 1996

36
down Forbus theory on the basis of these observations. In an extensive histopathological study conducted on 454 cerebral arteries [Stehbens 1963] he described three types of ‘preaneurysmal’ lesions: funnel shaped dilatations, areas of thinning and microscopic evaginations. These funnel shaped dilatations described by him correspond to the infundibula seen in angiography mostly found at the origin of posterior communicating artery. Unlike Forbus’ medial defects, the media was not ending abruptly in these lesions and the adventia was not thickened. Later, by various angiographic studies it has been demonstrated that these infundibula can lead to the formation of aneurysm over time [Stuntz 1970, Waga 1979]. The areas of thinning were present at the apex of arterial bifurcations. These areas had relatively thin walls, with attenuated adventitia and, absent media and internal elastic lamina. He considered these areas as pre-aneurysmal lesions because of their occurrence in the areas where the aneurysms are most commonly formed. He also noticed that these lesions bulging when subjected to a pressure of 30-mmHg pressures contrary to the medial defects. Small evaginations, the third pre-aneurysmal lesions described by him were the herniation of intima through medial defects, visible microscopically. Congenital vestigial vessels theory: Some authors like Bremer proposed that when primitive capillary plexus fail to obliterate the aneurysms can be formed. However, as no vessels are seen originating from the apex of an aneurysm, this theory was not well accepted. Drennan thought that origin of small vestigial vessels from the apex of arterial bifurcations could provide a weak spot for the aneurysms to form. No such vestigial vessels originating from the arterial forks were found in the studies done by various pathologists [Carmichael 1950]. Anomalies and variations in the circle of Willis: Variations and anomalies of the circle of Willis have been long associated with increased risk of aneurysm formation. Among all variations, a definitive correlation between the increased aneurysm incidence and an anomaly has only been found in cases of anterior communicating-anterior cerebral artery complex variations [Stehbens 1963, Stehbens 1963b]. In spite of claims of having a congenital basis, the possible underlying factors in the genesis of an aneurysm in these cases may be the haemodynamic stresses originating from an imbalance in the circulation secondary to the anomalous vasculature [Kayembe 1984]. Inflammatory theory: The theory was postulated by Handler and Blumenthal who reported nine patients developing aneurysms after post-arteritis destruction of internal elastic lamina [Handler 1954]. The

37
hypothesis however, could not get a widespread reorganization due to lack of confirmation of similar findings by other authors. Atherosclerotic theory: Atheromatous degeneration of the arterial wall in the genesis of an intracranial aneurysm was proposed by Kerpola and was supported by Walker and Allegre [Walker and Allegre 1954]. In spite of these reports, a definitive cause and effect relationship could not be established. Hypertensive theory: Hypertension has long been speculated as an underlying cause of cerebral aneurysms, working on the background of congenital medial defects. The Co-operative study of Intracranial Aneurysms showed that the incidence of hypertension was higher in the group with larger aneurysmal size. This however may reflect the high incidence of hypertension in elderly population where aneurysms are more common as well. Quite the contrary, the study demonstrated a negative correlation between the age at which ruptured aneurysms reached a critical size and hypertension, although the duration of hypertension in this group of patients was not known [Walker and Allegre 1954]. Similar findings were reproduced by McCormick and Schmlasteig [McCormick and Schmlasteig 1977] when they found no difference in the incidence of hypertension in a group of patients harbouring cerebral aneurysms at autopsy. In their study on 212 age-matched patients, Andrews and colleagues [Andrews and Spiegel 1979] found that the incidence of hypertension was significantly higher in the population with aneurysms. Both men and women with hypertension were twice as likely to develop aneurysm as compared to their non-hypertensive counterparts. They concluded that increasing age; high systolic and, diastolic pressure had good correlation with increased incidence of cerebral aneurysms in women, but not in men. Kwak and co-workers reported similar findings from Japan [Kwak et al 1979]. The increased incidence of intracranial aneurysms in animal models with experimentally induced hypertension also testifies to the role of hypertension in the genesis of cerebral aneurysms. Therefore, on the basis of the available clinical and experimental data it can be concluded that the hypertension plays a crucial role in the initiation of the cerebral aneurysms. However, its role in growth and rupture remained controversial.

2.3.5.1.1 Association of intracranial aneurysms with other diseases: Arteriovenous malformations (AVMs): The co-existence of intracranial arteriovenous malformations and related saccular aneurysms was initially described in 1925, and later further documented in 1930 and 1931. The incidence of a coexisting aneurysm in patients harbouring an AVM ranges from 2.7% to 16% (in the majority of studies diagnosed by means of cerebral angiography). Aneurysms associated with an AVM have also been reported in 5-7% of intracranial haemorrhage [Kim et al 2004]. Following the recent significant advancements in neuroradiology it has now been recognised the two lesions may co-exist more often than estimated before. Such association is mostly thought to be secondary to haemodynamic imbalance and is discussed in detail in haemodynamic section. Association with other diseases and genetic aspects: Genetic factors have also been implicated in the pathogenesis of intracranial aneurysms. Several epidemiological studies have demonstrated increased occurrence of these lesions in the first-degree relatives of the patients with cerebral aneurysms [Ronkainen et al 1998, Schievink et. al. 1995]. As it is evident from Table-2.3, the higher prevalence of cerebral aneurysms have been noted in various hereditary conditions like adult polycystic kidney disease (APKD), Ehlers-Danlos syndrome, Marfans’s syndrome, Pseudoxanthoma elasticum, Rendu-Osler-Weber syndrome, Klipple-Trenaunay-Weber syndrome, and Type III collagen deficiency. A number of studies have been done in order to establish the genetic link by analysing the encoding for protein synthesis in the genes [Kuivaniemi et al 1993, Peters et al 1999]. Apart from the associations with some genetic mutations, a clear evidence for the genetic basis for the aetiopathogenesis an intracranial aneurysm is missing. Associations of cerebral aneurysms have also been suggested with pituitary tumours [Jakubowski and Kendall 1978] and moyamoya [Adams et al 1979] disease. Stebehns [Stehbens 1962] conducted an autopsy study to compare the incidence of congenital anomalies in the patients having intracranial aneurysms with the normal population. He found no difference in the occurrence of these anomalies in both the groups. However, the sample size taken was not statistically significant. After reviewing the relevant literature he later concluded that only coarctation of aorta and adult polycystic kidney disease (APKD) had a significant association with cerebral aneurysms. The increased incidence of hypertension in these two conditions can be a contributory factor.

2.3.5.2: The Growth Most of the aneurysms don't grow in size is a general observation of Neurosurgeons and Neuroradiologists. However, sometimes it is difficult to imagine that an aneurysm will remain static in size forever. Recent evidence indicates that these are dynamic lesions with de-novo formation in the later life and growth in size of those already formed. In their recent publication (Aug 2008) in Journal of Neurosurgery Koffijberg and co-
authors [Koffijberg et al 2008] conclude that the intracranial aneurysms don't follow a linear pattern of growth (Figure-2.2). They grow in spurts with periods of no growth in between and don't follow a strict growth pattern. Most of the aneurysms they grow initially to attain a particular size, stabilize there and then some rupture suddenly without changing their size. In a follow-up study Wermer et al [2005] over a period of 10 years 13 out of 53 (24.5%; 95% CI-0.31-0.71%) aneurysms enlarged in size. Eleven aneurysms increased in size by 1-3 mm, one enlarged 3-5mm while one grew >5mm. The mean enlargement rate calculated by them was between 0.12 and 1.3 per year. The main risk factors for aneurysmal analysis were current smoking (HR 3.5, 95% CI-1.4-8.7), history of hypertension (HR 1.9, 95% CI 0.9-4.4) and multiple aneurysms. Other risk factors were positive family history and female sex. Smoking and female sex have also previously been shown as risk factors for aneurysmal growth by Juvela el al [Juvela el al 2001]. The growth of an intracranial aneurysm is mostly explained on the basis of pathological alterations in the mechanobiological properties of aneurysmal wall (e.g. stretching of collagen fibres and re-deposition of more collagen leading to fibrosis and thickening of aneurysmal wall), haemodynamic factors (WSS, OSI, Jet of blood stream, etc.) and as a passive yield to blood pressure. Tateshima et al in 2007 [Tateshima et al 2007] showed differences in the enlargement in their study as assessed by univariate Cox regression haemodynamic patterns of Intracranial Aneurysms that grew over a period of time (Figure-2.3). In an effort to analyse the mechanisms responsible for the
Figure 2.2: Graphs showing the average size of aneurysms at the time of rupture during follow-up (left) and the average aneurysm size as function of patient age (right). For high mean growth rates almost all aneurysms rupture in the first 40 years of follow-up but small rupture rates indicate towards the nonlinear pattern of the growth. Source: Koffijberg et al J Neurosurg 2008

40
growth of an aneurysm Crompton [Crompton 1966] suggested that the cellular and fibrin proliferation of the wall of an unruptured aneurysm might result in it’s weakening. The weak point subsequently may give way leading to aneurysmal rupture or it may organise perhaps forming a ‘bleb’
(a small nipple shaped outpouching of the wall) with resultant growth in the size. Due to repeated organization and fibrosis the wall of a larger aneurysm may actually get thicker, however more friable with less tensile strength.
Figure 2.3: Showing the intra-aneurysmal flow pattern inside an aneurysm before and after the growth. (Source: Tateshima et al)

Table 2.5: Activities or Events preceding Aneurysmal SAH Activity/Event Patients No. Percent % Chatting/Watching television/ Staying home
71 13.8
Defecation/micturition 65 12.7 Working at workplace 63 12.3 Taking a bath/Shower 44 8.6 Sleeping/resting 41 8.0 Housework/Housekeeping 39 7.6 Shopping/outing 31 6.0 Brushing teeth/ washing face 25 4.9
Eating/drinking 24 4.7 Sport/exercise 14 2.7 Driving/riding a bike 12 2.3 Others 27 5.3 Unknown 57 11.1 Total 513 100.0 Source: Matsuda et al 2007
2.3.5.3: The Rupture Rupture of an intracranial aneurysm unfortunately remains the least well-understood phenomenon. Rupture occurs typically when the stresses in the aneurysm wall exceed its strength. Different authors have suggested various risk factors for rupture. Hypertension has been found to be associated with rupture in up to 60% of the cases, as shown in both clinical [Inagawa 2005] as well as the necropsy series [Crompton 1964].
Most of the clinical series testify to this fact [Broderick et al 2003, Knekt et al 1991, Leppala et al 1999, Mhurchu et al 2001] whilst some contradict it [Juvela et al 1993, Longstreth et al 1992]. In his case control study on 247 patients and equal number of healthy volunteers, Inagawa [Inagawa 2005] found hypertension, cigarette smoking and hypercholesterolemia significantly more common in the patients with SAH. Diurnal and seasonal variations in the incidence of SAH have been reported in previous studies [Inagawa et al 2002, Inagawa 2000]. SAH exhibits two peaks during the day; between 6 am to 10 am and, between 4pm to 8pm. Again, high incidence of SAH in winters has been noted as compared to summers [Inagawa et al 2002, Inagawa 2000]. The instantaneous peaks in the blood pressure have been suggested as possible factor responsible for these variations and likely to play an important role in affecting the rupture [Inagawa et al 2002, Inagawa 2000]. The relationship between cigarette smoking and increased SAH has widely been studied [Broderick et al 2003, Mhurchu et al 2001, Juvela et al 1993,

42
Longstreth et al 1992]. It has been suggested that smoking can increase the risk of rupture by accelerating the rate of formation of de-novo aneurysms as well as growth. Alpha -1 antitrypsin deficiency [Gaetani et al 1996] and degradation of internal elastic lamina in vessel walls [Qureshi et al 1998] have been asserted as a basic mechanism affected by smoking. Cigarette smoking causes acute rise in systolic blood pressure [Cellina et al 1975], these instantaneous spikes, in turn can be trigger the rupture [Longstreth et al 1992]. Increasing size and the presence of multi-loculations has also been implicated in the aneurysmal rupture. In Crompton’s [Crompton 1966] series the majority of the ruptured aneurysms were more than 5mm in their maximum diameter. A size of 2 - 5mm was the critical size suggested by Crompton at which an aneurysm becomes suddenly unstable. Many studies including the recent ISUIA studies [Wiebers 2003, ISUIA 1998] have reiterated the importance of the larger size making aneurysm more prone for rupture. The critical size however, suggested by more recent studies is 7mm. It is seldom possible in vivo to determine the exact site of rupture. However, in 271 of 289 cases where the site of rupture could be localised by Crompton [Crompton 1966], the ruptured had occurred from the apex in 227 cases. 57% of the ruptured aneurysms in the same series had multiple loculations or blebs or daughter nuclei as against 16% of the unruptured aneurysms. Various activities have been proposed as risk factors for the aneurysmal rupture. Like Inagawa and colleagues [Inagawa et al 2002, Inagawa 2000], Matsude et al [Matsude et al 2007] also found a bimodal peak pattern for the aneurysmal SAH during a day. Peaks occurred during early morning (6-9 am) and late evening (6-9 pm), the period corresponding to the daily routine activities such as defecation, micturition, brushing teeth, washing face, dressing, drinking, and taking bath. 8% of all SAHs, however occurred during sleep or rest. Whereas they explained the morning peaks in the SAH on the basis of circadian spike of the blood pressure, no explanation could be found for the evening peaks. Some of the daily routine activities, like defecation and micturition, associated with a significant risk of bleed, have a predominant physiologic response essentially similar to Valsalva manoeuvre [Matsuda et al 2007]. The sudden changes in the arterial pressure during these activities can precipitate the aneurysmal rupture [Matsuda et al 2007]. Apart from the intramural factors, the peri-aneurysmal environment has also been proposed to influence the risk of rupture. In a retrospective analysis, Ruiz et al found that the existence of contact constraints between an intracranial saccular aneurysm and the surrounding structures had a significant influence on its shape and risk of rupture [San Millan Ruiz et al 2006]. The main activities at the time of rupture are given in the Table-2.5.
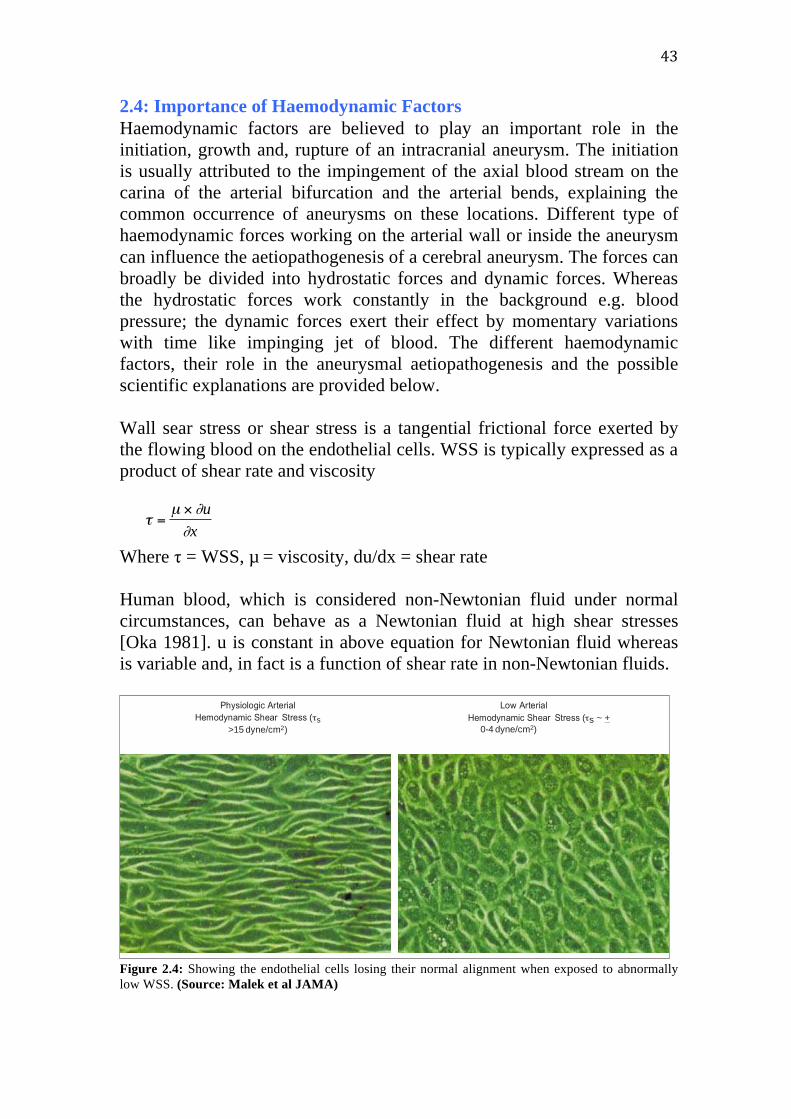
43
2.4: Importance of Haemodynamic Factors Haemodynamic factors are believed to play an important role in the initiation, growth and, rupture of an intracranial aneurysm. The initiation is usually attributed to the impingement of the axial blood stream on the carina of the arterial bifurcation and the arterial bends, explaining the common occurrence of aneurysms on these locations. Different type of haemodynamic forces working on the arterial wall or inside the aneurysm can influence the aetiopathogenesis of a cerebral aneurysm. The forces can broadly be divided into hydrostatic forces and dynamic forces. Whereas the hydrostatic forces work constantly in the background e.g. blood pressure; the dynamic forces exert their effect by momentary variations with time like impinging jet of blood. The different haemodynamic factors, their role in the aneurysmal aetiopathogenesis and the possible scientific explanations are provided below. Wall sear stress or shear stress is a tangential frictional force exerted by the flowing blood on the endothelial cells. WSS is typically expressed as a product of shear rate and viscosity
Where τ = WSS, µ = viscosity, du/dx = shear rate Human blood, which is considered non-Newtonian fluid under normal circumstances, can behave as a Newtonian fluid at high shear stresses [Oka 1981]. u is constant in above equation for Newtonian fluid whereas is variable and, in fact is a function of shear rate in non-Newtonian fluids.
Figure 2.4: Showing the endothelial cells losing their normal alignment when exposed to abnormally low WSS. (Source: Malek et al JAMA)
(τs
>15 dyne/cm2)
(τs ~ +
0-4 dyne/cm2)
€
τ =µ × ∂u
∂x

44
The normal physiological range of WSS is crucial for endothelial cells to maintain their normal function and integrity. One of the important properties of WSS is to influence the behaviour of endothelial cells. In their study on the haemodynamics of the intracranial aneurysms Malek et al [Malek et. al. 1999] demonstrated a good correlation between the low WSS and aneurysmal growth. They found that the endothelial cells subjected to low WSS in a bovine artery lost their normal alignment (Figure-2.4). It was seen that whereas the normal endothelial cells produced high growth inhibitors and low growth promoters, the ratio was reversed in endothelial cells subjected to low WSS (Table-2.6).
Table 2.6: The ratio of normal growth mediators is reversed in endothelial cells exposed to abnormally low WSS in right column. Source: Malek et al JAMA, 1999

45
WSS is directly proportional to the velocity and viscosity of blood flow inside the vessel or sac and will be highest in an end-on aneurysm while will be lowest in a side-on aneurysm, with bend-on aneurysm lying in between. Tateshima et al [Tateshima et al 2003] noted high WSS at the neck of the parent aneurysm and at the margin of the daughter bleb. The pre and post growth peak WSS were 5.61 n/m2 and 7.38 n/m2 respectively they attributed this high WSS to the flow separation and flow impingement at the margin of the bleb. Luscher et al 1993 [Luscher et al 1993], found that the release of the endothelial derived growth and relaxation factors are WSS dependant, which in turn regulate the vascular remodelling endothelial cells and have a capacity to remodel the blood vessel in response to change in WSS. Increased WSS stimulates the endothelial cells to produce the matrixmetalloproteases, which are responsible for the degradation of the internal elastic lamina [Sho et al 2002]. Tromp et al in 2004 [Tromp et al 2004], showed elevated expression of metalloprotienases-13 in abdominal aortic aneurysm and thought them to be responsible for destructive remodelling present in extracellular matrix of AAA. Focal high WSS is the predisposing factor in formation of aneurysm in healthy cerebral artery. Drexler in 1999 [Drexler and Hornig 1999] demonstrated that low WSS leads to endothelial dysfunction in coronary arteries. Pohl et al 1991 [Pohl et al 1991] proved that increased flow leading to increased WSS accelerates the release of endothelial derived relaxation factors (EDRF) from endothelium resulting in dilatation of an artery and demonstrated marked flow dependant dilatations in small arterioles in vivo and in vitro. The same authors also showed increased dilatation responses with an increasing viscosity indicating that the shear stress is the stimulus for the flow dependant dilatation. These flow-induced dilatations were abolished by inhibition of EDRF. Flow shear stress increases the production of N2O leading to increased EDRF release. It has been suggested by experimental studies that the shear stress may be directly or indirectly linked to the activation of Ca++ dependant endothelial N2O synthase [Busse et al 1990]. Elevated shear stress augments the release of ATP and substance-p from endothelium [Milner et al 1990], which in a paracrine manner may enhance EDRF production more directly [Pohl et al 1991]. Increased shear stress leads to the hyperpolarisation of the endothelial cells by mobilising the Ca++ from intracellular stores in the cultured endothelial cells [Ando et al 1988] probably via activation of phospholipase C [Bhagyalakshmi and Frangos 1989] and activation of K+ channels [Olesen et al 1988]. How shear stress transduces the signals to endothelial cells tom release EDRF production is not clear. It has been hypothesised that stress acts on the structures anchored in the endothelial membrane and mechanically enhances their interaction between regulatory proteins and their targets.

46
Neuraminidase inhibits the flow dependant dilatation by clearing the sialic acids, which are present in high concentration at the endothelial surface [Born and Palinski 1988] as an integral component of glycoproteins and lipoproteins, may act as mechanoreceptors. Fukuda et al [Fukuda et al 2000] examined the role of N2O in the degenerative changes associated with and, preceding to the formation of a cerebral aneurysm in experimental models they found high localisation iNOS (Inducible N2O synthase) at the site of aneurysm formation in both rat and human arteries, as demonstrated by increased immunoreactivity. In contrast to its counterpart eNOS, iNOS is not commonly present in arterial walls it is usually synthesised or used within the endothelial cells and the smooth muscle cells by a number of different stimuli including high WSS. They showed that an NOS inhibitor, amino guanidine attenuated the early degenerative changes associated with new aneurysm formation. They also showed that a blood-thinning agent Batroxobin (a defibrinogenic agent) also prevented early iNOS induction and thus early aneurysm formation by lowering the WSS. This phenomenon was explained by virtue of primarily decreasing the blood viscosity. Blood viscosity is determined by the haematocrit, which in turn is dependent upon its fibrinogen concentration [Oka 1981]. Bx can reduce the blood viscosity by lowering its fibrinogen concentration [Ohba and Aoyama 1985], which in turn decreases the wall shear stress. Bx doesn’t have any effect on cerebral blood flow and MABP. They concluded that N2O especially one derived from iNOS is a prerequisite for a development for a new aneurysm in cerebral blood vessel. In their earlier studies they experimentally induced cerebral aneurysms in rat and monkeys. They found that the degenerative changes associated with aneurysm formation was almost exclusively localised at arterial bifurcation especially the intimal fat pad and neighbouring distal portion known juxta apical groove (JAG). The role of N2O in the vessel wall damaged was proven by Beckman et al [Beckman et al 1990] and Geng et al [Geng et al 1992] in 2 independent studies. Mattson et al [Mattson et al 1998] linked iNOS with high blood pressure. Burleson [Burleson and Turitto 1996] and Steiger [Steiger et al 1988] were the other investigators who agreed with the association of site of high WSS and aneurysm formation. In their study on high WSS induced damage to endothelium and smooth muscle cells at JAG, Fukuda and colleagues [Fukuda et al 2000] classified the histopathological changes into 5 grades. Grade-1 changes are where no damage can be demonstrated, grade-2 is mild endothelial cell damage e.g. a wavy rippling of plasma membrane without smooth muscle cell damage, grade-3 corresponds to moderate endothelial cell damage and grade-4 is severe

47
endothelial cell damage. The changes are called grade-5 when damage involved smooth muscle cell in addition to severe endothelial cell damage. Table 2.7: The literature-based evidence on the importance of haemodynamics in the aetiopathogenesis of IAs Haemodynamic factors
Intracranial Aneurysm Proposed mechanism(s) References Initiation Growth Rupture
Dynamic Wall Shear Stress (WSS)
High Low Low Increased WSS increases the production of MMP-13 which in turn leads to vessel wall damage Decreased WSS increases iNOS synthesis- NO induced damage to vessel wall Low WSS increases endothelial proliferation and apoptosis
Boussel et al 2008, Fukuda et al 2000, Gao et al 2008, Jou et al 2008, Malek et al 1999, Meng et al 2007, Shojima et al 2004, Ujie et al 1999
Oscillatory Shear Index (OSI)
High/Low High High Degenerative changes in endothelium
Glor et al 2004, Goubergrits et al 2008, Mantha et al 2006
Jet of Blood Stream
Impingement Impingement Impingement Localized endothelial cell injury
Foutrakis et al 1999, Cebral et al 2005, Cebral et al 2009
Flow Pattern - - Complex Statistical association Cebral et al 2005, Cebral et al 2009
Hydrostatic Pressure High High High Passive yield/ water hammer
effect Inci and Spetzler 2000, Morimoto et al 2002, Steiger et al 1989
NB: WSS; wall shear stress, MMP-13; matrixmetalloproteneases-13, iNOS; inducible-nitric oxide synthase, NO; nitric oxide, OSI; oscillatory shear index
In 1993 Resnick and co-workers [Resnick et al 1993a, Resnick et al 1993b] identified a shear stress responsive element for iNOS on endothelial genes inducing the t-pa (tissue plasminogen activator), intracellular adhesions molecule- 1 and TGF- beta. Cooke et al in 1990 [Cooke et al 1990] demonstrated the association between high NOS and atherosclerosis. Both magnitude of WSS and duration of exposure of endothelial cells to that high WSS, played an important role in the induction of iNOS in their experimental study. Wagner et al [Wagner et al 1997] found that no iNOS was induced when the smooth muscle cells were exposed to the lower shear stresses in the order of 1.1 to 2.5 dynes per cm2 for a smaller period of time i.e. less than 24 hours. Table-2.7 below summarizes literature-based evidence on the role of haemodynamic factors in the aetiopathogenesis of Intracranial Aneurysms. Analysis of the haemodynamic factors thus, may act as a crystal ball where we can see the future of an intracranial aneurysm and can take necessary interventions to modify it, as and when required.

48
2.5 Management of Intracranial Aneurysms: The History of a Paradigm Shift 2.5.1: Background and Objectives With the advent of technology, management of intracranial aneurysms (IAs) have undergone a tremendous evolution. In order to appreciate the modern achievements, it is imperative to analyse the past. Apart from the masterly inactivity the initial treatment for IA was confined to the ligation of ipsilateral carotid artery mostly resulting in high morbidity and mortality. In 1927 Egas Moniz introduced cerebral angiography following which Dandy clipped the first aneurysm in 1937. This led to the surge in neurological surgeries to clip all ruptured aneurysms. Owing to the disastrous consequences originating from indiscriminate surgeries and poor surgical and neuroanaesthetic techniques, the euphoria however didn’t last long. Inherent limitations associated with surgical management inspired physicians to search for new and safer alternatives. Whilst the roots of some of these endovascular techniques can be traced back to the early nineteenth century, it’s only through the incredible progress in the technology over last couple of decades that made their safe and widespread clinical application possible. Since then, it has rapidly become a primary therapeutic option in most of centres worldwide. Present article summarises these diagnostic and therapeutic developments, in chronological order with an eye on the potential scope for research and future progress. 2.5.2: Introduction With the advancements in modern microsurgical and endovascular techniques coupled with improved neuroanaesthetic approaches, the morbidity and mortality figures associated with aneurysmal subarachnoid haemorrhage (SAH), have improved significantly. Whereas most of the recent advancements in the neurological therapy of IAs are achieved in past 200 years, the journey of success began over 4000 years ago. The following sections discuss the temporal evolution of different diagnostic and treatment modalities along with an analysis of the important milestones achieved and their long-term implications. With all this recent technological progress, the protocols to treat the ruptured IAs became quite clear over time however, the management of unruptured IAs (UIAs) still remains controversial. These uncertainties are

49
mainly due to an incomplete understanding of natural history of IAs and risks associated with active management [ISUIA-1998] The difficulties are further enhanced by the fact that the poor surgical outcome is dictated by the same factors [Komotar et al 2008] that currently form the basis of surgical decision making [Khanna et al 1996]. 2.5.3: The Early Developments The earliest description of intracranial or subarachnoid haemorrhage (SAH) as a cause of death in human beings dates back to the ancient
Biblical times. The first anecdotal evidence of an IA as well as the earliest attempt to treat it comes from Egypt. It is recorded in Ebers Papyrus, one of the oldest preserved medical documents that in 2725 BC Imhotep, who was an Egyptian architect cum physician, tried to treat an aneurysm by using a fire glazed instrument [Lippi 1990]. The term aneurysm, derived from Greek word aneúrysma (ana; throughout + eurus; wide), meaning ‘to dilate’, was introduced by Claudius Aelius
Galen, a philosopher of Greek origin in 200 AD. In 1664, Thomas Willis [Willis 1664], (Figure-2.5) an
Oxford-based physician provided the first scientific account of the cerebral vasculature later being honoured by the eponym ‘circle of Willis’. Almost a century later in 1761 [Morgagni 1761] an Italian anatomist from the city of Padua, published the first anatomical write-up describing the entity of an intracranial aneurysm. It however, took another four decades to recognize the definitive clinical importance of IAs until Blane in 1800 published the clinical and autopsy findings of a patient with bilateral carotid cavernous aneurysms, described by John Hunter in 1792. The credit of first clinical diagnosis of an intracranial aneurysm goes to Hutchinson [Hutchinson 1875] in 1861. Based on the neurological signs he successfully diagnosed an intracranial aneurysm in a patient 11 years before his death. However, in spite of the handful of clinical diagnoses, the exact preoperative localization of an IA remained a challenge to clinicians until late.
Figure 2.5: Thomas Willis (Source:http://www.accu-‐chek.com)

2.5.4: The Surgical Era Understanding the deadly nature of these lesions, the earliest efforts of modern times to treat them by surgery were started in the form of carotid ligation. The concept presumably stems from an important observation made by Jean-Louis Petit in 1760s that there were no significant adverse effects on the human brain even after the complete occlusion of one carotid artery by thrombosis. The carotid ligation was initially popularised by John Hunter (Figure-2.6) in 1800s, and was known as ‘Hunterian ligation’ after him [Hutchinson 1875]. The first ever attempt to treat an aneurysm by ‘Hunterian ligation’ was endeavoured by Cooper in 1808 [Cooper 1852]. Carotid ligation remained popular and appeared a reasonably successful treatment except for the fact that in most of the cases it carried a significant risk of cerebral infarction and hemiplegia. Given the high mortality and morbidity produced by the acute occlusion of the carotids, the concept of gradual occlusion was introduced [Crutchfield 1959]. Numerous metallic clamps were designed
that could be tightened over a period of several days. The clamp could be reopened should the patient become symptomatic. Because of unacceptably high complication rates, the ICA ligation was gradually replaced by common carotid artery ligation. Due to the lack of preoperative localization, most of the initial ‘direct surgical encounters’ of IAs were unplanned and were limited to their accidental surgical exposures. Sir Victor Horsley (Figure-2.7) [Drake 1985] was one of the first surgeons to witness an IA during a craniotomy in
1885, when he was operating on a patient with a preoperative diagnosis of a middle fossa tumour, which turned out to be an IA. He treated the patient by ipsilateral carotid ligation. Two other important discoveries that altogether changed the ways of diagnosis and management of IAs can be considered as contributing to the dawn of modern neurovascular surgery. Quincke introduced the technique of lumber puncture in 1891 [Quincke 1891]
while Egas Moniz discovered the cerebral angiography in 1927 [Moniz 1927]. The first direct planned surgical intervention to treat an intracranial aneurysm however,
was endeavoured by Norman Dott on April 22 1931, when he stopped bleeding from an intraoperatively
Figure 2.8: Walter Dandy (Source: Medscape)
Figure 2.6: John Hunter (Source:http://citizenscientistsleague.com)
Figure 2.7: Sir Victor Horsley
(Source: Medscape)

51
ruptured carotid aneurysm by wrapping a muscle around it [Dott 1933]. The preoperative diagnosis of a carotid bifurcation IA was localised clinically and the procedure was tolerated well. The efforts were further matured by Walter Dandy (Figure-2.8) who gets the credit for the first successful clipping of a preoperatively diagnosed IA
[Dandy 1938]. In March 1937 he treated a man of 43 by applying an ordinary flat silver clip to a pea sized IA of distal ICA. The operation was performed around six-years after Egas Moniz demonstrated the first IA by cerebral angiography in 1931. The diagnosis however, was localised solely on the basis of clinical signs. Dandy himself admits that such a precise clinical localization of an IA warranting a surgical attack is but a rare phenomenon [Dandy 1938]. Clipping became established as a new procedure to secure the ruptured IA, soon after Dandy published his monograph in 1938. Justification of Surgery: In absence of clear scientific evidence it was often difficult for earlier neurosurgeons to justify their surgical decisions against medical or conservative management. Strong doubts were raised about the effectiveness of surgery as most of the studies failed to show any advantage of surgery as compared with medical management (Figure-10). Continuing refinement in surgical techniques and instruments, coupled with the advancements in the neurocritical care, made the surgery progressively safer. Greenwood [Greenwood 1942] brought in the bipolar cautery in 1940, while the hypothermia was introduced by Lougheed, White and Sweet [Lougheed at al 1955] in 1953 for cerebral protection
Figure 2.9: Temporal Evolution of different surgical modalities Source: Neurosurg Focus, 2006, © AANS

52
during cerebrovascular procedures. Almost a decade later Uihlein et al [Uihlein et al 1962] performed the first intracranial aneurysm clipping using induced hypothermia and total circulatory arrest. The entity of vasospasm was demonstrated by Ecker and Riemenscheidner in 1951 [Ecker and Riemenscheidner 1951] The first operating microscope was introduced by Carl Zeiss Inc. in 1953 [Krampe 1984] a company established by the visionary German optician Carl Zeiss in 1846. Theodore Kurze from Los Angeles was the first neurosurgeon to use an operating microscope in neurosurgery in 1957 [Kurze 1964]. The twin benefits of illumination and magnification offered by the operating microscope, laid the pavement for microneurosurgery, led by Yaşargil and others. One of the earliest publications to attract the attention towards ineffectiveness of medical management of SAH came from Tappura in 1962 [Tappura 1962]. He showed that rebleeding rates were as high as 55% without any active intervention with 75% mortality. In the same year Norlén [Norlén 1963] published the results from his series of 134 patients of IAs managed surgically. He reported an astonishing success with a mortality of less than 2.5%. Over a period of time, the growing scientific evidence unequivocally established the superiority of intracranial surgery as compared to both, carotid ligation and bed rest. By the late 1970s direct clipping was accepted unanimously as a ‘gold-standard’ for the treatment of ruptured IAs. 2.5.5: Neuroradiological Developments & Invent of Cerebral Angiography The radiological localization of an intracranial pathology remained a challenge to neurosurgeons until late. In this context the discovery of cerebral angiography by Egas Moniz in 1927 [Moniz 1927] a multitalented physician from Portugal, and the demonstration of an IA by this technique in 1931 was a breakthrough research. A group of researchers, including Sir Godfrey Hounsfield [Hounsfield 1973] developed the first computed tomographic (CT) head scanner which became operational by 1971. The CT scan proved to be a crucial aid to the diagnosis of SAH due to its ability to pick subarachnoid and intraventricular blood. The early report about the first NMR image of a live human body was published by Damadian and colleagues [Damadian et al 1977] in 1977 and MRI came into clinical practice in 1982 after Sir Peter Mansfield [Mansfield et al 1979] and Paul Lauterbur [Lauterbur 1989] developed mathematical techniques that allowed rapid acquisition of MR Images possible making it a practical tool. It surpassed every

53
available imaging modality in providing exquisite soft tissue differentiation. 2.5.6: Endovascular Interventions The history of the evolution of endovascular treatment of the aneurysms is a fascinating story of ground-breaking work done by the early geniuses. Whereas roots for some of these endovascular techniques can be traced to the early nineteenth century it’s only through incredible progress in the technology over last couple of decades that made their safe and widespread clinical application possible. 2.5.6.1: Extracranial Endovascular Interventions Medical measures: Apart from masterly inactivity, workers started trying various medical compounds to induce thrombosis in aneurysmal sacs. The most commonly used pharmacological compound was potassium iodide [Keen 1916] administered systemically. Various other medical measures tried were; vinegar, iron perchloride solutions, alcohol, gelatin, ergot salts, and even hypothermia by local ice packing [Keen 1916]. These procedures however, soon had to be discontinued due to inconsistent and unpredictable results. Insertion of foreign bodies/ wiring techniques: After abandonment of medical measures various investigators started attempting to treat aneurysms by inserting foreign bodies. The earliest description of such an endovascular procedure to treat an aneurysm is given by Ransohoff [Ransohoff 1886] reciting Sir E Herne who by the turn of eighteenth century induced thrombosis in an iliac artery aneurysm by inserting heated needles into it. The same concept was later applied to treat aortic aneurysms by many authors who replaced needles with metallic wires. In spite of initial enthusiasm among its advocates the overall results from these ‘wiring’ procedures remained poor. These procedures were ultimately abandoned during the first half of the twentieth century. Emergence of the concept of electrothrombosis: The limited success of these ‘wiring’ techniques stimulated investigators to search for more efficient alternatives. It was realised that one of the important reasons for failure was the lack of sufficient thrombus formation attributed mostly to inadequate aneurysmal packing. The idea of using galvanic current as an adjunct to enhance the thrombogenicity of these metallic coils presumably has taken its inspiration from the early experimental works done by Scudamore [Duncan and Fraser 1867] in 1824. It was however Phillips in

54
1832 [Phillips 1832] who gave birth to the concept of electrocoagulation in aneurysms. CH Moore introduced wiring for the treatment of aortic aneurysms in 1864. Another dimension to it was added when Corradi in 1879 [Matas 1914] who passed the electric current through the wire. The technique was later called Moore-Corradi method after both the workers. The method remained in use for next 40 years and was adopted by many investigators. 2.5.6.2: Transcranial Approaches Due to understandable limitations in the precise localization and difficulties in accessing an IA, the early endovascular interventions were limited to the large and extracranial arteries. The initial attempts to treat an IA by iatrogenically induced thrombosis were therefore carried under direct vision during a craniotomy. In 1936 WJ Gardner [Gardner 1936] packed an accidentally opened giant IA with cotton sponges. The credit of the first successful ‘thermocoagulation’ of an IA however, goes to Werner [Werner et al 1941]. Working with Blakemore and King, in 1941 he treated a giant paraclinoid IA in a young girl. The aneurysm, resistant to multiple Hunterian ligations, was approached transorbitally. A ten-foot long silver wire was inserted through its fundus and heated for 40 sec, reportedly curing the aneurysm. Transition from transcranial to intravascular approach: The idea of using blood vessels as natural access to treat the cerebrovascular lesions may probably have taken motivation from the pioneering work done by Brooks [Brooks 1930]. He is credited with the first endovascular intervention to treat a cerebrovascular pathology. After exposing the ICA surgically, he embolised a traumatic carotid cavernous fistula in 1930 by placing a strip of muscle intravascularly. Switching from the transcranial to intravascular approach was nevertheless, not straightforward. Tortuosity, delicacy and narrowness of intracranial vasculature as well as the presence of the carotid siphon were the main obstacles for intracranial catheter navigation. This important shift could only be made possible through the development of sophisticated micro-catheter systems and intravascular delivery devices. Luessenhop and Spence [Luessenhop and Spence 1960] remained pioneers in cerebral endovascular navigation; they successfully cannulated an ICA to embolise an arteriovenous malformation (AVM) using flow-directed silastic spheres in 1960. They also set another important milestone in endovascular navigation in 1964; what is believed to be the first successful catheterization of intracranial vessels in a human being, finally shifting the focus from a transcranial to intravascular approach. With the help of a

55
glass chamber, surgically connected to the external carotid artery, they delivered a length of silastic tubing into intracranial arteries. The balloon at the tip of this flow-directed catheter was inflated temporarily to occlude the neck of a posterior communicating artery aneurysm. Superselective catheterization and magnetic navigation: Frei and colleagues [Frei 1966] from Rehvoth, Israel, added another dimension to endovascular navigation by introducing their novel microcatheter system in 1966. This high-tech system, also called POD (para-operational device) by its inventors, made superselective catheterization of intracranial vessels possible. The tip of the catheter was made of specialised soft silicone rubber to minimise vessel trauma. A micromagnet of 1 millimetre diameter, strategically placed inside the tip of the microcatheter was used to manipulate it with the help of external magnetic fields. In 1974 Hilal et al [Hilal et al 1974] published their experience with safe intracranial catheterization in 120 patients. Using a slightly modified version of magnetically directed POD catheter they catheterized many difficult to reach intracranial vessels and more importantly performed electrocoagulation of one basilar tip aneurysm, giving birth to the concept of neuroendovascular electrothrombosis. Following their initial success the magnetically directed catheters remained in use until the late 70s, however the lack of precise operator control and distortion of the fluoroscopic images by strong magnetic fields drove researchers to look for alternative methods of intracranial catheter navigation. Balloons: Convinced with the idea first given by Luessenhop and Rothenberg as early as in 1960s, [Luessenhop and Spence 1960] most of the investigators started realising with time that the best force to propel the endovascular catheter was the antegrade flow of blood itself. TJ Fogarty [Fogarty 1963] and co-workers introduced a novel balloon-tipped catheter system in 1963 to extract the arterial emboli. Fogarty catheter system proved as a milestone in the advancement of catheter technology and opened doors for the development of a range of endovascular catheters including the modern balloon-tipped catheters. The most important discovery in microcatheter technology however, was the invention of Tracker® microcatheter system in mid 1980s by Engelson [Engelson 1986]. By virtue of its unique externally steerable tip it revolutionised the way intracranial arteries were negotiated. Montgomery et al from Massachusetts Institute of Technology (MIT), USA, designed the first detachable balloon catheter in 1970 using a modified POD catheter by mounting a balloon on its tip. However, it was

56
Fedor A. Serbinenko [Serbinenko 1974] from Burdenko Neurosurgery Institute, Moscow, who not only established endovascular interventions as a treatment modality for IAs but also gets the credit for founding Endovascular Neurosurgery as a new medical discipline. Inspired by a simple observation of helium-filled balloons at May Day celebrations in Moscow’s Red Square in 1959, he spent relentless hours in the laboratory to create prototype silicone and latex balloon catheters. Using these flow-directed balloon-tipped catheters he mastered the art of balloon embolization of IAs and AVMs and performed 304 balloon endovascular procedures between 1969 and 1972 with just two mortalities [Kwan et al 1991] laying the foundation stone for modern endovascular neurosurgery. The seminal works done by him changed the management of IAs forever and he is therefore rightfully called father of endovascular neurosurgery. From balloons to endovascular coiling: Due to wide spread application and growing experience, a number of shortcomings of the balloon embolization started to become apparent. Owing to the fixed and rigid shape (round or oval) of the balloons, it was difficult to achieve 100% occlusion of the IAs, frequently leaving an insecure aneurysm at the end of the procedure. Furthermore, this potential space and the balloon-aneurysm complex together, when subjected to the continuous pulsations arising from the pulsating arterial blood column, were thought to produce a ‘water-hammer’ effect. This ‘water-hammer’ effect was reported to facilitate the IA recanalization, enlargement or delayed rupture [Kwan et al 1991]. Additionally, the balloons have also been reported to undergo slow-deflation, slowly loosening the packing further. All these drawbacks together formed the basis for the shift from balloons to coils for the endovascular treatment of the IAs. Transcatheter electrocoagulation: Therapeutic transcatheter vessel-occlusion (TCVC), which was introduced in 1930s for the treatment of carotid-cavernous fistulae, [Greenfield 1980] slowly became a well-established technique by the 70s. Thompson and colleagues provided a thorough and methodical description of the technique and uncovered its various merits and shortcomings. They also demonstrated that the clot size and the extent of thrombosis were directly related to the product of amount and duration of the current applied. Due to difficulties in precise placement of the anode in IA, TCEC was mostly used to occlude the vessels only. From ‘pushable’ coils to ‘detachable’ coils (GDC®): In the quest of selective and safe embolization of IAs Gianturco and colleagues invented a novel mechanical device in 1975, called ‘wool coils’ [Gianturco et al

57
1975]. It was one of the earliest ‘pushable’ coils where the ‘wool’ could be ‘pushed’ into target using a guide wire. In 1989 Hilal et al reported another use of short ‘pushable’ coils for the treatment of IAs. Although being relatively stiff, it was almost impossible to achieve a dense packing of IAs with these coils. Moreover, these coils were inherently non-retrievable and hence difficult to control. These ‘pushable’ coils later formed the basis of more advanced ‘detachable’ coils. The credit of inventing the modern detachable coils (commonly known as GDC®) can safely be attributed to Guido Guglielmi [Guglielmi 2009] Guido Guglielmi (Figure-2.10) was born in Rome, Italy and initially studied engineering for a while before opting for medicine as a career. Due to his great interest in engineering he studied the concept of electrothrombosis of IAs in detail and conducted a series of animal experiments in the 1980s. Guglielmi later moved to Los Angles where he
came in contact with Ivan Sepetka, a research and development engineer at Target® Therapeutics. The genesis of this state-of-the- art coiling system has changed the way Neurovascular surgery is practiced and is a unique example of a creative interdisciplinary collaboration between these two masterminds. Working together they mounted soft platinum coils of
different sizes to a stainless steel guide-wire. The thrombosis was achieved by passing an electric current to the coil once it is placed inside the IA. The coil would ‘detach’ from the delivery wire during the process of electrothrombosis due to the low melting point of the metal used to attach it to the guide wire. Another very important feature of these coils was their retrievability and softness, which at gave the operator added control over the procedure. The first GDC® was used in a human by Dr Viñuela on 6th March 1989 by treating a cavernous sinus fistula. The first IA was treated by GDC® in January 1991 at UCLA, Los Angeles. The techniques of endovascular interventions for the treatment of IAs have exploded in the past few decades. From a second line treatment in the early 1990s it has rapidly become a primary therapeutic option in most of the centres worldwide. A large, multicentric, prospective, randomised, controlled, clinical trial, the International Subarachnoid Aneurysm Trial (ISAT), was conducted
Figure 2.10: GDC® Detachable coils Source: http://synapse.koreamed.org

58
under the leadership of Neurovascular Research Unit, Oxford, UK. It has indicated that the outcome in terms of survival free of disability at 1 year is significantly better with endovascular coiling as compared to surgical clipping. It however, showed that the risk of re-bleed is slightly higher with coiling. 2.5.7: Recent Advancement and Future of Neurovascular Surgery The easy availability and widespread use of non-invasive neurodiagnostic modalities, has brought to clinical attention a large and ever increasing group of patients harbouring unruptured and asymptomatic IAs. These UIAs are also diagnosed coincidentally at the time of catheter angiography done for a ruptured IA in a patient with multiple lesions. The increasing awareness of the relatively bleak prognosis related to aneurysmal rupture amongst the general public and clinicians, forces neurosurgeons to come up with a definitive answer for these asymptomatic lesions. Turjman et al [Turjman et al 1994] introduce a GDC into the sac of aneurysm with the help of micro catheter passing through the mesh of a stent. This technique provides tight packing without danger of the coil being herniating through arterial wall. Kinugasa et al [Kinugasa et al 1992] used a polymerising plastic material, bismuth trioxide dissolved in dimethyl sulpoxide (DMSO) and cellulose acetate polymer (CAP), for endovascular packing of UIAs. However distal embolism and toxicity to DMSO are still cause of concern. Recently a few researchers used micro catheter to deposit viable migration capable fibroblasts as a promising endovascular technique to treat UIAs [Abruzzo et al 2007]. Though therapeutic management of IAs has evolved in past few decades but the issues, which still remain unresolved, is to identify patients at risk of developing IAs and take preventive measures. The flow of blood inside the intracranial vasculature, the shape of the IA and its structural properties, has long been thought to play a role in their aetiopathogenesis. Computational Fluid Dynamics (CFD) is providing a useful alternative to predict blood flows where detailed in vivo measurement of haemodynamic flow variables is not possible. Important haemodynamic factors to be considered are Wall Shear Stress (WSS) and Oscillatory shear index (OSI). In future these factors can be used as new descriptors to predict the risk of rupture for these lesions.

59
2.6: Computational fluid dynamics: the concept and need 2.6.1: A Brief History Flow of fluid has always caught the attention of man since the beginning of civilisation, whether it is the water in river or ocean, air in the atmosphere or blood in human body. The first idea on this topic was introduced by Heraclitus (536-460), though it was in a philosophical sense rather than a scientific one. Archimedes (287-212 BC) gave a scientific meaning to the concept and worked on hydrostatics and static mechanics. During European Renaissance (15th century) Leonardo Da Vinci started depicting the natural world of fluid through his drawings. His findings on fluid mechanics are presented in a nine-part treatise (Del moto e misura dell'acqua- in Latin ‘Mensura motus et aqua’, in English- ‘Motion and measure water’). The pictorial representation of Leonardo was followed by quantification and prediction of the fluid flow phenomena by Newton in the late 17th century. Again, in the 17th century the foundations for experimental fluid dynamics were laid in England and France. In the 18th and 19th century, theoretical fluid dynamics gradually developed, again primarily in Europe. As a result, throughout most of the 20th century the study and practice of fluid dynamics involved the use of pure theory on the one hand and pure experiment on the other hand. In 18th and 19th century Daniel Bernoulli (1700-1782) and Leonhard Euler (1707-1783) tried to mathematically describe the flow of fluid using for the first time the concept of infinitesimal calculus. Further, Claude Louis Marie Henry Navier (1785-1836) (Figure-2.11) and, George Gabriel Stokes (1819-1903) modified the Euler equation and gave birth to the now famous Navier-Stokes equation, which forms the basis of modern CFD. 2.6.2: Navier-Stokes Equations The Navier-Stokes equations are set of nonlinear partial differential equations that describe the flow of fluids in terms of fluid velocity and pressure. The Navier-Stokes equations are: !"!"+ ∇ ∙ 𝜌𝒖 = 0 .........................Continuity equation (1)
!!"
𝜌𝒖 + ∇ ∙ 𝜌𝒖 𝒖 + 𝝆𝑰 = ∇ ∙ 𝜏 + 𝜌𝑔...........Momentum equation (2)
Figure2.11:ClaudeNavierSource:Medscape

60
Where ρ is density of the fluid, u its velocity, p its pressure, μ its viscosity and F represents body forces (e.g. gravitational forces). The Navier-Stokes equations are time-dependent and consist of a continuity equation for conservation of mass and conservation of momentum equations which is equivalent to Newton’s second law of motion (Force=Mass x Acceleration) but applied to a fluid. These equations can be used to describe and predict the fluid flow in any applications. When the fluid flow is simple these equations can be simplified and a solution can be computed. A typical example is the steady viscous flow of a fluid through a straight circular pipe, in which case the simplified version of the Navier-Stokes, leads to the well-known Poiseuille’s solution-
( )x
prRu
∂∂
−−= 22
4
1
µ Which represent the famous Poiseuille’s parabolic velocity profile (see Figure-13), expressed in terms of viscosity μ, radius r, and pressure drop dp/dx.
Current knowledge in mathematics limits the analytical solution of the Navier-Stokes equations only to a restricted group of relatively simple applications (e.g. straight circular pipes and the likes). In most applications however, where fluid flows around or through more
complex geometries, a solution of these equations is not readily available and it is necessary to recur to computational
fluid dynamics, whose underlying concepts are further treated in the following chapters.
Figure 2.12: Equations for Poiseuille’s parabolic velocity profile Source: universe-‐review.ca

61
2.6.3: Why Computational Fluid Dynamics? The Concept And The Need Computational fluid dynamics constitutes a relatively new approach in the study and the development of the whole discipline of fluid dynamics. Around 1960, with the advent of high-speed digital computers and the development of accurate numerical algorithms a new third revolutionary approach developed that strongly affected the way we study and practice fluid dynamics today, the approach of computational fluid dynamics. This approach nicely and synergistically complements the other two approaches of pure theory and pure experiment, but it will never replace either of these. The interpretation and understanding of any fluid dynamics problem should rest upon a proper balance of all three approaches. Computational fluid dynamics is the science of predicting fluid-flow, heat & mass transfer, chemical reactions, and related phenomena by solving numerically the set of mathematical equations (conservation of mass, momentum, energy, species etc.) that govern a particular physical system. In the past decades it has been successfully used mainly in the engineering field for conceptual studies of new designs, troubleshooting redesign, or improving the physical understanding of a novel fluid mechanical phenomenon. Successful examples are found in the automotive sector, where it has helped to improve the aerodynamics of vehicles, civil engineering, where it has been used to design more efficient cooling systems, and nautical architecture, where it has been used in the design of more efficient keels. Accompanied to an in depth knowledge of the physical problem (theory) and supported by experimental data, CFD can be used as a powerful tool to reduce the total effort required in the experiment, design, and data acquisition.
Figure 2.13: Discretization and generation of polygonal mesh in a pipe flow fluid region

62
The behaviour of a particular physical problem is often represented by a set of partial differential equations (governing equations, i.e. conservation of continuity, momentum, energy, etc.) whose exact solution is sometimes tedious, if not impossible. In the case of fluid flows these equations are the Navier-Stokes equations. In complex physical problems the solution is often not available. In these contexts CFD offers the possibility to solve the governing equations by approximation. CFD solvers are based on the discretization of the fluid flow domain (i.e. the region traversed by flow). The domain is subdivided into a set of sub-volumes or cells called mesh or grid. The figure 2.13 shows the discretization and generation of polygonal mesh in a pipe flow fluid region. By using this discretization the governing differential equations of Navier-Stokes can be approximated and solved, but only at certain points (i.e. cell corners) of the domain, thus providing the solution in terms of pressure or velocity of the fluid at these points. While screening of patients (with high risk of cerebral aneurysm) through invasive techniques continues to play a paramount role in deciding the course of treatment, it has some disadvantages that explain the increasing emphasis many neurosurgeons are placing on computer simulation. 2.7: How Long We Have Come So Far: A Focused Review of Literature of The Studies Published on the Application of Computational Fluid Dynamics in the Field of Intracranial Aneurysms 2.7.1: Background and introduction A focused review of literature was conducted to assess the progression of Computational Fluid Dynamics research in the field of Intracranial Aneurysms. Twenty-six (26) full text publications were reviewed for past seventeen years (17 years) from 1998 to 2014. Table -2.8 shows the major journals publishing papers in the field. Efforts were made to cover the most important landmark studies of each year and at least one study was included in the review from each year except year 2000, as I could not find any relevant study conducted that year. A brief account of important studies reviewed is given below in Table-2.9. 2.7.2: Initial work, current research groups involved and publication trends Initial studies: The initial studies were conducted using idealised rather than patient-specific models [Low et al 1993, Burleson et al 1995, Aenis et al 1997]. With the progression of time it was realised that the patient-

63
specific models will be more appropriate to give a better approximation of the haemodynamic parameters in a given patient, and hence the researchers started using the patient specific models. The first simulations studies using the patient specific models were conducted in 2003 by Steinman and colleagues and Jou et al [Steinman et al 2003, Jou et al 2003]. Apart form having other flaws, the earlier studies also had inconsistent methodology and less explicit in describing their materials and methods e.g. no clear description of software used for mesh generation and CFD analysis, imaging modality used, boundary conditions applied, type of analysis, assumptions made, etc. [Foutrakis et al 1999, Cebral et al 2001, Butty et al 2002]. Whereas, most of these shortcomings can definitely be attributed to the rudimentary technology available that time, there also seem to be a lack of appreciation among few author groups [Cebral et al 2001, Foutrakis et al 1999], on the importance of stating the material and methods clearly in their publications. Table 2.8: Showing the Journals publishing 2 and more papers in CFD in PubMed search No Journal Number of publications % of Total 1 AJNR 37 20% 2 J Biomech 19 10% 3 Neurosurgery 11 5.6% 4 Ann Biomed Eng 10 5% 5 J Biomech Eng 9 4.6% 6 Stroke 8 4% 7 Int J Numer Method Biomed Eng 8 4% 8 IEEE Trans Med Imaging 5 2.5% 9 Acta Neurochir (Wein) 5 2.5% 10 Med Phys 5 2.5% 11 J Neurosurg 4 2% 12 Med Biol Eng Comput 4 2% 13 Conf Proc IEEE Eng Med Biol Soc 4 2% 14 Neurol Res. 3 1.5% 15 Neuroradiology 3 1.5% 16 Academic Radiology 3 1.5% 17 J Neurointerv Surg 3 1.5% 18 Proc Soc Photo Opt Instrum Eng 2 1% 19 Biorheology 2 1% 20 Surg Neurol 2 1% 21 Comput Math Methods Med 2 1% 22 Med Eng Phys 2 1% 23 NMR Biomed 2 1% 24 Phys Med Biol 2 1% 25 Physiol Meas 2 1% 26 PLoS One 2 1%
2.7.3: Salient Features of the Studies Reviewed Demography of the population in the publications reviewed: CFD analyses can be conducted either in human beings (patients or healthy subjects), animal models (e.g. experimental studies), in vitro models or virtual models (in silico). All of these methods have their own positives and negatives. Whereas, studies in human beings provide best chance to simulate the disease process of IAs in vivo and help in improving their ultimate management, they may be difficult to conduct and may limit

64
researchers’ ability to try new therapeutic options due to ethical and technical issues. In the publications reviewed here, most of the studies were conducted in human beings (19 out of 26, 73%), either in patient specific 3D geometries or healthy volunteers. Second method is in vitro experiments where 3D models are created (e.g. with the help of 3D printers) and experiments are conducted by simulating human tissues and blood by setting a rig. These in vitro studies are mainly used to simulate the human vasculature and IAs. These models serve excellent platform for validation of CFD results as used by many authors in my review (3, 11%) [Bordas et al. 2013, Acevedo-Bolton et al. 2006]. Animal models provide closest approximation to the human pathophysiology and give flexibility of experimentation to researchers, however, may lack specificity of the human disease process. In silico or computer generated virtual 3D models of idealized vessel/ IA geometries are popular among biomedical scientists who use them frequently to test mesh reliability and finite element solution methods (2, 8%). Cohort size: Most of the studies (>80%) were conducted on small number of subjects (cohorts of 10 or less). Less than 20% studies had a cohort size of more than 10 with biggest being analysing 114 IAs in 31 patients [Alfano et al, 2013] followed by 61 IAs in 57 patients [Cebral el al, 2005], 29 IAs in 26 patients [Shojima et al, 2005] and 20 IAs in 19 patients [Shojima et al, 2004]. Location: Location-wise the studies can be divided into two categories; a) Analyses of haemodynamics of IA and b) Analyses of haemodynamics of cerebral arteries. Out of the 32 locations for IAs analysed 20 (60%) were in anterior circulation (ICA=7, MCA=7, ICA-PComA Junction=2, ACA=2, AComA=2) while 10 (31%) were in Posterior circulation (BA=5, PComA=4, VA-BA=1). Locations for 2 (6%) IAs were not available (NA=2). These figures differ from the Juvela et al [Juvela et al 2000] who found in their study that 97% of IAs were located in anterior circulation while only 3% were in Posterior circulation. Type of IAs: Consistent with findings of other authors [Juvela et al 2000, Keedy 2006], the most common type of IAs in papers I reviewed was Saccular (81%) followed by Fusiform (2%) while for 11% type was either not available or not applicable (NA). Imaging modalities used in different studies for CFD analyses; Comparison of 3DRA/ CTA and MRA: Most common imaging modality used in most of the studies is 3DRA (3 Dimensional Rotational Angiography, also known as DSA= Digital Subtraction Angiogram) for creating 3D models and performing CFD analyses. Other imaging modalities used were CTA (CT Angiogram) and MRA (MR Angiogram).

65
In 3DRA the contrast is injected directly into the cerebral arteries leading to a high concentration of contrast material inside the arteries and Intracranial Aneurysm. This produces a very high-resolution image of the arterial ROI (Region of Interest) and the Intracranial Aneurysm making it the ‘Gold Standard’ modality for creating 3D Models and performing CFD Analyses. In rest two modalities (CTA and MRA) the contrast is injected systemically into a vein at a remote location (usually antecubital vein in the forearm of patient). The ‘bolus of the contrast’ material injected peripherally has to travel a long distance (via heart) before it reaches the cerebral arteries as well as is ‘diluted significantly’ by the time it reaches the cerebral arteries. Due to these two factors, the concentration of the contrast material inside the arterial (and aneurysmal) lumen remains significantly low in these two modalities resulting in lower resolution images compared to 3DRA. In spite of its ability to produce high quality better resolution images, 3DRA remains a fairly invasive procedure carrying higher risks to patients when compared to CTA and MRA. The main risks of 3DRA [Dion et al. 1987, Fifi et al. 2009] include Cerebral Ischemic Events (Stroke; including TIAs and Permanent Neurologic Deficits), intracranial bleed secondary to perforation of a vessel or the aneurysm itself, allergy to contrast media, acute kidney failure (Acute Tubular Necrosis), bleeding and hematoma formation at the puncture site, dissection of blood vessels, femoral abscess, femoral occlusion leading to distal ischemia, etc. CTA and MRA are relatively straightforward procedures carrying significantly lower risks that can be performed on outpatient basis and therefore used widely for monitoring unruptured aneurysms as well as post-procedural follow-ups. The risk of radiation exposure is common to both 3DRA as well as CTA while all three carry risk of developing allergy to contrast media. The MRA is least invasive of all three and supposed to be safest as well. However, as the effects of radiofrequency fields and the loud acoustic environment on a foetus remain unknown, further research is needed to establish the long-term safety of MRA on pregnant patients [Bulas 2013]. Furthermore, with advance in technology and introduction of sophisticated neuro-endovascular catheters, the risk profile of 3DRA is falling rapidly. Recent studies [Thiex et al. 2010] quote figures as low as approaching to zero in well-equipped centres, carefully selected cases and experienced operator. Software used for 3D Modelling and CFD Analyses: The process of analysing the haemodynamic variables and deducing other non-observable data can be divided into following steps: a) Importing the medical images into a suitable software interface and generation of 3D Models, b) Surface

66
extraction and mesh generation c) Application of appropriate boundary conditions on inlet and outlets of the geometry d) Simulation of blood-flow into the geometrical models of arteries and IAs created in previous steps, d) Post-processing of the results obtained to display the haemodynamic variables. Different researchers used a number of software at each step. a) Generation of 3D Models: The medical data is ‘raw’ and need to be ‘processed’ to create 3D Models that can be used for further processing. This is done by importing the medical images (e.g. 3DRA/ CTA/ MRA) into a suitable software-interface that generates Anatomical 3D Models of the ROI (Region of Interest), i.e. the IAs and surrounding vasculature. A number of software are available for generation of 3D models from medical images. The most common software used in my review of 26 publications was In House Developed Software (7, 27%). Other software used were Rapidform™ (INUS Technology, Seoul, South Korea) (3, 12%), VMTK (Vascular Modelling Toolkit, an open source software containing C++ based algorithms, developed by VMTK Community, Bergamo, Italy; www.vmtk.org) (2, 8%), Alatoview™ (Toshiba, Japan), Altair HyperMesh™ (Altair Engineering, Inc., MI, USA), (X)-MedCon™ V0.5.10 (Open Source Software), AVS/Express Visual Development Tool V5.1 (Advanced Visual System Inc.), e.soft@LEONARDO™ (Siemens Medical Solutions USA, Inc.), VTK/ Paraview™ (Kitware Inc., NY, USA), Amira™ V 3.0 (Mercury Computer Systems, Berlin, Germany), ICEM™-CFD software (Ansys, Berkeley, CA), Matlab™ R2006b (The Mathworks, Natick, MA, USA), and CAD software RHINOCEROS™ V 4.0 (McNeel &Associates, Indianapolis, IN, USA). For generating the 3D Models of Intracranial Aneurysms and surrounding vasculature in Project @neurIST, I used in house developed software @neuFuse. b) Mesh generation and Fluid flow simulation: Mesh or volume generation after surface extraction is the second step in the processing followed by application of Boundary Conditions and simulation of Fluid Flow by solving the equations iteratively, either as a steady-state or transient (also called as pulsatile) fluid flow. Two biggest giants building software in the field of CFD Simulation are Ansys® and Fluent® (bearing in mind that after acquisition in 2006, Fluent® has become a part of Ansys®). In my review of 26 publications, these two companies shared equal proportion of software used for mesh generation and blood flow simulation. Software provided by both Ansys® and Fluent® were used in 12 studies (46% each) totalling to 92% together. Main Ansys® software used for mesh generation is Ansys® ICEM™ used
67
in 7 studies (27%). Its counterpart from Fluent® is GAMBIT (Geometry and Mesh Building Intelligent Toolkit), which also used extensively in mesh generation and was used by equal number of authors (7, 27%) as ICEM™ from Ansys® in my review. Other popular software from Ansys are CFX™, CFD-Flo™, Ansys Fluent™, Ansys CFD Professional™. Ansys® has also integrated its all fluid dynamics solution products into the Ansys® Workbench™. Other software used for meshing and blood flow simulations by different authors are; FIDAP –CFD Software (Fluent Europe, Sheffield, UK), CFD-ACE+ package (CFD Research Corporation, Huntsville, AL, USA), STARCD, (CD Adapco, Melville, NY, USA), SC/Tetra V-5 (Software Cradle Co Ltd, Osaka, Japan), FeatFlow V1.3 release candidate 3 (University of Dortmund, Germany), Gridgen V15.12 (Pointwise Inc., TX), Nektar Spectral/ HP Element Framework (Division of Applied Mathematics, Brown University, USA, Department of Aeronautics, Imperial College London, UK, and Scientific Computing and Imaging Institute, University of Utah, USA), etc. In the studies included in this thesis, whereas Ansys® ICEM™ software was used for mesh generation, Ansys® CFX™ was used for blood flow simulations in the ROI (Region of Interest), as a part of Project @neurIST. Boundary conditions applied: Boundary conditions (BCs) are required as due to limitation in current technology it is currently impossible to simulate the whole body vasculature at the same time. The region of interest (ROI) despite the fact being simulated in isolation is naturally affected by the region outside it. In order to perform a realistic simulation this information is passed to the solver by applying the Boundary Conditions. These boundary conditions can be either measured directly on the patient by using different techniques e.g. Transcranial Doppler (TCD) or MR Q Flow measurements or if not available has to be taken from the other sources. In my review total 35 Boundary Conditions were considered (including inlet and outlet Boundary Conditions in the same study). Out of these 35 BCs, 17 (approx. 49%) were measured in the patients. The most common method for measuring the BCs was Transcranial Doppler (TCD) Ultrasound (5, 30%), followed by Phase Contrast MRI (pcMRI) in 4 (24%), MR Velocimetery (2, 12%), Laser Doppler Velocimetery (LDV) (2, 12%). All of these methods, in spite of their advantages, have some inherent shortcomings. The most recent advancement in the field of measuring the BCs is taking the measurements of pressure and velocity by Intravascular Probe Sensors directly in the Intracranial Vessels and IAs as demonstrated by Levitt and colleagues in a ground breaking study done this year [Levitt et al. 2014]. However, it will

68
take some time before these methods can become a practical adjunct in routine clinical settings. Whenever this information is not available for a particular patient, we use the values observed in age sex matched other patients or the healthy volunteers or values from literature, also known as ‘modelled’ or ‘phantom-boundary conditions’. In author’s review of 26 studies; 16 (46%) were modelled BCs, out of which while 12 (34%) were literature based, rest 4 (11%) were measured in healthy age and sex matched volunteers. The variables often used as phantom-boundary conditions are heart rate, blood flow velocity, pressure, velocity profile, and usually applied at outlets in most of the studies, sometimes also called ‘Universal Boundary Conditions’ by some authors. Methods of obtaining BCs were not available in 2 studies.

Table 2.9: CFD Analysis of Intracranial Aneurysms & Arteries: Some Main Studies, their Methodology and Results
No Author/ Year
Journal/ Year
Human/ Animal/ in- vitro
Patients/ Animals/ Aneurysms
Location Aneurysm type
Imaging Modality
Software used Haemodynamic Variables analyzed
Results Boundary Condition Applied
Type of Analysis
Assumptions Made
Salient features of study
1 Ortega J Med Eng Technol 1998
Animal 3/3 CCA Saccular 3DRA *Surface Extraction and 3D Modeling: -In house developed software *CFD: - FIDAP –CFD Software, Fluent Europe, Sheffield, UK
Flow patterns Jet stream impingement
Flow patterns inside the IAs change with time during a cardiac cycle- this may lead to increased WSS in the IAs
Measured with Doppler
Transient Newtonian Fluid, Rigid Vessel Wall, Non Slip BC
One of the early study to show potential application of CFD in the prediction of haemodynamics of IAs
2 Foutrakis et al
AJNR 1999
In vitro 2/0 Cerebral artery Curves Bifurcations +/- Aneurysm --models
Saccular NA *Surface Extraction and 3D Modeling: NA *CFD: NA
Pressure Velocity Flow Pattern Impingement WSS
High Pressure High Velocity, High WSS, Impingement –Initiation
Measured NA Newtonian Fluid, Rigid Vessel Wall, Non Slip BC
One of the early study, used 2D Finite Element Models
3 Cebral et al
JBiomech 2001
Human 1/0 ICA and ECA of a healthy volunteer
NA MRA *Surface Extraction and 3D Modeling: NA *CFD: NA
NA
Study describes a new method for mesh generation
NA NA NA A new method for Mesh Generation described
4 Butty et al Biorheology 2002
Human 1/2 ICA Saccular CTA *Surface Extraction and 3D Modeling: - Altair HyperMesh, Altair Engineering, Inc., MI, USA *CFD: - CFD-ACE+ package, by CFD Research Corporation, Huntsville, AL, USA
Flow patterns Residence time Basins of attraction
Complex flow patterns and mixing of blood seen inside the IAs
NA NA Newtonian Fluid, Rigid Vessel Wall, Non Slip BC
Early study, methodology not very clear esp. re: Boundary Conditions
5 Steinman et al
AJNR 2003
Human 1/1 ICA-PcomA
Saccular 3DRA *Surface Extraction and 3D Modeling: -NA *CFD: - In house developed finite element CFD Solver
WSS Flow Pattern OSI
Neck - High flow Aneurysmal sac – persistent & transient vortices Distal neck – high OCI & WSS
Measured in Age/Sex matched volunteers
Transient Newtonian Fluid, Rigid Vessel Wall, Non Slip BC
Validations done by comparing the CFD findings with the cine angiography showed good agreement

70 No Author/
Year Journal/ Year
Human/ Animal/ in- vitro
Patients/ Animals/ Aneurysms
Location Aneurysm type
Imaging Modality
Software used Haemodynamic Variables analyzed
Results Boundary Condition Applied
Type of Analysis
Assumptions Made
Salient features of study
6 Shojima et al
Stroke 2004
Humans
19/20 MCA Saccular 3 D CTA *Surface Extraction and 3D Modeling: Alatoview, Toshiba, Japan *CFD: ICEM CFD, Ansys
WSS High WSS – Initiation Low WSS – Growth & rupture
Inlet: measured in One Pt. by TCD Outlet: Modeled
Stationary Newtonian Fluid, Rigid Vessel Wall, Non Slip BC
7 Hoi et al
J Neurosurg 2004
In vitro 10 ICA Models
Saccular 3D DSA *Surface Extraction and 3D Modeling: In House Software *CFD: -Gambit, Fluent, Lebanon, NH -STARCD, CD Adapco, Melville, NY
Effects of arterial geometry and Neck Size WSS Velocity
WSS increases with Curvature and Neck Size
Measured Transient Newtonian Fluid, Rigid Vessel Wall, Non Slip BC
Effects of arterial geometry and Neck Size on WSS were investigated
8 Hassan et al
AJNR 2004
Human 1/1 Vertebro-Basilar
Saccular 3DRA *Surface Extraction and 3D Modeling: -(X) MedCon, V0.5.10, Open Source Software -AVS/Express visual development tool (V5.1, Advanced Visual System Inc.) *CFD: -ICEM CFD, Ansys -Gambit, Fluent, Lebanon, NH *Post Processing: Ensight, version 7.3.0 (Computational Engineering International, Inc., Berkley, CA)
Pressure, after therapeutic occlusion of VA- one by one
Balloon occlusion of Rt VA better than the Lt VA
Measured, TCD, Pt. Specific
Transient Newtonian Fluid, Rigid Vessel Wall, Non Slip BC
CFD of a Giant IA showing growth

71 No Author/
Year Journal/ Year
Human/ Animal/ in- vitro
Patients/ Animals/ Aneurysms
Location Aneurysm type
Imaging Modality
Software used Haemodynamic Variables analyzed
Results Boundary Condition Applied
Type of Analysis
Assumptions Made
Salient features of study
9 Jou et al
AJNR 2005
Humans 2/2 Basilar Artery
Fusiform MRA *Surface Extraction and 3D Modeling: Rapidform (INUS Technology, Seoul, South Korea) *CFD: -Gambit (Fluent, Lebanon, NH) -Fluent (Fluent Inc., Lebanon, NH)
WSS Flow Pattern Pressure Impingement
Low WSS correlates with IA growth
Pt. Specific- Inlet: pcMRA Outlet: MR Velicitometry
Transient Newtonian Fluid, Rigid Vessel Wall, Non Slip BC
CFD on growing IAs
10 Shojima et al
Stroke 2005
Humans 26/29 ICA MCA ACA
Saccular 3D DSA *Surface Extraction and 3D Modeling: ImageDesign (Quint Corporation) *CFD: SC/Tetra V-5 , Software Cradle Co Ltd, Osaka, Japan
Pressure Velocity Flow Pattern Impingement WSS
High Pressure- No correlation with Rupture, High Pressure- correlated with High WSS
Inlet: Measured in one pt., used in all Outlet: modeled
Transient Newtonian Fluid, Rigid Vessel Wall, Non Slip BC
Contrary to the common belief study shows Blood Stream Jet Impaction and Local Pressure Elevation less important factors in IA rupture
11 Cebral el al
AJNR 2005
Humans 57/62 ICA MCA PComA ACA NA
Saccular 3DRA *Surface Extraction and 3D Modeling: In House Software *CFD: Ansys
Peak Pressure OSI WSS
Ruptured IAs: Complex, unstable flow, Small Impingement Area Small Jet Size
Modeled Literature based Based on MRA
Transient Newtonian Fluid, Rigid Vessel Wall, Non Slip BC
Cebral el al found correlations with Complex, Unstable flow, and ruptured IAs
12 Karmonik et al
IEEE Proceedings 2006
Human 3/3 Basilar Artery
Saccular 3DRA *Surface Extraction and 3D Modeling: -e.soft@LEONARDO, Siemens Medical Solutions USA, Inc. -VTK/ Paraview- Kitware Inc. *CFD: Meshing: Gambit CFD: Fluent, CFD Solver, Fluent, Lebanon, NH
WSS- time dependent
WSS varies with time
Modeled, from literature
Transient Newtonian Fluid, Rigid Vessel Wall, Non Slip BC
One of the early studies on CFD of IAs

72 No Author/
Year Journal/ Year
Human/ Animal/ in- vitro
Patients/ Animals/ Aneurysms
Location Aneurysm type
Imaging Modality
Software used Haemodynamic Variables analyzed
Results Boundary Condition Applied
Type of Analysis
Assumptions Made
Salient features of study
13 Acevedo-Bolton et al
Neurosurgery 2006
Human/ in vitro
1/1 Basilar Artery
Fusiform MRI/ MRA
Surface Extraction and 3D Modeling: Amira (version 3.0; Mercury Computer Systems, Berlin, Germany) and Rapidform 2004 (INUS Technology, Seoul, South Korea) CFD: GAMBIT, Fluent
Inflow Jet WSS
*Low WSS- corresponds to Aneurysm growth *CFD can be used to model interventions
Measured pcMRI
Transient Newtonian Fluid, Rigid Vessel Wall, Non Slip BC
*in vitro and in vivo validations done *Increasing the WSS proposed as treatment
14 Castro et al
AJNR 2006
Humans 4/4 PComA Rt MCA Lt MCA AComA
Saccular 3DRA
*Surface Extraction and 3D Modeling: NA *CFD: NA
WSS Flow Velocity Flow Pattern
Significant effect of upstream parent vasculature on aneurysmal haemodynamics
Modeled, based on the MR measurements in Normal Subjects
Transient Newtonian Fluid, Rigid Vessel Wall, Non Slip BC
Effects of Geometry of the upstream parent artery on IA haemodynamics demonstrated
15 Mantha et al
AJNR 2006
Humans 3/3 ICA Saccular 3D DSA *Surface Extraction and 3D Modeling: In House Software *CFD: Gambit (Fluent, Lebanon, NH)
WSS OSI Velocity
Low WSS/ Stagnant flow correlates IA Initiation
Modeled Literature based
Transient Newtonian Fluid, Rigid Vessel Wall, Non Slip BC
First one to use technique of removing the IA and computing WSS after reconstructing the parent wall
16 Alnaes et al.
Stroke 2007
Human 10/0 Complete Circle of Willis
- CTA MRA 3DRA
*Surface Extraction and 3D Modeling: In House Software *CFD: FeatFlow (version 1.3, release candidate 3; Uni of Dortmund, Germany) *Post Processing: ParaView software (version 2.4; Kitware Inc., Los Alamos National Laboratory, Los Alamos, NM)
WSS *WSS changes with Vessel radii and Branch Angles. *High WSS at the sites where Aneurysms are common
*Modeled *Literature Based
Stationary Newtonian Fluid, Rigid Vessel Wall, Non Slip BC Blood Density: 1g/cm3 Viscosity: 0.0035 Pa.s
Study provides CFD model of circle of Willis and values of WSS in it

73 No Author/
Year Journal/ Year
Human/ Animal/ in- vitro
Patients/ Animals/ Aneurysms
Location Aneurysm type
Imaging Modality
Software used Haemodynamic Variables analyzed
Results Boundary Condition Applied
Type of Analysis
Assumptions Made
Salient features of study
17 Meng et al Stroke 2007
Animals 6 CCA-surgically created vessel branch
Saccular/ Nascent aneurysm formation
3DRA *Surface Extraction and 3D Modeling: ICEM-CFD software (Ansys, Berkeley, CA). *CFD: Star-CD (CD-Adapco, Melville, NY)
Impingement zones WSS WSS Gradients
High WSS, Impingement- Initiation
Measured Transient/ Stationary
Newtonian Fluid, Rigid Vessel Wall, Non Slip BC
Experimental study in animals showing histological changes in vessel walls of IA initiation
18 Boussel et al
Stroke 2008
Human 7/7 Basilar ICA MCA
Saccular MRA *Surface Extraction and 3D Modeling: Rapidform (INUS Technology, Seoul, South Korea) *CFD: Fluent (Fluent Inc., Lebanon, NH)
WSS TA
(Time Averaged WSS)
Low WSS correlates with Growth of IA
Measured by pcMRI
Transient Newtonian Fluid, Rigid Vessel Wall, Non Slip BC,
Correlation of Low WSS to Aneurysm Growth
19 Cebral el al
AJNR 2009
Human 1/1 Basilar Tip Saccular 3DRA *Surface Extraction and 3D Modeling: In House Software *CFD: Ansys
WSS Velocity Flow Pattern
Haemodynamic Characteristics of Ruptured IAs: *Concentrated inflow jet *Unstable Flow *Small Impaction zone *Low WSS
Modeled Based on MRA Of Volunteers
Transient Newtonian Fluid, Rigid Vessel Wall, Non Slip BC, Haemodynamic and Morphology of IA remains same before and after rupture
CFD analysis done just 2 hours before the IA rupture

74 20 Baek et al Interface
Focus 2010
Human 3/3 ICA PComA
Saccular 3DRA CTA
*Surface Extraction and 3D Modeling: Matlab R2006b (The Mathworks, Natick, MA, USA) *CFD: Mesh: Gridgen V15.12 (Pointwise Inc., TX) CFD: Nektar, Spectral/ HP Element Framework
WSS OSI VFR
Flow instability occurs in certain IAs -esp. wide necked IAs that may be responsible for their growth or rupture
Inlet: literature Based Outlet: Universal BC
Transient Newtonian Fluid, Rigid Vessel Wall, Non Slip BC,
No Author/ Year
Journal Human/ Animal/ in- vitro
Patients/ Aneurysms
Location Aneurysm type
Imaging Modality
Software used Haemodynamic Variables analyzed
Results Boundary Condition Applied
Type of Analysis
Assumptions Made
Salient features of study
21 Bernardini et al
Interface Focus 2011
Virtual 0/1 NA Saccular Idealized vessel and IA geometry
*Surface Extraction and 3D Modeling: CAD software RHINOCEROS v. 4.0 (McNeel &Associates, Indianapolis, IN, USA) *CFD: Meshing: Ansys ICEM CFD: Ansys CFX, (ANSYS, Canonsburg, Pennsylvania)
Position and deployment of stent WSS Impact zone
Position of stent influences the WSS and impact zone in the IAs
Inlet: literature Based Outlet: Universal BC
Transient Newtonian Fluid, Rigid Vessel Wall, Non Slip BC,
Position of stent influences the WSS and impact zone in the IAs
22 Kono et al Neurosurgery 2012
Human 1/1 ACA Saccular 3DRA CTA
*Surface Extraction and 3D Modeling: NA *CFD: Meshing: Ansys ICEM CFD: Ansys CFX, (ANSYS, Canonsburg, Pennsylvania)
WSS OSI Velocity Static pressure
Site of rupture corresponds with Low End-Diastolic WSS and High Peak-Systolic Pressure
Inlet: Measured by Doppler Outlet: Universal BC
Transient Newtonian Fluid, Rigid Vessel Wall, Non Slip BC,
Rare study that computed Haemodynamic variables during IA rupture

75 23 Li et al JNeurosurg
2012 Human 17/17 ICA
AComA PComA
Saccular 3DRA *Surface Extraction and 3D Modeling: In house software *CFD: Meshing: Ansys ICEM CFD: Ansys CFX, (ANSYS, Canonsburg, Pennsylvania)
Max WSS Spatially Ave WSS
Values of Max WSS and Spatially Ave WSS at peak systole were significantly higher at the neck in recanalized IAs after coiling
Inlet: Measured by Doppler in healthy volunteers Outlet: Universal BC
Transient Newtonian Fluid, Rigid Vessel Wall, Non Slip BC,
Study addresses a common problem of recanalization in IAs
24 Alfano et al
Neurosurgery 2013
Human 31/114- 10 common locations
Vessel bifurcations
- 3DRA CTA
*Surface Extraction and 3D Modeling: Vascular Modeling Toolkit *CFD: ICEM Ansys
WSS WSS Gradient Av WSS Max WSS Impact zones
High WSS correlates with the site of IA formation
Literature based
Stationary Newtonian Fluid, Rigid Vessel Wall, Non Slip BC,
-
No Author/ Year
Journal Human/ Animal/ in- vitro
Patients/ Aneurysms
Location Aneurysm type
Imaging Modality
Software used Haemodynamic Variables analyzed
Results Boundary Condition Applied
Type of Analysis
Assumptions Made
Salient features of study
25 Bordas et al
Interventional Med Applied Sci 2013
In vitro 1 PComA MCA AComA
Saccular MRA
*Surface Extraction and 3D Modeling: NA *CFD: Meshing: Ansys ICEM CFD: Fluent, (ANSYS, Canonsburg, Pennsylvania)
WSS Velocity
Good agreement was found between experimental and CFD results
MRA LDV =Laser Doppler Velocimetery
Transient Newtonian Fluid, Rigid Vessel Wall, Non Slip BC,
Validates CFD for analysis of Haemodynamic indices in IAs

76 26 Levitt et
al AJNR 2014
Human 4/4 ICA Saccular 3DRA *Surface Extraction and 3D Modeling: Vascular Modeling Toolkit (Bergamo, Italy; www.vmtk.org) *CFD: Meshing: Gambit CFD: Fluent, (ANSYS, Canonsburg, Pennsylvania)
Blood Flow Pressure WSS
Flow diverter stents lead to significant intra-IA reduction in WSS and WSS Gradient and a trend in reduced blood flow- that may induce thrombosis in IA
Pressure and velocity was measured by Intravascular Probe Sensors directly in the Intracranial Vessels and IA
Transient Newtonian Fluid, Rigid Vessel Wall, Non Slip BC,
CFD simulations of Flow Diverter Stents, Use of Intravascular Probe Sensors to measure the Pressure and Velocity directly in the Intracranial Vessels and IA

Transient vs. stationary analyses: Whereas, the blood-flow entering into the domain is pulsatile (varying according to the stage of cardiac cycle), for the sake of simplicity, sometimes authors perform analyses considering blood-flow as stationary or steady state. Most of the analyses in my review (19, 73%) however, were performed using pulsatile blood-flow shown, as transient analyses in the Table-9. 12% (3) analyses were stationary while the information was not available in another 12% (3) studies. One analysis was performed using both methods, transient as well as stationary. Assumptions made: As stated above, it is often difficult and impractical to measure all Boundary Conditions in a given patient, most of the authors tend to make some assumptions while performing CFD Analyses of Intracranial Aneurysms. In this review author found that 24 (92%) studies made assumptions that blood is a Newtonian fluid, vessel walls are rigid, and boundaries of domain are non-slip. In addition to these assumptions, one study also made assumption that shape and size of the intracranial aneurysm does not change before and after rupture. Information was not available in one study. Haemodynamic variables analysed: Wall shear stress (WSS) is the most important haemodynamic variable receiving attention of maximum number if researchers worldwide. In this review I found the same pattern with 22 (85%) studies computing WSS. Different types of WSS computed were; WSS gradient, time-dependent WSS, time-averaged WSS, max and min WSS, spatially-averaged WSS, etc. Next two haemodynamic variables analysed were Flow Patterns and Jet Stream Impingement (8, 31% each) followed by Pressure and Velocity (7, 27% each), Flow-rates, Residence Time, Basins of Attraction, Effects of Geometry of Parent Vessel and Neck Size on the haemodynamics, Position of deployment of Stent, etc. Results and Salient Features: This short review draws attention towards a number of important factors. Most common unanimous conclusion from the studies reviewed was that High WSS favours Initiation of Aneurysm as well as Low WSS promoting the Aneurysmal Growth and Rupture (12, 46% studies). Good correlations were also demonstrated between Rupture of IAs and Complex Blood Flow, Unstable Blood Flow, Mixing of Blood, and Small Impingement Zone by 9 (35%) authors. Other parameters analysed were; High Pressure and High Velocity correlates with Initiation, Flow patterns inside IAs change with cardiac cycle, High flow seen at neck, WSS increases with curvature of vessel and Neck size of IAs, CFD can be used to model interventions, Significant effects of Upstream Parent Vessel on the IA Haemodynamics, WSS changes with Tine and Radii of Vessels, Position of Stent Affects WSS and Impact Zones, High WSS

78
associated with Re-canalization of coiled IAs, Experimental Validations of CFD show Good Correlation, etc. 2.8: Conclusions Intracranial Aneurysms share a multifactorial aetiology with haemodynamics playing an important role. Though therapeutic management of IAs has evolved in past few decades but the issues that still remain unresolved are to identify patients at risk of developing IAs and take preventive measures. The flow of blood inside the intracranial vasculature, the shape of the IA and its structural properties, has long been thought to play a role in their aetiopathogenesis. Computational Fluid Dynamics (CFD) is providing a useful alternative to predict blood flows where detailed in vivo measurement of haemodynamic flow variables is not possible. Important haemodynamic factors to be considered by a number of authors are Wall Shear Stress (WSS), Oscillatory Shear Index (OSI), Pressure, Jet Impingement, Flow Patterns and Stability over time and space, Complexity of Flow, etc. In future these factors can be used as new descriptors to predict the risk of rupture for these lesions.

79
OVERVIEW 3.1. Introduction 3.2. Project @neurIST 3.3: Ethical Approvals 3.4: Recruitment of patients 3.5: Data collection and organization 3.6. Software @neuFuse: Development and 3.7. Boundary conditions used in different studies: Measured and 1D model 3.8. Statistical analysis 3.9. Designing and Performing Different CFD Studies *My contribution: The tool-chain (e.g. @neuFuse) were primarily developed by computer scientists (including Dr Alberto Marzo, Dr Mari-Cruz Villa-Uriol, etc., as detailed in acknowledgement section) working in project @neurIST, however, I played major role in the clinical evaluation to gather users’ feedback that was used in the improvement of these tools. I was also responsible for recruitment of the patients/ volunteer form Sheffield Centre including consenting and facilitating Scans, etc. 3.1. Introduction One of the most important parameters that can be used to assess the quality of a good study is the ease with which it can be replicated and, ability to reproduce similar results by other researchers independently. Results of any study can only be replicated consistently and reliably if materials and methods are constant across the researchers who are trying to replicate the research. A clear and detailed description of materials and methods used in any research is thus of paramount importance. The materials and methods used in different studies while conducting the work presented in this thesis are described here in detail. 3.2. Project @neurIST Overview @neurIST [@neurIST Project 2007, Project Identifier: IST-2004-027703, www.aneurist.org], was a major multidisciplinary European initiative funded by the European Commission with a budget €17 million. The main co-ordination of the project
CHAPTER 3.0: MATERIALS AND METHODS
Figure 3.1- Project @neuriST

80
is done from Center for Computational Imaging & Simulation Technologies in Biomedicine, Universitat Pompeu Fabra, Barcelona, Spain. The total duration of the project @neurIST was 4 years- from January 2006 to December 2009. The period was extended further for another three months until March 2010. The studies included in this thesis were conducted as a part of project from March 2008 to March 2010. Studies were mainly done jointly in the Departments of Neurosurgery and Neuroradiology, Royal Hallamshire Hospital, and the Academic Unit of Medical Physics, Department of Cardiovascular Science, University of Sheffield, Sheffield, UK, with collaborations and support from other project partners. The project brings together neurosurgeons, neuroradiologists, epidemiologists, engineers, biologists and computer scientists from 32 European institutions, both public and private, in 12 countries (Figure-3.1) to develop a usable interface for personalised risk assessment and treatment of patients with IAs and SAH. The University of Sheffield and the Sheffield Teaching Hospitals NHS Trust played a major role in the development of image-processing and computational tools to provide new, non-observational measures for the characterisation of the disease. Activities in the project are executed through different suites, as outlined below briefly: 1. @neuLink: The suite is aimed at exploring the genetic aspects of IAs
and linking them to their initiation, growth and rupture. It also facilitates successful application of data-mining, text-mining or micro array analysis leading to the development a model of the molecular mechanisms involved in the disease forming a platform for the future genetic epidemiological studies thus facilitating the process of molecular genetics.
2. @neuFuse: @neuFuse is the state of art software developed in the project that fuses diagnostic, modelling and simulation data into a coherent representation of the patient's condition. 3 dimensional models of the intracranial vasculature and intracranial aneurysms can be created starting from the patient medical image @neuFuse can solve these models to provide a prediction of haemodynamic, morphological and structural indices inside an IA. More details of @neuFuse are given below in the relevant section.
3. @neuRisk: @neuRisk provides clinicians a tool to facilitate the personalised risk assessment and guidelines establishment to treat patients by integrating the various sources of information (molecular to

81
clinical level). The management of unruptured intracranial aneurysms will be improved by optimizing the decision-making process. The goal of @neuRisk is to reduce the number of unnecessary treatments by 50%, leading to reduction of risks to the patient and economic savings.
4. @neuEndo: @neuEndo is developing computational tools to optimise and customise the design of endovascular devices. These tools simulate the structural, haemodynamic and biological responses of the body to the deployment of stents and coils before the procedure. This will serve not only the manufacturers in the design of these implants, but also the medical end-user in the planning of an intervention. Additionally, with the help of advanced numerical-simulation tools it can predict the occurrence of device-induced thrombosis and drug elution processes.
5. @neuInfo: @neuInfo enables accessing clinical and epidemiological data distributed in different databases. Different data sources can be searched using a query user interface linked to the actual physical data sources. It allows direct navigation through different specific knowledge domains.
6. @neuCompute: @neuCompute provides distributed (remote) computing capabilities to @neurIST ensuring secure data transport. This integration of computing resources supports computationally demanding tasks such as complex modelling and simulation demanded by the integrative suites @neuRisk, @neuLink, @neuEndo and @neuFuse. A focus is placed on interoperability and integration, leveraging on existing technologies.
7. @neuQuest: This data entry software was used to enter the clinical, social, radiological etc. data about the recruited patients across the project.
8. @neuBrowser: The data entered through @neuQuest at different locations is integrated through this suite. With the help of this unique software categorization and basic analysis of the data can be done along with its graphical representation.
3.3. Ethical Approvals The project has appropriate ethical approvals for the required research. All partners involved in the project took separate ethical approvals from their local ethical committees after satisfying their requirements. The ethical matters for UK are managed by Project Ethical Committee, Oxford, UK (Oxfordshire Research Ethics Committee-A Study Number: 07/Q1604/53). 3.4. Recruitment of patients The patients involved in different studies were recruited through seven clinical centres across Europe after taking informed consents. The clinical

82
centres responsible for the patient recruitment and data collection are: Royal Hallamshire Hospital and Sheffield Teaching Hospitals NHS Trust, Sheffield, UK; John Radcliffe Hospital, Oxford, UK; Université de Genève, Geneva, Switzerland; Medical University of Pecs, Hungary; Erasmus Medical Centre, Rotterdam, The Netherlands; Hospital General de Catalunya, Barcelona, Spain; and Hospital Clinical i Provincial de Barcelona. More recently, Dr. A. Asenjo Institute of Neurosurgery & Neuroradiology, Santiago, Chile, and Beaumont Hospital, Dublin, Ireland have also started the process of joining the project. Total number of cases was 1591, recruited through all clinical centres. 3.4.1: Demography of Recruited Cases A total number of 1591 cases were recruited to @neurIST through all 7 clinical centres. A brief overview of different demographic characteristics of the recruited population is given in Tables-3.1 and Table-3.2.
The patients were recruited randomly either in a retrospective or prospective manner through Neurosurgical Clinics and Wards. However, due to low risk of rupture majority of the population was recruited retrospectively. Depending upon the type of consent patients gave, blood samples were also collected and analysed for exploring the genetic aspects of the disease. In order to compare the characteristics of the case cohort, population matched controls were also recruited through the same sources.

83
Table: 3.1. Demographic details for all recruited cases in project @neurIST
Location No. Aneurysmal aspect No. Side of the IA Total recruited 1591 Total recruited 1591 Total recruited 1591 Info about IA location available
1264 Info about IA aspect available
1036 Info about IA side available 893
No-info about IA location available
327 No info about IA aspect available
555 No info about IA side available 698
Intracavernous internal carotid 61 Smooth 812 Left 347 Ophthalmic segment carotid 111 Rough 224 Midline 183 Medial wall carotid 31 Presence of blebs on IA Right 363 Posterior Communicating 200 Total recruited 1591 Endovascular treatment Ant Choroidal segment carotid 25 Info about IA blebs available 1102 Total recruited 1591 Anterior and superior wall carotid
6 No info about IA blebs available
489 Info about IA endovascular treatment available
750
Carotid bifurcation 56 No bleb present 841 No info about IA endovascular treatment available
841
A1 segment ant 26 One bleb present 190 Parent vessel occlusion 6 Ant communicating artery 231 Two blebs present 44 Coil - Balloon remodelling 23 A2 segment ant 10 Multiple blebs present 27 Coil - 3D Bare 142 Pericallosal cerebral artery 24 Presence of lobules in IA Coil - 3D Coated 98 Distal ant cerebral artery 4 Total recruited 1591 Coil – Random Shape -Bare 428 M1 segment middle cerebral artery
130 Info about IA lobules available
1117 Coil – Random Shape –Coated 53
Sylvian bifurcation 175 No info about IA lobules available
474 Stent - Covered stent - self expanding 5
Distal to sylvian bifurcation 10 No lobule present 835 Stent - Leo - self expanding 4 V4 segment vertebral artery 5 One lobule present 160 Stent - Neuroform - balloon
expandable 10
PICA 32 Two lobule present 107 Stent - open entry - balloon expandable
9
AICA 7 Multiple lobule present 15 Other endovascular procedures 15 Superior cerebellar artery 24 Total recruited 1591 Stimulant abuse Basilar trunk 10 Ruptured vs. Unruptured
IAs Total recruited 1591
Basilar Tip 74 Total recruited 1591 Info about stimulant abuse available 822 P1 Posterior cerebral artery 4 Info about IA rupture
available 1260 No info about IA stimulant abuse
available 709
P1-P2 junction posterior cerebral artery
5 No info about IA rupture available
331 Cocaine 12
P2 posterior cerebral artery 1 Unruptured 693 Amphetamine 2 Distal posterior cerebral artery 0 Ruptured 567 Diet pills 2 Ophthalmic artery 2 Total recruited 1591 Nasal spray 28 Type No. Genetic tissue samples
collected Oral decongestants 7
Total recruited 1591 Total recruited 1591 None 771 Info about IA Type available 1263 Total samples collected 2658 No info about IA Type available
328 Blood 928
Saccular side wall 377 Tissue from IA dome 14 Saccular bifurcation 869 Leucocytes 271 Fusiform dissecting 12 Plasma 315 Fusiform non-dissecting 3 DNA 299 Fusiform segmental ectasia 1 PAXgene 792 Fusiform transitional 1 No info about sample
available 39

84
Table: 3.2. Main known risk factors for IA development and SAH in the recruited population Risk factor No. Moyamoya Total recruited 1591 Info about moyamoya available 1132 Sex No-info about APKD available 459 Info about sex available 1327 Moyamoya absent 1129 No info about sex available 264 Moyamoya present 3 Males 455 Associated AVM Females 872 Info about AVM available 1133 Ethnicity No-info about AVM available 458 Info about ethnicity available 1075 Associated AVM absent 1125 No-info about ethnicity available 516 Associated AVM present 8 Arab 5 ED syndrome Japanese 1 Info about EDS available 1132 Eurasian, Albanian 2 No-info about EDS available 459 Eurasian, Anglo-Celt 298 EDS absent 1131 Eurasian, Baltic 1 EDS present 1 Eurasian, Basque 4 Aortic coarctation (CoA) Eurasian, Caucasian 42 Info about CoA available 1130 Eurasian, French 77 No-info about CoA available 461 Eurasian, German 10 CoA absent 1125 Eurasian, Hungarian 161 CoA present 5 Eurasian, Italian 21 Family history (FH) of SAH Eurasian, Other 152 Info about FH available 1141 Eurasian, Portuguese 10 No-info about FH available 450 Eurasian, Romanian 2 FH of SAH absent 965 Eurasian, Slav 6 FH of SAH present 176 Eurasian, Spanish 175 Smoking Iranian-Median, Kurd 1 Info about smoking available 1090 Latin-Caribbean Americans 14 No-info about smoking available 501 Malay, Filipino, Java 2 Never smoked 482 North American 1 Active smokers 341 South Asian, Indian, Nepali 2 Ex-smokers 267 Undefined 87 Hypertension (HTN) Coagulopathy Info about HTN available 1198 Info about coagulopathy available 775 No-info about HTN available 393 No-info about coagulopathy available 816 No HTN 794 No coagulopathy 766 HTN – not treated 73 Coagulopathy present 9 HTN - treated and controlled 301 Abdominal aneurysm (AAA) HTN - treated and poorly controlled 30 Info about AAA available 1130 Multiple IAs No-info about AAA available 461 Info about multiplicity available 1119 AAA absent 1125 No-info about multiplicity available 472 AAA present 5 Solitary lesions 200 APKD Multiple IAs 919 Info about APKD available 1129 Past SAH No-info about APKD available 462 Info about past SAH available 1151 APKD absent 1118 No-info about past SAH available 440 APKD present 11 No past SAH 1105 Alpha-1 antitrypsin deficiency (A-1AD) Past SAH present 46 Info about A-1AD available 1132 Marfan’s syndrome No-info about A-1AD available 459 Info about Marfan’s Synd. available 1133 A-1AD absent 1131 No-info about Marfan’s Synd. available 458 A-1AD present 1 No Marfan’s Synd. 1131 Oral contraceptives (OCP) use Marfan’s Synd. Present 2 Info about OCP use available 1142 Heart disease No-info about OCP use available 449 Info about heart disease available 1131 No OCP 1090 No-info about heart disease available 460 OCP users 52 No heart disease 1120 Heart disease Present 11

85
3.5. Data collection and organization 3.5.1: @neuQuest & CRIM (Clinically Relevant Information Model) The relevant clinical, demographic, social and radiological information of the participants was collected using the data entry software @neuQuest (Figures 3.2 and 3.3) @neuQuest is a GUI (Graphical User Interface) based software developed in Sheffield initially to collect local data but finally used by most of the clinical centres in @neurIST. 3.5.2: Data collection using @neuQuest: An editable definition file lists
the data fields to be collected both in terms of data type (date, text, number, etc.) and description of the item. All data entered into @neuQuest is recorded with audit information. Whereas, as much as possible information was collected, a minimum number of dataset also defined to prioritize the entry of information at the fastest possible pace without
missing the most vital bits through CRIM (clinically relevant information model). Collected data is made available outside the clinical environment after a rigorous anonymization process. The medical DICOM images selected in @neuQuest are also anonymized prior to export. Files anonymized for export are uploaded to an @neurIST DataNode where the data is imported into a database ready for users to query. @neuQuest also includes the functionality to scan patient DICOM imaging studies and automatically completes data sets. 3.5.3: Testing of the software and processing events: The @neuQuest suite and the routines for collecting data, anonymizing data and distributing data have constantly been tested by the clinical sites. Feedback has allowed new functionality to be added and issues to be fixed. The ultimate goal is @neuQuest to be adapted by many centres world over once the @neurIST and its products are taken over by ESMINT (European Society for Minimally Invasive Neurological Therapy).
Figure 3.2: @neuQuest GUI (Graphical User Interface)
Figure 3.3: @neuQuest GUI –Data Collection

86
3.5.4: @neuBrowser The anonymized data in @neuQuest software from all clinical centres were finally uploaded to a common server. This data was then passed to a central server called @neuBrowser (Figure-3.4) @neuBrowser is another state of the art
tool developed with project @neurIST. Apart from organizing and categorizing the data it can also present the information in nice and easy to understand graphs. 3.5.5: Image Acquisition and Processing The medical images used in different studies were obtained using rotational acquisition in a Philips® Integris™ Allura™ machine (Philips® Medical Systems, Best, The Netherlands), producing 100 images in 6 seconds, with 5 milliseconds exposure per image. Voxel size (Voxel is a ‘blend word’ derived form ‘volume’ and ‘pixel’ whereas ‘pixel’ itself is a combination of ‘picture’ and ‘element’. A Voxel therefore represents the smallest distinguishable boxed shaped part of a 3D image) in the reconstructed 3D images was either 121 microns or 234 microns (depending on the study, as specified in the beginning of each study) with reconstruction matrix of either 512x512x512 or 256x256x256 (depending on the study, as specified in the beginning of each study). All images were anonymized, respecting the @neurIST ethical approval for use of patient data. The current version of the @neuFuse software (prototype 4), based on the Multimod Application Framework [Viceconti et al 2004] and developed within the @neurIST project, was used to reconstruct the vessel surfaces, create the model and set up the haemodynamic analysis. The solvers used within @neuFuse to solve the fundamental equations describing the blood flow behavior within the region of interest were ANSYS®-ICEM™ and ANSYS®-CFX™ (Ansys®, Inc., Canonsburg, PA, USA). All analyses performed were pulsatile except for the workshops conducted for the evaluation of @neuFuse software, where simple stationary analyses (non-pulsatile but constant flow rate and pressure at the openings of the region of interest) were performed by the participants using Intel® core duo 2.4 GHz machines, with 2 GB RAM and 512 MB of dedicated graphic memory.
Figure-3.4 @neuBrowser- showing graphical representation of data

87
3.6. Software @neuFuse By definition, @neuFuse is a computer-aided medicine-application (CAM-application) software that integrates the visualization, modelling and simulation of multimodal biomedical data with specific respect to Intracranial Aneurysms. In the broad context of an integrated IT system for IA management, the role of such a suite is to gather clinical structured information from electronic medical records, and the unstructured functional imaging, to provide a state-of-the-art environment for medical imaging processing and modeling aimed at producing a structure of three distinguished complex derived indicators: morphological, haemodynamic, and structural. The derived data is then used by epidemiologists to find the definitive correlations to assess the risk of rupture. Innovative key elements are the capability of combining medical imaging data, simulation results and morphological indicators into a coherent set of patient-specific data, properly fused and interactively accessible from within an easy-to-use application and the development of a fat client that exploits the client hardware capabilities in advanced visualization while being fully integrated with the backend Grid infrastructure [Rajasekaran 2008]. 3.6.1 Development of @neuFuse: Contributions and Process @neuFuse is a result of joint collaboration received from several project partners that contributed at different layers by providing specific algorithmic plug-ins, or by providing application’s modules for a specific task, or by providing software libraries to connect to a specific service. In brief, Universitat Pompeu Fabra (UPF), Barcelona (Spain) provided the advanced medical imaging functionalities such as the segmentation and the skeletonization plug-ins. NEC Europe Ltd (Germany) contributed to
Figure-3.5: @neuFuse Software architecture

88
the data model design and provided routines for preprocessing the geometric models of vessel in an appropriate format for CFD solvers. Erasmus Medical Centre (The Netherlands) contributed in enhanced imaging filtering plug-in. The University of Sheffield (UK) and Ecole Polytechnique Federale de Lausanne (Switzerland) provided and integrated the 1D circulatory model. GridSystems S.A. (Spain), NEC Europe Ltd (Germany) and University of Vienna, Institute of Scientific Computing (Austria), provided the Grid-connectors libraries. University of Bedfordshire (former University of Luton) (UK) contributed to develop advanced graphics interface to visualize and manipulate vessel geometries. Super Computing Solution (s.r.l. B3C), Bologna, (Italy) was responsible for most of the development of the software, the integration and the maintenance. Major versions of @neuFuse applications have been released routinely every six months and it is being used by six clinical pilot centers (UPF, UNIGE, USFD, EMC, OXF, PEC). All these software components were integrated on an existing backbone, provided by the Multimod Application Framework. MAF is an open source freely available framework (MAF, http://www.openmaf.org) for the rapid development of applications based on the Visualisation Toolkit (www.vtk.org) and other specialized libraries. It provides high-level components that can be easily combined to develop a vertical application in different areas of scientific visualization (Figure-3.5). OpenMAF is further extended by an additional software layer, called MafMedical that contains all MAF components specific to the biomedical application domain. A generic MafMedical application, such as @neuFuse, is defined by choosing from the framework the necessary components, and eventually specialising them. It is also possible to develop ad hoc components that are necessary only to the application itself, and plug additional third party libraries. There are four types of components that form any MAF application: Virtual Medical Entities (VME); that are the data objects, Views; that provide interactive visualisation of the VMEs, Operations; that create new VMEs or modify existing ones, and interface elements; generic graphic user interface (GUI) components that define the user interface of the application.

89
3.6.2 @neuFuse: Work Flow at a Glance Haemodynamic modeling of cerebral aneurysms involves several steps (Figure-3.6). It starts with the retrieval of medical images in DICOM or
V3D format; creation of a geometric model of the vasculature; topological reconstruction of the vasculature, assignment of boundary conditions to the domain from the 1D flow model and, solution of the flow equations that are actually demanded for a specific off-the-shelf software. The main steps involved in the process are given below.
Figure-3.6: @neuFuse CFD processing toolchain. Form top right clockwise: DICOM images ate loaded and the vessel geometry segmented. Then a topologically correct geometric model is processed to extract vessel Centre line (axis). This information is then used to map 3D vessels with a 1D circulatory model. This mapping allows deriving flow boundary conditions for haemodynamic model.

90
Figure 3.7: Operation workflow from medical image to haemodynamic results. A) Orthoslice visualization of the 3DRA medical image in @neuFuse. B) Visualisation of the extracted vessel surface. C) Visualisation of reduced region of interest with location of inlet and outlet openings. D) 1D circulation model. E) Visualisation of predicted streamlines. F) Visualisation of predicted wall shear stress. Segmentation: The very first step to build CFD models of an IA is extraction of geometrical representation of the cerebral arteries from a medical image. Segmentation is a process where every pixel (or voxel in case of a medical images stack) of the image is labeled in order to form a small set of pixel clusters known as segments, to obtain a representation that is easier to analyze. The first product obtained here as a result of segmentation is the set of voxels that have been labeled as interior surface of the vasculature corresponding. In the literature, many different approaches are documented, but whereas some of these methods give acceptable results with a particular imaging modality; other methods are too operator-dependent. To combat the issue an automatic, multi-modal algorithm [Hernandez and Frangi 2007] has been developed and integrated in @neuFuse. Automatic segmentation could compute an accurate model of the arteries in few minutes.
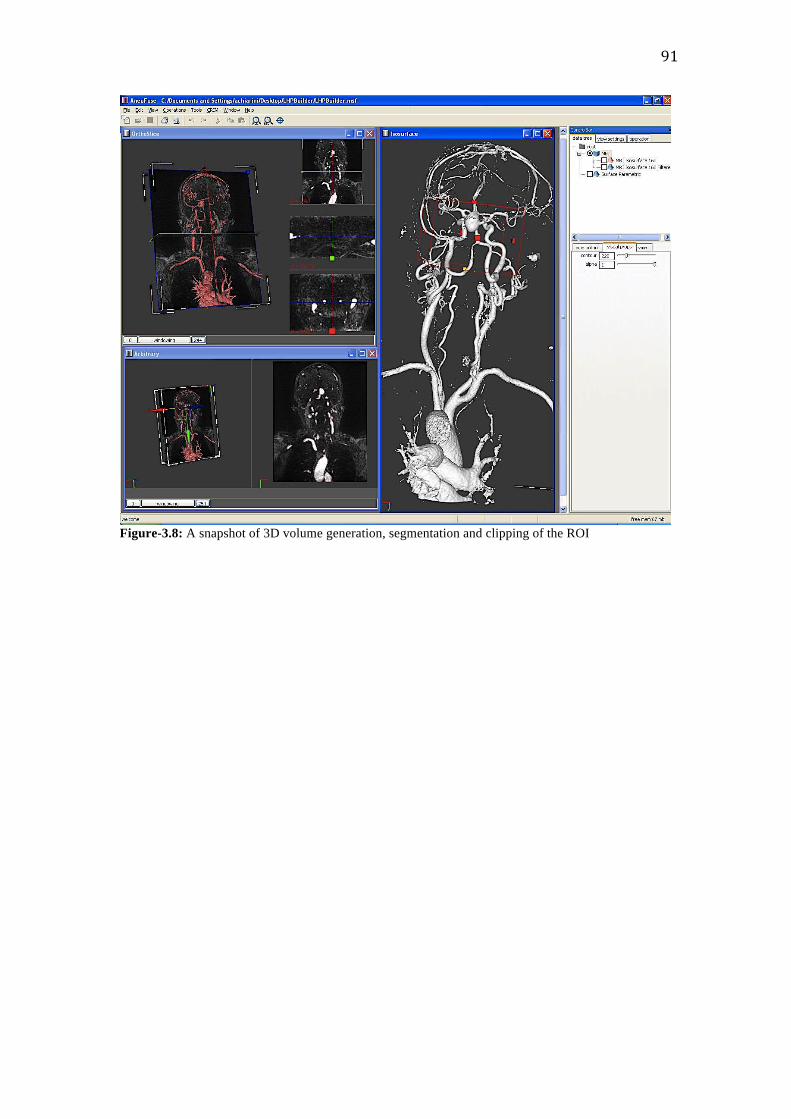
91
Figure-3.8: A snapshot of 3D volume generation, segmentation and clipping of the ROI

Geometric Healing: Lack of resolution or other contrast medium artifacts could generate errors in the automatic segmentation process that should be resolved by the operator. A typical example is the “kissing vessels” problem due to a lack of the image resolution. Two close vessels are glued together by the reconstruction algorithm, but in reality they are separate. If this problem is not solved before modeling, it may result in a gross error. To address this kind of problem, the @neuFuse operator should check that the resulting geometry is a topologically correct representation of the cerebral arteries and eventually fixes with a set of general-purpose tools, in a way which is similar to photo editing software.
Figure-3.9: A typical example of geometric healing where an artifact (a) and (b)“kissing vessels” can cause distortion of real geometry due to lack of the image resolution. Two close vessels are glued together by the reconstruction algorithm, but in reality they are separate

93
Vasculature Topology- Skeletonization: Once the geometric model is topologically correct, the next step is to extract the vasculature network. This process is called skeletonization because the result is a kind of graph that represents the vessels [Mellado et al 2007]. This representation is fundamental for many purposes; with this information it is possible to navigate the vessels, to check vessel diameters along a specific artery and, to plan an endovascular treatment choosing the position for deploying a stent.
Figure-3.10: Process of defining the centre line and Skeletonization

94
Boundary Conditions assignment: In this step the operator defines the domain of the flow simulation by localizing the inlets and outlets in relation to the vessel skeleton. Followed by this each vessel in the patient specific geometry is literally matched with the corresponding vessel in the 1D circulatory system model. The Boundary Conditions were derived from two main sources as described below in section 3.6.
Figure-3.11- Application of BCs at the inlets and outlets using 1D Model dictionary Solving flow equations: Once the model is completely defined, flow equations are solved. @neuFuse could launch the simulation software locally, or it can connect to the Grid infrastructure and request a remote simulation. To do so, data should be stored in a neutral format, as the simulation software could have several implementations. Then, data are processed and stored in the particular file format depending upon the solver used. The solver used in @neuFuse is ANSYS® ICEM-CFX™, which is then launched and finally results are loaded in @neuFuse.

95
Presenting results: The CFD solution is a very complex collection of data and it is a challenge to present them in an environment, which is coherent with the medical images and the clinical context (Figure-7). Results are composed by multi-scalar and multi-vector time-variant fields sampled on a tridimensional unstructured mesh, where each element represents an infinitesimal solid cell (typically tetrahedral).
Figure-3.12: Visualization of haemodynamic simulation in @neuFuse. On top right, flow particle tracing erythrocytes are animated according to the velocity field. On top left picture, streamlines represented with pressure-coded colouring. In the bottom left picture, WSS drawn on the vessel wall. On bottom right, complex visualization showing streamlines crossing an arbitrary plane coloured according a colour-code where red regions represent inward flow whilst represent outward flow regions. Typical representations for flow (velocity) fields are streamlines that represent the tangent of the velocity fields. Streamlines then are usually colored according the pressure gradients. To give an idea of the flow pattern, I introduced a particle tracer. It enables the visualization of flow particles’ position and to follow their trajectories in the boundaries for

96
each time-stamp of the simulation, by integrating the velocity field. The operator can also visualize 3D representation of the scalar fields. Vessel walls can be colored according to WSS values. Furthermore, it is also possible to superimpose scalar values on 2D original medical images. More complex, representations can also be obtained by combining those already presented. 3.7. Boundary conditions used in different studies: Measured and 1D model Application of appropriate Boundary Conditions at the inlets and outlets of the ROI (Region of Interest or domain) remains an essential prerequisite for any accurate CFD analysis. Accuracy of our predictions obviously depends upon the accuracy of the Boundary Conditions applied. The Boundary Conditions applied here in the studies done are derived from following sources: 1) Phase Contrast MRI (pc-MR) Scan: pcMR was used to measure the flow-rates in arteries at different locations to get the boundary conditions. All MR imaging and measurements were performed at high field strength (Achieva™ 3.0T, Philips® Medical Systems, Best, The Netherlands) using a standard 8-channel, radiofrequency receive-only head coil. The same radiographer imaged all patients to maximize the reproducibility of the overall acquisition technique. A pre-designed protocol guided the radiographer through the desired measurement locations for subsequent application of CFD BCs. As afferent vasculature has an important influence on intra-aneurysmal haemodynamics [Cebral et al 2005, Castro et al 2006, Moyle et al 2006, Oshima et al 2005], proximal measurements were taken at a distance of approximately 12 parent vessel diameters from the aneurysm. Measurements in distal arteries were taken four diameters away from the IAs. To minimize patient discomfort, table-occupancy time was no greater than 1 hour. Within this period, it was difficult to ensure that all measurements were obtained for all patients. The tortuous nature of the vasculature also made slice selection perpendicular to the artery difficult to achieve. To maintain integrity in the final measurement dataset, data was rejected if there was doubt about the placement of the measurement plane. Locations of pc-MR measurements are reported in Table-3.3. The manufacturer’s proprietary postdata-acquisition software (Q-Flow™, Philips® Medical Systems, Best, The Netherlands) was used to estimate volumetric flow rate (VFR) waveforms at each location.

97
Table-3.3: Radiological characteristics of IAs included in the study along with the location, type and method of BC application Pt. IA
No IA Location Size*
(mm) Neck (mm)
BC location BC type† BC Method
A 1 Lt ICA Cavernous
5.0/3.5 4.3 1.Lt ICA Proximal 2.Lt ICA Distal 3.Lt OphthA
Inlet/ velocity Outlet/ velocity Outlet/ pressure
pc-‐MR pc-‐MR 1-‐D
B 2 Lt MCA 11.1/7.3 4.3 1.Lt MCA Proximal 2.Lt MCA Supr-‐Div M-‐2 3. Lt MCA Infr-‐Div M-‐2
Inlet/ velocity Outlet/ pressure Outlet/ pressure
pc-‐MR 1-‐D 1-‐D
C 3 Lt ICA Cavernous
3.4/3.3 3.1 1.Lt ICA Proximal 2.Lt ICA Distal 3.Lt OphthA
Inlet/ velocity Outlet/ pressure Outlet/ pressure
pc-‐MR 1-‐D 1-‐D
D 4 Rt MCA Bifurcation
4.4/7.3 3.0 1.Rt MCA Proximal 2.Antr Temp branch of Rt MCA 3.Rt MCA Supr Div M-‐2 4.Rt MCA Infr Div M-‐2
Inlet/ velocity Outlet/ pressure Outlet/ pressure Outlet/ pressure
pc-‐MR 1-‐D 1-‐D 1-‐D
E 5 Lt ICA Subclinoid
2.9/2.5 3.1 1.Lt ICA Proximal 2.Lt ICA Distal 3.Lt OphthA
Inlet/ velocity Outlet/ velocity Outlet/ pressure
pc-‐MR pc-‐MR 1-‐D
6 Lt MCA Bifurcation
2.5/2.0 2.2 1.Lt MCA Proximal 2.Lt MCA Supr-‐Div M-‐2 3.Lt MCA Infr-‐Div M-‐2
Inlet/ velocity Outlet/ pressure Outlet/ pressure
pc-‐MR 1-‐D 1-‐D
NB: Lt; left, Rt; right, ICA; internal carotid artery, MCA; middle cerebral artery, OphthA; ophthalmic artery, Supr; superior, Infr; inferior, Div; division, Antr; anterior, Temp; temporal. *size is reported as max diameter/max length. †BC method refers to the analyses based on patient-‐specific BC. 2) 1D Model: In studies where patient-specific boundaries were not available (this is specified in the beginning of each study in their respective Materials and Methods sections), the Boundary Conditions were derived from the flow-rate and pressure waveforms computed by using the 1D circulation model developed by Reymond et al [Reymond et al 2009]. Development of this 1D Model was also a part of the @neurIST Project. This is a distributed model of the systemic arterial tree, including a detailed description of the cerebral arteries, and coupled to a heart model. Authors, Reymond and colleagues, have extensively validated the 1D Model given by them by measuring the flow and pressure in a number of arterial locations in healthy volunteers and found good agreement between these measurements with the corresponding values computed using the 1D Model [Reymond et al 2009]. The distal vessels and vascular beds of the model are terminated with three-elements Windkessel models to account for proximal and distal resistance and compliance of the peripheral vasculature. Flow-rate waveforms were used for all primary inlets and pressure waveforms for all primary outlets.

98
3.8. Statistical analysis: Robust and appropriate statistical tools were applied to analyze the results from different studies. Significance was calculated using Student’s t-test wherever required. Quantitative comparisons of the data obtained from different methodologies were made using boxplot diagrams. SPSS™ and Excel software were used to perform advanced statistical analyses as and where required. 3.9. Designing and Performing Different CFD Studies A number of studies were designed and performed as a part of this thesis. Next three sections of this manuscript are devoted to cover these studies as summarized below: First section: Validations of few common concepts used often in Computational Fluid Dynamics are covered in this section. Studies were designed by applying these concepts to CFD and their validity tested. Main concepts tested are; assessing effects of two common velocity profiles and effects of measured vs. modeled Boundary Conditions are also assessed on haemodynamics of Intracranial Aneurysms. Second section: This section covers Development and Controlled Exposures of Tool-chain. Third section: In this section, Computational Fluid Dynamics is used as a Tool to Explore the Aetipathogenesis of Intracranial Aneurysms. The main studies conducted were: Analysis of different haemodynamic factors during initiation and rupture of intracranial aneurysms, assessing the influence of various drugs, smoking, and hypertension on the haemodynamic characteristics of intracranial aneurysms, and effects of Aortic Coarctation on cerebral haemodynamics and aetiopathogenesis of intracranial Aneurysms.

99
Overview 4.1: Introduction 4.2: Effects of Different Velocity Profiles on the Haemodynamics of Intracranial Aneurysms 4.3: Effects of Measured vs. Modeled Boundary Conditions on the Haemodynamics of Intracranial Aneurysms 4.4: Discussion and conclusions *My contribution: In both studies described in this chapter, I played major role in concept, study design, conducting review of literature, performing analyses, performing statistical calculations, writing and submission of manuscripts to journals for publications. Dr Alberto Marzo (and other biomedical scientists, as detailed in acknowledgement section) gave important support and contribution in retrieval of medical images, performing CFD analyses, and post-processing of the results. 4.1. Introduction Once a robust tool-‐chain is build by the software engineers and biomedical scientists as described earlier, the next step was to establish the reliability of the common basic concepts applied while using CFD as a tool in the analysis of haemodynamic and morphological indices in the cerebral vasculature and IAs. Specification of boundary conditions is an important prerequisite for solving the governing equations in the extraction of these non-‐observable indices. As direct measurements of these flow-‐rate waveforms at the inlets and outlets of the domain are usually impracticable [Marzo et al. 2009], the boundary conditions are mostly derived using the available 1D Circulation models [Westerhof et al. 1969, Stergiopulos et al. 1992, Vignon-‐Clementel et al. 2006, Balossino et al. 2009, Bove et al. 2008]. A number of assumptions are made while applying these boundary conditions that can strongly perturb the numerical calculations. One such assumption is application of Womersley flow profile at inlet boundary of the domain [Marzo et al. 2009]. The first study therefore was conducted to investigate the
CHAPTER 4.0: VALIDATIONS OF THE COMMON CONCEPTS USED IN COMPUTATIONAL FLUID DYNAMICS

100
effects of different inlet velocity profiles on the haemodynamics of IAs and compared them with the more important determinants of the haemodynamics like geometry of the domain. The study on the effects of boundary conditions on the haemodynamics of IAs further extended by taking phase contrast MR (pc-‐MR) measurements for flow-‐rates in 19 IAs from nine patients recruited in the study [Marzo et al. 2011]. The effects of the boundary conditions derived using these patient-‐specific pc-‐MR follow-‐rates and the traditional 1D-‐model, on the haemodynamic characterization of IAs, were then compared and analyzed in order to quantify the agreements and differences in the values of derived haemodynamic indices. 4.2. Effects of Different Velocity Profiles on the Haemodynamics of Intracranial Aneurysms 4.2.1 Background and Objectives Pressure or flow rate waveforms are often available, from say magnetic resonance or 1D circulation models, as 1D values averaged over the cross sectional area of the vessel, and at specific instants along the cardiac cycle. The solution of the 3D Navier-Stoke equations, on the other hand, requires these quantities to be specified as point wise values at each node of the 3D boundary mesh. Assumptions made while completing such deficient data at boundaries is not trivial and can strongly perturb the numerical results. Many authors rely on the theory of Womersley (Womersley 1955) for the specification of the velocity profile of flow rate-based boundary conditions, assuming that flow is fully and axially developed and behave similarly to flow in a circular pipe. This is certainly the most realistic guess but it is known that geometry remains the most important factor (Cebral et al. 2005, Moyle et al. 2006, Oshima et al. 2005) that ultimately determines the flow development in cardiovascular vessels. The over-complication of applying a Womersley velocity profiles might be unnecessary and in some circumstances unrealistic in the determination of the haemodynamics within the aneurismal sac. Studies done so far (Myers et al. 2001) to assess the effect of these assumptions on systemic vessel haemodynamics have shown that geometry takes over within a relatively short distance from the location of the inlet boundaries, thus nullifying the effects of these assumptions.

101
However, the effects have only marginally been studied in the context of saccular cerebral aneurysms [Oshima et al. 2005], which often presents more complex haemodynamic patterns [Cebral et al. 2005a)] when compared to the simpler geometries of the studies reported so far [Myers et al. 2001; Moyle et al. 2006]. The current study investigates the effects of using different velocity profiles on the haemodynamics of intracranial aneurysms, and their secondary role when compared to anatomical geometry and extension of afferent vasculature, in three typical anatomical locations.
Figure-‐4.1: Representation in one of @neurIST application suites of a typical cerebral arterial tree, with locations of geom.1, geom.1b, geom.2, and geom.3 indicated by white spheres and black arrows.

102
4.2.2 Materials and Methods Three typical intracranial aneurysms found in the circle of Willis were considered in this study: an aneurysm at the tip of the basilar artery (herein called geom.1), an aneurysm of the right ophthalmic segment of the internal carotid artery (geom.2), and an aneurysm of the terminal bifurcation of the right middle cerebral artery (geom.3). Locations are shown in Figure-4.1. In order to study the flow development at the confluence of the vertebral arteries an additional geometry for the basilar artery aneurysm was reconstructed (geom.1b), which contains the junction of the two vertebral arteries. Essentially speaking geom.1 and geom.1b are same except for the presence of some extra proximal segment of vertebral arteries in geom.1b. Some images, in addition to the aneurysm of interest, contain additional minor aneurysms. These are highlighted by black arrows in Figure-2, and were excluded from the study. The aneurysm in each of geom.1 and geom.3 was saccular bilobular. The aneurysm in geom.2 was saccular with a single lobe. These geometries present a progressively higher level of tortuosity of the aneurysmal afferent loop from geom.1, where the basilar artery is only slightly curved, to geom.3, where the feeding vasculature presents several bends, changes in the lumen diameter and bifurcations, before reaching the aneurysm of interest. Properties of these geometries are given in Table-4.1.

Rotational acquisitions were obtained using a Philips® Integris™ BV 5000 machine (Philips® Medical Systems, Best, The Nederland), producing 100 images in 4 seconds, with 5ms exposure per image. A built-in x-ray image intensifier was used, with a close-circuit-digital camera and software to correct for geometrical deformation. Voxel size in the reconstructed 3D images was 303 microns with reconstruction matrix 512x512x512. Images were anonymized, respecting the ethical approval for @neurIST’s for use of patient data.
Figure-‐4.2. Reconstructed geometries: geom.1, basilar artery aneurysm, geom.1b, basilar artery aneurysm including vertebral arteries, geom.2, internal carotid artery aneurysm, geom3, middle cerebral artery aneurysm. Black arrows show secondary smaller aneurysms, excluded from the study. Labels indicate the openings where boundary conditions were applied.

104
Table-4.1: Geometrical properties of geom.1-3.
Aneurysm size [mm]
Depth Max diameter
Neck (max width)
Length of afferent vessel (normalized with inlet
diameter)
Complexity of afferent loop
geom.1 5.5-‐6.5* 4.6-‐5.8* 5.5 10D low geom.1b 5.5-‐6.5* 4.6-‐5.8* 5.5 12D** low geom.2 5.5 4.6 4.3 8.2D medium geom.3 4.4-‐3.8* 3.3-‐2.3* 3.1 12D high *Values for the two lobes, **values for both inlet afferent vessels, i.e. vertebral arteries, D= inlet diameter.
The @neurIST computational tool chain was used to segment, extract and repair the vessel surfaces. In particular, vessel triangular surfaces were created using a threshold isosurface extraction tool, based on the marching cubes algorithm developed by Lorensen et al. (1987) Artifacts and unnecessary vasculature were removed and surface repaired using tools based on the Visualization Toolkit (VTK) (www.vtk.org), further developed within the Multimod Application Framework (Viceconti et al. 2004) in @neurIST. All inlet openings were extruded and morphed into circular edges for the appropriate application of Womersley-based boundary conditions. Extrusion of some outlets was necessary to ensure that spatially constant pressure represented an appropriate boundary condition at the termination of the 3D domain. The results of the geometry reconstruction process are shown in Figure-4.2. During vessel reconstruction the neck of the aneurysms was manually identified and marked to define the aneurysmal sac that was used for the haemodynamic characterization of each aneurysm. Volumetric meshes were generated using ANSYS® ICEM CFD 11.0™ and based on the octree approach. Grids were made finer at the walls and progressively coarser towards the vessel axis. Tetrahedral elements were used for the discretization of the domain core, with three layers of prismatic elements adjacent to the wall, thus ensuring accurate computation of wall shear stresses (WSS) and oscillatory shear indices (OSI). Element size and number were set accordingly to the outcome of a mesh dependency study performed on similar aneurysmal geometries (Radaelli et al. 2008, private communications). In this study, results were found to be grid independent for meshes greater than 1700 el/mm3. In order to maintain consistency across the meshes used for all geometries, similar element density and the same wall element size and maximum core element size were used in the discretization of the domains. Mesh details are reported in Table-4.2 below.

105
Table-4.2: Grid properties for geom.1-3
volume [mm3]
elements nodes average density [el./mm3]
max el. size [mm]
max wall el. size [mm]
geom.1 433.9 1321449 411331 3046 0.4 0.12
geom.1b 540.4 1678606 527615 3106 0.4 0.12
geom.2 1375.5 3173174 912842 2307 0.4 0.12
geom.3 848.2 2292777 694172 2703 0.4 0.12
The 3D unsteady Navier-Stokes equations were solved by using the finite-control-volume software, ANSYS®-CFX™. The default second order high-resolution advection-differencing scheme was used. The solution algorithm is an implicit coupled solution scheme, based on an algebraic multigrid method for the coupled linear equations. Blood was assumed to be incompressible, with density ρ=1050 kg/m3, and Newtonian, with viscosity μ=0.0035 Pa s. All analyses were run in parallel, using the communication mode MPICH on two Itanium2 900MHz 64-bit processors of a Tiger-2 Linux cluster node with 4GB of registered DDR-SDRAM PC1600. 4.2.3 Boundary conditions Patient-specific flow measurements at boundaries were not available for the data sets under consideration, thus boundary conditions were derived from the flow-rate and pressure waveforms computed by using the 1D circulation model developed by Reymond et al. (2008), which is part of the @neurIST computational tool chain. This is a distributed model of the entire systemic arterial tree, coupled to a heart model and including a detailed description of the cerebral arteries. The 1D form of the fluid equations are applied over each arterial segment and intimal wall shear stress is modeled using the Womersley theory. A non-linear viscoelastic constitutive law for the arterial wall is considered. The systemic arterial tree dimensions and properties were taken from literature and extended to include a description of the cerebral arterial tree obtained from real patient scans. Flow-rate waveforms were used for all primary inlets and pressure waveforms for all primary outlets. All pressure and flow rate waveforms used for the analyses are reported in Figure-3 to Figure-6. Flow-rate waveforms were used to specify, in turn, plug-flow (i.e. flat velocity profile) and Womersley velocity profiles at the inlet boundaries.

106
Figure 4.3 Flow-rate (top) and pressure waveforms (bottom) applied in geom.1
0.0E+00
2.0E-06
4.0E-06
6.0E-06
0 0.2 0.4 0.6 0.8time [s]
flo
w r
ate
[m^
3/s]
in1
8.0E+03
1.3E+04
1.8E+04
0 0.2 0.4 0.6 0.8
time [s]
pre
ssu
re [
Pa]
out1-out2
out3-out4
out5-out6

107
Figure 4.4 Flow-rate (top) and pressure waveforms (bottom) applied in geom.1b
0.0E+00
2.0E-06
4.0E-06
6.0E-06
0 0.2 0.4 0.6 0.8time [s]
flow
rat
e [m
^3/s
]in1
in2
8.0E+03
1.3E+04
1.8E+04
0 0.2 0.4 0.6 0.8
time [s]
pre
ssu
re [
Pa]
out1-out2
out3-out4
out5-out6

108
Figure 4.5 Flow-rate (top) and pressure waveforms (bottom) applied in geom.2
0.0E+00
5.0E-06
1.0E-05
1.5E-05
0 0.2 0.4 0.6 0.8time [s]
flo
w r
ate
[m^
3/s]
in1
8.0E+03
1.3E+04
1.8E+04
0 0.2 0.4 0.6 0.8
time [s]
pre
ssu
re [
Pa]
out1
out2
out3
out4

109
Figure 4.6 Flow-rate (top) and pressure waveforms (bottom) applied in geom.3
0.0E+00
5.0E-06
1.0E-05
1.5E-05
0 0.2 0.4 0.6 0.8time [s]
flo
w r
ate
[m^
3/s]
in1
8.0E+03
1.3E+04
1.8E+04
0 0.2 0.4 0.6 0.8
time [s]
pre
ssu
re [
Pa]
out1
out2
out3
out4
out5

110
The waveforms were decomposed into Fourier series as indicated in equation (1)
…………….(1) where N is the number of harmonics , and ω is the angular frequency derived from the period of the cardiac cycle T=0.8 s. The Womersley velocity profile was expressed in terms of the Fourier representation of the flow rate waveforms as indicated in equation (2)
…..……..(2)
where R is the radius of the inlet boundary, Q0 is the first harmonic coefficient responsible for the parabolic profile of a steady flow (i.e. Poiseuille’s flow), J0 and J1 are Bessel functions of order zero and one, respectively, and
…………….(3)
……………(4)
where αn is the Womersley number of the n-th harmonic. A Fortran subroutine was created and interfaced to the ANSYS®-CFX™ solver for the computation of the velocity inlet profiles within each time loop. Analyses were run for four cardiac cycles to nullify the transient artifacts generated by the initial conditions, and only data from the 4-th cycle were used in the post-processing phase. 4.2.4 Results Relevant haemodynamic variables were compared qualitatively and quantitatively for the two velocity profile assumptions both at two time-points along the cardiac cycle (corresponding to the lowest and highest Reynolds numbers achieved during diastole and systole, respectively), and as time-averaged quantities across the cardiac cycle. The haemodynamic variables chosen for these comparisons have been associated to
inwtN
nneQtQ ∑
=
=0
)(
( )( )( )
i nwt
non
n
n
n
N
n
n e
JJJ
Rr
J
RQ
Rr
RQ
trv ⋅
⎥⎥⎥⎥⎥⎥⎥
⎦
⎤
⎢⎢⎢⎢⎢⎢⎢
⎣
⎡
⋅−
⎟⎠
⎞⎜⎝
⎛ ⋅
−
+⎥⎥⎦
⎤
⎢⎢⎣
⎡⎟⎠
⎞⎜⎝
⎛−= ∑=
ββββ
β
ππ 1
0
0
12
2
20
21
11
2),(
nn i αβ ⋅= 23
µρϖ
α⋅⋅
⋅=nRn

111
aneurysmal initiation, growth, and rupture in the literature (Shojima et al. 2004, Cebral et al. 2005) 4.2.4.1: Qualitative comparison using instantaneous velocity contours Figure-4.7 shows the comparison between Womersley and plug-flow boundary conditions during diastole and systole, using velocity contours at specific cross sections. The cross-sections were selected as those, which subjectively, best illustrated the complexity of the flow within the three domains. Results for geom.1 show that for both flow regimes; the Womersley and plug-flow flow patterns are essentially the same with some minor discrepancy in the magnitude of the velocity field, as shown by the arrows in Figure-4.7.
Figure-‐4.7: Velocity contours across the aneurysmal sac for a) Womersley BC at lowest Re during diastole, b) plug-‐flow BC at lowest Re during diastole, c) Womersley BC at highest Re during systole, d) plug-‐flow BC at highest Re during systole. From top to bottom: geom.1, geom.2, and geom.3. Grey arrows indicate areas of discrepancies.

112
Results for geom.2 are consistent with geom.1 except that discrepancies in velocity magnitudes are more pronounced in the lower part of the cross section, representing the velocity patterns within the parent vessel. Finally, results for geom.3 show good agreement in the patterns as well as the magnitude of the velocity field. Contours in geom.2 and geom.3 show the presence of a jet of fluid entering the aneurysm and impinging onto the distal side of the aneurysmal wall. Moreover, results for all geometries show that flow is rather stable (according to the definition of Cebral et al. 2005), exhibiting the same characteristics during diastole and systole. 4.2.4.2: Qualitative comparison using instantaneous WSS contours Figure-4.8 shows the comparison between Womersley and plug-flow boundary conditions during diastole and systole, using contours of WSS on the wall of the aneurysmal sac. Results for geom.1 show that Womersley and plug-flow boundary conditions at inlet develop essentially the same WSS distribution in the aneurysm in both flow regimes. It was noticed that the bigger lobule of geom.1 is one, which is subjected to comparatively low WSS at both reported time-points in the cardiac cycle, whereas in the smaller lobule WSS values reach their highest values. Results for geom.2 and geom.3 show essentially the same WSS patterns for both inflow assumptions and for both flow regimes, with some minor variations for geom.2 during diastole near the aneurysmal neck, and for geom.3 during systole as shown by the arrows in Figure 4.8. As for velocity distributions, WSS present similar patterns during diastole and systole, showing stability of the flow.

113
4.2.4.3: Qualitative comparison using time-averaged WSS and OSI contours Time-averaged haemodynamic quantities can be used to assess the agreement between results over the whole cardiac cycle, and not solely at specific snap-shots in time. Time-averaged WSS are reported, together with Oscillatory Shear Index (OSI) for further comparison. OSI is defined in equations 5, 6 and 7, and was used to quantify the oscillatory shears experienced by the cells of the inner part of the arterial vessel and aneurysm (endothelial layer).
…………(5)
……………(6)
where ts represents the surface traction vector. Figure 4.9 and Figure 4.10 show the time-averaged WSS and OSI contours, respectively, on the aneurysmal wall of all three geometries and for both inlet boundary conditions.
⎟⎟⎠
⎞⎜⎜⎝
⎛−=
abs
meanOSIττ
121
∫ ⋅=T
smean dttT 0
1τ
Figure-‐4.8: WSS contours for a) Womersley BC at lowest Re during diastole, b) plug-‐flow BC at lowest Re during diastole, c) Womersley BC at highest Re during systole, d) plug-‐flow BC at highest Re during systole. From top to bottom: geom.1, geom.2, and geom.3
A B C D

114
Figure-‐4.9: Time-‐averaged WSS contours for a) Womersley boundary conditions, b) plug-‐flow BC. From top to bottom: geom.1, geom.2, and geom.3.

115
The results are consistent with those of the instantaneous measures, i.e. very little differences are observed between WSS and OSI patterns, and only minor differences in magnitudes, from Womersley and plug-flow boundary conditions. For these aneurysms, exhibiting stable flow patterns over the cardiac cycle, it is noted that the time-averaged WSS stress pattern is qualitatively very similar to that of its instantaneous counterparts.
Figure-‐4.10: OSI contours for a) Womersley BC, b) plug-‐flow BC. From top to bottom: geom.1, geom.2, and geom.3.

116
4.2.4.4: Qualitative comparison on flow development Figure 4.11a and Figure 4.11b show the development of the flow for Womersley and plug-flow boundary conditions for geom.1. Although the two flows start from different assumptions at the inlet opening, both develop into a very similar velocity pattern before reaching the aneurysmal sac. Figure 4.11c, illustrating the results for the extended domain of geom.1b, shows that the two converging vessels produce a ring-like velocity profile that is significantly different from both the Womersley and flat profiles, but in fact closer to the latter.
This indicates clearly that there are geometries (of course those that are least like a straight tube) for which the Womersley profile is actually a worse choice than the flat profile. Nevertheless, once again the flow close to the aneurysm is relatively similar for all boundary conditions considered. 4.2.4.5: Quantitative comparison For a more accurate and direct evaluation of the effects that different boundary conditions may have on local haemodynamics, several haemodynamic indices were extracted from the flow field of the three aneurysmal sacs, for both inflow boundary conditions. These are reported in Table-3 with the percentage discrepancy between Womersley and plug-flow results. In geom.1, the maximum discrepancy was observed in the spatial-average speed in the aneurysmal sac (4.3%) and in the area of elevated pressure in the aneurysmal wall (also 4.3%). Relatively high discrepancies were also observed in the values predicted for the maximum speed within the aneurysm at systole (2.3%) and the location of maximum OSI (2.8%). In geom.2, the maximum discrepancy was observed in the
Figure-4.11: Velocity vectors on cross-sections along the afferent vessel at peak systole for geom.1 (a,b) and geom.1b (c). The distance between the cross-sections is 1.5D, where D is the diameter of the inlet boundary in geom.1.

117
predictions of area of elevated pressure (4.1%) and for geom.3 in the values of max OSI (3.7%) and its location (4.1%). Table 4.3. Haemodynamic indices extracted for geom.1-3 and percentage error between Womersley and plug-flow results. 1) Elevation defined as 50% of peak pressure minus average pressure in the aneurysm at systole. 2) Elevation defined as 50% of maximum time-averag
Geom.1 Geom.2 Geom.3 Wom Plug Err% Wom Plug Err% Wom Plug Err%
Max speed within aneurysm at systole [m/s]
1.774 1.733 -‐2.3 1.154 1.155 0.1 1.555 1.544 -‐0.7
Spatial mean speed in aneurysm at systole [m/s]
0.331 0.317 -‐4.3 0.557 0.557 0.0 0.619 0.619 0.0
Peak static wall pressure at systole [Pa]
16131 15950 -‐1.1 15770 15750 -‐0.1 14560 14550 -‐0.1
Location X of max pressure [m] 3.51E-‐02 3.51E-‐02 0.0 4.20E-‐02 4.20E-‐02 0.0 1.73E-‐02 1.73E-‐02 0.0
Location Y of max pressure [m] 1.64E-‐02 1.64E-‐02 0.0 2.33E-‐02 2.33E-‐02 0.0 3.11E-‐02 3.11E-‐02 0.0
Location Z of max pressure [m] -‐3.67E-‐02 -‐3.67E-‐02 0.0 -‐3.48E-‐02 -‐3.48E-‐02 0.0 -‐3.65E-‐02 -‐3.65E-‐02 0.0
Spatial mean static pressure in aneurysm at systole [Pa]
15260 15130 -‐0.9 15140 15120 -‐0.1 13770 13770 0.0
Area of elevated pressure1 [m2] 0.123E-‐06 0.118E-‐05 -‐4.3 4.18E-‐06 4.01E-‐06 -‐4.1 7.06E-‐06 7.13E-‐06 1.1
Max time-‐averaged WSS [Pa] 25.79 25.52 -‐1.1 16.44 16.87 2.6 49.07 50.52 2.95
Location X of max time-‐averaged WSS [m]
3.604E-‐2 3.604E-‐2 0.0 4.18E-‐02 4.18E-‐02 0.0 1.79E-‐02 1.79E-‐02 0.0
Location Y of max time-‐averaged WSS [m]
0.196E-‐03 0.196E-‐03 0.0 0.232E-‐03 0.232E-‐03 0.0 0.291E-‐03 0.291E-‐03 0.0
Location Z of max time-‐averaged WSS [m]
-‐3.48E-‐02 -‐3.48E-‐02 0.0 -‐3.49E-‐02 -‐3.49E-‐02 0.0 -‐3.36E-‐02 -‐3.36E-‐02 0.0
Area of elevated time-‐averaged WSS2 [m2]
1.83E-‐06 1.82E-‐06 -‐0.9 6.39E-‐07 6.39E-‐07 0.0 2.60E-‐07 2.56E-‐07 -‐1.4
Max OSI in aneurysmal wall [ ] 0.491 0.487 -‐0.8 0.471 0.472 0.2 0.494 0.475 -‐3.7
Location X of max OSI [m] 3.21E-‐02 3.12E-‐02 -‐2.8 4.13E-‐02 4.13E-‐02 0.0 1.95E-‐02 1.97E-‐02 1.2
Location Y of max OSI [m] 1.80E-‐02 1.79E-‐02 -‐0.9 2.34E-‐02 2.34E-‐02 0.0 3.12E-‐02 2.99E-‐02 -‐4.1
Location Z of max OSI [m] -‐3.20E-‐02 -‐3.12E-‐02 -‐2.7 -‐3.75E-‐02 -‐3.75E-‐02 0.0 -‐3.67E-‐02 -‐3.68E-‐02 0.3
Area of elevated OSI [m2] 6.44E-‐05 6.37E-‐05 -‐1.0 3.39E-‐07 3.35E-‐07 -‐1.2 7.30E-‐07 7.70E-‐07 5.4
RMS error % 1.9 1.2 1.98
The root mean square of the errors of the different indices was also computed and is reported in the last row of Table-4.3. Overall, the maximum discrepancy between Womersley and plug-flow results was observed in geom.3, where the RMS is 2%. Lower RMS values were calculated for geom.1, RMS = 1.9%, and geom.2, RMS = 1.2% 4.2.5 Discussion The purpose of this section is to compare the results from two common methods of application of proximal velocity boundary conditions for haemodynamic analysis of cerebral aneurysms. The context is that of

118
specification of a robust protocol for routine haemodynamic analysis as part of a clinical workflow. The isolation of the vessel of interest from the rest of the cardiovascular tree and its surroundings (e.g. tissues, bones) implies that wall and flow conditions will have to be specified at the boundaries of the vessel. Patient-specific assessment of the properties of the vessel walls and its surroundings are difficult. There is some evidence that pulsatility of the vessel wall might have negligible effect on haemodynamics even when the wall motion is of the order of the radius of a vessel (Jeays et al. 2007) and even less so in the context of cerebral aneurysms in the confined compartment of the skull (Dempere-Marco et al. 2006). For the purposes of the current study, (and probably for a routine clinical analysis protocol) the walls of the vessel are considered fixed. Patient-specific flow measurements are in principle attainable from MRI or Doppler ultrasound but the intricacy of the cerebral vasculature, the small size of its vessels, and the fact that these are not part of the clinical procedure make them rarely available. Even when they are, it is unusual to rely on the spatial distribution of velocity (due to resolution of MRI and difficulties of location of Doppler ultrasound measures). To overcome these difficulties several authors use lumped-parameters or 1D models for the description of the remaining vascular systems (Formaggia et al. 1999, Quarteroni et al. 2001). Flow boundary conditions, whether from patient-specific ultrasound MRI measures or computed using simple models of the cardiovascular system, are available as cross-sectional average values of velocity or pressure along the cardiac cycle. Thus assumptions on their 3D development across the same boundaries are to be made to match the level of details required by 3D modeling. While imposing inflow boundary conditions from the flow-rate waveforms computed by a 1D distributed model, for instance, one assumption often imposed at the inlet boundary is that of axisymmetric flow with a velocity distribution determined by the Womersley theory. The results of the comparative analyses with Womersley and flat velocity profiles indicate that there is no change in qualitative flow patterns, and detailed examination of the flow fields yields maximum differences of less than 5%, and RMS differences between 1 and 2%. It is suggested that these differences are unimportant in the context of interpretability against known thresholds, and particularly in the context of other uncertainties in the analysis (patient blood pressure, beat-to-beat variations, alternative physiological states including exercise, patient haematocrit and viscosity models). Certainly, the errors are small compared with those that might

119
arise from inaccurate segmentation of the patient specific geometry, when variability up to 48% has been reported (Moyle et al. 2006). Whilst the true significance and relevance of discrepancies between Womersley and plug-flow results can only be assessed once associations are found between haemodynamic indices and aneurysmal evolution, it is probably safe to assume that the uncertainties of any thresholds and the safety factors that will be built into any clinical interpretation and recommendations will always remain greater than that associated with analysis errors from the inlet velocity profile provided the inlet development domain is of adequate length. The computational savings associated with a recommendation of the simplest inlet-velocity-boundary-condition that of a flat profile, are not significant. More important is that the simpler the analysis protocol adopted, the more likely it is that other centers will contribute to the growth of an established database of haemodynamic characterizations, ultimately reflecting on its power to provide meaningful, peer-reviewed and clinically implementable associations of the characteristic haemodynamic measures with observed clinical outcome. Until such associations are established, the impact of CFD on the management of cerebral aneurysms will be minimal. A limitation of the current study is that results are reported for only three aneurysms, with one further variation. Nevertheless, these aneurysms have been selected as typical of those that arise most commonly in the cerebral vasculature and, given the consistency of the results and their resonance with expectations based on the physics of the problem, it is suggested that it provides strong evidence that haemodynamic characterizations are indeed likely to be insensitive to details of the inlet velocity distribution. Although specific analysis and comment on the haemodynamic results for any one aneurysm is not the focus of the current study, the analysis of geom.1 revealed some interesting haemodynamic characteristics that are worthy of mention. Primary haemodynamic activity is clearly confined to one of the lobules, whilst the other is subject to very low wall shear stresses. In fact it is the smaller lobule that exhibits strong haemodynamic activity and the larger that is relatively stagnant. It is noted that the larger lobe has a more irregular shape. No follow-up data is available and so it is impossible to determine which, if either, lobe is growing or which might rupture. Nevertheless, it is noteworthy that the haemodynamic environment in the smaller lobes is more similar to that in the parent vasculature rather than that in the larger lobe, and that the mean shear stress in the larger lobe is below that threshold that has been associated

120
with negative outcome and the onset of disease in other vascular applications [Malek et al. 1999]. 4.2.6. Conclusions The following conclusions can be drawn from this study: 1. The haemodynamic characterization of a cerebral aneurysm, under given proximal flow conditions is relatively insensitive to the details of the velocity profile on inlet boundaries that are sufficiently far from the aneurysm. 2. Wider adoption of a given analysis protocol is more likely if it is simple to implement, and the specification of a flat velocity profile at the inlet to a 3D domain provides an adequate and justifiable description for the purposes of haemodynamic characterization. 4.3. Computational Haemodynamics in Intracranial Aneurysms: the Effects of Modeled versus Patient-Specific Boundary Conditions 4.3.1 Background and Objectives There is growing consensus that haemodynamics plays an important role in the growth, rupture and initiation of IAs [Cebral et al 2005, Sekhar and Heros 1981, Shojima 2004]. Two haemodynamic indices, WSS (wall shear index) and OSI (oscillatory shear index), have received particular attention due to their influence on endothelial cell behavior [Cebral et al 2005, Shojima 2004]. Although the studies from Rayz et al [Rayz et al 2008], Boussel et al [Boussel et al 2008], and Isoda et al [Isoda et al 2010], showed that in-vivo measurements of these quantities are possible using magnetic resonance fluid dynamics (MRFD), inherent limitations in the technology impede its use in large cohort studies where detailed haemodynamics is needed also for smaller aneurysms (max diameter < 5 mm). In this context, numerical modeling can provide detailed predictions for WSS and OSI using input parameters derived from medical imaging, blood sampling, and other patient information. In fact, CFD has been used by many authors in the context of IAs to find correlations between haemodynamics and risk of rupture or growth. For convenience, in these works the extension of the computational domain is often limited to a restricted area around the aneurysm. The specification of boundary conditions at the interfaces with the rest of the cardiovascular network

121
thus remains a pre-requisite for the solution of the governing equations. Different authors approach this particular aspect differently. Some studies use patient-specific Boundary Conditions (BCs) based on measurements obtained using phase contrast – magnetic resonance (pc-MR) or transcranial Doppler (TCD) ultrasound, to record blood velocity; and applanation tonometry, to infer pressure. However, because of the inherent difficulty in obtaining these measures in the small and intricate vessels of the cerebral vasculature, and the fact that these measurements are to date rarely justifiable as part of the clinical routine, such studies are often based on small cohort sizes and lack statistical significance [Jou et al 2008, Hassan et al 2004, Jou et al 2005, Boussel at al 2008, Rayz et al 2008, Rayz et al 2008b]. Furthermore when patient-specific-BC data is available, these are often limited to the inflows of the fluid domains [Hassan et al 2004, Jou et al 2005, Boussel at al 2008, Rayz et al 2008, Rayz et al 2008b] where vessels are larger and easily accessible by the available measurement techniques. Larger cohort studies, in contrast, rely on inflow BCs based on measurements taken from typical healthy individuals, in some cases [Jou et al 2008, Radaelli et al 2008, Venugopal et al 2007, Cebral et al 2009, Mantha et al 2006] scaled to achieve a supposedly more realistic mean WSS of 1.5 Pa, and outflow BCs that assume the same peripheral resistance at all openings (traction free or zero pressure BCs). The assumptions associated with this type of BCs may also lead to unrealistic results. As detailed comparison with in-vivo measurements is currently difficult, the validity of CFD tools in the context of IAs rupture risk assessment and management relies upon the extent to which the correlations between haemodynamic predictions and rupture are statistically matched for a large cohort study. One of the important aims of @neurIST (www.aneurist.org), a multidisciplinary EU project of which this study forms a part, is to establish these correlations by processing a large number of cases. The lack of patient-specific data for use at computational boundaries remains an important limiting factor in the project. This issue has been addressed by deriving a complete set of BCs for 3D CFD analysis from a 1D-model of the circulatory system, including the cerebral vasculature [Reymond et al 2009]. This study explores and analyzes the effects that BCs derived using in turn the 1D-model, patient-specific pc-MR measurements, and other

122
approaches found in the literature, have on the haemodynamics within typical intracranial aneurysms. 4.3.2 Materials and Methods Study design, demographics and clinical details: The study was conducted in cooperation between the Departments of Neurosurgery and Neuroradiology, Royal Hallamshire Hospital, and the Academic Units of Medical Physics and Radiology, University of Sheffield, Sheffield, UK. A total of 5 patients diagnosed with IAs between Dec 2006 and Jan 2009, were identified retrospectively and followed prospectively according to the data collection protocol of the @neurIST project upon appropriate ethical approval and patient consent. Table-4.4 gives the demographic constitution of the population along with the relevant aneurysm details. All IAs were sidewall saccular aneurysms and their location is shown in Figure-4.12.
Figure: 4.12. Locations of aneurysms 1-5 in a typical cerebral vasculature (illustration generated using the @neurIST software)

123
Table 4.4 Patient demographics and aneurysm radiological features
Patient Aneurysm # Sex Age # Side Location Rupture Size(diam/neck)[mm] 1 M 44 1 Left ICA No 5/4.3 2 M 52 2 Left MCA No 11.1/4.3 3 F 50 3 Left ICA No 3.4/3.1 4 F 41 4 Right MCA Yes 4.4/3 5 F 51 5 Left ICA No 2.9/3.1
ICA = Internal Carotid Artery; MCA = Middle Cerebral Artery bifurcation Image acquisition: The medical images used for surface reconstruction were obtained using 3D rotational acquisition (3DRA) in a Philips® Integris™ Allura machine (Philips® Medical Systems, Best, The Netherlands), producing 100 images in 6 seconds, with 5ms exposure per image. Voxel size in the reconstructed 3D images was 121 microns with reconstruction matrix of 512x512x512. pc-MR protocol: All MR imaging was performed at high field strength (Achieva™ 3.0T, Philips® Medical Systems, Best, The Netherlands) using a standard 8-channel, radiofrequency receiver-only head coil. The same radiographer imaged all patients to maximize reproducibility of overall acquisition technique. Macroscopic vascular flow and IA location were visualized using a qualitative Time-Of-Flight (TOF) MR angiography sequence. Maximum intensity projections (MIP) from this 3D dataset were used to define the placement of each quantitative phase contrast measurement plane perpendicular to the vessel under investigation. A 2D acquisition sequence (TR=7.7ms, TE=3.7ms, flip angle=10˚; field of view=270x179mm, acquisition matrix=1.7x1.60mm, slice thickness=5mm) was used to acquire 40 velocity-encoded ‘time-point’ over the cardiac cycle at each vascular location. Vector Electro Cardiography (ECG) triggering was used to standardize each quantitative acquisition. Appropriate maximum velocity-encoding (VENC) values

124
Figure-4.13: Mesh particulars and BC types used. QMRI is the velocity-based boundary condition from MRI patient-specific measurements, Q1D is the velocity-based boundary condition from 1D model, Q1D-S is the WSS-scaled velocity-based boundary condition
condition from 1D model, and P1D is the pressure boundary condition from 1D Model was chosen (150 cm/sec for ICA and 120 cm/sec for MCA regions) to ensure that appropriate dynamic ranges were sampled in all cases. A pre-designed protocol guided the radiographer through the desired measurement locations for subsequent application of CFD BCs. As afferent vasculature has an important influence on intra-aneurysmal

125
haemodynamics [Cebral et al 2005, Castro et al 2006, Marzo et al 2009, Moyle et al 2006, Oshima et al 2005] proximal measurements were taken at a distance of approximately 10 parent vessel diameters from the aneurysm. Measurements in distal arteries were taken 3 diameters apart from the IAs. Patient table-occupancy time was no greater than 1 hour. Within this period it was difficult to ensure that all measurements were obtained for all volunteers. The tortuous nature of the vasculature also made slice selection perpendicular to the artery difficult to achieve. To maintain integrity in the final measurement dataset, data was rejected if there was doubt about the placement of the measurement plane. Table-4.5: Boundary conditions location, type and method Aneurysm BC Location type Method I Method II Method III
1 ICA proximal inlet pc-‐MR/velocity 1D/velocity 1D/velocity scaled ICA distal outlet pc-‐MR/velocity 1D/pressure 1D/pressure OphthA outlet 1D/pressure 1D/pressure 1D/pressure 2 MCA M1 inlet pc-‐MR/velocity 1D/velocity 1D/velocity scaled MCA M2 supr outlet 1D/pressure 1D/pressure 1D/pressure MCA M2 infr outlet 1D/pressure 1D/pressure 1D/pressure 3 ICA proximal inlet pc-‐MR/velocity 1D/velocity 1D/velocity scaled ICA distal outlet 1D/pressure 1D/pressure 1D/pressure OphthA outlet 1D/pressure 1D/pressure 1D/pressure 4 MCA M1 inlet pc-‐MR/velocity 1D/velocity 1D/velocity scaled TempA outlet 1D/pressure 1D/pressure 1D/pressure MCA M2 supr outlet 1D/pressure 1D/pressure 1D/pressure MCA M2 infr outlet 1D/pressure 1D/pressure 1D/pressure 5 ICA proximal inlet pc-‐MR/velocity 1D/velocity 1D/velocity scaled ICA distal outlet pc-‐MR/velocity 1D/pressure 1D/pressure OphthA outlet 1D/pressure 1D/pressure 1D/pressure
ICA=internal carotid artery, OphthA=ophthalmic artery, MCA M1=middle cerebral artery, MCA M2 supr/infr=superior/inferior division of the middle cerebral artery, TempA=temporal artery Locations of pc-MR measurements are reported in Table-4.5 (column “BC Location”). The manufacturer’s proprietary post-data-acquisition software (Q-Flow™, Philips® Medical Systems, Best, The Netherlands) was used to estimate volumetric flow rate (VFR) waveforms at each spatial location. 1D circulation model: The finite-difference model developed by Reymond et al [Reymond et al 2009], was used to compute pressure and VFR waveforms at the desired boundaries of the 3D domain. The model solves the 1D form of the Navier-Stokes equation in a distributed model of the main human systemic arteries including the main arteries of the circle of Willis. It accounts for ventricular-vascular interaction and wall viscoelasticity, and it was recently validated through a comparison with in-vivo measurements taken using applanation tonometry, B-mode, and colour-coded duplex flow imaging, and pc-MRI. Although the model could be personalized tuning input parameters such as heart rate (HR), cardiac contractility, age (vessel elasticity), height (vessel geometry), and blood properties, in this study the model was used with the properties of a

126
typical young individual as patient-specific data was not available for all patients. A typical analysis is solved in approximately 8 min. CFD models: The @neurIST computational tool-chain was used to reconstruct vessel and aneurysmal geometries, following the workflow described in Marzo et al [Marzo et al 2009]. The 3D transient Navier–Stokes equations were solved by using the finite-control-volume software, ANSYS®-CFX™. Blood was assumed to be incompressible, with density ρ=1060 kg/m3, and Newtonian, with viscosity µ=0.0035 Pa·s. Boundary conditions were applied following three different approaches, as reported in Table-4.5. Method I used pc-MR VFR measurements at the openings for which these could be measured, and 1D model pressure waveforms at every remaining interface. For aneurysm-1 and 5 measurements were available at all vessel openings but one. Method II used VFR and pressure waveforms from the 1D circulation model. Method III used the typical waveforms derived using the 1D model, where VFR curves where scaled to obtain a mean WSS of 1.5 Pa at inlets. For all velocity-based BCs a flat velocity profile was applied, in line with the recent findings of Marzo et al [Marzo et al 2009]. Arterial walls were assumed to be rigid. The validity of this assumption has been extensively tested in the context of intracranial aneurysms by other authors [Dempere-Marco et al 2006]. Tetrahedral elements were used to discretize the core of the computational domain, with 3 layers of prismatic elements at the wall to ensure accurate computation of the velocity gradients. Grid sizes with an average density of 2000 el/mm3 were used as a result of a mesh dependency study in which WSS, pressure and velocity values, were monitored at several points within aneurysm and parent vessel. Figure-4.13 shows the meshes and BC types used in the analyses. Three cardiac cycles were computed for each analysis and haemodynamic data were extracted from the last cardiac cycle, herein assumed to be independent from the initial numerical conditions. Analyses were run in parallel using 30 cluster nodes Xeon® 2.8 GHz 2GB RAM. The average time required to solve a complete 3-cycle analysis was approximately 5 hrs. Statistical analysis: Quantitative agreement between data obtained with the different BC methodologies was analyzed using boxplot diagrams.

127
4.3.3 Results Relevant haemodynamic variables were compared qualitatively and quantitatively for the BC methods analyzed. For the qualitative comparison I considered values of WSS time-averaged along the cardiac cycle (tavWSS) and OSI. The qualitative analysis of the results also included a comparison of the normalized values of tavWSS (ntavWSS), where normalization was done by dividing the absolute values of tavWSS to the spatial average of tavWSS at the aneurismal wall. 4.3.3.1 Qualitative comparison Figure-4.14 shows contour distributions of tavWSS at the wall of the IAs considered. For all methods, areas of relatively high WSS concentrate around the aneurysmal neck and apex, for aneurysms 1, 2, whilst for aneurysms 5 an area of relatively higher WSS is also present at the body. In aneurysms 3 and 4 only the neck is affected by high WSS, leaving the remaining part of the aneurysmal wall exposed to lower values of WSS. For all aneurysms, areas of relatively low WSS concentrated around their bodies. From a visual comparison of the contour plots, the most pronounced differences between method I (pc-MR) and method II (1D-model) are in the distribution of tavWSS for aneurysms 1, 3, and 5 whereas aneurysms 2 and 4 showed closer agreement. As an effect of the quantitative differences between patient-specific and 1D model waveforms, for all IAs except 2, tavWSS values were underestimated when 1D-model BCs were applied.

Figure- 4.14: Contour plots of tavWSS for method I (pc-MR), method II (1D-model), and method III (WSS-scaled).
Method I
1
2
3
4
5
Method II Method III
6

129
Figure-4.15: Contour plots of normalized values of tavWSS (ntavWSS) for method I (pc-MR), method II (1D-model), and method III (WSS-scaled).
The qualitative comparison between method I (pc-MR) and method III (WSS-scaled) showed larger discrepancies than those observed when comparing method I and II, except from aneurysm 1 where contour values of tavWSS are closer to the method I predictions. Values of tavWSS
Method I Method II Method III
1
2
3
4
5
6

130
obtained with method III are for all IAs smaller than those observed in method I. Figure-4.15 shows contours of normalized values of tavWSS (ntavWSS). Interestingly, the overall distribution of areas of proportionally higher, or lower, WSS is quantitatively similar for all methods.
Figure-4.16: Contour plots of OSI for method I (pc-MR), method II (1D-model), and method III (WSS-scaled).
Method I
1
2
3
4
5
Method II Method III
6

131
Figure-4.16 shows contour distributions of OSI on the surface of the aneurysms. Although some small differences can be observed, the OSI patterns are very similar, with areas of higher values occupying the same locations for all methods employed. As expected, areas of elevated OSI tend to concentrate where tavWSS is low. OSI values obtained with method II look closer to the pc-MR-based values, than those obtained using method III. 4.3.3.2 Quantitative comparison For some selected indices computed within the aneurismal sac, namely maximum OSI (mOSI), normalized maximum value of time-average WSS (nmtavWSS), maximum time-average WSS (mtavWSS), maximum time-average velocity (mtavU) and spatial and time-average velocity (stavU), Figure-4.17 reports the boxplots diagrams of the percentage differences between method I and method II (top boxplot) and method I and method III (bottom boxplot). Percentage error was calculated as equal to (index_valuemethodI-index_valuemethodX) 100/index_ valuemethodI. As previously observed in the qualitative comparison, both quantitative comparisons show that the smallest discrepancies are observed in the values of mOSI and nmtavWSS (median value 17.5-23.5% for mOSI and 11-20.5% for nmtavWSS). On the other hand, the haemodynamic index showing highest discrepancies is mtavWSS with median values of 46% for method I vs. II and 69% for method I vs. III. When considering the cross-comparison of the methods II (1D-model) and III (WSS-scaled) with method I (pc-MR), herein assumed as gold standard, the larger discrepancies are observed for the comparison between methods III and I. If I consider only the median values of each index we observe that all indexes in method I perform better than their counterpart in method III.

Figure-4.17: Boxplots showing the distribution percentage differences between methods I and II (top) and method I and III (bottom). Asterisks denote outliers above or below 1.5 times the inter quartile range.

133
4.3.4 Discussion The creation of a computational model for the prediction of haemodynamics in IAs requires assumptions that can adversely affect the numerical results. One of the most important areas where assumptions are frequently required is the application of BCs. Several authors have demonstrated the major influence of BCs on computed haemodynamic indices [Hassan et al 2004, Chatziprodromou et al 2003, Rayz et al 2008, Venugopal et al 200]. Depending on their method of derivation, BCs can be broadly divided into two categories: patient-specific and non-patient-specific BCs. 4.3.4.1 Patient-specific BC: Patient-specific-BCs are deservedly considered as ‘gold-standard’ [Hassan et al 2004, Chatziprodromou et al 2003, Venugopal et al 2007]. Unfortunately, these are rarely available. Of the 24 articles on CFD in IAs reviewed for this study (Table-4.7), only six (25%) used patient-specific BCs [Jou et al 2003, Hassan et al 2004, Jou et al 2005, Boussel et al 2008, Rayz et al 2008, Rayz et al 2008b]. In these studies, pc-MR remained the most common modality (5 out of 6) for obtaining patient-specific measurements, while TCD was used by one author [Hassan 2004]. Most authors (5 out of 6) applied these measurements only at inlets. Jou and colleagues [Jou et al 2005] was the only group to use patient-specific pc-MR measurements both at inlets and outlet for analyzing a basilar artery fusiform aneurysm. Thus, even when patient-specific measurements can be justified in a busy clinical setting, technical difficulties may compromise their application at all openings, further limiting their use in establishing statistical correlations with rupture. In fact, a major constraint when adopting patient-specific BCs is that due to current restrictions in obtaining these measurements, they have not been applied in large cohort studies, thus compromising the possibility of using CFD to find significant statistical correlations between haemodynamics and aneurysmal evolution (initiation, growth and rupture). In the current review, the mean cohort size in the patient-specific group was significantly smaller, i.e. 3 (range 1-7) [Boussel et al 2008, Castro et al 2006, Castro et al 2006b, Castro et al 2006c, Cebral et al 2005, Cebral et al 2009, Chatziprodromou et al 2003, Dempere-Marco et al. 2006, Hassan et al 2004, Jou et al 2003, Jou et al 2003, Karmonik et al, Mantha et al 2006, Marzo et al 2009, Mitsos et al 2008, Radaelii et al 2008, Rayz et al 2008, Rayz et al 2008b, Shimogonya et al 2009, Steinman et al 2003, Venugopal et al 2007] as compared to 9.5 (range 1-62) where non-patient-specific BCs were used [Shojima et al

134
2004, Cebral et al 2005, Shojima et al 2005, Jou et al 2008]. There is another important aspect one has to consider. There may be significant diurnal variations in a person’s day-to-day life associated with stress or anxiety [Ford et al 2008, Kulikov et al 2005] physical exertion [Gonzalez-Alonso 2004, Ide and Secher 2000] and other day-to-day activities [Hajjar et al 2007]. It can be argued that patient-specific BCs, invariably measured with a patient lying quietly in a scanner surrounded by an artificial environment or stressed by the overall clinical experience (e.g. white-coat hypertension), might not represent the normal day-to-day physiology for that individual, and therefore might not represent exactly the type of BCs I need for our statistical associations. Gonzalez-Alonso et al [Gonzalez-Alonso 2004] recorded population-average flow rate variation as high as 1 ml/s at middle cerebral artery level between a rest and exercise status.

135
Table-4.6: Time-average volumetric flow-rates and inlet radii for the 6 aneurysms in study Qav-MR(ml/s) Qav-1D(ml/s) Qav-wss (ml/s) rpt(mm) r1D(mm)*
Aneu-1 7.53 3.95 4.31 2.3 2.1-2.6
Aneu-2 1.46 1.90 0.74 1.3 1.4-1.5
Aneu-3 6.36 3.94 3.11 2.1 2.1-2.6
Aneu-4 2.00 1.91 0.42 1.1 1.4-1.5
Aneu-5 5.44 3.95 2.21 1.9 2.1-2.6
NB: Aneu; aneurysm, Pt.; patient, Qav-MR; average flow measured using pc-MR, Qav-1D; average flow predicted by 1D-model, Qav-WSS; average flow predicted by 1D-model scaled to obtain WSS=1.5 Pa at boundary, rpt; radius of the vessel as measured in the patient, r1D; average radius of the vessel used in 1D-model, * min and max radii in 1D model vessel where BCs was originated
4.3.4.2 Non patient-specific BC: In absence of patient-specific-BCs many investigators use typical or modeled BCs. Out of 24 authors in the current review 18 (75%) [Steinman et al 2003, Boussel et al 2008, Castro et al 2006b, Castro et al 2006c,
Castro et al 2006d, Cebral 2005a, Cebral 2009, Chatziprodromou et al 2003, Hassan et al 2004, Jou et al 2003, Jou et al 2005, Karmonik et al 2006, Mantha et al 2006, Marzo et al 2009, Mitsos et al 2008, Radaelli et al 2008, Rayz et al 2008, Rayz et al 2008b, Shimogonya 2009, Venugopal et al 2007] used this approach, reflecting their common usage. Non-patient-specific waveforms are usually obtained from population-averaged
0
5
10
15
0.0 0.2 0.4 0.6 0.8
Q [m
l/s]
time [s]
Lt ICA before ophthalmic
Typical healthy
pc-MR patient A
pc-MR patient B
pc-MR patient C
Figure-4.18: VFR waveforms for a typical healthy individual and aneurysm patients included in this study, measured using pc-MR at internal carotid level. Typical waveform was taken from Radaelli et al 2008.

136
measurements taken on healthy volunteers [Ford et al 2008, Chatziprodromou et al 2003]. While the use of such waveforms remains the most popular method of BC application (17 out of 18 non-patient-specific BCs in my review) [Shojima et al. 2004, Cebral et al 2005, Steinman et al 2003, Shojima et al. 2003, Jou et al 2008, Radaelli et al 2008, Chatziprodromou et al 2003, Cebral et al 2005, Karmonik et al 2006, Castro et al 2006, Castro et al 2006b, Castro et al 2006c, Cebral et al 2009, Mantha et al 2006, Mitsos et al 2008, Shimogonya 2009] they carry important limitations. First, as these measurements are taken in a healthy population, they may well differ from patient waveforms. This difference is apparent in Figure-4.18, where waveforms from a healthy volunteer show differences both in shape and values, when compared with those for patients 1,3, and 5. Second, these waveforms represent average values of pressure and velocity across the population, and lack adaptability in terms of location and vessel geometrical properties. In an attempt to address these issues and make these typical waveforms more patient-specific, Cebral and colleagues in 2008 [Cebral et al 2008] suggested ‘scaling’ the inflow rates to the inflow boundary area to keep the WSS within a ‘physiological’ range (around 1.5 Pa). The same approach has been adopted by other scientists [Jou et al 2008, Radaelli et al 2008, Mitsos et al 2008]. Although Cebral and co-workers [Cebral et al 2008] found an important flow-area correlation based on experimental evidence at some specific vessel locations, their approach is very sensitive to the boundary location along the vessel, due to diameter variations along the vessel, and to segmentation error and image modality. More importantly, Cebral’s work is based on an important assumption derived from Murray’s law, which states that WSS should be constant across the branches of the vascular tree in order to minimize the energy used to drive blood flow. This hypothesis may be true for a typical healthy individual but, as reported by many authors in the field, it is mostly atypical variations in haemodynamics (e.g. WSS) that are believed to influence the aetiopathogenesis of IAs [Sekhar and Heros 1981, Shojima et al. 2004, Cebral et al 2005, Cheng et al 2007] challenged this hypothesis in their recent review, which showed large variations of average WSS (variation range: 0.2-1.6 Pa). Atypical values of WSS have been associated with other conditions such as maladaptive growth, congenital malformations, patent ductus arteriosus, and atherosclerosis [Cheng et al 2007]. Quarteroni and collaborators [Quarteroni et al 2004] pioneered the concept of using lumped and 1D-circulation-models in a quest to provide realistic BCs to 3D circulation models [Formaggia et al 2001, Lagana et al 2002].

137
More recently in 2009, Marzo and colleagues [Marzo et al 2009] introduced the use of a 1D-circulation-model to derive BCs while studying haemodynamics within IAs. This is the same model used in the current study. The parameters of the 1D model used in the current study are relative to a healthy typical individual, an approach exposed to the limitations mentioned above for typical “healthy” waveforms. Indeed, this might explain in part the discrepancies observed in the quantitative comparisons. The use of a 1D model, however, as opposed to other methods allows flexibility in the locations of the model boundaries and, more importantly, has the potential of being adaptable to the patient specific parameters, when available, to obtain more representative values at the boundaries. The comparison in Figure-4.17 (top) shows important differences between 1D-model and pc-MR data ranging from a minimum median value of 11% (OSI) to a maximum of 46% (mtavWSS). These discrepancies, however, are determined by differences in flow rates between the 1D model and patient specific waveforms, which are of the same order of magnitude of the physiological variations reported by Gonzalez-Alonso et al [Gonzalez-Alonso et al 2004], see Table-4.6. As reported in the results session, differences among the different methods analyzed are only quantitative, while the distribution of WSS remains the same as shown by the comparison on the normalized data. This confirms once again the major role played by geometry in determining the haemodynamic development within the aneurysm [Cebral et al 2005, Marzo et al 2009]. For all methods scrutinized, the comparisons performed on the OSI values showed good agreement. This is in line with the fact the OSI in its definition uses the normalization of local WSS.

Table-4.7: A comprehensive review of the methods adapted by different authors while applying BCs No Author/ Year Cohort
size (IAs) IA location (s) BC type/ location BC source (method)
1 Steinman et al 2003 1 Terminal ICA Inlet/ ICA Healthy Subjects (pc-‐MR) Outlets/ MCA, ACA Traction-‐free
2 Chatziprodromou et al, 2003 2 Supraclinoid ICA Inlets/ ICA Healthy Subjects
Outlets/ ICA Traction-‐free
3 Jou et al, 2003 1 BA – Fusiform Inlets/ VA Patient-‐Specific (pc-‐MR) Outlet/ BA Patient-‐Specific (pc-‐MR)
4 Hassan et al, 2004 1 Vertebro-‐Basilar Inlet/ VA Patient-‐Specific (TCD) Outlet/ BA Traction-‐free
5 Shojima et al, 2004 20 MCA Inlets/ MCA-‐M1 Healthy Subjects (TCD) Outlets/ MCA-‐M2 Traction-‐free
6 Cebral et al, 2005 62 ICA(22), MCA(14), Pcom(13), ACA(1), Post(9), (3 NA)
Inlets/ ICA, MCA, ACA, BA Healthy Subjects (pc-‐MR) Outlets/ NA NA
7 Jou et al, 2005 2 BA (fusiform) Inlets/ VA Patient-‐Specific (pc-‐MR) Outlets/ PCA NA
8 Shojima et al, 2005 29 ICA (14), MCA (14), MCA (1) Inlets/ ICA Healthy Subjects (TCD) Outlets/ ICA, MCA Traction-‐free
9 Cebral et al, 2005 4 ICA (1), SCA (1), ICA (1), Pcom (1)
Inlets/ NA Healthy Subjects (pc-‐MR) Outlets/ NA Traction-‐free
10 Karmonik et al, 2006 3 BA top Inlets/ BA, VA Healthy Subjects, (pc-‐
MR/ TCD) Outlet NA
11 Castro et al, 2006 4 Pcom (1), Acom (1), MCA (2) Inlets Healthy Subjects (pc-‐MR) Outlets/ NA Traction-‐free
12 Castro et al, 2006 7 Acom (1), BA (1), ICA (2), MCA (1), SCA (1), PCA (1)
Inlets/ NA Healthy Subjects (pc-‐MR) Outlets/ NA Traction-‐free
13 Castro et al, 2006 2 Acom Inlets/ ICA Healthy Subjects (pc-‐MR) Outlets/ NA Traction-‐free
14 Mantha et al, 2006 3 ICA Inlets/ NA Healthy Subjects (Scaled) Outlets/ NA NA
15 Venugopal et al, 2007 1 Acom Inlet/ A1 Healthy Subjects (Scaled)
Outlet/ A2 Traction-‐free
16 Boussel et al, 2008 7 BA(3), ICA(3), MCA(3) Inlets/ NA Patient-‐Specific (pc-‐MR) Outlets/ NA NA
17 Mitosos et al, 2008 1 Acom Inlet/ NA Healthy Subjects (LDV) Outlet/ NA Traction-‐free
18 Rayz et al, 2008 4 BA Inlets/ VA Patient Specific (pc-‐MR) Outlets/ PCA Traction-‐free
19 Radaelli et al, 2008 1 ICA Inlet/ ICA-‐proximal Healthy Subjects (Scaled) Outlet/ ICA-‐distal Traction-‐free
20 Rayz et al, 2008 3 BA Inlet/ VA Patient-‐Specific (pc-‐MR) Outlet/ PCA Likely traction free
21 Shimogonya et al, 2008 1 ICA
Inlet/ ICA-‐proximal Healthy Subjects waveforms
Outlet/ ICA-‐distal Traction-‐free
22 Jou et al, 2008 26 ICA-‐clinoidal Inlets/ ICA Healthy Subjects (Scaled) Outlet/ NA NA
23 Marzo et al, 2009 3 BA, ICA Inlet/ BA, ICA-‐proximal Computed (1-‐D Model) Outlet/ BA, ICA-‐distal Traction free
24 Cebral et al, 2009 1 BA top Inlet/ Mid BA Healthy Subjects (Scaled) Outlets/ PCA Traction-‐free
NB: BCs; boundary conditions, PC-‐MR; phase contrast magnetic resonance angiography, TCD; trans-‐cranial Doppler’s ultrasound, LDV; laser Doppler Velocimetery, ICA; internal carotid artery, ACA; anterior cerebral artery, Acom; anterior communicating artery, MCA; middle cerebral artery, Pcom; posterior communicating artery, SCA; superior cerebellar artery, BA; basilar artery; VA; vertebral artery, Post; posterior circulation
The current study will benefit from a larger cohort size (5 aneurysm only in current study), although this is bound to the difficulties experienced while performing pc-MR measurements in a clinical environment, and from a wider range of aneurysm locations, for example aneurysm of the anterior communicating artery (AComA) or basilar artery, which were not available for this study.

139
4.3.5 Conclusions Significant differences were found between results obtained with patient-specific and modeled BCs. These are largely attributable to the underlying differences in the waveforms (similar peak but higher mean flow was observed in the measured values). It is most likely that in future patient-specific BCs will be provided as a part of the routine clinical procedure. Before that, CFD has to affirm itself in finding statistical correlations using non-patient-specific-BCs. The results of this study show that the 1D circulation model adopted by @neurIST performs better than other approaches found in the literature and offers a viable means to find correlation with rupture in large cohort size studies. 4.4: Overall Conclusions form this Section In the study on the validation of different concepts used in CFD, I demonstrated that there is no added advantage of complex Womersley-‐flow-‐profile over the much simpler plug-‐flow profile. The second study in this section on Modeled vs. Patient-Specific Boundary Conditions it I found that there are significant differences in the results obtained with these two methods. These are largely attributable to the underlying differences in the waveforms (similar peak but higher mean flow was observed in the measured values). It is most likely that in future patient-specific BCs will be provided as a part of the routine clinical procedure. The results of this study show that the 1D circulation model adopted by @neurIST performs better than other approaches found in the literature and offers a viable means to find correlation with rupture in large cohort size studies.

140
OVERVIEW 5.1. Introduction 5.2 The role of computational fluid dynamics in the management of unruptured intracranial aneurysms: a clinicians’ view 5.2.1 Background and Objectives 5.2.2 Materials and Methods 5.2.3 Results 5.2.4 Discussion 5.2.5 Conclusions 5.3 Appendix-1 *My contribution: In the study described in this chapter, I played a major role in concept, study design, conducting review of literature, conducting workshops for exposure of the tools, collecting feedback, performing analyses, performing statistical calculations, writing and submission of manuscripts to journals for publications. Dr Alberto Marzo, Dr Alessandro Chiarini and Dr Keith McCormack gave important support and contribution in conducting workshops at different venues. *Declarations: Whereas, as mentioned below, a total of six evaluations of the software @neuFuse were performed at different international locations by conducting the workshops, due to unavailability of the data only the first workshop conducted during the meeting of ESMINT (European Society of Minimally invasive Neurological Therapy), in Lisbon, Portugal, is included in this chapter. 5.1. Introduction The tool-chain @neuFuse was developed under Project @neurIST by teams of computer and biomedical scientists working across a number of centers as described in Chapter 3 - Materials and Methods. The development of the tool-chain was a process of trial and error where the perfect final product could only be achieved due to continuous improvements made hand in hand while it was still under development.
CHAPTER 5.0: EVALUATIONS AND CONTROLLED EXPOSURES OF @NEUFUSE TOOL-CHAIN

141
Due to the importance of haemodynamics in the aetiopathogenesis of intracranial aneurysms (IAs), mathematicians and engineers are increasingly using computational fluid dynamics (CFD) for haemodynamic predictions. However, whilst engineers and computer scientists devote their efforts towards the development and validation of these computational tools, it is imperative to collect the opinion of the clinical and other scientific community and evaluate their experience with the software. 5.1.1 Methods in general: The evaluation of these tools was done by conducing six hands-on workshops on CFD analysis. The workshops are designed by keeping in mind a wide range of audience including clinicians (Neurosurgeons/ Neuroradiologists/ Neurologists/ Nursing etc.), Biomedical Engineers, Computer Scientists, Software Programmers, Epidemiologists, CFD scientists and Residents still in training. The workshops were typically of 75 minutes consisting of an initial overview of the IAs and their current management followed by explanation of basic concept of CFD and role of haemodynamic and morphological indices in the aetiopathogenesis of these lesions. The participants were then presented with a clinical vignette treated using the current management protocols. They were then asked to perform the CFD analysis on the IA of the same patient using a printed ‘Ready Reckoner’ and see the results at
Figure-‐5.1: Snapshot of a Questionnaire used to gather Feedback

142
the end. The case was reappraised again in the light of available CFD results at the end of CFD analysis. The management was then discussed with participants in the form of an open question that if they had offered a different treatment to the patient if they would have these results beforehand? A Preformed Questionnaire (Figure-5.1, also given as an Appendix at the end of this chapter) was used to gather feedback on all these issues as well as about the different aspects of software @neuFuse. The data was analysed later and which was used to improve the on-going development of the software. A total of six evaluations of this type were performed at different international locations. The first planned exposure of this series, conducted during the meeting of ESMINT (European Society of Minimally invasive Neurological Therapy), in Lisbon, Portugal, is described below in detail in this chapter. The findings of this exposure have been published in the form of a peer-reviewed paper the journal Computational Intelligence and Neuroscience: [Singh et al 2009] 5.2 The role of computational fluid dynamics in the management of unruptured intracranial aneurysms: a clinicians’ view 5.2.1 Background and Objectives The management of unruptured cerebral aneurysms remains one of the most controversial topics in neurosurgery. These uncertainties are multi-factorial owing mainly to incomplete natural history of these lesions and risks associated with active management [Juvela et al 2004, Raaymakers et al 1998, ISUIA 1998, Wiebers et al 2003]. Recent evidence, however, suggests a good correlation between different haemodynamic factors and aetiopathogenesis of intracranial aneurysms [Burleson et al 1996, Gao et al 2008, Morimoto et al 2002, Byrne et al 1998]. This, together with the fact that current technologies do not allow detailed in-vivo measurements of blood flow [Shojima et al 2004, Steinman et al 2003] in cerebral arteries have given computational fluid dynamics (CFD) new strength and a chance to affirm itself as a technology that can help in the management of unruptured intracranial aneurysms. Many studies have been published where patient-specific medical images and CFD are used to predict relevant haemodynamic variables that correlate well with initiation, growth, and rupture of an IA [Boussel et al 2008, Cebral et al 2005, Cebral et al 2005, Castro et al 2006, Steinman et al 2003, Shojima et al 2004, Mantha et al 2006]. Until recently, engineers, physicists or mathematicians performed these works in collaboration with select clinicians. However, in order to make an impact on clinical practice and to enhance trust among clinicians, a controlled and extensive exposure of the software and its

143
concepts to the broader clinical community is crucial along with its continuing validations. The current study is the first effort of its kind where the concept and application of CFD software was exposed to the clinical community, followed by analysis of their views, understanding and performance. 5.2.2 Materials and Methods The first gathering of the ESMINT (European Society of Minimally Invasive Neurological Therapy) Teaching Course on intracranial aneurysms was chosen as an ideal opportunity to expose the computational tools being developed within the European project @neurIST (@neurIST), to the attention of its audience. The workshop was held near the birthplace of angiography at the “Edificio Egas Moniz” of the Hospital Santa Maria in Lisbon, Portugal between 6th and 12th September 2008. 5.2.2.1 Participants’ Demography and Overview The workshop was attended mainly by neurosurgeons and neuroradiologists. Out of all participants 86% had a clinical, 8% and engineering, and 6% a scientific background. Participants broadly fell into four age groups: 20-30 yrs. old (3 participants, 8%), 31-40 (22, 61%), 41-50 (9, 25%), 50+ (2, 6%). Participants were prevalently male with a ratio M: F = 8:1. These data are summarized in Figure-5.2.
Figure -‐5.2: Participants’ demographic constitution

144
Participants were subdivided into groups of about 8 individuals per session to maximize teacher-to-attendee ratio. Two tutors were available during each session, one with a clinical background, (neurosurgeon= Pankaj Singh, the author) and one with an engineering background (biomedical engineer= Alberto Marzo). Teaching was delivered via a lecture of 75 minutes, which included a discussion of the clinical background and relevance of haemodynamic factors in aetiopathogenesis of IAs, a brief introduction on the use of CFD in haemodynamic predictions, and explanation of key fluid dynamics concepts in this context e.g. wall shear stress (WSS), boundary conditions etc. This was followed by a supervised hands-on experience with the software.
The exercise was presented to the audience via a clinical vignette of a typical difficult scenario encountered in the clinic, represented in Figure-5.3. The vignette illustrates a typical case of an incidentally discovered IA in an anxious young patient. Due to its size (5 mm maximum diameter) and absence of any other major known risk factors, the aneurysm should be managed conservatively as per ISUIA (International Studies for Unruptured Intracranial Aneurysms) guidelines [ISUIA-1998, Wiebers et al 2003]. However due to patient’s concerns and insistence for active intervention the management plan becomes controversial.
Figure 5.3: Clinical Vignette: typical challenging case scenario

145
The participants were then asked to use the software @neuFuse to extract additional and non-observable haemodynamic data from the 3 dimensional rotational angiographic (3DRA) image of this case. Attendees performed the tasks independently with the help of a ready-reckoner containing the complete guided procedure with illustrations to facilitate the exercise. One-to-one support and supervision was provided during each session, as required. 5.2.2.2 Image Acquisition and Processing The medical image used in the workshop was obtained using rotational acquisition in a Philips® Integris™ Allura™ machine (Philips® Medical Systems, Best, The Netherlands), producing 100 images in 6 seconds, with 5ms exposure per image. Voxel size in the reconstructed 3D images was 234 microns with reconstruction matrix 256x256x256. Images were anonymized, respecting the @neurIST ethical approval for use of patient data. The characteristics of the aneurysm considered in this study are reported in Table-5.1. The current version of the @neuFuse software (prototype 4), based on the Multimod Application Framework [Viceconti et al. 2004] and developed within the @neurIST project, was used to reconstruct the vessel surfaces, create the model and set up the haemodynamic analysis. The solvers used within @neuFuse to solve the fundamental equations describing the blood flow behavior within the region of interest were ANSYS®-ICEM™ and ANSYS®-CFX™ (Ansys®, Inc., Canonsburg, PA, USA). For the purpose of the workshop a simple stationary analysis (non-pulsatile but constant flow rate and pressure at the openings of the region of interest) was performed by the participants using Intel® core duo 2.4 GHz machines, with 2 GB RAM and 512 MB of dedicated graphic memory. 5.2.2.3 CFD Analysis Figure 5.4 shows the overall workflow of the operations performed from uploading the raw medical image to the software through the visualization of relevant haemodynamic data in @neuFuse.
Table-‐5.1: Aneurysm Radiological Characteristics Localisation: Carotid artery/
ophthalmic segment/ medial wall
Side: Left Dome status: Unruptured Depth: 4.2 mm Max diameter: 5 mm Max neck width: 3.7 mm Type: Side-‐wall, saccular Aspect: Smooth

146
Any CFD analysis requires knowledge of the volumetric region traversed by the fluid (i.e. aneurysm including connected surrounding vasculature) plus information about velocity and pressure of the fluid at the boundaries of the chosen region of interest (boundary conditions). Participants were asked to reconstruct the region of interest starting from the medical image, and specify the boundary conditions using the software @neuFuse. The first step was to launch @neuFuse and import the medical image (Figure 5.4A). The geometry of the vessel, including the IA, was then extracted from the imported image (Figure-5.4B). As only a sub-region of the extracted vasculature around the aneurysm has influence on the haemodynamic computation, all vessels entering or leaving the IA were identified and cropped at desired locations to define the region of interest (ROI). The ascending carotid artery, which was an inlet (blood enters the domain through it), was cropped at ten vessel diameters proximal to the IA as shown in Figure-5.4C. The distal carotid artery in the region of cavernous sinus and the ophthalmic artery were identified as the two outlets of ROI (blood exits the domain through these two vessels). These are shown in Figure-5.4C. For the sake of simplicity and time constrains the mesh used in the analysis was coarse and was constructed using simple tetrahedral elements. As is often the case in real-life clinical situations,
Figure 5.4: Operation workflow from medical image to haemodynamic results. A) Orthoslice visualization of the 3DRA medical image in @neuFuse. B) Visualization of the extracted vessel surface. C) Visualization of reduced region of interest with location of inlet and outlet openings. D) 1D circulation model. E) Visualization of predicted streamlines. F) Visualization of predicted wall shear stress.

147
information on pressure or velocity of the blood at these locations for the patient under examination was not available. Boundary conditions were therefore provided by using a 1D mathematical model of the systemic tree, which has been developed within @neurIST [Reymond et al 2008]. A representation of the @neurIST 1D circulation model is depicted in Figure 3D. This model provides values of pressure and flow of blood at several locations along the systemic arterial tree, including locations in the circle of Willis for a typical individual. Plug-flow BCs were applied at inlet and pressure BC at outlet, using average values from the waveforms provided by the 1D circulation model. Typical values of blood viscosity (μ=0.004 Pa.s) and density (ρ=1066 kg/m3) were applied to define the blood properties. Although the blood is a non-Newtonian fluid for the sake of simplicity and time-constraints, and also in view of recent findings from Cebral et al [Cebral et al 2005], I decided to assume constant blood viscosity. Whilst arterial walls move under the effect of the propagating pressure waves, it has been shown that the effects of this movement on haemodynamic predictions are negligible [Jeays et al 2007]. Fixed walls were thus considered in this analysis. The computation was automatically performed by the software and participants were asked to display different predicted haemodynamic variables like flow streamlines (Figure-5.4E), pressure distribution within the aneurysm or arterial wall, and WSS (Figure-5.4F). Participants were then asked to compare the WSS values computed within the aneurysm with the critical values found in the experimental studies of Malek et al [Malek et al 1996] below which the endothelium is affected by cell loss, desquamation and deranged activity of wall-growth regulators. 5.2.2.4 Evaluation Finally, the feedback was collected via a questionnaire consisting of 48 questions. These were broadly divided into 6 categories (Table-5.2); general feedback, course design and conduct, experience with the software, haemodynamics understanding, impact of CFD in neurosurgery, and bringing this software into routine use. Each section of the questionnaire was carefully designed to collect information on different aspects of the participant experience as described in Table-5.2. The questionnaire with the complete list of questions is reported in Appendix-1 at the end of this chapter. Performance of participants was measured by analyzing the file containing an audit trail of the operations performed during the analysis. The performance criteria were based on the analysis settings that have major

148
influence on the outcome of the numerical predictions: The quality of the reconstructed geometry, its extension, the locations in the 1D circulation model from which boundary conditions were extracted, and the correctness of the applied boundary condition type (i.e. whether it was correctly set to inlet or outlet). Each correct operation was assigned one point, leading to a maximum score of four. Expert performance was considered as gold standard (4 out of 4) and participants’ performance rate was compared against this, 5.2.3 Results For each section of the questionnaire only data gathered for the most representative questions were reported in this manuscript. Results were represented using tables with percentage distribution for a ready appreciation of feedback across the participants. These are reported section by section below.
Table-‐5.2: Questionnaire sections and objectives Section Category Objectives
1 General feedback To gather impressions on the overall experience
2 Course design and conduct
To gather suggestions on possible improvements and identify any shortcomings in the design of the workshop
3 Experience with the software
To identify weak points as perceived by clinicians in the graphical user interface of the current version of the software
4 Haemodynamics understanding
To assess their current knowledge and understanding in the role of haemodynamics in the aetiopathogenesis of intracranial aneurysms
5 Impact of CFD in neurosurgery
To assess their faith in the principles of CFD and its use in the clinical environment, along with the need of validation through a multicentre trial
6 Bringing this software into routine use
To explore the participants view on cost related issues and gather information on future marketing potentials of this kind of software

149
Section 1: General feedback: As shown in Table-5.3, the overall feedback about the workshop was positive. The 86 % of participants would recommend the software to a colleague, 75 % found the workshop useful and 78% rated their overall experience between good and very good. Negative feedback was confined averagely within less than 5%. Most participants recognized the need to improve management of IAs and for 47% this was the main reason for attending the workshop.
Table-‐5.3: General feedback Question/Answer options
No of participants (%) Would you recommend the software to a colleague?
Yes 31 (86) No 3 (8) n.a. 2 (6)
Why did you decide to participate to this workshop?
Working in the field 16 (45) Interested in CFD 2 (6) Improve management of aneurysms 17 (47) Other 1 (2)
How useful did you find this workshop? Not useful 1 (3) Not sure 8 (22) Useful 16 (45) Very useful 11 (30)
Rate your overall experience Poor 1 (3) Average 7 (19) Good 15 (42) Very good 13 (36)

150
Section 2: Course design and conduct: 80% of candidates found the workshop to be of the right duration, 14% found it to be too short while for 6% it was too long (Table 5.4). Participants-to-instructor ratio was right for 91% while 6% thought that there were too many participants. Most of the participants did not have any difficulty in understanding the instructions. On a scale of 1 to 5, where 1 is not clear and 5 is very clear, 86% rated it 4-5, while 14% were not sure. 94% of the participants thought that the course content was scientifically appropriate.
Table-‐5.4: Course design and conduct Question/Answers No of participants (%)
Was the duration of the workshop …
Right 29 (80)
Short 5 (14) Long 2 (6)
Was the participant-‐to-‐instructor ratio…
Right 33 (91)
Too-‐many 2 (6)
n.a. 1 (3)
Were the instructions given in a clear way?
Not sure 5 (14)
Clear 18 (50)
Very clear 13 (36)
Was the content of the course scientifically appropriate?
Yes 34 (94)
No 2 (6)

151
Section 3: Experience with the Software: 34% of the candidates found the current version of the software user friendly, 11% think it needs some improvement, while 6% found it was not user-friendly (Table-5.5). The remaining 46% were unsure. 48% of the participants think that clinicians with limited IT skills will find using the software challenging, 11% disagree with this assumption and 33% were not sure. 86% of all attendees were able to complete all the steps of the haemodynamic analysis within the time allocated (approx. 50 minutes). 11% missed one or more steps. Application of boundary conditions and clipping the region of interest were amongst the most difficult steps reported by majority of participants. These were equally distributed among participants with scientific and clinical background.
Table-‐5.5: Experience with the software Question/Answers No of participants (%) Do you find the software user friendly? No 2 (6) Needs improvement 4 (11) Not sure 17 (46) User friendly 11 (31) Very user friendly 1 (3) n.a. 1 (3)
Will clinicians without tech/IT experience have trouble?
Yes 17 (48) Not sure 12 (33) No 4 (11) n.a. 3 (8)
Were you able to complete all the steps of the haemodynamic analysis?
Yes 30 (86) No 4 (11) n.a. 1 (3)

152
Section 4: Haemodynamics understanding: Whereas for 78% of the participants it was easy to understand the technical concepts used throughout the course (Table-5.6), 19% faced some difficulties in understanding the terminology, mostly related to concepts such as boundary conditions and WSS. 36% of the participants showed trust in the results predicted by the software and think they are realistic. However, 58% were unsure. 48% believe that there is good scientific evidence to justify the role of haemodynamics in the aetiopathogenesis of IAs, 3% did not agree with this. 43% of the candidates were not sure. Whereas 50% of the participants were aware of the use of CFD as a tool in the prediction of rupture in IAs, 42% were hearing the concept for the first time. Interestingly, 84% of all participants were willing to read further peer-reviewed articles published on CFD and role of haemodynamics in IAs.
Table-‐5.6: Haemodynamics understanding Question/Answers No of participants (%) Did you have difficulty with the technical concepts (boundary conditions, wall shear stress, etc.)?
Yes 7 (19) No 28 (78) n.a. 1 (3)
Are the results from this software realistic? Yes 13 (36) Not sure 21 (58) No 0 (0) n.a. 2 (6)
Is current evidence sufficient to justify a role for haemodynamics in the pathogenesis of aneurysms?
No 1 (3) Not sure 15 (43) Yes 17 (48) n.a. 2 6
Were you previously aware of the use of CFD to predict the risk of rupture in intracranial aneurysms?
No 15 (42) Yes 18 (50) n.a. 3 (8)
If you see a publication on computational predictions for IA in a peer-‐reviewed journal, will you read it?
No 3 (8) Yes 30 (84) n.a. 3 (8)

153
Section 5: Impact of CFD in neurosurgery: Responding to the question “Who should perform the CFD analysis for your patient”, 19% answered a consultant, 6% thought it should be done by a registrar or a junior member of the team (Table 5.7). 25% believed that analysis should be performed by a dedicated clinical scientist/engineer, while another 25% think that it can be done by anyone provided that they have adequate training. 84% of the participants were of the view that the software can be used as a diagnostic tool on outpatient basis, 8% did not agree with them. 84% of the participants were aware of similar software, whereas for 8% of them it was the first exposure to this kind of software. When asked about automated versus user-controlled software, interestingly 35% expressed a wish to retain user control. 26% preferred a fully automated tool, while another 26% were unsure. Although the majority of participants (88%) were convinced that there is a future for CFD as a risk prediction tool, and that there is a significant, or emerging clinical need for these kinds of innovative tools (84%), most of them (75%) thought that the current version of the software was not yet ready and would require refinement before it could be introduced into clinical practice.
Table-‐5.7: Impact of CFD in neurosurgery Question/Answers No of participants (%) Ideally, who should perform this type of computational analysis for patients?
Consultant 7 (19) Dedicated clinical scientist 9 (25) Registrar 2 (6) Anyone with training 14 (38) Office member 1 (3) All 1 (3) n.a. 2 (6)
When ready could this software be used diagnostically in an outpatient clinic?
Yes 30 (84) No 3 (8) n.a. 3 (8)
Are you aware of any similar software? Yes 30 (84) No 3 (8) n.a. 3 (8)
Should this type of analysis be fully automated, or is it better that the user has control?
Automated 10 (26) User control 14 (35) Not sure 10 (26) n.a. 5 (13) Is there a future for computational tools for risk prediction of intracranial aneurysm rupture?
Yes 29 (80) No 2 (6) Not sure 2 (6) n.a. 3 (8)
How great a clinical need is there for this software? Significant 17 (48) Emerging 13 (36) Low 3 (8) n.a.
3 (8)
Do you think that this type of analytical software is ready for introduction into the clinical environment?
Ready 4 (11) Needs work 26 (75) n.a. 5 (14)
In which cases might this software influence your decision-‐making about patient management?
All 7 (19) Small unruptured asymptomatic 14 (39) Other 2 (6) Not sure 1 (3) None 3 (8) n.a. 9 (25)
Would you be interested in participating in a multi-‐centre trial on the evaluation of this software?
Yes 25 (69) No 5 (14) n.a. 6 (17)

154
64% of the candidates believed that an early prediction of the risk of rupture computed with the help of this software could influence their decision making in the management of an IA. Out of the 64% over half (39%) think that small asymptomatic unruptured cases specially falling in the border-line category based on current evidence, are the best cases where such software can provide definitive help. Interestingly, 19% thought that it could be useful in all cases. 69% of the participants were convinced of the need for a multi-centric trial for the evaluation of the software and expressed their willingness to participate in it. Section 6: Bringing this software into routine use: Once the software is in routine use, 30% of the participants believed that it should be an integral part of the scanner (Table-5.8). 27% thought that it should be supplied as a standalone product, while 32% say it could be provided in either way. Cost will be an important deciding factor for 72% and another 81% prefer it to be a freeware or shareware. However, cost is a low priority for 17% and another 11% won’t mind paying for it.
Table-‐5.8: Bringing this software into routine use Question/Answers No of participants (%) Would you expect this software to be provided as part of a scanner, or as a stand-‐alone product?
Scanner 11 (30) Standalone 10 (27) Both 12 (32) n.a. 4 (11) Would the price of this software be an important factor in your deciding to obtain/use it?
Important 26 (72) Low priority 6 (17) n.a. 4 (11) Would you expect to pay for this software, or would you prefer a freeware/shareware arrangement?
Pay 4 (11) Shareware 14 (37) Freeware 17 (44) n.a. 3 (8)

155
Performance: Attendees totalized an average score of 63% of experts’ performance (Table-5.9). When age is taken into consideration youngest delegates in the group 20-30 yrs. scored highest (65%) with score figures reducing progressively with age. Age group 50+ obtained the lowest scores (56%). Performance was slightly higher in scientific community (2.7), as compared to the clinicians (2.5)
5.2.4 Discussion 5.2.4.1 The current challenges posed by unruptured IAs The easy availability and widespread use of relatively non-invasive and sophisticated neurodiagnostic modalities such as high resolution CT, MRI and MRA, have brought to clinical attention a large and ever increasing group of patients harboring unruptured and asymptomatic cerebral aneurysms. These unruptured lesions are also diagnosed coincidentally at the time of catheter angiography done for a ruptured aneurysm in patients having multiple aneurysms. The increasing awareness of relatively bleak prognosis related to aneurysmal rupture in general public and clinicians, forces neurosurgeons to come up with a definitive answer for these unruptured lesions. With the advancements in the microsurgical techniques and improved neuroanaesthetic and interventional neuroradiological approaches, the morbidity and mortality figures associated with the active management of the ruptured aneurysms has improved significantly when compared to their conservative management. In other words, the indications for the active interventions in ruptured intracranial aneurysms are now well established. The situation unfortunately is not as straightforward in cases of unruptured aneurysms and, the management of these lesions remains one of the most controversial topics in Neurosurgery [Juvela et al 2004, Raaymakers at al 1998, ISUIA 1998, Wiebers at al 2003]. Most of the large series including ISUIA studies agree on the low risk or rupture for unruptured intracranial aneurysms. The cumulative rupture rates in ISUIA studies were between 0.05 to <1 percent per annum [ISUIA-1998, Wiebers
Table-‐5.9: Attendees’ performance Score % Average 2.52 (63) Performance with age
20-‐30 yrs 2.58 (65) 31-‐40 yrs 2.50 (63) 41-‐50 yrs 2.36 (59) 50+ yrs 2.22 (56)
Performance with background
Clinicians 2.5 (63)
Scientists 2.7 (68)

156
et al 2003]. The fact that the prevalence of unruptured aneurysms in general population outnumbers the incidence of subarachnoid hemorrhage shows that not all unruptured intracranial aneurysms share a common natural history. The annual prevalence of unruptured aneurysms in a population is around 5% [ISUIA-1998] while the incidence of subarachnoid hemorrhage in the corresponding population is observed up to a maximum of 10 cases per 100, 000 persons per year [ISUIA-1998]. It is clear from the above-mentioned figures that 80 to 85% of all intracranial aneurysms will never rupture. The current uncertainties in the management of unruptured intracranial aneurysms are well accepted by the clinical community, and were amongst the most important motivating factors for majority of the participants (47%) to attend this workshop. In order to offer the best possible treatment to the patient with least side effects, the formulation of a clear management protocol, directed by the natural history of the unruptured intracranial aneurysms and the risks associated with the active management, is required. Whereas the endovascular coiling is increasingly being accepted as a preferred treatment modality for ruptured intracranial aneurysms, surgery has been advocated as a first line treatment for unruptured lesions [Juvela et al 2004, Wiebers at al 2003]. Although there are no strict guidelines, most of the studies [Juvela at al 2000, Komotar et al 2008, Mayberg et al 1994] including ISUIA trials (ISUIA-1998, Wiebers et al 2003], almost unanimously recommend certain factors as indications of surgery in unruptured aneurysms: large aneurysmal size, symptomatic lesions, evidence of growth, multiple lesions, posterior circulation location, and past history of SAH. All these criteria been established to have good correlation with increased risk of rupture and hence, surgery is advocated in these situations to avoid the poor outcome. It is interesting to note that whereas on the one hand the above-mentioned criteria are used to decide the need and suitability for surgery in an unruptured intracranial aneurysm, all of these factors also remain the underlying descriptors for poor surgical outcome [Solomon et al 1994, Khanna at al 1996, Wirth et al 1983]. In the light of current evidence it is clear that the group which will stand best chances of an excellent outcome after surgery will be one with solitary, very small (<5 mm), truly asymptomatic aneurysms located in the anterior circulation, without any evidence of growth. Quite the contrary, current protocols dictate clinicians not to operate upon this group [ISUIA-1998, Wiebers et al 2003, Komotar et al 2008]; and in fact contraindicate

157
any active management option in such patients [ISUIA-1998, Wiebers et al 2003, Komotar et al 2008). Moreover, the small aneurysms of <5 mm size which are traditionally thought to be ‘safe’, are not ‘rupture-proof’. In a study Yasui et al [Yasui et al 1996] found that in a group of 25-ruptured aneurysms, 16 (64%) were <5 mm in size. Similarly, Juvela and colleagues [Juvela et al 1993] who followed 142 patients with 181 aneurysms for a mean period of 13.9 years with an aneurysmal size of <4 mm, demonstrated a 19% rupture rate i.e. 27 out of 142 patients had a rupture. In order to improve the surgical outcome if we choose to operate on these smaller and ‘safe’ lesions, we have to operate on every single patient. The ideal situation, however, would be if we could identify the aneurysms at greater risk of rupture while they are still small in size and operate upon them, leaving others to be monitored expectantly. 5.2.4.2 The emerging need for new alternatives It is evident that due to limitations associated with conventional risk factors used to assess the risk of growth and rupture, it is currently impossible to identify those patients who are at an increased risk in this subset having a real need of an early surgery from those who can be monitored safely without any active intervention. The situation consequently leaves us with no options other than searching some new descriptors that can predict the risk of rupture independently in small cerebral aneurysms before they join the cohort destined for a poor surgical outcome. This is in part reflected by the large number of participants (84%, Table-5.7) who believe that there is a significant or emerging need of new alternatives. There is a rapidly growing body of literature affirming the importance of haemodynamics in the aetiopathogenesis of cerebral aneurysms [Burleson et al 1996, Gao et al 2008, Morimoto et al 2002, Byrne et al 1998]. The haemodynamic variables often considered in these studies are wall shear stress (WSS), oscillatory shear index (OSI), blood pressure and other quantities used to characterize blood flow. Proportional to blood viscosity and its velocity, WSS is the tangential frictional force exerted by the flowing blood on the walls of each vessel. High supraphysiological and low infraphysiological values of WSS have been associated with initiation, growth and rupture of aneurysms [Gao et al 2008, Fukuda et al 2000, Meng et al 2007, Shojima et al 2004, Jou et al 2008, Malek et al 1996, Ujie et al 1999, Boussel et al 2008]. A measure of the oscillatory nature of these viscous forces is given by the oscillatory shear index (OSI), often associated with endothelial cells degeneration [Mantha et al, 2006, Glor et

158
al 2004, Goubergrits et al 2008]. Table 10 below gives a comprehensive list of haemodynamic variables from the literature and their association with intracranial aneurysm evolution. An evaluation of these variables can provide a useful alternative to predict the behavior of an unruptured IA at an early stage before it changes in size, shape or becomes symptomatic. Unfortunately, the detailed in-vivo measurements of all relevant flow variables in the regions affected by the disease are currently impossible [Shojima et al 2004, Steinman et al 2003]. 5.2.4.3 Computational Fluid Dynamics: a brief overview Motivated by the important role played by haemodynamics and the difficulty of conducting detailed in-vivo observations of relevant haemodynamic variables, engineers and computer scientists have started using Computational Fluid Dynamics (CFD) to predict blood flows in intracranial aneurysms [Boussel et al 2008, Cebral et al 2005, Cebral et al 2005, Castro et al 2006, Steinman et al 2003, Shojima et al 2004, Mantha et al 2006]. Computational fluid dynamics is the science of predicting fluid flow, heat and mass transfer, chemical reactions, and related phenomena by solving numerically the set of mathematical equations that govern a particular physical system (conservation of mass, momentum, energy, species etc.) Since its early development in the 1960s and 1970s in the aerospace field, where it was mainly used to improve the design and efficiency of aircrafts [Anderson 1995], CFD has been successfully used in many other applications. In the past decades, engineers used CFD in the automotive, nautical, and civil engineering industries for conceptual studies of new designs, troubleshooting redesign, or improving the physical understanding of a novel fluid mechanical phenomenon. Supported by experimental studies and a profound theoretical knowledge of the application at hand, CFD can be applied anywhere the flow of a fluid is important. Validation, through comparisons with experimental data, has always been a key aspect in successful applications of CFD. In the context of its use in intracranial aneurysms, although some early validation work has shown promising results [Ford et al 2008, Ford et al 2005, Radaelli et al 2008, Karmonik et al 2008], a more systematic validation remains a pre-requisite before CFD can be adopted as a routine tool in clinical practice. Whereas the majority of participants (78%) did not find any difficulty in understanding the technical concepts used in CFD, only 36% of them believed that the results produced by its application were realistic. The mistrust in the results indicates the need for validation. This is further

159
supported by the fact that most of the participants (84%) readily wanted to participate in a multi-centric clinical trial. Although participants showed a manifest interest in computational predictions (Table 5.6), there is a clear lack of awareness concerning the role of haemodynamics in the aetiopathogenesis of IAs and the use of CFD in this context (42%, Table 5.6). More efforts therefore are required by the scientific community to enhance understanding of the role of haemodynamics and awareness of the use of CFD in this field. Table 5.10: The literature-‐based evidence on the importance of haemodynamics in the aetiopathogenesis of IAs Haemodynamic factors
Intracranial Aneurysm Proposed mechanism(s)
References Initiation Growth Rupture
Dynamic Wall Shear Stress (WSS)
High Low Low Increased WSS increases the production of MMP-13 which in turn leads to vessel wall damage Decreased WSS increases iNOS synthesis- NO induced damage to vessel wall Low WSS increases endothelial proliferation and apoptosis
Boussel et al 2008, Fukuda et al 2000,
Gao et al 2008, Jou et al 2008, Malek et al 1999, Meng et al 2007, Shojima et al 2004, Ujie et al 1999
Oscillatory Shear Index (OSI)
High/Low High High Degenerative changes in endothelium
Glor et al 2004, Goubergrits et al 2008, Mantha et al 2006
Jet of Blood Stream
Impingement Impingement Impingement Localized endothelial cell injury
Foutrakis et al 1999, Cebral et al 2005, Cebral et al 2009
Flow Pattern - - Complex Statistical association Cebral et al 2005, Cebral et al 2009
Hydrostatic Pressure High High High Passive yield/ water
hammer effect Inci and Spetzler 2000, Morimoto et al 2002, Steiger et al 1989
NB: WSS; wall shear stress, MMP-‐13; matrixmetalloproteneases-‐13, iNOS; inducible-‐nitric oxide synthase, NO; nitric oxide, OSI; oscillatory shear index
5.2.4.4 The concept of controlled exposure The use of CFD in this context represents a significant change in the clinical workflow and a successful transfer of knowledge will only happen via carefully planned, controlled exposure. Clinical sites must be supported locally, underpinning the training for clinicians with the involvement of clinical scientists. The effectiveness of interdisciplinary transfer of knowledge is largely dependent on the course design and the methodology used. As reflected by the results (Table-5.9), a hands-on workshop using multimedia PowerPoint presentation, one-to-one supervision, and low participants-to-instructor ratio with a carefully designed course based on sound scientific principles, can lead to good

160
results. The correct duration of such a course is also an important factor (Table 5.4). A close collaboration between engineers and the clinical community is also a pre-requisite for successful transfer of knowledge. Supervision during this workshop was hence, jointly provided by a biomedical engineer and a clinician. Given a short training period of only 75 minute, the first ever exposure of the software and its concepts to most of the participants (Table 5.6), together with the fact that the software is still in its prototype stage, the overall response and average performance of 63% was remarkable. It is anticipated that performance can be enhanced to the level of the expert-user by means of a user-friendlier version of the software and more intensive training. The results also show a decline in performance with age. It may be associated with the IT skills necessary to use this type of software efficiently. This fact should be kept in mind when interpreting the results and formulating future training and translational requirements. 5.2.4.5 Software design improvement Many valuable suggestions were collected from participants on the possible improvements in the software design and its functionalities. Among the important suggestions included automating the steps for which user intervention is not strictly necessary, improving user friendliness through a more intuitive graphical user interface (GUI) where the user is guided through the number of operations required, or use of the icons in place of the more cumbersome operation from the menu bar and, finally graphical representation of the 1D circulation model for easier application of boundary conditions. After discussing the feasibility with developers, most of these suggestions were implemented in the latest version of the software @neuFuse. 5.2.4.6 The expected place of CFD in Neurosurgery It is interesting to note that the majority of the participants (63%, Table 5.7) want these analyses to be performed either by an expert clinical scientist/engineer or a person with the same level of expertise, rather than a clinician. The fact may reflect clinicians’ reluctance to conduct the analyses themselves due to their understandable concern over time-constraints and may indicate the requirement of a dedicated team with sufficient infrastructure for the purpose. In spite of this, most of the clinicians (84%, Table 5.7) see the software as a handy tool, which can be used on an outpatient basis (e.g. ophthalmoscope, otoscope, etc.) rather than a specialist department-based facility (e.g. 3DRA, MRA etc.). On comparing the software in terms of the different properties of a diagnostic modality, which makes it an ideal outpatient tool versus those requiring a dedicated set-up, I found that this software has some important features of

161
an ideal outpatient tool. It is non-invasive and is not directly performed on the patient (patients do not have to come prepared, e.g. empty stomach). As it is totally non-invasive, there is no risk of cross-infection or contamination. Due to no associated side effects, no admission or post-operative care is necessary. Although only time will decide, in my view only a dedicated department with sufficient IT facilities and dedicated biomedical engineers can take the burden of the extensive computational time required by more realistic transient analyses and, effort to visualize and extract the haemodynamic characteristics required for clinical decision making. Whereas the current study indicates a positive response among the clinical community for CFD and its use in IAs, it will be necessary to expose the software to a larger number of clinicians before definitive conclusions can be drawn. 5.2.5 Conclusions Although participants showed a manifest interest in computational predictions, there is a clear lack of awareness concerning the role of haemodynamics in the aetiopathogenesis of IAs and the use of CFD in this context. More efforts therefore are required by the scientific community to enhance awareness and understanding of the clinicians in the subject. There is a clear willingness to use such software as an outpatient tool. The mistrust in the results indicates the need for validations, and most of the participants supported with the need of a multi-centric trial, when software is ready. Keeping in mind the very first exposure to CFD for most of the participants and the inherent difficulties associated with a developing-software, the average performance of 2.5 (63% of an expert) was remarkable. Adequate training, controlled exposure, and further development of these tools is necessary before these can be efficiently used by a common clinician.

162
5.3 Appendix-1: Questionnaire used for feedback
Edificio “Egas Moniz”, Hospital de Santa Maria Faculdate de Medicina da Universidade de Av. Professor Egas Moniz 1649-028 Lisboa, Portugal http://www.fm.ul.pt/
Workshop Evaluation -‐ @neuFuse
Personal Details
Title: First Name: Surname: Age: Degree: Job Title: Institution/Department: Background: Clinical Engineering Scientific Other: Address:
Email: Telephone:
Section 1: General Feedback
Q1. Why did you decide to participate to this workshop? Working in the field Suggestion by colleague Interested in computational haemodynamics Improve management of aneurysms Other: please specify …………………………………………….
Q2. How useful did you find this workshop? Not 1 2 3 4 5 Very
Q3. Would you recommend a friend to attend? No Yes
Q4. Would you recommend the software to a friend No Yes
Q5. Any specific shortcomings, surprises? 1. 2. 3.
Q6. Any suggestions for course improvements? No Yes, I’ve described them below …………………………………………….
Q7. Rate your overall experience… Bad 1 2 3 4 5Good
Section 2: Course Design and Conduct
Q8. Was the participant-‐to-‐instructor ratio… OK Too many students
Q9. Were the instructions given in a clear way? No 1 2 3 4 5 Very
Q10. Was the content of the course scientifically appropriate? No Yes
Q11. Do you think the instructors were helpful? No 1 2 3 4 5Very
Q12. How useful was the presentation and notes? Not 1 2 3 4 5Very
Q13. Did you have any difficulty with terminology? No Yes, I’ve described it below …………………………………………….

163
Q14. Were the IT facilities satisfactory? No 1 2 3 4 5Very
Q15. Was the duration of the workshop… Too short Just right Too long
Section 3: Experience with the Software
Q16. Do you find the software user-‐friendly? No 1 2 3 4 5 Very
Q17. Will clinicians without tech/IT experience have trouble? No Not Sure Yes
Q18. Were you able to complete all the steps of the haemodynamic analysis?
No, I missed those below Yes ……………………………..………….
Q19. Is there any obvious limitation which may prevent the use of this software in future?
No Yes, I’ve described it below …………………………………………….
Q20. Please, identify the easiest and most difficult steps in the use of @neuFuse
Easiest: ……………..……….. Most Difficult: ……………………….
Q21. What would you change/improve in the software? 1. 2. 3.
Q22. In particular, do you think that the Graphical User Interface (GUI) can be improved in any way?
No Yes, I’ve described it below ………………………………………….
Q23. Do you now feel confident in the use of this software? No 1 2 3 4 5 Very
Q24. Would you like to be kept informed about developments of this software?
No Yes
Section 4: Haemodynamic Understanding
Q25. Did you have difficulty with the technical concepts (boundary conditions, wall shear stress, etc.)?
No Yes, I’ve named them below …………………………………………….
Q26. Are the results from this software realistic? No Yes Not sure
Q27. Is current evidence sufficient to justify a role for haemodynamics in the pathogenesis of aneurysms?
No Yes Not sure
Q28. Were you previously aware of the use of CFD to predict the risk of rupture in intracranial aneurysms?
No Yes
Q29. If you see a publication on computational predictions for IA in a peer-‐reviewed journal, will you read it?
No Yes
Q30. Would you be interested in receiving high-‐quality peer-‐reviewed publications on haemodynamics in IA?
No Yes
Section 5: Impact of CFD in Neurosurgery
Q31. Ideally, who should perform this type of computational analysis for patients?
Consultant A dedicated clinical scientist/ engineer Registrar/ junior member of team Anyone provided with adequate training It should be simplified so it’s an office job Other, please specify: …………………………………………….
Q32. Could this software be used diagnostically in an outpatient clinic?
No Yes
Q33. Are you aware of any similar software? No Yes, I’ve named it below …………………………………………….
Q34. Should this type of analysis be fully automated, or is it better that the user has control?
Automate Not Sure User control
Q35. Is there a future for computational tools for risk prediction of intracranial aneurysm rupture?
No Yes Not sure
Q36. How great a clinical need is there for this software? Significant Low Emerging

164
Q37. Do you think that this type of analytical software is ready for introduction into the clinical environment?
Ready Not required Needs work
Q38. In which cases might this software influence your decision-‐making about patient management?
None All Those below… …………………………………………….
Q39. Would you be interested in participating in a multi-‐center trial on the evaluation of this software?
No Yes
Q40. Can you see any legal or ethical implications in the use of this software?
No Yes, I’ve described them below …………………………………………….
Q41. The principles employed in @neurIST are applicable to other diseases; is this important?
Important Only care about IA
Q42. More complex and informative analyses take longer to calculate; are quick results better?
Quick Complex Let me choose
Q43. @neurIST IA rupture risk assessment can use more that haemodynamic data; is this important?
Important Only need haemodynamics
Q44. @neurIST offers tools for researchers as well as clinicians; are these important?
Important Only need clinical
Section 6: Bringing this Software into Routine Use
Q45. Would you expect this software to be provided as part of a scanner, or as a stand-‐alone product?
Scanner Standalone Both
Q46. Would you expect such software to be provided by a scanner company or an independent specialist?
Scanner Co Independent
Q47. Would you expect to pay for this software, or would you prefer a freeware/shareware arrangement?
Pay Freeware Shareware
Q48. Would the price of this software be an important factor in your decision to obtain/use it?
Important Cost is a lower priority
Any other comments?
Thank-‐you for completing this Questionnaire!
.......................................................................................................................................................................................................................................................................
OFFICE USE ONLY
Instructor’s evaluation of individual’s performance

165
OVERVIEW 6.1: Introduction 6.2: Effects of Smoking and Hypertension on the Formation of IAs 6.3: Analysis of Different Haemodynamic Factors During Initiation and Rupture of an Intracranial Aneurysm and Possible Influence of Low Molecular Weight Heparin Mediated Change in the Blood Viscosity on Computed Values of These Haemodynamic Factors 6.4: The Effects of Aortic Coarctation on Cerebral Haemodynamics and its Possible Role in the Aetiopathogenesis of Intracranial Aneurysms 6.5: Conclusions *My contribution: In the studies described in this chapter, I played a major role in concept, study design, recruitment of patients, consenting them, conducting review of literature, performing analyses, performing statistical calculations, writing and submission of manuscripts to journals for publications. Dr Alberto Marzo (and other biomedical scientists, as detailed in acknowledgement section) gave important support and contribution in retrieval of medical images, performing CFD analyses, and post-processing of the results. **Declaration: In my study on The Effects of The Effects of Aortic Coarctation on Cerebral Haemodynamics and its Possible Role in the Aetiopathogenesis of Intracranial Aneurysms, apart form CoA patient, the measurements were also taken in five healthy volunteers to establish the flow-rates at different locations in the cerebral vasculature. The data form these volunteers however, could not be included in the study as unfortunately this data is not currently available. 6.1. Introduction CFD is used as a tool for exploring the different factors that can influence the aetiopathogenesis of Intracranial Aneurysms by altering their haemodynamic environments. A number of studies are conducted in this context and CFD was used to prove or refute the hypotheses.
CHAPTER 6.0: COMPUTATIONAL FLUID DYNAMICS AS A TOOL TO EXPLORE THE AETIPATHOGENESIS OF INTRACRANIAL ANEURYSMS

166
The first study in this section was conducted on the two well-known risk factors for Intracranial Aneurysm formation: smoking and hypertension. Whereas, smoking and hypertension are well-established risk factors in IA formation [Bonita 1986, de la Monte et al. 1985, Inci et al. 2000, Juvela 2000, Kondo et al. 1997] their roles in the mechanisms that regulate aneurysm formation are poorly understood and are essentially limited to their statistical associations. In this study, I hypothesized that smoking and hypertension lead to intracranial aneurysm formation by changing the haemodynamic environment of the cerebral vasculature secondary to their effect on Blood Viscosity. There is good evidence in the literature that smoking and hypertension increase the Blood Viscosity in individuals [de Simone et al. 2005, Letcher et al. 1983]. CFD was used to compute the effects of these risk factors on wall shear stress (WSS) and oscillatory shear index (OSI) at the site of IA initiation, two most important factors for the development of Intracranial Aneurysms [Burleson et al. 1996, Byrne et al. 1998, Gao et al. 2008, Morimoto et al. 2002]. In the next study, I analyze the differences in the haemodynamic environments of intracranial aneurysms during the stages of their initiation versus rupture. 3D Rotational Angiograms were used to build the three-dimensional computer models of aneurysms included in the study followed by their qualitative and quantitative comparisons. The study further extended by investigating the effects of heparin (and enoxaparin) on the haemodynamic characteristics of aneurysms. Heparin (and its derivative enoxaparin) is a widely used injectable anticoagulant for preventing venous thrombosis and pulmonary embolism. It inhibits the factors involved in blood clotting (factor Xa), causing instantaneous inactivation of thrombin, thereby reducing Blood Viscosity [Hitosugi et al. 2001) and, in turn altering the haemodynamics of the blood circulation. Values of WSS and OSI were computed with the help of CFD in a ruptured Intracranial Aneurysm and compared with a tiny aneurysm in the stage of initiation. Possible link, between the low blood viscosity, and alterations in values of WSS/ OSI, leading to the rupture of IAs was explored. Potential effects of other pharmacological agents on the aetiopathogenesis of intracranial aneurysms are also discussed. Another interesting study was conducted to analyze the haemodynamic changes in the cerebral circulation of patients with Coarctation of Aorta and its possible effects on the increased incidence and rupture of Intracranial Aneurysms in these patients. After a thorough search (PubMed®, Embase® and Google-Scholar™ searched from the year 1900 up to 2009) I could retrieve only two relevant studies. Whereas, Hafkenschiel et al [Hafkenschiel et al. 1949) demonstrated a significant

167
increase in cerebral arterial flow-rates in patients with Coarctation of Aorta in 1949, Rowe and colleagues [Rowe et al. 1964] found no significant differences in the flow-rates before and after the repair of Coarctation of Aorta in their study performed in 1964. We therefore preformed pc-MR measurements in the cerebral arteries of a Coarctation of Aorta patient with coexisting IA and five healthy volunteers to establish the flow-rates at different locations in the cerebral vasculature. Amongst other aetiologies proposed, Coarctation of Aorta has been highlighted as a major risk factor in the aetiopathogenesis of IAs [Abbott 1928, Ahmetoğlu et al. 2003, Connolly et al. 2003, DuBoulay 1965, Eppinger 1871). Incidence of Intracranial Aneurysms among patients with CoA is approximately 5 times higher than that of the general population [Connolly et al. 2003]. The incidence of IA rupture in CoA patients (4.8%) [Shimogonya et al 2009, Mercado et al. 2002, Reifenstein et al. 1947] is also higher than the estimated rate of rupture in the general population, which is less than 1% [Weir et al. 1996]. In spite of CoA being a well-established risk factor for IA formation, [Abbott 1928, Ahmetoğlu et al. 2003, Connolly et al. 2003, DuBoulay 1965, Eppinger 1871] the exact underlying mechanisms for this association remain poorly understood. After measuring the flow-rates in the cerebral vasculature in patients with CoA, an analysis of the different haemodynamic factors inside Intracranial Aneurysms was performed. The possible role of haemodynamics is discussed in this context in a background of relevant literature. A better understanding of the aetiopathogenesis of the IA formation and rupture may help clinicians in preventing and treating the disease effectively. 6.2. Effects of changing blood viscosity on computed wall shear stress and oscillatory shear index at the site of intracranial aneurysm formation 6.2.1 Introduction Aneurysmal subarachnoid hemorrhage (SAH) remains a major cause of morbidity and mortality in neurosurgical patients [Inagawa et al 2001, Numminen et al 1996]. Smoking and hypertension are well-established risk factors in IA formation [Bonita 1986, de la Monte 1985 et al, Inci and Spetzler 2000, Juvela 2000, Kondo et al 1997]. However, their roles in the mechanisms that regulate aneurysm formation are poorly understood and are essentially limited to their statistical associations.

168
Recent evidence indicates WSS and OSI as important underlying haemodynamic factors in IA formation [Burleson and Turitto 1996, Gao et al 2008, Morimoto et al 2002]. One of the important parameters influencing WSS is blood viscosity, which in turn is influenced by smoking and hypertension [de Simone et al 1990, Letcher et al 1983]. The current study employs CFD to predict the effect of smoking and hypertension on the WSS patterns at the site of IA initiation with aim to explore the possible underlying mechanisms leading to their formation. 6.2.2 Materials and Methods 6.2.2.1 Study design and patient recruitment: The study was conducted jointly in the Departments of Neurosurgery and Neuroradiology, Royal Hallamshire Hospital, and the Department of Cardiovascular Science, University of Sheffield, Sheffield, UK. A total of two (n=2) patients diagnosed with IAs between Jan 2004 and March 2009, were identified retrospectively and recruited with appropriate consent and ethical approval. In order to avoid age and sex bias both patients were selected from the same age group (45 years) with one male and one female. Their relevant demographic and clinical data are reported in Table-6.1. Table-6.1: Patients’ demography, clinical presentations of IAs included in the study, their management, and the known risk factors
Pt.
Age/Sex
Clinical presentation
Ruptured/ Unruptured
Management Location of IA
Smoking Hypertension Other risk factors
1 45/M
Asymptomatic Unruptured Observed Lt terminal ICA
>60 cigarettes/ day/ 25 years
Poorly controlled
None
2 45/ F
Asymptomatic Unruptured GDC embolization
Rt terminal ICA
>40 cigarettes/ day/ 22 years
Controlled on medication
None
NB: Pt.; patient, GDC; Guglielmi detachable coils, Lt; left, Rt; right, ICA; internal carotid artery
3DRA acquisitions: Medical images were obtained using rotational acquisition in a Philips® Integris™ Allura machine (Philips® Medical Systems, Best, The Netherlands), producing 100 images in 6 seconds, with 5ms exposure per image. Voxel size in the reconstructed 3D images was 121 microns with reconstruction matrix 512x512x512. 6.2.2.1 Numerical 3D model: @neuFuse, the computational tool-chain developed within the EU project @neurIST was used to reconstruct vessel and aneurysmal geometries. Vessel triangular surfaces were reconstructed using a threshold isosurface extraction tool, based on the marching cubes algorithm developed by Lorensen and Cline [Lorensen and Cline 1987]. The removal of IAs was performed with the help of software @neuFuse. In order to mark the location of the IA in the parent artery after its removal, the image with IA in situ was superimposed over the image where the IA was removed. This step was done during the post-processing

169
of data with the help of software ANSYS®-CFX Postprocess™. A virtual marker (a sphere) was placed at the location of IA in the parent vessel from where the IA was removed. Now the first image (image with IA intact) was taken out and the location of IA (as localized by the virtual marker) was displayed by the arrows. Understanding the importance of the issue I have used exactly the same views for comparing the haemodynamic indices with and without intracranial aneurysms, so that the readers can make out the location of IAs easily in the view where there no IAs are present. Volumetric meshes were generated using ANSYS® ICEM™ CFD 11.0 (Ansys®, Inc., Canonsburg, PA, USA) based on the octree approach. The mesh was refined at the wall (using prismatic elements) for more accurate computation of WSS and OSI. For computational efficiency a progressively coarser mesh was used towards the vessel axis. Tetrahedral elements were used for the discretization of the domain core, with three layers of prismatic elements adjacent to the wall, thus ensuring accurate computation of WSS and OSI. Element size and number were set according to the outcome of a mesh dependency study performed on similar aneurysmal geometries [Radaelli et al 2008]. In this study results were found to be grid independent for meshes greater than 1700 el/mm3. In order to maintain consistency across the meshes used for all geometries, similar element density and the same wall element size and maximum core element size were used in the discretization of the domains. The 3D transient Navier-Stokes equations were solved using the finite-control-volume software, ANSYS®-CFX™. In view of the recent findings of [Marzo et al 2009] I used the ‘plug-flow’ or ‘flat’ velocity profile at inlet instead of Womersley flow profile. The default second-order high-resolution advection-differencing scheme was used. Blood was assumed to be incompressible, with density ρ=1060 kg/m3 and Newtonian, with viscosity µtypical=3.5 mPa·s. The effects of hypertension and smoking were modeled by increasing BV values by 8.1% (µatypical=3.78 mPa·s) according to the findings of De Simone et al [de Simone et al 1990] and Price et al [Price et al 1999]. Boundary conditions (BCs) for the 3D models were provided in form of typical volumetric flow rate waveforms at inlet and pressure waveforms at outlet. These were computed using the 1-D circulation model developed by Reymond et al [Reymond et al 2009]. The authors validated their model and found that the predictions of this 1-D model have good agreement with the measurements performed in the real patient/ healthy volunteers.

170
6.2.3 Results Values of WSS and OSI were time-averaged for one cardiac cycle and a qualitative and quantitative comparison made for the two BVs. WSS contours reported in Figures-6.1 and 6.2, and the data reported in Table-6.2, show that, in the case of Table-6.2: Quantitative comparison of areas and values of WSS the effects for µtypical and µatypical
Patient 1 Patient 2 µtypical µatypical % µtypical µatypical % Area of WSS > 15 Pa at aneurysm location [mm2] 1.24 1.42 +14.5 0.67 0.68 +1.5 Area of WSS > 15 Pa in parent vessel [mm2] 7.01 8.24 +17.5 148.8 160.0 +7.5 Maximum WSS at aneurysm location [Pa] 21.3 22.2 +4.2 56.54 58.73 +3.9 Average WSS in parent vessel [Pa] 4.5 Pa 4.7 Pa +4.4 12.12 12.68 +4.6 NB: µtypical; typical blood viscosity, µatypical; blood viscosity in smokers and hypertensive patients
both patients, the aneurysm formed at a location where WSS was higher than the mean value in the parent vessel. At physiological BV, the maximum WSS at the site of IA initiation for patient-1 (21.3Pa) was approximately 5 times higher than the mean value in the parent vessel (4.5Pa).

Similarly, for patient-2, the maximum WSS at the initiation site (56.5Pa) was approximately 5 times higher than in the parent vessel (12.1Pa). OSI also followed the same trend with relatively higher values at the sites of aneurysmal development for both patients, compared to that in the respective parent vessel (Figures 6.1 and 6.2, Table-6.2). However, it must
Figure-6.1: Reconstructed geometry of the IA and surrounding vasculature for patient-1 (A). Contours of WSS (B,C) and OSI (D,E) for µtypical (B,D) and µatypical (C,E) are displayed. Arrows indicate the site of IA along the parent vessel before removal.

172
be noted that areas of relatively high WSS and OSI were not exclusively limited to the sites of IA formation.
The threshold value of 15Pa for WSS used in the study was chosen as an arbitrary limit to highlight the areas of relatively higher WSS where the IAs were initiated and to appreciate/ quantify the effects of changes in BV in smokers and hypertensives on WSS. Whereas it was possible to identify
Figure-‐6.2: Reconstructed geometry of the IA and surrounding vasculature for patient-‐2 (A). Contours of WSS (B,C) and OSI (D,E) for µtypical (B,D) and µatypical (C,E) are displayed. Arrows indicate the site of IA along the parent vessel before removal.

173
a threshold for infra-physiological WSS (<0.4Pa) [Malek et al 1996], no such values could be found in the literature for supra-physiological WSS. An increase in BV, to represent the effects of smoking and hypertension, is reflected in the values of WSS and OSI, reported in Table-6.2. For patient-1 the area of high WSS (>15Pa) increased by 17.5%, whereas for patient-2 the increment was 7.5%. The maximum values of WSS at initiation sites followed a similar trend, but the increment was around 4% for both patients. Interestingly, the increase in the value of WSS does not correlate linearly with the increment in BV. Furthermore, from the data in Table-2, it can be seen that changes in BV do not have a significant or consistent effect on the value of OSI at the site of aneurysmal development. Table 6.3: The literature-based evidence on the importance of WSS and OSI in the aetiopathogenesis of IAs Haemodynamic factors
Intracranial Aneurysm Proposed mechanism(s) References Initiation Growth Rupture
Dynamic Wall Shear Stress (WSS)
High Low Low Increased WSS increases the production of MMP-13 which in turn leads to vessel wall damage Decreased WSS increases iNOS synthesis- NO induced damage to vessel wall Low WSS increases endothelial proliferation and apoptosis
Boussel et al 2008, Fukuda et al 2000, Gao et al 2008, Jou et al 2008, Malek et al 1999,
Meng et al 2007, Shojima et al 2004, Ujie et al 1999
Oscillatory Shear Index (OSI)
High/Low High High Degenerative changes in endothelium
Glor et al 2004, Goubergrits et al 2008, Mantha et al 2006
NB: WSS; wall shear stress, MMP-13; matrixmetalloproteneases-13, iNOS; inducible-nitric oxide synthase, NO; nitric oxide, OSI; oscillatory shear index
6.2.4 Discussion The exact aetiopathogenesis of IA formation is poorly understood [Sekhar and Heros 1981]. Whilst there is some indication of a congenital link [Forbus 1930], IAs are believed primarily to be acquired lesions [Crawford 1959, Stehbens 1975]. Recent evidence suggests a strong correlation between different haemodynamic factors and the aetiopathogenesis of IAs [Burleson and Turitto 1996, Byrne 1998, Gao et al 2008, Morimoto et al 2002]. In particular, a number of studies suggest a link between aneurysmal initiation, growth and rupture and the magnitude and distribution of WSS and OSI (Table-6.3). 6.2.4.1 Wall Shear Stress (WSS) WSS is a tangential frictional force exerted by flowing blood on the arterial endothelium, and is proportional to the blood viscosity and the velocity gradients. Mean arterial WSS has been suggested by Malek et al to lie within the range of 1.5-2.0Pa [Malek et al 1996]. There is an increasing body of literature suggesting that high WSS plays a role in the initiation of IAs [Burleson and Turitto 1996, Byrne 1998, Gao et al 2008, Gonzalez et al 1992, Morimoto et al 2002, Sacco et al 1984]. This is

174
further supported by the observation that IAs most frequently occur at bifurcations and arterial bends. These are regions, which are exposed to constantly high WSS [Foutrakis et al 1997, Rossitti 1998]. A number of different mechanisms have been proposed to explain how WSS influences the natural history of an IA. It has been established that the normal behavior of arterial endothelial cells (ECs) is regulated by haemodynamic shear stress. Sho et al [Sho et al. 2002] observed that increased WSS stimulates ECs to produce matrix metalloproteinase (MMP-13), which, in turn, leads to degeneration of the internal elastic lamina. In 1993 Luscher and Tanner [Luscher and Tanner 1993] found that the release of EC-derived growth and relaxation factor (EDRF – later recognized as nitric oxide) is shear stress dependent and is responsible for vascular remodeling. It has been demonstrated by a number of workers [Cooke et al 1990, Fukuda et al 2000, Pohl et al 1991] that WSS increases the production of NO by the ECs by inducing an enzyme responsible for its synthesis (iNOS; inducible nitric oxide synthase). Fukuda et al [Fukuda et al 2000] found a high localization of iNOS at the site of IA formation, in both rat and human arteries. They also demonstrated that iNOS inhibitors such as Aminoguanidine and Batroxobin (DF-521) attenuate the early degenerative changes associated with IA formation. The preventive effects of these drugs are thought to be mediated by lowering BV and hence WSS [Fukuda et al 2000]. They concluded that iNOS is a prerequisite for de novo development of IAs in cerebral vessels. In 1995, Wang et al [Wang et al 1995] showed that smooth muscle cells (SMCs) in arterial wall can also respond to WSS in intact arteries by virtue of interstitial flow generated by transmural flow gradients, further accentuating the vessel wall damage. A number of authors have attempted to explain the mechanisms linking WSS with EDRF/NO production. Experimental studies conducted by Busse et al [Busse et al 1990] revealed that WSS activates calcium ion-dependent endothelial iNOS leading to its increased production. Furthermore, WSS augments the release of adenosine tri-phosphate (ATP) and substance-P from EC [Milner et al 1990]. Increased concentrations of these two mediators are believed to enhance NO production in a paracrine manner [Pohl et al 1991]. More directly, increased WSS leads to hyperpolarization of the ECs by mobilizing the calcium ions from intracellular stores in cultured ECs [Ando 1988] probably via activation of phospholipase-C [Bhagyalakshmi and Frangos 1989] and/ or K+ channels [Olesen et al 1988]. Several authors have attempted to explain the mechanism of WSS transduction by the endothelium [Born and Palinski 1985, Pohl et al 1991, Radaelli et al 2008]. Born and Palinski [Born and

175
Palinski 1985] identified 3D mechanoreceptors anchored to the endothelial membrane. They hypothesized that WSS acts on these mechanoreceptors, mechanically enhancing the interaction between regulatory proteins and their targets [Born and Palinski 1985]. Resnick and colleagues [Resnick et al 1993] located a WSS-responsive element for iNOS on endothelial genes in 1993. Table-6.4 gives an overview of the important mechanisms proposed on the role of WSS in vascular remodeling. Table-6.4: WSS-induced vascular remodeling: an overview of some important mechanisms proposed
Author/ Journal/ Year Proposed mechanism(s)/ Observations Implications Rossitti et al (Acta Radiol, 1998); Foutrakis et al (Neurol Res, 1997)
IAs mostly occur at arterial bends and bifurcations exposed constantly to high WSS
High WSS can be a possible culprit in the development of IAs
Sho et al (Exp Mol Pathol, 2002)
Increased WSS stimulates endothelial cells to produce matrix metallo-proteinases (MMP-13)
Degeneration of the arterial internal elastic lamina by MMP-13
Luscher et al (Am J Hypertens, 1993
Release of endothelium derived EDRF is shear stress dependent
Vascular remodeling by WSS
Cooke et al (Am J Physiol, 1990), Pohl et al (Am J Physiol, 1991) Fukuda et al (Circulation, 2000)
WSS induces iNOS, an enzyme responsible for NO synthesis
Increased production of NO in the endothelium, EC injury
Fukuda et al (Circulation, 2000)
Found high concentrations of iNOS at the site of IA formation, both in rat and human arteries
Levels of iNOS correlate with IA initiation
Fukuda et al (Circulation, 2000)
iNOS inhibitors; Aminoguanidine and Batroxobin (DF-521) attenuate the early degenerative changes associated with IA formation
Aminoguanidine and Batroxobin (DF-521) have preventive effects on IA formation by lowering WSS
Wang et al (J Biomech Eng, 1995)
SMCs in arterial walls also respond to shear stress WSS induced vessel wall damage can extend to SMCs
Busse et al (FEBS Lett, 1990)
WSS activate the calcium ion dependent endothelial iNOS
WSS increases the synthesis of iNOS
Milner et al (Proc Biol Sci, 1990), Pohl et al (Am J Physiol, 1991)
WSS also augments the release of adenosine triphosphate (ATP) and substance-P from ECs
These two mediators increase EDRF production in a paracrine manner
Ando et al (In Vitro Cell Dev Biol, 1988)
High WSS leads to the hyperpolarization of the ECs by mobilizing the calcium ions from intracellular stores
EC damage
Bhagyalakshmi et al (Biochem Biophys Res Commun, 1989)
Hyperpolarization of ECs and mobilization of intracellular calcium is via activation of phospholipase-C
EC damage
Olesen et al (Nature, 1988) Hyperpolarization of the ECs and mobilization of intracellular calcium is via activation of K+
channels
EC damage
Born et al (Br J Exp Pathol, 1985)
Identified presence of 3D mechanoreceptors anchored to the EC membrane, WSS acts on these mechanoreceptors, mechanically enhancing the interaction between regulatory proteins and their targets
Link is established on how WSS transduces signals to ECs
Resnick (Proc Natl Acad Sci USA, 1993)
Located a WSS responsive element for iNOS on EC genes
Role of WSS in EC damage
Fukuda et al (Circulation, 2000)
Both, the magnitude of WSS as well as the duration of exposure for the endothelium remain important determinants for the induction of iNOS
Duration and magnitude of WSS play important role in IA formation
Wagner et al (J Clin Invest, 1997)
Demonstrated that no iNOS was induced when the SMCs were exposed lower WSS (1.1-2.5 Pa) for shorter durations (<24 Hrs.)
Chronic and significant exposure of WSS are required for the initiation of IAs
NB: MMP-13; matrixmetalloproteneases-13, NO; nitric oxide, iNOS; inducible-NO synthase, EC; endothelial cells

176
The findings of the current study support the correlation between high WSS and initiation of IA. Maximum values of WSS at the site of aneurysm formation were approximately 5 times higher than the mean values observed in the parent vessels, in both patients (Table-6.2). 6.2.4.2 Oscillatory shear index (OSI) The OSI is measure of the oscillatory nature of shear forces [Glor et al 2004, Glor et al 2003, Goubergrits et al 2008, Marzo et al 2009]. This index, which has a range of between 0 and 0.5, represents the fraction of the cardiac cycle over which the instantaneous shear force vector forms an angle greater than 90 degrees to the time-average direction of the same force. Consistently high values of OSI have been associated with EC dysfunction [He et al 1996] and changes in cell structure secondary to cyclic mechanical stress have been demonstrated by Wang et al. [Wang et al 1995] reporting disruption of the actin cytoskeleton of ECs. Glor and colleagues propose that an OSI of 0.2 represents a threshold value above which endothelial damage is initiated [Glor et al 2004, Glor et al 2003]. Damage to ECs produced by high OSI may contribute in IA formation. Areas of relatively high OSI predicted at the site of aneurysm formation for patient-2 in my CFD simulations support such theories; the maximum values observed approached the threshold value of OSI (0.2) identified in the literature. In contrast, for patient-1, the OSI at the site of IA initiation fell well below the threshold. This may indicate a less significant role for OSI in IA formation, at least in the case of this particular patient. Whilst, for both patients, areas of high WSS and OSI were located primarily at the bifurcations where the two IAs were observed, areas of high value for these indices were also predicted at other sites in the parent vessels. This raises a further question; why are these other critical areas unaffected? One explanation is that, in addition to the key haemodynamic triggers, IA initiation is governed by many other factors including amongst others; smoking, hypertension, genetics, polycystic kidney disease, Ehlers-Danlos syndrome, Marfans’s syndrome, etc. In addition, the possibility of de novo IA formation in these patients in other locations in the future cannot be excluded without a long-term follow-up. 6.2.4.3 Role of smoking and hypertension in the IA formation Smoking and hypertension are two well-established risk factors for IA formation. A number of clinical studies have highlighted the strong association between smoking [Anderson et al 2004, Bonita 1986, Qureshi et al 1998, Sacco et al 1984, Sauerbeck et al 2008] and hypertension [Inci

177
and Spetzler 2000, Sakaki et al 1993, Solenski et al 1995, Taylor et al 1995, Teunissen et al 1996] and de novo IA formation. Indeed, both risk factors also correlate with the presence of multiple IAs [Erbengi et al 1997, Juvela 2000, Ostergaard et al 1985, Qureshi et al 1998, Rinne et al 1994]. Experimental studies, where IA has been induced by hypertension, confirm these findings [Handa et al 1993, Hashimoto et al 1987, Kim et al 1992, Kondo et al 1997, Nagata et al 1980, Strother et al 1992]. Furthermore, autopsy studies conducted to assess the relationship between the IA formation and hypertension demonstrate even stronger correlations [Chason and Hindman 1958, Crompton 1964, de la Monte et al 1985, Sarner et al 1965, Toftdahl et al 1995]. Whilst being well-established risk factors for IA formation, the exact mechanisms by which smoking and hypertension lead to increased IA formation remain controversial [Inci and Spetzler 2000]. A number of explanations have been offered including; endothelial cell injury, occlusion of vasa vasorum and disturbances in the synthesis of elastin and collagen [Inci and Spetzler 2000]. It has been proposed that protease/protease-inhibitor factor imbalance is a factor in smokers and a quantitative deficiency of alpha-1-antitrypsin has been reported both in patients with SAH and in smokers [Gaetani et al 1996, Schievink et al 1995, St Jean et al 1996]. Alpha-1-antitrypsin is an inhibitor of elastase, a proteolytic enzyme that enhances collagen catabolism. This link is not supported universally; Sakai et al [Sakai et al 1999] attribute the increased plasma protease levels found in patients with IAs to leukocytosis after SAH thus disputing the significance of plasma protease/protease-inhibitor imbalance as a marker for IA formation. Another hypothesis suggests that IA formation is a part of a vascular degenerative process similar to atherosclerosis and that smoking leads to IA initiation by facilitating this process [Adamson et al 1994, Greenhalgh et al 1980]. One widely recognized effect of smoking and hypertension is an increase in BV [de Simone et al 1990, Price et al 1999]. I propose that the missing link between these risk factors and increased IA formation is via high WSS secondary to an increase in BV. This hypothesis is supported by my findings, which show an increase in the area of vessel wall subject to high WSS and elevated maximum values of WSS coincident with the IA initiation site for the two patients studied. For patient-1 both qualitative (Figure-6.3) and quantitative (Table-6.2) comparisons show that increased BV results in a substantial increase in the maximum WSS of 4.2%. The area of wall affected by very high WSS (>15Pa), up by 14.5% and 17.5% for the site of the IA and parent vessel respectively. Similar trends were

178
observed for patient-2 but the relative differences were lower (Figure-6.4, Table-6.2). There is strong evidence to indicate that induction of iNOS in ECs is dependent on both the magnitude and duration of exposure to WSS [Fukuda et al 2000]. In an experimental study, Wagner et al [Wagner et al], found that iNOS was not induced when the vessel walls were exposed to low WSS (1.1-2.5 Pa) for short durations (<24 Hrs.). The study suggests that the chances of IA development are increased if an artery is exposed to high WSS on chronic basis. Both patients included in my study were exposed to these two risk factors chronically for an extended period (20-25 years). Long-term exposure to high WSS, and the increase in the area of vessel wall affected, may have led to EC damage in these patients and contributed to an increased risk of IA development. Changes in OSI at the sites of IAs were less marked than changes in WSS, and had no consistent trend. Whilst OSI is not directly dependent on BV, changes in haemodynamics resulting from altered rheology may be reflected in the OSI. However, the results indicate its less significant dependency from the haemodynamic changes secondary to altered BV. It is important to note that my findings differ in some respects from those reported for previous studies, based on similar methodology [Marzo et al 2009, Shimogonya et al 2009]. These sought to develop novel indices in an attempt to link initiation with a haemodynamic trigger whilst indicating that WSS was relatively low at the site of IA initiation. Shimogonya et al [Shimogonya et al 2009] reported a significant correlation between IA formation and a self-proposed haemodynamic index which they termed the ‘gradient oscillatory number’ (GON) and Mantha et al [Mantha et al 2006] showed a correlation between IA initiation and their newly-proposed haemodynamic index; aneurysm formation indicator (AFI). In considering these results in the light of the current work, it is important to note that Shimogonya et al used a simplified geometry that may have influenced their results. Furthermore, as there are bodies of literature associating low [Boussel et al 2008, Byrne 1998, Jou et al 2005, Malek et al 1996] and high [Burleson and Turitto 1996, Byrne 1998, Fukuda et al 2000, Gao et al 2008, Gonzalez et al 1992, Morimoto et al 2002, Rossitti 1998] WSS with endothelial dysfunction and the aetiopathogenesis of IA, it could be argued that both supra-physiological and infra-physiological WSS lead to perturbance of normal EC behavior. My findings agree with the majority of studies [Burleson and Turitto 1996, Byrne 1998, Fukuda et al 2000, Gao et al 2008, Gonzalez et al 1992, Morimoto et al 2002, Rossitti 1998] that support the role of high WSS in IA formation.

179
It is evident that the IA formation is likely to have a multi-factorial aetiology with haemodynamic factors acting as an important cog in this process. Many factors are likely to act in parallel rendering the vessel wall more susceptible to the effects of increased pressure and WSS. 6.2.5 Limitations of the study Before drawing any conclusions it is important to emphasize that my study, in common with other CFD analyses, carries inherent limitations associated with the assumptions necessary to create the models. First, whilst very high quality images (3DRA) were used to reconstruct the vessel geometries, these represent the volume of the vessel occupied by contrast agent. If vessel filling with contrast is incomplete, this may generate errors in surface prediction. Unfortunately, due to the limitations of current technology this remains an unresolved problem. Second, the BCs used in the analyses were obtained from a generic 1D circulation model and were not patient-specific [Reymond et al 2009]. Here it is important to note that recent validation of this model against flow waveforms measured for young volunteers justify its use [Reymond et al 2009]. Third, despite being non-Newtonian, blood was considered as a Newtonian fluid for the purposes of these analyses. This assumption was based on the observations that, blood behaves as a Newtonian fluid at the high shear-rates which apply at most sites in the cerebral circulation (>100s-1) [Bonert et al 2002], in particular in areas coinciding with sites of IA formation. Fourth, the arterial wall was considered rigid, neglecting wall motion, as this has been shown to have a negligible effect on CFD predictions [Ford et al 2008, Jeays 2007]. Finally, the study was performed on a small cohort of two IAs. The work must be considered as a preliminary study; analyses will be required for a significantly larger number of IAs before firm conclusions can be drawn. 6.2.6 Conclusions The current study suggests that if the smoking and hypertension affect the blood viscosity as per the values given in the literature, the high values of blood viscosity can change the haemodynamic environment of the IAs. Furthermore, when I substituted these high blood viscosity values in CFD simulation I found that the values of computed WSS and OSI for patient were significantly higher.

180
6.3 Analysis of Different Haemodynamic Factors During Initiation and Rupture of an Intracranial Aneurysm and Possible Influence of Low Molecular Weight Heparin Mediated Change in the Blood Viscosity on Computed Values of These Haemodynamic Factors 6.3.1 Introduction Aneurysmal subarachnoid haemorrhage (SAH), despite improvement in surgical and medical management, remains a major cause of morbidity and mortality [Inagawa 1998]. Whereas the exact aetiopathogenesis of IA formation and rupture is poorly understood, recent evidence indicates haemodynamics as an important underlying factor [Baskurt 2003, Danesh et al 2000, Sekhar and Heros 1981, Shojima et al 2004]. Most of the IAs are formed at arterial bends and bifurcations corresponding to the areas exposed to highest WSS. [Danesh et al 2000] Contrary to the initiation, aneurysmal growth has been demonstrated to coincide with regions where endothelial cell lining is exposed to abnormally low WSS. [Baskurt 2003] The rupture typically occurs when the stresses and strains in the aneurysmal wall exceed its strength and have been correlated to the complex intra-aneurysmal flow patterns, jet impingement, and areas of low WSS [Cebral et al 2005, Cebral et al 2008]. As confirmed by many authors [Baskurt 2003, Danesh et al 2000] haemodynamics of intracranial vasculature is dependent upon the rheological properties of blood, including BV. It is intuitive to speculate that the factors, which affect BV, may influence the haemodynamic environment of an IA, affecting in turn its initiation, growth, and rupture. Various workers have demonstrated the influence of commonly used drugs on BV including heparin, [Hosoda and Iri 1966] amlodipine, [Linde et al 1996], metoprolol [Hosoda and Iri 1966], pentoxiphilline [Schmetterer 1996], nitrates [Brugger et al 1985], oral contraceptives [Coata et al 1995], statins [Rosenson and Tangney 1998], various chemotherapeutic agents [Mark et al 2001], etc. As correctly feared by Sekhar and Heros [Sekhar and Heros 1981] in their classical review; with ever increasing use of more and more pharmacological agents there is a pragmatic possibility that a certain medical or surgical treatment modality may alter the delicate balance, leading to increased aneurysm formation or rupture. In the current study I analyzed and compared the important haemodynamic factors in two IAs, one in the stage of initiation (a preaneurysmal lesion, Aneu-1) and other a ruptured aneurysm (Aneu-2). Followed by this, the study investigates the effects of heparin on the haemodynamics of these IAs, and discusses its possible long-term implications on their natural history.

181
6.3.2 Material And Methods The study was conducted jointly in the departments of Neurosurgery and Neuroradiology, Royal Hallamshire Hospital, and the Academic Unit of Medical Physics, School of Medicine and Biomedical Sciences, University of Sheffield, Sheffield, UK. After obtaining appropriate consent and ethical approval the patient was recruited to the project @neurIST (www.aneurist.org). 6.3.2.1 Clinical Details The patient included in the study was a 58-years-old woman presented in March 2008 with a history of sudden onset of severe headache, nausea vomiting, photophobia and loss of consciousness. She had a past medical history of deep vein thrombosis (DVT) and was on long-term warfarin for that. The Glasgow Coma Score (GCS) at the time of admission was 13/15 (E3V4M6) with bilateral normally reacting pupils and no signs of meningism. An urgent CT scan of the head revealed presence of subarachnoid blood with normal ventricles. 6.3.2.2 Endovascular Intervention and Postoperative Period
A CT angiogram performed later demonstrated the presence of two IAs, further confirmed by a four-vessel 3DRA (Figure-6.3). First aneurysm (Aneu-1) was a tiny ‘bleb’ type IA in the ophthalmic segment of right internal carotid artery (ICA) and is considered as
preaneurysmal lesion here. The second IA (Aneu-2)
considered as source of bleed here was present in right
Figure-6.3: Reconstructed geometries showing the IAs and connecting vessels reconstructed with software @neuFUSE. Labels indicate the openings where boundary conditions were applied.

182
ICA at the level of right posterior communicating artery (PComA). The radiological characteristics of the IAs are given in Table-6.5. It was decided to coil the tubular right ICA-PComA aneurysm in the same sitting using GDC® (Guglielmi Detachable Coils) embolization. A 6-French guide-wire catheter was positioned distally within the right extracranial ICA. The aneurysm was catheterized with an Excelsior® microcatheter using a Transend® 14 guide wire (Boston Scientific®, USA). The IA was packed satisfactorily using four Micrus® endovascular bare platinum coils. Patient’s hospital stay was unfortunately complicated by bouts of chest infections necessitating prolonged hospitalization. Throughout the hospital stay, she received low molecular weight (LMW) heparin (enoxaparin, Clexane®) for her DVT prophylaxis. The tiny ‘bleb’ IA was found unsuitable for coiling and therefore decided to be followed by MRAs.

183
Table-6.5: Radiological characteristics of IAs Aneu-1 Aneu-2 Location Rt. ICA –Ophthalmic
segment Rt. ICA at the origin of PComA
Size 1.4x2mm 9x3 mm Neck size 2.3mm 3.6mm Dome status Unruptured Ruptured Type Bleb/ preaneurysmal/
side wall Saccular/ side wall
Aspect Smooth Smooth Connected vessels Inlets Rt. ICA, Rt. PComA Rt. ICA, Rt. PComA Outlets Rt. Ophthalmic, Rt. MCA,
Rt. ACA Rt. Ophthalmic, Rt. MCA, Rt. ACA
NB: Rt; Right, PComA; posterior communicating artery, ICA; internal carotid artery, MCA; middle cerebral artery, ACA; anterior cerebral artery. Connected vessels are used as outlets or inlets in the flow simulation, as indicated. 6.3.2.3 Image acquisition protocol The medical images used in the study to reconstruct the aneurysm geometries were obtained using rotational acquisition in a Philips® Integris™ Allura™ machine (Philips® Medical Systems, Best, The Netherlands), producing 100 images in 6 seconds, with 5ms exposure per image. Voxel size in the reconstructed 3D images was 121 microns with a reconstruction matrix of 512x512x512. 6.3.2.4 Numerical 3D model The @neurIST computational tool-chain was used to reconstruct the vessel surfaces as described by Singh and colleagues (Figure-3). Volumetric meshes were generated using ANSYS®-ICEM™ CFD-11.0, based on the octree approach. Grids were made finer at the walls and progressively coarser towards the vessel axis. Tetrahedral elements were used for the discretization of the domain core, with three layers of prismatic elements adjacent to the wall thus ensuring accurate computation of haemodynamic indices. In order to maintain consistency across the meshes used for all geometries, similar element density, same wall element size and maximum core element size were used in the discretization of the domains. 6.3.2.5 CFD Analysis The 3D transient Navier–Stokes equations were solved by using the finite-control-volume software, ANSYS®-CFX™. The default second-order high-resolution advection-differencing scheme was used. Blood was assumed to be incompressible, with density ρ=1060 kg/m3 and Newtonian, with viscosity μuntreated=0.0045 Pa.s; for untreated blood, and μheparin=0.0025 Pa·s; 22 for heparinized blood. This simulates the effect of heparin at an average therapeutic concentration of 0.0075 mg/ml. All analyses were run in parallel on two Itanium2 900MHz 64-bit processors of a Tiger-2 Linux cluster. The average time required to solve one cardiac

184
cycle was approximately 8.6 Hrs. The relevant haemodynamic variables were computed for both the viscosity values. Qualitative and quantitative comparisons of all the computed haemodynamic variables were performed. 6.3.3 Results 6.3.3.1 Comparison of the haemodynamics in initiation (Aneu-1) and rupture (Aneu-2) phase Table-6.6 gives the details of all haemodynamic indices computed using typical BV (μuntreated=0.0045 Pa.s) and their quantitative comparison between Aneu-1 and Aneu-2. The WSS, OSI and blood velocity values used in the present study are time-averaged along the cardiac cycle while the area of elevated pressure was considered at peak systole. Whereas, the flow was stable throughout the cardiac cycle in both the IAs and was momentum driven, it was more vortical in the ruptured lesion (Aneu-2) with higher flow velocities. Table-6.6: Inter-aneurysmal comparison of haemodynamic indices in Aneu-1 and Aneu-2 for typical BV (μuntreated) Haemodynamic variable Aneu-1 Aneu-2 Difference (%) Max-t-av-velocity in IA (m/s) 0.049 1.024 +95.2 Space t-av-velocity in IA (m/s) 0.085 0.085 0 t-av-WSSmin (Pa) 1.066 0.055 -1838.18 t-av-WSS max (Pa) 35.9 67.75 +47 Area of infra-physiological WSS (<0.4 Pa) 00% 0.8% +100 Area of supra-physiological WSS (>1.5 Pa) 99.9% 91.2% -9.6 OSI max 0.21 0.43 +51 Area of elevated OSI (>0.2) 0.1% 2.6% +96 Area of elevated pressure (%) 2.1% 3.5% +40 No. Of Vortices 1 2-3 NB: Aneu-1; preaneurysmal lesion, Aneu-2; ruptured aneurysm, μuntreated; untreated viscosity values used = 0.0045 Pa.s, WSS; wall shear stress, OSI; oscillatory shear index, Max-t-av-velocity; maximum time-averaged velocity over the cardiac cycle; Space t-av-velocity; space and time-averaged velocity, t-av-WSSmin; minimum time-averaged WSS, t-av-WSSmax; maximum time-averaged WSS. The values of WSS between 0.4 and 1.5 Pa are considered as physiological range after Malek et al. (1996) and the values of OSI above 0.2 were considered as a threshold value above which endothelial damage is initiated after Glor and colleagues. [Glor et al 2003 and 2004, Goubergrits 2008].
The most striking differences however were observed in the values of WSS, OSI and pressure. Whereas the values for minimum time-averaged WSS (t-av-WSSmin) were substantially lower (by 1838.18%) in the ruptured lesion the values for maximum time-averaged WSS (t-av-WSSmax) showed an opposite trend. The area affected by infra-physiological WSS (<0.4Pa) was larger in the ruptured lesion (0.8%) as compared to the preaneurysmal stage (0%). Quite the contrary, the area affected by supra-physiological WSS (>1.5 Pa) was larger in preaneurysmal stage. Both, the maximum values of OSI (OSImax) as well as the areas affected by the elevated OSI (>0.2) were higher in the ruptured lesion. Ruptured aneurysm also exhibited approximately 40% rise in the pressure on it wall as compared to its preaneurysmal counterpart.

185
6.3.3.2 Comparison of the effects of heparin on aneurysmal haemodynamics 6.3.3.2.1 Qualitative comparison The comparisons of qualitative contour plots of WSS and OSI with and without effects of heparin show (Figure-6.4) that whereas the distributions of both the indices follow similar patterns for both values of BV, the areas affected by their high or low values have changed significantly. It is evident from Figure-6.4 that heparin as a rule increasing the areas affected by relatively low WSS while decreasing the areas affected by relatively high WSS. This pattern of change in the distribution is observed consistently across both the geometries. Whilst for both BV values, areas of low WSS remain confined within the dome and body of the aneurysms, zones of comparatively higher WSS were concentrated around the distal part of the neck and in areas within the aneurysmal body, where the jet generated at the base of the aneurysm impinges against its wall. Figure-6.4 shows the increasing ‘low-WSS’ (black arrows) and decreasing ‘high-WSS’ patterns for Aneu-1 and Aneu-2 (red arrows). Contrary to the t-av-WSS, it is observed that heparin treatment has peculiar effect on OSI. Whereas in some of the areas the areas of low OSI (black arrows) are increasing with heparin treatment, in other areas it is increasing the areas affected high OSI (red arrows). 6.3.3.2.2 Quantitative comparison Table-6.7 shows a quantitative comparison between minimum and maximum values of WSS and OSI, Table-6.7: The Quantitative comparison of effects of heparin on haemodynamic indices Aneu-1 Aneu-2 µuntreated µheparin Change % µuntreated µheparin Change % t-av-WSSmin (Pa) 1.066 1.086 +1.8 0.055 0.048 -12.7 t-av-WSSmax (Pa) 35.9 28.08 -21.8 67.75 45.11 -33.4 Area of infra-physiological WSS (<0.4 Pa) 0.009% 0.07% +677.8 0.8% 1.2% +50.0 Area of supra-physiological WSS (>1.5 Pa) 99.9% 99.6% -0.3 91.2% 88.7% -2.7 OSImax 0.21 0.17 -19.0 0.43 0.46 +7.0 Area of elevated OSI (>0.2) 0.1% 00% -100.0 2.6% 4.1% +57.7 Area of elevated pressure (%) 2.1% 2.5% -19.0 3.5% 4.0% +14.3 NB: Aneu-1; preaneurysmal lesion, Aneu-2; ruptured aneurysm, μuntreated; untreated viscosity values used = 0.0045 Pa.s, WSS; wall shear stress, OSI; oscillatory shear index, Max-t-av-velocity; maximum time-averaged velocity over the cardiac cycle; Space t-av-velocity; space and time-averaged velocity, t-av-WSSmin; minimum time-averaged WSS, t-av-WSSmax; maximum time-averaged WSS. The values of WSS between 0.4 and 1.5 Pa are considered as physiological range after Malek et al. (1996) and the values of OSI above 0.2 were considered as a threshold value above which endothelial damage is initiated after Glor and colleagues. [Glor et al 2003, 2004, Goubergrits 2008] areas where values for these indices are outside their normal physiological range, [Glor et al 2003, 2004, Goubergrits 2008] and areas of elevated pressure for both the geometries. The change in values of these indices

186
before and after heparin treatment is represented in percentage, in the last columns.
Qualitative and quantitative comparisons for only three most relevant haemodynamic indices i.e. WSS, OSI and pressure were performed.
Figure-6.4: The qualitative differences in the patterns of t-av-WSS and OSI in pre (a,b) and post heparinized (c,d) blood. Top two rows are contour plots for t-av-WSS. Bottom two rows are contour plots for OSI. a&b; front views, c&d; back views. Row 1&3; Aneu-1, row 2&4; Aneu-2.
Whereas t-av-WSSmin was decreased in Aneu-2 after heparin administration by 12.7%, the values were minimally (1.8%) increased in Aneu-1. t-av-WSSmax was decreased in both IAs. An increase in the areas affected by infra-physiological WSS (<0.4Pa) was observed in both the lesions. The increments however were substantially higher (+677.8%) in the preaneurysmal lesion (Aneu-1) as compared to the ruptured IA (50%). The areas affected by supra-physiological WSS (>1.5 Pa) were decreased

187
in both the lesions when BV values specific to heparin were used. Whereas, the values for OSImax and the areas of elevated OSI (>0.2) were decreased in Aneu-1, the corresponding values were increased in Aneu-2 after treatment with heparin. The distribution of elevated pressure areas followed the similar trend to that of OSI. 6.3.4 Discussion There is a rapidly growing body of literature affirming the importance of haemodynamics in the aetiopathogenesis of IAs [Baskurt 2003, Burleson et al 1996, Castro et al 2006, Cebral et al 2005, Cebral et al 2008, Danesh et al 2000, Fukuda et al 2000, Gao et al 2008, Glor et al 2003, 2004, Goubergrits 2008, Inci and Spetzler 2000, Malek et al 1999, Mantha el at 2006, Morimoto et al 2002, Shojima et al 2004, Steinman et al 2003]. The haemodynamic variables often considered in these studies are WSS, oscillatory shear index (OSI), blood pressure, and other quantities used to characterize blood flow. Proportional to blood viscosity and its velocity, WSS is the tangential frictional force exerted by the flowing blood on the walls of each vessel. High supra-physiological and low infra-physiological values of WSS have been associated with initiation, growth and rupture of aneurysms [Baskurt 2003, Fukuda et al 2000, Gao et al 2008, Glor et al 2003, Shojima et al 2004]. A measure of the oscillatory nature of these viscous forces is given by the OSI, often associated with endothelial cells degeneration. [Glor et al 2003, 2004, Goubergrits 2008] Table-8 below gives a comprehensive list of haemodynamic variables from the literature and their association with IA evolution. An evaluation of these variables can provide a useful alternative to predict the behavior of an unruptured IA at an early stage before it changes in size, shape or becomes symptomatic. Unfortunately, the detailed in-vivo measurements of these relevant flow variables in the regions affected by the disease are currently impossible [Shojima et al 2004, Steinman et al 2003]. Motivated by the important role played by haemodynamics and the difficulty of conducting detailed in-vivo observations of relevant haemodynamic variables, engineers and computer scientists have started using CFD to predict blood flows in IAs [Baskurt 2003, Castro et al 2006, Cebral et al 2005, Cebral et al 2008]. In this study, I observed that both aneurysms, representing the two extreme stages in the natural history of an IA, were peculiar in their haemodynamic characteristics (Table-6.6). Max-t-av-velocity was approximately 95% higher in Aneu-2 than the preaneurysmal lesion IA (Aneu-1). This might represent a correlation of high max-t-av-velocity and aneurysmal rupture. On the other hand the space and t-av velocity was

188
identical in both IAs making it difficult to draw any conclusions on its effect IA pathogenesis. Table 6.8: The literature-based evidence on the importance of haemodynamics in the aetiopathogenesis of IAs Haemodynamic factors
Intracranial Aneurysm Proposed mechanism(s) References Initiation Growth Rupture
Dynamic Wall Shear Stress (WSS)
High Low Low Increased WSS increases the production of MMP-13 which in turn leads to vessel wall damage Decreased WSS increases iNOS synthesis- NO induced damage to vessel wall Low WSS increases endothelial proliferation and apoptosis
Boussel et al 2008, Fukuda et al 2000, Gao et al 2008, Jou et al 2008, Malek et al 1999, Meng et al 2007, Shojima et al 2004, Ujie et al 1999
Oscillatory Shear Index (OSI)
High/Low High High Degenerative changes in endothelium
Glor et al 2004, Goubergrits et al 2008, Mantha et al 2006
Jet of Blood Stream
Impingement Impingement Impingement Localized endothelial cell injury
Foutrakis et al 1999, Cebral et al 2005, Cebral et al 2009
Flow Pattern - - Complex Statistical association Cebral et al 2005, Cebral et al 2009
Hydrostatic Pressure High High High Passive yield/ water hammer
effect Inci and Spetzler 2000, Morimoto et al 2002, Steiger et al 1989
NB: WSS; wall shear stress, MMP-13; matrixmetalloproteneases-13, iNOS; inducible-nitric oxide synthase, NO; nitric oxide, OSI; oscillatory shear index WSS is one of the most extensively studied haemodynamic indices. Whereas high supra-physiological values have been associated with initiation, the low values are thought to be responsible for growth and rupture. Cebral et al 2005, Cebral et al 2008 Values of t-av-WSSmin in the preaneurysmal lesion (Aneu-1) were significantly (1838.18%) higher as compared to the ruptured IA where it was significantly lower. t-av-WSSmax also showed the similar patterns being higher in the Aneu-1 as compared to Aneu-2. As suggested by Malek et al [Malek et al 1999] the values of WSS between 0.4 Pa and 1.5 Pa were considered physiological range in the study. Whereas, the area affected by infra-physiological WSS (<0.4Pa) was larger in ruptured IA, the area affected by supra-physiological WSS (>1.5 Pa) was bigger in initiation stage. It has been suggested that supra-physiological WSS increases the production of MMP-13, which in turn leads to vessel wall damage [Boussel et al 2008] leading to IA formation, especially at arterial bends and bifurcations. Infra-physiological WSS on the other hand increases iNOS (inducible Nitric Oxide) synthesis. [Fukuda et al 2000] NO induced damage to vessel wall increases endothelial proliferation and apoptosis. The increased values of OSI (>0.2) are found to be associated with aneurysmal pathogenesis by producing degenerative changes in endothelium. [Glor et al 2003, 2004, Goubergrits 2008]. In my study, both

189
OSImax and the area of elevated OSI (>0.2) were higher in ruptured IA as compared to one in the stage of initiation (Aneu-1). This observation may indicate that possibly the high values of OSI play more important role during the rupture of an IA than its initiation. High pressure has long been implicated in aneurysmal rupture [Inci and Spetzler 2000]. The rupture is thought to be an effect of passive yield to pressure leading to tissue failure and the water hammer effect [Inci and Spetzler 2000]. Keeping in consistent with the previous authors’ findings, the area affected by high pressure in the current study was greater in the ruptured IA (Aneu-2). The number of vortices inside an IA represents complexity of its flow, which in turn correlates with aneurysmal rupture [Cebral et al 2005, Cebral et al 2008]. Whereas, only one vortex was observed in Aneu-1 (preaneurysmal lesion) the flow was relatively complex in Aneu-2 (ruptured) with 2-3 vortices. Various pharmacological agents including Beta aminoproprionitrile fumarate (BAPN), a lathyrogen, have been successfully used in the induction of IAs in experimental animal models [Hosoda et al 1966, Inci and Spetzler 2000, Kim et al 1989]. BAPN irreversibly inhibits lysyl oxidase enzyme preventing the cross-linkage between elastin and collagen fibers, critical for the maintenance of normal structure and strength of vessel wall. The net effect is disruption or loss of internal elastic lamina, possibly facilitating the IA formation. Apart from the experimental animal models, there are reports describing the bilateral IA formation in human beings after the anticoagulation therapy [Turowski et al 2007]. The dissecting aneurysms regressed when aspirin replaced warfarin. It has been suggested that a combination of increased pressure (hypertension) and anticoagulation can play a role in the development of IAs in these situations thus contraindicating the use of anticoagulants in these patients [Pezzini et al 2006]. In their novel experimental studies Akoi and colleagues [Aoki et al 2007, Aoki et al 2007, Aoki et al 2008, Aoki et al 2008, Aoki et al 2009] showed various inflammatory mediators playing a crucial role in the initiation and progression of IAs. More recently, the same group also demonstrated preventive effects of different drugs on the formation or progression of IAs including simvastatin [Aoki et al 2008], pitavastatin [Aoki et al 2009], and nifedipine [Aoki et al 2008]. It has been suggested that protective effects of these drugs are mediated through their property of inhibiting the inflammatory reactions in the IA wall. The effects of various pharmacological agents on the rheological properties of blood have extensively been studied by many authors. It has been shown that drugs like heparin [Hosoda and Iri 1966]

190
antihypertensives [Hosoda and Iri 1966], pentoxiphilline [Schmetterer 1996] nitrates [Brugger et al 1985] oral contraceptives [Coata et al 1995] statins [Rosenson et al 1998], various chemotherapeutic agents [Mark et al 2001], etc., can influence the BV. Heparin, a highly sulfated glycosaminoglycan, is a widely used injectable anticoagulant. Heparin and its newer derivatives like enoxaparin are very effective in preventing deep vein thrombosis and pulmonary embolism in the patients at risk. By binding with plasma-protease inhibitor antithrombin III, heparin accelerates its action, which in turn inhibits factors involved in blood clotting most notably factor Xa. Heparin increases the rate of this inactivation complex formation 1000-fold, thus causes instantaneous inactivation of thrombin, lowering the BV [Hosoda and Iri 1966]. This reduction in the BV then alters the haemodynamics of blood circulation [Baskurt 2003, Danesh et al 2000, Hitosugi and co-workers [Hitosugi et al 2001] demonstrated that there was a decrease in the BV by 55.6% by heparin at a therapeutic concentration of 0.75 IU/lit. These values are used in the current study to simulate the BV in the patient when she was receiving this drug for DVT prophylaxis. As noted above the high values of t-av-WSSmin favor initiation and low values favor the rupture. Whereas the values of t-av-WSSmin in Aneu-2 were decreased by heparin by 12.7%, the same values were affected minimally in Aneu-1, an observation that may promote rupture of an IA without much affecting the initiation. Quite the contrary, the heparin administration decreased t-av-WSSmax in both Aneu-1 and Aneu-2 by 21.8% and 33.4%, respectively. Whereas, the situation favors rupture of the existing IAs, it may actually provide protection against formation of new ones. A dramatic increase of 677.8% was seen in the area affected by infra-physiological WSS (<0.4Pa) in preaneurysmal lesion (Aneu-1) after heparin administration. The same values were also increased by 50% in ruptured IA. Again, the deranged values are expected to facilitate the rupture of the existing IAs; but can be protective against formation of new lesions. The area affected by supra-physiological WSS was minimally affected by heparin. The values of OSImax are associated with both initiation as well as rupture of IAs. [Glor et al 2003 and 2004, Goubergrits 2008]. Whereas, heparin decreased both OSImax as well as area of elevated OSI in preaneurysmal lesion (Aneu-1) the effect was opposite in the ruptured IA (Aneu-2) where both the values were increased. The findings further indicate that whereas heparin administration may accelerate the rate of rupture in the existing aneurysms it may suppress the formation of new IAs.

191
6.3.5 Conclusions Haemodynamics plays important role in the aetiopathogenesis of IAs. CFD can offer valuable alternative to extract this non-observable data from IAs that can be used to improve the prognosis and management of disease. The current study demonstrates that the haemodynamic patterns of IAs during initiation and rupture are significantly different. Whereas, values of t-av-WSSmin and areas affected by supra-physiological WSS were higher in preaneurysmal lesion the corresponding values were lower in ruptured IA. The area affected by infra-physiological WSS (<0.4Pa) was significantly higher in ruptured lesion as compared to preaneurysmal IA. Furthermore, by changing the blood viscosity, heparin can induce significant derangements in the haemodynamics of both, preaneurysmal as well as ruptured IA. In the light of evidence form this study, it is expected that whereas on the one hand such alterations in haemodynamics may facilitate the rupture of existing IAs, on the other hand they may suppress the formation of new IAs. Similar effects may be associated with other pharmacological agents, warranting further investigations. 6.3.6 Limitations of the Study Before drawing any conclusions it is important to emphasize that my study, in common with other CFD analyses, carries inherent limitations associated with the assumptions necessary to create the models. First, whilst very high quality images (3DRA) were used to reconstruct the vessel geometries, these represent the volume of the vessel occupied by contrast agent. If vessel filling with contrast is incomplete, this may generate errors in surface prediction. Unfortunately, due to the limitations of current technology this remains an unresolved problem. Second, the BCs used in the analyses were obtained from a generic 1D circulation model and were not patient-specific. Here it is important to note that recent validation of this model against flow waveforms measured for young volunteers justify its use [Reymond et al 2009]. Third, despite being non-Newtonian, blood was considered as a Newtonian fluid for the purposes of these analyses. This assumption was based on the observations that, blood behaves as a Newtonian fluid at the high shear-rates which apply at most sites in the cerebral circulation (>100s-1), 7 in particular in areas coinciding with sites of IA formation. Fourth, the arterial wall was considered rigid, neglecting wall motion, as this has been shown to have a negligible effect on CFD predictions [Ford et al 2008, Jeays et al 2007]. Finally, the study was performed on a small cohort of two IAs. The work must be considered as a preliminary study; analyses will be required for a significantly larger number of IAs before firm conclusions can be drawn.

192
6.4 The Effects of Aortic Coarctation on Cerebral Haemodynamics and its Possible Role in the Aetiopathogenesis of Intracranial Aneurysms 6.4.1 Introduction Estimated annual incidence of IAs in most western countries is 1 to 2% [Atkinson et al 1989, Inagawa et al 1990]. Aneurysmal subarachnoid haemorrhage (SAH) is feared with unacceptably high overall mortality rates of 45% (32-67%) [Hop et al 1997]. About 30% of survivors have moderate to severe disabilities and 66% of those who have ‘successful’ clipping, never return to same quality of life as before SAH [Hop et al 1997, Drake et al 1981]. The current evidence convincingly supports a multi-factorial basis for the initiation and rupture of IAs [Sekhar and Heros 1981, Yong-Zhong et al 1990, Stehbens 1989]. Amongst other aetiologies proposed, Coarctation of Aorta (CoA) has been highlighted as a major risk factor in the aetiopathogenesis of IAs [Eppinger at al 1871, Abbott et al 1928, Walton et al 1956, Laitinen et al 1960, DuBoulay 1965, Patel 1971, Orsi 1993, Schievink 1996, Ishii 2001, Mercado 2002, Ahmetoğlu 2003, Connolly 2003, Cowan 2004, Hudaoglu 2006, Kan 2007]. A wide range for the incidence of IAs in patients with CoA has been reported starting from 2.5% [Abbott 1928] to as high as 50% [Shearer 1970]. All quoted figures nevertheless are above the estimated incidence of 1-2% of IAs in general population. It is however found by Connolly and colleagues in their recent study that the frequency of IAs among patients with CoA is approximately 5 times higher that of the general population [Connolly2003]. Apart from that the incidence of IA rupture in CoA patients (4.8%) [Reifenstein1947] also outnumbers the estimated rate of rupture in the general population, which is less than 1% [Weir1996]. In spite of CoA being a well-established risk factor for IA formation [Eppinger1871, Abbott1928, Walton1956, Laitinen1960, DuBoulay1965, Patel1971, Orsi1993, Schievink1996, Ishii2001, Mercado2002, Ahmetoğlu2003, Connolly2003, Cowan2004, Hudaoglu2006, Kan2007], the exact underlying mechanisms for this association remain poorly understood. Hypertension [Orsi1993, Walton1956, Stehbens1962, Stehbens1989, DuBoulay1965, Patel1971, Banna1973, Orsi1993, Ishii2001, Ahmetoğlu2003] and developmental errors of neural crest resulting in abnormal vessel wall collagen [Laitinen1960, Schievink1996, Mercado2002, Connolly2003, Cowan2004, Hudaoglu2006, Kan2007] are two main factors thought to facilitate the formation of IAs in presence of CoA. It is surprising to note that in spite of well-established role of WSS in the genesis of IAs [Burleson1996, Gao2008, Morimoto2002, Handa1983, Hashimoto1987,

193
Hashimoto1980, Mantha2006, Meng2007, Wang2009], none of the workers explored this important link in this context. Owing to their direct origin from the pre-coarctation segment of aorta cerebrocephalic arteries are most likely to be affected by the haemodynamic changes occurring in this part of aorta. Secondary to the increased resistance to outflow increased aorto-cranial pressure gradients have been demonstrated by a number of authors correlating to the severity of stenosis [Gupta1951, Abbott1928, Hom2008, Varaprasathan2002, Mohiaddin1993]. Dilatation of cervicocephalic arteries in CoA secondary to this increased pressure gradient is has also been reported [Rowe et al 1964, Abbot1928]. An increase in the radius (r) of cerebral arteries and increased arorto-cranial pressure gradient (ΔP) in CoA are expected to result in an exponential rise in flow-rates (Q) as per the Hagen-Poiseuille’s law (Equation-1), given the viscosity (µ) and length (L) remain constant. 𝑄 = ∆!
!!"𝜋𝑟!............. (Eq-1)
Furthermore, bradicardia coupled with increased stroke volume and cardiac output is a known feature of CoA [Gupta1951]. These increments will further increase the cerebral blood-flow (CBF). An increased flow-rate (Q) on the other hand remains one of the major factors responsible for increased wall shear stress (WSS) in the intracranial arteries (Equation-2). 𝜏 = 4𝜂 !
!!!................. (Eq-2)
Where 𝜏 is WSS and 𝜂 is average blood viscosity. Literature seems to be particularly deficient and controversial on the effects of CoA on cerebral flow-rates. After a thorough search (Pubmed®, Embase® and Google-Scholar™ searched from the year 1800 up to 2009) I could retrieve only two studies done in this field. Whereas, in 1949 Hafkenschiel et al [Hafkenschiel1949] demonstrated a significant increase in cerebral flow-rates in patients with CoA, Rowe and colleagues [Rowe 1964] found no significant differences in the flow-rates before and after the repair of CoA in their study done in 1964. No apparent efforts were done since then to measure the cerebral flow-rates in patients with CoA.

194
Paucity of information about the flow patterns inside the cerebral circulation in presence of CoA provided us a rationale to measure the cerebral flow-rates in the present patient. Furthermore, given the widely accepted importance of haemodynamics in the aetiopathogenesis of IAs [Burleson1996, Gao2008, Morimoto2002, Handa1983, Hashimoto1987, Hashimoto1980, Mantha2006, Meng2007, Wang2009] it is logical to analyse the haemodynamic factors in the coexisting IA of our patient. A better understanding of the aetiopathogenesis of the IA formation and rupture may help clinicians in preventing and treating the disease effectively.
In the current study I preformed pc-MR (phase contrast magnetic resonance) measurements in the cerebral arteries of an IA patient with coexisting CoA and five healthy volunteers followed by an analysis of the different haemodynamic factors inside IA. The possible role of haemodynamics is discussed in this context in a background of relevant literature.
6.4.2 Materials and Methods The study was conducted jointly in the departments of Neurosurgery and Neuroradiology, Royal Hallamshire Hospital, and the Academic Units of Medical Physics, and Radiology, School of Medicine and Biomedical Sciences, University of Sheffield, Sheffield, UK. After obtaining appropriate consent and ethical approval the patient was recruited to the @neurIST project (www.aneurist.org).
6.4.2.1 Clinical details: This 51-years old lady, presented for the first time to cardiovascular surgeons in 1989 at the age of 31 years through obstetric unit. She had hypertension in both her pregnancies but was otherwise asymptomatic. She was a smoker, smoking 10-15 cigarettes per day. On clinical examination, she was generally fit and well with a BP of 160/90. No femoral pulses were palpable and there was an ejection systolic murmur in the aortic area coupled with a continuous machinery murmur at left scapula. She was taking oral antihypertensives (Atenolol and Nifedipine) to control her hypertension. Subsequent investigations including DVI (digital vascular scan) done that time revealed a severe (>80% reduction in diameter) post-ductal aortic coarctation distal to origin of left subclavian artery. X-ray chest showed typical inferior notching of 3rd and 8th ribs, bilaterally. No other congenital anomalies were detected apart from a pseudo-bicuspid aortic valve, without any evidence of regurgitation or stenosis. One year later, the patient was treated with

195
Dacron onlay patch graft (DOPG) repair for her coarctation with an uneventful postoperative recovery.
A follow-up MRI of the heart and great vessels done in July 2004 after 15 years of primary procedure demonstrated evidence of re-coarctation with significant (60-70%) loss of luminal diameter. The stenosis occurred just distal to the origin of left subclavian artery coinciding with the site of
repair. Presence of significant collaterals was also noted along with marginal concentric hypertrophy of left ventricle but satisfactory ejection fraction. A BRUCE treadmill stress test done to evaluate cardiac fitness demonstrated an appropriate exercise tolerance without any chest pain or ECG changes. 24-hour BP monitoring further confirmed a satisfactory BP control (Figure-6.5). Being completely asymptomatic and no signs of cardiac failure whatsoever it was decided to manage her conservatively.
Figure-6.5: 24 hours ambulatory Non-invasive BP (NIBP) monitoring showing satisfactory BP control for both systolic and diastolic values.

196
The patient was referred to the neurosurgeons in May 2007 with complaints of tingling and numbness affecting right side of her face. On further interrogation she gave history of a similar episode three years back resulting in spontaneous resolution, but no other neurological symptoms. On clinical examination she had an unremarkable neurology. An MRI done to investigate it further demonstrated presence of two incidental IAs. First aneurysm was located in the pericallosal artery and was 4.2 mm in maximum diameter. A second small broad necked 1 mm aneurysm was also present at the origin of left anterior temporal artery arising from the proximal left middle cerebral artery (MCA). The findings were further confirmed by a 3D rotational angiogram (3DRA), which apart from two previous IAs, also revealed an approximately 1.8 mm aneurysm in the subclinoid segment of left internal carotid artery (ICA), pointing medially (Figure-6.6). The case was discussed in a multidisciplinary meeting with neuroradiologists and it was found that due to its small neck the pericallosal IA was suitable for coil embolization.
6.4.2.2 3DRA acquisition: All medical images were obtained using rotational acquisition in a Philips® Integris™ Allura machine (Philips® Medical Systems, Best, The Netherlands), producing 100 images in 6 seconds, with 5 ms exposure per image. Voxel size in the reconstructed 3D images was 121 microns with reconstruction matrix of 512x512x512.
Figure-‐6.6: Intracranial aneurysm included in the study shown in (a) circle of Willis (yellow sphere) and (b) in subclinoid part of ICA (arrow)

197
6.4.2.3 Endovascular Interventions: The pericallosal artery aneurysm was coiled under general anaesthetic in May 2008 with GDC® (Guglielmi Detachable Coils) embolization. A 6-French guided catheter was gently placed within the distal right ICA. The aneurysm was catheterized with an Excelsior® SL-10 microcatheter using a Transend® 14 guide-wire (Boston Scientific, USA). The IA was packed satisfactorily using four Micrus® Cerecyte® endovascular bare platinum coils. She made an uneventful recovery from the procedure. Owing to their small size and unsuitability for endovascular coiling (broad neck) remaining two aneurysms were decided to be observed by follow-up MRAs. 6.4.2.4 Flow Measurements & pc-MR protocol: MR imaging was performed at high field strength (Achieva™ 3.0T, Philips® Medical Systems, Best, The Netherlands) using a standard 8-channel, radiofrequency receive-only head coil. The same radiographer imaged the patient and all volunteers to maximize reproducibility of overall acquisition technique. Macroscopic vascular flow and IA location were visualized using a qualitative Time-Of-Flight (TOF) MR angiography sequence (TR=25ms; TE=3.5ms; α=20˚; visualization voxel size=0.39x0.39x1.00mm3). Maximum intensity projections from this 3D dataset were used to define the placement of each quantitative phase-contrast measurement plane perpendicular to the vessel under investigation. A 2D acquisition sequence (TR=8ms; TE=4.4ms; α=10˚; field of view=220x179mm2; in-plane acquisition matrix=128x112; slice thickness=5mm) was used to acquire 40 velocity-encoded ‘time points’ over the cardiac cycle at each vascular location. Vector ECG triggering was used to standardize each quantitative acquisition. The measurements were performed at three locations, both in healthy volunteers and in patient: left proximal ICA, left distal ICA, and left ACA A-1 segment. An appropriate maximum velocity-encoding (VENC) value was chosen (100 cm/sec) for ICA to ensure that appropriate dynamic ranges were sampled in all cases and no phase-aliasing occurred. As proximal vessels geometry has an important influence on intra-aneurysmal haemodynamics [Castro 2006], measurements were taken at a distance of approximately 10 vessel diameters from the aneurysm location. Measurement location in distal vessels was approximately 3 diameters from the IA. Measurements are reported in Table-6.9, and are consistent with boundary conditions (BCs) in the 3D models. The manufacturer’s proprietary post-data-acquisition processing software (Q-Flow™, Philips® Medical Systems,

198
Best, The Netherlands) was used to estimate VFR waveforms at each spatial location. Table-6.9: Radiological characteristics of the IA included in the study, the pc-MR measurements in CoA patient and healthy volunteers along with the locations, types and methods of BC application IA Location, Size* and Neck Size*
Q-flow measurements using pc-MR and BC application
Lt ICA Subclinoid, 1.8mm, 3.1mm
Location of Q-Flow measurements
Q-av-Typical Healthy Volunteers (ml/s)
Q-av-CoA patient (ml/s)
Change (%)
BC location BC type BC Method†
1. Lt ICA Proximal 3.95 5.44 +27.4 1. Lt ICA Proximal
Inlet/ velocity
pc-MR
2. Lt ICA Distal 3.7 5.07 +27.1 2. Lt ICA Distal
Outlet/ velocity
pc-MR
4. Lt ACA 1.2 2.66 +54.9 3. Lt OphthA
Outlet/ pressure
Typical/ population average
NB: Q-av; average blood flow, BC; boundary condition, Lt; left, Rt; right, ICA; internal carotid artery, MCA; middle cerebral artery, OphthA; ophthalmic artery, *size is reported as max diameter. †BC method refers to the analyses based on patient-specific BC from CoA patient.
6.4.2.5 Transthoracic Doppler echocardiography: Flow and pressure measurements were performed using transthoracic Doppler echocardiography (Philips® Sonos™ 5500). The results are reported in Figure-6.9. 6.4.2.6 Numerical 3D models and computational fluid dynamics (CFD) analysis: The @neurIST computational tool-chain was used to reconstruct vessel and aneurysmal geometries, as described by Marzo et al [Marzo 2009]. The 3D transient Navier–Stokes equations were solved by using the finite-control-volume software ANSYS®-CFX™. Blood was assumed to be incompressible, with density ρ=1060 kg/m3 and Newtonian, with viscosity µ=0.0035 Pa·s. The relevant haemodynamic indices were computed (Table-6.10) in the IA located in subclinoid part of left ICA (Figure-6.6) of the patient using the VFR values measured in the patient as BCs. A second analysis was performed with BCs derived from the average VFR values measured in healthy volunteers. Location, type and method of BC applied in the study are indicated in Table-6.9. All analyses were run on two Itanium2® 900MHz 64-bit processors. The average time required to solve one cardiac cycle was approximately 8.6 Hr. 6.4.3 Results On comparing the patient-specific waveforms (Figure-6.7) from CoA patient (red) with that of typical normal individual (blue) it becomes apparent that the VFR waveform in the proximal ICA of CoA patient is higher then the one for the healthy volunteers. This also reflected by the average values reported in Table-6.9 where the flow-rates for the CoA patient are 1.5 times higher (5.44 ml/sec) as compared to the normal healthy individuals (3.62 ml/sec).

199
The flow waveforms further illustrate that the cerebral flow in CoA rises and falls slowly than that of a typical individual but the overall volume over one cardiac cycle is increased from 3.48 ml to 4.54 ml. A new broad hump (arrow-a) is seen just after the original peak (arrow-b). The systolic upstroke is delayed and slow; the peak is broader (between arrows a & b), slightly lower and rounded. The flow during diastole is almost a smooth decline curve (arrow-c) and the notch indicating the beginning of diastole is absent (arrow-d).
0.0
5.0
10.0
0.00 0.20 0.40 0.60 0.80
Q [ml/s]
time [s]
coarctation patient
typical average (n=5)
mean coarctation patient
mean typical avaerage
a
c
d
b
Figure-6.7: A comparison of VFR waveforms from CoA patient (marked-red) measured in proximal ICA and average VFR waveforms from healthy volunteers (marked-blue) in the same location. The flow-rates in presence of CoA are 1.5 times higher (5.44 ml/sec) as compared to the normal healthy individuals (3.62 ml/sec). Solid horizontal lines represent average values of VFR for CoA (red) and typical (blue).

200
The contour plots for haemodynamic indices and their absolute values
Figure-‐6.8: Time-‐averaged WSS (top) and OSI (Oscillatory shear index) (bottom) contour plots in the left subclinoid intracranial aneurysm of CoA patient. Whereas, the areas affected by high WSS are increased in CoA patient (top, right) as compared to healthy volunteers (top, left) the OSI values are minimally changed

201
Table-6.10 below shows the absolute values of WSS, OSI, velocity and pressure for IA, obtained using BCs derived from healthy volunteers and measurements taken in CoA patient by pc-MR. Table-6.10: Absolute values of WSS, OSI, velocity and pressure for IA, obtained using BCs derived from healthy volunteers and measurements taken in CoA patient by pc-MR
Haemodynamic Indices BCs derived from healthy volunteers (without CoA)
BCs derived from patient (with CoA) % difference
Max t-ave velocity (m/s) 0.5 0.72 +44 Space and t-ave velocity (m/s) 0.072 0.097 +35 Max OSI 0.3 0.3 0 Area of WSS below 0.4 Pa (mm2) 0.05 (0.3%) 0.03 (0.2%) -34 Area of WSS above 15 Pa (mm2) 0.4 (0.4%) 3.0 (17.2%) +650 Space and t-ave WSS in aneurysm (Pa) 5.7 9.4 +65 Max pressure on aneurysm wall (mmHg)* 122.4 140.8 +15 Area of elevated pressure (mm2)* 3.0 (17.1%) 1.5 (8.5%) -50% NB: WSS; wall shear stress, OSI; oscillatory shear index, Max; maximum, ave; average, t; time, BC; boundary condition, * indicates the values at peak systole

202
Figure-6.9: Transthoracic Doppler echocardiogram showing aortic coarctation with a diastolic tail. A coarctation gradient of 30-40mmHg was seen (arrowhead) while the average aortic pressure was 16mmHg. The peak velocity in aorta was 276cm/sec.

203
6.4.4 Discussion The CoA is a connective tissue disorder accounting for 10% cases of congenital heart disease [Verheugt 2008]. The most common site of narrowing is distal to the left subclavian artery. Due to the mechanical outflow obstruction and extensive collateral formation a number of haemodynamic changes are seen in CoA. The most notable is a differential hypertension produced in the segment of aorta above the site of narrowing leading to increased aorto-cranial pressure gradients [Gupta1951, Abbott1928, Hom2008, Varaprasathan2002, Mohiaddin1993] and dilatation of cervicocephalic arteries [Rowe et al 1964, Abbot 1928]. The similar changes were seen in our patient (Figure-6.9). A pressure gradient of 30-40 mmHg was present at the site of coarctation. The peak velocity in aorta was also increased to 276 cm/sec as against the peak velocity of 80-90 cm/sec in the aorta of a normal person [Daley 1985]. As discussed in the previous sections, it is hypothesized here that the CBF in CoA patients should increase as a consequence of these changes. It is surprising to see that such little attention is devoted on the effects of CoA on CBF. The first available study on the subject was conducted by Hafkenschiel et al [Hafkenschiel1949] in 1949. They measured CBF and cerebral oxygen consumption in two patients with CoA using nitrous oxide (NO) saturation method. They found that the CBF in patients with CoA was higher as compared to normal subjects. A similar study was done by Rowe and colleagues [Rowe 1964] in 1964 that measured the CBF in 20 CoA patients using the same technique. The CBF was measured in these patients before and after the surgical correction of CoA and the results were compared with CBF values obtained in normal subjects in their previous study [Rowe 1959], as well as CBF values specific to hypertensive patients [Crumpton 1955]. No significant differences were noted in the CBF pre and post surgical repair of coarctation and, between CoA patients and hypertensive patients. Interestingly, whereas authors conclude that there were no significant differences in the CBF in CoA patients and healthy volunteers, the values of average CBF measured by them (63±13 ml/100 gm/ min) were approximately 21.2% higher compared to the CBF measured by same authors in 8 normal subjects (52±12 ml/100 gm/ min) [Rowe 1959] using same methodology. Apart from that, the postoperative measurements in the study were taken at an average interval of 21 months (maximum 9.25 yrs.) from the time of surgery. Re-coarctation is a frequent complication of the coarctation surgery that can occur in 41-86% patients [Hesslein 1981]. The similar patterns were observed in our patient where 60-70% loss of luminal diameter occurred 14 years after repair. As Rowe and colleagues

204
did not assess the diameter of aorta at the time of CBF measurements, the possibility of re-coarctation in these patients cannot be ruled out which might account for the lack of difference in the CBF before and after surgical correction. Moreover, being over 40-60 years old, the measurements in both the studies were performed using the oldest available technique based on NO diffusion and Fick’s principle introduced by Kety and Schmidt in 1951 [Kety 1951]. The technique has several limitations. Apart from being cumbersome and difficult to perform, it only provides the measurements of global CBF rather than the regional values. The accuracy of measurements is dependent upon the reliability of the blood sample withdrawn from a single jugular vein, which can be influenced by the flow variations in dural sinuses and torcula [Joseph 2000]. With the advent of technology, the technique of CBF measurement has evolved tremendously. The use of pc-MR in this context is gaining a rapid popularity [Ueda 1999, Rordorf 1999, Buijs 1998, Enzmann 1993, Enzmann 1994, Yamashita 2007]. The CBF can be measured using this technique in a simple non-invasive manner without the need of any intravenous contrast administration and has been validated widely by means of in vitro and in vivo experiments [Caputo 1991, Kondo 1991, Evans 1993, Bakker 1995]. Apart from that, both the studies provide the estimation of global CBF in CoA patients. The recent evidence however indicates that it is the local variations in the haemodynamics that play an important role in the aetiopathogenesis of IAs [Gao 2008, Morimoto 2002, Handa 1983, Hashimoto 1987, Hashimoto 1980, Mantha 2006, Meng 2007, Wang 2009] highlighting the importance of assessing the local CBF. No previous study however has examined the local CBF in presence of CoA. According to the Hagan-Poiseuille’s law I hypothesised that the local CBF should increase in patients with CoA. The results from current study demonstrate that my hypothesis is correct and the regional blood-flow in ICA and ACA of CoA patient was 27.1 to 54.9% higher (Table-6.9) when compared to healthy volunteers. Keeping in line with the increased flow-rates in the cerebral arteries in presence of CoA (Table-6.9) the space and time averaged velocity and max time average velocities inside the coincidental IA present in the same patient were also increased by 35-44% (Table-6.10) when the BCs specific to CoA were used. I further hypothesize that this increased regional CBF can be an important contributory factor in the increased incidence of IAs in presence of CoA.

205
The possible mechanisms responsible for increased incidence of IAs in CoA patients are explored in the further sections of this manuscript. Eppinger was the first person to draw attention towards the association between CoA and IAs in 1871 [Eppinger 1871]. Whereas the exact mechanisms responsible for this increased incidence remained obscure, arterial hypertension (HTN) has been suggested as a possible underlying cause by most of the authors (Table-6.11) [Stehbens 1989, 1962, Walton 1956, Patel 1971, Banna 1971, Orsi 1993, Ishii2001, Ahmetoğlu 2002]. Stehbens was the strongest proponent of this theory who particularly stressed on the importance of hypertension in this context while denying the role of all other factors including vessel wall abnormalities [Stebehns 1989, 1962]. This assumption is probably based on two observations. First, HTN is often a constant feature in CoA patients. Second, HTN has been considered as a major risk factor for the development of IAs even without CoA [de la Monte 1985, Taylor 1995]. In spite of an increased prevalence of IAs in hypertensive patients many authors have questioned the role of HTN in this context. McCormick and Schmalstieg found no relationship between arterial HTN and IAs in 250 patients they studied [McCormick 1977]. In a similar study conducted in 212 cases Andrews and Spiegel [Andrews 1979] did not find significant elevation in the blood pressure in patients with IAs compared with the general population. However, studies supporting HTN as a risk factor for the development and rupture of IAs outnumber the studies refuting it. De la Monte et al [de la Monte 1985] found high degree of correlation (p<0.001) between systemic hypertension and development of saccular IAs. In one of the largest studies conducted including 20,767 elderly patients Taylor et al [Taylor 1995] found HTN as an independent major risk factor for aneurysmal SAH. It is argued here that whereas HTN can be an important contributory force in the aetiopathogenesis of IAs in these patients, it cannot be the sole perpetrator. Hudaoglu et al [Hudaoglu 2006] raised a question on HTN alone being a factor in the aetiopathogenesis of IAs in CoA patients. The fact is further supported by the observation that IAs may develop or rupture even in normotensive patients, years after the repair of CoA [Mercado2002, Forfang 1979, Laborde 1983, Ostergaard 1983]. Apart from that, HTN was not uniformly noted in the patients of CoA reported to have IAs [Connolly2003, Schievink1996]. The IAs were developed in our patient 17 years after the surgical correction of CoA. However, re-coarctation of the repaired segment occurred during this period (>70% reduction in aortic diameter), the patient remained completely

206
asymptomatic with a very well controlled blood pressure (Figure-6.5). My findings also indicate towards the presence of the some factors working independently of arterial HTN. In their study conducted in 1960 Laitinen and Snellman [Laitinen1960] found that apart from CoA, aneurysms of Pericallosal artery region were also associated with other concomitant malformations such as craniosynostosis and kyphoscoliosis. They believed that coexistence of these malformations with IAs is secondary to a common developmental error-playing role in their aetiology. Embryologically- heart, aorta and cervicocephalic arteries all share a common origin from neural crest. After recognizing the association between a variety of congenital heart diseases and IAs, Schievink et al [Schievink1996] attributed the occurrence of IAs in CoA patients to the developmental errors of neural crest resulting in abnormal vessel wall collagen. The same theory was later supported many other authors (Table-6.11) [Mercado2002, Connolly2003, Cowan2004, Hudaoglu2006, Kan2007]. Haemodynamic stress due to increased blood flow has long been implicated in the pathogenesis of IAs. Development of IAs is reported in association with a wide range of conditions responsible for increased flow related WSS. Padget was first to draw attention towards the relationship between anatomical variations in CoW and increased incidence of IAs [Padget 1944]. The similar findings were confirmed by other workers [Riggs 1943, Stehbens 1963, Alpers 1963]. Kayambe et al [Kayambe 1984] observed that there was a definitive correlation between the site of vascular asymmetry and the location of IA formation. This increased incidence of IAs in presence of vascular asymmetry is thought to be caused by increased haemodynamic stress secondary to compensatory increase in blood flow [Kayambe 1984, Stehbens 1963, Stehbens 1972]. Iatrogenic carotid artery (ICA) ligation is a well-established technique to produce IAs in experimental animals [Jamous 2007, Handa 1983, Hashimoto 1987, Hashimoto 1978, Nagata 1980]. Increased haemodynamic shear stress has been considered a major factor in the production of these experimental IAs [Gao 2008, Jamous 2007, Handa 1983, Hashimoto1987, Hashimoto1987, Nagata 1980]. Apart from the carotid ligation, induced hypertension and administration of BAPN (beta aminopionitrile; a lathyrogen used to render arterial walls fragile), have also been common adjuncts of these experiments. One might argue here on the importance of haemodynamic shear stress on the development of

207
these IAs in these situations. In order to test this assumption Handa et al [Handa 1983] divided their experimental animals into three cohorts: no carotid ligation, unilateral carotid ligation and bilateral carotid ligation. Whereas, all rats were made hypertensive and fed on BAPN, no IA was induced where carotid artery was not ligated. Furthermore, the IAs were always formed corresponding to the sites where haemodynamic stress was expected to increase after carotid ligation.

Table-6.11: A comprehensive review of different mechanisms proposed for the increased incidence of IAs in CoA patients Author/ Year No. of
Patients IA location/ No.
HTN at the time IA diagnosed
Associated features Proposed Mechanism(s)
Abbot (1928) 6 ACA, AComA, VA, PcomA, MCA
Yes Reported one case of his own (MCA), rest 5 cases collected from literature
Congenital IA
Laitinen et al (1960)
1 Pericallosal/ Callosomarginal
Yes Oxycephalic deformity of skull Possible developmental errors
Patel et al (1971)
7 ICA, AComA (3), ACA (3), PcomA, BA
Yes Only pediatric population (<19 yrs.) reviewed, 12% had CoA coexisting with IAs
HTN
Banna et al (1971)
1 PCA NA Source of SAH was dilated spinal collaterals
Medial hypoplasia of arteries of CoW + HTN
Stehbens (1989)
Review article HTN
Orsi et al. (1993)
1 MCA, ICA NA - HTN
Schievink et al (1996)
1 MCA No - Development errors of Neural Crest leading to defective collagen and elastin formation
Ishii et al (2001)
1 AComA Yes Coarctation of abdominal aorta HTN
Ahmetoğlu et al (2002)
1 B/L MCA Yes Coarctation of abdominal aorta HTN ± Haemodynamic shear stress
Mercado et al. (2002)
3 ICA, PcomA (2), PeriA
Yes Provided a comprehensive review of the distinct clinical behavior of IAs in presence of CoA
Development errors of Neural Crest
Connolley et al (2003)[
10 ICA, MCA, PICA, PCA, PcomA, AChoA, BA tip
Yes (in 7 out of 10 patients)
Found 10% incidence of IAs in patients with CoA, no significant difference in BP of patients with and without IAs
Development errors of Neural Crest
Cowan et al (2004)
1 PcomA No Coexisting Alagille syndrome (arteriohepatic dysplasia), Progression of infundibulum to PcomA Aneurysm
Developmental defects
Harikrishnan (2005)
1 BA, VA Yes CoA of Descending aorta, coronary artery aneurysms
Atherosclerosis
Hudaoglu et al (2006)
1 PcomA No Raised strong suspicions about HTN alone being a factor for the increased incidence of IA in CoA
Development errors of Neural Crest
Kan et al (2007)
1 ICA NA Fusiform aneurysm associated with PHACES syndrome, positive family history of IAs
Development errors of Neural Crest
Singh et al (2009) (Present study)
1 ICA, MCA, PeriA
No Measured the CBF in CoA patient and proposed WSS as an important factor in the formation of IAs in these patients
Haemodynamic WSS
NB: PHACES syndrome; posterior fossa malformations, facial haemangiomas, arterial anomalies, CoA, cardiac defects, eye abnormalities and sterna defects, NA; not available, B/L; bilateral, CoW; circle of Willis, BP; blood pressure, PeriA; pericallosal artery, AChoA; anterior choroidal artery, PCA; posterior cerebral artery, BA; basilar artery, VA; vertebral artery, PICA; posterior inferior cerebellar artery

209
Congenital absence of ICA [Chen 2008, Suyama 2009, Horie 2008], arteriovenous malformations (AVMs) [Meisel 2000, Redekop 1998, Thompson 1998], Takayasu’s arteritis [Takayama 2008, Kanda 2004], Moyamoya disease [Kawaguchi 1996, Konishi 1985, Adams 1979] and presence of persistent fetal circulation [Zada 2008, Ali 2007, Li 2004] are other similar conditions where increased IAs are encountered due to flow related WSS. Development of IAs has also been observed following extra-intracranial bypass procedures [Kurokawa 2007, Nishimoto 2005, Fleischer 1979], again secondary to increased CBF. Resolution of these flow related IAs could occur once the cerebral haemodynamics is reestablished by addressing the underlying pathology [Takahashi 1997, Peltier 2008]. It is surprising to see that in spite of its very well established role in the aetiopathogenesis of IAs, nobody discussed the importance of haemodynamic WSS in this context. Ahmetoğlu et al (2002) indicated that arterial wall injury secondary to increased haemodynamic shear forces may be an important factor in the IA formation while discussing their case of abdominal aortic coarctation (AbCoA). However, the statement probably reflects their opinion towards the aetiopathogenesis of IAs in general population rather than in patients with CoA. Furthermore, the inference of was merely based on the literature based evidence rather than any experimental work. They finally concluded that hypertension was the main factor responsible for the rupture and growth of IAs in patients with AbCoA [Ahmetoğlu 2002]. I hypothesize that the higher WSS values secondary to increased flow-rates in cerebral circulation can be an important contributory factor in the pathogenesis of IAs in presence of CoA. WSS is a frictional force exerted tangentially on the arterial endothelium by flowing blood. It is proportional to the blood viscosity and velocity gradients. The average physiological range of arterial WSS has been suggested to lie between 1.5-2.0 Pa by Malek et al [Malek 1999]. It is widely accepted now that damage to the arterial and subsequently aneurysmal wall by haemodynamic forces plays a crucial role in the aetiopathogenesis of IAs [Burleson 1996, Gao 2008, Morimoto 2002, Handa 1983, Hashimoto1987, Hashimoto1987, Mantha 2006, Meng 2007, Wang 2009]. High supra-physiological and low infra-physiological values of WSS have been associated with initiation, growth and rupture of aneurysms [Malek 1999, Burleson 1996, Gao 2008, Morimoto 2002, Handa 1983, Hashimoto1987, Hashimoto 1987, Mantha 2006, Meng 2007, Wang 2009]. The values of space and time averaged WSS as well as the area affected by supraphysiological WSS (>15Pa) were increased in our patient by 65%

210
and 650%, respectively (Table-6.10). This exponential rise in the high supraphysiological WSS may play an important role in the aetiopathogenesis of IAs in patients with CoA. Various authors have tried to explain the underlying mechanisms involved in the WSS induced vascular remodeling. The normal endothelial cell (EC) function and structure are regulated by WSS through a process called mechanotransduction [Davies 1993, Davies 1995]. The shear stress is sensed by a number of mechanoceptors including basal adhesion points of ECs, cell junctions and nuclear membrane [Davies 1993, Davies 1995]. WSS also activates stretch-sensitive ion channels such as phospholipids and integrins in cellular membrane [Davies 1993, Davies 1995]. Increased production of matrix metalloproteinase (MMP-13) by ECs has been demonstrated after their prolonged exposure to high WSS, which, in turn, leads to degeneration of the internal elastic lamina [Sho et al [69]]. It has been demonstrated by a number of workers [Cooke 1990, Fukuda 2000, Pohl 1991] that WSS increases endothelial production of nitric oxide (NO) by inducing an enzyme responsible for its synthesis (iNOS; inducible nitric oxide synthase). Fukuda et al [Fukuda 2000] found a high concentration of iNOS at the site of IA formation, in both rat and human arteries and concluded that iNOS is a prerequisite for de novo development of IAs in cerebral vessels. In 1995, Wang et al [Wang 1995] showed that smooth muscle cells (SMCs) in arterial wall can also respond to WSS in intact arteries by virtue of interstitial flow generated by transmural flow gradients, further accentuating the vessel wall damage. In addition to WSS, oscillatory shear index (OSI) has also been recognized as an important haemodynamic factor in the aneurysmal pathogenesis [Glor 2003, 2004, Goubergrits 2008, He 1996, Mantha 2006]. It is measure of the oscillatory nature of shear forces [Glor 2003, 2004, Goubergrits 2008, He 1996, Mantha 2006]. This index, which has a range of between 0 and 0.5, represents the fraction of the cardiac cycle over which the instantaneous shear force vector forms an angle greater than 90 degrees to the time-average direction of the same force. Consistently high values of OSI have been associated with EC dysfunction [He et al 1996]. Changes in cell structure secondary to cyclic mechanical stress have been demonstrated by Wang et al [Wang et al 1995] resulting in disruption of the actin cytoskeleton of ECs. Glor and colleagues propose 0.2 as a threshold value for OSI above which endothelial damage is initiated [Glor et al 2003, 2004]. Whereas, no change was observed in the maximum OSI in presence of CoA (Table-6.10), the values obtained from both analyses (0.3) remained above this critical threshold. This indicates towards the

211
possible role of high OSI in the EC damage in patients with IAs irrespective of presence or absence of CoA. Apart from being a known risk factor for the formation of IAs, CoA has also been associated with increased incidence of IA rupture [Mercado 2002, Connolly 2003, Hudaoglu 2006, Weir 1996]. No satisfactory explanation is provided for this increased association. This increased tendency for early aneurysmal rupture can possibly be explained by analyzing the haemodynamic factors computed for our patient (Table-6.10). Whereas the values for maximum pressure on IA wall have increased by 15% in the patient with CoA, the area affected by high pressure is actually decreased by 50%. It means that CoA increases pressure applied per unit area. In other words, the pressure on the IA wall is more concentrated in nature in presence of CoA and may be an important underlying factor affecting the early aneurysmal rupture. Apart from that, high supra-physiological values of WSS have also been associated with endothelial cell dysfunction [Burleson et al. 1996, Handa et al 1996, Hashimoto et al 1978, Hashimoto et al 1980, Hashimoto et al 1987, Malek et al 1999, Mantha et al 2006, Meng et al 2007, Morimoto et al. 2002 Singh et al 2009, Wang et al 1995]. The exponential rise (by 650%) in the area affected by high supra-physiological WSS (>15Pa) may also play a role in early IA rupture in the patient with CoA. 6.4.5 Limitations of the study Due to technical limitations, I could not perform extensive measurements in cerebral arteries other than ICA and ACA. It is however expected that the CBF will be increased in other arteries as well provided other parameters in the Hagan-Poiseuille’s equation remain constant. The current study therefore reflects the need of further studies performed on bigger cohort of patients with CoA. Moreover, as stated above the IAs are likely to share a multifactorial aetiology. Two other known risk factors in the formation of IAs are HTN and smoking. Whereas, our patient remained completely normotensive after the repair of her CoA (Figure-6.9) she had had high BP prior to surgery, managed by antihypertensives. Apart from that, she was also a chronic smoker smoking 10-15 cigarettes per day. The possibility of HTN and smoking playing some role in the formation of her IAs therefore cannot be ruled out. 6.4.6 Conclusions My study demonstrates that the cerebral flow-rates in CoA patients are significantly higher when compared to average flow-rates in healthy

212
population. Furthermore, the values of space and time averaged WSS as well as the area affected by supraphysiological WSS (>15Pa) were increased in our patient by 65% and 650%, respectively. The values of maximum OSI however, remained unaffected by the presence of CoA. Increased haemodynamic WSS secondary to the increased flow-rates may play an important role in the pathogenesis of IAs in CoA patients. The increased per unit pressure on aneurysmal wall in CoA patients may be an important underlying factor affecting the early aneurysmal rupture. IAs can develop in patients with CoA years after the surgical repair. I recommend that a high index of suspicion should be kept and all CoA patients should be carefully examined and followed-up by MRA for the possible presence of co-existing IAs. The lack of clear knowledge about the cerebral blood-flow in CoA patients and the existing controversies in the aetiopathogenesis of IAs in these patients emphasizes the importance of this study.

213
Despite improvements in surgical and medical management, aneurysmal subarachnoid hemorrhage (SAH) remains a major cause of morbidity and mortality in neurosurgical patients. The current protocols used to treat the unruptured IAs are inadequate to provide clear guidelines, as they themselves remain descriptors for the poor prognosis for an intervention. In order to offer the best possible treatment to the patient with the least side effects, formulation of clear management protocols, directed by the natural history of unruptured IAs and, the risks associated with the active management, is required. Whereas, the aetiopathogenesis of IA formation and rupture remains multifactorial, consistent with studies performed by other researchers, my work indicates haemodynamics playing an important role. An evaluation of patient-specific haemodynamic indices can provide a useful alternative to predict the behavior of an unruptured IA at an early stage. In spite of their ability of guiding the correct management of IAs, limitations in current technology significantly restricts our ability to measure these haemodynamic indices in routine clinical practice. My studies demonstrate that Computational Fluid Dynamics (CFD) can provide a useful alternative to predict blood flows where detailed in vivo measurement of haemodynamic flow variables is not possible. European Commission funded Project @neurIST was the first project of it’s kind that brought together a number of multidisciplinary professionals from 32 European institutions and developed state of the art tools for personalised risk assessment and treatment IAs using CFD. These tools have been constantly improved and amended in the light of feedback gathered from their controlled exposures conducted world over, as described in the manuscript. However, need of a well-designed Randomized Controlled Trial in this context cannot be overemphasized, before these tools can be accepted by clinicians and patients. In my study on the validation of different concepts used in CFD, I demonstrated that there is no added advantage of complex Womersley-‐flow-‐profile over the much simpler plug-‐flow profile. One of my studies on initiation and rupture of IAs showed that the haemodynamic patterns of IAs during these two phases are significantly
CHAPTER 7.0: CONCLUSIONS AND FUTURE WORK
214
different. Whereas, values of t-av-WSSmin and areas affected by supra-physiological WSS were higher in preaneurysmal lesion the corresponding values were lower in ruptured IA. The area affected by infra-physiological WSS (<0.4Pa) was significantly higher in ruptured lesion as compared to preaneurysmal IA. Furthermore, heparin induces significant derangements in the haemodynamics of both, preaneurysmal as well as ruptured IA. In the light of current evidence, it is expected that whereas on the one hand such alterations in haemodynamics may facilitate the rupture of existing IAs, on the other hand they may suppress the formation of new IAs. Similar effects may be associated with other pharmacological agents, warranting further investigations. Another study on Modeled vs. Patient-Specific Boundary Conditions demonstrated significant differences in the results obtained with these two methods. These are largely attributable to the underlying differences in the waveforms (similar peak but higher mean flow was observed in the measured values). It is most likely that in future patient-specific BCs will be provided as a part of the routine clinical procedure. The results of this study show that the 1D circulation model adopted by @neurIST performs better than other approaches found in the literature and offers a viable means to find correlation with rupture in large cohort size studies. In the study on the effects of hypertension and smoking on the haemodynamic indices of an IA it was observed that when the high values of blood viscosity were used the values of WSS and OSI have increased significantly. In the interesting study performed on Coarctation of Aorta (CoA), it was demonstrated that the cerebral flow-rates in CoA patients were significantly higher when compared to average flow-rates in healthy population. Furthermore, the values of space and time averaged WSS as well as the area affected by supraphysiological WSS (>15Pa) were increased in our patient by 65% and 650%, respectively. The values of maximum OSI however, remained unaffected by the presence of CoA. Increased haemodynamic WSS secondary to the increased flow-rates may play an important role in the pathogenesis of IAs in CoA patients. The increased per unit pressure on aneurysmal wall in CoA patients may be an important underlying factor affecting the early aneurysmal rupture. Due to the relatively low incidence of CoA in general population (1 in 5000) it may be difficult for the neurosurgeons and interventional neuroradiologists to get an opportunity to observe a case of IA coexisting with CoA. Moreover, IAs can develop in patients with CoA years after the

215
surgical repair. I recommend that a high index of suspicion should be kept and all CoA patients should be carefully examined and followed-up by MRA for the possible presence of co-existing IAs. The lack of clear knowledge about the cerebral blood-flow in CoA patients and the existing controversies in the aetiopathogenesis of IAs in these patients emphasizes the importance of this study. In terms of future applications of the CFD in clinical practice there are a number or practical challenges that we will have to address before this dream could be realized. One of the most important factors is the validation of these tools in the field. Whereas, the CFD has been extensively validated and is a very well established technique in other fields, its validations in the field of Intracranial Aneurysms still in a preliminary stage. As reflected by the feedback form the workshops I conducted, mistrust shown by the clinicians in the CFD results clearly indicates the need for validations. Before any technology or technique can be freely applied in clinical practice, one of the important prerequisite is conducting multi-centric, trials. Once the tools have been validated robustly and we are past the stage of mistrust, the second stage therefore will be need of a well designed multi-centric double blinded, randomized controlled clinical trial on a big cohort of patients. This again can be quite challenging especially due to the ethical issues related to making decisions of non-intervention treatment that can lead to the rupture of an aneurysm that obviously carries very high risk of mortality and morbidity. This can also lead to huge selection bias due to inherent inclination of clinicians to assign patient to the treatment group as against conservative. Apart form that, due to very long natural history of the Unruptured IAs, relatively longer period of observation will be required before any sensible conclusions can be drawn. All these factors can make logistics of conducting the clinical trails a herculean task. However, in spite of all these challenges and limitations, the expected significant improvements in the outcome of the IA treatment when guided by CFD predictions, make this painstaking task worth accomplishing.

216
Anonymous @neurist "integrated biomedical informatics for the management of cerebral aneurysms" In: Annex 1 - v6.1. Sixth Framework Programme PIST (Ed) Barcelona, Spain (2007). Project Identifier: IST-2004-027703. ISUIA (1998). Unruptured intracranial aneurysms--risk of rupture and risks of surgical intervention. International study of unruptured intracranial aneurysms investigators. N Engl J Med (1998) 339(24):1725-1733.
A Abbott ME: Coarctation of aorta of adult type: II. A statistical study and historical retrospect of 200-recorded cases, with autopsy, of stenosis or obliteration of the descending arch in subjects above the age of two years. Am Heart J (1928) 3):392-421. Abruzzo T, Tun T, Sambanis A: Efficient transmicrocatheter delivery of functional fibroblasts with a bioengineered collagen gel-platinum microcoil complex: Toward the development of endovascular cell therapy for cerebral aneurysms. AJNR Am J Neuroradiol (2007) Sep;28(8):1586-1593. Acevedo-Bolton G, Jou LD, Dispensa BP, Lawton MT, Higashida RT, Martin AJ, Young WL, Saloner D: Estimating the haemodynamic impact of interventional treatments of aneurysms: Numerical simulation with experimental validation: Technical case report. Neurosurgery (2006) 59(2):E429-430; author reply E429-430. Adams HP, Jr., Kassell NF, Wisoff HS, Drake CG: Intracranial saccular aneurysm and moyamoya disease. Stroke (1979) 10(2):174-179. Adamson J, Humphries SE, Ostergaard JR, Voldby B, Richards P, Powell JT: Are cerebral aneurysms atherosclerotic? Stroke (1994) 25(5):963-966. Aenis M, Stancampiano AP, Wakhloo AK, Lieber BB: Modeling of flow in a straight stented and nonstented side wall aneurysm model. J Biomech Eng (1997) 119(2):206-212.
CHAPTER 8.0 REFERENCES

217
Agarwal R: Computational fluid dynamics of whole-body aircraft. Annu Rev Fluid Mech (1999) 31(125-169. Ahmetoğlu A, Koşucu, P. Sari, A. Gümele, HR.: Abdominal aortic coarctation associated with multiple intracranial aneurysms. European Journal of Radiology (2003) Extra (46)(38-41. Alpers BJ, Berry RG: Circle of Willis in cerebral vascular disorders. The anatomical structure. Arch Neurol (1963) 8(398-402. Ali S, Walker MT: Bilateral persistent trigeminal arteries associated with bilateral carotid aneurysms. J Vasc Interv Radiol (2007) 18(5):692-694. Alfano JM, Kolega J, Natarajan SK, Xiang J, Paluch RA, Levy EI, Siddiqui AH, Meng H: Intracranial aneurysms occur more frequently at bifurcation sites that typically experience higher haemodynamic stresses. Neurosurgery (2013) Jun 10. [Epub ahead of print] Alnaes MS, Isaksen J, Mardal KA, Romner B, Morgan MK, Ingebrigtsen T: Computation of haemodynamics in the circle of Willis. Stroke (2007) 38(9):2500-2505. Anderson JDJ: Computational fluid dynamics: The basics with application. McGraw-Hill, New York, USA (1995). Anderson CS, Feigin V, Bennett D, Lin RB, Hankey G, Jamrozik K: Active and passive smoking and the risk of subarachnoid hemorrhage: An international population-based case-control study. Stroke (2004) 35(3):633-637. Ando J, Komatsuda T, Kamiya A: Cytoplasmic calcium response to fluid shear stress in cultured vascular endothelial cells. In Vitro Cell Dev Biol (1988) 24(9):871-877. Andrews RJ, Spiegel PK: Intracranial aneurysms. Age, sex, blood pressure, and multiplicity in an unselected series of patients. J Neurosurg (1979) 51(1):27-32. Aoki T, Kataoka H, Morimoto M, Nozaki K, Hashimoto N: Macrophage-derived matrix metalloproteinase-2 and -9 promote the progression of cerebral aneurysms in rats. Stroke (2007) 38(1):162-169.

218
Aoki T, Kataoka H, Moriwaki T, Nozaki K, Hashimoto N: Role of timp-1 and timp-2 in the progression of cerebral aneurysms. Stroke (2007) 38(8):2337-2345. Aoki T, Kataoka H, Ishibashi R, Nozaki K, Hashimoto N: Nifedipine inhibits the progression of an experimentally induced cerebral aneurysm in rats with associated down-regulation of nf-kappa b transcriptional activity. Curr Neurovasc Res (2008) 5(1):37-45. Aoki T, Kataoka H, Ishibashi R, Nozaki K, Hashimoto N: Simvastatin suppresses the progression of experimentally induced cerebral aneurysms in rats. Stroke (2008) 39(4):1276-1285. Aoki T, Kataoka H, Ishibashi R, Nakagami H, Nozaki K, Morishita R, Hashimoto N: Pitavastatin suppresses formation and progression of cerebral aneurysms through inhibition of the nuclear factor kappab pathway. Neurosurgery (2009) 64(2):357-365; discussion 365-356. Atkinson JL, Sundt TM, Jr., Houser OW, Whisnant JP: Angiographic frequency of anterior circulation intracranial aneurysms. J Neurosurg (1989) 70(4):551-555.
B Baek H, Jayaraman MV, Richardson PD, Karniadakis GE: Flow instability and wall shear stress variation in intracranial aneurysms. Journal of the Royal Society, Interface / the Royal Society (2010) 7(47):967-988. Bakker CJ, Kouwenhoven M, Hartkamp MJ, Hoogeveen RM, Mali WP: Accuracy and precision of time-averaged flow as measured by nontriggered 2d phase-contrast mr angiography, a phantom evaluation. Magn Reson Imaging (1995) 13(7):959-965. Balossino R, Pennati G, Migliavacca F, Formaggia L, Veneziani A, Tuveri M, Dubini G: Computational models to predict stenosis growth in carotid arteries: Which is the role of boundary conditions? Computer methods in biomechanics and biomedical engineering (2009) 12(1):113-123. Banna MM, Rose PG, Pearce GW: Coarctation of the aorta as a cause

219
of spinal subarachnoid hemorrhage. Case report. J Neurosurg (1973) 39(6):761-763. Bark DL, Jr., Ku DN: Wall shear over high degree stenoses pertinent to atherothrombosis. J Biomech (2010) 16(43(15)):2970-2977. Baskurt OK, Meiselman HJ: Blood rheology and haemodynamics. Semin Thromb Hemost (2003) 29(5):435-450. Beckman JS, Beckman TW, Chen J, Marshall PA, Freeman BA: Apparent hydroxyl radical production by peroxynitrite: Implications for endothelial injury from nitric oxide and superoxide. Proc Natl Acad Sci U S A (1990) 87(4):1620-1624. Bernardini A, Larrabide I, Morales HG, Pennati G, Petrini L, Cito S, Frangi AF: Influence of different computational approaches for stent deployment on cerebral aneurysm haemodynamics. Interface focus (2011) 1(3):338-348. Bhagyalakshmi A, Frangos JA: Mechanism of shear-induced prostacyclin production in endothelial cells. Biochem Biophys Res Commun (1989) 158(1):31-37. Bonert M, Myers JG, Fremes S, Williams J, Ethier CR: A numerical study of blood flow in coronary artery bypass graft side-to-side anastomoses. Ann Biomed Eng (2002) 30(5):599-611. Bonita R: Cigarette smoking, hypertension and the risk of subarachnoid hemorrhage: A population-based case-control study. Stroke (1986) 17(5):831-835. Bordas R, Seshadhri S, Janiga G, Skalej M, Thevenin D: Experimental validation of numerical simulations on a cerebral aneurysm phantom model. Interventional Medicine & Applied Science (2012) 4(4):13. Born GV, Palinski W: Unusually high concentrations of sialic acids on the surface of vascular endothelia. Br J Exp Pathol (1985) 66(5):543-549. Boussel L, Rayz V, McCulloch C, Martin A, Acevedo-Bolton G, Lawton M, Higashida R, Smith WS, Young WL, Saloner D: Aneurysm growth occurs at region of low wall shear stress: Patient-specific correlation of haemodynamics and growth in a longitudinal study. Stroke (2008)

220
39(11):2997-3002. Bove EL, Migliavacca F, de Leval MR, Balossino R, Pennati G, Lloyd TR, Khambadkone S, Hsia TY, Dubini G: Use of mathematic modeling to compare and predict haemodynamic effects of the modified blalock-taussig and right ventricle-pulmonary artery shunts for hypoplastic left heart syndrome. J Thorac Cardiovasc Surg (2008) 136(2):312-320 e312. Brooks B: The treatment of traumatic arteriovenous fistula. South Med J (1930) 23(100 –106. Broderick JP, Viscoli CM, Brott T, Kernan WN, Brass LM, Feldmann E, Morgenstern LB, Wilterdink JL, Horwitz RI: Major risk factors for aneurysmal subarachnoid hemorrhage in the young are modifiable. Stroke (2003) 34(6):1375-1381. Brugger W, Imhof P, Muller P, Moser P, Reubi F: Effect of nitroglycerin on blood rheology in healthy subjects. Eur J Clin Pharmacol (1985) 29(3):331-336. Buijs PC, Krabbe-Hartkamp MJ, Bakker CJ, de Lange EE, Ramos LM, Breteler MM, Mali WP: Effect of age on cerebral blood flow: Measurement with ungated two-dimensional phase-contrast mr angiography in 250 adults. Radiology (1998) 209(3):667-674. Burleson AC, Strother CM, Turitto VT: Computer modeling of intracranial saccular and lateral aneurysms for the study of their haemodynamics. Neurosurgery (1995) 37(4):774-782; discussion 782-774. Burleson AC, Turitto VT: Identification of quantifiable haemodynamic factors in the assessment of cerebral aneurysm behavior. On behalf of the subcommittee on biorheology of the scientific and standardization committee of the isth. Thromb Haemost (1996) 76(1):118-123. Bulas D, Egloff A: Benefits and risks of mri in pregnancy. Seminars in perinatology (2013) 37(5):301-304. Busse R, Mulsch A: Calcium-dependent nitric oxide synthesis in endothelial cytosol is mediated by calmodulin. FEBS Lett (1990) 265(1-2):133-136.

221
Butty VD, Gudjonsson K, Buchel P, Makhijani VB, Ventikos Y, Poulikakos D: Residence times and basins of attraction for a realistic right internal carotid artery with two aneurysms. Biorheology (2002) 39(3-4):387-393. Byrne JV, Guglielmi, G.: Endovascular treatment of intracranial aneurysms. Springer, (1998).
C Caputo GR, Kondo C, Masui T, Geraci SJ, Foster E, O'Sullivan MM, Higgins CB: Right and left lung perfusion: In vitro and in vivo validation with oblique-angle, velocity-encoded cine mr imaging. Radiology (1991) 180(3):693-698. Carmichael R: The pathogenesis of noninflammatory cerebral aneurysms. J Pathol Bacteriol (1950) 62(1):1-19. Castro MA, Putman CM, Cebral JR: Computational fluid dynamics modeling of intracranial aneurysms: Effects of parent artery segmentation on intra-aneurysmal haemodynamics. AJNR Am J Neuroradiol (2006) 27(8):1703-1709. Castro MA, Putman CM, Cebral JR: Patient-specific computational fluid dynamics modeling of anterior communicating artery aneurysms: A study of the sensitivity of intra-aneurysmal flow patterns to flow conditions in the carotid arteries. AJNR Am J Neuroradiol (2006b) 27(10):2061-2068. Castro MA, Putman CM, Cebral JR: Patient-specific computational modeling of cerebral aneurysms with multiple avenues of flow from 3d rotational angiography images. Acad Radiol (2006c) 13(7):811-821. Cebral JR, Castro MA, Appanaboyina S, Putman CM, Millan D, Frangi AF: Efficient pipeline for image-based patient-specific analysis of cerebral aneurysm haemodynamics: Technique and sensitivity. IEEE Trans Med Imaging (2005) 24(4):457-467. Cebral JR, Lohner R, Choyke PL, Yim PJ: Merging of intersecting triangulations for finite element modeling. Journal of biomechanics (2001) 34(6):815-819.

222
Cebral JR, Castro MA, Burgess JE, Pergolizzi RS, Sheridan MJ, Putman CM: Characterization of cerebral aneurysms for assessing risk of rupture by using patient-specific computational haemodynamics models. AJNR Am J Neuroradiol (2005) 26(10):2550-2559. Cebral JR, Castro MA, Putman CM, Alperin N: Flow-area relationship in internal carotid and vertebral arteries. Physiol Meas (2008) 29(5):585-594. Cebral JR, Hendrickson S, Putman CM: Haemodynamics in a lethal basilar artery aneurysm just before its rupture. AJNR Am J Neuroradiol (2009) 30(1):95-98. Cebral JR, Raschi M: Suggested connections between risk factors of intracranial aneurysms: A review. Ann Biomed Eng (2013) Jul;41(7):1366-1383. Cellina GU, Honour AJ, Littler WA: Direct arterial pressure, heart rate, and electrocardiogram during cigarette smoking in unrestricted patients. Am Heart J (1975) 89(1):18-25. Chan BT, Lim E, Chee KH, Abu-Osman NA: Review on cfd simulation in heart with dilated cardiomyopathy and myocardial infarction. Comput Biol Med (2013) 1(1;43(4)):377-385. Chason JL, Hindman WM: Berry aneurysms of the circle of willis; results of a planned autopsy study. Neurology (1958) 8(1):41-44. Chatziprodromou I, Butty, V.D., Makhijani, V. B. P, D.,, Ventikos Y: Pulsatile blood flow in anatomically accurate vessels with multiple aneurysms: A medical intervention planning application of computational haemodynamics. Flow, Turbulence and Combustion (2003) 71(333–346. Chen L, Liu JM, Zhou D: Congenital absence of the right common carotid artery, internal carotid artery and external carotid artery associated with anterior communicating artery aneurysm: A rare case. Neurol Sci (2008) 29(6):485-487. Cheng C, Helderman F, Tempel D, Segers D, Hierck B, Poelmann R, van Tol A, Duncker DJ, Robbers-Visser D, Ursem NT, van Haperen R et al: Large variations in absolute wall shear stress levels within one species and between species. Atherosclerosis (2007) 195(2):225-235.

223
Coata G, Ventura F, Lombardini R, Ciuffetti G, Cosmi EV, Di Renzo GC: Effect of low-dose oral triphasic contraceptives on blood viscosity, coagulation and lipid metabolism. Contraception (1995) 52(3):151-157. Cohen MM: Cerebrovascular accidents; a study of two hundred one cases. AMA Arch Pathol (1955) 60(3):296-307. Connolly HM, Huston J, 3rd, Brown RD, Jr., Warnes CA, Ammash NM, Tajik AJ: Intracranial aneurysms in patients with coarctation of the aorta: A prospective magnetic resonance angiographic study of 100 patients. Mayo Clin Proc (2003) 78(12):1491-1499. Cooke JP, Stamler J, Andon N, Davies PF, McKinley G, Loscalzo J: Flow stimulates endothelial cells to release a nitrovasodilator that is potentiated by reduced thiol. Am J Physiol (1990) 259(3 Pt 2):H804-812. Cooper BB: Lectures on the principles and practice of surgery. Blanchard & Lee, Philadelphia (1852). Corbett SC, Ajdari A, Coskun AU, Nayeb-Hashemi H: Effect of pulsatile blood flow on thrombosis potential with a step wall transition. ASAIO J (2010) Jul-Aug;56(4):290-295. Cowan JA, Jr., Barkhoudarian G, Yang LJ, Thompson BG: Progression of a posterior communicating artery infundibulum into an aneurysm in a patient with alagille syndrome. Case report. J Neurosurg (2004) 101(4):694-696. Crawford T: Some observations on the pathogenesis and natural history of intracranial aneurysms. J Neurol Neurosurg Psychiatry (1959) 22(259-266. Crompton MR: The pathogenesis of cerebral infarction following the rupture of cerebral berry aneurysms. Brain (1964) 87(491-510. Crompton MR: Mechanism of growth and rupture in cerebral berry aneurysms. Br Med J (1966) 1(5496):1138-1142. Crumpton CW, Rowe GG, Capps RC, Whitmore JJ, Murphy QR: The effect of hexamethonium upon cerebral blood flow and metabolism in

224
patients with premalignant and malignant hypertension. Circulation (1955) 11(1):106-109. Crutchfield WG: Instruments for use in the treatment of certain intracranial vascular lesions. J Neurosurg (1959) 16(4):471-474.
D Daley PJ, Sagar KB, Wann LS: Doppler echocardiographic measurement of flow velocity in the ascending aorta during supine and upright exercise. Br Heart J (1985) 54(6):562-567. Dandy WE: Intracranial aneurysm of the internal carotid artery: Cured by operation. Ann Surg (1938) 107(5):654-659. Danesh J, Collins R, Peto R, Lowe GD: Haematocrit, viscosity, erythrocyte sedimentation rate: Meta-analyses of prospective studies of coronary heart disease. Eur Heart J (2000) 21(7):515-520. Damadian R, Goldsmith M, Minkoff L: Nmr in cancer: Xvi. Fonar image of the live human body. Physiol Chem Phys (1977) 9(1):97-100, 108. Davies PF: Flow-mediated endothelial mechanotransduction. Physiol Rev (1995) 75(3):519-560. Davies PF, Tripathi SC: Mechanical stress mechanisms and the cell. An endothelial paradigm. Circ Res (1993) 72(2):239-245. de la Monte SM, Moore GW, Monk MA, Hutchins GM: Risk factors for the development and rupture of intracranial berry aneurysms. Am J Med (1985) 78(6 Pt 1):957-964. de Simone G, Devereux RB, Chien S, Alderman MH, Atlas SA, Laragh JH: Relation of blood viscosity to demographic and physiologic variables and to cardiovascular risk factors in apparently normal adults. Circulation (1990) 81(1):107-117. Dempere-Marco L, Oubel E, Castro M, Putman C, Frangi A, Cebral J: Cfd analysis incorporating the influence of wall motion: Application to intracranial aneurysms. Med Image Comput Comput Assist Interv Int Conf Med Image Comput Comput Assist Interv (2006) 9(Pt 2):438-445.

225
Dion JE, Gates PC, Fox AJ, Barnett HJ, Blom RJ: Clinical events following neuroangiography: A prospective study. Stroke (1987) 18(6):997-1004. Dodge JT, Jr., Brown BG, Bolson EL, Dodge HT: Lumen diameter of normal human coronary arteries. Influence of age, sex, anatomic variation, and left ventricular hypertrophy or dilation. Circulation (1992) 86(1):232-246. Doenitz C, Schebesch KM, Zoephel R, Brawanski A: A mechanism for the rapid development of intracranial aneurysms: A case study. Neurosurgery (2010) Nov;67(5):1213-1221. Dott NM: Intracranial aneurysms: Cerebral arterio-radiography: Surgical treatment. Edinburgh Med J (1933) 40(219-234. Drake CG: Earlier times in aneurysm surgery. Clin Neurosurg (1985) 32(41-50. Drake CG: Progress in cerebrovascular disease. Management of cerebral aneurysm. Stroke (1981) 12(3):273-283. Drexler H, Hornig B: Endothelial dysfunction in human disease. J Mol Cell Cardiol (1999) 31(1):51-60. DuBoulay GH: Some observation on the natural history of intracranial aneurysms. Brit J Radiol (1965) 38(721-757. Duncan J, Fraser TR: On the treatment of aneurism by electrolysis: With an account of an investigation into the action of galvanism on blood and on albuminous fluids. Medico-Chir Soc Edinb Med J (1867) 13(101-120.
E Ecker A, Riemenschneider PA: Arteriographic demonstration of spasm of the intracranial arteries, with special reference to saccular arterial aneurysms. J Neurosurg (1951) 8(6):660-667. Engelson E: Catheter for guide-wire tracking. In: 4739768. USPTO (Ed) USA (1986).

226
Ene-Iordache B, Remuzzi A: Disturbed flow in radial-cephalic arteriovenous fistulae for haemodialysis: Low and oscillating shear stress locates the sites of stenosis. Nephrol Dial Transplant (2011) Jul 18.([Epub ahead of print]. Enzmann DR, Marks MP, Pelc NJ: Comparison of cerebral artery blood flow measurements with gated cine and ungated phase-contrast techniques. J Magn Reson Imaging (1993) 3(5):705-712. Enzmann DR, Ross MR, Marks MP, Pelc NJ: Blood flow in major cerebral arteries measured by phase-contrast cine mr. AJNR Am J Neuroradiol (1994) 15(1):123-129. Eppinger H: Pathogenesis (histogenesis and aetiologie) der aneurysmen einschliesslich des aneurysma equi verminosum. Arch Klin Chir (1887) 35(Suppl 1):1-563. Erbengi A, Inci S: Pheochromocytoma and multiple intracranial aneurysms: Is it a coincidence? Case report. J Neurosurg (1997) 87(5):764-767. Evans AJ, Iwai F, Grist TA, Sostman HD, Hedlund LW, Spritzer CE, Negro-Vilar R, Beam CA, Pelc NJ: Magnetic resonance imaging of blood flow with a phase subtraction technique. In vitro and in vivo validation. Invest Radiol (1993) 28(2):109-115.
F Fedorov BM, Sebekina TV, Sinitsyna TM, Strel'tsova EN, Vakulenko VM, Nikolaeva TG: [stress and blood circulation in man]. Kosm Biol Aviakosm Med (1990) 24(3):35-40. Feng R, Xenos M, Girdhar G, Kang W, Davenport JW, Deng Y, Bluestein D: Viscous flow simulation in a stenosis model using discrete particle dynamics: A comparison between dpd and cfd. Biomech Model Mechanobiol (2011 [Epub ahead of print]) Mar 3( Ferrua MJ, Singh RP: Modeling the fluid dynamics in a human stomach to gain insight of food digestion. J Food Sci (2010) Sep;75(7):R151-162. Fifi JT, Meyers PM, Lavine SD, Cox V, Silverberg L, Mangla S, Pile-Spellman J: Complications of modern diagnostic cerebral angiography

227
in an academic medical center. J Vasc Interv Radiol (2009) 20(4):442-447. Fleischer AS, Faria MA, Jr., Hoffmann JC, Jr.: Pseudoaneurysm complicating superficial temporal artery--middle cerebral artery bypass. Surg Neurol (1979) 12(4):305-306. Fogarty TJ, Cranley JJ, Krause RJ, Strasser ES, Hafner CD: A method for extraction of arterial emboli and thrombi. Surg Gynecol Obstet (1963) 116(241-244. Forbus WD: On the origin of miliary aneurysms of the superficial cerebral arteries. Bull Johns Hopkins Hosp (1930) 47(239-284. Ford MD, Nikolov HN, Milner JS, Lownie SP, Demont EM, Kalata W, Loth F, Holdsworth DW, Steinman DA: Piv-measured versus cfd-predicted flow dynamics in anatomically realistic cerebral aneurysm models. J Biomech Eng (2008) 130(2):021015. Ford MD, Stuhne GR, Nikolov HN, Habets DF, Lownie SP, Holdsworth DW, Steinman DA: Virtual angiography for visualization and validation of computational models of aneurysm haemodynamics. IEEE Trans Med Imaging (2005) 24(12):1586-1592. Forfang K, Rostad H, Sorland S, Levorstad K: Late sudden death after surgical correction of coarctation of the aorta. Importance of aneurysm of the ascending aorta. Acta Med Scand (1979) 206(5):375-379. Formaggia L, Nobile F, Quarteroni A, Veneziani A: Multiscale modelling of the circulatory system: A preliminary analysis. Comput Vis Sci (1999) 2(75–83. Forbus WD: On the origin of miliary aneurysms of the superficial cerebral arteries. Bull Johns Hopkins Hosp (1930) 47(239-284. Foutrakis GN, Yonas H, Sclabassi RJ: Saccular aneurysm formation in curved and bifurcating arteries. AJNR Am J Neuroradiol (1999) 20(7):1309-1317. Fox C, Davies MJ, Webb-Peploe MM: Length of left main coronary artery. Br Heart J (1973) 35(8):796-798.

228
Frawley P, Geron M: Combination of cfd and doe to analyze and improve the mass flow rate in urinary catheters. J Biomech Eng (2009) Aug;131(8):084501. Frei EH, Driller J, Neufeld HN, Barr I, Bleiden L, Askenazy HN: The pod and its applications. Med Res Eng (1966) 5(4):11-18. Fukuda S, Hashimoto N, Naritomi H, Nagata I, Nozaki K, Kondo S, Kurino M, Kikuchi H: Prevention of rat cerebral aneurysm formation by inhibition of nitric oxide synthase. Circulation (2000) 101(21):2532-2538.
G Gaetani P, Tartara F, Tancioni F, Klersy C, Forlino A, Baena RR: Activity of alpha 1-antitrypsin and cigarette smoking in subarachnoid haemorrhage from ruptured aneurysm. J Neurol Sci (1996) 141(1-2):33-38. Gabrielsen TO, Greitz T: Normal size of the internal carotid, middle cerebral and anterior cerebral arteries. Acta Radiol Diagn (Stockh) (1970) 10(1):1-10. Gao L, Hoi Y, Swartz DD, Kolega J, Siddiqui A, Meng H: Nascent aneurysm formation at the basilar terminus induced by haemodynamics. Stroke (2008) 39(7):2085-2090. Gardner WJ: Cerebral angiomas and aneurysms. Surg Clin North Am (1936) 16(1019–1030. Geng Y, Hansson GK, Holme E: Interferon-gamma and tumor necrosis factor synergize to induce nitric oxide production and inhibit mitochondrial respiration in vascular smooth muscle cells. Circ Res (1992) 71(5):1268-1276. Gianturco C, Anderson JH, Wallace S: Mechanical devices for arterial occlusion. Am J Roentgenol Radium Ther Nucl Med (1975) 124(3):428-435. Glor FP, Long Q, Hughes AD, Augst AD, Ariff B, Thom SA, Verdonck PR, Xu XY: Reproducibility study of magnetic resonance image-based computational fluid dynamics prediction of carotid bifurcation flow. Ann Biomed Eng (2003) 31(2):142-151.

229
Glor FP, Ariff B, Hughes AD, Crowe LA, Verdonck PR, Barratt DC, Mc GTSA, Firmin DN, Xu XY: The integration of medical imaging and computational fluid dynamics for measuring wall shear stress in carotid arteries. Conf Proc IEEE Eng Med Biol Soc (2004) 2(1415-1418. Glynn LE: Medial defects in the circle of willis and their relation to aneurysm formation. J Pathol Bacteriol (1940) 51(213-222. Gonzalez CF, Cho YI, Ortega HV, Moret J: Intracranial aneurysms: Flow analysis of their origin and progression. AJNR Am J Neuroradiol (1992) 13(1):181-188. Gonzalez-Alonso J, Dalsgaard MK, Osada T, Volianitis S, Dawson EA, Yoshiga CC, Secher NH: Brain and central haemodynamics and oxygenation during maximal exercise in humans. J Physiol (2004) 557(Pt 1):331-342. Goubergrits L, Kertzscher U, Schoneberg B, Wellnhofer E, Petz C, Hege HC: Cfd analysis in an anatomically realistic coronary artery model based on non-invasive 3d imaging: Comparison of magnetic resonance imaging with computed tomography. Int J Cardiovasc Imaging (2008) 24(4):411-421. Greenfield AJ: Transcatheter vessel occlusion: Selection of methods and materials. Cardiovasc Intervent Radiol (1980) 3(4):222-228. Greenhalgh RM, Laing S, Taylor GW: Risk factors in carotid artery stenosis and intracranial aneurysms. J Cardiovasc Surg (Torino) (1980) 21(5):559-567. Greenwood J, Jr.: Two point coagulation: A follow-up report of a new technic and instrument for electrocoagulation in neurosurgery. Arch Phys Ther (1942) 23(9):552-554. Guglielmi G: History of the genesis of detachable coils. A review. J Neurosurg (2009) 111(1):1-8.
H Hafkenschiel JH, Jr., Crumpton CW, Moyer JH: Blood flow and oxygen consumption of the brain in coarctation of the aorta. Proc Soc Exp Biol Med (1949) 71(1):165-167.

230
Hajjar I, Selim M, Novak P, Novak V: The relationship between nighttime dipping in blood pressure and cerebral haemodynamics in nonstroke patients. J Clin Hypertens (Greenwich) (2007) 9(12):929-936. Handa H, Hashimoto N, Nagata I, Hazama F: Saccular cerebral aneurysms in rats: A newly developed animal model of the disease. Stroke (1983) 14(6):857-866. Handler FP, Blumenthal HT: Inflammatory factor in pathogenesis of cerebrovascular aneurysms. J Am Med Assoc (1954) 155(17):1479-1483. Harikrishnan S, Stigimon J, Tharakan JM: Intracranial aneurysms, coronary aneurysms and descending aortic coarctation--unreported association. Int J Cardiol (2005) 99(2):329-330. Hashimoto N, Handa H, Hazama F: Experimentally induced cerebral aneurysms in rats. Surg Neurol (1978) 10(1):3-8. Hashimoto N, Handa H, Nagata I, Hazama F: Experimentally induced cerebral aneurysms in rats: Part v. Relation of haemodynamics in the circle of willis to formation of aneurysms. Surg Neurol (1980) 13(1):41-45. Hashimoto N, Kim C, Kikuchi H, Kojima M, Kang Y, Hazama F: Experimental induction of cerebral aneurysms in monkeys. J Neurosurg (1987) 67(6):903-905. Hassan T, Ahmed YM, Hassan AA: The adverse effects of flow-diverter stent-like devices on the flow pattern of saccular intracranial aneurysm models: Computational fluid dynamics study. Acta Neurochir (Wien) (2011) Aug;153(8):1633-1640. Hassan T, Ezura M, Timofeev EV, Tominaga T, Saito T, Takahashi A, Takayama K, Yoshimoto T: Computational simulation of therapeutic parent artery occlusion to treat giant vertebrobasilar aneurysm. AJNR Am J Neuroradiol (2004) 25(1):63-68. He X, Ku DN: Pulsatile flow in the human left coronary artery bifurcation: Average conditions. J Biomech Eng (1996) 118(1):74-82.

231
Hesslein PS, McNamara DG, Morriss MJ, Hallman GL, Cooley DA: Comparison of resection versus patch aortoplasty for repair of coarctation in infants and children. Circulation (1981) 64(1):164-168. Hernandez M, Frangi AF: Non-parametric geodesic active regions: Method and evaluation for cerebral aneurysms segmentation in 3dra and cta. Med Image Anal (2007) 11(3):224-241. Hilal SK, Michelsen WJ, Driller J, Leonard E: Magnetically guided devices for vascular exploration and treatment. Radiology (1974) 113(3):529-540. Hillen B, Hoogstraten HW, Post L: A mathematical model of the flow in the circle of willis. J Biomech (1986) 19(3):187-194. Hitosugi M, Niwa M, Takatsu A: Changes in blood viscosity by heparin and argatroban. Thromb Res (2001) 104(5):371-374. Hoi Y, Meng H, Woodward SH, Bendok BR, Hanel RA, Guterman LR, Hopkins LN: Effects of arterial geometry on aneurysm growth: Three-dimensional computational fluid dynamics study. J Neurosurg (2004) 101(4):676-681. Holdsworth DW, Norley CJ, Frayne R, Steinman DA, Rutt BK: Characterization of common carotid artery blood-flow waveforms in normal human subjects. Physiol Meas (1999) 20(3):219-240. Holenstein R, Niederer P, Anliker M: A viscoelastic model for use in predicting arterial pulse waves. J Biomech Eng (1980) 102(4):318-325. Hom JJ, Ordovas K, Reddy GP: Velocity-encoded cine mr imaging in aortic coarctation: Functional assessment of haemodynamic events. Radiographics (2008) 28(2):407-416. Hop JW, Rinkel GJ, Algra A, van Gijn J: Case-fatality rates and functional outcome after subarachnoid hemorrhage: A systematic review. Stroke (1997) 28(3):660-664. Horie N, Tsutsumi K, Kaminogo M, Morikawa M, Kitagawa N, Nagata I: Agenesis of the internal carotid artery with transcavernous anastomosis presenting with an anterior communicating artery aneurysm--a case report and review of the literature. Clin Neurol Neurosurg (2008) 110(6):622-626.

232
Hounsfield GN: Computerized transverse axial scanning (tomography). 1. Description of system. The British journal of radiology (1973) 46(552):1016-1022. Hudaoglu O, Kurul S, Cakmakci H, Men S, Yis U, Dirik E: Aorta coarctation presenting with intracranial aneurysm rupture. J Paediatr Child Health (2006) 42(7-8):477-479. Hutchinson J: Aneurism of internal carotid within the skull diagnosed eleven years before patient’s death: Spontaneous cure. . Trans Clin Soc Lond (1875) 8(127-131.
I Ide K, Secher NH: Cerebral blood flow and metabolism during exercise. Prog Neurobiol (2000) 61(4):397-414. Inagawa T, Takechi A, Yahara K, Saito J, Moritake K, Kobayashi S, Fujii Y, Sugimura C: Primary intracerebral and aneurysmal subarachnoid hemorrhage in izumo city, japan. Part i: Incidence and seasonal and diurnal variations. J Neurosurg (2000) 93(6):958-966. Inagawa T: Trends in incidence and case fatality rates of aneurysmal subarachnoid hemorrhage in izumo city, japan, between 1980-1989 and 1990-1998. Stroke (2001) 32(7):1499-1507. Inagawa T: Seasonal variation in the incidence of aneurysmal subarachnoid hemorrhage in hospital- and community-based studies. J Neurosurg (2002) 96(3):497-509. Inagawa T: Risk factors for aneurysmal subarachnoid hemorrhage in patients in izumo city, japan. J Neurosurg (2005) 102(1):60-67. Inci S, Spetzler RF: Intracranial aneurysms and arterial hypertension: A review and hypothesis. Surg Neurol (2000) 53(6):530-540; discussion 540-532. Ishii K, Isono M, Kasai N, Nakano T, Kubo T, Inoue R, Nomura Y: Midaortic syndrome in childhood associated with a ruptured cerebral aneurysm: A case report. Surg Neurol (2001) 55(4):209-212.

233
Isoda H, Ohkura Y, Kosugi T, Hirano M, Takeda H, Hiramatsu H, Yamashita S, Takehara Y, Alley MT, Bammer R, Pelc NJ et al: In vivo haemodynamic analysis of intracranial aneurysms obtained by magnetic resonance fluid dynamics (mrfd) based on time-resolved three-dimensional phase-contrast mri. Neuroradiology (2009).
J Jakubowski J, Kendall B: Coincidental aneurysms with tumours of pituitary origin. J Neurol Neurosurg Psychiatry (1978) 41(11):972-979. Jamous MA, Nagahiro S, Kitazato KT, Tamura T, Aziz HA, Shono M, Satoh K: Endothelial injury and inflammatory response induced by haemodynamic changes preceding intracranial aneurysm formation: Experimental study in rats. J Neurosurg (2007) 107(2):405-411. Jeays AD, Lawford PV, Gillott R, Spencer P, Barber DC, Bardhan KD, Hose DR: Characterisation of the haemodynamics of the superior mesenteric artery. J Biomech (2007) 40(9):1916-1926. Joseph M, Nates, J.L.: Stable xenon computed tomography cerebral blood flow measurement in neurological disease: Review and protocols. The Internet Journal of Emergency and Intensive Care Medicine (2000) 4(2). Jou LD, Lee DH, Morsi H, Mawad ME: Wall shear stress on ruptured and unruptured intracranial aneurysms at the internal carotid artery. AJNR Am J Neuroradiol (2008). Jou LD, Quick CM, Young WL, Lawton MT, Higashida R, Martin A, Saloner D: Computational approach to quantifying haemodynamic forces in giant cerebral aneurysms. AJNR Am J Neuroradiol (2003) 24(9):1804-1810. Jou LD, Wong G, Dispensa B, Lawton MT, Higashida RT, Young WL, Saloner D: Correlation between lumenal geometry changes and haemodynamics in fusiform intracranial aneurysms. AJNR Am J Neuroradiol (2005) 26(9):2357-2363. Juvela S: Risk factors for multiple intracranial aneurysms. Stroke (2000) 31(2):392-397.

234
Juvela S, Poussa K, Porras M: Factors affecting formation and growth of intracranial aneurysms: A long-term follow-up study. Stroke; a journal of cerebral circulation (2001) 32(2):485-491. Juvela S, Hillbom M, Numminen H, Koskinen P: Cigarette smoking and alcohol consumption as risk factors for aneurysmal subarachnoid hemorrhage. Stroke (1993) 24(5):639-646.
K Kan P, Liu JK, Couldwell WT: Giant fusiform aneurysm in an adolescent with phaces syndrome treated with a high-flow external carotid artery-m3 bypass. Case report and review of the literature. J Neurosurg (2007) 106(6 Suppl):495-500. Kanda M, Shinoda S, Masuzawa T: Ruptured vertebral artery-posterior inferior cerebellar artery aneurysm associated with pulseless disease--case report. Neurol Med Chir (Tokyo) (2004) 44(7):363-367. Karmonik C, Benndorf G, Klucznik R, Haykal H, Strother CM: Wall shear stress variations in basilar tip aneurysms investigated with computational fluid dynamics. Conf Proc IEEE Eng Med Biol Soc (2006) 1(3214-3217. Kashiwazaki D, Kuroda S: On behalf of the sapporo sah study group. Size ratio can highly predict rupture risk in intracranial small (<5 mm) aneurysms. Stroke (2013) Jun 6([Epub ahead of print]. Kassell NF, Torner JC, Haley EC, Jr., Jane JA, Adams HP, Kongable GL: The international cooperative study on the timing of aneurysm surgery. Part 1: Overall management results. J Neurosurg (1990) 73(1):18-36. Kaufmann TA, Linde T, Cuenca-Navalon E, Schmitz C, Hormes M, Schmitz-Rode T, Steinseifer U: Transient, three-dimensional flow field simulation through a mechanical, trileaflet heart valve prosthesis. ASAIO J (2011) 57(4):278-282. Kawaguchi S, Sakaki T, Morimoto T, Kakizaki T, Kamada K: Characteristics of intracranial aneurysms associated with moyamoya disease. A review of 111 cases. Acta Neurochir (Wien) (1996) 138(11):1287-1294.

235
Kayembe KN, Sasahara M, Hazama F: Cerebral aneurysms and variations in the circle of willis. Stroke (1984) 15(5):846-850. Keen W, DaCosta J: Surgery its principles and practice. WB Saunders, Philadelphia. (1916). Kety SS: The theory and applications of the exchange of inert gas at the lungs and tissues. Pharmacol Rev (1951) 3(1):1-41. Khanna RK, Malik GM, Qureshi N: Predicting outcome following surgical treatment of unruptured intracranial aneurysms: A proposed grading system. J Neurosurg (1996) 84(1):49-54. Kharboutly Z, Deplano V, Bertrand E, Legallais C: Numerical and experimental study of blood flow through a patient-specific arteriovenous fistula used for hemodialysis. Med Eng Phys (2010) Mar;32(2):111-118. Kim C, Cervos-Navarro J, Kikuchi H, Hashimoto N, Hazama F: Alterations in cerebral vessels in experimental animals and their possible relationship to the development of aneurysms. Surg Neurol (1992) 38(5):331-337. Kim EJ, Halim AX, Dowd CF, Lawton MT, Singh V, Bennett J, Young WL: The relationship of coexisting extranidal aneurysms to intracranial hemorrhage in patients harboring brain arteriovenous malformations. Neurosurgery (2004) 54(6):1349-1357; discussion 1357-1348. Kim C, Kikuchi H, Hashimoto N, Hazama F, Kataoka H: Establishment of the experimental conditions for inducing saccular cerebral aneurysms in primates with special reference to hypertension. Acta Neurochir (Wien) (1989) 96(3-4):132-136. Kinugasa K, Mandai S, Terai Y, Kamata I, Sugiu K, Ohmoto T, Nishimoto A: Direct thrombosis of aneurysms with cellulose acetate polymer. Part ii: Preliminary clinical experience. Journal of neurosurgery (1992) 77(4):501-507. Knekt P, Reunanen A, Aho K, Heliovaara M, Rissanen A, Aromaa A, Impivaara O: Risk factors for subarachnoid hemorrhage in a longitudinal population study. J Clin Epidemiol (1991) 44(9):933-939.

236
Koffijberg H, Buskens E, Algra A, Wermer MJ, Rinkel GJ: Growth rates of intracranial aneurysms: Exploring constancy. J Neurosurg (2008) 109(2):176-185. Komotar RJ, Mocco J, Solomon RA: Guidelines for the surgical treatment of unruptured intracranial aneurysms: The first annual j. Lawrence pool memorial research symposium--controversies in the management of cerebral aneurysms. Neurosurgery (2008) 62(1):183-193; discussion 193-184. Kondo C, Caputo GR, Semelka R, Foster E, Shimakawa A, Higgins CB: Right and left ventricular stroke volume measurements with velocity-encoded cine mr imaging: In vitro and in vivo validation. AJR Am J Roentgenol (1991) 157(1):9-16. Kondo S, Hashimoto N, Kikuchi H, Hazama F, Nagata I, Kataoka H: Cerebral aneurysms arising at nonbranching sites. An experimental study. Stroke (1997) 28(2):398-403; discussion 403-394. Konishi Y, Kadowaki C, Hara M, Takeuchi K: Aneurysms associated with moyamoya disease. Neurosurgery (1985) 16(4):484-491. Kono K, Fujimoto T, Shintani A, Terada T: Haemodynamic characteristics at the rupture site of cerebral aneurysms: A case study. Neurosurgery (2012) 71(6):E1202-1208; discussion 1209. Krabbe-Hartkamp MJ, van der Grond J, de Leeuw FE, de Groot JC, Algra A, Hillen B, Breteler MM, Mali WP: Circle of willis: Morphologic variation on three-dimensional time-of-flight mr angiograms. Radiology (1998) 207(1):103-111. Krampe C: Zeiss operating microscopes for neurosurgery. Neurosurg Rev (1984) 7(2-3):89-97. Krayenbuehl H, Yasargil MG: Cerebral angiography. Thieme Medical Publishers., Stuttgart (1982). Kuivaniemi H, Prockop DJ, Wu Y, Madhatheri SL, Kleinert C, Earley JJ, Jokinen A, Stolle C, Majamaa K, Myllyla VV, et al.: Exclusion of mutations in the gene for type iii collagen (col3a1) as a common cause of intracranial aneurysms or cervical artery dissections: Results from sequence analysis of the coding sequences of type iii collagen from 55 unrelated patients. Neurology (1993) 43(12):2652-2658.

237
Kulikov VP, Grechishnikov VN, Sidor MV: [response of cerebral haemodynamics to combined stress impacts]. Patol Fiziol Eksp Ter (2005) 1):7-9. Kurokawa T, Harada K, Ishihara H, Fujisawa H, Kato S, Kajiwara K, Suzuki M: De novo aneurysm formation on middle cerebral artery branches adjacent to the anastomotic site of superficial temporal artery-middle cerebral artery bypass surgery in two patients: Technical case report. Neurosurgery (2007) 61(5 Suppl 2):E297-298; discussion E298. Kurze T: Microtechniques in neurological surgery. Clin Neurosurg (1964) 11(128-137. Kwak R, Mizoi K, Katakura R, Suzuki J: The correlation between hypertension in past history and the incidence of cerebral aneurysms. Tohoku J Exp Med (1979) 128(3):267-271. Kwan ES, Heilman CB, Shucart WA, Klucznik RP: Enlargement of basilar artery aneurysms following balloon occlusion--"water-hammer effect". Report of two cases. J Neurosurg (1991) 75(6):963-968.
L Laborde F, Bical O, Lemoine G, Neveux JY: [rupture of a dissecting aneurysm of the ascending aorta 10 years after therapy of coarctation. Apropos of a case of a 10-year-old girl]. Sem Hop (1983) 59(42):2937-2938. Lagana K, Dubini G, Migliavacca F, Pietrabissa R, Pennati G, Veneziani A, Quarteroni A: Multiscale modelling as a tool to prescribe realistic boundary conditions for the study of surgical procedures. Biorheology (2002) 39(3-4):359-364. Laitinen L, Snellman A: Aneurysms of the pericallosal artery: A study of 14 cases verified angiographically and treated mainly by direct surgical attack. J Neurosurg (1960) 17(447-458. Lall RR, Eddleman CS, Bendok BR, Batjer HH: Unruptured intracranial aneurysms and the assessment of rupture risk based on anatomical and morphological factors: Sifting through the sands of data. Neurosurg Focus (2009) 26(5):E2.

238
Langewouters GJ: Visco-elasticity of the human aorta in vitro in relation to pressure and age [thesis]. . In: University of Amsterdam, The Netherlands, Amsterdam, The Netherlands (1982). Lauterbur PC: Image formation by induced local interactions. Examples employing nuclear magnetic resonance. 1973. Clinical orthopaedics and related research (1989) 244):3-6. Leppala JM, Virtamo J, Fogelholm R, Albanes D, Heinonen OP: Different risk factors for different stroke subtypes: Association of blood pressure, cholesterol, and antioxidants. Stroke (1999) 30(12):2535-2540. Letcher RL, Chien S, Pickering TG, Laragh JH: Elevated blood viscosity in patients with borderline essential hypertension. Hypertension (1983) 5(5):757-762. Levitt MR, McGah PM, Aliseda A, Mourad PD, Nerva JD, Vaidya SS, Morton RP, Ghodke BV, Kim LJ: Cerebral aneurysms treated with flow-diverting stents: Computational models with intravascular blood flow measurements. AJNR American journal of neuroradiology (2014) 35(1):143-148. Li MH, Li WB, Pan YP, Fang C, Wang W: Persistent primitive trigeminal artery associated with aneurysm: Report of two cases and review of the literature. Acta Radiol (2004) 45(6):664-668. Li C, Wang S, Chen J, Yu H, Zhang Y, Jiang F, Mu S, Li H, Yang X: Influence of haemodynamics on recanalization of totally occluded intracranial aneurysms: A patient-specific computational fluid dynamic simulation study. Journal of neurosurgery (2012) 117(2):276-283. Linde T, Sandhagen B, Hagg A, Morlin C, Danielson BG: Decreased blood viscosity and serum levels of erythropoietin after anti-hypertensive treatment with amlodipine or metoprolol: Results of a cross-over study. J Hum Hypertens (1996) 10(3):199-205. Linge SO, Haughton V, Løvgren AE, Mardal KA, Helgeland A, Langtangen HP: Effect of tonsillar herniation on cyclic csf flow studied with computational flow analysis. AJNR Am J Neuroradiol (2011) Sep;32(8):1474-1481.

239
Lippi D: An aneurysm in the papyrus of ebers (108, 3-9). Med Secoli (1990) 2(1-4. Longstreth WT, Jr., Nelson LM, Koepsell TD, van Belle G: Cigarette smoking, alcohol use, and subarachnoid hemorrhage. Stroke (1992) 23(9):1242-1249. Lorensen WE, Cline, H.E.: Marching cubes: A high resolution 3d surface construction algorithm. Computer Graphics (1987) 21(163-169. Lougheed WM, Sweet WH, White JC, Brewster WR: The use of hypothermia in surgical treatment of cerebral vascular lesions; a preliminary report. J Neurosurg (1955) 12(3):240-255. Low M, Perktold K, Raunig R: Haemodynamics in rigid and distensible saccular aneurysms: A numerical study of pulsatile flow characteristics. Biorheology (1993) 30(3-4):287-298. Lu G, Huang L, Zhang XL, Wang SZ, Hong Y, Hu Z, Geng DY: Influence of haemodynamic factors on rupture of intracranial aneurysms: Patient-specific 3d mirror aneurysms model computational fluid dynamics simulation. AJNR Am J Neuroradiol (2011) Aug;32(7):1255-1261. Luessenhop AJ, Spence WT: Artificial embolization of cerebral arteries. Report of use in a case of arteriovenous malformation. J Am Med Assoc (1960) 172(1153-1155. Luo XY, Hinton JS, Liew TT, Tan KK: Les modelling of flow in a simple airway model. Med Eng Phys (2004) Jun;26.(5):403-413. Luscher TF, Tanner FC: Endothelial regulation of vascular tone and growth. Am J Hypertens (1993) 6(7 Pt 2):283S-293S.
M Malek AM, Alper SL, Izumo S: Haemodynamic shear stress and its role in atherosclerosis. JAMA (1999) 282(21):2035-2042. Malvè M, Pérez-del-Palomar A, Chandra S, López-Villalobos JL, Mena A, Finol EA, Ginel A, Doblaré M: Fsi analysis of a healthy and a

240
stenotic human trachea under impedance-based boundary conditions. J Biomech Eng (2011) Feb;133(2):021001. Mansfield P, Morris PG, Ordidge R, Coupland RE, Bishop HM, Blamey RW: Carcinoma of the breast imaged by nuclear magnetic resonance (nmr). The British journal of radiology (1979) 52(615):242-243. Mantha A, Karmonik C, Benndorf G, Strother C, Metcalfe R: Haemodynamics in a cerebral artery before and after the formation of an aneurysm. AJNR Am J Neuroradiol (2006) 27(5):1113-1118. Mark M, Walter R, Meredith DO, Reinhart WH: Commercial taxane formulations induce stomatocytosis and increase blood viscosity. Br J Pharmacol (2001) 134(6):1207-1214. Marzo A, Singh P, Larrabide I, Radaelli A, Coley S, Gwilliam M, Wilkinson ID, Lawford P, Reymond P, Patel U, Frangi A et al: Computational haemodynamics in cerebral aneurysms: The effects of modeled versus measured boundary conditions. Ann Biomed Eng (2011) 39(2):884-896. Marzo A, Singh P, Reymond P, Stergiopulos N, Patel U, Hose R: Influence of inlet boundary conditions on the local haemodynamics of intracranial aneurysms. Comput Methods Biomech Biomed Engin (2009) 12(4):431-444. Matas R: Surgery of the vascular system. Surgery, its principles and practice. W.B. Saunders Company, Philadelphia, Pennsylvania (1914). Matsuda M, Watanabe K, Saito A, Matsumura K, Ichikawa M: Circumstances, activities, and events precipitating aneurysmal subarachnoid hemorrhage. J Stroke Cerebrovasc Dis (2007) 16(1):25-29. Mattson DL, Maeda CY, Bachman TD, Cowley AW, Jr.: Inducible nitric oxide synthase and blood pressure. Hypertension (1998) 31(1):15-20. Mayberg MR, Batjer HH, Dacey R, Diringer M, Haley EC, Heros RC, Sternau LL, Torner J, Adams HP, Jr., Feinberg W, et al.: Guidelines for the management of aneurysmal subarachnoid hemorrhage. A statement for healthcare professionals from a special writing group of the stroke council, american heart association. Stroke (1994) 25(11):2315-2328.

241
McCormick WF, Schmalstieg EJ: The relationship of arterial hypertension to intracranial aneurysms. Arch Neurol (1977) 34(5):285-287. Meisel HJ, Mansmann U, Alvarez H, Rodesch G, Brock M, Lasjaunias P: Cerebral arteriovenous malformations and associated aneurysms: Analysis of 305 cases from a series of 662 patients. Neurosurgery (2000) 46(4):793-800; discussion 800-792. Meng H, Tutino VM, Xiang J, Siddiqui A: High wss or low wss? Complex interactions of haemodynamics with intracranial aneurysm initiation, growth, and rupture: Toward a unifying hypothesis. AJNR Am J Neuroradiol (2013). Meng H, Wang Z, Hoi Y, Gao L, Metaxa E, Swartz DD, Kolega J: Complex haemodynamics at the apex of an arterial bifurcation induces vascular remodeling resembling cerebral aneurysm initiation. Stroke (2007) 38(6):1924-1931. Mellado X, Larrabide, I. Hernandez, M. Frangi, A.F.: Flux driven medial curve extraction. The Insight Journal (2007) 1926( Mercado R, Lopez S, Cantu C, Sanchez A, Revuelta R, Gomez-Llata S, Bouffard JA, Pineda C: Intracranial aneurysms associated with unsuspected aortic coarctation. J Neurosurg (2002) 97(5):1221-1225. Mhurchu CN, Anderson C, Jamrozik K, Hankey G, Dunbabin D: Hormonal factors and risk of aneurysmal subarachnoid hemorrhage: An international population-based, case-control study. Stroke (2001) 32(3):606-612. Milner P, Kirkpatrick KA, Ralevic V, Toothill V, Pearson J, Burnstock G: Endothelial cells cultured from human umbilical vein release atp, substance p and acetylcholine in response to increased flow. Proc Biol Sci (1990) 241(1302):245-248. Mitsos AP, Kakalis NM, Ventikos YP, Byrne JV: Haemodynamic simulation of aneurysm coiling in an anatomically accurate computational fluid dynamics model: Technical note. Neuroradiology (2008) 50(4):341-347.

242
Mohiaddin RH, Kilner PJ, Rees S, Longmore DB: Magnetic resonance volume flow and jet velocity mapping in aortic coarctation. J Am Coll Cardiol (1993) 22(5):1515-1521. Moniz E: L’encephalographic arterielle dans la localoisation des tumeurs cerebrales. . Rev Neurol (Paris) (1927) 2(72-90. Morales HG, Kim M, Vivas EE, Villa-Uriol MC, Larrabide I, Sola T, Guimaraens L, Frangi AF: How do coil configuration and packing density influence intra-aneurysmal haemodynamics? AJNR Am J Neuroradiol (2011) Nov-Dec;32(10):1935-1941. Morgagni JB: De sebiuset causis morborumper anatomenin sagatis venetis et topog remondiama, book 1, letter 4. (1761) 2(VXCVI):298. Morimoto M, Miyamoto S, Mizoguchi A, Kume N, Kita T, Hashimoto N: Mouse model of cerebral aneurysm: Experimental induction by renal hypertension and local haemodynamic changes. Stroke (2002) 33(7):1911-1915. Moyle KR, Antiga L, Steinman DA: Inlet conditions for image-based cfd models of the carotid bifurcation: Is it reasonable to assume fully developed flow? J Biomech Eng (2006) 128(3):371-379. Myers JG, Moore JA, Ojha M, Johnston KW, Ethier CR: Factors influencing blood flow patterns in the human right coronary artery. Ann Biomed Eng (2001) 29(2):109-120.
N Nagata I, Handa H, Hashimoto N, Hazama F: Experimentally induced cerebral aneurysms in rats: Part vi. Hypertension. Surg Neurol (1980) 14(6):477-479. Nishimoto T, Yuki K, Sasaki T, Murakami T, Kodama Y, Kurisu K: A ruptured middle cerebral artery aneurysm originating from the site of anastomosis 20 years after extracranial-intracranial bypass for moyamoya disease: Case report. Surg Neurol (2005) 64(3):261-265; discussion 265. Noordergraaf A: Physical basis of ballistocardiography. ’s-Gravenhage: Excelsior (1956) 146.

243
Norlen G: Some aspects of the surgical treatment of intracranial aneurysms. Clinical neurosurgery (1963) 9(214-222. Numminen H, Kotila M, Waltimo O, Aho K, Kaste M: Declining incidence and mortality rates of stroke in finland from 1972 to 1991. Results of three population-based stroke registers. Stroke (1996) 27(9):1487-1491.
O Ohba M, Aoyama, M.: Defibrinogenating effect of batroxobin (df-521) on plasma fibrinogen concentration of experimental animals: A comparative study on seven different species. Jpn J Med Pharmacol (1985) 14(1061-1071. Oka S: Cardiovascular hemorheology. Cambridge, UK (1981). Olesen SP, Clapham DE, Davies PF: Haemodynamic shear stress activates a k+ current in vascular endothelial cells. Nature (1988) 331(6152):168-170. Omodaka S, Sugiyama S, Inoue T, Funamoto K, Fujimura M, Shimizu H, Hayase T, Takahashi A, Tominaga T: Local haemodynamics at the rupture point of cerebral aneurysms determined by computational fluid dynamics analysis. Cerebrovasc Dis (2012) 34(2):121-129. Orsi P, Rosa G, Liberatori G, Lunardi PP, Ferrante L: Repair of two unruptured intracranial aneurysms in the presence of coarctation of the aorta-anesthetic implications and management. J Neurosurg Anesthesiol (1993) 5(1):48-51. Ortega HV: Computer simulation helps predict cerebral aneurysms. Journal of medical engineering & technology (1998) 22(4):179-181. Oshima M, Sakai H, Torii R: Modelling of inflow boundary conditions for image-based simulation of cerebrovascular flow. Int J Numer Methods Fluids (2005) 47(603–617. Ostergaard JR, Hog E: Incidence of multiple intracranial aneurysms. Influence of arterial hypertension and gender. J Neurosurg (1985) 63(1):49-55.
P

244
Padget DH: The circle of willis: Its embryology and anatomy. In: Intracranial arterial aneurysms. Dandy WE (Ed) Comstock Publishing Co., New York (1944):67-90. Patel AN, Richardson AE: Ruptured intracranial aneurysms in the first two decades of life. A study of 58 patients. J Neurosurg (1971) 35(5):571-576. Peltier J, Vinchon M, Soto-Ares G, Dhellemmes P: Disappearance of a middle cerebral artery aneurysm associated with moyamoya syndrome after revascularization in a child: Case report. Childs Nerv Syst (2008) 24(12):1483-1487. Penn RD, Basati S, Sweetman B, Guo X, Linninger A: Ventricle wall movements and cerebrospinal fluid flow in hydrocephalus. J Neurosurg (2011) Jul;115(1):159-164. Peters DG, Kassam A, St Jean PL, Yonas H, Ferrell RE: Functional polymorphism in the matrix metalloproteinase-9 promoter as a potential risk factor for intracranial aneurysm. Stroke (1999) 30(12):2612-2616. Pezzini A, Caso V, Zanferrari C, Del Zotto E, Paciaroni M, Bertolino C, Grassi M, Agnelli G, Padovani A: Arterial hypertension as risk factor for spontaneous cervical artery dissection. A case-control study. J Neurol Neurosurg Psychiatry (2006) 77(1):95-97. Phillips B: A series of experiments performed for the purpose of showing that arteries may be obliterated without ligature, compression or the knife. Pamphlet published in London, Longman & Co, London, Churchill, London (1832 (reference unverified)). Pohl U, Herlan K, Huang A, Bassenge E: Edrf-mediated shear-induced dilation opposes myogenic vasoconstriction in small rabbit arteries. Am J Physiol (1991) 261(6 Pt 2):H2016-2023. Prasad A, To LK, Gorrepati ML, Zarins CK, Figueroa CA: Computational analysis of stresses acting on intermodular junctions in thoracic aortic endografts. J Endovasc Ther (2011) Aug 18(4):559-568. Price JF, Mowbray PI, Lee AJ, Rumley A, Lowe GD, Fowkes FG: Relationship between smoking and cardiovascular risk factors in the

245
development of peripheral arterial disease and coronary artery disease: Edinburgh artery study. Eur Heart J (1999) 20(5):344-353.
Q Quarteroni A, Formaggia L: Mathematical modelling and numerical simulation of the cardiovascular system. Handbook of Numerical Analysis (2004) 12(3-127. Quarteroni A, Ragni S, Veneziani A: Coupling between lumped and distributed models for blood flow problems. Comput Vis Sci (2001) 4(111–124. Quigley MR, Heiferman K, Kwaan HC, Vidovich D, Nora P, Cerullo LJ: Laser-sealed arteriotomy: A reliable aneurysm model. J Neurosurg (1987) 67(2):284-287. Qureshi AI, Suarez JI, Parekh PD, Sung G, Geocadin R, Bhardwaj A, Tamargo RJ, Ulatowski JA: Risk factors for multiple intracranial aneurysms. Neurosurgery (1998) 43(1):22-26; discussion 26-27. Quincke H: Die lumberpunction des hydrocephalus. Klin Wochenscher (1891) 28(929-965.
R Raaymakers TW, Rinkel GJ, Limburg M, Algra A: Mortality and morbidity of surgery for unruptured intracranial aneurysms: A meta-analysis. Stroke (1998) 29(8):1531-1538. Radaelli AG, Augsburger L, Cebral JR, Ohta M, Rufenacht DA, Balossino R, Benndorf G, Hose DR, Marzo A, Metcalfe R, Mortier P et al: Reproducibility of haemodynamical simulations in a subject-specific stented aneurysm model--a report on the virtual intracranial stenting challenge 2007. J Biomech (2008) 41(10):2069-2081. Rajasekaran H: @neurist - towards a system architecture for advanced disease management through integration of heterogeneous data, computing, and complex processing services. Proceedings of the 2008 21st IEEE International Symposium on Computer-Based Medical Systems (2008) 00( Ransohoff J: A case of aortic aneurism treated by the insertion of wire. JAMA (1886 ) 7(481–485

246
Rayz VL, Boussel L, Acevedo-Bolton G, Martin AJ, Young WL, Lawton MT, Higashida R, Saloner D: Numerical simulations of flow in cerebral aneurysms: Comparison of cfd results and in vivo mri measurements. J Biomech Eng (2008) 130(5):051011. Rayz VL, Boussel L, Lawton MT, Acevedo-Bolton G, Ge L, Young WL, Higashida RT, Saloner D: Numerical modeling of the flow in intracranial aneurysms: Prediction of regions prone to thrombus formation. Ann Biomed Eng (2008) 36(11):1793-1804. Redekop G, TerBrugge K, Montanera W, Willinsky R: Arterial aneurysms associated with cerebral arteriovenous malformations: Classification, incidence, and risk of hemorrhage. J Neurosurg (1998) 89(4):539-546. Reifenstein GH, Levine, S.A. Gross, R.E.: Coarctation of the aorta. A review of 104 autopsied cases of the "adult type", 2 years of age or older. Am Heart J (1947) 33):146-168. Rengachary SS, Wilkins RH: Principles of neurosurgery. McGraw Hill, USA (1996). Resnick N, Collins T, Atkinson W, Bonthron DT, Dewey CF, Jr., Gimbron MA, Jr.: Platelet-derived growth factor b chain promoter contains a cis-acting fluid shear-stress-responsive element. Proc Natl Acad Sci U S A (1993) 90(16):7908. Reymond P, Merenda F, Perren F, Rufenacht D, Stergiopulos N: Validation of a one-dimensional model of the systemic arterial tree. Am J Physiol Heart Circ Physiol (2009). Rhoton AL, Jr.: Anatomy of saccular aneurysms. Surg Neurol (1980) 14(1):59-66. Riggs HE, Rupp C.: Miliary aneurysms: Relations of anomalies of circle of willis to formation of aneurysms. Arch Neurol Psychiat (1943) 49(615-616. Rinkel GJ, Djibuti M, Algra A, van Gijn J: Prevalence and risk of rupture of intracranial aneurysms: A systematic review. Stroke (1998) 29(1):251-256.

247
Rinne J, Hernesniemi J, Puranen M, Saari T: Multiple intracranial aneurysms in a defined population: Prospective angiographic and clinical study. Neurosurgery (1994) 35(5):803-808. Rordorf G, Koroshetz WJ, Copen WA, Gonzalez G, Yamada K, Schaefer PW, Schwamm LH, Ogilvy CS, Sorensen AG: Diffusion- and perfusion-weighted imaging in vasospasm after subarachnoid hemorrhage. Stroke (1999) 30(3):599-605. Ronkainen A, Miettinen H, Karkola K, Papinaho S, Vanninen R, Puranen M, Hernesniemi J: Risk of harboring an unruptured intracranial aneurysm. Stroke (1998) 29(2):359-362. Rosenson RS, Tangney CC: Antiatherothrombotic properties of statins: Implications for cardiovascular event reduction. JAMA (1998) 279(20):1643-1650. Rossitti S: Shear stress in cerebral arteries carrying saccular aneurysms. A preliminary study. Acta Radiol (1998) 39(6):711-717. Rowe GG, Castillo CA, Afonso S, Young WP, Crumpton CW: Cerebral blood flow in coarctation of the aorta. J Clin Invest (1964) 43(1922-1927.
S Sacco RL, Wolf PA, Bharucha NE, Meeks SL, Kannel WB, Charette LJ, McNamara PM, Palmer EP, D'Agostino R: Subarachnoid and intracerebral hemorrhage: Natural history, prognosis, and precursive factors in the framingham study. Neurology (1984) 34(7):847-854. Sadasivan C, Fiorella DJ, Woo HH, Lieber BB: Physical factors effecting cerebral aneurysm pathophysiology. Ann Biomed Eng (2013) Jul;41(7):1347-1365. Sadatomo T, Yuki K, Migita K, Taniguchi E, Kodama Y, Kurisu K: Morphological differences between ruptured and unruptured cases in middle cerebral artery aneurysms. Neurosurgery (2008) 62(3):602-609; discussion 602-609. Sah AL, Perett, G.E., Locksley, H.B. et al.: Intracranial aneurysms sand sah: A co-operative study. . JB Lippincott, Philadelphia (1969).

248
Sakai N, Nakayama K, Tanabe Y, Izumiya Y, Nishizawa S, Uemuara K: Absence of plasma protease-antiprotease imbalance in the formation of saccular cerebral aneurysms. Neurosurgery (1999) 45(1):34-38; discussion 38-39. Sakaki T, Tominaga M, Miyamoto K, Tsunoda S, Hiasa Y: Clinical studies of de novo aneurysms. Neurosurgery (1993) 32(4):512-516; discussion 516-517. San Millan Ruiz D, Yilmaz H, Dehdashti AR, Alimenti A, de Tribolet N, Rufenacht DA: The perianeurysmal environment: Influence on saccular aneurysm shape and rupture. AJNR Am J Neuroradiol (2006) 27(3):504-512. Sarner M, Crawford MD: Ruptured intracranial aneurysm. Clinical series. Lancet (1965) 2(7425):1251-1254. Sauerbeck LR, Hornung R, Moomaw CJ, Woo D, Curry R, Brown RD, Jr., Broderick J: The effects of study participation in the familial intracranial aneurysm study on cigarette smoking. J Stroke Cerebrovasc Dis (2008) 17(6):370-372. Schievink WI, Schaid DJ, Michels VV, Piepgras DG: Familial aneurysmal subarachnoid hemorrhage: A community-based study. J Neurosurg (1995) 83(3):426-429. Schmetterer L, Kemmler D, Breiteneder H, Alschinger C, Koppensteiner R, Lexer F, Fercher AF, Eichler HG, Wolzt M: A randomized, placebo-controlled, double-blind crossover study of the effect of pentoxifylline on ocular fundus pulsations. Am J Ophthalmol (1996) 121(2):169-176. Sekhar LN, Heros RC: Origin, growth, and rupture of saccular aneurysms: A review. Neurosurgery (1981) 8(2):248-260. Serbinenko FA: Balloon catheterization and occlusion of major cerebral vessels. J Neurosurg (1974) 41(2):125-145. Sforza DM, Putman CM, Scrivano E, Lylyk P, Cebral JR: Blood-flow characteristics in a terminal basilar tip aneurysm prior to its fatal rupture. AJNR Am J Neuroradiol (2010) Jun;31(6):1127-1131.

249
Shearer WT, Rutman JY, Weinberg WA, Goldring D: Coarctation of the aorta and cerebrovascular accident: A proposal for early corrective surgery. J Pediatr (1970) 77(6):1004-1009. Shimogonya Y, Ishikawa T, Imai Y, Matsuki N, Yamaguchi T: Can temporal fluctuation in spatial wall shear stress gradient initiate a cerebral aneurysm? A proposed novel haemodynamic index, the gradient oscillatory number (gon). J Biomech (2009) 42(4):550-554. Sho E, Sho M, Singh TM, Nanjo H, Komatsu M, Xu C, Masuda H, Zarins CK: Arterial enlargement in response to high flow requires early expression of matrix metalloproteinases to degrade extracellular matrix. Exp Mol Pathol (2002) 73(2):142-153. Shojima M, Oshima M, Takagi K, Torii R, Hayakawa M, Katada K, Morita A, Kirino T: Magnitude and role of wall shear stress on cerebral aneurysm: Computational fluid dynamic study of 20 middle cerebral artery aneurysms. Stroke (2004) 35(11):2500-2505. Shojima M, Oshima M, Takagi K, Torii R, Nagata K, Shirouzu I, Morita A, Kirino T: Role of the bloodstream impacting force and the local pressure elevation in the rupture of cerebral aneurysms. Stroke (2005) 36(9):1933-1938. Singh PK, Marzo A, Coley SC, Berti G, Bijlenga P, Lawford PV, Villa-Uriol MC, Rufenacht DA, McCormack KM, Frangi A, Patel UJ et al: The role of computational fluid dynamics in the management of unruptured intracranial aneurysms: A clinicians' view. Comput Intell Neurosci (2009) 760364. Siouffi M, Deplano V, Pélissier R: Experimental analysis of unsteady flows through a stenosis. J Biomech (1998) 31(1):11-19. Solenski NJ, Haley EC, Jr., Kassell NF, Kongable G, Germanson T, Truskowski L, Torner JC: Medical complications of aneurysmal subarachnoid hemorrhage: A report of the multicenter, cooperative aneurysm study. Participants of the multicenter cooperative aneurysm study. Crit Care Med (1995) 23(6):1007-1017. Solomon RA, Fink ME, Pile-Spellman J: Surgical management of unruptured intracranial aneurysms. J Neurosurg (1994) 80(3):440-446.

250
St Jean P, Hart, B. Webster, M. Steed, D. Adamson, J. Powell, J. Ferrell, R.: Alpha-1-antitrypsin deficiency in aneurysmal disease. Hum Hered (1996) 46(92-97. Stehbens WE: Medial defects of the cerebral arteries of man. J Pathol Bacteriol (1959) 78(179-185. Stehbens WE: Cerebral aneurysms and congenital abnormalities. Australas Ann Med (1962) 11(102-112. Stehbens WE: Histopathology of cerebral aneurysms. Arch Neurol (1963) 8(272-285. Stehbens WE: Aneurysms and anatomical variation of cerebral arteries. Arch Pathol (1963b) 75(45-64. Stehbens WE: Pathology of the cerebral blood vessels. Mosby, St. Louis (1972). Stehbens WE: Aetiology of intracranial berry aneurysms. J Neurosurg (1989) 70(6):823-831. Steiger HJ, Aaslid R, Keller S, Reulen HJ: Growth of aneurysms can be understood as passive yield to blood pressure. An experimental study. Acta Neurochir (Wien) (1989) 100(1-2):74-78. Steinman DA, Milner JS, Norley CJ, Lownie SP, Holdsworth DW: Image-based computational simulation of flow dynamics in a giant intracranial aneurysm. AJNR Am J Neuroradiol (2003) 24(4):559-566. Steinman DA: Image-based computational fluid dynamics: A new paradigm for monitoring haemodynamics and atherosclerosis. Current drug targets Cardiovascular & haematological disorders (2004) 4(2):183-197. Stergiopulos N, Young DF, Rogge TR: Computer simulation of arterial flow with applications to arterial and aortic stenoses. J Biomech (1992) 25(12):1477–1488. Strother CM, Graves VB, Rappe A: Aneurysm haemodynamics: An experimental study. AJNR Am J Neuroradiol (1992) 13(4):1089-1095.

251
Stuntz JT, Ojemann GA, Alvord EC, Jr.: Radiographic and histologic demonstration of an aneurysm developing on the infundibulum of the posterior communicating artery. Case report. J Neurosurg (1970) 33(5):591-595. Sun Q, Groth A, Aach T: Comprehensive validation of computational fluid dynamics simulations of in-vivo blood flow in patient-specific cerebral aneurysms. Med Phys (2012) Feb;39(2):742-754. Sun Q, Groth A, Bertram M, Waechter I, Bruijns T, Hermans R, Aach T: Phantom-based experimental validation of computational fluid dynamics simulations on cerebral aneurysms. Med Phys (2010) Sep;37(9):5054-5065. Suyama K, Mizota S, Minagawa T, Hayashi K, Miyazaki H, Nagata I: A ruptured anterior communicating artery aneurysm associated with internal carotid artery agenesis and a middle cerebral artery anomaly. J Clin Neurosci (2009) 16(4):585-586. Suzuki J, Hori S, Sakurai Y: Intracranial aneurysms in the neurosurgical clinics in japan. J Neurosurg (1971) 35(1):34-39.
T Takahashi M, Fujimoto T, Suzuki R, Asai J, Miyo T, Hokaku H: [a case of spontaneous middle cerebral artery occlusion associated with a cerebral aneurysm angiographically disappearing after sta-mca anastomosis]. No Shinkei Geka (1997) 25(8):727-732. Takayama K, Nakagawa H, Iwasaki S, Taoka T, Myouchin K, Wada T, Sakamoto M, Fukusumi A, Kurokawa S, Kichikawa K: Multiple cerebral aneurysms associated with takayasu arteritis successfully treated with coil embolization. Radiat Med (2008) 26(1):33-38. Tang BT, Pickard SS, Chan FP, Tsao PS, Taylor CA, Feinstein JA: Wall shear stress is decreased in the pulmonary arteries of patients with pulmonary arterial hypertension: An image-based, computational fluid dynamics study. Pulm Circ (2012) 2(4):470-476.

252
Tappura M: Prognosis of subarachnoid haemorrhage. A study of 120 patients with unoperated intracranial aneurysms and 267 patients without vascular lesions demonstrable in bilateral carotid angiograms. Acta Med Scand Suppl (1962) 392(1):75. Tateshima S, Murayama Y, Villablanca JP, Morino T, Nomura K, Tanishita K, Vinuela F: In vitro measurement of fluid-induced wall shear stress in unruptured cerebral aneurysms harboring blebs. Stroke (2003) 34(1):187-192. Tateshima S, Tanishita K, Omura H, Villablanca JP, Vinuela F: Intra-aneurysmal haemodynamics during the growth of an unruptured aneurysm: In vitro study using longitudinal ct angiogram database. AJNR Am J Neuroradiol (2007) 28(4):622-627. Taylor CL, Yuan Z, Selman WR, Ratcheson RA, Rimm AA: Cerebral arterial aneurysm formation and rupture in 20,767 elderly patients: Hypertension and other risk factors. J Neurosurg (1995) 83(5):812-819. Taylor CL, Yuan Z, Selman WR, Ratcheson RA, Rimm AA: Cerebral arterial aneurysm formation and rupture in 20,767 elderly patients: Hypertension and other risk factors. J Neurosurg (1995) 83(5):812-819. Thiex R, Norbash AM, Frerichs KU: The safety of dedicated-team catheter-based diagnostic cerebral angiography in the era of advanced noninvasive imaging. AJNR Am J Neuroradiol (2010) 31(2):230-234. Thompson RC, Steinberg GK, Levy RP, Marks MP: The management of patients with arteriovenous malformations and associated intracranial aneurysms. Neurosurgery (1998) 43(2):202-211; discussion 211-202. Tian G, Longest PW, Su G, Hindle M: Characterization of respiratory drug delivery with enhanced condensational growth using an individual path model of the entire tracheobronchial airways. Ann Biomed Eng (2011) Mar;39(3):1136-1153. Toftdahl DB, Torp-Pedersen C, Engel UH, Strandgaard S, Jespersen B: Hypertension and left ventricular hypertrophy in patients with spontaneous subarachnoid hemorrhage. Neurosurgery (1995) 37(2):235-239; discussion 239-240.

253
Tromp G, Gatalica Z, Skunca M, Berguer R, Siegel T, Kline RA, Kuivaniemi H: Elevated expression of matrix metalloproteinase-13 in abdominal aortic aneurysms. Ann Vasc Surg (2004) 18(4):414-420. Teunissen LL, Rinkel GJ, Algra A, van Gijn J: Risk factors for subarachnoid hemorrhage: A systematic review. Stroke (1996) 27(3):544-549. Turjman F, Massoud TF, Ji C, Guglielmi G, Vinuela F, Robert J: Combined stent implantation and endosaccular coil placement for treatment of experimental wide-necked aneurysms: A feasibility study in swine. AJNR American journal of neuroradiology (1994) 15(6):1087-1090. Turowski B, Hanggi D, Siebler M: Intracranial bilateral vertebral artery dissection during anticoagulation after cerebral venous and sinus thrombosis (csvt). Acta Neurochir (Wien) (2007) 149(8):793-797; discussion 797.
U Ujiie H, Tachibana H, Hiramatsu O, Hazel AL, Matsumoto T, Ogasawara Y, Nakajima H, Hori T, Takakura K, Kajiya F: Effects of size and shape (aspect ratio) on the haemodynamics of saccular aneurysms: A possible index for surgical treatment of intracranial aneurysms. Neurosurgery (1999) 45(1):119-129; discussion 129-130. Uihlein A: Profound hypothermia and circulatory arrest in operations for intracranial aneurysms. Ann Chir Thorac Cardiovasc (1962) 1(811-812.
V Varaprasathan GA, Araoz PA, Higgins CB, Reddy GP: Quantification of flow dynamics in congenital heart disease: Applications of velocity-encoded cine mr imaging. Radiographics (2002) 22(4):895-905; discussion 905-896. Vardoulis O, Coppens E, Martin B, Reymond P, Tozzi P, Stergiopulos N: Impact of aortic grafts on arterial pressure: A computational fluid dynamics study. Eur J Vasc Endovasc Surg (2011) Aug 31.([Epub ahead of print]).

254
Verheugt CL, Uiterwaal CS, Grobbee DE, Mulder BJ: Long-term prognosis of congenital heart defects: A systematic review. Int J Cardiol (2008) 131(1):25-32. Vignon-Clementel IE, Figueroa C.A., Jansen K.E., Taylor C.A.: Outflow boundary conditions for three-dimensional finite element modeling of blood flow and pressure in arteries. Comput Methods Appl Mech Eng (2006) 195(3776–3796 Villa-Uriol MC, Berti G, Hose DR, Marzo A, Chiarini A, Penrose J, Pozo J, Schmidt JG, Singh P, Lycett R, Larrabide I et al: @neurist complex information processing toolchain for the integrated management of cerebral aneurysms. Interface Focus (2011) Jun 6(3):308-319. Venugopal P, Valentino D, Schmitt H, Villablanca JP, Vinuela F, Duckwiler G: Sensitivity of patient-specific numerical simulation of cerebal aneurysm haemodynamics to inflow boundary conditions. J Neurosurg (2007) 106(6):1051-1060. Viceconti M, Astolfi, L., Leardini, A., Imboden, S., Petrone, M., Quadrani, P., Taddei, F., Testi, D., Zannoni, C.: The multimod application framework.:Abs 15-20. 2004. Vignon-Clementel IE, Figueroa C.A., Jansen K.E., Taylor C.A.: Outflow boundary conditions for three-dimensional finite element modeling of blood flow and pressure in arteries. Comput Methods Appl Mech Eng (2006) 195(3776–3796
W Waga S, Morikawa A: Aneurysm developing on the infundibular widening of the posterior communicating artery. Surg Neurol (1979) 11(2):125-127. Wagner CT, Durante W, Christodoulides N, Hellums JD, Schafer AI: Haemodynamic forces induce the expression of heme oxygenase in cultured vascular smooth muscle cells. J Clin Invest (1997) 100(3):589-596. Walker AE, Allegre GW: The pathology and pathogenesis of cerebral aneurysms. J Neuropathol Exp Neurol (1954) 13(1):248-259.

255
Wang DM, Tarbell JM: Modeling interstitial flow in an artery wall allows estimation of wall shear stress on smooth muscle cells. J Biomech Eng (1995) 117(3):358-363. Wang Z, Kolega J, Hoi Y, Gao L, Swartz DD, Levy EI, Mocco J, Meng H: Molecular alterations associated with aneurysmal remodeling are localized in the high haemodynamic stress region of a created carotid bifurcation. Neurosurgery (2009) 65(1):169-177; discussion 177-168. Weichert F, Walczak L, Fisseler D, Opfermann T, Razzaq M, Münster R, Turek S, Grunwald I, Roth C, Veith C, Wagner M: Simulation of intra-aneurysmal blood flow by different numerical methods. Comput Math Methods Med (2013) Epub 2013 Apr 15(527654. Weir B, Macdonald, R.L.: Intracranial aneurysms and subarachnoid hemorrhage: An overview. In: Neurosurgery. 2. Wilkins RH, Rengachary, S.S. (Ed) McGraw-Hill, New York (1996):2191–2213. Wermer MJ, van der Schaaf IC, Velthuis BK, Algra A, Buskens E, Rinkel GJ, Group AS: Follow-up screening after subarachnoid haemorrhage: Frequency and determinants of new aneurysms and enlargement of existing aneurysms. Brain (2005) 128(Pt 10):2421-2429. Werner SC, Blackemore, A.H., King, B.C.: Aneurysm of internal carotid artery within skull, wiring and electrothermic coagulation. JAMA (1941) 116(578-582. Westerhof N, Bosman F, De Vries CJ, Noordergraaf A: Analog studies of the human systemic arterial tree. J Biomech (1969) 2(2):121-143. Wiebers DO, Whisnant JP, Huston J, 3rd, Meissner I, Brown RD, Jr., Piepgras DG, Forbes GS, Thielen K, Nichols D, O'Fallon WM, Peacock J et al: Unruptured intracranial aneurysms: Natural history, clinical outcome, and risks of surgical and endovascular treatment. Lancet (2003) 362(9378):103-110. Willis T: Cerebri anatome cui accessit nervorum descriptio et usus. (1664). Wirth FP, Laws ER, Jr., Piepgras D, Scott RM: Surgical treatment of incidental intracranial aneurysms. Neurosurgery (1983) 12(5):507-511.

256
Womersley JR: Method for the calculation of velocity, rate of flow and viscous drag in arteries when the pressure gradient is known. J Physiol (1955) 127(3):553-563. Wong GK, Poon WS: Current status of computational fluid dynamics for cerebral aneurysms: The clinician's perspective. J Clin Neurosci (2011) Oct;18(10):1285-1288.
X Xu J, Yu Y, Wu X, Wu Y, Jiang C, Wang S, Huang Q, Liu J: Morphological and haemodynamic analysis of mirror posterior communicating artery aneurysms. PLoS One (2013) 8(1):e55413.
Y Yasui N, Magarisawa S, Suzuki A, Nishimura H, Okudera T, Abe T: Subarachnoid hemorrhage caused by previously diagnosed, previously unruptured intracranial aneurysms: A retrospective analysis of 25 cases. Neurosurgery (1996) 39(6):1096-1100; discussion 1100-1091. Yamashita K, Kashiwagi S, Kato S, Takasago T, Ito H: Cerebral aneurysms in the elderly in yamaguchi, japan. Analysis of the yamaguchi data bank of cerebral aneurysm from 1985 to 1995. Stroke (1997) 28(10):1926-1931. Yong-Zhong G, van Alphen HA: Pathogenesis and histopathology of saccular aneurysms: Review of the literature. Neurol Res (1990) 12(4):249-255.
Z Zada G, Breault J, Liu CY, Khalessi AA, Larsen DW, Teitelbaum GP, Giannotta SL: Internal carotid artery aneurysms occurring at the origin of fetal variant posterior cerebral arteries: Surgical and endovascular experience. Neurosurgery (2008) 63(1 Suppl 1):ONS55-61; discussion ONS61-52. Zeng Z, Kallmes DF, Durka MJ, Ding Y, Lewis D, Kadirvel R, Robertson AM: Sensitivity of cfd based haemodynamic results in rabbit aneurysm models to idealizations in surrounding vasculature. J Biomech Eng (2010) Sep;132(9):091009.

17Journal of Vascular and Interventional Neurology, Volume 3, Number 1, January 2010
`
The Effects of Aortic Coarctation on Cerebral Hemodynamics and its Importance in the Etiopathogenesis of Intracranial Aneurysms
Abstract
Objectives: Hemodynamic changes in the cerebral circulation in presence of coarctation of aorta (CoA) and their significance in the increased intracranial aneurysms (IAs) formation in these patients remain unclear. In the present study, we measured the flow-rate waveforms in the cerebral arteries of a patient with CoA, followed by an analysis of different hemodynamic indices in a coexisting IA.
Materials and Methods: Phase-contrast Magnetic Resonance (pc-MR) volumetric flow-rate (VFR) measurements were performed in cerebral arteries of a 51 years old woman with coexisting CoA, and five healthy volunteers. Numerical predictions of a number of relevant hemodynamic indices were performed in an IA located in sub-clinoid part of left internal carotid artery (ICA) of the patient. Computations were performed using Ansys®-CFX™ solver using the VFR values measured in the patient as boundary conditions (BCs). A second analysis was performed using the average VFR values measured in healthy volunteers. The VFR waveforms measured in the patient and healthy volunteers were compared followed by a comparison of the hemodynamic indices obtained using both approaches. The results are discussed in the background of relevant literature.
Results: Mean flow-rates were increased by 27.1% to 54.9% (2.66-5.44 ml/sec) in the cerebral circulation of patients with CoA as compared to healthy volunteers (1.2-3.95 ml/sec). Velocities were increased inside the IA by 35-45%. An exponential rise of 650% was observed in the area affected by high wall shear stress (WSS>15Pa) when flow-rates specific to CoA were used as compared to population average flow-rates. Absolute values of space and time averaged WSS were increased by 65%. Whereas values of maximum pressure on the IA wall were increased by 15% the area of elevated pressure was actually decreased by 50%, reflecting a more focalized jet impingement within the IA of the CoA patient.
Conclusions: IAs can develop in patients with CoA several years after the surgical repair. Cerebral flow-rates in CoA patients are significantly higher as compared to average flow-rates in healthy population. The increased supra-physiological WSS (>15Pa), OSI (>0.2) and focalized pressure may play an important role in the etiopathogenesis of IAs in patients with CoA.
Keywords: Coarctation of aorta, intracranial aneurysms, cerebral circulation, flow-rates, hemodynamics, wall shear stress, computational fluid dynamics
Journal of Vascular and Interventional Neurology 2010;3(1) 17-30
Introduction:
Estimated annual incidence of IAs in most Western countries is estimated to be at 1 to 2%.7,49 Subarachnoid hemorrhage (SAH) can be a consequence with a high overall mortality rates approximating 45% (range 32-67%).46 About 30% of survivors have moderate to severe disabilities and 66% of those who have ‘successful’ clip placement, never return to same quality of life as before SAH.23,46 The current evidence convincingly supports a multi-factorial basis for the initiation and rupture of IAs.88,92,108
Amongst other etiologies proposed, CoA has been highlighted as a major risk factor in the etiopathogenesis of IAs.1,3,15,24,27,48,50,53,62,70,75,78,87 A wide range for the incidence of IAs in patients with CoA has been reported starting from 2.5%1 to as high as 50%,89 all above the estimated
original Contribution
Pankaj K Singh, MRCSAlberto Marzo, PhDCristina Staicu, PhDMatt G William, PhDIain Wilkinson, PhDPatricia V Lawford, PhDDaniel A Rufenacht, MDPhilippe Bijlenga, MDAlejandro F Frangi, PhDRodney Hose, PhDUmang J Patel, FRCSStuart C Coley, MD
Address Correspondence to:Pankaj K Singh, MRCSClinical Research Fellow, Departments of Neurosurgery/Medical Physics, Royal Hallamshire Hospital, Sheffield, UKEmail: [email protected]: +44 114 2712180Fax: +44 114 2713314

18 Journal of Vascular and Interventional Neurology, Volume 3, Number 1, January 2010
incidence of IAs in general population. Connolly and colleagues in their recent study confirmed that the frequency of IAs among patients with CoA is approximately 5 times higher than that of the general population.15 The incidence of IA rupture in CoA patients (4.8%)70,83 is also higher than the estimated rate of rupture in the general population which is less than 1%.106 In spite of CoA being a well-established risk factor for IA formation,1,3,15,24,27,48,50,53,62,70,75,78,87 the exact underlying mechanisms for this association remain poorly understood. Hypertension3,9,24,50,75,78,92,95 and developmental errors of neural crest resulting in abnormal vessel wall collagen15,17,48,53,62,70,87, are two main factors thought to facilitate the formation of IAs in presence of CoA. It is surprising to note that in spite of well established role of wall shear stress (WSS) in the genesis of IAs,11,32,38,40-42,65,69,72,91,104 none of the workers explored this important link in this context.
Owing to their direct origin from the pre-coarctation segment of aorta, cerebro-cephalic arteries are most likely to be affected by the hemodynamic changes occurring in this part of aorta. Secondary to the increased resistance to outflow, increased aorto-cranial pressure gradients have been demonstrated by a number of authors correlating to the severity of stenosis.1,36,45,71,102 Dilatation of cervico-cephalic arteries in CoA secondary to this increased pressure gradient is has also been reported.1,85
An increase in the radius (r) of cerebral arteries and increased aorto-cranial pressure gradient (ΔP) in CoA are expected to result in an exponential rise in flow-rates (Q) as per the Hagan-Poiseuille law (Equation-1), given the viscosity (µ) and length (L) remain constant.
............. (Eq-1)
Furthermore, bradycardia coupled with increased stroke volume
and cardiac output is a known feature of CoA.36 These increments will further increase the cerebral blood-flow (CBF).
An increased flow-rate (Q), in turn is one of the major factors responsible for increased wall shear stress (WSS) in the intracranial arteries (Equation-2).
................. (Eq-2)
Where τ is WSS
Literature seems to be particularly deficient and controversial on the effects of CoA on cerebral arterial flow-rates. After a thorough search (PubMed®, Embase® and Google-Scholar™ searched from the year 1900 up to 2009) we could retrieve only two relevant studies. In 1949 Hafkenschiel et al37 demonstrated a significant increase in cerebral arterial flow-rates in patients with CoA. Rowe and colleagues85 found no significant differences in the flow-rates before and after the repair of CoA in their study done in 1964. No apparent efforts were done since then to measure the cerebral arterial flow-rates in patients with CoA. Paucity of information about the flow patterns inside the cerebral circulation in presence of CoA provided us a rationale to measure the cerebral arterial flow-rates in the present patient. Furthermore, given the widely accepted importance of hemodynamics in the etiopathogenesis of IAs11,32,38,40-42,65,69,72,91,104 it is logical to analyze the hemodynamic factors in the coexisting IA of our patient. A better understanding of the etiopathogenesis of the IA formation and rupture may help clinicians in preventing and treating the disease effectively.
In the current study, we preformed pc-MR measurements in the cerebral arteries of a CoA patient with coexisting IA and five healthy volunteers followed by an analysis of the different hemodynamic factors inside IA. The possible role of
Figure 1: 24 hours ambulatory Non-invasive BP
(NIBP) monitoring showing satisfactory BP control
for both systolic and diastolic values.

19Journal of Vascular and Interventional Neurology, Volume 3, Number 1, January 2010
hemodynamics is discussed in this context in a background of relevant literature.
Materials and methods
The study was conducted jointly in the departments of Neurosurgery and Neuroradiology, Royal Hallamshire Hospital, and the Academic Unit of Medical Physics, and Radiology, School of Medicine and Biomedical Sciences, University of Sheffield, Sheffield, UK. After obtaining appropriate consent and ethical approval the patient was recruited to the @neurIST project (www.aneurist.org).
Clinical details: This 51 years old woman, presented for the first time to cardiovascular surgeons in 1989 at the age of 31 years through obstetric unit. She had hypertension during both her pregnancies but was otherwise asymptomatic. She was a cigarette smoker, smoking 10-15 cigarettes per day. On clinical examination, she appeared fit and well with a blood pressure (BP) of 160/90 mm Hg. No femoral pulses were palpable and there was an ejection systolic murmur in the aortic area coupled with a continuous machinery murmur at left scapula. She was taking oral antihypertensives (Atenolol and Nifedipine) to control her hypertension. Subsequent investigations including DVI (digital vascular scan) done at that time revealed a severe (>80% reduction in diameter) post-ductal aortic coarctation distal to origin of left subclavian artery. X-ray chest showed typical inferior notching of 3rd and 8th ribs, bilaterally. No other congenital anomalies were detected apart from a pseudo-bicuspid aortic valve, without any
evidence of regurgitation or stenosis. One year later, the patient was treated with Dacron onlay patch graft (DOPG) repair for her coarctation with an uneventful postoperative recovery.
A follow-up MRI of heart done in July 2004 after 15 years of primary procedure demonstrated evidence of re-occurrence of coarctation with significant (60-70%) loss of luminal diameter. The stenosis occurred just distal to the origin of left subclavian artery coinciding with the site of repair. Presence of significant collaterals was also noted along with marginal concentric hypertrophy of left ventricle but adequate ejection fraction. A BRUCE treadmill stress test done to evaluate cardiac fitness demonstrated an appropriate exercise tolerance without any chest pain or ECG changes. A 24-hour BP monitoring further confirmed a satisfactory BP control (Fig-1). A completely asymptomatic status with no signs of cardiac failure was the reason to manage her conservatively.
The patient was referred to Neurosurgery in May 2007 with complaints of tingling and numbness affecting right side of her face. On further interrogation, she gave history of a similar episode three years back resulting in spontaneous resolution, but no other neurological symptoms. On clinical examination, she had no neurological deficits. An MRI demonstrated presence of two incidental IAs. First aneurysm was located in the pericallosal artery and was 4.2 mm in maximum diameter. A second small broad necked 1 mm aneurysm was also present at the origin of left anterior temporal artery arising from the proximal left middle cerebral artery (MCA). The findings were further confirmed by a
Figure 2: Intracranial aneurysm included in the study shown in (a) circle of Willis (yellow sphere- arrowhead) and (b) in subclinoid part of ICA (arrow)

20 Journal of Vascular and Interventional Neurology, Volume 3, Number 1, January 2010
3D rotational angiogram (3DRA), which apart from two previous IAs, also revealed an approximately 1.8 mm aneurysm in the subclinoid segment of left internal carotid artery (ICA), pointing medially (Fig-2). The case was discussed in a multidisciplinary meeting with Neuroradiologists and it was found that due to its small neck the pericallosal IA was suitable for coil embolization.
3DRA acquisition: All medical images were obtained using rotational acquisition in a Philips® Integris™ Allura machine (Philips® Medical Systems, Best, The Netherlands), producing 100 images in 6 seconds, with 5 ms exposure per image. Voxel size in the reconstructed 3D images was 121 microns with reconstruction matrix of 512 x 512 x 512.
Endovascular Interventions: The pericallosal artery aneurysm was embolized under general anaesthesia in May 2008 with GDC® (Guglielmi Detachable Coils). A 6-french guided catheter was gently placed within the distal right internal carotid artery (ICA). The aneurysm was catheterized with an Excelsior® SL-10 microcatheter using a Transend® 14 guidewire (Boston Scientific, USA). The IA was packed satisfactorily using four Micrus® Cerecyte® endovascular bare platinum coils. She made an uneventful recovery from the procedure. Owing to their small size and anticipated difficulties for endovascular coiling (broad neck) remaining two aneurysms were decided to be observed by follow-up MRAs.
Flow Measurements & pc-MR protocol: MR imaging was performed
at high field strength (Achieva™ 3.0T, Philips® Medical Systems, Best, The Netherlands) using a standard 8-channel, radiofrequency receive-only head coil. The same radiographer imaged the patient and all volunteers to maximize reproducibility of overall acquisition technique. Macroscopic vascular flow and IA location were visualized using a qualitative Time-Of-Flight (TOF) MR angiography sequence (TR=25 ms; TE=3.5 ms; α=20˚; visualization voxel size = 0.39 x 0.39 x 1.00 mm3). Maximum intensity projections from this 3D dataset were used to define the placement of each quantitative phase contrast measurement plane perpendicular to the vessel under investigation. A 2D acquisition sequence (TR=8 ms; TE=4.4 ms; α=10˚; field of view=220 x 179 mm;2 in-plane acquisition matrix=128 x 112; slice thickness=5 mm) was used to acquire 40 velocity-encoded ‘time points’ over the cardiac cycle at each vascular location. Vector ECG triggering was used to standardize each quantitative acquisition.
The measurements were performed at three locations, both in healthy volunteers and in patient viz. left proximal ICA, left distal ICA, and left ACA A-1 segment. An appropriate maximum velocity-encoding (VENC) value was chosen (100 cm/sec) for ICA to ensure that appropriate dynamic ranges were sampled in all cases and no phase-aliasing occurred. As proximal vessels geometry has an important influence on intra-aneurysmal hemodynamics,13 measurements were taken at a distance of approximately 10 vessel diameters from the aneurysm location so that BCs to the numerical models could be applied at a sufficient distance from the location of the aneurysm. Measurement
Figure 3: A comparison of VFR waveforms from CoA patient (marked-red) measured in proximal ICA and average VFR waveforms from healthy volunteers (marked-
blue) in the same location. The flow-rates in presence of CoA are 1.5 times higher (5.44 ml/sec) as compared with the normal healthy individuals (3.62 ml/sec). Solid
horizontal lines represent average values of VFR for CoA (red) and typical (blue).

21Journal of Vascular and Interventional Neurology, Volume 3, Number 1, January 2010
location in distal vessels was approximately 3 diameters from the IA.
Measurements are reported in Fig-3 and Table-1. The manufacturer’s proprietary post-data-acquisition processing software (Q-Flow™, Philips® Medical Systems, Best, The Netherlands) was used to estimate VFR waveforms at each spatial location.
Transthoracic Doppler echocardiography: Flow and pressure measurements were performed using transthoracic Doppler echocardiography (Philips® Sonos™ 5500). The results are reported in Fig-5.
Numerical 3D models and computational fluid dynamics (CFD) analysis: The @neurIST computational tool-chain was used to reconstruct vessel and aneurysmal geometries, as described by Marzo et al.66 The 3D transient Navier–Stokes equations were solved by using the finite-control-volume software ANSYS®-CFX™. Blood was assumed to be incompressible, with density ρ=1060 kg/m3 and Newtonian, with viscosity µ=0.0035 Pa∙s. The relevant hemodynamic indices were computed (Table-2) in the IA located in subclinoid part of left ICA (Fig-2) of the patient using the VFR values measured in the patient as BCs. A second analysis was performed with BCs derived from the average VFR values measured in healthy volunteers. Location, type and method of BC applied in the study are indicated in Table-1. All analyses were run in parallel on two Itanium2® 900 MHz 64-bit processors. The average time required to solve one cardiac cycle was approximately 8.6 Hr. Analyses were run for three cardiac cycles, to minimize the effects of the initial transient effects, and only results from the last cardiac cycle were post-processed.
Results
Flow measurements in intracranial arteries of healthy volunteers and patient with CoA
On comparing the patient-specific waveforms (Fig-3) from CoA patient (red) with that of typical normal individual (blue) it becomes apparent that the VFR waveform in the proximal ICA of CoA patient is higher than the one for the healthy volunteers. This is also reflected by the average values reported in Table-1 where the flow-rates for the CoA patient are 1.5 times higher (5.44 ml/sec) as compared to the normal healthy individuals (3.62 ml/sec).
The flow waveforms further illustrate that the cerebral arterial flow in CoA rises and falls slowly than that of a typical individual but the overall volume over one cardiac cycle is increased from 3.48 ml to 4.54 ml. A new broad hump (arrow-b) is seen just after the original peak (arrow-a). The systolic upstroke is delayed and slow; the peak is broader (between arrows a & b), slightly lower and dumped. The flow during diastole is almost a smooth decline curve (arrow-c) and the notch indicating the beginning of diastole is absent (arrow-d).
Table-1: Radiological characteristics of the IA included in the study, the pc-MR measurements in CoA patient and healthy volunteers along with the locations, types
and methods of BC application
IA Location,
Size* and Neck
Size*
Q-flow measurements using pc-MR and BC application
Lt ICA
Subclinoid,
1.8mm,
3.1mm
Location of Q-Flow
measurements
Q-av-Typical
Healthy
Volunteers (ml/s)
Q-av-CoA
patient (ml/s)
Change
(%)
BC location BC type BC Method†
1. Lt ICA Proximal 3.95 5.44 +27.4 1. Lt ICA Proximal Inlet/velocity pc-MR
2. Lt ICA Distal 3.7 5.07 +27.1 2. Lt ICA Distal Outlet/velocity pc-MR
4. Lt ACA 1.2 2.66 +54.9 3. Lt OphthA Outlet/pressure
Typical/population
average
NB: Q-av; average blood flow, BC; boundary condition, Lt; left, Rt; right, ICA; internal carotid artery, MCA; middle cerebral artery, OphthA; ophthalmic artery, *size
is reported as max diameter. †BC method refers to the analyses based on patient-specific BC from CoA patient.

22 Journal of Vascular and Interventional Neurology, Volume 3, Number 1, January 2010
Contour plots for hemodynamic indices and their absolute values
Figure 4: Time-averaged WSS (top) and OSI (Oscillatory shear index) (bottom) contour plots in the left subclinoid intracranial aneurysm of the CoA patient. Whereas,
areas affected by high WSS are increased in CoA patient (top, right) as compared with healthy volunteers (top, left) OSI patterns are minimally changed.

23Journal of Vascular and Interventional Neurology, Volume 3, Number 1, January 2010
Figure 5: Transthoracic Doppler echocardiogram showing aortic coarctation with a diastolic tail. A coarctation gradient of 30-40mmHg was seen (arrowhead) while
the average aortic pressure gradient was 16 mmHg. The peak velocity in aorta was 276cm/sec.
Table 2: Absolute values of WSS, OSI, velocity and pressure for IA, obtained using BCs derived from healthy volunteers and measurements taken in CoA patient by
pc-MR
Hemodynamic Indices BCs derived from healthy volunteers (without CoA)
BCs derived from patient (with CoA)
% difference
Max t-ave velocity (m/s) 0.5 0.72 +44
Space and t-ave velocity (m/s) 0.072 0.097 +35
Max OSI 0.3 0.3 0
Area of WSS below 0.4 Pa (mm2) 0.05 (0.3%) 0.03 (0.2%) -34
Area of WSS above 15 Pa (mm2) 0.4 (0.4%) 3.0 (17.2%) +650
Space and t-ave WSS in aneurysm (Pa) 5.7 9.4 +65
Max pressure on aneurysm wall (mmHg)*
122.4 140.8 +15
Area of elevated pressure (mm2)* 3.0 (17.1%) 1.5 (8.5%) -50%
NB: WSS; wall shear stress, OSI; oscillatory shear index, Max; maximum, ave; average, t; time, BC; boundary condition, * indicates the values at peak systole

24 Journal of Vascular and Interventional Neurology, Volume 3, Number 1, January 2010
Discussion
The CoA is a connective tissue disorder accounting for 10% of the cases of congenital heart disease.103 The most common site of narrowing is distal to the left subclavian artery. Due to the mechanical outflow obstruction and extensive collateral formation a number of hemodynamic changes are seen in CoA. The most notable is a differential hypertension produced in the segment of aorta above the site of narrowing leading to increased aorto-cranial pressure gradients1,36,45,71,102 and dilatation of cervico-cephalic arteries.1,85 Similar changes were seen in our patient (Fig-5). A pressure gradient of 30-40 mmHg was present at the site of coarctation as compared to the mean aortic pressure gradient of 16 mmHg. The peak velocity in aorta was also increased to 276 cm/sec when compared to the peak velocity of 80-90 cm/sec in the aorta of a normal person.19 As discussed in the previous sections, it is hypothesized here that the regional cerebral blood flow (rCBF) in CoA patients should increase as a consequence of these changes.
It is surprising to see that such little attention is devoted on the effects of CoA on rCBF. The first available study on the subject was conducted by Hafkenschiel et al37 in 1949. They measured rCBF and cerebral oxygen consumption in two patients with CoA using nitrous oxide (N
2O) saturation method and found
that the rCBF in patients with CoA was higher as compared with normal subjects.
A similar study was done by Rowe and colleagues85 in 1964 who measured the rCBF in 20 CoA patients using the same technique. The rCBF was measured in these patients before and after the surgical correction of CoA and the results were compared with rCBF values obtained in normal subjects in their previous study,86 and rCBF values specific to hypertensive patients.18 No significant differences were noted in the rCBF pre and post surgical repair of coarctation and, between CoA patients and hypertensive patients. Interestingly, the comparison of rCBF in CoA patients and healthy volunteers suggested that the values of average rCBF measured by them (63±13 ml/100 gm/ min) were approximately 21% higher compared to the rCBF measured in 8 normal subjects (52±12 ml/100 gm/ min)86 but not statistically significant . The postoperative measurements in this study were taken at an average interval of 21 months (maximum 9.25 yrs) from the time of surgery which may have obscured some of the differences. Re-occurrence of coarctation is a frequent complication following surgery that can occur in 41-86% patients.44 The similar patterns were observed in our patient where 60-70% loss of luminal diameter occurred 14 years after repair. As the diameter of aorta was not assessed by Rowe and colleagues85 at the time of rCBF measurements, the possibility of recoarctation in these patients cannot be ruled out which might account for the lack of difference in the rCBF before and after surgical correction.
The measurements of rCBF in both studies were performed using the oldest available technique based on N
2O diffusion
and Fick’s principle introduced by Kety and Schmidt in 1951.57 The technique provides the measurements of global CBF rather than the regional values. The accuracy of measurements is
dependent upon the reliability of the blood sample withdrawn from a single jugular vein which can be influenced by the flow variations in dural sinuses and torcula.52 With the advent of new technology, the technique of rCBF measurement has evolved tremendously. The use of pc-MR in this context is gaining a rapid popularity.10,25,26,84,101,107 The rCBF can be measured using this technique in a simple non-invasive manner without the need of any intravenous contrast administration and has been validated widely by means of in vitro and in vivo experiments.8,12,28,58
Recent evidence however indicates that the local variations in the hemodynamics that play an important role in the etiopathogenesis of IAs32,38,40-42,65,69,72,104 highlighting the importance of assessing the local flow patterns. No previous study however has examined the local hemodynamics in presence of CoA. According to the Hagan-Poiseuille law, we hypothesized that the local VFR should increase in patients with CoA. The pc-MR measurements performed prior to repair of the CoA in our study confirmed this hypothesis by demonstrating an increase of local regional CBF by 27.1 to 54.9% (Table-1) in ICA and ACA respectively, when compared to healthy volunteers. As a result space and time averaged velocity and max time average velocities inside the coincidental IA present were also increased by 35-44% (Table-2) when the BCs specific to CoA were used.
We further hypothesize that the increased VFR can be an important contributory factor in the increased incidence of IAs in presence of CoA. The possible mechanisms responsible for increased incidence of IAs in CoA patients are explored in the further sections of this manuscript. Eppinger was the first person to draw attention towards the association between CoA and IAs in 1871.27 Whereas the exact mechanisms responsible for this increased incidence remained obscure, arterial hypertension has been suggested as a possible underlying cause by most of the authors (Table-3).3,9,24,50,75,78,92,95 Stehbens was the strongest proponent of this theory who particularly stressed on the importance of hypertension in this context while denying the role of all other factors including vessel wall abnormalities.92,95 This assumption is probably based on two observations. First, hypertension is often a constant feature in CoA patients. Second, hypertension has been considered as a major risk factor for the development of IAs even without CoA.22,99 In spite of an increased prevalence of IAs in hypertensive patients the role of hypertension in this context has been questioned by many authors. McCormick and Schmalstieg found no relationship between arterial hypertension and IAs in 250 patients they studied.67 In a similar study conducted in 212 cases, Andrews and Spiegel6 did not find significant elevation in the blood pressure in patients with IAs compared with the general population. However, studies supporting hypertension as a risk factor for the development and rupture of IAs outnumber the studies refuting it. De la Monte et al22 found high degree of correlation (p<0.001) between systemic hypertension and development of saccular IAs. In one of the largest studies conducted including 20,767 elderly patients Taylor et al99 found hypertension as an independent major risk factor for aneurysmal SAH.
Although, hypertension can be an important contributory

25Journal of Vascular and Interventional Neurology, Volume 3, Number 1, January 2010
Table-3: A comprehensive review of different mechanisms proposed for the increased incidence of IAs in CoA patients
Author/ YearNo. of
Patients
IA
location/No.
HTN at
the time IA
diagnosed
Associated features Proposed Mechanism(s)
Abbot (1928) [1] 6
ACA, AcomA,
VA, PcomA,
MCA
YesReported one case of his own (MCA), rest 5 cases collected
from literatureCongenital IA
Laitinen et al
(1960) [62]1
Pericallosal/
CallosomarginalYes Oxycephalic deformity of skull Possible developmental errors
Patel et al (1971)
[78]7
ICA, AcomA(3),
ACA(3), PcomA,
BA
YesOnly pediatric population (<19 yrs) reviewed, 12% had CoA
coexisting with IAsHTN
Banna et al
(1971) [9]1 PCA NA Source of SAH was dilated spinal collaterals
Medial hypoplasia of arteries of
CoW + HTN
Stehbens (1989)
[92]Review article HTN
Orsi et al. (1993)
[75]1 MCA, ICA NA - HTN
Schievink et al
(1996)[87]1 MCA No -
Development errors of Neural Crest
leading to defective collagen and
elastin formation
Ishii et al (2001)
[50]1 AcomA Yes Coarctation of abdominal aorta HTN
Ahmetoglu et al
(2002) [3]1 B/L MCA Yes Coarctation of abdominal aorta HTN ± hemodynamic shear stress
Mercado et al.
(2002)[70]3
ICA, PcomA(2),
PeriAYes
Provided a comprehensive review of the distinct clinical
behavior of IAs in presence of CoADevelopment errors of Neural Crest
Connolley et al
(2003)[15]10
ICA, MCA,
PICA, PCA,
PcomA, AChoA,
BA tip
Yes
(in 7 out of 10
patients)
Found 10% incidence of IAs in patients with CoA, no
significant difference in BP of patients with and without IAs Development errors of Neural Crest
Cowan et al
(2004)[17]1 PcomA No
Coexisting Alagille syndrome (arteriohepatic dysplasia),
progression of infundibulum to PcomA AneurysmDevelopmental defects
Harikrishnan
(2005) [39]1 BA, VA Yes CoA of Descending aorta, coronary artery aneurysms Atherosclerosis
Hudaoglu et al
(2006)[48]1 PcomA No
Raised strong suspicions about HTN alone being a factor for
the increased incidence of IA in CoADevelopment errors of Neural Crest
Kan et al (2007)
[53]1 ICA NA
Fusiform aneurysm associated with PHACES syndrome,
positive family history of IAsDevelopment errors of Neural Crest
Singh et al
(2009)
(Present study)
1ICA, MCA,
PeriANo
Measured the CBF in CoA patient and proposed WSS as an
important factor in the formation of IAs in these patientsHemodynamic WSS
NB: PHACES syndrome; posterior fossa malformations, facial hemangiomas, arterial anomalies, CoA, cardiac defects, eye abnormalities and sterna defects, NA; not
available, B/L; bilateral, CoW; circle of Willis, BP; blood pressure, PeriA; pericallosal artery, AChoA; anterior choroidal artery, PCA; posterior cerebral artery, BA;
basilar artery, VA; vertebral artery, PICA; posterior inferior cerebeller artery, HTN; Hypertension, MCA,ICA & ACA; middle, internal & anterior cerebral arteries.

26 Journal of Vascular and Interventional Neurology, Volume 3, Number 1, January 2010
force in the etiopathogenesis of IAs in these patients, it cannot be the sole contributor. Hudaoglu et al48 raised a question on hypertension alone being a factor in the etiopathogenesis of IAs in CoA patients. The fact is further supported by the observation that IAs may develop or rupture even in normotensive patients, years after the repair of CoA.30,61,70,76 Additionally, hypertension was not uniformly noted in the patients of CoA reported to have IAs.15,87 The IAs were developed in our patient 17 years after the surgical correction of CoA. However, recoarctation of the repaired segment occurred during this period (>70% reduction in aortic diameter), the patient remained completely asymptomatic with a very well controlled blood pressure (Fig-1). Our findings also indicate towards the role of other factors working independent of arterial hypertension.
Laitinen and Snellman62 in 1960 found that apart from CoA, aneurysms of Pericallosal artery region were also associated with other concomitant malformations such as craniosynostosis and kyphoscoliosis. They believed that coexistence of these malformations with IAs is secondary to a common developmental error playing a role in their etiology. Embryologically; heart, aorta and cervico-cephalic arteries all share a common origin from neural crest. After recognizing the association between a variety of congenital heart diseases and IAs, Schievink et al87 attributed the occurrence of IAs in CoA patients to the developmental errors of neural crest resulting in abnormal vessel wall collagen. The same theory was later supported many other authors (Table-3).15,17,48,53,70
Hemodynamic stress due to increased blood flow has long been implicated in the pathogenesis of IAs. Development of IAs is reported in association with a wide range of conditions responsible for increased flow related WSS. Padget was first to draw attention towards the relationship between anatomical variations in circle of Willis and increased incidence of IAs.77 The similar findings were confirmed by other workers.4,82,94 Kayambe et al56 observed that there was a definitive correlation between the site of vascular asymmetry and the location of IA formation. This increased incidence of IAs in presence of vascular asymmetry is thought to be caused by increased hemodynamic stress secondary to compensatory increase in blood flow.56,93,94
Iatrogenic carotid artery ligation is a well established technique to produce IAs in experimental animals.38,40-42,51,73 Increased hemodynamic shear stress has been considered a major factor in the production of these experimental IAs.32,38,40-42,51,73 Apart from the carotid ligation, induced hypertension and administration of BAPN (beta aminopionitrile; a lathyrogen used to render arterial walls fragile), can potentiate the occurrence of IAs in these models . Handa et al38 divided their experimental animals into three cohorts: no carotid ligation, unilateral carotid ligation and bilateral carotid ligation. Whereas, all rats were made hypertensive and fed on BAPN, no IA was induced where carotid artery was not ligated. Furthermore, the IAs was always formed corresponding to the sites where hemodynamic stress was expected to increase after carotid ligation.
Congenital absence of ICA,14,47,96 arterivenous malformations
(AVMs),68,81,100 Takayasu’s arteritis,54,98 Moyamoya disease,2,55,59 and presence of persistent fetal circulation5,63,109 are other similar conditions where increased IAs are encountered due to increased-flow-related WSS. Development of IAs has also been observed following extra-intracranial bypass procedures,29,60,74 again secondary to increased rCBF. Resolution of these flow related IAs can occur once the cerebral hemodynamics is reestablished by addressing the underlying pathology.79,97
The importance of hemodynamic WSS in the context of CoA is somewhat poorly explored. Ahmetoglu et al (2002)3 indicated that arterial wall injury secondary to increased hemodynamic shear forces may be an important factor in the IA formation while discussing their case of abdominal aortic coarctation (AbCoA). However, the statement probably reflects their opinion towards the etiopathogenesis of IAs in general population rather than in patients with CoA. Furthermore, the inference was merely based on the literature based evidence rather than any experimental work. They finally concluded that hypertension was the main factor responsible for the rupture and growth of IAs in patients with AbCoA.3
We hypothesize that the higher WSS values secondary to increased flow-rates in cerebral circulation can be an important contributory factor in the pathogenesis of IAs in presence of CoA. WSS is a frictional force exerted tangentially on the arterial endothelium by flowing blood. It is proportional to the blood viscosity and velocity gradients. The average physiological range of arterial WSS has been suggested to lie between 1.5-2.0 Pa by Malek et al.64 It is widely accepted now that damage to the arterial and subsequently aneurysmal wall by hemodynamic forces plays a crucial role in the etiopathogenesis of IAs.11,32,38,40-
42,65,69,72,91,104 High supra-physiological and low infra-physiological values of WSS have been associated with initiation, growth and rupture of aneurysms.11,32,38,40-42,65,69,72,91,104 The values of space and time averaged WSS as well as the area affected by supra-physiological WSS (>15Pa) were increased in our patient by 65% and 650%, respectively (Table-2). This exponential rise in the high supra-physiological WSS may play an important role in the etiopathogenesis of IAs in patients with CoA.
Various authors tried to explain the underlying mechanisms involved in the WSS induced vascular remodeling. The normal endothelial cell (EC) function and structure are regulated by WSS through a process called mechanotransduction.21,20 The shear stress is sensed by a number of mechanoceptors including basal adhesion points of ECs, cell junctions, and nuclear membrane.21,20 WSS also activates stretch-sensitive ion channels such as phospholipids and integrins in cellular membrane.21,20 Increased production of matrix metalloproteinase (MMP-13) by ECs has been demonstrated after their prolonged exposure to high WSS which, in turn, leads to degeneration of the internal elastic lamina.90 It has been demonstrated by a number of workers16,31,80 that WSS increases endothelial production of nitric oxide (NO) by inducing an enzyme responsible for its synthesis (iNOS; inducible nitric oxide synthase). Fukuda et al31 found a high concentration of iNOS at the site of IA formation, in both rat and human arteries and concluded that iNOS is a prerequisite for

27Journal of Vascular and Interventional Neurology, Volume 3, Number 1, January 2010
de novo development of IAs in cerebral vessels. In 1995, Wang et al104 showed that smooth muscle cells (SMCs) in arterial wall can also respond to WSS in intact arteries by virtue of interstitial flow generated by transmural flow gradients, further accentuating the vessel wall damage.
In addition to WSS, oscillatory shear index (OSI) has also been recognized as an important hemodynamic factor in the aneurysmal pathogenesis.33-35,43,65 It is a measure of the oscillatory nature of shear forces.33-35,43,65 This index, which has a range of between 0 and 0.5, represents the fraction of the cardiac cycle over which the instantaneous shear force vector forms an angle greater than 90 degrees to the time-average direction of the same force. Consistently high values of OSI have been associated with EC dysfunction.43 Changes in cell structure secondary to cyclic mechanical stress have been demonstrated by Wang et al.104 resulting in disruption of the actin cytoskeleton of ECs. Glor and colleagues propose 0.2 as a threshold value for OSI above which endothelial damage is initiated.33,34 Whereas, no change was observed in the maximum OSI in presence of CoA (Table-2), the values obtained from both analyses (0.3) remained above this critical threshold. This indicates towards the possible role of high OSI in the EC damage in patients with IAs irrespective of presence or absence of CoA.
Apart from being a known risk factor for the formation of IAs, CoA has also been associated with increased incidence of IA rupture (4.8%).15,48,70,106 No satisfactory explanation is provided for the association between the two entities. This increased tendency for early aneurysmal rupture can possibly be explained by analyzing the hemodynamic factors computed for our patient (Table-2). Whereas the values for maximum pressure on IA wall have increased by 15% in patient with CoA, the area affected by high pressure is actually decreased by 50%. In other words, in the context of our CoA patient, the pressure on the IA wall is more focal in nature in presence of CoA and may be an important underlying factor predisposing to early aneurysmal rupture. High supra-physiological values of WSS have also been associated with endothelial cell dysfunction.11,32,38,40-42,64,65,69,72,91,104 The exponential rise (by 650%) in the area affected by high supra-physiological WSS (>15Pa) may also play a role in early IA rupture in patient with CoA.
Limitations of the study
Due to technical limitations, we could not perform extensive measurements in cerebral arteries other than ICA and ACA. It is however expected that the VFR will increase in other arteries as well provided other parameters in the Hagan-Poiseuille (Eq-1) equation remain constant. The current study therefore reflects the need of further studies performed in larger cohort of patients with CoA.
Conclusions
Our study demonstrates that the cerebral arterial flow-rates in CoA patients are significantly higher when compared with average arterial flow-rates in healthy population. Furthermore,
the values of space and time averaged WSS and the area affected by supraphysiological WSS (>15Pa) were increased in our patient by 65% and 650%, respectively. The values of maximum OSI however, remained unaffected by the presence of CoA. Increased hemodynamic WSS secondary to the increased rCBF may play an important role in the pathogenesis of IAs in CoA patients. The more focalized pressure impingement on the aneurysmal wall in CoA patients may be an important underlying factor affecting the early aneurysmal rupture.
The lack of clear knowledge about the rCBF in CoA patients and the existing controversies in the etiopathogenesis of IAs in these patients emphasizes the importance of the findings of the current study.
Acknowledgements
The authors would like to extend their acknowledgments to Mr. David Capener and the MRI department to for their help in obtaining the pc-MR measurements. Furthermore, we are thankful to all developers of the @neurIST computational tool-chain and European Commission for funding this study.
Ethical Approvals
The project has appropriate ethical approvals for the required research. The ethical matters are managed by Project Ethical Committee, Oxford, UK (Oxfordshire Research Ethics Committee-A Study Number: 07/Q1604/53). A copy of the ethical approval can be provided as and when required.
References:
1. Abbott ME. A statistical study and historical retrospect of 200 recorded
cases, with autopsy, of stenosis or obliteration of the descending arch in
subjects above the age of two years. Am Heart J:1928;392-421.
2. Adams HP, Jr., Kassell NF, Wisoff HS, Drake CG. Intracranial saccular
aneurysm and moyamoya disease. Stroke 10:1979;174-179.
3. Ahmetoğlu A, Koşucu P, Sari A, Gümele HR. Abdominal aortic
coarctation associated with multiple intracranial aneurysms. European
Journal of Radiology Extra (46):2003;38-41.
4. Alpers BJ, Berry RG. Circle of Willis in cerebral vascular disorders. The
anatomical structure. Arch Neurol 8:1963;398-402.
5. Ali S, Walker MT. Bilateral persistent trigeminal arteries associated
with bilateral carotid aneurysms. J Vasc Interv Radiol. 2007;18:692-694.
6. Andrews RJ, Spiegel PK. Intracranial aneurysms. Age, sex, blood
pressure, and multiplicity in an unselected series of patients. J
Neurosurg. 1979;51:27-32.
7. Atkinson JL, Sundt TMJ, Houser OW, Whisnant JP. Angiographic
frequency of anterior circulation intracranial aneurysms. J Neurosurg.
1989;70:551-555.
8. Bakker CJ, Kouwenhoven M, Hartkamp MJ, Hoogeveen RM, Mali
WP. Accuracy and precision of time-averaged flow as measured
by nontriggered 2D phase-contrast MR angiography, a phantom
evaluation. Magn Reson Imaging. 1995;13:959-965.
9. Banna MM, Rose PG, Pearce GW. Coarctation of the aorta as a cause of
spinal subarachnoid hemorrhage. Case report. J Neurosurg. 1973;39:761-

28 Journal of Vascular and Interventional Neurology, Volume 3, Number 1, January 2010
763.
10. Buijs PC, Krabbe-Hartkamp MJ, Bakker CJ, et. al. Effect of age on
cerebral blood flow: measurement with ungated two-dimensional
phase-contrast MR angiography in 250 adults. Radiology. 1998;209:667-
674.
11. Burleson AC, Strother CM, Turitto VT. Computer modeling of
intracranial saccular and lateral aneurysms for the study of their
hemodynamics. Neurosurgery. 1995;37:774-82; discussion 782-7782;
discussion 782-4.
12. Caputo GR, Kondo C, Masui T, et. al. Right and left lung perfusion: in
vitro and in vivo validation with oblique-angle, velocity-encoded cine
MR imaging. Radiology. 1991;180:693-698.
13. Castro MA, Putman CM, Cebral JR. Computational fluid dynamics
modeling of intracranial aneurysms: effects of parent artery
segmentation on intra-aneurysmal hemodynamics. AJNR Am J
Neuroradiol. 2006;27:1703-1709.
14. Chen L, Liu J-M, Zhou D. Congenital absence of the right common
carotid artery, internal carotid artery and external carotid artery
associated with anterior communicating artery aneurysm: a rare case.
Neurol Sci. 2008;29:485-487.
15. Connolly HM, Huston J3rd, Brown RDJ, et. al. Intracranial aneurysms in
patients with coarctation of the aorta: a prospective magnetic resonance
angiographic study of 100 patients. Mayo Clin Proc. 2003;78:1491-1499.
16. Cooke JP, Stamler J, Andon N, et. al. Flow stimulates endothelial cells
to release a nitrovasodilator that is potentiated by reduced thiol. Am J
Physiol. 1990;259:H804-12.
17. Cowan JAJ, Barkhoudarian G, Yang LJS, Thompson BG. Progression of
a posterior communicating artery infundibulum into an aneurysm in a
patient with Alagille syndrome. Case report. J Neurosurg. 2004;101:694-
696.
18. Crumpton CW, Rowe GG, Capps RC, Whitmore JJ, Murphy QR. The
effect of hexamethonium upon cerebral blood flow and metabolism in
patients with premalignant and malignant hypertension. Circulation.
1955;11:106-109.
19. Daley PJ, Sagar KB, Wann LS. Doppler echocardiographic measurement
of flow velocity in the ascending aorta during supine and upright
exercise. Br Heart J. 1985;54:562-567.
20. Davies PF. Flow-mediated endothelial mechanotransduction. Physiol
Rev. 1995;75:519-560.
21. Davies PF, Tripathi SC. Mechanical stress mechanisms and the cell. An
endothelial paradigm. Circ Res. 1993;72:239-245.
22. de la Monte SM, Moore GW, Monk MA, Hutchins GM. Risk factors
for the development and rupture of intracranial berry aneurysms. Am J
Med. 1985;78:957-964.
23. Drake CG. Progress in cerebrovascular disease. Management of cerebral
aneurysm. Stroke. 1981;12:273-283.
24. Du Boulay GH. Some observations on the natural history of intracranial
aneurysms. Br J Radiol. 1965;38:721-757.
25. Enzmann DR, Marks MP, Pelc NJ. Comparison of cerebral artery
blood flow measurements with gated cine and ungated phase-contrast
techniques. J Magn Reson Imaging. 1993;3:705-712.
26. Enzmann DR, Ross MR, Marks MP, Pelc NJ. Blood flow in major
cerebral arteries measured by phase-contrast cine MR. AJNR Am J
Neuroradiol. 1994;15:123-129
27. Eppinger H. Stenosis aortae congenita seu isthmus persistans. Vjschr
Prakt aheilk. 1871;112:31-67.
28. Evans AJ, Iwai F, Grist TA, et. al. Magnetic resonance imaging of blood
flow with a phase subtraction technique. In vitro and in vivo validation.
Invest Radiol. 1993;28:109-115.
29. Fleischer AS, Faria MAJ, Hoffmann JCJ. Pseudoaneurysm complicating
superficial temporal artery--middle cerebral artery bypass. Surg Neurol.
1979;12:305-306.
30. Forfang K, Rostad H, Sorland S, Levorstad K. Late sudden death after
surgical correction of coarctation of the aorta. Importance of aneurysm
of the ascending aorta. Acta Med Scand. 1979;206:375-379.
31. Fukuda S, Hashimoto N, Naritomi H, et. al. Prevention of rat cerebral
aneurysm formation by inhibition of nitric oxide synthase. Circulation.
2000;101:2532-2538.
32. Gao L, Hoi Y, Swartz DD, et. al. Nascent aneurysm formation at the
basilar terminus induced by hemodynamics. Stroke. 2008;39:2085-2090.
33. Glor FP, Ariff B, Hughes AD, et. al. The integration of medical imaging
and computational fluid dynamics for measuring wall shear stress in
carotid arteries. Conf Proc IEEE Eng Med Biol Soc. 2004;2:1415-1418.
34. Glor FP, Long Q, Hughes AD, et. al. Reproducibility study of magnetic
resonance image-based computational fluid dynamics prediction of
carotid bifurcation flow. Ann Biomed Eng. 2003;31:142-151.
35. Goubergrits L, Kertzscher U, Schoneberg B, et. al. CFD analysis in an
anatomically realistic coronary artery model based on non-invasive 3D
imaging: comparison of magnetic resonance imaging with computed
tomography. Int J Cardiovasc Imaging. 2008;24:411-421.
36. Gupta TC, Wiggers CJ. Basic hemodynamic changes produced by aortic
coarctation of different degrees. Circulation. 1951;3:17-31.
37. Hafkenschiel JHJ, Crumpton CW, Moyer JH. Blood flow and oxygen
consumption of the brain in coarctation of the aorta. Proc Soc Exp Biol
Med. 1949;71:165-167.
38. Handa H, Hashimoto N, Nagata I, Hazama F. Saccular cerebral
aneurysms in rats: a newly developed animal model of the disease.
Stroke. 1983;14:857-866.
39. Harikrishnan S, Stigimon J, Tharakan JM. Intracranial aneurysms,
coronary aneurysms and descending aortic coarctation--unreported
association. Int J Cardiol. 2005;99:329-330.
40. Hashimoto N, Handa H, Hazama F. Experimentally induced cerebral
aneurysms in rats. Surg Neurol. 1978;10:3-8.
41. Hashimoto N, Handa H, Nagata I, Hazama F. Experimentally induced
cerebral aneurysms in rats: Part V. Relation of hemodynamics in the
circle of Willis to formation of aneurysms. Surg Neurol. 1980;13:41-45.
42. Hashimoto N, Kim C, Kikuchi H, et. al. Experimental induction of
cerebral aneurysms in monkeys. J Neurosurg. 1987;67:903-905.
43. He X, Ku DN. Pulsatile flow in the human left coronary artery
bifurcation: average conditions. J Biomech Eng. 1996;118:74-82.
44. Hesslein PS, McNamara DG, Morriss MJ, Hallman GL, Cooley DA.
Comparison of resection versus patch aortoplasty for repair of
coarctation in infants and children. Circulation. 1981;64:164-168.
45. Hom JJ, Ordovas K, Reddy GP. Velocity-encoded cine MR imaging
in aortic coarctation: functional assessment of hemodynamic events.
Radiographics. 2008;28:407-416.
46. Hop JW, Rinkel GJ, Algra A, van Gijn J. Case-fatality rates and functional
outcome after subarachnoid hemorrhage: a systematic review. Stroke.
1997;28:660-664.
47. Horie N, Tsutsumi K, Kaminogo M, et. al. Agenesis of the internal
carotid artery with transcavernous anastomosis presenting with an
anterior communicating artery aneurysm--a case report and review of
the literature. Clin Neurol Neurosurg. 2008;110:622-626.
48. Hudaoglu O, Kurul S, Cakmakci H, et. al. Aorta coarctation presenting
with intracranial aneurysm rupture. J Paediatr Child Health.
2006;42:477-479.

29Journal of Vascular and Interventional Neurology, Volume 3, Number 1, January 2010
49. Inagawa T. Trends in incidence and case fatality rates of aneurysmal
subarachnoid hemorrhage in Izumo City, Japan, between 1980-1989 and
1990-1998. Stroke. 2001;32:1499-1507.
50. Ishii K, Isono M, Kasai N, et. al. Midaortic syndrome in childhood
associated with a ruptured cerebral aneurysm: a case report. Surg
Neurol. 2001;55:209-212.
51. Jamous MA, Nagahiro S, Kitazato KT, et. al. Endothelial injury and
inflammatory response induced by hemodynamic changes preceding
intracranial aneurysm formation: experimental study in rats. J
Neurosurg. 2007;107:405-411.
52. Joseph M, Nates, JL. Stable Xenon Computed Tomography Cerebral
Blood Flow Measurement In Neurological Disease: Review And
Protocols. The Internet Journal of Emergency and Intensive Care
Medicine. 2000;4(2).
53. Kan P, Liu JK, Couldwell WT. Giant fusiform aneurysm in an adolescent
with PHACES syndrome treated with a high-flow external carotid
artery-M3 bypass. Case report and review of the literature. J Neurosurg.
2007;106:495-500.
54. Kanda M, Shinoda S, Masuzawa T. Ruptured vertebral artery-posterior
inferior cerebellar artery aneurysm associated with pulseless disease--
case report. Neurol Med Chir (Tokyo). 2004;44:363-367.
55. Kawaguchi S, Sakaki T, Morimoto T, Kakizaki T, Kamada K.
Characteristics of intracranial aneurysms associated with moyamoya
disease. A review of 111 cases. Acta Neurochir (Wien). 1996;138:1287-
1294.
56. Kayembe KN, Sasahara M, Hazama F. Cerebral aneurysms and variations
in the circle of Willis. Stroke. 1984;15:846-850.
57. Kety SS. The theory and applications of the exchange of inert gas at the
lungs and tissues. Pharmacol Rev. 1951;3:1-41.
58. Kondo C, Caputo GR, Semelka R, et. al. Right and left ventricular stroke
volume measurements with velocity-encoded cine MR imaging: in vitro
and in vivo validation. AJR Am J Roentgenol. 1991;157:9-16.
59. Konishi Y, Kadowaki C, Hara M, Takeuchi K. Aneurysms associated
with moyamoya disease. Neurosurgery. 1985;16:484-491.
60. Kurokawa T, Harada K, Ishihara H, et. al. De novo aneurysm formation
on middle cerebral artery branches adjacent to the anastomotic site
of superficial temporal artery-middle cerebral artery bypass surgery
in two patients: technical case report. Neurosurgery. 2007;61:E297-8;
discussion E298.
61. Laborde F, Bical O, Lemoine G, Neveux JY. [Rupture of a dissecting
aneurysm of the ascending aorta 10 years after therapy of coarctation.
Apropos of a case of a 10-year-old girl]. Sem Hop. 1983;59:2937-2938.
62. Laitinen L, Snellman A. Aneurysms of the pericallosal artery: a study of
14 cases verified angiographically and treated mainly by direct surgical
attack. J Neurosurg. 1960;17:447-458.
63. Li MH, Li WB, Pan YP, Fang C, Wang W. Persistent primitive trigeminal
artery associated with aneurysm: report of two cases and review of the
literature. Acta Radiol. 2004;45:664-668.
64. Malek AM, Alper SL, Izumo S. Hemodynamic shear stress and its role in
atherosclerosis. JAMA. 1999;282:2035-2042.
65. Mantha A, Karmonik C, Benndorf G, Strother C, Metcalfe R.
Hemodynamics in a cerebral artery before and after the formation of an
aneurysm. AJNR Am J Neuroradiol. 2006;27:1113-1118.
66. Marzo A, Singh P, Reymond P, et. al. Influence of inlet boundary
conditions on the local haemodynamics of intracranial aneurysms.
Comput Methods Biomech Biomed Engin. 2009;12:431-444.
67. McCormick WF, Schmalstieg EJ. The relationship of arterial
hypertension to intracranial aneurysms. Arch Neurol. 1977;34:285-287.
68. Meisel HJ, Mansmann U, Alvarez H, et. al. Cerebral arteriovenous
malformations and associated aneurysms: analysis of 305 cases from a
series of 662 patients. Neurosurgery. 2000;46:793-800; discussion 800-
800; discussion 800-2.
69. Meng H, Wang Z, Hoi Y, et. al. Complex hemodynamics at the apex of
an arterial bifurcation induces vascular remodeling resembling cerebral
aneurysm initiation. Stroke. 2007;38:1924-1931.
70. Mercado R, Lopez S, Cantu C, et. al. Intracranial aneurysms associated
with unsuspected aortic coarctation. J Neurosurg. 2002;97:1221-1225.
71. Mohiaddin RH, Kilner PJ, Rees S, Longmore DB. Magnetic resonance
volume flow and jet velocity mapping in aortic coarctation. J Am Coll
Cardiol. 1993;22:1515-1521.
72. Morimoto M, Miyamoto S, Mizoguchi A, et. al. Mouse model of cerebral
aneurysm: experimental induction by renal hypertension and local
hemodynamic changes. Stroke. 2002;33:1911-1915.
73. Nagata I, Handa H, Hashimoto N, Hazama F. Experimentally induced
cerebral aneurysms in rats: Part VI. Hypertension. Surg Neurol.
1980;14:477-479.
74. Nishimoto T, Yuki K, Sasaki T, et. al. A ruptured middle cerebral
artery aneurysm originating from the site of anastomosis 20 years after
extracranial-intracranial bypass for moyamoya disease: case report.
Surg Neurol. 2005;64:261-5; discussion 265.
75. Orsi P, Rosa G, Liberatori G, Lunardi PP, Ferrante L. Repair of two
unruptured intracranial aneurysms in the presence of coarctation
of the aorta-anesthetic implications and management. J Neurosurg
Anesthesiol. 1993;5:48-51.
76. Ostergaard JR, Hog E. Incidence of multiple intracranial aneurysms.
Influence of arterial hypertension and gender. J Neurosurg. 1985;63:49-
55.
77. Padget DH. The circle of Willis: its embryology and anatomy. In: Dandy
WE, ed. Intracranial Arterial Aneurysms. New York, NY: Comstock
Publishing Co; 1944:67-90.
78. Patel AN, Richardson AE. Ruptured intracranial aneurysms in the first
two decades of life. A study of 58 patients. J Neurosurg. 1971;35:571-576.
79. Peltier J, Vinchon M, Soto-Ares G, Dhellemmes P. Disappearance of a
middle cerebral artery aneurysm associated with Moyamoya syndrome
after revascularization in a child: case report. Childs Nerv Syst.
2008;24:1483-1487.
80. Pohl U, Herlan K, Huang A, Bassenge E. EDRF-mediated shear-induced
dilation opposes myogenic vasoconstriction in small rabbit arteries. Am
J Physiol. 1991;261:H2016-23.
81. Redekop G, TerBrugge K, Montanera W, Willinsky R. Arterial
aneurysms associated with cerebral arteriovenous malformations:
classification, incidence, and risk of hemorrhage. J Neurosurg.
1998;89:539-546.
82. Riggs HE, Rupp C: Miliary aneurysms: Relations of anomalies of circle
of Willis to formation of aneurysms. Arch Neurol Psychiat 49:1943;615-
616.
83. Reifenstein GH, Levine SA, Gross RE. Coarctation of the aorta. A review
of 104 autopsied cases of the "adult type", 2 years of age or older. Am
Heart J 1947; 33(2): 146-169.
84. Rordorf G, Koroshetz WJ, Copen WA, et. al. Diffusion – and perfusion-
weighted imaging in vasospasm after subarachnoid hemorrhage. Stroke.
1999;30:599-605.
85. Rowe GG, Castillo CA, Afonso S, Young WP, Crumpton CW. Cerebral
blood flow in coarctation of the aorta. J Clin Invest. 1964;43:1922-1927.
86. Rowe GG, Maxwell GM, Castillo CA, Freeman DJ, Crumpton CW. A
study in man of cerebral blood flow and cerebral glucose, lactate and

30 Journal of Vascular and Interventional Neurology, Volume 3, Number 1, January 2010
pyruvate metabolism before and after eating. J Clin Invest. 1959;38:2154-
2158.
87. Schievink WI, Mokri B, Piepgras DG, Gittenberger-de Groot AC.
Intracranial aneurysms and cervicocephalic arterial dissections
associated with congenital heart disease. Neurosurgery. 1996;39:685-9;
discussion 689-69; discussion 689-90.
88. Sekhar LN, Heros RC. Origin, growth, and rupture of saccular
aneurysms: a review. Neurosurgery. 1981;8:248-260.
89. Shearer WT, Rutman JY, Weinberg WA, Goldring D. Coarctation of
the aorta and cerebrovascular accident: a proposal for early corrective
surgery. J Pediatr. 1970;77:1004-1009.
90. Sho E, Sho M, Singh TM, et. al. Arterial enlargement in response to high
flow requires early expression of matrix metalloproteinases to degrade
extracellular matrix. Exp Mol Pathol. 2002;73:142-153.
91. Singh PK, Marzo A, Coley SC, et. al. The role of computational fluid
dynamics in the management of unruptured intracranial aneurysms: a
clinicians' view. Comput Intell Neurosci. 2009:760364.
92. Stehbens WE. Etiology of intracranial berry aneurysms. J Neurosurg.
1989;70:823-831.
93. Stehbens WE. Pathology of the Cerebral Blood Vessels. St Louis, Mo:
CV Mosby; 1972.
94. Stehbens WE. Aneurysms and anatomical variation of cerebral arteries.
Arch Pathol. 1963;75:45-64.
95. Stehbens WE. Cerebral aneurysms and congenital abnormalities.
Australas Ann Med. 1962;11:102-112.
96. Suyama K, Mizota S, Minagawa T, et. al. A ruptured anterior
communicating artery aneurysm associated with internal carotid
artery agenesis and a middle cerebral artery anomaly. J Clin Neurosci.
2009;16:585-586.
97. Takahashi M, Fujimoto T, Suzuki R, et. al. [A case of spontaneous
middle cerebral artery occlusion associated with a cerebral aneurysm
angiographically disappearing after STA-MCA anastomosis]. No
Shinkei Geka. 1997;25:727-732.
98. Takayama K, Nakagawa H, Iwasaki S, et. al. Multiple cerebral
aneurysms associated with Takayasu arteritis successfully treated with
coil embolization. Radiat Med. 2008;26:33-38.
99. Taylor CL, Yuan Z, Selman WR, Ratcheson RA, Rimm AA. Cerebral
arterial aneurysm formation and rupture in 20,767 elderly patients:
hypertension and other risk factors. J Neurosurg. 1995;83:812-819.
100. Thompson RC, Steinberg GK, Levy RP, Marks MP. The management of
patients with arteriovenous malformations and associated intracranial
aneurysms. Neurosurgery. 1998;43:202-11; discussion 211-2011;
discussion 211-2.
101. Ueda T, Yuh WT, Taoka T. Clinical application of perfusion and
diffusion MR imaging in acute ischemic stroke. J Magn Reson Imaging.
1999;10:305-309.
102. Varaprasathan GA, Araoz PA, Higgins CB, Reddy GP. Quantification
of flow dynamics in congenital heart disease: applications of velocity-
encoded cine MR imaging. Radiographics. 2002;22:895-905; discussion
905-905; discussion 905-6.
103. Verheugt CL, Uiterwaal CSPM, Grobbee DE, Mulder BJM. Long-term
prognosis of congenital heart defects: a systematic review. Int J Cardiol.
2008;131:25-32.
104. Wang DM, Tarbell JM. Modeling interstitial flow in an artery wall
allows estimation of wall shear stress on smooth muscle cells. J Biomech
Eng. 1995;117:358-363.
105. Wang Z, Kolega J, Hoi Y, et. al. Molecular alterations associated with
aneurysmal remodeling are localized in the high hemodynamic stress
region of a created carotid bifurcation. Neurosurgery. 2009;65:169-77;
discussion 177-1677; discussion 177-8.
106. Weir B, Macdonald, RL: Intracranial aneurysms and subarachnoid
hemorrhage: an overview, in Wilkins RH, Rengachary SS (ed):
Neurosurgery, ed 2. New York: McGraw-Hill;1996:2191–2213.
107. Yamashita S, Isoda H, Hirano M, et. al. Visualization of hemodynamics
in intracranial arteries using time-resolved three-dimensional phase-
contrast MRI. J Magn Reson Imaging. 2007;25:473-478.
108. Yong-Zhong G, van Alphen HA. Pathogenesis and histopathology of
saccular aneurysms: review of the literature. Neurol Res. 1990;12:249-
255.
109. Zada G, Breault J, Liu CY, et. al. Internal carotid artery aneurysms
occurring at the origin of fetal variant posterior cerebral arteries:
surgical and endovascular experience. Neurosurgery. 2008;63:ONS55-
61; discussion ONS61-61; discussion ONS61-2.

Hindawi Publishing CorporationComputational Intelligence and NeuroscienceVolume 2009, Article ID 760364, 12 pagesdoi:10.1155/2009/760364
Research Article
The Role of Computational Fluid Dynamics in the Management ofUnruptured Intracranial Aneurysms: A Clinicians’ View
Pankaj K. Singh,1 Alberto Marzo,2 Stuart C. Coley,3 Guntram Berti,4 Philippe Bijlenga,5
Patricia V. Lawford,2 Mari-Cruz Villa-Uriol,6 Daniel A. Rufenacht,7 Keith M. McCormack,2
Alejandro Frangi,6 Umang J. Patel,8 and D. Rodney Hose2
1 Departments of Medical Physics and Neurosurgery, Royal Hallamshire Hospital, Sheffield, UK2 Academic Unit of Medical Physics, School of Medicine and Biomedical Sciences, University of Sheffield, Sheffield, UK3 Department of Neuroradiology, Royal Hallamshire Hospital, Sheffield, UK4 NEC Laboratories Europe, NEC Europe Ltd., 53757 St. Augustin, Germany5 Clinic of Neurosurgery, Department of Clinical Neurosciences, Geneva University Hospital, 1211 Geneva, Switzerland6 Biomedicine Communication Technologies Department, Center for Computational Imaging & Simulation Technologies,Pompeu Fabra University, Barcelona, Spain
7 Department of Neuroradiology, Institute of Radiology, University Hospital Basel, Petersgraben, Basel, Switzerland8 Department of Neurosurgery, Royal Hallamshire Hospital, Sheffield, UK
Correspondence should be addressed to Pankaj K. Singh, [email protected]
Received 11 February 2009; Revised 24 April 2009; Accepted 9 June 2009
Recommended by Francois Vialatte
Objective. The importance of hemodynamics in the etiopathogenesis of intracranial aneurysms (IAs) is widely accepted.Computational fluid dynamics (CFD) is being used increasingly for hemodynamic predictions. However, alogn with thecontinuing development and validation of these tools, it is imperative to collect the opinion of the clinicians. Methods. A workshopon CFD was conducted during the European Society of Minimally Invasive Neurological Therapy (ESMINT) Teaching Course,Lisbon, Portugal. 36 delegates, mostly clinicians, performed supervised CFD analysis for an IA, using the @neuFuse softwaredeveloped within the European project @neurIST. Feedback on the workshop was collected and analyzed. The performancewas assessed on a scale of 1 to 4 and, compared with experts’ performance. Results. Current dilemmas in the management ofunruptured IAs remained the most important motivating factor to attend the workshop and majority of participants showedinterest in participating in a multicentric trial. The participants achieved an average score of 2.52 (range 0–4) which was 63%(range 0–100%) of an expert user. Conclusions. Although participants showed a manifest interest in CFD, there was a clear lack ofawareness concerning the role of hemodynamics in the etiopathogenesis of IAs and the use of CFD in this context. More effortstherefore are required to enhance understanding of the clinicians in the subject.
Copyright © 2009 Pankaj K. Singh et al. This is an open access article distributed under the Creative Commons AttributionLicense, which permits unrestricted use, distribution, and reproduction in any medium, provided the original work is properlycited.
1. Introduction
The management of unruptured cerebral aneurysms remainsone of the most controversial topics in neurosurgery. Theseuncertainties are multifactorial owing mainly to an incom-plete understanding of the natural history of these lesionsand risks associated with active management [1–4]. Recentevidence, however, suggests a good correlation betweendifferent hemodynamic factors and etiopathogenesis of IAs[5–8]. This, together with the fact that current technologies
do not allow detailed in vivo measurements of blood flow[9, 10] in cerebral arteries has given computational fluiddynamics (CFD) new strength and a chance to affirm itself asa technology that can help in the management of unrupturedIAs. Many studies have been published where patient-specific medical images and CFD are used to predict relevanthemodynamic variables that correlate well with initiation,growth and rupture of an IA [9–15]. Until recently, theseanalyses were performed primarily by engineers, physicistsor mathematicians in collaboration with select clinicians.

2 Computational Intelligence and Neuroscience
However, in order to make an impact on clinical practice andto enhance trust among clinicians, a controlled and extensiveexposure of the software and its concepts to the broaderclinical community is crucial along with its continuingvalidations.
The current study is the first effort of its kind where theconcept and application of CFD software was exposed tothe clinical community, followed by analysis of their views,understanding and performance.
2. Material and Methods
The first gathering of the European Society of MinimallyInvasive Neurological Therapy (ESMINT) Teaching Courseon IAs provided an ideal opportunity to expose thecomputational tools being developed within the Europeanproject @neurIST [16], to the attention of its audience. Theworkshop was held near the birthplace of angiography at the“Edificio Egas Moniz” of the Hospital Santa Maria in Lisbon,Portugal between 7th and 12th September 2008.
2.1. Participants’ Demography and Overview. The workshopwas attended mainly by neurosurgeons and neuroradiolo-gists. Out of all participants 86% had a clinical, 8% anengineering, and 6% a scientific background. Participantsbroadly fell into four age groups: 20–30 years old (3participants, 8%), 31–40 (22, 61%), 41–50 (9, 25%), 50+ (2,6%). Participants were prevalently male with a ratio M : F =8 : 1. These data are summarized in Figure 1.
Participants were subdivided into groups of about 8individuals per session to maximize teacher-to-attendeeratio. Two tutors were available during each session, onewith a clinical background (neurosurgeon) and one withan engineering background (biomedical engineer). Teachingwas delivered via a lecture of 75 minutes, which includeda discussion of the clinical background and relevance ofhemodynamic factors in etiopathogenesis of IAs, a briefintroduction on the use of CFD in hemodynamic predic-tions, and explanation of key fluid dynamics concepts inthis context, for example, wall shear stress (WSS), boundaryconditions, and so forth. This was followed by a supervisedhands-on experience with the software.
The exercise was presented to the audience via a clinicalvignette of a typical difficult scenario encountered in theclinic, represented in Figure 2. The vignette illustrates atypical case of an incidentally-discovered IA in an anxiousyoung patient. Due to its size (5 mm maximum diame-ter) and absence of any other major known risk factorsthe aneurysm should be managed conservatively as perISUIA (International Studies for Unruptured IntracranialAneurysms) guidelines [1, 4]. However due to patient’s con-cerns and insistence for active intervention the managementplan becomes controversial.
The participants were then asked to use the software@neuFuse to extract additional and nonobservable hemody-namic data from the 3-dimensional rotational angiographic(3DRA) image of this case. Attendees performed the tasksindependently with the help of a ready-reckoner containing
Table 1: Aneurysm radiological characteristics.
Localization Carotid artery/ophthalmicsegment/medial wall
Side Left
Dome status Unruptured
Depth 4.2 mm
Max diameter 5 mm
Max neck width 3.7 mm
Type Side-wall, saccular
Aspect Smooth
the complete guided procedure with illustrations to facilitatethe exercise. One-to-one support and supervision was pro-vided during each session, as required.
2.2. Image Acquisition and Processing. The medical imageused in the workshop was obtained using rotational acqui-sition in a Philips Integris Allura machine (Philips MedicalSystems, Best, The Netherlands), producing 100 images in6 seconds, with 5 ms exposure per image. Voxel size in thereconstructed 3D images was 234 microns with reconstruc-tion matrix 256 × 256 × 256. Images were anonymized,respecting the @neurIST ethical approval for use of patientdata. The characteristics of the aneurysm considered in thisstudy are reported in Table 1.
The current version of the @neuFuse software (prototype4), based on the Multimod Application Framework [17]and developed within the @neurIST project, was used toreconstruct the vessel surfaces, create the model and setup the hemodynamic analysis. The solvers used within@neuFuse to solve the fundamental equations describingthe blood flow behavior within the region of interest wereANSYS-ICEM and ANSYS-CFX (Ansys, Inc., Canonsburg,PA, USA).
For the purpose of the workshop a simple stationaryanalysis (nonpulsatile but constant flow rate and pressureat the openings of the region of interest) was performed bythe participants using Intel core duo 2.4 GHz machines, with2 GB RAM and 512 MB of dedicated graphic memory.
2.3. CFD Analysis. Figure 3 shows the overall workflow ofthe operations performed from uploading the raw medicalimage to the software through the visualization of relevanthemodynamic data in @neuFuse.
Any CFD analysis requires knowledge of the volumetricregion traversed by the fluid (i.e., aneurysm includingconnected surrounding vasculature) plus information aboutvelocity and pressure of the fluid at the boundaries ofthe chosen region of interest (boundary conditions). Par-ticipants were asked to reconstruct the region of intereststarting from the medical image, and specify the boundaryconditions using the software @neuFuse. The first stepwas to launch @neuFuse and import the medical image(Figure 3(a)). The geometry of the vessel, including the IA,was then extracted from the imported image (Figure 3(b)).As only a subregion of the extracted vasculature around the

Computational Intelligence and Neuroscience 3
50+41–5031–4020–30
Age distribution
0
10
20
30
40
50
60
70
(a)
Scie
nti
fic
En
gin
eeri
ng
Clin
ical
Background
0
10
20
30
40
50
60
70
80
90
100
(b)
FemaleMale
Sex
0
10
20
30
40
50
60
70
80
90
100
(c)
Figure 1: Participants’ demographic constitution.
Clinical vignette:A 23-year lady attends neurovascular clinic withher partner. Her mother died one month back dueto subarachnoid hemorrhage from a cerebralaneurysm. She smokes around 10 cigarettes a daybut is otherwise fit and asymptomatic. After a longdiscussion it was decided to screen her for thepossibility of an intracranial aneurysm. The MRArevealed the presence of an aneurysm of 5millimetre maximum diameter in the region of leftterminal ICA. She expresses great concerns aboutthe diagnosis and is keen on exploring the activetreatment options rather than being observed byroutine follow-up.
Figure 2: Clinical vignette: typical challenging case scenario.
aneurysm has influence on the hemodynamic computation,all vessels entering or leaving the IA were identified andcropped at desired locations to define the region of interest(ROI). The ascending carotid artery, which was an inlet(blood enters the domain through it), was cropped at tenvessel diameters proximal to the IA as shown in Figure 3(c).The distal carotid artery in the region of cavernous sinusand the ophthalmic artery were identified as the two outletsof ROI (blood exits the domain through these two vessels).These are shown in Figure 3(c). For the sake of simplicityand time constrains the mesh used in the analysis was coarseand was constructed using simple tetrahedral elements. Asis often the case in real-life clinical situations, information
on pressure or velocity of the blood at these locations forthe patient under examination was not available. Boundaryconditions were therefore provided by using a 1D mathemat-ical model of the systemic tree, which has been developedwithin @neurIST [18]. A representation of the @neurIST1D circulation model is depicted in Figure 3(d). This modelprovides values of pressure and flow of blood at severallocations along the systemic arterial tree, including locationsin the circle of Willis for a typical individual. Plug-flow BCswere applied at inlet and pressure BC at outlet, using averagevalues from the waveforms provided by the 1D circulationmodel. Typical values of blood viscosity (μ = 0.004 Pa·s) anddensity (ρ = 1066 kg/m3) were applied to define the bloodproperties. Although the blood is a nonNewtonian fluid forthe sake of simplicity and time-constraints, and also in viewof recent findings from Cebral et al. [13], we decided toassume constant blood viscosity.
While arterial walls move under the effect of thepropagating pressure waves, it has been shown that theeffects of this movement on hemodynamic predictions arenegligible [19, 20]. Fixed walls were thus considered in thisanalysis. The computation was automatically performed bythe software and participants were asked to display differ-ent predicted hemodynamic variables like flow streamlines(Figure 3(e)), pressure distribution within the aneurysm orarterial wall, and WSS (Figure 3(f)). Participants were thenasked to compare the WSS values computed within theaneurysm with the critical values found in the experimentalstudies of Malek et al. [21] below which the endothelium isaffected by cell loss, desquamation and deranged activity ofwall-growth regulators.

4 Computational Intelligence and Neuroscience
0. 0.Wallshearmag
1. 1. 1. 11653. 12012. 12370. 12729. 13067.Pressure
Out
Out
In
(a)
(e)(f) (d)
(c)(b)
Figure 3: Operation workflow from medical image to hemodynamic results. (a) Orthoslice visualization of the 3DRA medical image in@neuFuse. (b) Visualization of the extracted vessel surface. (c) Visualization of reduced region of interest with location of inlet and outletopenings. (d) 1D circulation model. (e) Visualization of predicted streamlines. (f) Visualization of predicted wall shear stress.
2.4. Evaluation. Finally, the feedback was collected via aquestionnaire consisting of 48 questions. These were broadlydivided into 6 categories (Table 2): general feedback, coursedesign and conduct, experience with the software, hemody-namics understanding, impact of CFD in neurosurgery, andbringing this software into routine use. Each section of thequestionnaire was carefully designed to collect informationon different aspects of the participant experience as describedin Table 2. The questionnaire with the complete list ofquestions is reported in The questionnaire with the completelist of questions is reported in supplementary appendixquestionnaire in Supplementary Material available online atdoi:10.1155/2009/760364.
Performance of participants was measured by analyzingthe file containing an audit trail of the operations performedduring the analysis. The performance criteria were basedon the analysis settings that have major influence on theoutcome of the numerical predictions, namely, the qualityof the reconstructed geometry, its extension, the locations inthe 1D circulation model from which boundary conditionswere extracted, and the correctness of the applied boundarycondition type (i.e., whether it was correctly set to inletor outlet). Each correct operation was assigned one point,leading to a maximum score of four. Expert performancewas considered as gold standard (4 out of 4) and participantsperformance rate was compared against this.
3. Results
For each section of the questionnaire only data gatheredfor the most representative questions were reported inthis manuscript. Results were represented using tables withpercentage distribution for a ready appreciation of feedbackacross the participants. These are reported section by sectionbelow.
Section 1: General Feedback. As shown in Table 3, the overallfeedback about the workshop was positive. The 86% ofparticipants would recommend the software to a colleague,75% found the workshop useful and 78% rated theiroverall experience between good and very good. Negativefeedback was confined averagely within less than 5%. Mostparticipants recognized the need to improve management ofIAs and for 47% this was the main reason for attending theworkshop.
Section 2: Course Design and Conduct. 80% of candidatesfound that the workshop to be of the right duration, 14%found that it to be too short while for 6% it was too long(Table 4). Participants-to-instructor ratio was right for 91%while 6% thought that there were too many participants.Most of the participants did not have any difficulty inunderstanding the instructions. On a scale of 1 to 5, where

Computational Intelligence and Neuroscience 5
Table 2: Questionnaire sections and objectives.
Section Category Objectives
1 General feedbackTo gather impressionson the overall experience
2 Course designand conduct
To gather suggestions onpossible improvementsand identify anyshortcomings in thedesign of the workshop
3 Experience withthe software
To identify weak pointsas perceived by cliniciansin the graphical userinterface of the currentversion of the software
4 Haemodynamicsunderstanding
To assess their currentknowledge andunderstanding in therole of haemodynamicsin the aetiopathogenesisof intracranialaneurysms
5 Impact of CFD inneurosurgery
To assess their faith inthe principles of CFDand its use in the clinicalenvironment, along withthe need of validationthrough a multicentretrial
6Bringing thissoftware intoroutine use
To explore theparticipants view on costrelated issues and gatherinformation on futuremarketing potentials ofthis kind of software
1 is not clear and 5 is very clear, 86% rated it 4-5, while14% were not sure. 94% of the participants thought that thecourse content was scientifically appropriate.
Section 3: Experience with the Software. 34% of the candi-dates found the current version of the software user friendly,11% think that it needs some improvement, while 6% foundthat it was not user-friendly (Table 5). The remaining 46%were unsure. 48% of the participants think that clinicianswith limited IT skills will find using the software challenging,11% disagree with this assumption and 33% were not sure.86% of all attendees were able to complete all the stepsof the hemodynamic analysis within the time allocated(approximately 50 minutes). 11% missed one or more steps.Application of boundary conditions and clipping the regionof interest were among the most difficult steps reportedby majority of participants. These were equally distributedamong participants with scientific and clinical background.
Section 4: Haemodynamics Understanding. Whereas for 78%of the participants it was easy to understand the technicalconcepts used throughout the course (Table 6), 19% faced
Table 3: General feedback.
Question/Answer options Number of participants (%)
Would you recommend thesoftware to a colleague?
Yes 31 (86)
No 3 (8)
n.a. 2 (6)
Why did you decide toparticipate to this workshop?
Working in the field 16 (45)
Interested in CFD 2 (6)
Improve management ofaneurysms
17 (47)
Other 1 (2)
How useful did you find thisworkshop?
Not useful 1 (3)
Not sure 8 (22)
Useful 16 (45)
Very useful 11 (30)
Rate your overall experience
Poor 1 (3)
Average 7 (19)
Good 15 (42)
Very good 13 (36)
Table 4: Course design and conduct.
Question/Answers Number of participants (%)
Was the duration of theworkshop. . .
Right 29 (80)
Short 5 (14)
Long 2 (6)
Was theparticipant-to-instructorratio. . .
Right 33 (91)
Too-many 2 (6)
n.a. 1 (3)
Were the instructions given in aclear way?
Not sure 5 (14)
Clear 18 (50)
Very clear 13 (36)
Was the content of the coursescientifically appropriate?
Yes 34 (94)
No 2 (6)
some difficulties in understanding the terminology, mostlyrelated to concepts such as boundary conditions and WSS.

6 Computational Intelligence and Neuroscience
Table 5: Experience with the software.
Question/Answers Number of participants (%)
Do you find the software userfriendly?
No 2 (6)
Needs improvement 4 (11)
Not sure 17 (46)
User friendly 11 (31)
Very user friendly 1 (3)
n.a. 1 (3)
Will clinicians without tech/ITexperience have trouble?
Yes 17 (48)
Not sure 12 (33)
No 4 (11)
n.a. 3 (8)
Were you able to complete allthe steps of the hemodynamicanalysis?
Yes 30 (86)
No 4 (11)
n.a. 1 (3)
36% of the participants showed trust in the resultspredicted by the software and think that they are realistic.However, 58% were unsure. 48% believe that there is goodscientific evidence to justify the role of hemodynamics inthe etiopathogenesis of IAs, 3% did not agree with this.43% of the candidates were not sure. Whereas 50% of theparticipants were aware of the use of CFD as a tool in theprediction of rupture in IAs, 42% were hearing the conceptfor the first time.
Interestingly, 84% of all participants were willing to readfurther peer-reviewed articles published on CFD and role ofhemodynamics in IAs.
Section 5: Impact of CFD in Neurosurgery. Responding to thequestion “who should perform the CFD analysis for yourpatient”, 19% answered a consultant, 6% thought that itshould be done by a registrar or a junior member of the team(Table 7). 25% believed that analysis should be performed bya dedicated clinical scientist/engineer, while 25% think thatit can be done by anyone provided that they have adequatetraining.
84% of the participants were of the view that the softwarecan be used as a diagnostic tool on outpatient basis, 8% didnot agree with them. 84% of the participants were awareof similar software, whereas for 8% of them it was thefirst exposure to this kind of software. When asked aboutautomated versus user controlled software, interestingly 35%expressed a wish to retain user control. 26% preferred a fully-automated tool, while 26% were unsure.
Although the majority of participants (88%) were con-vinced that there is a future for CFD as a risk prediction tool,and that there is a significant, or emerging clinical need for
Table 6: Haemodynamics understanding.
Question/Answers Number of participants (%)
Did you have difficulty with thetechnical concepts (boundaryconditions, wall shear stress,etc.)?
Yes 7 (19)
No 28 (78)
n.a. 1 (3)
Are the results from thissoftware realistic?
Yes 13 (36)
Not sure 21 (58)
No 0 (0)
n.a. 2 (6)
Is current evidence sufficient tojustify a role forhaemodynamics in thepathogenesis of aneurysms?
No 1 (3)
Not sure 15 (43)
Yes 17 (48)
n.a. 2 6
Were you previously aware ofthe use of CFD to predict therisk of rupture in intracranialaneurysms?
No 15 (42)
Yes 18 (50)
n.a. 3 (8)
If you see a publication oncomputational predictions forIA in a peer-reviewed journal,will you read it?
No 3 (8)
Yes 30 (84)
n.a. 3 (8)
these kinds of innovative tools (84%), most of them (75%)thought that the current version of the software was notyet ready and would require refinement before it could beintroduced into clinical practice.
64% of the candidates believed that an early prediction ofthe risk of rupture computed with the help of this softwarecould influence their decision making in the managementof an IA. Out of the 64% over half (39%) think thatsmall asymptomatic unruptured cases specially falling inthe border-line category based on current evidence, are thebest cases where such software can provide definitive help.Interestingly, 19% thought that it could be useful in all cases.69% of the participants were convinced of the need fora multicentric trial for the evaluation of the software andexpressed their willingness to participate in it.

Computational Intelligence and Neuroscience 7
Table 7: Impact of CFD in neurosurgery.
Question/Answers Number of participants (%)
Ideally, who should performthis type of computationalanalysis for patients?
Consultant 7 (19)
Dedicated clinical scientist 9 (25)
Registrar 2 (6)
Anyone with training 14 (38)
Office member 1 (3)
All 1 (3)
n.a. 2 (6)
When ready could thissoftware be useddiagnostically in anoutpatient clinic?
Yes 30 (84)
No 3 (8)
n.a. 3 (8)
Are you aware of any similarsoftware?
Yes 30 (84)
No 3 (8)
n.a. 3 (8)
Should this type of analysis befully automated, or is it betterthat the user has control?
Automated 10 (26)
User control 14 (35)
Not sure 10 (26)
n.a. 5 (13)
Is there a future forcomputational tools for riskprediction of intracranialaneurysm rupture?
Yes 29 (80)
No 2 (6)
Not sure 2 (6)
n.a. 3 (8)
How great a clinical need isthere for this software?
Significant 17 (48)
Emerging 13 (36)
Low 3 (8)
n.a. 3 (8)
Do you think that this type ofanalytical software is readyfor introduction into theclinical environment?
Ready 4 (11)
Needs work 26 (75)
n.a. 5 (14)
Table 7: Continued.
Question/Answers Number of participants (%)
In which cases might thissoftware influence yourdecision-making aboutpatient management?
All 7 (19)
Small unrupturedasymptomatic
14 (39)
Other 2 (6)
Not sure 1 (3)
None 3 (8)
n.a. 9 (25)
Would you be interested inparticipating in a multicentretrial on the evaluation of thissoftware?
Yes 25 (69)
No 5 (14)
n.a. 6 (17)
Table 8: Bringing this software into routine use.
Question/Answers Number of participants (%)
Would you expect this softwareto be provided as part of ascanner, or as a stand-aloneproduct?
Scanner 11 (30)
Standalone 10 (27)
Both 12 (32)
n.a. 4 (11)
Would the price of this softwarebe an important factor in yourdeciding to obtain/use it?
Important 26 (72)
Low priority 6 (17)
n.a. 4 (11)
Would you expect to pay forthis software, or would youprefer a freeware/sharewarearrangement?
Pay 4 (11)
Shareware 14 (37)
Freeware 17 (44)
n.a. 3 (8)
Section 6: Bringing This Software into Routine Use. Once thesoftware is in routine use, 30% of the participants believedthat it should be an integral part of the scanner (Table 8).27% thought that it should be supplied as a standaloneproduct, while 32% say it could be provided in either way.
Cost will be an important deciding factor for 72% and81% prefer it to be a freeware or shareware. However, cost isa low priority for 17% and 11% will not mind paying for it.

8 Computational Intelligence and Neuroscience
Table 9: Attendees’ performance.
Score %
Average 2.52 (63)
Performance with age
20–30 years 2.58 (65)
31–40 years 2.50 (63)
41–50 years 2.36 (59)
50+ years 2.22 (56)
Performance with background
Clinicians 2.5 (63)
Scientists 2.7 (68)
Performance. Attendees totalized an average score of 63% ofexperts’ performance (Table 9). When age is taken into con-sideration youngest delegates in the group 20–30 years scoredhighest (65%) with score figures reducing progressively withage. Age group 50+ obtained the lowest scores (56%).Performance was slightly higher in scientific community(2.7), as compared to the clinicians (2.5).
4. Discussion
4.1. The Current Challenges Posed by Unruptured IAs. Theeasy availability and widespread use of relatively nonin-vasive and sophisticated neurodiagnostic modalities suchas high resolution CT, MRI and MRA, have brought toclinical attention a large and ever increasing, group ofpatients harboring unruptured and asymptomatic IAs. Theseunruptured lesions are also diagnosed coincidentally at thetime of catheter angiography carried out for a rupturedaneurysm in patients having multiple aneurysms. Theincreasing awareness of relatively bleak prognosis related toaneurysmal rupture in general public and clinicians, forcesneurosurgeons to come up with a definitive answer for theseunruptured lesions.
With the advancements in microsurgical techniques andimproved neuroanesthetic and interventional neuroradio-logical approaches, the morbidity and mortality figuresassociated with active management of the ruptured IAs haveimproved significantly when compared to their conservativemanagement. In other words, the indications for the activeinterventions in ruptured IAs are now well established. Thesituation unfortunately is not as straightforward in casesof unruptured IAs and, the management of these lesionsremains one of the most controversial topics in Neurosurgery[1–4]. Most large series including the ISUIA studies, agree onthe low risk of rupture for unruptured IAs. The cumulativerupture rates in the ISUIA studies were between 0.05 and<1 percent per annum [1, 4]. The fact that the prevalenceof unruptured IAs in general population outnumbers theincidence of subarachnoid hemorrhage suggests that not allunruptured IAs share a common natural history. The annualprevalence of unruptured IAs in a population is around5% while the incidence of subarachnoid hemorrhage in thecorresponding population is observed up to a maximum of
10 cases per 100 000 persons per year [1]. It is clear from thesefigures that 80% to 85% of all IAs will never rupture.
The current uncertainties in the management of unrup-tured IAs are well acknowledged by the clinical community,and were among the most important motivating factors forthe majority of the participants (47%, Table 3) to attend thisworkshop.
In order to offer the best possible treatment to thepatient with the least side effects, formulation of a clearmanagement protocol, directed by the natural history ofunruptured IAs and the risks associated with the activemanagement, is required. Whereas the endovascular coilingis increasingly being accepted as a preferred treatmentmodality for ruptured IAs, surgery is advocated as a first linetreatment for unruptured lesions [2, 4]. Although there areno strict guidelines, most of the studies [22–24] includingISUIA trials [1, 4], almost unanimously recommend certainfactors as indications of surgery in unruptured IAs, namely,large aneurysmal size, symptomatic lesions, evidence ofgrowth, multiple lesions, posterior circulation location, andpast history of SAH. All these criteria have been establishedto have good correlation with increased risk of rupture andhence, surgery is advocated in these situations to avoid thepoor outcome. It is interesting to note that whereas on theone hand the above mentioned criteria are used to decide theneed and suitability for surgery in an unruptured IA, all ofthese factors also remain the underlying descriptors for poorsurgical outcome [25–27].
In the light of current evidence, it is clear that the groupwhich will stand the best chance of an excellent outcomeafter surgery is the one with solitary, very small (<5 mm),truly asymptomatic IAs located in the anterior circulation,without any evidence of growth. Quite the contrary, currentprotocols dictate clinicians not to operate upon this group[1, 4, 25]; and in fact contraindicate any active managementoption in such patients [1, 4, 25]. Moreover, the smallaneurysms of <5 mm size which are traditionally thought tobe “safe”, are not “rupture-proof”. In a study Yasui et al. [28]found that in a group of 25 ruptured aneurysms, 16 (64%)were <5 mm in size. Similarly, Juvela et al. [29] who followed142 patients with 181 aneurysms for a mean period of 13.9years with an aneurysmal size of <4 mm, demonstrated a19% rupture rate, that is, 27 out of 142 patients had arupture.
In order to improve the surgical outcome if we chooseto operate on these smaller and “safe” lesions, we have tooperate on every single patient. The ideal situation, however,would be if we could identify the aneurysms at greater riskof rupture while they are still small in size and operate uponthem, leaving others to be monitored expectantly.
4.2. The Emerging Need for New Alternatives. It is evidentthat, due to the limitations associated with conventional riskfactors used to assess the risk of growth and rupture, it iscurrently impossible to identify those patients who are at anincreased risk in this subset having a real need of an earlysurgery from those who can be monitored safely withoutany active intervention. The situation consequently leaves us

Computational Intelligence and Neuroscience 9
with no options other than searching some new descriptorswhich can predict the risk of rupture independently in smallIAs before they join the cohort destined for a poor surgicaloutcome. This fact is in part reflected by the large number ofparticipants’ views (84%, Table 7), who believe that there is asignificant or emerging need of new alternatives.
There is a rapidly growing body of literature affirmingthe importance of hemodynamics in the etiopathogenesis ofIAs [5–8]. The hemodynamic variables often considered inthese studies are WSS, oscillatory shear index (OSI), bloodpressure and other quantities used to characterize blood flow.Proportional to blood viscosity and its velocity, WSS is thetangential frictional force exerted by the flowing blood onthe walls of each vessel. High supra-physiological and lowinfra-physiological values of WSS have been associated withinitiation, growth and rupture of aneurysms [7, 9, 11, 21, 30–33]. A measure of the oscillatory nature of these viscousforces is given by the OSI, often associated with endothelialcells degeneration [6, 15, 34]. Table 10 gives a comprehensivelist of hemodynamic variables from literature and theirassociation with IA evolution.
An evaluation of these variables can provide a usefulalternative to predict the behavior of an unruptured IA at anearly stage before it changes in size, shape or becomes symp-tomatic. Unfortunately, the detailed in vivo measurementsof all relevant flow variables in the regions affected by thedisease are currently impossible [9, 10].
4.3. Computational Fluid Dynamics: A Brief Overview. Moti-vated by the important role played by hemodynamics andthe difficulty of conducting detailed in vivo observations ofrelevant hemodynamic variables, engineers and computerscientists have started using CFD to predict blood flows inIAs [9–15].
CFD is the science of predicting fluid flow, heat andmass transfer, chemical reactions, and related phenomenaby solving numerically the set of mathematical equationsthat govern a particular physical system (conservation ofmass, momentum, energy, species, etc.). Since its earlydevelopment in the 1960s and 1970s in the field of aerospace,where it was used mainly to improve the design and efficiencyof aircrafts [40], CFD has been successfully used in manyother applications. In the past decades engineers used CFD inthe automotive, nautical, and civil engineering industries forconceptual studies of new designs, troubleshooting redesign,or improving the physical understanding of a novel fluidmechanical phenomenon. Supported by experimental stud-ies and a profound theoretical knowledge of the applicationat hand, CFD can be applied anywhere the flow of afluid is important. Validation, through comparisons withexperimental data, has always been a key aspect in successfulapplications of CFD. In the context of its use in IAs, althoughearly validation work shows promising results [19, 41–43],a more systematic validation remains a prerequisite beforeCFD can be adopted as a routine tool in clinical practice. Asit is evident from Table 7, 58% of the participants agreed thatthe results obtained using the software may influence theirdecision making in the small unruptured IA presented in the
clinical vignette or all cases, provided they are backed by alarger clinical trial. Whereas the software at the moment cansuccessfully predict the relevant haemodynamic indices inthe context of IAs, it is expected that after the larger clinicaltrials, significant statistical correlations can be establishedforming the basis of novel clinical protocols. Whereas themajority of participants (78%, Table 6) did not find anydifficulty in understanding the technical concepts used inCFD, only 36% (Table 6) of them believed that the resultsproduced by its application were realistic. The mistrust inthe results emphasises the importance of validation. This isfurther supported by the fact that most of the participants(84%, Table 7) readily wanted to participate in a multicentricclinical trial.
Although participants showed a manifest interest incomputational predictions (Table 6), there is a clear lackof awareness concerning the role of hemodynamics in theetiopathogenesis of IAs and the use of CFD in this context(42%, Table 6). More efforts therefore are required by thescientific community to enhance understanding of the roleof hemodynamics and awareness of the use of CFD in thisfield.
4.4. The Concept of Controlled Exposure. The use of CFD inthis context represents a significant change in the clinicalworkflow and a successful transfer of knowledge will onlyhappen via carefully planned, controlled exposure. Clinicalsites must be supported locally, underpinning the trainingfor clinicians with the involvement of clinical scientists. Theeffectiveness of interdisciplinary transfer of knowledge islargely dependent on the course design and the methodologyused. As reflected by the results (Table 9), a hands-onworkshop using multimedia PowerPoint presentation, one-to-one supervision, and low participants-to-instructor ratiowith a carefully designed course based on sound scientificprinciples, can lead to good results. The correct durationof such a course is also an important factor (Table 4).A close collaboration between engineers and the clinicalcommunity is also a prerequisite for successful transfer ofknowledge. Supervision during this workshop was hence,jointly provided by a biomedical engineer and a clinician.Given a short training period of only 75 minute, the firstever exposure of the software and its concepts to most of theparticipants (Table 6), together with the fact that the softwareis still in its prototype stage, the overall response and averageperformance of 63% was remarkable. It is anticipated thatperformance can be enhanced to the level of the expert-userby means of a more user-friendly version of the software andmore intensive training. The results also show a decline inperformance with age. It may be associated with the IT skillsnecessary to use this type of software efficiently. This factshould be kept in mind when interpreting the results andformulating future training and translational requirements.
4.5. Software Design Improvement. Many valuable sugges-tions were collected from participants on the possibleimprovements in the software design and its functionalities.Among the important suggestions included automating the

10 Computational Intelligence and Neuroscience
Table 10: Literature-based evidence on the importance of hemodynamics in the etiopathogenesis of ICAs. NB: WSS; wall shear stress,MMP-13; matrixmetalloproteneases-13, iNOS; inducible-nitric oxide synthase, NO; nitric oxide, OSI; oscillatory shear index.
Hemodynamicfactors
Intracranial aneurysmProposed mechanism(s) References
Initiation Growth Rupture
Dynamic
Wall shear stress(WSS)
High Low Low
Increased WSS increases theproduction of MMP-13 which inturn leads to vessel wall damage.Decreased WSS increases iNOSsynthesis—NO induced damageto vessel wall.Low WSS increases endothelialproliferation and apoptosis
Boussel et al. [11], Fukuda et al.[30], Gao et al. [7], Jou et al.[31], Malek et al. [21], Meng etal. [32], Shojima et al. [9], Ujiieet al. [33]
Oscillatory shearindex (OSI)
High/Low High High Degenerative changes inendothelium
Glor et al. [35], Goubergrits et al.[34], Mantha et al. [15]
Jet of bloodstream
Impingement Impingement Impingement Localized endothelial cell injuryFoutrakis et al. [36], Cebral et al.[14], Cebral et al. [37]
Flow pattern — — Complex Statistical association Cebral et al. [14, 37]
Hydrostatic
Pressure High High High Passive yield/water hammereffect
Inci and Spetzler [38], Morimotoet al. [8] Steiger et al. [39]
steps for which user intervention is not strictly necessary,improving user friendliness through a more intuitive graph-ical user interface (GUI) where the user is guided throughthe number of operations required, or use of the icons inplace of the more cumbersome operation from the menu barand, finally graphical representation of the 1D circulationmodel for easier application of boundary conditions. Afterdiscussing the feasibility with developers, most of thesesuggestions were implemented in the latest version of thesoftware @neuFuse.
4.6. The Expected Place of CFD in Neurosurgery. It isinteresting to note that the majority of the participants (63%,Table 7) want these analyses to be performed either by anexpert clinical scientist/engineer or by a person with thesame level of expertise, rather than a clinician. The factmay reflect clinicians’ reluctance to conduct the analysesthemselves due to their understandable concern over time-constraints and may indicate the requirement of a dedicatedteam with sufficient infrastructure for the purpose. In spiteof this, most of the clinicians (84%, Table 7) see the softwareas a handy tool which can be used on an outpatientbasis (e.g., ophthalmoscope, otoscope, etc.) rather thana specialist department-based facility (e.g., 3DRA, MRA,etc.). On comparing the software in terms of the differentproperties of a diagnostic modality which makes it an idealoutpatient tool versus those requiring a dedicated setup, wefind that this software has some important features of anideal outpatient tool. It is noninvasive and is not directlyperformed on the patient (patients do not have to comeprepared, e.g., empty stomach). As it is totally noninvasive,there is no risk of cross-infection or contamination. Dueto no associated side effects, no admission or postoperativecare is necessary. Although only time will decide, in authors’view only a dedicated department with sufficient IT facilities
and dedicated biomedical engineers can take the burden ofthe extensive computational time required by more realistictransient analyses and, effort to visualize and extract thehemodynamic characteristics required for clinical decisionmaking.
Whereas the current study indicates a positive responseamong the clinical community for CFD and its use in IAs, itwill be necessary to expose the software to a larger number ofclinicians before definitive conclusions can be drawn.
5. Conclusions
Although participants showed a manifest interest in com-putational predictions, there is a clear lack of awarenessconcerning the role of hemodynamics in the etiopatho-genesis of IAs and the use of CFD in this context. Moreefforts therefore are required by the scientific community toenhance awareness and understanding of the clinicians in thesubject. There is a clear willingness to use such software asan outpatient tool. The mistrust in the results indicates theneed for validations, and most of the participants supportedwith the need of a multicentric trial, when software is ready.Keeping in mind the very first exposure to CFD for mostof the participants and the inherent difficulties associatedwith a developing-software, the average performance of 2.5(63% of an expert) was remarkable. Adequate training,controlled exposure, and further development of these toolsare necessary before these can be efficiently used by acommon clinician.
Acknowledgments
The authors would like to thank the European Commission,VI Framework Program, Priority 2, Information Society

Computational Intelligence and Neuroscience 11
Technologies, a European Public Funded Organization,for funding @neurIST Project (2) (www.aneurist.org) andallowing this study (Research Grant no. IST-FP6-027703).The funding was provided in the form of financial supportto first two authors along with the arrangement of neces-sary resources to conduct the workshop. The project hasappropriate ethical approvals for the required research. Theethical matters are managed by Project Ethical Committee,Oxford, UK. A copy of the ethical approval can be providedas and when required. Special thanks go to AlessandroChiarini, from BioComputing Competence Centre SCSs.r.l. (Bologna, Italy), Nacho Larrabide, from UniversitatPompeu Fabra (Barcelona, Spain), and the other developersfrom University of Bedfordshire, UK, for their dedicatedefforts and support to make this software presentable andfunctional. Ian Jones from ANSYS Europe Inc. needs specialmention for providing the ANSYS software to perform theanalyses. The 1D circulation model used in the analyses isthe result of the work done by Philippe Reymond and NikosStergiopulos from the Laboratory of Hemodynamics andCardiovascular Technology, Ecole Polytechnique, Federale deLausanne EPFL, Switzerland. They also extend their specialthanks to ESMINT (www.mitcourse.org) for providing theopportunity to conduct the workshop and, to all theparticipants of the workshop for their contribution.
References
[1] “Unruptured intracranial aneurysms—risk of rupture andrisks of surgical intervention. International Study of Unrup-tured Intracranial Aneurysms Investigators,” The New EnglandJournal of Medicine, vol. 339, pp. 1725–1733, 1998.
[2] S. Juvela, “Treatment options of unruptured intracranialaneurysms,” Stroke, vol. 35, no. 2, pp. 372–374, 2004.
[3] T. W. M. Raaymakers, G. J. E. Rinkel, M. Limburg, and A.Algra, “Mortality and morbidity of surgery for unrupturedintracranial aneurysms: a meta-analysis,” Stroke, vol. 29, no.8, pp. 1531–1538, 1998.
[4] D. O. Wiebers, J. P. Whisnant, J. Huston III, et al., “Unrupturedintracranial aneurysms: natural history, clinical outcome, andrisks of surgical and endovascular treatment,” The Lancet, vol.362, no. 9378, pp. 103–110, 2003.
[5] A. C. Burleson and V. T. Turitto, “Identification of quantifiablehemodynamic factors in the assessment of cerebral aneurysmbehavior: on behalf of the Subcommittee on Biorheology ofthe Scientific and Standardization Committee of the ISTH,”Thrombosis and Haemostasis, vol. 76, no. 1, pp. 118–123, 1996.
[6] J. V. Byrne and G. Guglielmi, Endovascular Treatment ofIntracranial Aneurysms, Springer, New York, NY, USA, 1998.
[7] L. Gao, Y. Hoi, D. D. Swartz, J. Kolega, A. Siddiqui, and H.Meng, “Nascent aneurysm formation at the basilar terminusinduced by hemodynamics,” Stroke, vol. 39, no. 7, pp. 2085–2090, 2008.
[8] M. Morimoto, S. Miyamoto, A. Mizoguchi, N. Kume, T. Kita,and N. Hashimoto, “Mouse model of cerebral aneurysm:experimental induction by renal hypertension and localhemodynamic changes,” Stroke, vol. 33, no. 7, pp. 1911–1915,2002.
[9] M. Shojima, M. Oshima, K. Takagi, et al., “Magnitude androle of wall shear stress on cerebral aneurysm: computational
fluid dynamic study of 20 middle cerebral artery aneurysms,”Stroke, vol. 35, no. 11, pp. 2500–2505, 2004.
[10] D. A. Steinman, J. S. Milner, C. J. Norley, S. P. Lownie, andD. W. Holdsworth, “Image-based computational simulationof flow dynamics in a giant intracranial aneurysm,” AmericanJournal of Neuroradiology, vol. 24, no. 4, pp. 559–566, 2003.
[11] L. Boussel, V. Rayz, C. McCulloch, et al., “Aneurysm growthoccurs at region of low wall shear stress: patient-specificcorrelation of hemodynamics and growth in a longitudinalstudy,” Stroke, vol. 39, no. 11, pp. 2997–3002, 2008.
[12] M. A. Castro, C. M. Putman, and J. R. Cebral, “Computationalfluid dynamics modeling of intracranial aneurysms: effectsof parent artery segmentation on intra-aneurysmal hemody-namics,” American Journal of Neuroradiology, vol. 27, no. 8, pp.1703–1709, 2006.
[13] J. R. Cebral, M. A. Castro, S. Appanaboyina, C. M. Putman,D. Millan, and A. Frangi, “Efficient pipeline for image-basedpatient-specific analysis of cerebral aneurysm hemodynamics:technique and sensitivity,” IEEE Transactions on MedicalImaging, vol. 24, no. 4, pp. 457–467, 2005.
[14] J. R. Cebral, M. A. Castro, J. E. Burgess, R. S. Pergolizzi, M.J. Sheridan, and C. M. Putman, “Characterization of cerebralaneurysms for assessing risk of rupture by using patient-specific computational hemodynamics models,” AmericanJournal of Neuroradiology, vol. 26, no. 10, pp. 2550–2559, 2005.
[15] A. Mantha, C. Karmonik, G. Benndorf, C. Strother, and R.Metcalfe, “Hemodynamics in a cerebral artery before andafter the formation of an aneurysm,” American Journal ofNeuroradiology, vol. 27, no. 5, pp. 1113–1118, 2006.
[16] Description of Work. @neurIST, “Integrated BiomedicalInformatics for the management of cerebral aneurysms,”Sixth Framework Programme, Priority 2. Information SocietyTechnologies. Project Identifier: IST-2004-027703.
[17] M. Viceconti, L. Astolfi, A. Leardini, et al., “The multimodapplication framework,” in Proceedings of the 8th InternationalConference on Information Visualisation (IV ’04), pp. 15–20,2004.
[18] P. Reymond, F. Merenda, F. Perren, D. Rufenacht, and N.Stergiopulos, “Validation of 1D model of the systemic arterialtree including the cerebral circulation,” in Proceedings of theSummer Bioengineering Conference (SBC ’08), Proceedings ofASME, Marco Island, Fla, USA, 2008.
[19] M. D. Ford, H. N. Nikolov, J. S. Milner, et al., “PIV-measuredversus CFD-predicted flow dynamics in anatomically realisticcerebral aneurysm models,” Journal of Biomechanical Engi-neering, vol. 130, no. 2, Article ID 021015, 2008.
[20] A. D. Jeays, P. V. Lawford, R. Gillott, et al., “Characterisation ofthe haemodynamics of the superior mesenteric artery,” Journalof Biomechanics, vol. 40, no. 9, pp. 1916–1926, 2007.
[21] A. M. Malek, S. L. Alper, and S. Izumo, “Hemodynamicshear stress and its role in atherosclerosis,” The Journal of theAmerican Medical Association, vol. 282, no. 21, pp. 2035–2042,1999.
[22] S. Juvela, M. Porras, and K. Poussa, “Natural history of unrup-tured intracranial aneurysms: probability and risk factors foraneurysm rupture,” Neurosurgical Focus, vol. 8, no. 5, preview1, 2000.
[23] R. J. Komotar, J. Mocco, and R. A. Solomon, “Guide-lines for the surgical treatment of unruptured intracranialaneurysms: the first annual J. Lawrence pool memorialresearch symposium—controversies in the management ofcerebral aneurysms,” Neurosurgery, vol. 62, no. 1, pp. 183–193,2008.

12 Computational Intelligence and Neuroscience
[24] M. R. Mayberg, H. H. Batjer, R. Dacey, et al., “Guidelines forthe management of aneurysmal subarachnoid hemorrhage: astatement for healthcare professionals from a special writinggroup of the Stroke Council, American Heart Association,”Stroke, vol. 25, no. 11, pp. 2315–2328, 1994.
[25] R. K. Khanna, G. M. Malik, and N. Qureshi, “Predict-ing outcome following surgical treatment of unrupturedintracranial aneurysms: a proposed grading system,” Journalof Neurosurgery, vol. 84, no. 1, pp. 49–54, 1996.
[26] R. A. Solomon, M. E. Fink, and J. Pile-Spellman, “Surgicalmanagement of unruptured intracranial aneurysms,” Journalof Neurosurgery, vol. 80, no. 3, pp. 440–446, 1994.
[27] F. P. Wirth, E. R. Laws Jr., D. Piepgras, and R. M. Scott,“Surgical treatment of incidental intracranial aneurysms,”Neurosurgery, vol. 12, no. 5, pp. 507–511, 1983.
[28] N. Yasui, S. Magarisawa, A. Suzuki, H. Nishimura, T. Okudera,and T. Abe, “Subarachnoid hemorrhage caused by previouslydiagnosed, previously unruptured intracranial aneurysms: aretrospective analysis of 25 cases,” Neurosurgery, vol. 39, no.6, pp. 1096–1101, 1996.
[29] S. Juvela, M. Porras, and O. Heiskanen, “Natural history ofunruptured intracranial aneurysms: a long-term follow- upstudy,” Journal of Neurosurgery, vol. 79, no. 2, pp. 174–182,1993.
[30] S. Fukuda, N. Hashimoto, H. Naritomi, et al., “Prevention ofrat cerebral aneurysm formation by inhibition of nitric oxidesynthase,” Circulation, vol. 101, no. 21, pp. 2532–2538, 2000.
[31] L.-D. Jou, D. H. Lee, H. Morsi, and M. E. Mawad, “Wall shearstress on ruptured and unruptured intracranial aneurysms atthe internal carotid artery,” American Journal of Neuroradiol-ogy, vol. 29, no. 9, pp. 1761–1767, 2008.
[32] H. Meng, Z. Wang, Y. Hoi, et al., “Complex hemodynamics atthe apex of an arterial bifurcation induces vascular remodelingresembling cerebral aneurysm initiation,” Stroke, vol. 38, no. 6,pp. 1924–1931, 2007.
[33] H. Ujiie, H. Tachibana, O. Hiramatsu, et al., “Effects ofsize and shape (aspect ratio) on the hemodynamics ofsaccular aneurysms: a possible index for surgical treatment ofintracranial aneurysms,” Neurosurgery, vol. 45, no. 1, pp. 119–130, 1999.
[34] L. Goubergrits, U. Kertzscher, B. Schoneberg, E. Wellnhofer, C.Petz, and H.-C. Hege, “CFD analysis in an anatomically realis-tic coronary artery model based on non-invasive 3D imaging:comparison of magnetic resonance imaging with computedtomography,” International Journal of Cardiovascular Imaging,vol. 24, no. 4, pp. 411–421, 2008.
[35] F. P. Glor, B. Ariff, A. D. Hughes, et al., “The integrationof medical imaging and computational fluid dynamics formeasuring wall shear stress in carotid arteries,” in Proceedingsof the Annual International Conference of the IEEE Engineeringin Medicine and Biology Society, vol. 2, pp. 1415–1418, 2004.
[36] G. N. Foutrakis, H. Yonas, and R. J. Sclabassi, “Saccularaneurysm formation in curved and bifurcating arteries,”American Journal of Neuroradiology, vol. 20, no. 7, pp. 1309–1317, 1999.
[37] J. R. Cebral, S. Hendrickson, and C. M. Putman, “Hemo-dynamics in a lethal basilar artery aneurysm just before itsrupture,” American Journal of Neuroradiology, vol. 30, no. 1,pp. 95–98, 2009.
[38] S. Inci and R. F. Spetzler, “Intracranial aneurysms and arterialhypertension: a review and hypothesis,” Surgical Neurology,vol. 53, no. 6, pp. 530–542, 2000.
[39] H. J. Steiger, R. Aaslid, S. Keller, and H.-J. Reulen, “Growthof aneurysms can be understood as passive yield to bloodpressure. An experimental study,” Acta Neurochirurgica, vol.100, no. 1-2, pp. 74–78, 1989.
[40] J. D. J. Anderson, Computational Fluid Dynamics: The Basicswith Application, McGraw-Hill, New York, NY, USA, 1stedition, 1995.
[41] M. D. Ford, G. R. Stuhne, H. N. Nikolov, et al., “Virtualangiography for visualization and validation of computationalmodels of aneurysm hemodynamics,” IEEE Transactions onMedical Imaging, vol. 24, no. 12, pp. 1586–1592, 2005.
[42] C. Karmonik, R. Klucznik, and C. Benndorf, “Blood flow incerebral aneurysms: comparison of phase contrast magneticresonance and computational fluid dynamics—preliminaryexperience,” RoFo Fortschritte auf dem Gebiet der Rontgen-strahlen und der Bildgebenden Verfahren, vol. 180, no. 3, pp.209–215, 2008.
[43] A. G. Radaelli, L. Augsburger, J. R. Cebral, et al., “Repro-ducibility of haemodynamical simulations in a subject-specificstented aneurysm model—a report on the Virtual IntracranialStenting Challenge 2007,” Journal of Biomechanics, vol. 41, no.10, pp. 2069–2081, 2008.

This article appeared in a journal published by Elsevier. The attached
copy is furnished to the author for internal non-commercial research
and education use, including for instruction at the authors institution
and sharing with colleagues.
Other uses, including reproduction and distribution, or selling or
licensing copies, or posting to personal, institutional or third party
websites are prohibited.
In most cases authors are permitted to post their version of the
article (e.g. in Word or Tex form) to their personal website or
institutional repository. Authors requiring further information
regarding Elsevier’s archiving and manuscript policies are
encouraged to visit:
http://www.elsevier.com/copyright

Author's personal copy
Clinical Neurology and Neurosurgery 112 (2010) 306–313
Contents lists available at ScienceDirect
Clinical Neurology and Neurosurgery
journa l homepage: www.e lsev ier .com/ locate /c l ineuro
Effects of smoking and hypertension on wall shear stress and oscillatory shearindex at the site of intracranial aneurysm formation
Pankaj K. Singha,b,!, Alberto Marzoc, Bethany Howardd, Daniel A. Rufenachte, Philippe Bijlengaf,Alejandro F. Frangig,h,i, Patricia V. Lawfordc, Stuart C. Coley j, D. Rodney Hosec, Umang J. Patelb
a Department of Medical Physics, Royal Hallamshire Hospital, Sheffield, UKb Department of Neurosurgery, Royal Hallamshire Hospital, Sheffield, UKc Academic Unit of Medical Physics, School of Medicine and Biomedical Sciences, University of Sheffield, Sheffield, UKd Academic Unit of Medical Physics, School of Biomedical Sciences, University of Sheffield, Sheffield, UKe Department of Neuroradiology, Institute of Radiology, University Hospital Basel, Petersgraben, Basel, Switzerlandf Clinic of Neurosurgery, Department of Clinical Neurosciences, Geneva University Hospital, Switzerlandg Center for Computational Imaging & Simulation Technologies in Biomedicine, Universitat Pompeu Fabra (UPF), Barcelona, Spainh Center for Networked Biomedical Research on Bioengineering, Biomaterials and Nanomedicine (CIBER-BBN), Spaini Institució Catalana de Recerca i Estudis Avacats (ICREA), Barcelona, Spainj Department of Neuroradiology, Royal Hallamshire Hospital, Sheffield, UK
a r t i c l e i n f o
Article history:Received 5 August 2009Received in revised form 6 November 2009Accepted 28 December 2009Available online 21 January 2010
Keywords:Blood viscosityComputational fluid dynamics (CFD)HemodynamicsHypertensionInitiationIntracranial aneurysmSmokingWall shear stress (WSS)Oscillatory shear index (OSI)
a b s t r a c t
Objective: The mechanisms by which smoking and hypertension lead to increased incidence of intracranialaneurysm (IA) formation remain poorly understood. The current study investigates the effects of theserisk factors on wall shear stress (WSS) and oscillatory shear index (OSI) at the site of IA initiation.Methods: Two (n = 2) IAs from two patients with history of smoking and hypertension were artificiallyremoved with the help of software @neuFuse (Supercomputing Solutions®, Bologna, Italy) and the vesselgeometry reconstructed to mimic the condition prior to IA formation. Two computational fluid dynamics(CFD) analyses were performed on each data-set by using in turn the normal physiological values of bloodviscosity (BV), and high BV values specific to smoking and hypertension, obtained from literature.Results: At normal BV, high WSS (>15 Pa) was observed at the site of IA initiation in both patients. When BVvalues specific to smoking and hypertension were used, both the areas affected by high WSS (>15 Pa) andthe maximum WSS were increased whilst the magnitude and distribution of OSI showed no significantchange.Conclusions: Long-term exposure to high WSS may result in an increased risk of IA development. Anincremental increase in areas of high WSS observed secondary to smoking and hypertension may indicatea further increase in the risk of IA initiation. Interestingly, the relationship between BV and the area ofincreased WSS was not linear, reflecting the need for patient-specific CFD analysis.
Crown Copyright © 2010 Published by Elsevier B.V. All rights reserved.
1. Introduction
Aneurysmal subarachnoid hemorrhage (SAH) remains a majorcause of morbidity and mortality in neurosurgical patients [34,51].Smoking and hypertension are well-established risk factors in IAformation [6,16,35,38,40]. However, their roles in the mechanismsthat regulate aneurysm formation are poorly understood and areessentially limited to their statistical associations.
! Corresponding author at: Department of Neurosurgery, Royal Hallamshire Hos-pital, Glossop Road, Sheffield S10 2JF, UK. Tel.: +44 114 2712180;fax: +44 114 2713314.
E-mail address: [email protected] (P.K. Singh).
Recent evidence indicates WSS and OSI as important underly-ing hemodynamic factors in IA formation [9,11,24,49]. One of theimportant parameters influencing WSS is blood viscosity, whichin turn is influenced by smoking and hypertension [17,41]. Thecurrent study employs CFD to predict the effect of smoking andhypertension on the WSS patterns at the site of IA initiation withaim to explore the possible underlying mechanisms leading to theirformation.
2. Materials and methods
2.1.1. Study design and patients’ recruitment
The study was conducted jointly in the Departments of Neu-rosurgery and Neuroradiology, Royal Hallamshire Hospital, and
0303-8467/$ – see front matter. Crown Copyright © 2010 Published by Elsevier B.V. All rights reserved.doi:10.1016/j.clineuro.2009.12.018

Author's personal copy
P.K. Singh et al. / Clinical Neurology and Neurosurgery 112 (2010) 306–313 307
Table 1Patients’ demography, clinical presentations of IAs included in the study, their management and the known risk factors.
Pt Age/sex Clinical presentation Ruptured/unruptured
Management Location of IA Smoking Hypertension Other riskfactors
1 45/M Asymptomatic Unruptured Observed Lt terminal ICA >60 cigarettes/day/25 years Poorly controlled None2 45/F Asymptomatic Unruptured GDC embolization Rt terminal ICA >40 cigarettes/day/22 years Controlled on medication None
NB: Pt, patient; GDC, Guglielmi detachable coils; Lt, left; Rt, right; ICA, internal carotid artery.
the Department of Cardiovascular Science, University of Sheffield,Sheffield, UK. A total of two (n = 2) patients diagnosed with IAsbetween January 2004 and March 2009, were identified retrospec-tively and recruited with appropriate consent and ethical approval.In order to avoid age and sex bias both patients were selected fromthe same age group (45 years) with one male and one female. Theirrelevant demographic and clinical data are reported in Table 1.
2.1.2. 3DRA acquisitions
Medical images were obtained using rotational acquisition in aPhilips® IntegrisTM Allura machine (Philips® Medical Systems, Best,The Netherlands), producing 100 images in 6 s, with 5 ms exposureper image. Voxel size in the reconstructed 3D images was 121 !mwith reconstruction matrix 512 " 512 " 512.
2.1.3. Numerical 3D model
@neuFuse, the computational tool-chain developed within theEU project @neurIST was used to reconstruct vessel and aneurysmalgeometries. Vessel triangular surfaces were reconstructed using athreshold iso-surface extraction tool, based on the marching cubesalgorithm developed by Lorensen and Cline [42]. The removal ofIAs was performed with the help of software @neuFuse. In order tomark the location of the IA in the parent artery after its removal, theimage with IA in situ was superimposed over the image where theIA was removed. This step was done during the post-processing ofdata with the help of software ANSYS®-CFX PostprocessTM. A vir-tual marker (a sphere) was placed at the location of IA in the parentvessel from where the IA was removed. Now the first image (imagewith IA intact) was taken out and the location of IA (as localized bythe virtual marker) was displayed by the arrows. Understanding theimportance of the issue authors have used exactly the same viewsfor comparing the hemodynamic indices with and without intracra-nial aneurysms, so that the readers can make out the location of IAseasily in the view where there no IAs are present.
Volumetric meshes were generated using ANSYS® ICEMTM CFD11.0 (Ansys®, Inc., Canonsburg, PA, USA) based on the octreeapproach. The mesh was refined at the wall (using prismaticelements) for more accurate computation of WSS and OSI. Forcomputational efficiency a progressively coarser mesh was usedtowards the vessel axis. Tetrahedral elements were used for thediscretization of the domain core, with three layers of prismaticelements adjacent to the wall, thus ensuring accurate computationof WSS and OSI. Element size and number were set according to
the outcome of a mesh dependency study performed on similaraneurysmal geometries [58]. In this study results were found to begrid independent for meshes greater than 1700 el/mm3. In orderto maintain consistency across the meshes used for all geome-tries, similar element density and the same wall element size andmaximum core element size were used in the discretization of thedomains.
The 3D transient Navier–Stokes equations were solved usingthe finite-control-volume software, ANSYS®-CFXTM. In view of therecent findings of [44] we used the ‘plug-flow’ or ‘flat’ velocityprofile at inlet instead of Womersley flow profile. The defaultsecond-order high-resolution advection differencing scheme wasused. Blood was assumed to be incompressible, with density! = 1060 kg/m3 and Newtonian, with viscosity "typical = 3.5 mPa s.The effects of hypertension and smoking were modelled by increas-ing BV values by 8.1% ("atypical = 3.78 mPa s) according to thefindings of de Simone et al. [17] and Price et al. [55]. Boundary con-ditions (BCs) for the 3D models were provided in the form of typicalvolumetric flow rate waveforms at inlet and pressure waveforms atoutlet. These were computed using the 1D circulation model devel-oped by Reymond et al. [60]. The authors validated their modeland found that the predictions of this 1D model have good agree-ment with the measurements performed in the real patient/healthyvolunteers.
3. Results
Values of WSS and OSI were time-averaged for one cardiac cycleand a qualitative and quantitative comparison made for the twoBVs. WSS contours reported in Figs. 1 and 2, and the data reportedin Table 2, show that, in the case of both patients, the aneurysmformed at a location where WSS was higher than the mean valuein the parent vessel. At physiological BV, the maximum WSS atthe site of IA initiation for patient-1 (21.3 Pa) was approximately5 times higher than the mean value in the parent vessel (4.5 Pa).Similarly, for patient-2, the maximum WSS at the initiation site(56.5 Pa) was approximately 5 times higher than in the parent ves-sel (12.1 Pa). OSI also followed the same trend with relatively highervalues at the sites of aneurysmal development for both patients,compared to that in the respective parent vessel (Figs. 1 and 2and Table 2). However, it must be noted that areas of relativelyhigh WSS and OSI were not exclusively limited to the sites of IAformation.
The threshold value of 15 Pa for WSS used in the study waschosen as an arbitrary limit to highlight the areas of relatively
Table 2Quantitative comparison of values of WSS and OSI obtained using two BVs; "typical and "atypical .
Patient-1 Patient-2
"typical "atypical %Change "typical "atypical %Change
Area of WSS >15 Pa at aneurysm location (mm2) 1.24 1.42 +14.5 0.67 0.68 +1.5Area of WSS >15 Pa in parent vessel (mm2) 7.01 8.24 +17.5 148.8 160.0 +7.5Maximum WSS at aneurysm location (Pa) 21.3 22.2 +4.2 56.54 58.73 +3.9Average WSS in parent vessel (Pa) 4.5 4.7 +4.4 12.12 12.68 +4.6Area of OSI >0.01 at location (mm2) 0.83 0.79 #5.3 0.21 0.22 +5.1Maximum OSI at location (mm2) 0.018 0.019 +2.1 0.21 0.20 #2.8
NB: "typical , typical blood viscosity; "atypical , blood viscosity in smokers and hypertensive patients.

Author's personal copy
308 P.K. Singh et al. / Clinical Neurology and Neurosurgery 112 (2010) 306–313
Fig. 1. Reconstructed geometry of the IA and surrounding vasculature for patient-1 (A). Contours of WSS (B and C) and OSI (D and E) for "typical (B and D) and "atypical (C andE) are displayed. Arrows indicate the site of IA along the parent vessel before removal.
Table 3The literature-based evidence on the importance of WSS and OSI in the etiopathogenesis of IAs.
Hemodynamic factors Intracranial aneurysm Proposed mechanism(s) References
Initiation Growth Rupture
Wall shear stress (WSS) High Low Low Increased WSS increases theproduction of MMP-13 which in turnleads to vessel wall damage
Boussel et al. [8], Fukuda et al. [22],Gao et al. [24], Jou et al. [37], Malek etal. [46], Meng et al. [47], Ujiie et al. [79]
Decreased WSS increases iNOSsynthesis NO induced damage to vesselwallLow WSS increases endothelialproliferation and apoptosis
Oscillatory shear index (OSI) High High High Degenerative changes in endothelium Glor et al. [25,26], Goubergrits et al.[28], Mantha et al. [45]
NB: MMP-13, matrix metalloproteinases-13; NO, nitric oxide; iNOS, inducible-NO synthase.

Author's personal copy
P.K. Singh et al. / Clinical Neurology and Neurosurgery 112 (2010) 306–313 309
Fig. 2. Reconstructed geometry of the IA and surrounding vasculature for patient-2 (A). Contours of WSS (B and C) and OSI (D and E) for "typical (B and D) and "atypical (C andE) are displayed. Arrows indicate the site of IA along the parent vessel before removal.
higher WSS where the IAs were initiated and to appreciate/quantifythe effects of changes in BV in smokers and hypertensives onWSS. Whereas it was possible to identify a threshold for infra-physiological WSS (<0.4 Pa) [46], no such values could be findin the literature for supra-physiological WSS. An increase inBV, to represent the effects of smoking and hypertension, isreflected in the values of WSS and OSI, reported in Table 2.For patient-1 the area of high WSS (>15 Pa) increased by 17.5%,whereas for patient-2 the increment was 7.5%. The maximum val-ues of WSS at initiation sites followed a similar trend, but theincrement was around 4% for both patients. Interestingly, theincrease in the value of WSS does not correlate linearly withthe increment in BV. Furthermore, from the data in Table 2, itcan be seen that changes in BV do not have a significant orconsistent effect on the value of OSI at the site of aneurysmaldevelopment.
4. Discussion
The exact etiopathogenesis of IA formation is poorly understood[69]. Whilst there is some indication of a congenital link [19], IAs arebelieved primarily to be acquired lesions [14,73]. Recent evidencesuggests a strong correlation between different hemodynamic fac-tors and the etiopathogenesis of IAs [9,11,24,49]. In particular, anumber of studies suggest a link between aneurysmal initiation,growth and rupture and the magnitude and distribution of WSSand OSI (Table 3).
4.1. Wall shear stress (WSS)
WSS is a tangential frictional force exerted by flowing blood onthe arterial endothelium, and is proportional to the blood viscosityand the velocity gradients. Mean arterial WSS has been suggested

Author's personal copy
310 P.K. Singh et al. / Clinical Neurology and Neurosurgery 112 (2010) 306–313
by Malek et al. to lie within the range of 1.5–2.0 Pa [46]. There is anincreasing body of literature suggesting that high WSS plays a rolein the initiation of IAs [9,11,24,27,49,63]. This is further supportedby the observation that IAs most frequently occur at bifurcationsand arterial bends. These are regions which are exposed to con-stantly high WSS [21,62].
A number of different mechanisms have been proposed toexplain how WSS influences the natural history of an IA. It hasbeen established that the normal behaviour of arterial endothe-lial cells (ECs) is regulated by hemodynamic shear stress. Sho et al.[71] observed that increased WSS stimulates ECs to produce matrixmetalloproteinase (MMP-13) which, in turn, leads to degenerationof the internal elastic lamina. In 1993 Luscher and Tanner [43]found that the release of EC-derived growth and relaxation factor(EDRF—later recognised as nitric oxide) is shear stress dependentand is responsible for vascular remodelling. It has been demon-strated by a number of workers [13,22,54] that WSS increases theproduction of NO by the ECs by inducing an enzyme responsiblefor its synthesis (iNOS, inducible nitric oxide synthase). Fukuda etal. [22] found a high localization of iNOS at the site of IA formation,in both rat and human arteries. They also demonstrated that iNOSinhibitors such as Aminoguanidine and Batroxobin (DF-521) atten-uate the early degenerative changes associated with IA formation.The preventive effects of these drugs are thought to be mediatedby lowering BV and hence WSS [22]. They concluded that iNOS isa prerequisite for de novo development of IAs in cerebral vessels.In 1995, Wang and Tarbell [81] showed that smooth muscle cells(SMCs) in arterial wall can also respond to WSS in intact arteries by
virtue of interstitial flow generated by transmural flow gradients,further accentuating the vessel wall damage.
A number of authors have attempted to explain the mecha-nisms linking WSS with EDRF/NO production. Experimental studiesconducted by Busse and Mulsch [10] revealed that WSS activatescalcium ion-dependent endothelial iNOS leading to its increasedproduction. Furthermore, WSS augments the release of adenosinetri-phosphate (ATP) and substance-P from EC [48]. Increased con-centrations of these two mediators are believed to enhance NOproduction in a paracrine manner [54]. More directly, increasedWSS leads to hyperpolarization of the ECs by mobilizing the calciumions from intracellular stores in cultured ECs [3] probably via activa-tion of phospholipase-C [4] and/or K+ channels [52]. Several authorshave attempted to explain the mechanism of WSS transductionby the endothelium [7,54,58]. Born and Palinski [7] identified 3Dmechanoreceptors anchored to the endothelial membrane. Theyhypothesized that WSS acts on these mechanoreceptors, mechani-cally enhancing the interaction between regulatory proteins andtheir targets [7]. Resnick and colleagues [59] located a WSS-responsive element for iNOS on endothelial genes in 1993.
Table 4 gives an overview of the important mechanisms pro-posed on the role of WSS in vascular remodelling.
The findings of the current study support the correlationbetween high WSS and initiation of IA. Maximum values of WSSat the site of aneurysm formation were approximately 5 timeshigher than the mean values observed in the parent vessels, in bothpatients (Table 2).
Table 4WSS-induced vascular remodelling: an overview of some important mechanisms proposed.
Author/journal/year Proposed mechanism(s)/observations Implications
Rossitti (Acta Radiol, 1998) [62],Foutrakis et al. (Neurol Res, 1997)[21]
IAs mostly occur at arterial bends and bifurcations exposedconstantly to high WSS
High WSS can be a possible culprit in the development ofIAs
Sho et al. (Exp Mol Pathol, 2002) [71] Increased WSS stimulates endothelial cells to producematrix metalloproteinases (MMP-13)
Degeneration of the arterial internal elastic lamina byMMP-13
Luscher and Tanner (Am J Hypertens,1993) [43]
Release of endothelium derived EDRF is shear stressdependent
Vascular remodelling by WSS
Cooke et al. (Am J Physiol, 1990) [13],Pohl et al. (Am J Physiol, 1991) [54],Fukuda et al. (Circulation, 2000) [22]
WSS induces iNOS, an enzyme responsible for NO synthesis Increased production of NO in the endothelium, EC injury
Fukuda et al. (Circulation, 2000) [22] Found high concentrations of iNOS at the site of IAformation, both in rat and human arteries
Levels of iNOS correlate with IA initiation
Fukuda et al. (Circulation, 2000) [22] iNOS inhibitors; Aminoguanidine and Batroxobin (DF-521)attenuate the early degenerative changes associated withIA formation
Aminoguanidine and Batroxobin (DF-521) have preventiveeffects on IA formation by lowering WSS
Wang and Tarbell (J Biomech Eng,1995) [81]
SMCs in arterial walls also respond to shear stress WSS induced vessel wall damage can extend to SMCs
Busse and Mulsch (FEBS Lett, 1990)[10]
WSS activate the calcium ion-dependent endothelial iNOS WSS increases the synthesis of iNOS
Milner et al. (Proc Biol Sci, 1990) [48],Pohl et al. (Am J Physiol, 1991) [54]
WSS also augments the release of adenosine tri-phosphate(ATP) and substance-P from ECs
These two mediators increase EDRF production in aparacrine manner
Ando et al. (In Vitro Cell Dev Biol,1988) [3]
High WSS leads to the hyperpolarization of the ECs bymobilizing the calcium ions from intracellular stores
EC damage
Bhagyalakshmi and Frangos (BiochemBiophys Res Commun, 1989) [4]
Hyperpolarization of ECs and mobilization of intracellularcalcium is via activation of phospholipase-C
EC damage
Olesen et al. (Nature, 1988) [52] Hyperpolarization of the ECs and mobilization ofintracellular calcium is via activation of K+ channels
EC damage
Born and Palinski (Br J Exp Pathol,1985) [7]
Identified presence of 3D mechanoreceptors anchored tothe EC membrane, WSS acts on these mechanoreceptors,mechanically enhancing the interaction betweenregulatory proteins and their targets
Link is established on how WSS transduces signals to ECs
Resnick et al. (Proc Natl Acad Sci USA,1993) [59]
Located a WSS-responsive element for iNOS on EC genes Role of WSS in EC damage
Fukuda et al. (Circulation, 2000) [22] Both, the magnitude of WSS as well as the duration ofexposure for the endothelium remain importantdeterminants for the induction of iNOS
Duration and magnitude of WSS play important role in IAformation
Wagner et al. (J Clin Invest, 1997) [80] Demonstrated that no iNOS was induced when the SMCswere exposed lower WSS (1.1–2.5 Pa) for shorter durations(<24 h)
Chronic and significant exposure of WSS are required forthe initiation of IAs
NB: MMP-13, matrix metalloproteinases-13; NO, nitric oxide; iNOS, inducible-NO synthase; EC, endothelial cells.

Author's personal copy
P.K. Singh et al. / Clinical Neurology and Neurosurgery 112 (2010) 306–313 311
4.2. Oscillatory shear index (OSI)
The OSI is a measure of the oscillatory nature of shear forces[25,26,28,44]. This index, which has a range of between 0 and 0.5,represents the fraction of the cardiac cycle over which the instan-taneous shear force vector forms an angle greater than 90$ to thetime-average direction of the same force. Consistently high valuesof OSI have been associated with EC dysfunction [33] and changesin cell structure secondary to cyclic mechanical stress have beendemonstrated by Wang and Tarbell [81] reporting disruption of theactin cytoskeleton of ECs.
Glor et al. propose that an OSI of 0.2 represents a threshold valueabove which endothelial damage is initiated [25,26]. Damage to ECsproduced by high OSI may contribute in IA formation. Areas of rel-atively high OSI predicted at the site of aneurysm formation forpatient-2 in our CFD simulations support such theories; the maxi-mum values observed approached the threshold value of OSI (0.2)identified in the literature. In contrast, for patient-1, the OSI at thesite of IA initiation fell well below the threshold. This may indicatea less significant role for OSI in IA formation, at least in the case ofthis particular patient.
Whilst, for both patients, areas of high WSS and OSI were locatedprimarily at the bifurcations where the two IAs were observed,areas of high value for these indices were also predicted at othersites in the parent vessels. This raises a further question; why arethese other critical areas unaffected? One explanation is that, inaddition to the key hemodynamic triggers, IA initiation is gov-erned by many other factors including amongst others; smoking,hypertension, genetics, polycystic kidney disease, Ehlers–Danlossyndrome, Marfans’s syndrome, etc. In addition, the possibility of denovo IA formation in these patients in other locations in the futurecannot be excluded without a long-term follow-up.
4.3. Role of smoking and hypertension in the IA formation
Smoking and hypertension are two well-established risk fac-tors for IA formation. A number of clinical studies have highlightedthe strong association between smoking [2,6,57,63,67] and hyper-tension [35,65,72,76,77] and de novo IA formation. Indeed, bothrisk factors also correlate with the presence of multiple IAs[18,38,53,57,61]. Experimental studies, where IA has been inducedby hypertension, confirm these findings [30–32,39,40,50,56,75].Furthermore, autopsy studies conducted to assess the relation-ship between the IA formation and hypertension demonstrate evenstronger correlations [12,15,16,66,78].
Whilst being well-established risk factors for IA formation,the exact mechanisms by which smoking and hypertension leadto increased IA formation remain controversial [35]. A num-ber of explanations have been offered including; endothelial cellinjury, occlusion of vasa vasorum and disturbances in the syn-thesis of elastin and collagen [35]. It has been proposed thatprotease/protease-inhibitor factor imbalance is a factor in smok-ers and a quantitative deficiency of alpha-1-antitrypsin has beenreported both in patients with SAH and in smokers [23,68,74].Alpha-1-antitrypsin is an inhibitor of elastase, a proteolytic enzymewhich enhances collagen catabolism. This link is not supported uni-versally; Sakai et al. [64] attribute the increased plasma proteaselevels found in patients with IAs to leucocytosis after SAH thusdisputing the significance of plasma protease/protease-inhibitorimbalance as a marker for IA formation. Another hypothesis sug-gests that IA formation is a part of a vascular degenerative processsimilar to atherosclerosis and that smoking leads to IA initiation byfacilitating this process [1,29].
One widely recognised effect of smoking and hypertension is anincrease in BV [17,55]. We propose that the missing link betweenthese risk factors and increased IA formation is via high WSS sec-
ondary to an increase in BV. This hypothesis is supported by ourfindings which show an increase in the area of vessel wall subjectto high WSS and elevated maximum values of WSS coincident withthe IA initiation site for the two patients studied. For patient-1 bothqualitative (Fig. 1) and quantitative (Table 2) comparisons showthat increased BV results in a substantial increase in the maximumWSS of 4.2%. The area of wall affected by very high WSS (>15 Pa), upby 14.5% and 17.5% for the site of the IA and parent vessel respec-tively. Similar trends were observed for patient-2 but the relativedifferences were lower (Fig. 2 and Table 2).
There is strong evidence to indicate that induction of iNOS in ECsis dependent on both the magnitude and duration of exposure toWSS [22]. In an experimental study, Wagner et al. [80], found thatiNOS was not induced when the vessel walls were exposed to lowWSS (1.1–2.5 Pa) for short durations (<24 h). The study suggeststhat the chances of IA development are increased if an artery isexposed to high WSS on chronic basis. Both patients included inour study were exposed to these two risk factors chronically for anextended period (20–25 years). Long-term exposure to high WSS,and the increase in the area of vessel wall affected, may have led toEC damage in these patients and contributed to an increased riskof IA development.
Changes in OSI at the sites of IAs were less marked than changesin WSS, and had no consistent trend. Whilst OSI is not directlydependent on BV, changes in hemodynamics resulting from alteredrheology may be reflected in the OSI. However the results indicateits less significant dependency from the hemodynamic changessecondary to altered BV.
It is important to note that our findings differ in some respectsfrom those reported for previous studies, based on similar method-ology [44,70]. These sought to develop novel indices in an attemptto link initiation with a hemodynamic trigger whilst indicating thatWSS was relatively low at the site of IA initiation. Shimogonya etal. [70] reported a significant correlation between IA formation anda self-proposed hemodynamic index which they termed the ‘gra-dient oscillatory number’ (GON) and Mantha et al. [45] showed acorrelation between IA initiation and their newly proposed hemo-dynamic index; aneurysm formation indicator (AFI). In consideringthese results in the light of the current work, it is important to notethat Shimogonya et al. used a simplified geometry which may haveinfluenced their results. Furthermore, as there are bodies of liter-ature associating low [8,11,37,46] and high [9,11,22,24,27,49,62]WSS with endothelial dysfunction and the etiopathogenesis ofIA, it could be argued that both supra-physiological and infra-physiological WSS lead to perturbance of normal EC behaviour. Ourfindings agree with the majority of studies [9,11,22,24,27,49,62]which support the role of high WSS in IA formation.
It is evident that the IA formation is likely to have a multi-factorial etiology with hemodynamic factors acting as an importantcog in this process. Many factors are likely to act in parallel ren-dering the vessel wall more susceptible to the effects of increasedpressure and WSS.
4.4. Limitations of the study
Before drawing any conclusions it is important to emphasisethat our study, in common with other CFD analyses, carries inher-ent limitations associated with the assumptions necessary to createthe models. First, whilst very high quality images (3DRA) were usedto reconstruct the vessel geometries, these represent the volume ofthe vessel occupied by contrast agent. If vessel filling with contrastis incomplete this may generate errors in surface prediction. Unfor-tunately, due to the limitations of current technology this remainsan unresolved problem. Second, the BCs used in the analyses wereobtained from a generic 1D circulation model and were not patient-specific [60]. Here it is important to note that recent validation of

Author's personal copy
312 P.K. Singh et al. / Clinical Neurology and Neurosurgery 112 (2010) 306–313
this model against flow waveforms measured for young volunteersjustify its use [60]. Third, despite being non-Newtonian, blood wasconsidered as a Newtonian fluid for the purposes of these analyses.This assumption was based on the observations that, blood behavesas a Newtonian fluid at the high shear-rates which apply at mostsites in the cerebral circulation (>100 s#1) [5], in particular in areascoinciding with sites of IA formation. Fourth, the arterial wall wasconsidered rigid, neglecting wall motion, as this has been shownto have a negligible effect on CFD predictions [20,36]. Finally, thestudy was performed on a small cohort of two IAs. The work mustbe considered as a preliminary study; analyses will be required fora significantly larger number of IAs before firm conclusions can bedrawn.
5. Conclusions
The current study suggests that long-term exposure to high WSSmay affect the behaviour of ECs leading, in turn, to an increased riskof IA development. IA formation is likely to have a multi-factorialetiology with hemodynamics acting as an important componentin the process. Increase in BV and hence WSS may be one of theimportant underlying mechanisms responsible for the increasedincidence of IA formation in smokers and hypertensive patients.Trends in OSI patterns were less significant, with no consistenttrend, and a less significant interdependency with BV. Interestingly,the relationship between BV and the area of increased WSS was notlinear, reflecting the need for patient-specific CFD analysis.
Conflict of interest
Authors have nothing to declare under conflict of interests.
Ethical approvals
The project has appropriate ethical approvals for the requiredresearch. The ethical matters are managed by Project Ethical Com-mittee, Oxford, UK (Oxfordshire Research Ethics Committee-AStudy Number: 07/Q1604/53). A copy of the ethical approval canbe provided as and when required.
Acknowledgements
The study was funded by European Commission, VI FrameworkProgramme, Priority 2, Information Society Technologies, a Euro-pean Public Funded Organization, under the banner of @neurISTProject (Research Grant No. IST-FP6-027703). The funding was pro-vided in the form of financial support to first two authors along withthe arrangement of necessary resources to conduct the workshop.
References
[1] Adamson J, Humphries SE, Ostergaard JR, Voldby B, Richards P, Powell JT. Arecerebral aneurysms atherosclerotic? Stroke 1994;25:963–6.
[2] Anderson CS, Feigin V, Bennett D, Lin RB, Hankey G, Jamrozik K. Active andpassive smoking and the risk of subarachnoid hemorrhage: an internationalpopulation-based case–control study. Stroke 2004;35:633–7.
[3] Ando J, Komatsuda T, Kamiya A. Cytoplasmic calcium response to fluidshear stress in cultured vascular endothelial cells. In Vitro Cell Dev Biol1988;24:871–7.
[4] Bhagyalakshmi A, Frangos JA. Mechanism of shear-induced prostacyclin pro-duction in endothelial cells. Biochem Biophys Res Commun 1989;158:31–7.
[5] Bonert M, Myers JG, Fremes S, Williams J, Ethier CR. A numerical study of bloodflow in coronary artery bypass graft side-to-side anastomoses. Ann Biomed Eng2002;30:599–611.
[6] Bonita R. Cigarette smoking, hypertension and the risk of subarachnoid hem-orrhage: a population-based case–control study. Stroke 1986;17:831–5.
[7] Born GV, Palinski W. Unusually high concentrations of sialic acids on the surfaceof vascular endothelia. Br J Exp Pathol 1985;66:543–9.
[8] Boussel L, Rayz V, McCulloch C, Martin A, Acevedo-Bolton G, Lawton M, et al.Aneurysm growth occurs at region of low wall shear stress. Patient-specificcorrelation of hemodynamics and growth in a longitudinal study. Stroke 2008.
[9] Burleson AC, Turitto VT. Identification of quantifiable hemodynamic factors inthe assessment of cerebral aneurysm behavior. On behalf of the Subcommitteeon Biorheology of the Scientific and Standardization Committee of the ISTH.Thromb Haemost 1996;76:118–23.
[10] Busse R, Mulsch A. Calcium-dependent nitric oxide synthesis in endothelialcytosol is mediated by calmodulin. FEBS Lett 1990;265:133–6.
[11] Byrne JV, Guglielmi G. Endovascular treatment of intracranial aneurysms.Springer; 1998.
[12] Chason JL, Hindman WM. Berry aneurysms of the circle of Willis; results of aplanned autopsy study. Neurology 1958;8:41–4.
[13] Cooke JP, Stamler J, Andon N, Davies PF, McKinley G, Loscalzo J. Flow stimulatesendothelial cells to release a nitrovasodilator that is potentiated by reducedthiol. Am J Physiol 1990;259:H804–12.
[14] Crawford T. Some observations on the pathogenesis and natural historyof intracranial aneurysms. J Neurol Neurosurg Psychiatry 1959;22:259–66.
[15] Crompton MR. The pathogenesis of cerebral infarction following the rupture ofcerebral berry aneurysms. Brain 1964;87:491–510.
[16] de la Monte SM, Moore GW, Monk MA, Hutchins GM. Risk factors forthe development and rupture of intracranial berry aneurysms. Am J Med1985;78:957–64.
[17] de Simone G, Devereux RB, Chinali M, Best LG, Lee ET, Welty TK. Associationof blood pressure with blood viscosity in American Indians: the Strong HeartStudy. Hypertension 2005;45:625–30.
[18] Erbengi A, Inci S. Pheochromocytoma and multiple intracranial aneurysms: isit a coincidence? Case report. J Neurosurg 1997;87:764–7.
[19] Forbus WD. On the origin of miliary aneurysms of the superficial cerebral arter-ies. Bull Johns Hopkins Hosp 1930;47:239–84.
[20] Ford MD, Nikolov HN, Milner JS, Lownie SP, Demont EM, Kalata W, et al.PIV-measured versus CFD-predicted flow dynamics in anatomically realisticcerebral aneurysm models. J Biomech Eng 2008;130:021015.
[21] Foutrakis GN, Yonas H, Sclabassi RJ. Finite element methods in the simulationand analysis of intracranial blood flow. Neurol Res 1997;19:174–86.
[22] Fukuda S, Hashimoto N, Naritomi H, Nagata I, Nozaki K, Kondo S, et al. Preven-tion of rat cerebral aneurysm formation by inhibition of nitric oxide synthase.Circulation 2000;101:2532–8.
[23] Gaetani P, Tartara F, Tancioni F, Klersy C, Forlino A, Baena RR. Activity of alpha 1-antitrypsin and cigarette smoking in subarachnoid haemorrhage from rupturedaneurysm. J Neurol Sci 1996;141:33–8.
[24] Gao L, Hoi Y, Swartz DD, Kolega J, Siddiqui A, Meng H. Nascent aneurysmformation at the basilar terminus induced by hemodynamics. Stroke2008;39:2085–90.
[25] Glor FP, Ariff B, Hughes AD, Crowe LA, Verdonck PR, Barratt DC, et al. Image-based carotid flow reconstruction: a comparison between MRI and ultrasound.Physiol Meas 2004;25:1495–509.
[26] Glor FP, Long Q, Hughes AD, Augst AD, Ariff B, Thom SA, et al. Reproducibil-ity study of magnetic resonance image-based computational fluid dynamicsprediction of carotid bifurcation flow. Ann Biomed Eng 2003;31:142–51.
[27] Gonzalez CF, Cho YI, Ortega HV, Moret J. Intracranial aneurysms: flow analysisof their origin and progression. AJNR Am J Neuroradiol 1992;13:181–8.
[28] Goubergrits L, Kertzscher U, Schoneberg B, Wellnhofer E, Petz C, Hege HC.CFD analysis in an anatomically realistic coronary artery model based onnon-invasive 3D imaging: comparison of magnetic resonance imaging withcomputed tomography. Int J Cardiovasc Imaging 2008;24:411–21.
[29] Greenhalgh RM, Laing S, Taylor GW. Risk factors in carotid artery stenosis andintracranial aneurysms. J Cardiovasc Surg (Torino) 1980;21:559–67.
[30] Handa H, Hashimoto N, Nagata I, Hazama F. Saccular cerebral aneurysms inrats: a newly developed animal model of the disease. Stroke 1983;14:857–66.
[31] Hashimoto N, Kim C, Kikuchi H, Kojima M, Kang Y, Hazama F. Experimentalinduction of cerebral aneurysms in monkeys. J Neurosurg 1987;67:903–5.
[32] Hashimoto N, Handa H, Nagata I, Hazama F. Experimentally induced cerebralaneurysms in rats. Part V. Relation of hemodynamics in the circle of Willis toformation of aneurysms. Surg Neurol 1980;13:41–5.
[33] He X, Ku DN. Pulsatile flow in the human left coronary artery bifurcation:average conditions. J Biomech Eng 1996;118:74–82.
[34] Inagawa T. Trends in incidence and case fatality rates of aneurysmal subarach-noid hemorrhage in Izumo City, Japan, between 1980–1989 and 1990–1998.Stroke 2001;32:1499–507.
[35] Inci S, Spetzler RF. Intracranial aneurysms and arterial hypertension: a reviewand hypothesis. Surg Neurol 2000;53:530–40, discussion 540–532.
[36] Jeays AD, Lawford PV, Gillott R, Spencer P, Barber DC, Bardhan KD, et al. Charac-terisation of the haemodynamics of the superior mesenteric artery. J Biomech2007;40:1916–26.
[37] Jou LD, Wong G, Dispensa B, Lawton MT, Higashida RT, Young WL, et al. Cor-relation between lumenal geometry changes and hemodynamics in fusiformintracranial aneurysms. AJNR Am J Neuroradiol 2005;26:2357–63.
[38] Juvela S. Risk factors for multiple intracranial aneurysms. Stroke2000;31:392–7.
[39] Kim C, Cervos-Navarro J, Kikuchi H, Hashimoto N, Hazama F. Alterations incerebral vessels in experimental animals and their possible relationship to thedevelopment of aneurysms. Surg Neurol 1992;38:331–7.
[40] Kondo S, Hashimoto N, Kikuchi H, Hazama F, Nagata I, Kataoka H. Cere-bral aneurysms arising at nonbranching sites. An experimental study. Stroke1997;28:398–403, discussion 403–394.
[41] Letcher RL, Chien S, Pickering TG, Laragh JH. Elevated blood viscosity in patientswith borderline essential hypertension. Hypertension 1983;5:757–62.

Author's personal copy
P.K. Singh et al. / Clinical Neurology and Neurosurgery 112 (2010) 306–313 313
[42] Lorensen WE, Cline HE. Marching cubes: a high resolution 3D surface construc-tion algorithm. Comput Graph 1987;21:163–9.
[43] Luscher TF, Tanner FC. Endothelial regulation of vascular tone and growth. AmJ Hypertens 1993;6:283S–93S.
[44] Marzo A, Singh P, Reymond P, Stergiopulos N, Patel U, Hose R. Influence of inletboundary conditions on the local haemodynamics of intracranial aneurysms.Comput Methods Biomech Biomed Eng 2009:1025–5842.
[45] Mantha A, Karmonik C, Benndorf G, Strother C, Metcalfe R. Hemodynamics ina cerebral artery before and after the formation of an aneurysm. AJNR Am JNeuroradiol 2006;27:1113–8.
[46] Malek AM, Alper SL, Izumo S. Hemodynamic shear stress and its role inatherosclerosis. JAMA 1999;282:2035–42.
[47] Meng H, Wang Z, Hoi Y, Gao L, Metaxa E, Swartz DD, et al. Complex hemo-dynamics at the apex of an arterial bifurcation induces vascular remodelingresembling cerebral aneurysm initiation. Stroke 2007;38:1924–31.
[48] Milner P, Kirkpatrick KA, Ralevic V, Toothill V, Pearson J, Burnstock G. Endothe-lial cells cultured from human umbilical vein release ATP, substance P andacetylcholine in response to increased flow. Proc Biol Sci 1990;241:245–8.
[49] Morimoto M, Miyamoto S, Mizoguchi A, Kume N, Kita T, Hashimoto N. Mousemodel of cerebral aneurysm: experimental induction by renal hypertensionand local hemodynamic changes. Stroke 2002;33:1911–5.
[50] Nagata I, Handa H, Hashimoto N, Hazama F. Experimentally induced cerebralaneurysms in rats. Part VI. Hypertension. Surg Neurol 1980;14:477–9.
[51] Numminen H, Kotila M, Waltimo O, Aho K, Kaste M. Declining incidenceand mortality rates of stroke in Finland from 1972 to 1991. Results of threepopulation-based stroke registers. Stroke 1996;27:1487–91.
[52] Olesen SP, Clapham DE, Davies PF. Haemodynamic shear stress activates a K+
current in vascular endothelial cells. Nature 1988;331:168–70.[53] Ostergaard JR, Hog E. Incidence of multiple intracranial aneurysms. Influence
of arterial hypertension and gender. J Neurosurg 1985;63:49–55.[54] Pohl U, Herlan K, Huang A, Bassenge E. EDRF-mediated shear-induced dila-
tion opposes myogenic vasoconstriction in small rabbit arteries. Am J Physiol1991;261:H2016–2023.
[55] Price JF, Mowbray PI, Lee AJ, Rumley A, Lowe GD, Fowkes FG. Relationshipbetween smoking and cardiovascular risk factors in the development of periph-eral arterial disease and coronary artery disease: Edinburgh Artery Study. EurHeart J 1999;20:344–53.
[56] Quigley MR, Heiferman K, Kwaan HC, Vidovich D, Nora P, Cerullo LJ. Laser-sealedarteriotomy: a reliable aneurysm model. J Neurosurg 1987;67:284–7.
[57] Qureshi AI, Suarez JI, Parekh PD, Sung G, Geocadin R, Bhardwaj A, et al. Riskfactors for multiple intracranial aneurysms. Neurosurgery 1998;43:22–6, dis-cussion 26–27.
[58] Radaelli AG, Augsburger L, Cebral JR, Ohta M, Rufenacht DA, Balossino R, et al.Reproducibility of haemodynamical simulations in a subject-specific stentedaneurysm model—a report on the Virtual Intracranial Stenting Challenge 2007.J Biomech 2008;41:2069–81.
[59] Resnick N, Collins T, Atkinson W, Bonthron DT, Dewey Jr CF, Gimbron Jr MA.Platelet-derived growth factor B chain promoter contains a cis-acting fluidshear-stress-responsive element. Proc Natl Acad Sci USA 1993;90:7908.
[60] Reymond P, Merenda F, Perren F, Rufenacht D, Stergiopulos N. Validation of aone-dimensional model of the systemic arterial tree. Am J Physiol Heart CircPhysiol 2009.
[61] Rinne J, Hernesniemi J, Puranen M, Saari T. Multiple intracranial aneurysms in adefined population: prospective angiographic and clinical study. Neurosurgery1994;35:803–8.
[62] Rossitti S. Shear stress in cerebral arteries carrying saccular aneurysms. A pre-liminary study. Acta Radiol 1998;39:711–7.
[63] Sacco RL, Wolf PA, Bharucha NE, Meeks SL, Kannel WB, Charette LJ, et al.Subarachnoid and intracerebral hemorrhage: natural history, prognosis, andprecursive factors in the Framingham Study. Neurology 1984;34:847–54.
[64] Sakai N, Nakayama K, Tanabe Y, Izumiya Y, Nishizawa S, Uemuara K. Absence ofplasma protease-antiprotease imbalance in the formation of saccular cerebralaneurysms. Neurosurgery 1999;45:34–8, discussion 38–39.
[65] Sakaki T, Tominaga M, Miyamoto K, Tsunoda S, Hiasa Y. Clinical studies of denovo aneurysms. Neurosurgery 1993;32:512–6, discussion 516–517.
[66] Sarner M, Crawford MD. Ruptured intracranial aneurysm. Clinical series. Lancet1965;2:1251–4.
[67] Sauerbeck LR, Hornung R, Moomaw CJ, Woo D, Curry R, Brown Jr RD, et al. Theeffects of study participation in the Familial Intracranial Aneurysm Study oncigarette smoking. J Stroke Cerebrovasc Dis 2008;17:370–2.
[68] Schievink WI, Prakash UB, Piepgras DG, Mokri B. Alpha 1-antitrypsin defi-ciency in intracranial aneurysms and cervical artery dissection. Lancet1994;343:452–3.
[69] Sekhar LN, Heros RC. Origin, growth, and rupture of saccular aneurysms: areview. Neurosurgery 1981;8:248–60.
[70] Shimogonya Y, Ishikawa T, Imai Y, Matsuki N, Yamaguchi T. Can temporal fluc-tuation in spatial wall shear stress gradient initiate a cerebral aneurysm? Aproposed novel hemodynamic index, the gradient oscillatory number (GON). JBiomech 2009;42:550–4.
[71] Sho E, Sho M, Singh TM, Nanjo H, Komatsu M, Xu C, et al. Arterial enlargementin response to high flow requires early expression of matrix metalloproteinasesto degrade extracellular matrix. Exp Mol Pathol 2002;73:142–53.
[72] Solenski NJ, Haley Jr EC, Kassell NF, Kongable G, Germanson T, Truskowski L, etal. Medical complications of aneurysmal subarachnoid hemorrhage: a report ofthe multicenter, cooperative aneurysm study. Participants of the MulticenterCooperative Aneurysm Study. Crit Care Med 1995;23:1007–17.
[73] Stehbens WE. Ultrastructure of aneurysms. Arch Neurol 1975;32:798–807.[74] St Jean P, Hart B, Webster M, Steed D, Adamson J, Powell J, et al. Alpha-1-
antitrypsin deficiency in aneurysmal disease. Hum Hered 1996;46:92–7.[75] Strother CM, Graves VB, Rappe A. Aneurysm hemodynamics: an experimental
study. AJNR Am J Neuroradiol 1992;13:1089–95.[76] Taylor CL, Yuan Z, Selman WR, Ratcheson RA, Rimm AA. Cerebral arterial
aneurysm formation and rupture in 20,767 elderly patients: hypertension andother risk factors. J Neurosurg 1995;83:812–9.
[77] Teunissen LL, Rinkel GJ, Algra A, van Gijn J. Risk factors for subarachnoid hem-orrhage: a systematic review. Stroke 1996;27:544–9.
[78] Toftdahl DB, Torp-Pedersen C, Engel UH, Strandgaard S, Jespersen B. Hyper-tension and left ventricular hypertrophy in patients with spontaneoussubarachnoid hemorrhage. Neurosurgery 1995;37:235–9, discussion 239–240.
[79] Ujiie H, Tachibana H, Hiramatsu O, Hazel AL, Matsumoto T, Ogasawara Y, etal. Effects of size and shape (aspect ratio) on the hemodynamics of saccularaneurysms: a possible index for surgical treatment of intracranial aneurysms.Neurosurgery 1999;45:119–29, discussion 129–130.
[80] Wagner CT, Durante W, Christodoulides N, Hellums JD, Schafer AI. Hemody-namic forces induce the expression of heme oxygenase in cultured vascularsmooth muscle cells. J Clin Invest 1997;100:589–96.
[81] Wang DM, Tarbell JM. Modeling interstitial flow in an artery wall allowsestimation of wall shear stress on smooth muscle cells. J Biomech Eng1995;117:358–63.

UN
CO
RR
EC
TED
PR
OO
F
NEURAD 226 1—2Please cite this article in press as: Singh PK, et al. Effects of heparin on the hemodynamic characteristics of intracranialaneurysms. J Neuroradiol (2010), doi:10.1016/j.neurad.2010.02.002
ARTICLE IN PRESS+ModelNEURAD 226 1—2
Journal of Neuroradiology (2010) xxx, xxx—xxx1
CORRESPONDENCE
2 Effects of heparin on the hemodynamic charac-1
teristics of intracranial aneurysms2
A 58-year-old woman presented with a history of sudden3
onset of severe headache and loss of consciousness. She had4
a past medical history of deep vein thrombosis and was tak-5
ing long-term warfarin for that. Her Glasgow Coma Scale6
score at the time of admission was 13. An urgent CT scan7
of the head revealed the presence of subarachnoid hemor-8
rhage. The patient was recruited to the @neurIST project9
(www.aneurist.org) after obtaining the proper consent.10
Four-vessel cerebral angiography demonstrated the pres-11
ence of two intracranial aneurysms (Fig. 1). The first12
aneurysm (Aneu-1) was a tiny ‘bleb’-type aneurysm located13
on the ophthalmic segment of the right internal carotid14
artery. It was considered a pre-aneurysm lesion. The second15
aneurysm (Aneu-2), which ruptured, was located at the ori-16
gin of the right posterior communicating artery (PCommA)17
and was coiled with GDC® (Guglielmi Detachable Coils).18
Throughout her hospital stay, the patient received low-19
molecular weight (LMW) heparin (enoxaparin, Clexane®).20
However, as the tiny ‘bleb’ aneurysm was unsuitable for21
coiling, it was followed by magnetic resonance angiography22
(MRA).23
Three-dimensional computer models of the intracra-24
nial aneurysms were created from 3D angiograms (Fig. 1).25
Boundary conditions were applied proximally at a distance26
of at least 10 vessel diameters and distally at 2—3 ves-27
sel diameters. Hemodynamic factors were computed with28
the help of @neuFuse software, using physiological values29
(�untreated = 0.0045 Pa s) of blood viscosity (BV). The analyses30
were then repeated, using the values of BVs specific to hep-31
arin (�heparin = 0.0025 Pa s), as reported in the literature. The32
latter simulates the effect of heparin at an average ther-33
apeutic concentration of 0.0075 mg/mL. The 3D unsteady34
Navier—Stokes equations were solved with the use of finite35
control volume ANSYS®-CFXTM software. Qualitative (Fig. 2)36
and quantitative (Table 1) comparisons were made between37
the hemodynamic parameters computed in both settings.38
Findings showed that heparin administration decreased39
the maximum values of time-averaged wall shear stress (t-40
av-WSS) in both aneurysms, with a dramatic increase in41
the area affected by infraphysiological wall shear stress42
(< 0.4 Pa) in both lesions. The values for the oscillatory43
shear index (OSI) and pressure were decreased in the pre-44
aneurysm lesion, whereas an increase was observed in the45
ruptured lesion (Table 1).46
Ruptured aneurysms remain a major cause of morbid- 47
ity and mortality [1], and recent evidence indicates that 48
hemodynamics are an important underlying factor in their 49
etiopathogenesis [2]. As confirmed by others [3], the hemo- 50
dynamics of the intracranial vasculature is dependent upon 51
the rheological properties of blood, including BV. It is then 52
logical to speculate that the factors affecting BV can also 53
influence the hemodynamic environment of intracranial 54
aneurysms, thereby affecting their initiation, growth and 55
rupture. 56
In the present study, we investigated the effects of hep- 57
arin on the hemodynamic characteristics of aneurysms. High 58
wall shear stress (WSS) values have been associated with 59
heparin initiation by increasing the production of MMP- 60
13, while low values are thought to be responsible for 61
aneurysm growth and rupture [4] by increasing inducible 62
nitric-oxide (iNOS) synthesis, resulting in vessel wall dam- 63
age. Heparin (and its derivative enoxaparin) is a widely used 64
injectable anticoagulant for preventing venous thrombosis 65
and pulmonary embolism. It inhibits the factors involved 66
in blood-clotting (factor Xa), causing instantaneous inacti- 67
vation of thrombin, thereby reducing BV [5] and, in turn, 68
Figure 1 Reconstructed geometry showing the intracranialaneurysms and connecting vessels reconstructed with softwarefrom @neuFUSE. Labels indicate the openings where boundaryconditions were applied.
0150-9861/$ – see front matter © 2010 Published by Elsevier Masson SAS.doi:10.1016/j.neurad.2010.02.002

UN
CO
RR
EC
TED
PR
OO
F
NEURAD 226 1—2Please cite this article in press as: Singh PK, et al. Effects of heparin on the hemodynamic characteristics of intracranialaneurysms. J Neuroradiol (2010), doi:10.1016/j.neurad.2010.02.002
ARTICLE IN PRESS+ModelNEURAD 226 1—2
2 Correspondence
Table 1 Quantitative comparison of the effects of heparin on hemodynamic indices.
Aneu-1 Aneu-2
�untreated �heparin Change (%) �untreated �heparin Change (%)
t-av-WSSmin (Pa) 1.066 1.086 +1.8 0.055 0.048 −12.7t-av-WSSmax (Pa) 35.9 28.08 −21.8 67.75 45.11 −33.4Area of infraphysiological WSS (< 0.4 Pa) 0.009% 0.07% +677.8 0.8% 1.2 % +50.0Area of supraphysiological WSS (> 1.5 Pa) 99.9% 99.6% −0.3 91.2% 88.7% −2.7OSImax 0.21 0.17 −19.0 0.43 0.46 +7.0Area of elevated OSI (> 0.2) 0.1% 00% −100.0 2.6% 4.1% +57.7Area of elevated pressure (%) 2.1% 2.5% −19.0 3.5% 4.0% +14.3
Area values were computed as a percentage of the overall aneurysm surface; Aneu-1: pre-aneurysm lesion; Aneu-2: ruptured aneurysm;�untreated: untreated viscosity values used = 0.0045 Pa s; �heparin: heparinized viscosity values used = 0.0025 Pa s; WSS: wall shear stress;OSI: oscillatory shear index; t-av-WSSmin: minimum time-averaged wall shear stress; t-av-WSSmax: maximum time-averaged wall shearstress.
altering the hemodynamics of the blood circulation. Hito-69
sugi and co-workers demonstrated a decrease in BV by 55.6%70
with the use of heparin at a therapeutic concentration of71
0.75 IU/L.72
However, heparin may also induce significant derange-73
ments of the hemodynamics of intracranial aneurysms and74
may even facilitate the rupture of existing aneurysms, albeit75
while perhaps inhibiting the formation of new aneurysms.76
In addition, similar effects might be achieved with other77
pharmacological agents, thus warranting further investiga-78
tions. However, so far, it is difficult to draw any definitive79
conclusions based on only two aneurysms in one patient.80
Conflict of interest statement81
The authors have not declared any conflict of interest.Q182
Figure 2 Qualitative differences in the patterns of time-averaged wall shear stress (t-av-WSS) and the oscillatory shearindex (OSI) in pre- (a, c) and post-heparinized (b, d) blood. Theupper two rows are contour plots for t-av-WSS, and the lowertwo rows are contour plots for OSI. (a, b) Anterior views; (c, d)posterior views; (rows 1, 3) Aneu-1; (rows 2, 4) Aneu-2.
References 83
[1] Inagawa T. Trends in incidence and case fatality rates of aneurys- 84
mal subarachnoid hemorrhage in Izumo City, Japan, between 85
1980—1989 and 1990—1998. Stroke 2001;32:1499—507. 86
[2] Shojima M, Oshima M, Takagi K, Torii R, Hayakawa M, Katada 87
K, et al. Magnitude and role of wall shear stress on cerebral 88
aneurysm: computational fluid dynamic study of 20 middle cere- 89
bral artery aneurysms. Stroke 2004;35:2500—5. 90
[3] De Simone G, Devereux RB, Chien S, Alderman MH, Atlas SA, 91
Laragh JH. Relation of blood viscosity to demographic and phys- 92
iologic variables and to cardiovascular risk factors in apparently 93
normal adults. Circulation 1990;81:107—17. 94
[4] Cebral JR, Castro MA, Burgess JE, Pergolizzi RS, Sheridan MJ, 95
Putman CM. Characterization of cerebral aneurysms for assess- 96
ing risk of rupture by using patient-specific computational 97
hemodynamics models. AJNR Am J Neuroradiol 2005;26:2550—9. 98
[5] Hitosugi M, Niwa M, Takatsu A. Changes in blood viscosity by 99
heparin and argatroban. Thromb Res 2001;104:371—4. 100
P.K. Singha,b,∗101
A. Marzoc102
H. Tahir c103
T.F. Weeratungec104
K. Kumard105
M. Boutarbouche106
R. Hosec107
U.J. Patela108
S.C. Coley f109
a Department of Neurosurgery, Royal Hallamshire Hospital, 110
Sheffield, UK 111
b Medical Physics, Royal Hallamshire Hospital, Sheffield, 112
UK 113
c Academic Unit of Medical Physics, School of Medicine and 114
Biomedical Sciences, University of Sheffield, Sheffield, UK 115
d Institute of Tropical Medicine, Berlin Germany 116
e Department of Neurosurgery, Mohamed Vth University 117
School of Medicine, Hospital des Specialités ONO, Rabat 118
10100, Morocco 119
f Department of Neuroradiology, Royal Hallamshire 120
Hospital, Sheffield, UK 121
∗ Corresponding author. 122
E-mail address: [email protected] (P.K. Singh) 123

Computational Hemodynamics in Cerebral Aneurysms: The Effects
of Modeled Versus Measured Boundary Conditions
ALBERTO MARZO,1 PANKAJ SINGH,2 IGNACIO LARRABIDE,3,4,5 ALESSANDRO RADAELLI,6 STUART COLEY,7
MATT GWILLIAM,8 IAIN D. WILKINSON,9 PATRICIA LAWFORD,1 PHILIPPE REYMOND,10 UMANG PATEL,11
ALEJANDRO FRANGI,3,4,5 and D. ROD HOSE1
1Department of Cardiovascular Science, Academic Unit of Medical Physics, Faculty of Medicine and Biomedical Sciences,University of Sheffield, Beech Hill Road, S10 2RX Sheffield, UK; 2Departments of Medical Physics and Neurosurgery,
Royal Hallamshire Hospital, Sheffield, UK; 3Centre for Computational Imaging and Simulation Technologies in Biomedicine,Universitat Pompeu Fabra (UPF), Barcelona, Spain; 4Centre for Networked Biomedical Research on Bioengineering,
Biomaterials and Nanomedicine (CIBER-BBN), Barcelona, Spain; 5Institucio Catalana de Recerca i Estudis Avacats (ICREA),Barcelona, Spain; 6Philips Healthcare, Best, The Netherlands; 7Department of Neuroradiology, Royal Hallamshire Hospital,Sheffield, UK; 8Medical Physics and Clinical Engineering, Sheffield Teaching Hospitals NHS, Sheffield, UK; 9Department
of Human Metabolism, Academic Unit of Radiology, University of Sheffield, Sheffield, UK; 10Laboratory of Hemodynamicsand Cardiovascular Technology (LHCT), Ecole Polytechnique Federale de Lausanne, Lausanne, Switzerland; and Department
of Neurosurgery, Royal Hallamshire Hospital, Sheffield, UK
(Received 8 June 2010; accepted 9 October 2010; published online 23 October 2010)
Associate Editor Peter E. McHugh oversaw the review of this article.
Abstract—Modeling of flow in intracranial aneurysms (IAs)requires flow information at the model boundaries. In absenceof patient-specific measurements, typical or modeled bound-ary conditions (BCs) are often used. This study investigatesthe effects of modeled versus patient-specific BCs on modeledhemodynamics within IAs. Computational fluid dynamics(CFD) models of five IAs were reconstructed from three-dimensional rotational angiography (3DRA). BCs wereapplied using in turn patient-specific phase-contrast-MR(pc-MR) measurements, a 1D-circulation model, and aphysiologically coherent method based on local WSS atinlets. The Navier–Stokes equations were solved using theAnsys�-CFXTM software. Wall shear stress (WSS), oscilla-tory shear index (OSI), and other hemodynamic indices werecomputed. Differences in the values obtained with the threemethods were analyzed using boxplot diagrams. Qualitativesimilarities were observed in the flow fields obtained with thethree approaches. The quantitative comparison showedsmaller discrepancies between pc-MR and 1D-model data,than those observed between pc-MR and WSS-scaled data.Discrepancies were reduced when indices were normalized tomean hemodynamic aneurysmal data. The strong similaritiesobserved for the three BCs models suggest that vessel andaneurysm geometry have the strongest influence on aneurys-mal hemodynamics. In absence of patient-specific BCs, adistributed circulation model may represent the best optionwhen CFD is used for large cohort studies.
Keywords—Computational fluid dynamics, Phase-contrast
MRI, 1D circulation model.
INTRODUCTION
An aneurysm is a localized dilation in a blood ves-sel, which carries an inherent risk of rupture andconsequent hemorrhage; for cerebral aneurysms rup-ture results in a subarachnoid hemorrhage (SAH).Despite improvements in surgical and medical man-agement, SAH is still a major cause of morbidity andmortality.20
Although the etiology of the disease remainsunclear, there is a growing consensus that hemody-namics plays an important role in the growth, rupture,and initiation of intracranial aneurysms (IAs).6,38,40
In this respect, a reliable prediction of stress orstrain of the aneurysm wall would possibly offer agreater diagnostic capacity in the context of imminentrupture (it is likely that the event of rupture occurswhen the tissue stress or strain exceeds some sustain-able level). The stress and strain in the aneurysm canbe calculated if the geometry, material characteristics,and boundary (support) conditions are known:unfortunately this will never be true for an individualand approximations would be required for all of them,thus compromising accuracy. The hemodynamiccharacterization returns parameters that might drive
Address correspondence to Alberto Marzo, Department of
Cardiovascular Science, Academic Unit of Medical Physics, Faculty
of Medicine and Biomedical Sciences, University of Sheffield, Beech
Hill Road, S10 2RX Sheffield, UK. Electronic mail: a.marzo@
shef.ac.uk, [email protected]
Annals of Biomedical Engineering, Vol. 39, No. 2, February 2011 (� 2010) pp. 884–896
DOI: 10.1007/s10439-010-0187-z
0090-6964/11/0200-0884/0 � 2010 Biomedical Engineering Society
884

biological processes that are important in the evolutionof an aneurysm toward a state in which it will rupture.This, despite a smaller diagnostic capacity might pro-vide more accurate predictions, which might proveimportant with respect to correlation to rupture. Sev-eral hemodynamic indices and many biological pat-terns have been proposed that link hemodynamics toaneurysm formation, and evolution. These are wellsummarized by Singh et al.42 Two hemodynamicindices, wall shear stress (WSS) and oscillatory shearindex (OSI), have received particular attention due totheir influence on endothelial cell behavior.6,40
Although studies from Rayz et al.,36 Boussel et al.,1
and Isoda et al.22 showed that in vivo measurement ofthese quantities is possible using magnetic resonance,inherent limitations in the current technology impedeits use, especially for smaller aneurysms, in largecohort studies.
In this context, computational fluid dynamics(CFD) can provide detailed predictions of hemody-namics using input parameters derived from medicalimaging, blood sampling, and other patient informa-tion. CFD has been used by many groups to investi-gate possible correlations between hemodynamics andrisk of rupture or growth of IAs. For convenience, thespatial extent of the computational domain is oftenlimited to a restricted area around the aneurysm andspecification of boundary conditions (BCs) at theinterfaces with the rest of the cardiovascular networkremains a pre-requisite to find a numerical solution.This issue is approached in different ways by differentauthors.
Some studies use patient-specific BCs based onmeasurements obtained using phase-contrast-MR(pc-MR) or transcranial Doppler (TCD) ultrasound,to record blood velocity, and applanation tonometry,to infer pressure. More recently Ferns and colleagues13
have used a dual-sensor wire to measure in vivo pres-sure and blood flow velocity within intracranial vessels.These measurements are costly to perform, are cur-rently rarely justifiable as part of the clinical routineand are inherently difficult to obtain for the small,intricate vessels of the cerebral vasculature hence, suchstudies often involve small cohorts and the results lackstatistical significance.1,19,24
Larger cohort studies, in contrast, rely on inflowBCs based on measurements taken from healthy indi-viduals, that are, in some cases8,23,29,35,44 scaled in anattempt to achieve a more realistic mean WSS, andoutflow BCs that arbitrarily assume the same pressureat all openings (zero pressure BCs). The assumptionsassociated with this approach may also lead to unre-alistic results.
As detailed comparison with in vivomeasurements iscurrently difficult, the validity of CFD tools in the
context of IA rupture-risk assessment relies upon theextent to which the correlations between hemody-namic predictions and rupture are statistically mat-ched for a large cohort study. One of the importantaims of @neurIST (www.aneurist.org), a multidisci-plinary EU project of which this study forms a part,is to establish these correlations by processing a largenumber of cases. The lack of patient-specific data foruse at computational boundaries remains an impor-tant limiting factor in the project. This issue has beenaddressed by deriving a complete set of BCs for 3DCFD analysis from a 1D model of the circulatorysystem.37
This article analyses and compares the sensitivity ofmodeled hemodynamics within typical IAs to BCsderived using the 1D model, patient-specific pc-MRmeasurements, and other approaches described in theliterature.
MATERIALS AND METHODS
Study Design, Demographics, and Clinical Details
The study was conducted as a co-operation betweenthe Departments of Neurosurgery and Neuroradiol-ogy, Royal Hallamshire Hospital, and the Departmentof Cardiovascular Science, University of Sheffield,Sheffield, UK. A total of five patients diagnosed withIAs between Dec. 2006 and Jan. 2009, were iden-tified retrospectively and followed prospectively uponappropriate ethical approval and patient consent.Table 1 shows the demographic constitution of thepopulation along with the relevant aneurysm details.All IAs were side-wall saccular aneurysms with loca-tions shown in Figs. 1 and 2.
X-ray Angiography Image Acquisition
The medical images used for surface reconstructionwere obtained using 3D rotational acquisition (3DRA)in a Philips� IntegrisTM Allura machine (Philips�
Medical Systems, Best, The Netherlands), producing
TABLE 1. Patient demographics and aneurysm radiologicalfeatures.
Aneurysm Sex Age Side Location Rupture
Size (diam/neck)
(mm)
1 M 44 Left ICA No 5/4.3
2 M 52 Left MCA No 11.1/4.3
3 F 50 Left ICA No 3.4/3.1
4 F 41 Right MCA Yes 4.4/3
5 F 51 Left ICA No 2.9/3.1
ICA, internal carotid artery; MCA, middle cerebral artery bifurcation.
Boundary Conditions and Flow Predictions in Aneurysms 885

100 images in 6 s, with 5 ms exposure per image. Voxelsize in the reconstructed 3D images was 121 micronswith reconstruction matrix of 512 9 512 9 512.
pc-MR Protocol
All MR imaging was performed at high fieldstrength (AchievaTM 3.0T, Philips� Medical Systems,Best, The Netherlands) using a standard eight-chan-nel, radiofrequency receive-only head coil. The sameradiographer imaged all patients to maximize thereproducibility of the overall acquisition technique.17
A pre-designed protocol guided the radiographerthrough the desired measurement locations for sub-sequent application of CFD BCs. As afferent vascu-lature has an important influence on intra-aneurysmalhemodynamics,2,30,32,33 proximal measurements weretaken at a distance of approximately 10 parent vesseldiameters from the aneurysm. Measurements in distalarteries were taken four diameters away from the IAs.To minimize patient discomfort, table-occupancy timewas no greater than 1 h. Within this period it wasdifficult to ensure that all measurements wereobtained for all patients. The tortuous nature of thevasculature also made slice selection perpendicular tothe artery difficult to achieve. To maintain integrity inthe final measurement data set, data was rejected ifthere was doubt about the placement of the mea-surement plane.
Locations of pc-MR measurements are reportedTable 2. The manufacturer’s proprietary post-data-acquisition software (Q-FlowTM, Philips� MedicalSystems, Best, The Netherlands) was used to estimatevolumetric flow rate (VFR) waveforms at eachlocation.
1D Circulation Model
The model developed by Reymond et al.37 was usedto compute pressure and VFR waveforms at thedesired interfaces with the 3D domains. The modelsolves the 1D form of the Navier–Stokes equation in adistributed model of the main human systemic arteriesincluding the main arteries of the circle of Willis. Itaccounts for ventricular–vascular interaction and wallviscoelasticity, and it was recently validated through acomparison with in vivo flow measurements. Althoughthe model could be personalized tuning input param-eters such as heart rate, cardiac contractility, vesselelasticity, vessel geometry, and blood properties, in thisstudy the model was used with the properties of atypical young individual as patient-specific data wasnot available for all patients. A typical analysis issolved in approximately 8 min.
3D Models
The @neurIST computational tool chain was usedto reconstruct vessel and aneurysmal geometries, asdescribed in Marzo et al.30 The 3D transient Navier–Stokes equations were solved by using the finite-control-volume software, ANSYS�-CFXTM. Bloodwas assumed to be incompressible, with densityq = 1060 kg m23, and Newtonian, with viscosityl = 0.0035 Pa s. BCs were applied using three dif-ferent approaches, as reported in Table 2. Method Iused pc-MR VFR measurements at the openings forwhich these could be measured, and 1D model pres-sure waveforms at every remaining interface. Foraneurysm 1 and 5, measurements were available at allbut one vessel opening. Method II used VFR andpressure waveforms from the 1D circulation model.Method III used the typical waveforms derived usingthe 1D model, where VFR curves were scaled toobtain a mean WSS of 1.5 Pa at inlets. For allvelocity-based BCs a flat velocity profile was applied,in line with our recent finding.30 Arterial walls wereassumed to be rigid. The validity of this assumptionhas been tested in the context of IAs.11 Tetrahedralelements were used to discretise the core of thecomputational domain, with three layers of prismaticelements at the wall to ensure accurate computationof the velocity gradients. Grid sizes with an averagedensity of 2000 el/mm3 were used following a meshdependency study in which WSS, pressure andvelocity values, were monitored at several pointswithin the aneurysm and parent vessel.35 Figure 2shows the meshes and BC types used in the analyses.To be independent of the initial numerical conditionshemodynamic data were extracted from the last car-diac cycle of a three-cycle analysis. Analyses were run
FIGURE 1. Locations of aneurysms 1–5 in typical cerebralvasculature (illustration generated using the @neurIST soft-ware).
MARZO et al.886

in parallel using 30 cluster nodes (Xeon� 2.8 GHz,2 GB RAM). The average time required to solve acomplete three-cycle analysis was 5 h.
Statistical Analysis
Quantitative agreement between data obtained withthe different BC methodologies was analyzed usingboxplot diagrams.
RESULTS
Hemodynamic variables were compared qualita-tively and quantitatively for the BC methods analyzed.
Qualitative Comparison
Figure 3 shows contour distributions of WSS time-averaged along the cardiac cycle (tavWSS) at the wallof the IAs. For all methods, in aneurysms 1, 2, areas of
FIGURE 2. Mesh particulars and BC types used. QMRI is the velocity-based boundary condition from MRI patient-specificmeasurements, Q1D is the velocity-based boundary condition from 1D model, Q1D-S is the WSS-scaled velocity-based boundarycondition from 1D model, and P1D is the pressure boundary condition from 1D model.
Boundary Conditions and Flow Predictions in Aneurysms 887

relatively high WSS were concentrated around theaneurysmal neck and apex, while in aneurysm 5, anarea of relatively high WSS is also present in the body.In aneurysms 3 and 4 only the neck is affected by highWSS, with the remainder of the aneurysmal wallexposed to lower WSS. For all aneurysms, areas ofrelatively low WSS were found in their bodies.
From a visual comparison of the contour plots,the most pronounced differences between method I(pc-MR) and method II (1D model) are in the distri-bution of tavWSS for aneurysms 1, 3, and 5, whereasaneurysms 2 and 4 showed closer agreement. In termsof qualitative differences between patient-specificand 1D model waveforms tavWSS values wereunderestimated when 1D-model BCs were applied, forall IAs except IA2.
Qualitative comparison of method I (pc-MR) andmethod III (WSS scaled) revealed larger differencesthan those observed when comparing methods I andII, except for aneurysm 1 where contour values oftavWSS are closer to the predictions of method I. Forall IAs, the values of tavWSS obtained with method IIIare lower than those observed for method I.
Figure 4 shows contours of normalized values oftavWSS (ntavWSS). Normalization was achieved bydividing the absolute values of tavWSS by the spatialaverage of tavWSS at the aneurysmal wall. Interest-ingly, for all methods, there is similarity in the over-all distribution of areas of proportionally higher, orlower, WSS.
Figure 5 shows contour distributions of OSI onthe aneurysmal surface. Although small differencescan be observed, the OSI patterns are very similar.
As expected, areas of elevated OSI tend to be associ-ated with low tavWSS. OSI values obtained withmethod II look closer to the pc-MR-based values, thanthose obtained using method III.
Quantitative Comparison
Figure 6 shows the boxplots diagrams of the per-centage differences between method I and method II(top boxplot) and method I and method III (bottomboxplot) for selected indices computed within theaneurysmal sac, namely; maximum OSI (mOSI), nor-malized maximum value of time-average WSS(nmtavWSS), maximum time-average WSS (mtavWSS),maximum time-average velocity (mtavU) and spatialand time-average velocity (stavU). The percentageerror was calculated from (index_valuemethod I 2
index_valuemethod X)100/index_valuemethod I. As previ-ously observed qualitatively, comparisons show that thesmallest discrepancies are observed in the values ofmOSI and nmtavWSS (median value 17.5–23.5% formOSI and 11–20.5% for nmtavWSS). The hemody-namic index showing highest discrepancies is mtavWSSwith median values of 46% for method I versus II and69% for method I versus III.
When considering the cross-comparison of methodsII (1D model) and III (WSS scaled) with method I(pc-MR) (which is assumed to be the gold standard),the largest discrepancies are observed for the com-parison between methods I and III. If we consideronly the median values of each index we observe that,for method I, all indices perform better than theircounterpart in method III.
TABLE 2. Boundary conditions location, type, and method.
Aneurysm BC location Type Method I Method II Method III
1 ICA proximal Inlet pc-MR/velocity 1D/velocity 1D/velocity scaled
ICA distal Outlet pc-MR/velocity 1D/pressure 1D/pressure
OphthA Outlet 1D/pressure 1D/pressure 1D/pressure
2 MCA M1 Inlet pc-MR/velocity 1D/velocity 1D/velocity scaled
MCA M2 supr Outlet 1D/pressure 1D/pressure 1D/pressure
MCA M2 infr Outlet 1D/pressure 1D/pressure 1D/pressure
3 ICA proximal Inlet pc-MR/velocity 1D/velocity 1D/velocity scaled
ICA distal Outlet 1D/pressure 1D/pressure 1D/pressure
OphthA Outlet 1D/pressure 1D/pressure 1D/pressure
4 MCA M1 Inlet pc-MR/velocity 1D/velocity 1D/velocity scaled
TempA Outlet 1D/pressure 1D/pressure 1D/pressure
MCA M2 supr Outlet 1D/pressure 1D/pressure 1D/pressure
MCA M2 infr Outlet 1D/pressure 1D/pressure 1D/pressure
5 ICA proximal Inlet pc-MR/velocity 1D/velocity 1D/velocity scaled
ICA distal Outlet pc-MR/velocity 1D/pressure 1D/pressure
OphthA Outlet 1D/pressure 1D/pressure 1D/pressure
ICA, internal carotid artery; OphthA, ophthalmic artery; MCA M1, middle cerebral artery; MCA M2 supr/infr, superior/inferior
division of the middle cerebral artery; TempA, temporal artery.
MARZO et al.888

DISCUSSION
In creating a computational model to predict thehemodynamics in an IA, assumptions are often madethat can adversely affect the numerical results. One ofthe most important areas where assumptions are
required is the application of BCs. Several authorshave demonstrated the significant influence of BCs oncomputed hemodynamic indices.9,19,44
Depending on the method of derivation, BCs can bebroadly divided into two categories; those that arepatient-specific and those that are non-patient-specific.
FIGURE 3. Contour plots of tavWSS for method I (pc-MR), method II (1D model), and method III (WSS scaled).
Boundary Conditions and Flow Predictions in Aneurysms 889

Patient-Specific BC’s
Patient-specific BCs are understandably consideredthe ‘‘gold standard.’’9,19,44 Unfortunately, these arerarely available. Of 24 articles reviewed for this study(Table 3), only 6 (25%) used patient-specific BCs.1,19,24
pc-MR was the most common modality (5 out of 6)
used to obtain patient-specific measurements, withTCD used by one author.19 Most authors (5 out of 6),applied these measurements only at inlets. Only onegroup, Jou and colleagues,25 used patient-specificpc-MR measurements at both inlets and outlet whenanalyzing a basilar artery fusiform aneurysm. Thus,
FIGURE 4. Contour plots of normalized values of tavWSS (ntavWSS) for method I (pc-MR), method II (1D model), and method III(WSS scaled).
MARZO et al.890

even when patient-specific measurements can be justi-fied in a busy clinical setting, technical difficulties maycompromise their application at all openings, furtherlimiting their use in establishing statistical correla-tions with rupture. In fact, a major constraint whenadopting patient-specific BCs is that due to current
restrictions in obtaining these measurements, they havenot been applied in large cohort studies, thus com-promising the possibility of using CFD to find signif-icant statistical correlations between hemodynamicsand aneurysmal evolution (initiation, growth, andrupture). In the current review, the mean cohort size
FIGURE 5. Contour plots of OSI for method I (pc-MR), method II (1D model), and method III (WSS scaled).
Boundary Conditions and Flow Predictions in Aneurysms 891

for the patient-specific BC group was significantlysmaller, i.e. 3 (range 1–7) compared to 9.5 (range 1–62)when non-patient-specific BCs were used. Anotherimportant aspect one has to consider: there may besignificant diurnal variation in values for an individualassociated with stress or anxiety,12,27 physical exer-tion,16,21 and other day-to-day activities.18 It can beargued that patient-specific BCs, invariably measuredwith a patient lying quietly in a scanner surrounded byan artificial environment or stressed by the overallclinical experience (e.g., white-coat hypertension),might not represent the normal day-to-day physiologyfor that individual, and thus might not representexactly the type of BCs needed for statistical associa-tions. Gonzalez-Alonso et al.16 recorded a population-average flow rate variation as high as 1 mL/s at thelevel of middle cerebral artery level between rest andexercise.
Another important aspect is the error associatedwith blood flow measurement. For quantitativeMR angiography average measurement errors have
been reported to be as high as 7.6% for pulsatileflow.45
Non-Patient-Specific BC
In absence of patient-specific BCs many investiga-tors use typical or modeled BCs. Out of 24 papers, 18(75%) used this approach. Waveforms are usuallyobtained from population-averaged measurementstaken on healthy volunteers.14,43 While the use of suchwaveforms remains the most popular method of BCapplication (17 out of 18 non-patient-specific BCs inour review), the method carries important limitations.First, as these measurements are taken in a healthypopulation, they may not be representative of patientwaveforms. This is illustrated in Fig. 7, where wave-forms from a healthy volunteer show differences bothin shape and values, when compared with those forpatients 1, 3, and 5.
Second, these waveforms represent average valuesof pressure and velocity across the population, andlack adaptability in terms of location and vessel geo-metrical properties. In an attempt to address theseissues and make these typical waveforms more patient-specific, Cebral and colleagues7 suggested ‘‘scaling’’ theinflow rates to the inflow boundary area to keep theWSS within a ‘‘physiological’’ range (around 1.5 Pa).The same approach has been adopted by other scien-tists.23,31,35 Although Cebral and co-workers found animportant flow-area correlation based on experimentalevidence at some specific vessel locations, theirapproach can be very sensitive to the boundary loca-tion along the vessel, due to diameter variations alongthe vessel, and to segmentation error and imagemodality. This approach may be appropriate for atypical healthy individual but, as reported by manyauthors in the field, it is predominantly atypical vari-ations in hemodynamics (e.g., WSS) that are believedto influence the etiopathogenesis of IAs.38,40 Chenget al.10 challenged this hypothesis in their recentreview, which showed large variations of average WSS(range 0.2–1.6 Pa). Atypical values of WSS have beenassociated with other conditions such as maladaptivegrowth, congenital malformations, patent ductusarteriosus, and atherosclerosis.
Quarteroni and collaborators pioneered the conceptof using lumped and 1D-circulation models in anattempt to provide realistic BCs to 3D models.15,28,34
More recently in 2009, we30 introduced the use of a1D-circulation model to derive BCs while studyinghemodynamics within IAs. This model is used in thecurrent study. The parameters of the 1D model usedare relative to a healthy typical individual, anapproach exposed to the limitations mentioned abovefor typical ‘‘healthy’’ waveforms. Indeed, this might
FIGURE 6. Boxplots showing the distribution percentagedifferences between method I and II (top) and method I and III(bottom). Asterisks denote outliers above or below 1.5 timesthe inter-quartile range.
MARZO et al.892

explain, in part, the quantitative discrepanciesobserved. The use of a 1D model, however, has theadvantage of allowing flexibility in the location of themodel boundaries and, more importantly, has thepotential for adaptation to patient-specific parameters,
when available, to obtain more representative values atthe boundaries. The comparison in Fig. 6 (top) showsimportant differences between 1D model and pc-MRdata ranging from a minimum median value of 11%(OSI) to a maximum of 46% (mtavWSS).
TABLE 3. A comprehensive review showing the methods adapted by different authors while applying BCs.
No. Author/references
Cohort
size (IAs) IA location (s) BC type/location BC source (method)
1 Steinman et al.43 1 Terminal ICA Inlet/ICA Healthy subjects (pc-MR)
Outlets/MCA, ACA Traction free
2 Chatziprodromou et al.9 2 Supraclinoid ICA Inlets/ICA Idealized
Outlets/ICA Traction free
3 Jou et al.24 1 BA (fusiform) Inlets/VA Patient-specific (pc-MR)
Outlet/BA Patient-specific (pc-MR)
4 Hassan et al.19 1 Vertebro-basilar Inlet/VA Patient-specific (TCD)
Outlet/BA Traction free
5 Shojima et al.40 20 MCA Inlets/MCA-M1 Healthy subjects (TCD)
Outlets/MCA-M2 Traction free
6 Cebral et al.6 62 ICA (22), MCA (14), Pcom (13),
ACA (1), Post (9), (3 NA)
Inlets/ICA, MCA, ACA, BA Healthy subjects (pc-MR)
Outlets/NA NA
7 Jou et al.25 2 BA (fusiform) Inlets/VA Patient-specific (pc-MR)
Outlets/PCA NA
8 Shojima et al.41 29 ICA (14), MCA (14), ACA (1) Inlets/ICA Healthy subjects (TCD)
Outlets/ICA, MCA Traction free
9 Cebral et al.5 4 ICA (2), SCA (1), Pcom (1) Inlets/NA Healthy subjects (pc-MR)
Outlets/NA Traction free
10 Karmonik et al.26 3 BA (top) Inlets/BA, VA Healthy subjects (pc-MR)
Outlet NA
11 Castro et al.2 4 Pcom (1), Acom (1), MCA (2) Inlets/NA Healthy subjects (pc-MR)
Outlets/NA Traction free
12 Castro et al.4 7 Acom (1), BA (1), ICA (2),
MCA (1), SCA (1),
PCA (1)
Inlets/NA Healthy subjects (pc-MR)
Outlets/NA Traction free
13 Castro et al.3 2 Acom Inlets/ICA Healthy subjects (pc-MR)
Outlets/NA Traction free
14 Mantha et al.29 3 ICA Inlets/NA Healthy subjects (scaled)
Outlets/NA NA
15 Venugopal et al.44 1 Acom Inlets/A1 Healthy subjects (scaled)
Outlets/A2 Zero pressure
16 Boussel et al.1 7 BA (3), ICA (3), MCA (3) Inlets/NA Patient-specific (pc-MR)
Outlets/NA NA
17 Mitsos et al.31 1 Acom Inlet/NA Healthy subjects (LDV)
Outlet/NA Traction free
18 Rayz et al.36 4 BA Inlets/VA Patient specific (pc-MR)
Outlets/PCA Traction free
19 Radaelli et al.35 1 ICA Inlet/ICA-proximal Healthy subjects (scaled)
Outlet/ICA-distal Traction free
20 Rayz et al.36 3 BA Inlet/VA Patient-specific (pc-MR)
Outlet/PCA Likely traction free
21 Shimogonya et al.39 1 ICA Inlet/ICA-proximal Healthy subjects waveforms
Outlet/ICA-distal Traction free
22 Jou et al.23 26 ICA-clinoidal Inlets/ICA Healthy subjects (scaled)
Outlet/NA NA
23 Marzo et al.30 3 BA, ICA Inlet/BA, ICA-proximal Computed (1-D model)
Outlet/BA, ICA-distal Traction free
24 Cebral et al.8 1 BA (top) Inlet/mid-BA Healthy subjects (scaled)
Outlets/PCA Traction free
BCs, boundary conditions; PC-MR, phase contrast magnetic resonance angiography; TCD, trans-cranial Doppler’s ultrasound; LDV, laser
Doppler velocimetry; ICA, internal carotid artery; ACA, anterior cerebral artery; Acom, anterior communicating artery; MCA, middle cerebral
artery; Pcom, posterior communicating artery; SCA, superior cerebeller artery; BA, basilar artery; VA, vertebral artery; Post, posterior
circulation.
Boundary Conditions and Flow Predictions in Aneurysms 893

These discrepancies, however, are determined bydifferences in flow rates between the 1D model andpatient-specific waveforms, which are of the sameorder of magnitude to physiological variationsreported by Gonzalez-Alonso et al.16, see Table 4.While there are quantitative differences in hemody-namic indices obtained by the different methods,comparisons using normalized data showed that thedistribution of WSS remains unchanged. This confirmsonce again the significance of geometry in determiningthe hemodynamic development within the aneu-rysm,5,30 but also some degree of linearity of the resultswith respect to the flow within the aneurysm. Table 5shows information on geometry and flow immediatelyproximal to the aneurysm sac for all three methodsconsidered. Re values show a certain degree of linearitywith respect to the absolute values reported in Fig. 3.
Comparisons of OSI values showed good agree-ment between the three methods. This is to be expected
as OSI, in its definition, uses the normalization oflocal WSS.
Although blood is a non-Newtonian fluid, in thisstudy we made the assumption of constant viscosity.This is a valid assumption in the context of a studywhose aim is to evaluate the influence of BCs on intra-aneurysmal flow. In this respect, the use of a non-Newtonian model would have negligible influence onour findings as the same rheology model would beconsistently used to study the influence of BCs. Also,Cebral et al.5 showed that the sensitivity of hemody-namic predictions to different rheology models isnegligible in the context of aneurysmal hemodynamics.
The current study would benefit from a largeraneurysm cohort (although this would, of course, besubject to clinical limitations), and from a wider rangeof aneurysm locations (for example, aneurysm of theanterior communicating artery (ACommA) or basilarartery), which were not available in this study.
Summary
Whereas we can easily extract information aboutaneurysm and vessel geometry, measurements of bloodflow to be used as BCs in numerical predictions aremore difficult to determine. As hemodynamic factorsare believed to be important in the aneurysm naturalhistory, we investigated the variability of certainhemodynamic parameters with BCs. In this pre-liminary study differences were found between resultsobtained with patient-specific and modeled BCs. Theseare attributable to underlying differences in the Re ofthe flow approaching the aneurysms. In fact, discrep-ancies were significantly reduced when consideringnormalized indices, suggesting a certain degree of lin-earity in the results and the important role played bygeometry in intraneurismal hemodynamics. It is likelythat in the future patient-specific BCs will be providedas a part of routine clinical procedure. Until then,affirmation of CFD will be based on finding statisticalcorrelations using non-patient-specific BCs. The results
FIGURE 7. VFR waveforms for a typical healthy individualand aneurysm patients included in this study, measured usingpc-MR at internal carotid level. Typical waveform was takenfrom Radaelli et al.35
TABLE 4. Time-average volumetric flow rates and inlet radiifor the five aneurysms.
Qav-MR
(mL/s)
Qav-1D
(mL/s)
Qav-wss
(mL/s)
rpt
(mm)
r1D
(mm)a
Aneu-1 7.53 3.95 4.31 2.3 2.1–2.6
Aneu-2 1.46 1.90 0.74 1.3 1.4–1.5
Aneu-3 6.36 3.94 3.11 2.1 2.1–2.6
Aneu-4 2.00 1.91 0.42 1.1 1.4–1.5
Aneu-5 5.44 3.95 2.21 1.9 2.1–2.6
Aneu, aneurysm; Pt, patient; Qav-MR, average flow measured
using pc-MR; Qav-1D, average flow predicted by 1D-model;
Qav-WSS, average flow predicted by 1D-model scaled to obtain
wss = 1.5 Pa at boundary; rpt, radius of the vessel as measured in
the patient; r1D, average radius of the vessel used in 1D-model.aMin and max radii in 1D model vessel where BCs was originated.
TABLE 5. Reynolds numbers of flow approaching aneurysm,aneurysm aspect ratios, and vessel radii.
Aneurysm Re I Re II Re III Surface ratio rprox (mm)
1 551 285 311 4.7 1.8
2 140 228 89 20.1 1.3
3 343 223 176 5.6 2.1
4 155 184 138 15.5 0.9
5 434 298 152 2.5 1.9
Re I–II–III, Reynolds numbers of flow approaching aneurysm for
pc-MRI (I), 1D model (II), and WSS-scaled (III) boundary conditions
methods measured at end diastole; Surface ratio, aneurysm sur-
face area over neck surface area; rprox, vessel radius proximal to
aneurysm.
MARZO et al.894

of this study show that modeled BCs allow realisticpredictions of IA hemodynamics and offer a viablemeans for finding correlations with rupture in largecohort studies.
ACKNOWLEDGMENTS
The @neurIST project is funded by the EuropeanCommission, VI Framework Programme, Priority 2,Information Society Technologies (OxfordshireResearch Ethics Committee—A Study Number:07/Q1604/53).
REFERENCES
1Boussel, L., V. Rayz, et al. Aneurysm growth occurs atregion of low wall shear stress: patient-specific correlationof hemodynamics and growth in a longitudinal study.Stroke 39(11):2997–3002, 2008.2Castro, M. A., C. M. Putman, et al. Computationalfluid dynamics modeling of intracranial aneurysms: effectsof parent artery segmentation on intra-aneurysmal hemo-dynamics. AJNR Am. J. Neuroradiol. 27(8):1703–1709,2006.3Castro, M. A., C. M. Putman, et al. Patient-specificcomputational fluid dynamics modeling of anterior com-municating artery aneurysms: a study of the sensitivity ofintra-aneurysmal flow patterns to flow conditions in thecarotid arteries. AJNR Am. J. Neuroradiol. 27(10):2061–2068, 2006.4Castro, M. A., C. M. Putman, et al. Patient-specific com-putational modeling of cerebral aneurysms with multipleavenues of flow from 3D rotational angiography images.Acad. Radiol. 13(7):811–821, 2006.5Cebral, J. R., M. A. Castro, et al. Efficient pipeline forimage-based patient-specific analysis of cerebral aneurysmhemodynamics: technique and sensitivity. IEEE Trans.Med. Imaging 24(4):457–467, 2005.6Cebral, J. R., M. A. Castro, et al. Characterization ofcerebral aneurysms for assessing risk of rupture by usingpatient-specific computational hemodynamics models.AJNR Am. J. Neuroradiol. 26(10):2550–2559, 2005.7Cebral, J. R., M. A. Castro, et al. Flow–area relationshipin internal carotid and vertebral arteries. Physiol. Meas.29(5):585–594, 2008.8Cebral, J. R., S. Hendrickson, et al. Hemodynamics in alethal basilar artery aneurysm just before its rupture.AJNR Am. J. Neuroradiol. 30(1):95–98, 2009.9Chatziprodromou, I., V. D. Butty, et al. Pulsatile bloodflow in anatomically accurate vessels with multiple aneu-rysms: a medical intervention planning application ofcomputational haemodynamics. Flow Turbul. Combust.71:333–346, 2003.
10Cheng, C., F. Helderman, et al. Large variations in abso-lute wall shear stress levels within one species and betweenspecies. Atherosclerosis 195(2):225–235, 2007.
11Dempere-Marco, L., E. Oubel, et al. CFD analysis incor-porating the influence of wall motion: application to
intracranial aneurysms. Med. Image Comput. Comput. As-sist. Interv. 9(Pt 2):438–445, 2006.
12Fedorov, B. M., T. V. Sebekina, et al. [Stress and bloodcirculation in man]. Kosm. Biol. Aviakosm. Med. 24(3):35–40, 1990.
13Ferns, S. P., J. J. Schneiders, et al. Intracranial blood-flowvelocity and pressure measurements using an intra-arterialdual-sensor guidewire. AJNR Am. J. Neuroradiol. 31(2):324–326, 2010.
14Ford, M. D., H. N. Nikolov, et al. PIV-measured versusCFD-predicted flow dynamics in anatomically realisticcerebral aneurysm models. J. Biomech. Eng. 130(2):021015,2008.
15Formaggia, L., J. F. Gerbeau, et al. On the coupling of 3dand 1d Navier–Stokes equations for flow problems incompliant vessels. Comput. Methods Appl. Mech. Eng.191:561–582, 2001.
16Gonzalez-Alonso, J., M. K. Dalsgaard, et al. Brainand central haemodynamics and oxygenation duringmaximal exercise in humans. J Physiol 557(Pt 1):331–342,2004.
17Gwilliam, M. N., N. Hoggard, et al. MR derived volu-metric flow rate waveforms at locations within the commoncarotid, internal carotid, and basilar arteries. J. Cereb.Blood Flow Metab. 29(12):1975–1982, 2009.
18Hajjar, I., M. Selim, et al. The relationship betweennighttime dipping in blood pressure and cerebral hemody-namics in nonstroke patients. J. Clin. Hypertens. (Green-wich) 9(12):929–936, 2007.
19Hassan, T., M. Ezura, et al. Computational simulation oftherapeutic parent artery occlusion to treat giant verte-brobasilar aneurysm. AJNR Am. J. Neuroradiol. 25(1):63–68, 2004.
20Hop, J. W., G. J. Rinkel, et al. Case-fatality rates andfunctional outcome after subarachnoid hemorrhage: asystematic review. Stroke 28(3):660–664, 1997.
21Ide, K., and N. H. Secher. Cerebral blood flow andmetabolism during exercise. Prog. Neurobiol. 61(4):397–414, 2000.
22Isoda, H., Y. Ohkura, et al. In vivo hemodynamic analysisof intracranial aneurysms obtained by magnetic resonancefluid dynamics (MRFD) based on time-resolved three-dimensional phase-contrast MRI. Neuroradiology 52(10):921–928, 2010.
23Jou, L. D., D. H. Lee, et al. Wall shear stress on rupturedand unruptured intracranial aneurysms at the internalcarotid artery. AJNR Am. J. Neuroradiol. 29(9):1761–1767,2008.
24Jou, L. D., C. M. Quick, et al. Computational approach toquantifying hemodynamic forces in giant cerebral aneu-rysms. AJNR Am. J. Neuroradiol. 24(9):1804–1810, 2003.
25Jou, L. D., G. Wong, et al. Correlation between lumenalgeometry changes and hemodynamics in fusiform intra-cranial aneurysms. AJNR Am. J. Neuroradiol. 26(9):2357–2363, 2005.
26Karmonik, C., G. Benndorf, et al. Wall shear stress vari-ations in basilar tip aneurysms investigated with compu-tational fluid dynamics. Conf. Proc. IEEE Eng. Med. Biol.Soc. 1:3214–3217, 2006.
27Kulikov, V. P., V. N. Grechishnikov, et al. [Response ofcerebral hemodynamics to combined stress impacts]. Patol.Fiziol. Eksp. Ter. 1:7–9, 2005.
28Lagana, K., G. Dubini, et al. Multiscale modelling as a toolto prescribe realistic boundary conditions for the study ofsurgical procedures. Biorheology 39(3–4):359–364, 2002.
Boundary Conditions and Flow Predictions in Aneurysms 895

29Mantha, A., C. Karmonik, et al. Hemodynamics in acerebral artery before and after the formation of an aneu-rysm. AJNR Am. J. Neuroradiol. 27(5):1113–1118, 2006.
30Marzo, A., P. Singh, et al. Influence of inlet boundaryconditions on the local haemodynamics of intracranialaneurysms. Comput. Methods Biomech. Biomed. Eng. 12(4):431–444, 2009.
31Mitsos, A. P., N. M. Kakalis, et al. Haemodynamicsimulation of aneurysm coiling in an anatomically accu-rate computational fluid dynamics model: technical note.Neuroradiology 50(4):341–347, 2008.
32Moyle, K. R., L. Antiga, et al. Inlet conditions for image-based CFD models of the carotid bifurcation: is it rea-sonable to assume fully developed flow? J. Biomech. Eng.128(3):371–379, 2006.
33Oshima, M., H. Sakai, et al. Modelling of inflow boundaryconditions for image-based simulation of cerebrovascularflow. Int. J. Numer. Methods Fluids 47:603–617, 2005.
34Quarteroni, A., and L. Formaggia. Mathematical model-ling and numerical simulation of the cardiovascular system.In: Handbook of Numerical Analysis, Vol. 12, edited byP. G. Ciarlet, and J. L. Lions. Amsterdam: Elsevier, 2004,pp. 3–127.
35Radaelli, A. G., L. Augsburger, et al. Reproducibility ofhaemodynamical simulations in a subject-specific stentedaneurysm model—a report on the Virtual IntracranialStenting Challenge 2007. J. Biomech. 41(10):2069–2081,2008.
36Rayz, V. L., L. Boussel, et al. Numerical simulations offlow in cerebral aneurysms: comparison of CFD resultsand in vivo MRI measurements. J. Biomech. Eng. 130(5):051011, 2008.
37Reymond, P., F. Merenda, et al. Validation of a one-dimensional model of the systemic arterial tree. Am.J. Physiol. Heart Circ. Physiol. 297(1):H208–H222, 2009.
38Sekhar, L. N., and R. C. Heros. Origin, growth, and rup-ture of saccular aneurysms: a review. Neurosurgery 8(2):248–260, 1981.
39Shimogonya, Y., T. Ishikawa, et al. Can temporal fluctu-ation in spatial wall shear stress gradient initiate a cerebralaneurysm? A proposed novel hemodynamic index, thegradient oscillatory number (GON). J. Biomech. 42(4):550–554, 2009.
40Shojima, M., M. Oshima, et al. Magnitude and role of wallshear stress on cerebral aneurysm: computational fluiddynamic study of 20 middle cerebral artery aneurysms.Stroke 35(11):2500–2505, 2004.
41Shojima, M., M. Oshima, et al. Role of the bloodstreamimpacting force and the local pressure elevation in therupture of cerebral aneurysms. Stroke 36(9):1933–1938,2005.
42Singh, P. K., A. Marzo, et al. Effects of heparin on thehemodynamic characteristics of intracranial aneurysms.J. Neuroradiol. Apr 5.
43Steinman, D. A., J. S. Milner, et al. Image-based compu-tational simulation of flow dynamics in a giant intracranialaneurysm. AJNR Am. J. Neuroradiol. 24(4):559–566, 2003.
44Venugopal, P., D. Valentino, et al. Sensitivity of patient-specific numerical simulation of cerebral aneurysm hemo-dynamics to inflow boundary conditions. J. Neurosurg.106(6):1051–1060, 2007.
45Zhao, M., S. Amin-Hanjani, et al. Regional cerebral bloodflow using quantitative MR angiography. AJNR Am.J. Neuroradiol. 28(8):1470–1473, 2007.
MARZO et al.896

PLEASE SCROLL DOWN FOR ARTICLE
This article was downloaded by: [Warren, Gregg]On: 2 February 2009Access details: Access Details: [subscription number 781472160]Publisher Taylor & FrancisInforma Ltd Registered in England and Wales Registered Number: 1072954 Registered office: Mortimer House,37-41 Mortimer Street, London W1T 3JH, UK
Computer Methods in Biomechanics and Biomedical EngineeringPublication details, including instructions for authors and subscription information:http://www.informaworld.com/smpp/title~content=t713455284
Influence of inlet boundary conditions on the local haemodynamics ofintracranial aneurysmsAlberto Marzo a; Pankaj Singh ab; Philippe Reymond c; Nikos Stergiopulos c; Umang Patel b; Rodney Hose a
a Department of Medical Physics, School of Biomedical Sciences, University of Sheffield, Sheffield, UK b
Department of Neurosurgery, Royal Hallamshire Hospital, Sheffield, UK c Laboratory of Hemodynamics andCardiovascular Technology, École Polytechnique Fédérale de Lausanne, Lausanne, Switzerland
First Published on: 26 January 2009
To cite this Article Marzo, Alberto, Singh, Pankaj, Reymond, Philippe, Stergiopulos, Nikos, Patel, Umang and Hose,Rodney(2009)'Influence of inlet boundary conditions on the local haemodynamics of intracranial aneurysms',Computer Methods inBiomechanics and Biomedical Engineering,
To link to this Article: DOI: 10.1080/10255840802654335
URL: http://dx.doi.org/10.1080/10255840802654335
Full terms and conditions of use: http://www.informaworld.com/terms-and-conditions-of-access.pdf
This article may be used for research, teaching and private study purposes. Any substantial orsystematic reproduction, re-distribution, re-selling, loan or sub-licensing, systematic supply ordistribution in any form to anyone is expressly forbidden.
The publisher does not give any warranty express or implied or make any representation that the contentswill be complete or accurate or up to date. The accuracy of any instructions, formulae and drug dosesshould be independently verified with primary sources. The publisher shall not be liable for any loss,actions, claims, proceedings, demand or costs or damages whatsoever or howsoever caused arising directlyor indirectly in connection with or arising out of the use of this material.

Influence of inlet boundary conditions on the local haemodynamics of intracranial aneurysms
Alberto Marzoa*, Pankaj Singhab, Philippe Reymondc, Nikos Stergiopulosc, Umang Patelb and Rodney Hosea
aDepartment of Medical Physics, School of Biomedical Sciences, University of Sheffield, Sheffield, UK; bDepartment of Neurosurgery,Royal Hallamshire Hospital, Sheffield, UK; cLaboratory of Hemodynamics and Cardiovascular Technology, Ecole Polytechnique
Federale de Lausanne, Lausanne, Switzerland
(Received 6 August 2008; final version received 25 November 2008 )
Haemodynamics is believed to play an important role in the initiation, growth and rupture of intracranial aneurysms. In thiscontext, computational haemodynamics has been extensively used in an effort to establish correlations between flowvariables and clinical outcome. It is common practice in the application of Dirichlet boundary conditions at domain inlets tospecify transient velocities as either a flat (plug) profile or a spatially developed profile based on Womersley’s analyticalsolution. This paper provides comparative haemodynamics measures for three typical cerebral aneurysms.
Three dimentional rotational angiography images of aneurysms at three common locations, viz. basilar artery tip, internalcarotid artery and middle cerebral artery were obtained. The computational tools being developed in the European project@neurIST were used to reconstruct the fluid domains and solve the unsteady Navier–Stokes equations, using in turnWomersley and plug-flow inlet velocity profiles. The effects of these assumptions were analysed and compared in terms ofrelevant haemodynamic variables within the aneurismal sac. For the aneurysm at the basilar tip geometries with differentextensions of the afferent vasculature were considered to study the plausibility of a fully-developed axial flow at the inletboundaries.
The study shows that assumptions made on the velocity profile while specifying inlet boundary conditions have littleinfluence on the local haemodynamics in the aneurysm, provided that a sufficient extension of the afferent vasculature isconsidered and that geometry is the primary determinant of the flow field within the aneurismal sac. For real geometries theWomersley profile is at best an unnecessary over-complication, and may even be worse than the plug profile in someanatomical locations (e.g. basilar confluence).
Keywords: boundary conditions; haemodynamics; blood flow; Womersley; plug-flow; intracranial aneurysm
1. Introduction
An aneurysm is a localised dilation in a blood vessel,
which carries an inherent risk of rupture and haemorrhage.
Aneurysmal subarachnoid haemorrhage, despite improve-
ment in surgical and medical management, remains a
major cause of morbidity and mortality with high rates of
case fatality (40–50%, Numminen et al. 1996; Inagawa
2001). Among different etiologies proposed so far
(genetic, traumatic and inflammatory), haemodynamics
is believed to play an important role in the initiation and
the development of the disease (Sekhar and Heros 1981;
Kayembe et al. 1984; Byrne and Guglielmi 1998; Shojima
et al. 2004; Cebral et al. 2005b).
Detailed in vivo measurements of all relevant flow
variables in the regions affected by the disease are currently
impossible. Computational fluid dynamics (CFD) might
represent a valuable tool to extract additional non-
observable information from patient-specific data.
Advances in image processing and vessel reconstruction
techniques, together with the wider availability of
significant computing power, have made possible the
realisation of characterisation of the haemodynamics
of patient-specific geometries. Steinman (2004) has made
the important observation that patient-specific CFD
analyses are possible and that the onus is now on researchers
to bring these technologies into a clinical setting. There are
two steps in this process: the first is to establish a consistent
analysis protocol and to undertake characterisation of large
numbers of aneurysms to provide confidence in the
association of haemodynamic measures with the event of
rupture. The second is to deliver an effective and robust
simulation workflow into the clinical environment.
Both of these steps are addressed in the @neurIST
project (www.aneurist.org), which seeks to develop a
robust, clinically-usable tool chain for the computation of
relevant haemodynamic data associated with the initiation,
growth and rupture of intracranial aneurysms.
The specification of an analysis protocol that can be
applied at all sites, both within and without the @neurIST
project, that are interested in contribution to an extensive
database of haemodynamic characterisations of patient-
specific aneurysms is an important goal.
The computational technologies currently available
limit the extension of the computational domain
ISSN 1025-5842 print/ISSN 1476-8259 online
q 2009 Taylor & Francis
DOI: 10.1080/10255840802654335
http://www.informaworld.com
*Corresponding author. Email: [email protected]
Computer Methods in Biomechanics and Biomedical Engineering
iFirst article, 2009, 1–14
Downloaded By: [Warren, Gregg] At: 11:24 2 February 2009

to a restricted area around the aneurysm. The specification
of boundary conditions at the interfaces with the rest of the
cardiovascular network thus remains a pre-requisite for the
solution of the governing equations.
Flow rate waveforms (describing area-integrated
velocity at each instant in time) in the region of the
aneurysm or in the afferent vessels might sometimes be
available from Doppler ultrasound in the carotid, from
transcranial Doppler ultrasound or from magnetic
resonance imaging, but none of these is currently
measured in routine clinical practice in the management
of cerebral aneurysm. Invasive pressure measurements
are even rarer. A viable alternative for description of
flow and pressure waveforms might be 1D circulation
models (Westerhof et al. 1969; Stergiopulos et al. 1992;
Vignon-Clementel 2006; Balossino et al. 2008; Bove
et al. 2008). From whatever source flow or pressure
measurements are available, it is unlikely or impossible
that they include spatial resolution of the profiles.
The solution of the 3D Navier–Stokes equations, on the
other hand, requires these quantities to be specified as
pointwise values at each node of the 3D boundary mesh.
Assumptions made while completing such deficient data
at boundaries is not trivial and can strongly perturb the
numerical results.
Many authors rely on the theory of Womersley (1955)
for the specification of the velocity profile of flowrate-
based boundary conditions, assuming that flow is spatially
developed to that associated with periodic flow in a
circular pipe. This might be appropriate but it is known
that geometry of the proximal vasculature remains the
most important factor in describing the flow presented to
the aneurysm (Cebral et al. 2005a; Oshima et al. 2005;
Castro et al. 2006; Moyle et al. 2006). The over-
complication of applying a Womersley velocity profiles
might be unnecessary and in some circumstances
unrealistic in the determination of the haemodynamics
within the aneurismal sac.
Myers et al. (2001) and Moyle et al. (2006) have
assessed the effect of these assumptions on arterial
haemodynamics and have shown that geometry takes over
within a relatively short distance from the location of the
inlet boundaries, thus nullifying the effects of careful
specification of inlet velocity profiles.
However, there is relatively little data in the context of
saccular cerebral aneurysms (Oshima et al. 2005), which
often presents more complex haemodynamic patterns
(Cebral et al. 2005a) when compared to the simpler
geometries of the studies reported so far (Myers et al.
2001; Moyle et al. 2006).
The current study investigates the effects of inlet
velocity profiles on the haemodynamics of intracranial
aneurysms and demonstrates their secondary role when
compared to anatomical geometry and extension of
afferent vasculature in three typical anatomical locations.
2. Materials and methods
Three typical intracranial aneurysms found in the circle of
Willis were considered in this study: an aneurysm at the tip
of the basilar artery (herein called geom.1), an aneurysm
of the right ophthalmic segment of the internal carotid
artery (geom.2), and an aneurysm of the terminal
bifurcation of the right middle cerebral artery (geom.3).
Locations are illustrated in Figure 1. In order to study the
flow development at the confluence of the vertebral
arteries, an additional geometry for the basilar artery
aneurysm was reconstructed (geom.1b), which contains
the junction of the two vertebral arteries.
Some of the case studies had additional minor
aneurysms. These are highlighted by black arrows in
Figure 2, but were excluded from the study.
The aneurysm in each of geom.1 and 3 was saccular
bilobular. The aneurysm in geom.2 was saccular with a
single lobe. These geometries present a progressively
higher level of tortuosity of the aneurysmal afferent loop
from geom.1, where the basilar artery is only slightly
curved, to geom.3, where the feeding vasculature presents
several bends, changes in the lumen diameter and
bifurcations, before reaching the aneurysm of interest.
More details of the geometries of interest are reported in
Table 1.
Rotational acquisitions were obtained using a Philipsw
Integrise BV 5000 machine (Philipsw Medical Systems,
Eindhoven, The Nederlands), producing 100 images in 4 s,
with 5 ms exposure per image. A built-in X-ray image
Figure 1. Representation in one of @neurIST application suitesof a typical cerebral arterial tree, with locations of geom.1, 1b, 2and 3 indicated by white spheres and black arrows.
A. Marzo et al.2
Downloaded By: [Warren, Gregg] At: 11:24 2 February 2009

Table 1. Geometrical properties of geom.1–3.
Aneurysm size (mm)
Depth Max diameterNeck
(max width)Length of afferent vessel
(normalised with inlet diameter) Complexity of afferent loop
Geom.1 5.5–6.5a 4.6–5.8a 5.5 10 LowGeom.1b 5.5–6.5a 4.6–5.8a 5.5 12b LowGeom.2 5.5 4.6 4.3 8.2 MediumGeom.3 4.4–3.8a 3.3–2.3a 3.1 12 High
a Values for the two lobes.b Values for both inlet afferent vessels of geom.1b, i.e. vertebral arteries.
Figure 2. Reconstructed geometries: geom.1, basilar artery aneurysm; geom.1b, basilar artery aneurysm including vertebral arteries;geom.2, internal carotid artery aneurysm, geom.3, middle cerebral artery aneurysm. Black arrows show secondary smaller aneurysms,excluded from the study. Labels indicate the openings where boundary conditions were applied.
Computer Methods in Biomechanics and Biomedical Engineering 3
Downloaded By: [Warren, Gregg] At: 11:24 2 February 2009

intensifier was used, with a close-circuit-digital camera
and software to correct for geometrical deformation.
Voxel size in the reconstructed 3D images was 303mm
with reconstruction matrix 512 £ 512 £ 512. Images
were anonymised, respecting the ethical approval for
@neurIST’s for use of patient data.
The @neurIST computational tool-chain was used
to segment, extract and repair the vessel surfaces.
In particular, vessel triangular surfaces were created
using a threshold isosurface extraction tool, based on the
marching cubes algorithm developed by Lorensen and
Cline (1987). Artefacts and unnecessary vasculature were
removed and surface repaired using tools based on the
Visualisation Toolkit (www.vtk.org), first developed
within the Multimod Application Framework (Viceconti
et al. 2004) and further improved within the project
@neurIST. All inlet openings were extruded and morphed
into circular edges for the appropriate application of
Womersley-based boundary conditions. Extrusion of some
outlets was necessary to ensure that spatially constant
pressure represented an appropriate boundary condition at
the termination of the 3D domain. The results of the
geometry reconstruction process are shown in Figure 2.
During vessel reconstruction, the neck of the
aneurysms was manually identified and marked to define
the aneurysmal sac that was used for the haemodynamic
characterisation of each aneurysm.
Volumetric meshes were generated using ANSYSw
ICEM CFD 11.0e and based on the octree approach.
Grids were made finer at the walls and progressively
coarser towards the vessel axis. Tetrahedral elements were
used for the discretisation of the domain core, with three
layers of prismatic elements adjacent to the wall, thus
ensuring accurate computation of wall shear stresses
(WSS) and oscillatory shear indices (OSI). Element size
and number were set accordingly to the outcome of a mesh
dependency study performed on similar aneurysmal
geometries (Radaelli et al. 2008, private communications).
In this study, results were found to be grid independent for
meshes greater than 1700 el/mm3. In order to maintain
consistency across the meshes used for all geometries,
similar element density and the same wall element size and
maximum core element size were used in the discretisation
of the domains. Mesh details are reported in Table 2
below.
The 3D unsteady Navier–Stokes equations were
solved by using the finite-control-volume software,
ANSYSw-CFXe. The default second-order high-resol-
ution advection differencing scheme was used. The solution
algorithm is an implicit coupled solution scheme, based on
an algebraic multigrid method for the coupled linear
equations. Blood was assumed to be incompressible, with
density r ¼ 1050 kg/m3 and Newtonian, with viscosity
m ¼ 0.0035 Pa s. All analyses were run in parallel, using
the communication mode MPICH on two Itanium2
900MHz 64-bit processors of a Tiger-2 Linux cluster
node with 4GB of registered DDR-SDRAM PC1600. The
average time required to solve one cardiac cycle with the
meshes considered was approximately 8.6 h.
2.1 Boundary conditions
Patient-specific flow measurements at boundaries were not
available for the data sets under consideration, thus
boundary conditions were derived from the flow-rate and
pressure waveforms computed by using the 1D circulation
model developed by Reymond et al. (2008), which is part
of the @neurIST computational tool-chain. This is a
distributed model of the entire systemic arterial tree,
coupled to a heart model and including a detailed
description of the cerebral arteries. The 1D form of the
fluid equations are applied over each arterial segment and
intimal WSS is modelled using the Womersley theory.
Arterial wall was modelled with a non-linear viscoelastic
constitutive law and arterial tree dimensions and proper-
ties were taken from literature and extended to include a
description of the cerebral arterial tree obtained from real
patient scans. In some more detail, the pressure
dependency of compliance in thoracic and abdominal
aortas, measured ex vivo and described by Langewouters
(1982), was applied to the whole arterial tree. The elastic
component of the compliance, which is function of the
mean arterial lumen diameter, compliance, was described
as a function of pulse wave velocity (Reymond et al.
2008). The viscoelastic behaviour of the arterial wall was
described by the model developed by Holenstein et al.
(1980). Geometrical properties of the arterial tree,
including the circle of Willis, were taken from
Noordergraaf (1956), Gabrielsen and Greitz (1970),
Fox et al. (1973), Krayenbuehl and Yasargil (1982),
Table 2. Grid properties for geom.1–3.
Volume(mm3) Elements Nodes
Averagedensity (el/mm3)
Max el.size (mm)
Max wall el.size (mm)
Geom.1 433.9 1321449 411331 3046 0.4 0.12Geom.1b 540.4 1678606 527615 3106 0.4 0.12Geom.2 1375.5 3173174 912842 2307 0.4 0.12Geom.3 848.2 2292777 694172 2703 0.4 0.12
A. Marzo et al.4
Downloaded By: [Warren, Gregg] At: 11:24 2 February 2009

Hillen et al. (1986), Dodge et al. (1992), Stergiopulos et al.
(1992), Krabbe-Hartkamp et al. (1998) and Holdsworth
et al. (1999), and completed by interpolated real patient
scans (3D rotational angiography and MRA).
Flow-rate waveforms were used for all primary inlets
and pressure waveforms for all primary outlets. All
pressure and flow rate waveforms used for the analyses are
reported in Figure 3. Flow-rate waveforms were used to
specify, in turn, plug-flow (i.e. flat velocity profile) and
Womersley velocity profiles at the inlet boundaries.
The waveforms were decomposed into Fourier series as
indicated in Equation (1):
QðtÞ ¼XNn¼0
Qneinvt; ð1Þ
where N is the number of harmonics, and v is the angular
frequency derived from the period of the cardiac cycle
T ¼ 0.8 s. The Womersley velocity profile was expressed
in terms of the Fourier representation of the flow rate
waveforms as indicated in Equation (2):
n ðr; tÞ ¼2Q0
pR212
r
R
� �2
h i
þXNn¼1
Qn
pR2
12J0 bn·ðr=RÞð Þ
J0ðbnÞ
12 2J1ðbnÞbn·JoðbnÞ
24
35·e invt;
ð2Þ
where R is the radius of the inlet boundary, Q0 is the first
harmonic coefficient responsible for the parabolic profile
of a steady flow (i.e. Poiseuille flow), J0 and J1 are Bessel
functions of order zero and one, respectively, and
bn ¼ i 3=2·an; ð3Þ
an ¼ R·
ffiffiffiffiffiffiffiffiffiffiffiffin·4·r
m
r; ð4Þ
where an is the Womersley number of the nth harmonic.
A Fortran subroutine was created and interfaced to the
ANSYSw-CFXe solver for the computation of the
velocity inlet profiles within each time loop.
Analyses were run for four cardiac cycles to nullify
the transient artefacts generated by the initial conditions,
and only data from the 4th cycle were used in the
post-processing phase.
3. Results
Relevant haemodynamic variables were compared quali-
tatively and quantitatively for the two velocity profile
assumptions both at two time-points along the cardiac cycle
(corresponding to the lowest and highest Reynolds numbers
achieved during diastole and systole, respectively), and
as time-averaged quantities across the cardiac cycle.
The haemodynamic variables chosen for these comparisons
have been associated with aneurysmal initiation, growth
and rupture in the literature (Shojima et al. 2004; Cebral
et al. 2005b).
3.1 Qualitative comparison using instantaneousvelocity contours
Figure 4 shows the comparison between Womersley and
plug-flow boundary conditions during diastole and systole,
using velocity contours at specific cross sections.
The cross-sections were selected as those, which
subjectively, best illustrated the complexity of the flow
within the three domains. Results for geom.1 show that for
both flow regimes; the Womersley and plug-flow flow
patterns are essentially the same with some minor
discrepancy in the magnitude of the velocity field, as
shown by the arrows in Figure. Results for geom.2 are
consistent with geom.1 except that discrepancies in
velocity magnitudes are more pronounced in the lower
part of the cross section, representing the velocity patterns
within the parent vessel. Finally, results for geom.3 show
good agreement in the patterns as well as the magnitude of
the velocity field. Contours in geom.2 and 3 show the
presence of a jet of fluid entering the aneurysm and
impinging onto the distal side of the aneurysmal wall.
Moreover, results for all geometries show that flow is
rather stable (according to the definition of Cebral et al.
2005b), exhibiting the same characteristics during diastole
and systole.
3.2 Qualitative comparison using instantaneous WSScontours
Figure 5 shows the comparison between Womersley and
plug-flow boundary conditions during diastole and
systole, using contours of WSS on the wall of the
aneurysmal sac. Results for geom.1 show that Womersley
and plug-flow boundary conditions at inlet develop
essentially the same WSS distribution in the aneurysm in
both flow regimes. It was noticed that the bigger lobule of
geom.1 is one, which is subjected to comparatively low
WSS at both reported time-points in the cardiac cycle,
whereas in the smaller lobule WSS values reach their
highest values. Results for geom.2 and 3 show essentially
the same WSS patterns for both inflow assumptions and
for both flow regimes, with some minor variations for
geom.2 during diastole near the aneurysmal neck, and
for geom.3 during systole as shown by the arrows in
Figure 5.
As for velocity distributions, WSS present similar
patterns during diastole and systole, showing stability of
the flow.
Computer Methods in Biomechanics and Biomedical Engineering 5
Downloaded By: [Warren, Gregg] At: 11:24 2 February 2009

Figure 3. (a) Flow-rate (left) and pressure waveforms (right) applied in geom.1. (b) Flow-rate (left) and pressure waveforms (right)applied in geom.1b. (c) Flow-rate (left) and pressure waveforms (right) applied in geom.2 and (d) Flow-rate (left) and pressure waveforms(right) applied in geom.3.
A. Marzo et al.6
Downloaded By: [Warren, Gregg] At: 11:24 2 February 2009

3.3 Qualitative comparison using time-averaged WSSand OSI contours
Time-averaged haemodynamic quantities can be used to
assess the agreement between results over the whole
cardiac cycle, and not solely at specific snap-shots in time.
Time-averaged WSS are reported, together with OSI for
further comparison. OSI is defined in Equations (5) and (6),
and was used to quantify the oscillatory shears experienced
by the cells of the inner part of the arterial vessel and
aneurysm (endothelial layer).
OSI ¼1
212
tmean
tabs
� �; ð5Þ
tmean ¼1
T
ðT0
ts·dt
��������; ð6Þ
where ts represents the surface traction vector. Figures 6
and 7 show the time-averaged WSS and OSI contours,
respectively, on the aneurysmal wall of all three
geometries and for both inlet boundary conditions.
The results are consistent with those of the instantaneous
measures, i.e. very little differences are observed between
WSS and OSI patterns, and only minor differences in
magnitudes, from Womersley and plug-flow boundary
conditions. For these aneurysms, exhibiting stable flow
patterns over the cardiac cycle, it is noted that the
time-averaged WSS pattern is qualitatively very similar to
that of its instantaneous counterparts.
3.4 Qualitative comparison on flow development
Figure 8(a),(b) shows the development of the flow for
Womersley and plug-flow boundary conditions for
geom.1. Although the two flows start from different
assumptions at the inlet opening, both develop into a very
similar velocity pattern before reaching the aneurysmal
sac. Figure 8(c), illustrating the results for the extended
domain of geom.1b, shows that the two converging vessels
produce a ring-like velocity profile that is significantly
different from both the Womersley and flat profiles, but
Figure 4. Velocity contours across the aneurysmal sac for (a) Womersley boundary conditions at lowest Re during diastole; (b) plug-flowboundary conditions at lowest Re during diastole; (c) Womersley boundary conditions at highest Re during systole and (d) plug-flowboundary conditions at highest Re during systole. From top to bottom: geom.1–3. Grey arrows indicate areas of discrepancies. Units forvelocity are expressed in m/s.
Computer Methods in Biomechanics and Biomedical Engineering 7
Downloaded By: [Warren, Gregg] At: 11:24 2 February 2009

in fact closer to the latter. This indicates clearly that there
are some geometries (of course those that are least like a
straight tube) for which the Womersley profile is actually a
worse choice than the flat profile. Nevertheless, once again
the flow close to the aneurysm is relatively similar for all
boundary conditions considered.
3.5 Quantitative comparison
For a more accurate and direct evaluation of the effects
that different boundary conditions may have on local
haemodynamics, several haemodynamic indices were
extracted from the flow field of the three aneurysmal
sacs, for both inflow boundary conditions. These are
reported in Table 3 with the percentage discrepancy
between Womersley and plug-flow results. In geom.1, the
maximum discrepancy was observed in the spatial-average
speed in the aneurysmal sac (4.3%) and in the area of
elevated pressure in the aneurysmal wall (also 4.3%).
Relatively high discrepancies were also observed in the
values predicted for the maximum speed within the
aneurysm at systole (2.3%) and the location of maximum
OSI (2.8%). In geom.2, the maximum discrepancy was
observed in the predictions of area of elevated pressure
(4.1%) and for geom.3 in the values of max OSI (3.7%)
and its location (4.1%).
The root mean square of the errors of the different
indices was also computed and is reported in the last row
of Table 3.
Overall the maximum discrepancy between Womersley
and plug-flow results was observed in geom.3, where the
RMS is 2%. Lower RMS values were calculated for geom.1,
RMS ¼ 1.9% and geom.2, RMS ¼ 1.2%.
4. Discussion
The purpose of this paper is to compare the results from
two common methods of application of proximal velocity
boundary conditions for haemodynamic analysis of
cerebral aneurysms. The context is that of specification
of a robust protocol for routine haemodynamic analysis as
part of a clinical workflow.
The isolation of the vessel of interest from the rest of
the cardiovascular tree and its surroundings (e.g. tissues
Figure 5. WSS contours for (a) Womersley boundary conditions at lowest Re during diastole; (b) plug-flow boundary conditions atlowest Re during diastole; (c) Womersley boundary conditions at highest Re during systole and (d) plug-flow boundary conditions athighest Re during systole. From top to bottom: geom.1–3. Units for WSS are expressed in Pa.
A. Marzo et al.8
Downloaded By: [Warren, Gregg] At: 11:24 2 February 2009

and bones) implies that wall and flow conditions will have
to be specified at the boundaries of the vessel. Patient-
specific assessment of the properties of the vessel walls
and its surroundings are difficult. There is some evidence
that pulsatility of the vessel wall might have negligible
effect on haemodynamics even when the wall motion is of
the order of the radius of a vessel (Jeays et al. 2007) and
even less so in the context of cerebral aneurysms in the
confined compartment of the skull (Dempere-Marco et al.
2006). For the purposes of the current study (and probably
for a routine clinical analysis protocol) the walls of the
vessel are considered fixed.
Patient-specific flow measurements are in principle
attainable from MRI or Doppler ultrasound but the
intricacy of the cerebral vasculature, the small size of its
vessels, and the fact that these are not part of the clinical
procedure make them rarely available. Even when they
are, it is unusual to rely on the spatial distribution of
velocity (due to resolution of MRI and difficulties of
location of Doppler ultrasound measures). To overcome
Figure 6. Time-averaged WSS contours for (a) Womersley boundary conditions; (b) plug-flow boundary conditions. From top tobottom: geom.1–3. Units for WSS are expressed in Pa.
Computer Methods in Biomechanics and Biomedical Engineering 9
Downloaded By: [Warren, Gregg] At: 11:24 2 February 2009

these difficulties several authors use lumped-parameters or
1D models for the description of the remaining vascular
systems (Formaggia et al. 1999; Quarteroni et al. 2001).
Flow boundary conditions, whether from patient-specific
ultrasound or MRI measures, or computed using simple
models of the cardiovascular system, are available as
cross-sectional average values of velocity or pressure
along the cardiac cycle. Thus assumptions on their 3D
development across the same boundaries are to be made to
match the level of details required by 3D modelling. While
imposing inflow boundary conditions from the flow-rate
waveforms computed by a 1D distributed model, for
instance, one assumption often imposed at the inlet
boundary is that of axisymmetric flow with a velocity
distribution determined by the Womersley theory.
The results of the comparative analyses with Womersley
and flat velocity profiles indicate that there is no change in
qualitative flow patterns, and detailed examination of the
flow fields yields maximum differences of less than 5%, and
RMS differences between 1 and 2%. It is suggested that
these differences are unimportant in the context of
interpretability against known thresholds, and particularly
Figure 7. OSI contours for (a) Womersley boundary conditions; (b) plug-flow boundary conditions. From top to bottom: geom.1–3.
A. Marzo et al.10
Downloaded By: [Warren, Gregg] At: 11:24 2 February 2009

in the context of other uncertainties in the analysis (patient
blood pressure, beat-to-beat variations, alternative physio-
logical states including exercise, patient haematocrit and
viscosity models). Certainly, the errors are small compared
with those that might arise from inaccurate segmentation of
the patient specific geometry, when variabilities up to 48%
have been reported (Moyle et al. 2006). Whilst the true
significance and relevance of discrepancies between
Womersley and plug-flow results can only be assessed
once associations are found between haemodynamic indices
and aneurysmal evolution, it is probably safe to assume that
the uncertainties of any thresholds and the safety factors that
will be built into any clinical interpretation and recommen-
dations will always remain greater than that associated with
analysis errors from the inlet velocity profile provided the
inlet development domain is of adequate length.
The computational savings associated with a recommen-
dation of the simplest inlet velocity boundary condition, that
of a flat profile, are not significant. More important is that the
simpler the analysis protocol adopted, the more likely it is
that other centres will contribute to the growth of an
established database of haemodynamic characterisations,
ultimately reflecting on its power to provide meaningful,
peer-reviewed and clinically implementable associations of
the characteristic haemodynamic measures with observed
clinical outcome. Until such associations are established, the
impact of CFD on the management of cerebral aneurysms
will be minimal.
A limitation of the current study is that results are
reported for only three aneurysms, with one further
variation. Nevertheless, these aneurysms have been
selected as typical of those that arise most commonly in
the cerebral vasculature and given the consistency of the
results, and their resonance with expectations based on the
physics of the problem, it is suggested that it provides
strong evidence that haemodynamic characterisations are
indeed likely to be insensitive to details of the inlet
velocity distribution.
Although specific analysis and comment on the
haemodynamic results for any one aneurysm is not the
focus of the current study, the analysis of geom.1 revealed
some interesting haemodynamic characteristics that are
worthy of mention. Primary haemodynamic activity is
clearly confined to one of the lobules, whilst the other is
subject to very low WSS. In fact, it is the smaller lobule
that exhibits strong haemodynamic activity and the larger
that is relatively stagnant. It is noted that the larger lobe
has a more irregular shape. No follow-up data is available
and so it is impossible to determine which, if either, lobe is
growing or which might rupture. Nevertheless, it is
noteworthy that the haemodynamic environment in the
smaller of the lobes is more similar to that in the parent
vasculature than that in the larger lobe, and that the mean
shear stress in the larger lobe is below that threshold
that has been associated with negative outcome and
the onset of disease in other vascular applications
(Malek et al. 1999).
5. Conclusions
Our final conclusions are as follows:
(1) The haemodynamic characterisation of a cerebral
aneurysm under given proximal flow conditions is
relatively insensitive to the details of the velocity
profile on inlet boundaries that are sufficiently far
from the aneurysm.
(2) Wider adoption of a given analysis protocol is more
likely if it is simple to implement and the
specification of a flat velocity profile at the inlet to
a 3D domain provides an adequate and justifiable
description for the purposes of haemodynamic
characterisation.
Figure 8. Velocity vectors on cross-sections along the afferent vessel at peak systole for geom.1 with plug-flow boundary conditions (a);geom.1 with Womersley boundary conditions (b) and geom.1b (c) with Womersley boundary conditions. The distance between the cross-sections is approximately 1.5D, where D is the diameter of the inlet boundary in geom.1. Units for velocity are expressed in m/s.
Computer Methods in Biomechanics and Biomedical Engineering 11
Downloaded By: [Warren, Gregg] At: 11:24 2 February 2009

Table 3. Haemodynamic indices extracted for geom.1–3 and percentage error between Womersley and plug-flow results.
Geom.1 Geom.2 Geom.3
Wom Plug Err% Wom Plug Err% Wom Plug Err%
Max speed within aneurysmat systole (m/s)
1.774 1.733 22.3 1.154 1.155 0.1 1.555 1.544 20.7
Spatial mean speed in aneurysmat systole (m/s)
0.331 0.317 24.3 0.557 0.557 0.0 0.619 0.619 0.0
Peak static wall pressureat systole (Pa)
16,131 15,950 21.1 15,770 15,750 20.1 14560 14,550 20.1
Location X of max pressure (m) 3.51 £ 1022 3.51 £ 1022 0.0 4.20 £ 1022 4.20 £ 1022 0.0 1.73 £ 1022 1.73 £ 1022 0.0Location Y of max pressure (m) 1.64 £ 1022 1.64 £ 1022 0.0 2.33 £ 1022 2.33 £ 1022 0.0 3.11 £ 1022 3.11 £ 1022 0.0Location Z of max pressure (m) 23.67 £ 1022 23.67 £ 1022 0.0 23.48 £ 1022 23.48 £ 1022 0.0 23.65 £ 1022 23.65 £ 1022 0.0Spatial mean static pressurein aneurysm at systole (Pa)
15,260 15,130 20.9 15,140 15,120 20.1 13,770 13,770 0.0
Area of elevated pressurea (m2) 0.123 £ 1026 0.118 £ 1025 24.3 4.18 £ 1026 4.01 £ 1026 24.1 7.06 £ 1026 7.13 £ 1026 1.1Max time-averaged WSS (Pa) 25.79 25.52 21.1 16.44 16.87 2.6 49.07 50.52 2.95Location X of max time-averagedWSS (m)
3.604 £ 1022 3.604 £ 1022 0.0 4.18 £ 1022 4.18 £ 1022 0.0 1.79 £ 1022 1.79 £ 1022 0.0
Location Y of max time-averagedWSS (m)
0.196 £ 1023 0.196 £ 1023 0.0 0.232 £ 1023 0.232 £ 1023 0.0 0.291 £ 1023 0.291 £ 1023 0.0
Location Z of max time-averagedWSS (m)
23.48 £ 1022 23.48 £ 1022 0.0 23.49 £ 1022 23.49 £ 1022 0.0 23.36 £ 1022 23.36 £ 1022 0.0
Area of elevated time-averagedWSSb (m2)
1.83 £ 1026 1.82 £ 1026 20.9 6.39 £ 1027 6.39 £ 1027 0.0 2.60 £ 1027 2.56 £ 1027 21.4
Max OSI in aneurysmal wall 0.491 0.487 20.8 0.471 0.472 0.2 0.494 0.475 23.7Location X of max OSI (m) 3.21 £ 1022 3.12 £ 1022 22.8 4.13 £ 1022 4.13 £ 1022 0.0 1.95 £ 1022 1.97 £ 1022 1.2Location Y of max OSI (m) 1.80 £ 1022 1.79 £ 1022 20.9 2.34 £ 1022 2.34 £ 1022 0.0 3.12 £ 1022 2.99 £ 1022 24.1Location Z of max OSI (m) 23.20 £ 1022 23.12 £ 1022 22.7 23.75 £ 1022 23.75 £ 1022 0.0 23.67 £ 1022 23.68 £ 1022 0.3Area of elevated OSI (m2) 6.44 £ 1025 6.37 £ 1025 21.0 3.39 £ 1027 3.35 £ 1027 21.2 7.30 £ 1027 7.70 £ 1027 5.4RMS error (%) 1.9 1.2 1.98
a Elevation defined as 50% of peak pressure minus average pressure in the aneurysm at systole.b Elevation defined as 50% of maximum time-averaged WSS.
A.Marzo
etal.
12
Downloaded By: [Warren, Gregg] At: 11:24 2 February 2009

Acknowledgements
The authors would like to thank the European Commission, VIFramework Programme, Priority 2, Information Society Techno-logies, for funding @neurIST and allowing this study.
References
Balossino R, Pennati G, Migliavacca F, Formaggia L, Veneziani A,Tuveri M, Dubini G. 2008. Computational models to predictstenosis growth in carotid arteries: which is the role ofboundary conditions? Comput Methods Biomech BiomedEngin. Sep 1:1. [Epub ahead of Print].
Bove EL, Migliavacca F, De Leval MR, Balossino R, PennatiG, Lloyd TR, Khambadkone S, Hsia TY, Dubini G. 2008.Use of mathematic modeling to compare and predicthemodynamic effects of the modified Blalock–Taussig andright ventricle–pulmonary artery shunts for hypoplastic leftheart syndrome. J Thorac Cardiovasc Surg.136(2):312–320.
Byrne JV, Guglielmi G. 1998. Endovascular treatment ofintracranial aneurysms. 1st ed. Chapter 1. Introduction tointracranial aneurysms: haemodynamic causes. Berlin:Springer-Verlag. p. 5–6.
Castro MA, Putman CM, Cebral JR. 2006. Computational fluiddynamics modeling of intracranial aneurysms: effects ofparent artery segmentation on intra-aneurysmal hemody-namics. AJNR Am J Neuroradiol. 27:1703–1709.
Cebral JR, Castro MA, Appanaboyina S, Putman CM, Millan D,Frangi AF. 2005a. Efficient pipeline for image-based patient-specific analysis of cerebral aneurysm hemodynamics:technique and sensitivity. IEEE Trans Med Imaging24:457–467.
Cebral JR, Castro MA, Burgess JE, Pergolizzi RS, Sheridan MJ,Putman CM. 2005b. Characterization of cerebral aneurysmsfor assessing risk of rupture by using patient-specificcomputational hemodynamics models. AJNR Am J Neuro-radiol. 26:2550–2559.
Dempere-Marco L, Oubel E, Castro M, Putman C, Frangi A,Cebral J. 2006. CFD analysis incorporating the influence ofwall motion: application to intracranial aneurysms. MedImage Comput Comput Assist Interv Int Conf Med ImageComput Comput Assist Interv. 9:438–445.
Dodge JT Jr, Brown BG, Bolson EL, Dodge HT. 1992. Lumendiameter of normal human coronary arteries. Influence ofage, sex, anatomic variation, and left ventricular hypertrophyor dilation. Circulation 86(1):232–246.
Formaggia L, Nobile F, Quarteroni A, Veneziani A. 1999.Multiscale modelling of the circulatory system: a preliminaryanalysis. Comput Vis Sci. 2:75–83.
Fox C, Davies MJ, Webb-Peploe MM. 1973. Length of left maincoronary artery. Br Heart J. 35(8):796–798.
Gabrielsen TO, Greitz T. 1970. Normal size of the internalcarotid, middle cerebral and anterior cerebral arteries. ActaRadiol Diagn (Stockh) 10(1):1–10.
Hillen B, Hoogstraten HW, Post L. 1986. A mathematical modelof the flow in the circle of Willis. J Biomech. 19(3):187–194.
Holdsworth DW, Norley CJ, Frayne R, Steinman DA, Rutt BK.1999. Characterization of common carotid artery blood-flowwaveforms in normal human subjects. Physiol Meas. 20(3):219–240.
Holenstein R, Niederer P, Anliker M. 1980. A viscoelastic modelfor use in predicting arterial pulse waves. J Biomech Eng.102(4):318–325.
Inagawa T. 2001. Trends in incidence and case fatality rates ofaneurysmal subarachnoid hemorrhage in Izumo city, Japan,
between 1980 – 1989 and 1990 – 1998. Stroke. 32:1499–1507.
Jeays AD, Lawford PV, Gillott R, Spencer P, Barber DC,Bardhan KD, Hose DR. 2007. Characterisation of thehaemodynamics of the superior mesenteric artery. J Biomech.40:1916–1926.
Kayembe KN, Sasahara M, Hazama F. 1984. Cerebralaneurysms and variations in the circle of Willis. Stroke.15:846–850.
Krabbe-Hartkamp MJ, Van der Grond J, De Leeuw FE, De GrootJC, Algra A, Hillen B, Breteler MM, Mali WP. 1998. Circleof Willis: morphologic variation on three-dimensional time-of-flight MR angiograms. Radiology 207(1):103–111.
Krayenbuehl H, Yasargil MG. 1982. Cerebral angiography.Stuttgart: Thieme Medical Publishers.
Langewouters GJ. 1982. Visco-elasticity of the human aorta invitro in relation to pressure and age [thesis]. [Amsterdam(The Netherlands)]: University of Amsterdam.
Lorensen WE, Cline H. 1987. Marching cubes: a high resolution3D surface construction algorithm. Comput Graph. 21(4):163–169.
Malek AM, Alper SL, Izumo S. 1999. Hemodynamic shear stressand its role in atherosclerosis. JAMA 282:2035–2042.
Moyle KR, Antiga L, Steinman DA. 2006. Inlet conditions forimage-based CFD models of the carotid bifurcation: is itreasonable to assume fully developed flow? J Biomech Eng.128:371–379.
Myers JG, Moore JA, Ojha M, Johnston KW, Ethier CR. 2001.Factors influencing blood flow patterns in the human rightcoronary artery. Ann Biomed Eng. 29:109–120.
Noordergraaf A. 1956. Physical basis of ballistocardiography.’s-Gravenhage: Excelsior. p. 146.
Numminen H, Kotila M, Waltimo O, Aho K, Kaste M. 1996.Declining incidence and mortality rates of stroke in Finlandfrom 1972 to 1991. Results of three population-based strokeregisters. Stroke 27:1487–1491.
Oshima M, Sakai H, Torii R. 2005. Modelling of inflow boundaryconditions for image-based simulation of cerebrovascularflow. Int J Numer Methods Fluids 47:603–617.
Quarteroni A, Ragni S, Veneziani A. 2001. Coupling betweenlumped and distributed models for blood flow problems.Comput Vis Sci. 4:111–124.
Radaelli AG, Augsburger L, Cebral JR, Ohta M, Rufenacht DA,Balossino R, Benndorf G, Hose DR, Marzo A, Metcalfe R,et al. 2008. Reproducibility of haemodynamical simulationsin a subject-specific stented aneurysm model – a report onthe Virtual Intracranial Stenting Challenge 2007. J Biomech.41:2069–2081.
Reymond P, Merenda F, Perren F, Rufenacht D, Stergiopulos N.2008. Validation of 1D model of the systemic arterial treeincluding the cerebral circulation. In: Paper presented at:Summer Bioengineering Conference (SBC2008). Proceed-ings of ASME 2008 Conference; Florida, USA.
Sekhar LN, Heros RC. 1981. Origin, growth, and rupture ofsaccular aneurysms: a review. Neurosurgery 8:248–260.
Shojima M, Oshima M, Takagi K, Torii R, Hayakawa M, KatadaK, Morita A, Kirino T. 2004. Magnitude and role of wallshear stress on cerebral aneurysm: computational fluiddynamic study of 20 middle cerebral artery aneurysms.Stroke 35:2500–2505.
Steinman DA. 2004. Image-based computational fluid dynamics:a new paradigm for monitoring hemodynamics andatherosclerosis. Curr Drug Targets Cardiovasc HaematolDisord. 4:183–197.
Computer Methods in Biomechanics and Biomedical Engineering 13
Downloaded By: [Warren, Gregg] At: 11:24 2 February 2009

Stergiopulos N, Young DF, Rogge TR. 1992. Computersimulation of arterial flow with applications to arterial andaortic stenoses. J Biomech. 25(12):1477–1488.
Viceconti M, Astolfi L, Leardini A, Imboden S, Petrone M,Quadrani P, Taddei F, Testi D, Zannoni C. 2004. The multimodapplication framework. In: Proceedings of the InformationVisualisation, Eight International Conference; 15–20.
Vignon-Clementel IE, Figueroa CA, Jansen KE, Taylor CA.2006. Outflow boundary conditions for three-dimensional
finite element modeling of blood flow and pressurein arteries. Comput Methods Appl Mech Eng. 195:3776–3796.
Westerhof N, Bosman F, De Vries CJ, Noordergraaf A. 1969.Analog studies of the human systemic arterial tree.J Biomech. 2(2):121–143.
Womersley JR. 1955. Method for the calculation of velocity, rateof flow and viscous drag in arteries when the pressuregradient is known. J Physiol. 127:553–563.
A. Marzo et al.14
Downloaded By: [Warren, Gregg] At: 11:24 2 February 2009

@neurIST complex informationprocessing toolchain for the integratedmanagement of cerebral aneurysms
M. C. Villa-Uriol1,2,*, G. Berti4, D. R. Hose5, A. Marzo5,A. Chiarini6, J. Penrose7, J. Pozo1,2, J. G. Schmidt8, P. Singh5,
R. Lycett5, I. Larrabide2,1 and A. F. Frangi1,2,3
1Centre for Computational Imaging and Simulation Technologies in Biomedicine (CISTIB),Information and Communication Technologies Department, Universitat Pompeu Fabra,
2Networking Research Center on Bioengineering, Biomaterials and Nanomedicine(CIBER-BBN), and
3Institucio Catalana de Recerca i Estudis Avancats (ICREA), c/ Tanger 122–140, E08018Barcelona, Spain
4Consulting in mathematical methods, Bonn, Germany5Medical Physics Group, Faculty of Medicine, University of Sheffield, Sheffield, UK
6BioComputing Competence Centre SCS s.r.l., Casalecchio di Reno, Italy7ANSYS UK, Ltd, Abingdon, UK
8University of Applied Science Koblenz, Germany
Cerebral aneurysms are a multi-factorial disease with severe consequences. A core part of theEuropean project @neurIST was the physical characterization of aneurysms to find candidaterisk factors associated with aneurysm rupture. The project investigated measures based onmorphological, haemodynamic and aneurysm wall structure analyses for more than 300cases of ruptured and unruptured aneurysms, extracting descriptors suitable for statisticalstudies. This paper deals with the unique challenges associated with this task, and theimplemented solutions. The consistency of results required by the subsequent statisticalanalyses, given the heterogeneous image data sources and multiple human operators, wasmet by a highly automated toolchain combined with training. A testimonial of the success-ful automation is the positive evaluation of the toolchain by over 260 clinicians duringvarious hands-on workshops. The specification of the analyses required thorough investi-gations of modelling and processing choices, discussed in a detailed analysis protocol.Finally, an abstract data model governing the management of the simulation-related dataprovides a framework for data provenance and supports future use of data and toolchain.This is achieved by enabling the easy modification of the modelling approaches and solutiondetails through abstract problem descriptions, removing the need of repetition of manualprocessing work.
Keywords: cerebral aneurysms; computational imaging and modelling;computational physiology; virtual physiological human
1. INTRODUCTION
Cerebral aneurysms are local pathological dilatations ofarteries in the brain causing significant morbidity andmortality rates [1]. A large proportion (1–5%) of thepopulation has unruptured aneurysms. Once an aneur-ysm ruptures, subarachnoid haemorrhage (SAH) usuallyoccurs, and the impact is devastating. After SAH,patients have a 45 per cent 30 day mortality rate, andan estimated 30 per cent of survivors present moderate-
to-severe disability. As a consequence, SAH induces aserious burden for patients, their relatives and society.
A considerable debate regarding the optimal treat-ment of patients harbouring unruptured intracranialaneurysms has developed in recent years, stemming lar-gely from the influence of several factors. Among themstand out the impact of recent technological improve-ments on diagnostic and interventional imaging, theappearance of a new generation of therapeutic devices,and the increase in the number of large-scale, random-ized, multi-institutional studies centred in the outcomeevaluation of existing treatments [2] as well as theevolution of unruptured aneurysms [3]. The combinationof these factors and the sometimes contradictory
*Author for correspondence ([email protected]).
One contribution of 17 to a Theme Issue ‘The virtual physiologicalhuman’.
Interface Focus (2011) 1, 308–319doi:10.1098/rsfs.2010.0033
Published online 6 April 2011
Received 16 November 2010Accepted 8 February 2011 308 This journal is q 2011 The Royal Society

conclusions introduced by these studies have led to con-siderable uncertainty about the optimal treatment forpatients harbouring unruptured intracranial aneurysms.
These efforts from the clinical community havecaused an increasing interest in modelling the complexmulti-factorial mechanisms thought to be involved inaneurysm genesis, growth and rupture, which includegenetic, physical and environmental factors. Thisglobal approach to the disease links with the wide inter-national interest in the construction of an integrated insilico human. The ‘IUPS Physiome’ [4,5] provides theframework for a hierarchy of models spanning thelength scales from the molecule to the individual. Otheractivities exploring the development of multi-scale andmulti-disciplinary physiological models up to specificorgan level have resulted in the development of the vir-tual physiological human (VPH) [6–8], in the contextof which we could frame this work.
1.1. The @neurIST project
This work was developed as part of the European project‘Integrated Biomedical Informatics for the Managementof Cerebral Aneurysms’ (@neurIST; http://www.aneurist.org) [9,10]. @neurIST was a 4 year project started in2006 with a 17 million euro budget, gathering 28 publicand private institutions of 12 European countries,including industrial, medical and academic institutions.Several organizations from the USA, New Zealand andJapan participated as external collaborators. Themission statement of the project was the following:
@neurIST will transform the management ofcerebral aneurysms by providing new insights,personalized risk assessment, and methods for thedesign of improved medical devices and treatmentprotocols.
To fulfil this mission, four software suites (@neuRisk,@neuLink, @neuFuse and @neuEndo) and two infra-structure components (@neuCompute and @neuInfo)were developed to collaborate with each other [11–13].@neuRisk provides personalized risk assessment andtreatment guidelines to practitioners based on the ana-lyses performed by the other three suites. @neuLinkenables not only the study of the existing links betweengenetics and disease, but also provides links to thebiomechanical indices extracted from @neuFuse. @neu-Fuse addresses the patient data fusion from differentmodalities and the extraction of such biomechanicalindices. @neuEndo works closely to the other threesuites facilitating the optimization and customizationof medical devices used for patient treatment. Thetwo infrastructure components allowing the intero-perability and collaboration of the suites are@neuCompute, by providing high-performance-distrib-uted computing capabilities, and @neuInfo, byenabling a homogeneous data access and storage tothe heterogeneous data types handled in the suites. Amore detailed description of the @neurIST systemarchitecture is provided in Benkner et al. [14], wherethe authors introduce the developed service-orientedIT infrastructure supporting the seamless access to
distributed medical data and computational resourcesin an easy and secure manner.
From the previous, one can understand the role that@neurIST has in tackling a disease in a global manner,a concept which directly links to the VPH. Thedeveloped multi-scale paradigm could be extended toother diseases.
1.2. Finding biomechanical risk factors:approach and challenges
This paper describes the @neurIST complex infor-mation processing toolchain approach to providephysical models of cerebral aneurysms and deriverepresentative descriptors that could be associatedwith their rupture.
To create a comprehensive basis for investigatingpotential physical risk factors, the project aimed tocompute for a large number of cases many differentcharacterizations based on the analysis of shape,blood flow (haemodynamics) and wall mechanics. Toenable statistical analyses, the typically continuousoutput of these analyses had to be reduced to a finitenumber of descriptors suitable for finding statisticalassociations that would help understanding the naturalhistory and the risks of available treatments.
To this end, @neurIST collected extremely hetero-geneous data that included patient’s clinical history,images and blood samples, for more than a total of1400 patients with ruptured and unruptured aneur-ysms. Our goal was then to compute the whole set ofphysical characterizations mentioned before for thenearly 500 patients having associated medical images.
To reach these goals, we had to face three major chal-lenges. First, to determine the details of the mostrepresentative biomechanical analyses to be performedand select the most meaningful physical descriptorsthat could be derived (§2). Second, to enable perform-ing multi-case, multi-operator and multi-site analysesguaranteeing consistency and repeatability amongusers and processing sites, and to reduce the manualwork needed (§3). And third, to preserve the prove-nance of the derived descriptors, to link back to theclinical data, and to permit revisions of the modellingdecisions, allowing for future variations and extensionsof the analysis (§4).
Section 5 gives an account on our practical experi-ence with using the toolchain. Among others, thework needed to synchronize between different proces-sing teams and feedback collected from exposure toclinicians, i.e. non-experts with respect to the tools.Finally, we discuss how relevant these results are forclinical practice and VPH research in general.
2. CHALLENGE 1: BIOMECHANICALMODELLING AND DESCRIPTORS
The first challenge faced while designing the @neurISTtoolchain was to identify the set of most representativebiomechanical descriptors suitable for performingrisk assessment and association studies, and to identifythe most appropriate computational model of theunderlying physical problem. Along the lines set by
@neurIST complex information processing M. C. Villa-Uriol et al. 309
Interface Focus (2011)
panks
Highlight
panks
Highlight
panks
Highlight
panks
Highlight

Ma et al. [15] and Ma [16], three general analyses werechosen to be performed: morphological, haemodynamicand structural. These analyses have been linked in theliterature to aneurysm genesis, growth and rupture[17–19]. Evidence indicating differences in morphology[20–23] and flow [18,24] between ruptured and unrup-tured aneurysms have been shown for reduced patientcohorts. Structural wall mechanics [25–28] has beenused to justify the growth and remodelling happeningat the aneurysm level.
The balance between merits and demerits of eachanalysis is sketched in figure 1. The theoretical levelof confidence in the physical measures on which eachof the analyses are based and the direct diagnostic capa-bility derived from them varies inversely depending onthe analysis. As an example, morphological characteriz-ations have the least requirements in terms of thephysical measures, only depending on the anatomicalinformation extracted from the medical image. This isopposed to the difficulties in obtaining the physicalmeasures needed to perform haemodynamic and struc-tural analyses in this order of complexity. In the caseof haemodynamics, the exact boundary conditions(inlet, outlet and wall movement) are usually unknown.For structural analysis, the situation is worse, as lackof information on the aneurysm wall (thickness, indivi-dual material properties) limits the analysis to providequalitative results only. In contrast, the theoreticaldiagnostic capability would certainly be highest for aquantitatively correct wall mechanics analysis, as stres-ses exceeding the strength of the wall could be moredirectly associated with the mechanical processes indu-cing growth and remodelling phenomena and, therefore,linked to the event of rupture. Nevertheless, practically,morphological characterizations might currently havethe highest predictive capabilities with respect to theother analyses.
Once these analyses were chosen, based on prior evi-dences found in the literature, and especially in the case
of the haemodynamic and structural analyses, theimmediate need was to decide what to simulate andhow to perform such simulations. Unfortunately, thereis not a clear answer to this problem. Each of themodelling choices presented trade-offs [30] and neededto be judged in the light of the available input dataand intended purpose of the output.
To address these issues, an analysis protocol wasdeveloped in two stages. During the first stage, an initialversion of the protocol was created and where the funda-mental alternatives were identified, the core processingsteps and data entities were specified and the topicsthat needed further exploration were highlighted. As anexample of the last, the need for performing sensitivitystudies was discussed. An external scientific advisoryboard of experts reviewed the protocol and raised severalquestions, including the need of performing linear versusnonlinear wall mechanics studies, using moving versusfixed wall boundary conditions for haemodynamics,employing coupled or isolated models (fluid structureinteraction being an option) and using a personalizedversus generic systemic model.
As a result, a second version of the protocol waswritten [29] providing a high-level tool-independentdescription of the processing chain, clearly describingeach major operation with the specification of inputsand outputs. In addition, it included references to severalof the studies carried out by the project to evaluateaspects such as the sensitivity of flow simulations to theimaging modality [31] and inlet boundary conditions set-ting [32], and the relationship between patient-specificand generic boundary conditions [33].
3. CHALLENGE 2: IMPLEMENTATION OFTHE TOOLCHAIN
The second challenge was to enable multi-case,multi-user and multi-site analyses, which guaranteed
medical images
+
+–
–
morphologicalcharacterization
morphological descriptors(size, aspect ratio)
haemodynamicanalysis
haemodynamicdescriptors
(wall shear stress, flow,pressure...)
structural descriptors(deformation, strain,
stress...)
structuralanalysis
boundary conditionsconstitutive equations
boundary conditionsconstitutive equations
confidence inphysical measures
direct diagnosticcapability from
derived descriptors
Figure 1. The theoretical diagnostic power (right) versus the practical reliability of physical measures (left) of the differentanalysis modes are inversely related [29].
310 @neurIST complex information processing M. C. Villa-Uriol et al.
Interface Focus (2011)

consistency and repeatability among operators and geo-graphically disperse processing sites, while minimizingthe amount of required user manual intervention. How-ever, some steps had to remain under user control andconsiderable efforts had to be devoted to synchronizethe different operators in the various processingteams. In the current section, the actual implemen-tation of the toolchain is discussed, highlighting theefforts made to automate or semi-automate it. The tool-chain encompassed the whole process from reading amedical image to the extraction of the morphological,structural and haemodynamic descriptors selected inthe analysis protocol. These were combined withinformation available from the patient record andstored within a structured data repository, as describedin §4.
3.1. Vascular geometry creation
All three analyses specified in the analysis protocol getas an input a surface mesh. Therefore, the first stage inthe toolchain proceeds to create a vascular geometryfrom a three-dimensional rotational angiographicimage (3DRA). This imaging modality is currentlyconsidered the gold standard [34,35] for aneurysmdetection owing to its superior spatial and contrast res-olution. A three-dimensional triangulated surface meshis obtained using an automatic segmentation methodbased on geodesic active regions (GAR) in combinationwith an image standardization technique [36,37],recently presented and validated by Bogunovic et al.[38]. The method eliminates most of the dependencyon the operator, and on the specific imaging protocolsand equipment used. The only possible choice for theoperator is the selection of the region of interest to besegmented as opposed to other methods such as themanual iso-intensity surface extraction (ISE), where inaddition the selection of a threshold is left to the oper-ator. While the impact of the selection of the region ofinterest for both methods has shown to be negligible,GAR outperformed ISE qualitatively and quantitat-ively for 3DRA and time of flight magnetic resonanceangiographic images obtained from clinical routinewhen compared with manual measurements performed
by clinicians. The dependency on the equipment usedto image the patient is removed, thanks to the use ofa training set and standardized images. The impact ofthe selection of images to build a training set has alsoshown to be minimal when compared with theinter-observer variability among clinicians when per-forming manual measurements. In terms of executiontime, it was able to segment a region of interest witha size of 2563 voxels in 17+ 4 min (average+ standarddeviation) on a standard personal computer withan Intel quad-core 2.4 GHz processor and 4GBof memory.
Once the segmented surface mesh is available, it ismanually manipulated to remove some of the artefactsnot belonging to the cerebral vasculature or not relevantfor the subsequent analyses (figure 2). A skeletonizationalgorithm [39] is used to extract the skeleton (medialaxis) of this geometry. The skeleton acts as a referenceto perform the perpendicular cuts where the flow bound-ary conditions need to be set, and as the linking point tothe three-dimensional model of the human systemic cir-culation [40]. This first step in the toolchain is criticalbecause the resulting vascular geometry is used as thebasis for all further analyses. The impact of the chosenimaging modality and the quality of the image mighthave a strong influence in quantitative parametersextracted from flow simulations [31]. Therefore, therole of the operator in accepting or rejecting the imagesbased on their quality before they are processed is funda-mental for the accuracy of subsequent analyses. In ourexperience in @neurIST, the approximate discard rateof 3DRA images for all clinical centres involved in thedata collection was between 30 and 40 per cent.
3.2. Morphological characterization chain
A collection of morphological descriptors of variouscomplexity was selected among the wide variety avail-able in the literature [21,22]. Basic size indices such asaspect ratio [20], non-sphericity index [22], aneurysmvolume and surface area are calculated for the aneurysmsac. Aspect ratio relates the aneurysm depth and neckwidth, while non-sphericity index relates the aneurysmvolume and surface area. To isolate the aneurysm sac,
(a) (b)
Figure 2. Examples of typical topological problems introduced during the segmentation because of low image quality: (a) touchingvessels and (b) missing vessels.
@neurIST complex information processing M. C. Villa-Uriol et al. 311
Interface Focus (2011)

the aneurysm neck is manually delineated as shown infigure 3. A set of more sophisticated descriptors calledthree-dimensional Zernike moment invariants [23,41]are also used to characterize the aneurysm shape anda portion of the surrounding feeding vessels using afixed cutting protocol at every inlet and outlet. Three-dimensional Zernike moments provide a completethree-dimensional morphological characterization ofobjects, and their invariants remove scale and orien-tation dependency. These have shown for a smallheterogeneous population promising rupture predictionrates [42]. Finally, inlet and outlet vessel diameters arealso calculated at the cut planes used to isolate the geo-metry for which the Zernike moment invariants arecomputed. All of these descriptors are automaticallycomputed in real time from the isolated geometries ofthe sac and aneurysm plus a portion of the surroundingfeeding vessels.
3.3. Haemodynamics analysis chain
Two complementary haemodynamic analyses are car-ried out as part of this chain: a global one and a localone, with an optional uni-directional coupling betweenthem. The global one is based on a one-dimensionalmodel of the human systemic circulation [40], includingthe main arteries of a complete circle of Willis, and pre-dicts flow rate and pressure waveforms at predefinedpoints (figure 4). The local analysis uses the fullthree-dimensional geometry near the region of interest,obtained by clipping the three-dimensional geometry atappropriate places [29,32].
As no patient-specific measurements of flow propertiesat the openings defined by the clipping are generally avail-able, the results of the one-dimensional global analysis canbe used to obtain boundary conditions for the local three-dimensional analysis. Using the skeletonized represen-tation of the three-dimensional vasculature in the regionof interest calculated during the vascular geometry extrac-tion stage, the operator manually defines perpendicularclipping planes and links the appropriate nodes of the
one-dimensional circulation model to the correspondingpoints of the three-dimensional inlet and outlet boundaries,thus defining the boundary conditions for the three-dimen-sional model (figure 4).
The set of qualitative and quantitative descriptors (can-didate risk factors) defined by the analysis protocol wereextracted from the flow solution automatically, except afew qualitative ones such as flow stability and intra-aneur-ysmal flow type (figure 5) requiring expert judgement.Quantitative volumetric measures were performed withinthe aneurysm and at the neck. These included the maxi-mum and mean velocities defined at peak systole andaveraged over the cardiac cycle. Similarly, other measureswere computed on the model surface, including areas ofelevated pressure, impingement jet location, maximumstatic pressure on the wall at peak systole and the wallshear stress and derivates such as the oscillatory shearindex. Some of these measures are highly dependent onthe location of the aneurysm neck, which unfortunatelyhad to be manually defined as already mentioned in themorphological analysis. There have been several effortsin the literature aimed to solve this problem in anautomated way, but to date none has been ableto extract the aneurysm neck reliably in the general case[43–46].
The analysis protocol chose to model the transientblood flow by the Navier–Stokes equations under theassumption of rigid walls and a simple Newtonian rheo-logy model with blood density of 1060 kg m23 andviscosity of 0.0035 Pa s.
The production runs were performed using a com-mercial three-dimensional flow solver ANSYS CFX(Ansys Inc., Canonsburg, PA, USA), which is a finite-volume computational fluid dyamics (CFD) codesolving for the Navier–Stokes flow equations across anunstructured three-dimensional discretization (knownas mesh) of the vasculature volume. Such mesh was gen-erated by the ANSYS ICEM 3D (Ansys Inc.) meshgenerator that labelled the aneurysmal interior in acompletely automatic manner.
3.4. Structural analysis chain
Of all types of analyses in figure 1, an ‘accurate’ structuralanalysis would have the largest predictive capabilities.Nevertheless, in practice it also is the analysis requiringthe most assumptions and simplifications. Still it can behoped to gain information about risk factors [28]. In@neur-IST, and owing to the lack of patient-specific data, theassumptions being made included averaged material prop-erties and aneurysmal wall thickness and spatially andtemporally constant pressure, for simplicity assumed atdiastole. However, the membrane code FEANOR [47],developed specifically for @neurIST, computes the zero-load state of the aneurysm under the above assumptions,which is a first step towards more realistic wall mechanicssimulation.
The thickness of the aneurysm wall was set to a con-stant value of 86 mm, the thickness of the vessel wall to500 mm, and was linearly interpolated in a transitionregion (figure 6a). Owing to this thin wall, computingthe zero-load state is a numerically delicate process
Figure 3. Example of the manual delineation of the aneurysmneck implemented in the @neurIST toolchain.
312 @neurIST complex information processing M. C. Villa-Uriol et al.
Interface Focus (2011)

(figure 6) and great effort was required to make thisnumerically stable and hence automatic.
Two different protocols are supported. The first oneuses a nonlinear material model and computation of azero-load state, and the second uses a linear materialmodel assuming zero stresses at diastole. Given theessential uncertainties in quantitatively estimating themodel parameters, the characteristic measures includeonly relative measures like ratio of areas exceedingcertain thresholds of maximum stress and strain, asthese are expected to be less sensitive to variations ofthe unknown patient-specific values of aneurysm wallthickness and material properties.
4. CHALLENGE 3: A MODEL FOR@NEURIST SIMULATION DATA
4.1. Motivation and overview
The third challenge was to preserve the provenance ofthe derived descriptors, to be able to link back to the
clinical data and to permit future revisions of the mod-elling decisions, allowing for future variations andextensions of the analysis. This concern was partiallyoriginated by the huge amount of manual work goinginto the toolchain and into the data processing, despitethe level of automation and semi-automation achievedduring the implementation of the toolchain. Moreover,feeding the results into the sophisticated data miningmachinery of @neuLink [11] meant that various subsetsand combinations of the result data were possiblyneeded, in order to select statistically meaningfulgroups of cases and to provide the greatest flexibilityin the search for patterns.
The answer was to design a systematic model of thedifferent data entities involved to facilitate meetingthese requirements. Relationships, mutual dependenciesand history (provenance) needed to be clearly captured.In contrast to the general approaches for provenancerecording described in Simmhan et al. [48], ourapproach is geared towards the specific needs of the@neurIST project. According to the taxonomy of
Figure 4. A view of the @neurIST one-dimensional model.
8.665e – 001 3.557e + 000
2.667e + 000
1.778e + 000
8.891e + 000
0.000e + 000
6.499e – 001
4.333e – 001
2.166e – 001
0.000e – 001
0 0.002 0.004 (m)
0.001 0.003z
x
(m s–1) (m s–1)
0 0.002 0.004 (m)
0.001 0.003z
x
Figure 5. Example of unstable flow from (a) end diastole and (b) peak systole.
@neurIST complex information processing M. C. Villa-Uriol et al. 313
Interface Focus (2011)

Simmhan et al. [48], we use a coarse-grained and some-what abstracted replication recipe (see also below §4c onabstract problem descriptions (APDs)). At the sametime, to maximize opportunities for future use, the enti-ties in this model had to be represented in a sufficientlygeneral way in order to distinguish from details specificto concrete tools and applications. That is, to abstractfrom information which will become obsolete sooneror later. This application-neutrality was alreadyrequired within the @neurIST complex informationtoolchain, as it was designed to support different solversfor the same computational problem (e.g. ANSYS CFXand a Lattice–Boltzmann code for haemodynamics).
Our solution thus consisted of the followingingredients:
— A relational data model (using structured querylanguage (SQL) as data definition language) linkingthe important classes of simulation (or ‘derived’)data to the clinical data, hence ‘derived datamodel’ (DDM).
— A set of tools automatically translating the abstract,application-neutral description of the DDM intocomplete input specifications for concrete simulationapplications.
— A strategy for storing and retrieving bulk data, likeraw simulation results, images, etc. While most ofthe bulk data is application-specific and can bereproduced using the high-level data and the twotools just mentioned, it may be worthwhile to keepit for a certain period of time, e.g. for visualizationand review purposes.
4.2. A relational data model for derived data
The DDM forms the core of these developments. Ahigh-level overview in the form of an entity-relationship(ER) diagram is shown in figure 7. The DDM coveredthe following major entities.
— Aneurysm. The anatomical structure in the focus ofinterest.
— Image (split in imagingStudy and imagingSeries). Amedical image of the region of interest.
— Processed geometry. A valid geometric representationof one or more aneurysms with anatomically correcttopology.
— Analysis. A high-level description of a computationalmodel, e.g. blood flow through the vasculature sur-rounding an aneurysm.
— Run. An actual computation of an analysis with asimulation programme.
— Index. A discrete1 characterization of an aneurysm,e.g. aspect ratio, collection of three-dimensionalZernike moment invariants or maximal wall shearstress inside the aneurysm.
— Experiment. A group of similar analyses suitable forfinding statistical correlations.
Some of these entities (namely aneurysm and image)contained references to their counterparts in clinicaldatabases that may be enhanced with additional infor-mation, such as image quality. The clinical databasescontaining the anonymized patient’s clinical recorduse their own data model developed in the project,the @neurIST clinical reference information model(CRIM). The DDM was kept deliberately separatefrom the CRIM to minimize dependencies.
The central use case of the DDM in our contextof finding risk indicators is the ability to retrieve ans-wers to questions (known as queries) like ‘for a set ofaneurysms, retrieve rupture status and values of bio-mechanical characterizations A, B, and C’. This querycould easily be refined by restriction to aneurysms incertain locations, or by excluding cases with certainirregularities (like bad image quality), and so on.
An important means to form meaningful groups ofcomparable analyses is the experiment entity. Forinstance, we used two different experiments for the wallmechanics analyses, one using a linear material model,and one using a non-linear model with computation ofa zero-load state. Another example of use of experimentsis for different conventions for geometry clipping in shapeanalysis. Clearly, it does not make sense to mix analy-ses pertaining to different experiments in a statisticalevaluation.
4.3. Handling bulk data
The storage of the actual bulk data (meshes, picturesand full simulation results) can be handled in a quiteflexible way, as the data model provides a placeholder
(a) (b)
Figure 6. Computing the zero-load state leads to considerable wrinkling and is numerically delicate. (a) Computed zero-loadconfiguration (with assumed thickness) and (b) stresses at 120 mmHg computed by using the nonlinear material model.
1I.e. a small, finite set of values, as opposed to a continuum like apressure field, which is not usable in a statistical clustering analysis.
314 @neurIST complex information processing M. C. Villa-Uriol et al.
Interface Focus (2011)

for each such data entities, with the necessary meta-data as to where and how it is stored. Smaller datalike surface meshes can even be stored directly in adata base management system (DBMS) as binarylarge object (BLOB). Data stored outside the DBMScan be referenced by URLs, or most generally, by end-point references (EPR), containing the details foraddressing a service delivering the data.
An important criterion to support decisions aboutwhether to store a particular piece of data, such asraw simulation results or processed geometries, is thecost associated to (re-)generate them. This can be com-putational costly as well as, and more importantly, theamount of manual work needed to create them. For thecase of the @neurIST toolchain, this differentiates pro-cessed geometries, possibly requiring a lot of manualwork, see §3a, from simulation results, which can begenerated automatically from their APDs, a conceptwe will discuss in more detail next.
4.4. An important concept: abstract problemdescriptions
An APD is a high-level definition of a computationalbiomechanical problem, like a blood flow analysisthrough an aneurysm and surrounding vasculature.Despite their high-level nature, they contain or refer-ence all information needed to generate input for any
concrete simulation application run computing theanalysis. There could be different runs using differentapplications for the same analysis, which should yieldthe ‘same’ results (up to some limit of accuracy). Setsof different runs could be used for verification of thesolver-independence of results.
The conversion of an APD into a concrete simulationinput and the subsequent run is, in principle, a comple-tely automatic task, as the APD contained all relevantinformation; all necessary pieces of data needing humanintervention are generated and stored before creatingthe APD. In practice, the feasibility of automation iscertainly dependent on the application; in the case of@neurIST, we fully automated this step for the sup-ported simulation packages. An exception to this ruleare some qualitative characterizations that inevitablyrequired human intervention.
The precise but application-neutral representation ofbiomechanical problems in the APDs enables theirlong-term storage, making them insensitive to the riseand fall of simulation applications, or just incompatibil-ities between versions. For instance, we integrated twofundamentally different types of CFD solvers. First,ANSYS CFX based on a finite volume scheme onunstructured meshes, and, second, a Lattice–Boltz-mann solver, based on regular structured grids (thelatter was not used for production runs). Basically,this meant implementing specific preprocessors
examed in imagingStudy
P. has aneurysm
G coversderived from P
S covers
G. based on
A. based on
R. based onI. based on
A. based on
A. part of
processedGeometry
systemic_modelI describes
index_XYZ_ABC
experiment_XYZ
run_XYZ analysis_XYZ
imagingSeriesconsists ofpatient1 0..N
0..N1
1 1
1
1
1
1 11
1
1
0..N
0..N
0..N 0..N
0..N
1..N
0..M
0..N
0..N 0..N
1 1..N
Figure 7. An entity-relationship diagram of the @neurIST derived data model [29]. Grey entities link to their counterparts in theclinical reference information model (CRIM) developed in the project, white ones to derived (i.e. computed) data. The diamond-shaped boxes describe the relationship of two entities, and the numbers give their multiplicities. For example, a processed geo-metry is based on exactly one imaging series, and each imaging series is the basis for 0 up to N processed geometries. The suffixXYZ is a placeholder for the different types of analysis.
@neurIST complex information processing M. C. Villa-Uriol et al. 315
Interface Focus (2011)

translating the APD into either ANSYS CFX or Lat-tice–Boltzmann input. The abstractness of therepresentation also facilitates automatic transformationof analyses to yield variants implementing differentexperiments. For instance, it would be easy toimplement features like changing the generation ofboundary conditions or using a different materialmodel. Such automatic transformations pave the wayto practical future uses of the results, like doing para-metric studies or setting up completely new modellingapproaches.
5. PRACTICAL EXPERIENCE
Even if the degree of automation accomplished in theimplementation of the complex information toolchainis beyond the state of the art, it was not sufficient toachieve consistent results across the different processingteams. To achieve this, training was fundamental, andverification of the level of understanding of the case pro-cessing rules was mandatory. To evaluate the overallimpact of the operator decisions on the final-deriveddescriptors, six patient images were chosen as demonstra-tors and were fully processed by eight representatives ofthe processing teams. The objective was to synchronizethe results of the operators for the shape, structural andhaemodynamic analyses.
Several rounds of this synchronization were neededbefore a common agreement was reached and a set ofaccurate guidelines could be distilled. This process wassimpler in the case of the morphological analysis andonly two rounds were needed. As an example of theimportance of this process, see in figure 8 the surprisingvariability in the results for some operators after the firstsynchronization iteration. In the case of the haemo-dynamic analysis, the synchronization took longerbecause of the elevated complexity of this chain as wellas the impact that operator decisions could have on thefinal simulation results. Still, agreement was reached inthe end and the @neurIST case processing was started.
In total, 15 operators from four case processingcentres were involved and fully processed images fromfive hospitals producing descriptors for more than 300aneurysms. The essential data items created duringthis process were stored using the mechanism describedin §4 and are thus available for future work. Statisticalassociations are currently being analysed betweenthese descriptors and the aneurysm rupture statusinformation, among others.
In addition, we also wanted to evaluate the suit-ability of our toolchain for clinical practice. In thisspirit, and to gain useful feedback, the toolchain hasbeen officially exposed to more than 260 neurointerven-tionists, neurosurgeons and neurologists for theirevaluation through hands-on workshops at differentpublic events, where the participants worked under gui-dance through a simple case, from medical image to athree-dimensional blood flow simulation. They achievedresults comparable to those obtained by experts users,with similar performance.
The main venues have been the 1st and 2nd Euro-pean Society for Minimally Invasive Neurovascular
Treatment (ESMINT) Teaching Courses, respectively,held in Lisbon, Portugal (7–12 September 2008) andBarcelona, Spain (13–18 December 2009), the 4thInternational Conference on Computational Bioengi-neering, Bertinoro, Italy (16–18 September 2009), theXIV World Congress of Neurological Surgery, Boston,USA (30 August–4 September 2009) and the SimposioInternacional de Neuroradiologıa Intervencional,Santiago de Chile, Chile (26–27 November 2009).
The collected feedback was used to further improvethe subsequent releases of the toolchain. Some of theconclusions reached during the 1st ESMINT TeachingCourse were reported and described in Singh et al.[49]. In general, clinicians recognized shortcomings incurrent management of cerebral aneurysms and theneed for better understanding of the disease and theidentification of novel and more efficient risk descrip-tors. Although most clinicians believe that physicalcharacterization (mainly haemodynamics at that work-shop) may offer better diagnostic value, there is a clearlack of awareness concerning the role of haemodynamicsin the aetiopathogenesis of cerebral aneurysms and theuse of CFD in this context.
6. DISCUSSION
A number of unique challenges were associated with thelarge-scale multi-case, multi-operator and multi-sitebiomechanical processing undertaken by @neurIST.The solutions we have developed to meet these chal-lenges are, we believe, of interest not only for the fieldof aneurysm research, but also beyond that for thelarger VPH community studying other diseases.2
The toolchain itself was developed and automated toa degree which proved sufficient to process more than300 aneurysms minimizing and quantifying the impactof human operators, either by ensuring synchronizationamong operators through training or by performing
operator 1 operator 2 operator 3
operator 4 operator 5 operator 6
Figure 8. Results for the first synchronization round showingthe differences among six of the eight operators during themanual isolation of the region of interest. Operators 1, 2 and4 showed significant discrepancies with the correct geometriesisolated by operators 3, 5 and 6.
2Parts of the toolchain are available through the @neurIST web sitehttp://www.aneurist.org/, as well as the data model SQL definitionand the final analysis protocol document. Currently, there areefforts in the direction of making derived data available through theEuropean Society of Minimally Invasive Neurological Therapy(ESMINT) society http://www.esmint.eu/.
316 @neurIST complex information processing M. C. Villa-Uriol et al.
Interface Focus (2011)

several sensitivity studies. Also, more than 260 clini-cians ran full blood flow simulations starting frommedical images, using our toolchain during internation-ally renowned hands-on events. Their feedbackconvinced us that these kinds of tools will find theirway into clinical practice. All together, the amount ofpractical usage, testing and continual improvementbased on user feedback of this toolchain certainly sur-passes that of most similar research-oriented efforts.There is, however, still room for improvements.
Our analysis protocol [29], with its detailed specifica-tions and ample discussion of limitations versusmodelling alternatives, is an ideal starting point for con-tinuing and extending our efforts. It can also serve as ablueprint for transferring the approach to other dis-eases, which should be straightforward for vasculardiseases.
The analysis of the biomechanical characterizationswith respect to their diagnostic value is still ongoing.Some preliminary works [42,50–53] have already usedthe toolchain on a reduced number of cases. However,it can be expected that the larger the number ofcases, the statistically more reliable conclusions will beachieved compared with similar prior works [53], butalways under the strong and arguable assumptionthat aneurysms do not change over time.
Using the toolchain to simulate flow in the presence ofvirtual endovascular devices such as stents [54] currentlyallows evaluating the performance of endovasculardevices from a haemodynamic point of view [55,56], ben-efitting from the ability of setting boundary conditionsbased on a one-dimensional model of the systemic circu-lation [32,33,40]. The inclusion in the project of geneticsdata has rendered already relevant results [57] to thescientific community in identifying three new risk loci,which still need to be linked to biomechanical factorsthrough @neuLink [12].
The results of our processing are organized using theDDM and are available for future extensions of the ourwork, both by adding new cases or by varying the model-ling approach. In this case, it might be interesting toenable the toolchain to investigate effects of certaindrugs on blood viscosity and hence on the computedflow characterizations. The prospect of being able to runlarge-scale computational experiments with these manycases without having to invest a lot of human effort intomanual case-by-case model adaptation is exciting.
We believe that our approach has the potential toserve as a model for organizing large-scale multi-casesimulation in the VPH context in general, as it supportslooking both into the past, by providing provenanceinformation, and into the future, by providing ameans to modify toolchain details (like replacingspecific solvers) and to transform problem descriptionsto support alternative modelling choices. Currently,the model only supports the coupling between the sys-temic and the local three-dimensional haemodynamicsanalyses; a particularly promising path for future evol-ution is to add explicit support for coupling betweendifferent analyses on different scales.
This work was supported by the @neurIST Integrated Project(co-financed by the European Commission through the
contract no. IST-027703). The authors would also like tothank for their contribution to the processing of cases aswell as to the implementation of the toolchain the followingresearchers: C. Valencia, H. Tahir, H. Morales, A. J. Geers,M. Aguilar, M. Kim, C. Bludszuweit, D. Capdeferro,P. Watton, M. Giacomoni, H. Bogunovic, A. Radaelli andK. McCormack.
REFERENCES
1 Brisman, J., Song, J. & Newell, D. 2006 Medical progress:cerebral aneurysms. New Engl. J. Med. 355, 928–939.(doi:10.1056/NEJMra052760)
2 Molyneux, A. J. & the International Subarachnoid Aneur-ysm Trial (ISAT) Collaborative Group. 2002 Internationalsubarachnoid aneurysm trial (ISAT) of neurologicalclipping versus endovascular coiling in 2143 patientswith ruptured intracranial aneurysms: a randomisedtrial. Lancet 360, 1267–1274. (doi:10.1016/S0140-6736(02)11314-6)
3 Wiebers, D. & the International Study of the UnrupturedIntracranial Aneurysms Investigators. 2003 Unrupturedintracranial aneurysms: natural history, clinical outcome,and risks of surgical and endovascular treatment. Lancet362, 103–110. (doi:10.1016/S0140-6736(03)13860-3)
4 Hunter, P., Robbins, P. & Noble, D. 2002 The IUPShuman physiome project. Eur. J. Physiol. 445, 1–9.(doi:10.1007/s00424-002-0890-1)
5 Hunter, P. & Borg, T. 2003 Integration from proteins toorgans: the physiome project. Nature 4, 237–243.(doi:10.1038/nrm1017)
6 STEP Consortium. 2007 Seeding the EuroPhysiome: aroadmap to the virtual physiological human. See http://www.europhysiome.org/roadmap.
7 Fenner, J. et al. 2008 The EuroPhysiome, STEP and a road-map for the virtual physiological human. Proc. R. Soc. A366, 2979–2999. (doi:10.1098/rsta.2008.0089)
8 Viceconti, M., Clapworthy, G. & Van Sint Jan, S. 2008The virtual physiological human—a European initiativefor in silico human modelling. J. Physiol. Sci. 58, 441–447. (doi:10.2170/physiolsci.RP009908)
9 Iavindrasana, J. et al. 2008 The @neurIST project. Stud.Health Technol. Inform. 138, 161–164.
10 Dunlop, R. et al. 2008 @neurIST—chronic disease man-agement through integration of heterogeneous data andcomputer-interpretable guideline services. Stud. HealthTechnol. Inform. 138, 173–177.
11 Arbona, A., Benkner, S., Engelbrecht, G., Fingberg, J.,Hofmann, M., Kumpf, K., Lonsdale, G. & Woehrer, A.2007 A service-oriented grid infrastructure for biomedicaldata and compute services. IEEE Trans. Nanobiosci. 6,136–141. (doi:10.1109/TNB.2007.897438)
12 Friedrich, C. M., Dach, H., Gattermayer, T., Engelbrecht,G., Benkner, S. & Hofmann-Apitius, M. 2008 @neuLink:a service-oriented application for biomedical knowledgediscovery. Stud. Health Technol. Inform. 138, 165–172.
13 Hofmann-Apitius, M. et al. 2008 Knowledge environmentsrepresenting molecular entities for the virtual physiologi-cal human. Phil. Trans. R. Soc. A 366, 3091–3110.(doi:10.1098/rsta.2008.0099)
14 Benkner, S. et al. 2010 @neurist—infrastructure foradvanced disease management through integration ofheterogeneous data, computing, and complex processingservices. IEEE Trans. Info. Technol. BioMed. 14,1365–1377. (doi:10.1109/TITB.2010.2049268)
15 Ma, B., Harbaugh, R., Lu, J. & Raghavan, M. 2004 Mod-eling the geometry, hemodynamics and tissue mechanics ofcerebral aneurysms. In Proc. of IMECE: ASME Int.
@neurIST complex information processing M. C. Villa-Uriol et al. 317
Interface Focus (2011)

Mechanical Engineering Congress and Exposition,Advances in Bioengineering, pp. 397–398. Washington,DC: ASME. (doi:10.1115/IMECE2004-60024)
16 Ma, B. 2004 Modeling the geometry, hemodynamics, andtissue mechanics of cerebral aneurysms. Ph.D. thesis,University of Iowa, USA.
17 Humphrey, J. & Taylor, C. 2008 Intracranial and abdomi-nal aortic aneurysms: similarities, differences, and need fora new class of computational models. Annu. Rev. Biomed.Eng. 10, 221–246. (doi:10.1146/annurev.bioeng.10.061807.160439)
18 Cebral, J. R., Castro, M. A., Appanaboyina, S., Putman,C. M., Millan, D. & Frangi, A. F. 2005 Efficient pipelinefor image-based patient-specific analysis of cerebral aneur-ysm hemodynamics: technique and sensitivity. IEEETrans. Med. Imag. 24, 457–467. (doi:10.1109/TMI.2005.844159)
19 Villa-Uriol, M. C. et al. 2010 Toward integrated manage-ment of cerebral aneurysms. Phil. Trans. R. Soc. A 368,2961–2982. (doi:10.1098/rsta.2010.0095)
20 Ujiie, H. et al. 1999 Effects of size and shape (aspect ratio)on the hemodynamics of saccular aneurysms: a possibleindex for surgical treatment of intracranial aneurysms.Neurosurgery 45, 119–130. (doi:10.1097/00006123-199907000-00028)
21 Ma, B., Harbaugh, R. E. & Raghavan, M. L. 2004 Three-dimensional geometrical characterization of cerebralaneurysms. Ann. Biomed. Eng. 32, 264–273. (doi:10.1023/B:ABME.0000012746.31343.92)
22 Raghavan, M. L., Ma, B. & Harbaugh, R. E. 2005 Quan-tified aneurysm shape and rupture risk. J. Neurosurg. 102,355–362. (doi:10.3171/jns.2005.102.2.0355)
23 Millan, R., Dempere-Marco, L., Pozo, J. M., Cebral, J. R. &Frangi, A. F. 2007 Morphological characterization of intra-cranial aneurysms using 3-D moment invariants. IEEETrans. Med. Imag. 26, 1270–1282. (doi:10.1109/TMI.2007.901008)
24 Steinman, D., Milner, J., Norley, C., Lownie, S. & Holds-worth, D. 2003 Image-based computational simulation offlow dynamics in a giant intracranial aneurysm.Am. J. Neuroradiol. 24, 559–566.
25 Stehbens, W. 1963 Histopathology of cerebral aneurysms.Arch. Neurol. 8, 272–285.
26 Stehbens, W. 1981 Arterial structure at branches andbifurcations with reference to physiological and pathologi-cal processes, including aneurysm formation. In Structureand function of the circulation, vol. 2 (eds C. J. Schwarz,N. T. Werthessen & S. G. Wolf), pp. 667–693. NewYork, NY: Plenum Press.
27 Seshaiyer, P., Hsu, F., Shah, A., Kyriacou, S. &Humphrey, J. 2001 Multiaxial mechanical behavior ofhuman saccular aneurysms. Comput. Methods Biomech.Biomed. Eng. 4, 281–289. (doi:10.1080/10255840108908009)
28 Ma, B., Lu, J., Harbaugh, R. & Raghavan, M. 2007 Non-linear anisotropic stress analysis of anatomically realisticcerebral Aneurysms. Trans. ASME J. Biomech. Eng.129, 88–96. (doi:10.1115/1.2401187)
29 Berti, G., Hose, R., Marzo, A., Villa-Uriol, M. C., Singh,P. & Lawford, P. 2010 Analysis protocols version 2.See http://www.aneurist.org/UserFiles/File/PUBLIC_DELIVERABLES/ D23v2_v1.2_final.pdf.
30 Taylor, C. & Humphrey, J. 2009 Open problems in compu-tational vascular biomechanics: hemodynamics andarterial wall mechanics. Comput. Methods Appl. Mech.Eng. 198, 3514–3523. (doi:10.1016/j.cma.2009.02.004)
31 Geers, A. J., Larrabide, I., Radaelli, A. G., Bogunovic, H.,Kim, M., van Andel, H. A. F. G., Majoie, C. B., VanBavel,
E. & Frangi, A. F. 2011 Patient-specific computational hemo-dynamics of intracranial aneurysms from 3DRA and CTA:an in vivo reproducibility study. Am. J. Neuroradiol. (doi:10.3174/ajnr.A2306)
32 Marzo, A., Singh, P., Reymond, P., Stergiopulos, N.,Patel, U. & Hose, D. R. 2009 Influence of inlet boundaryconditions on the local haemodynamics of intracranialaneurysms. Comput. Methods Biomech. Biomed. Eng.12, 431–444. (doi:10.1080/10255840802654335)
33 Marzo, A. et al. 2010 Computational haemodynamics incerebral aneurysms: the effects of modelled versusmeasured boundary conditions. Ann. Biomed. Eng. 2,884–896 (doi:10.1007/s10439-010-0187-z)
34 McKinney, A., Palmer, C., Truwit, C., Karagulle, A. &Teksam, M. 2008 Detection of aneurysms by 64-sectionmultidetector CT angiography in patients acutely sus-pected of having an intracranial aneurysm andcomparison with digital subtraction and 3D rotationalangiography. Am. J. Neuroradiol. 29, 594–602. (doi:10.3174/ajnr.A0848)
35 van Rooij, W., Sprengers, M., de Gast, A., Peluso, J. &Sluzewski, M. 2008 3D rotational angiography: the newgold standard in the detection of additional intracranialaneurysms. Am. J. Neuroradiol. 29, 976–979. (doi:10.3174/ajnr.A0964)
36 Hernandez, M. & Frangi, A. F. 2007 Non-parametricgeodesic active regions: method and evaluation forcerebral aneurysms segmentation in 3DRA and CTA.Med. Image Anal. 11, 224–241. (doi:10.1016/j.media.2007.01.002)
37 Bogunovic, H., Radaelli, A., de Craene, M., Delgado, D. &Frangi, A. F. 2008 Image intensity standardization in 3Drotational angiography and its application to vascularsegmentation. In SPIE Medical Imaging 2008: ImageProcessing, San Diego, CA, USA, vol. 6914 (edsJ. Reinhardt & J. Pluim), p. 691419. Bellingham, WA:Society of Photo-Optical Instrumentation Engineers.(doi:10.1117/12.770564)
38 Bogunovic, H. et al. 2011 Automated segmentation ofcerebral vasculature with aneurysms in 3DRA and TOF-MRA using geodesic active regions: an evaluation study.Med. Phys. 38, 210–222. (doi:10.1118/1.3515749)
39 Mellado, X., Larrabide, I., Hernandez, M. & Frangi, A. F.2007 Flux driven medial curve extraction. Insight J.
40 Reymond, P., Merenda, F., Perren, F., Rufenacht, D. &Stergiopulos, N. 2009 Validation of a one-dimensionalmodel of the systemic arterial tree. Am. J. Physiol. HeartCirc. Physiol. 297, H208–H222. (doi:10.1152/ajpheart.00037.2009)
41 Pozo, J. M., Villa-Uriol, M. & Frangi, A. F. 2011 Efficient3D Geometric and Zernike moments computation fromunstructured surface meshes. IEEE Trans. PatternAnal. Machine Intell. 33, 471–484. (doi:10.1109/TPAMI.2010.139)
42 Valencia, C., Villa-Uriol, M. C., Pozo, J. M. & Frangi,A. F. 2010 Morphological descriptors as rupture indicatorsin middle cerebral artery aneurysms. In Proc. IEEEEMBS. EMBC, pp. 6046–6049. Buenos Aires, Argentina.Piscataway, NJ: IEEE Press. (doi:10.1109/IEMBS.2010.5627610)
43 Lauric, A., Miller, E., Frisken, S. & Malek, A. M. 2010Automated detection of intracranial aneurysms based onparent vessel 3D analysis. Med. Image Anal. 14, 149–159. (doi:10.1016/j.media.2009.10.005)
44 Ford, M., Hoi, Y., Piccinelli, M., Antiga, L. & Steinman,D. 2009 An objective approach to digital removal of saccu-lar aneurysms: technique and applications. Bri. J. Radiol.82, S55–S61. (doi:10.1259/bjr/67593727)
318 @neurIST complex information processing M. C. Villa-Uriol et al.
Interface Focus (2011)

45 Sgouritsa, E., Mohamed, A., Morsi, H., Shaltoni, H.,Mawad, M. & Kakadiaris, I. 2010 Neck localization andgeometry quantification of intracranial aneurysms. InIEEE Int. Symp. Biomed. Imag., pp. 1057–1060. Piscat-away, NJ: IEEE Press. Rotterdam, The Netherlands.(doi:10.1109/ISBI.2010.5490172)
46 Larrabide, I., Villa-Uriol, M. C., Cardenes, R., Pozo, J. M.,Hose, D. & Frangi, A. F. 2010 Automated intracranialaneurysm isolation and quantification. In Proc. IEEEEMBS. EMBC, pp. 2841–2844. Argentina: BuenosAires. Piscataway, NJ: IEEE Press. (doi:10.1109/IEMBS.2010.5626075)
47 Schmidt, J. G. 2010 The FEANOR source code. Seehttp://www.rheinahrcampus.de/�medsim.
48 Simmhan, Y. L., Plale, B. & Gannon, D. 2005 A survey ofdata provenance in e-science. SIGMOD Record 34, 31–36.(doi:10.1145/1084805.1084812)
49 Singh, P. et al. 2009 The role of computational fluiddynamics in the management of unruptured intracranialaneurysms: a clinicians’ view. Comput. Intell. Neurosci.2009, 1–12. (doi:10.1155/2009/760364)
50 Radaelli, A. G., Sola Martınez, T., Vivas Dıaz, E.,Mellado, X., Castro, M. A., Putman, C. M., Guimaraens,L., Cebral, J. R. & Frangi, A. F. 2007 Combined clinicaland computational information in complex cerebral aneur-ysms: application to mirror cerebral aneurysms. In SPIEMedical Imaging: Physiology, Function, and Structurefrom Medical Images, San Diego, CA, USA (edsA. Manduca & X. P. Hu). Lecture Notes on ComputerScience 6511, p. 65111F. Bellingham, WA: Society ofPhoto-Optical Instrumentation Engineers. (doi:10.1117/12.708955)
51 Singh, P. et al. 2010 Effects of smoking and hypertension onwall shear stress and oscillatory shear index at the site ofintracranial aneurysm formation. Clin. Neurol. Neurosurg.112, 306–313. (doi:10.1016/j.clineuro.2009.12.018)
52 Singh, P. et al. 2010 The effects of aortic coarctation oncerebral hemodynamics and its importance in the etio-pathogenesis of intracranial aneurysms. J. Vasc. Interv.Neurol. 3, 17–30.
53 Cebral, J., Mut, F., Raschi, M., Scrivano, E., Ceratto, R.,Lylyk, P. & Putman, C. 2010 Aneurysm rupture followingtreatment with flow-diverting stents: computationalhemodynamics analysis of treatment. Am. J. Neuroradiol.32, 27–33. (doi:10.3174/ajnr.A2398)
54 Larrabide, I., Kim, M., Augsburger, L., Villa-Uriol, M.,Rufenacht, D. & Frangi, A. 2011 Fast virtual deploymentof self-expandable stents: method and in vitro evaluationfor intracranial aneurysmal stenting. Med. Image Anal.(doi:10.1016/j.media.2010.04.009)
55 Radaelli, A. et al. 2008 Reproducibility of haemodyna-mical simulations in a subject-specific stented aneurysmmodel: A report on the Virtual Intracranial Stenting Chal-lenge 2007. J. Biomech. 41, 2069–2081. (doi:10.1016/j.jbiomech.2008.04.035)
56 Kim, M., Larrabide, I., Villa-Uriol, M. C. & Frangi, A. F.2009 Hemodynamic alterations of a patient-specific intra-cranial aneurysm induced by virtual deployment of stentsin various axial orientation. In IEEE Int. Symp. Biomed.Imag., Boston, MA, USA, pp. 1215–1218. Piscataway,NJ: IEEE Press. (doi:10.1109/ISBI.2009.5193280)
57 Yasuno, K. et al. 2010 Genome-wide association studyof intracranial aneurysm identifies three new risk loci.Nat. Genet. 42, 420–425. (doi:10.1038/ng.563)
@neurIST complex information processing M. C. Villa-Uriol et al. 319
Interface Focus (2011)

Philippe BijlengaPosterior Circulation Aneurysms
Risk of Rupture of Small Anterior Communicating Artery Aneurysms Is Similar to
Print ISSN: 0039-2499. Online ISSN: 1524-4628 Copyright © 2013 American Heart Association, Inc. All rights reserved.
is published by the American Heart Association, 7272 Greenville Avenue, Dallas, TX 75231Stroke published online July 30, 2013;Stroke.
http://stroke.ahajournals.org/content/early/2013/07/30/STROKEAHA.113.001667World Wide Web at:
The online version of this article, along with updated information and services, is located on the
http://stroke.ahajournals.org/content/suppl/2013/07/30/STROKEAHA.113.001667.DC1.htmlData Supplement (unedited) at:
http://stroke.ahajournals.org//subscriptions/
is online at: Stroke Information about subscribing to Subscriptions:
http://www.lww.com/reprints Information about reprints can be found online at: Reprints:
document. Permissions and Rights Question and Answer process is available in the
Request Permissions in the middle column of the Web page under Services. Further information about thisOnce the online version of the published article for which permission is being requested is located, click
can be obtained via RightsLink, a service of the Copyright Clearance Center, not the Editorial Office.Strokein Requests for permissions to reproduce figures, tables, or portions of articles originally publishedPermissions:
by guest on July 31, 2013http://stroke.ahajournals.org/Downloaded from

1
The management of patients with unruptured cerebral aneu-rysms (UA) remains controversial because of their uncer-
tain natural history. Although estimates of the prevalence of intracranial aneurysms range from 0.5% to 6% on radiologi-cal and autopsy studies, the incidence of aneurismal subarach-noid hemorrhage (SAH) is 10/100.000 per year in the United States, leading to the conclusion that the majority of UAs do not rupture.1,2 The average risk of rupture of a UA is estimated to be between 1% and 2% per year.3,4 The International Study of Unruptured Intracranial Aneurysms (ISUIA) reported on a retrospective and prospective multicenter study in 1998 and 2003.5,6 In the latter, they observed that aneurysm location, size, and previous SAH were risk factors for rupture, with pos-terior circulation (PC) aneuryms collectively (including poste-rior communicating artery [PcoA] aneurysms) and aneurysms >7 mm located in the anterior circulation (AC) rupturing with at rates high enough to justify intervention. This observation seems to contradict the clinical perception that patients com-monly present with ruptured small aneurysms. Moreover, aneurysm locations were segregated only as being either AC
or PC for risk assessment, raising concerns that the effects of pathophysiological mechanisms specific to individual arteries were combined reducing sensitivity to location as a risk factor. Work has since been published demonstrating the importance of aneurysm location, along with criteria such as patients’ age, sex, ethnicity, and aneurysm morphology (size and shape) as risk factors for rupture. Recently, the Unruptured Cerebral Aneurysm Study of Japan (UCAS Japan) reported an annual rupture rate for UAs of 0.95%.7 It also found that aneurysms >7 mm in general, smaller aneurysms of the anterior com-municating artery (AcoA) or internal carotid-PcoA, and aneu-rysms having a daughter sac were associated with increased rupture risk.
The aim of the present study was to assess whether AcoA aneurysms behave differently from other AC aneurysms. Furthermore, we provide a detailed comparison with previous studies of the risk factors for aneurysm rupture, and in doing so examine whether simply dividing UAs into anterior or PC locations along with aneurysm size, as proposed by ISUIA, remains adequate for rupture risk analysis.
Background and Purpose—According to the International Study of Unruptured Intracranial Aneurysms (ISUIA), anterior circulation (AC) aneurysms of <7 mm in diameter have a minimal risk of rupture. It is general experience, however, that anterior communicating artery (AcoA) aneurysms are frequent and mostly rupture at <7 mm. The aim of the study was to assess whether AcoA aneurysms behave differently from other AC aneurysms.
Methods—Information about 932 patients newly diagnosed with intracranial aneurysms between November 1, 2006, and March 31, 2012, including aneurysm status at diagnosis, its location, size, and risk factors, was collected during the multicenter @neurIST project. For each location or location and size subgroup, the odds ratio (OR) of aneurysms being ruptured at diagnosis was calculated.
Results—The OR for aneurysms to be discovered ruptured was significantly higher for AcoA (OR, 3.5 [95% confidence interval, 2.6–4.5]) and posterior circulation (OR, 2.6 [95% confidence interval, 2.1–3.3]) than for AC excluding AcoA (OR, 0.5 [95% confidence interval, 0.4–0.6]). Although a threshold of 7 mm has been suggested by ISUIA as a threshold for aggressive treatment, AcoA aneurysms <7 mm were more frequently found ruptured (OR, 2.0 [95% confidence interval, 1.3–3.0]) than AC aneurysms of 7 to 12 mm diameter as defined in ISUIA.
Conclusions—We found that AC aneurysms are not a homogenous group. Aneurysms between 4 and 7 mm located in AcoA or distal anterior cerebral artery present similar rupture odds to posterior circulation aneurysms. Intervention should be recommended for this high-risk lesion group. (Stroke. 2013;44:00-00.)
Key Words: intracranial aneurysm ◼ registries ◼ risk factors ◼ SAH ◼ subarachnoid hemorrhage
Risk of Rupture of Small Anterior Communicating Artery Aneurysms Is Similar to Posterior Circulation Aneurysms
Philippe Bijlenga; on behalf of the @neurIST investigators*
Received April 15, 2013; accepted June 14, 2013.From the Hôpitaux Universitaire de Genève et Faculté de médecine de Genève, Geneva, Switzerland.*A list of @neurIST Investigators is given in the Appendix.Preliminary findings from this study have been presented as a digital poster at the Annual Meeting of the Congress of Neurological Surgeons, San
Francisco, CA, October 16–21, 2010 (http://w3.cns.org/dp/2010CNS/38.pdf) and as an oral presentation at the 62nd annual meeting of the German Society of Neurosurgery (DGNC), Hamburg, Germany, May 7–11, 2011.
The online-only Data Supplement is available at http://stroke.ahajournals.org/lookup/suppl/doi:10.1161/STROKEAHA.113.001667/-/DC1.Correspondence to Philippe Bijlenga, Service de neurochirurgie, Département de neurosciences cliniques, Hôpitaux Universitaire de Genève, 4 rue
Gabrielle-Perret-Gentil, 1211 Genève 14, Switzerland. E-mail [email protected]© 2013 American Heart Association, Inc.
Stroke is available at http://stroke.ahajournals.org DOI: 10.1161/STROKEAHA.113.001667
Original Contribution
by guest on July 31, 2013http://stroke.ahajournals.org/Downloaded from

2 Stroke October 2013
MethodsAs part of the European Union’s Sixth Framework Program Information Society Technologies priority, an information platform was designed, developed, and implemented by a group of clinical centers, universities, and companies from across Europe. Its purpose was to integrate complete biomedical information for the manage-ment of cerebral aneurysms. The system was used in the collection of the clinical data on aneurysm patients from multiple centers as described below.
PatientsBetween November 1, 2006, and March 31, 2012, a total of 932 patients diagnosed with intracranial aneurysms were enrolled at 7 European clinical centers (Royal Hallamshire Hospital, Sheffield, United Kingdom; John Radcliffe Hospital, Oxford, United Kingdom; Erasmus Medical Center Rotterdam, The Netherlands; University Hospital of Geneva, Switzerland; University Hospital of Barcelona, Spain; General Hospital of Catalonia, Spain; University Hospital of Pecs, Hungary) using the platform. The data collection protocol was approved by individual local ethics committees, and written consent obtained from patients or where appropriate, next of kin, in all cases.
All clinical centers were made aware of the importance of consecu-tive recruitment from an identifiable catchment area but only 1 was able to verify and guarantee consecutive recruitment from a stable population. The University Hospital of Geneva embedded the data collection tool (@neuQuest) in the hospital’s electronic information system and trained neurosurgical medical staff to use the platform as the basis of the electronic medical record. Regular checks were per-formed to ensure consistency between the administrative and medi-cal databases. Thus, prospective and consecutive recruitment of all patients with a newly diagnosed intracranial aneurysm and known to be resident within this referral area was ensured, and the referral area did not vary during the course of data collection.
For analysis, the data were separated into 2 groups:
1. The Total @neurIST Cohort (TC), including all the cases of diagnosed intracranial aneurysm recruited prospectively or retrospectively by the 7 participating clinical centers. In the TC, 651 (70%) patients were recruited prospectively, and 281 (30%) patients were recruited retrospectively, for a total of 932 patients, of which 343 (36.8%) patients had no history of SAH and 589 (63.2%) patients had a SAH.
2. The Consecutive Cohort (CC), a subset of the TC, including cases prospectively and consecutively diagnosed with ≥1 sac-cular intracranial aneurysm, living within the hospital’s recruit-ment area. Two patients were excluded from the analysis be-cause they refused to give consent to participate (0.6%). The CC consisted of 404 patients; 194 (48%) patients without his-tory of SAH and 210 (52%) patients recruited after SAH. Of the patients without SAH, 174 (89.7%) patients had incidentally discovered aneurysm(s) and 20 (10.3%) patients had symp-tomatic aneurysms causing cranial nerve palsy or focal strokes from upstream thrombosis.
Aneurysms and Clinical InformationFor all recruited patients, data were collected relating to aneurysm location, characteristics, clinical history, and risk factors, some par-ticulars of which are as follows.
Neurovascular NomenclatureAdapted from the ISUIA study, aneurysm locations were defined as follows. The internal carotid artery (ICA), anterior cerebral artery (ACA), AcoA, middle cerebral artery (MCA), vertebral artery, basilar artery, and posterior cerebral artery were considered as parent vessels. In accordance with most neurovascular publications, we defined each parent artery segment as starting proximal to the origin of a branch and finishing proximal to the next branch artery. Each parent artery segment was then given the name of the branch that departs from
that segment. The following branches were taken into consideration: ophthalmic artery, PcoA anterior choroidal artery, pericallosal artery, posterior inferior cerebellar artery, and anterior inferior cerebellar ar-tery, and superior cerebellar artery (Figure 1A).
For bifurcations, the segments were defined as per Rhoton,8 start-ing where the walls diverge and finishing at the cross-sections perpen-dicular to the flow within the daughter vessels where the projection of the parent vessel wall crosses the medial wall of the daughter vessel (see Figure 1B).
Risk Factors of Aneurysm Rupture and SAHRisk factors considered in the study were those previously described for aneurysm rupture, including presence of an unruptured symp-tomatic aneurysms (relative risk [RR], 8.2 [95% confidence interval {CI}, 3.9–17.0]), aneurysms >10 mm (RR, 5.5 [95% CI, 3.3–9.5]), location in the PC (RR, 4.1 [95% CI, 1.5–11.0]), and female sex (RR, 2.1 [95% CI, 1.1–3.9]).9–15
We also included those additional factors identified by a system-atic Cochrane literature review of reviews16 as having significant RR associated with SAH in the general population, including positive family history (RR, 4.0 [95% CI, 2.7–6]), smoking (RR, 2.4 [95% CI, 1.8–3.4]), alcohol consumption of >150 g/wk (RR, 2.1 [95% CI, 1.5–2.8]), hypertension (RR, 2 [95% CI, 1.5–2.7]).
The @neurIST system was designed to serve the clinical manage-ment of patients with aneurysms. The data collected therefore includ-ed the above parameters as well as the patient’s presenting history, symptoms, and signs, and details of any treatments and their follow-up. These records, coupled with angiographic imaging (eg, computed tomography angiogram, magnetic resonance angiogram, digital sub-traction angiogram, digital rotational angiogram) and neurovascular morphological measurements and characterizations, were collated using elements (@neuQuest, @neuFuse, @neuInfo) of the purpose built information platform, developed during the course of the proj-ect. Prospective and retrospective clinical data were collected and the subject’s residency could be determined from within the database.
Statistical AnalysisIt has been postulated that the process leading to an aneurysmal SAH depends first on the formation of ≥1 aneurysm and, subsequently, the rupture of the aneurysm wall; our study is designed to estimate the latter risk.
The above data collection allowed us to count and compare the occurrence of newly diagnosed ruptured and unruptured aneurysms in each vessel segment. To evaluate the risk of rupture of an aneurysm located in a particular vessel segment, the odds of aneurysms being discovered ruptured versus being discovered unruptured was calcu-lated for each vessel segment.
The role of size in AcoA aneurysm rupture was further compared with MCA aneurysms using groups composed of aneurysms with maximum dome sizes in the following ranges: 0 to 4, 4 to 7, 7 to 12, 12 to 25, and >25 mm. Again, the odds of aneurysms being dis-covered ruptured were calculated for comparison between AcoA and MCA locations.
To compare our observations with those reported in ISUIA, the TC data were analyzed for size and location effects, as per the categori-zations used in the ISUIA report. This involved dividing the aneu-rysms by size into 2 groups: aneurysms of <7 mm in diameter and those between 7 and 12 mm, and then subdividing both groups by location. Observations on larger aneurysms groups are not reported because the rupture risk is known to be high and statistical robust-ness is low because of their relative rarity and limited population studied. In keeping with the ISUIA categorization, the PC group was composed of aneurysms located in the vertebrobasilar system, basilar tip, posterior cerebral artery, and PcoA segment of the ICA. The AC was formed by pooling all aneurysms located on the ICA (exclud-ing PcoA), ACA (including AcoA), and MCA (ACA+ICA+MCA). To assess the place of AcoA aneurysms relative to this categorization system, subcomponents of the AC (namely the MCA-ICA, the ACA, and AcoA) were also considered separately. The 5-year cumulative
by guest on July 31, 2013http://stroke.ahajournals.org/Downloaded from

Bijlenga et al Risk of Aneurysm Rupture by Location and Size 3
rupture risk of 2.6%, calculated by ISUIA for AC aneurysms between 7 and 12 mm, was taken as point of reference. The latter group was used as reference to calculated odds ratios (ORs).
To verify that the TC and CC were consistent, the risk factors and clinical characteristics of the cohorts were compared with each other and, to the extent possible, the same comparisons were made to the results in a 2002 report by Weir et al.14 Limited to UA patients with no previous history of SAH, similar comparisons were made between the @neurIST TC, Weir et al14 2002, the ISUIA cohorts, and the 2012 UCAS report. For this, frequencies were calculated on a per patient basis and, for completeness, we also calculated per aneurysm statis-tics. The purpose of these comparisons was to identify differences between the cohorts that could affect the conclusions drawn from the observations either attributable to selection bias or to general changes in the population over time.
Case categorization and information extraction were performed using the @neuBrowser tool developed in the course of the @neu-rIST project. Statistics were produced using SPSS version 15.0 software (SPSS: IBM, NY) or MedCalc software (MedCalc soft-ware, Belgium), whichever was considered to be the most practical. Results for continuous variables are reported as mean±SD. The test of significance for mean differences was assessed using Student t test (significance level P<0.05). Odd ratios are reported with a 95% CI. Significance of differences in proportions was assessed by means of Fisher exact tests.
ResultsSummaries of patient demographics, clinical histories, and risk factors obtained for the 2 @neurIST cohorts and their com-parisons are given in the Table. In both the TC and CC, there was a ratio of ≈3 females for every male (Table). The aver-age maximal unruptured aneurysm diameter was significantly higher in the TC than in the CC (6.35±4.8 versus 5.51±4.23 mm; P<0.05). However, there was a higher proportion of small (2–7 mm) aneurysms (63.9% versus 52.8%; P<0.05) and a significantly lower proportion of large (13–24 mm) aneurysms (6.3% versus 12.2%; P<0.05) reported in the CC (Table I in the online-only Data Supplement). The proportion
of symptomatic patients was significantly smaller in the CC (9% versus 16.9%; P<0.05). Both cohort populations were, however, comparable for all other variables studied (Table; Table I in the online-only Data Supplement).
Location and Size Dependence of Aneurysms and RuptureAcoA was the vessel segment most commonly bearing a rup-tured aneurysm (n=162), followed by the PcoA (n=121) and MCA bifurcation (n=72). The occurrence of SAH secondary to the rupture of aneurysms was more frequent in the AcoA and in the PcoA than in the MCA bifurcation (RR, 2.25 [95% CI, 1.7–3.0] and RR, 1.7 [95% CI, 1.2–2.25], respectively).
Figure 2 shows a forest plot reporting the ORs of aneurysms discovered ruptured or unruptured at each anatomic location (regardless of aneurysm size) in the TC. ORs to the right of the reference line (OR=1) reflect a higher than average proportion of aneurysms being ruptured at discovery. AcoA aneurysms had the highest OR (TC: 4.3 [95% CI, 2.8–6.5]; CC: 2.1 [95% CI, 1.4–3.2]) for rupture followed in order by basilar tip, A2 and pericallosal, and PcoA and posterior inferior cerebellar artery aneurysms. In contrast, aneurysms located in the oph-thalmic segment of the ICA had the lowest OR for rupture. Observations were similar when analyzing the CC (Figure I in the online-only Data Supplement).
For different size subgroups, the odds of discovering rup-tured AcoA aneurysms relative to that of similarly sized MCA aneurysms are compared in Figure 3. The OR for rup-tured AcoA aneurysms was the highest in the size group 4 to 7 mm (OR, 8.3 [95% CI, 4.4–16]; P<0.001). At larger diameters, the differences decreased as the corresponding proportion of ruptured MCA aneurysms increased; at >12 mm diameter, no conclusions were drawn in light of the small sample size.
Figure 1. Left, Basis for attributing aneu-rysm locations according to the Interna-tional Study of Unruptured Intracranial Aneurysms (ISUIA). Aneurysms of the internal carotid artery (ICA), middle cere-bral artery (MCA), and anterior cerebral artery (ACA; excluding posterior com-municating artery [PcoA]) belong to the anterior circulation (orange), whereas aneurysms of the vertebrobasilar system, PcoA, and PcoA segment of the ICA belong to the posterior circulation (red). Note that there is no subdivision in ISUIA between ACA and anterior communicat-ing artery (AcoA). Right, Refined subdivi-sion of neurovasculature as applied in this study: each parent vessel segment starts proximal to the origin of the branch and finishes proximal to the next branch and takes the name of the branch depart-ing from the segment. Inset, As defined by Rhoton,8 a bifurcation begins where the walls diverge (dotted line) and ends on the cross-sections perpendicular to the flow (lines B1 and B2) located in the daughter vessels where the projection of the parent vessel wall (lines A1 and A2)
cross the medial wall of the daughter vessel. AC indicates anterior circulation; AchIC, anterior choroidal artery segment of the ICA; and PC, posterior circulation.
by guest on July 31, 2013http://stroke.ahajournals.org/Downloaded from

4 Stroke October 2013
Reflecting the ISUIA classification of aneurysms by location (AC or PC) and size (<7 mm, 7–12 mm, or >12 mm in diam-eter), the incidences and ORs for ruptures of the subgroups are compared in Figure 4 (aneurysms >12 mm excluded). Also shown are the behaviors of separable AC components, bro-ken down as AcoA, ACA (including A1, AcoA, A2, PerA, and Distal ACA aneurysms), or MCA+ICA aneurysms. The OR of ruptured AC aneurysms of <7 mm in size showed fewer ruptured aneurysms than the reference group, suggesting their rupture risk could be ≤2.6% per 5 years. In contrast, aneu-rysms located in the PC showed a trend to higher ORs (1.29 [95% CI, 0.9–1.9]). These observations are in accordance with the ISUIA observations. We found however, that aneurysms of <7 mm in size in ACA locations in general, and AcoA aneu-rysms in particular, were more likely to be ruptured at presen-tation than other AC aneurysms, and that they showed ORs similar to PC lesions (ACA: 1.58 [95% CI, 1.10–2.30]; AcoA:
2.0 [95% CI, 1.31–3.03]). Interestingly, the OR for ruptured aneurysms <4 mm in the AcoA was smaller, although not sig-nificantly so, than the reference group (OR, 0.547 [95% CI, 0.279–1.073]). When separated from the AC aneurysms, a low OR for rupture of ICA+MCA became apparent even at diam-eters up to 12 mm (0.26 [95% CI, 0.18–0.37] for aneurysms <7 mm and 0.61 [95% CI, 0.39–0.95] for aneurysms between 7 and 12 mm; Figure 4).
Comparison With Previous StudiesIncluded in the Table, along with the details of the @neurIST cohorts, are summary data from Weir et al14 2002. A simi-lar summary and analysis, limited to patients with UA at the time of recruitment, is given in Table I in the online-only Data Supplement. Because our interest here is in possible differ-ences in bias between studies, or changes in the patient popula-tions over time, below, we focus primarily on describing the
Table. Baseline Characteristics of Patients and Aneurysms for Cohorts
Weir et al14 (n=507)
Consecutive Cohort (n=404)
Total @neurist Cohort (n=932) P Value* P Value†
Period of recruitment 1967–1987 2007–2012 2007–2012
Baseline characteristics of patients
Age, mean (SD) 47 (NA) 55.3 (14.11) 55.02 (13.24) NA NS
Sex ratio (% of female) 318/189 (62.7) 298/106 (74) 663/269 (71) <0.005 NS
Ratio of multiple aneurysms (% of cases with multiple lesions)
111/396 (21.9) 134/270 (33) 278/654 (30) <0.005 NS
Percentage of patients with SAH 86 53 63 <0.001 <0.001
Number of aneurysms 621 1347
Max aneurysm diameter, mm; mean (SD)
9.7 (0.3 se) 6.2 (7.35) 6.76 (11.39) <0.001 NS
Baseline characteristics of aneurysms
Size of aneurysm, number of patients (%)
0–1.9 mm 8 (2.0) 13 (1.4) NS
2–6.9 mm 155 (38.5) 239 (59.2) 490 (52.6) <0.001 <0.05
7–12 mm 144 (36.0) 117 (29.0) 316 (33.9) NS NS
13–24 mm 73 (18.0) 33 (8.2) 95 (10.2) <0.001 NS
>24 mm 30 (7.5) 7 (1.7) 18 (1.9) <0.001 NS
Location of aneurysm, number of patients (%)
Cavernous part of carotid artery
18 (3.5) 26 (6) 50 (5) NS NS
Internal carotid artery 53 (10.4) 109 (27) 218 (23) <0.001 NS
Anterior communicating or anterior cerebral artery
158 (31.2) 141 (35) 308 (33) NS NS
Middle cerebral artery 158 (31.2) 137 (34) 386 (31) NS NS
Posterior communicating artery
88 (17.4) 65 (16) 186 (20) NS NS
Vertebrobasilar system (other than basilar tip)
10 (2) 33 (8) 74 (8) <0.001 NS
Tip of basilar artery 22 (4.3) 30 (7) 79 (8) <0.005 NS
NA indicates not applicable; NS, not significant; SAH, subarachnoid hemorrhage; and se, standard error.*P value comparing @neurIST Total Cohort (TC) with Weir et al.14
†P value between @neurIST cohorts.
by guest on July 31, 2013http://stroke.ahajournals.org/Downloaded from

Bijlenga et al Risk of Aneurysm Rupture by Location and Size 5
points where significant differences were observed. Care has been taken to compare population of patients recruited accord-ing to the same criteria between studies. @neurIST cohorts are compared with Weir et al,14 whereas population of patients recruited with unruptured aneurysms and no history of SAH are compared with ISUIA and UCAS, and the subpopulation of patients recruited with unruptured aneurysms in Weir et al.14
Demographics, Signs, and SymptomsThe TC was populated with older patients, more females, more patients with multiple aneurysms, and fewer patients that had SAH than reported in Weir et al14 (Table).
The patients with unruptured aneurysms in the TC and ISUIA populations were similar in age (56±13.1 versus 55±13.1 years), whereas those in UCAS were older (65±10.4 years) and those in Weir et al14 were younger (46 years). Fewer of the @neurIST patients with unruptured aneurysms had mul-tiple aneurysms or a family history of aneurysms than those in ISUIA. @neurIST patients had lower levels of alcohol and tobacco consumption and a trend toward fewer patients using
stimulants as compared with ISUIA (Table I in the online-only Data Supplement).
Relative to ISUIA, the comparable patient group in UCAS was older, and contained more males, whereas fewer patients were smokers, had multiple aneurysms, were symptomatic, or had a family history of SAH (Table IV in the online-only Data Supplement).
Ruptured Versus UnrupturedThe population of patients with unruptured intracranial aneu-rysms (UA) corresponded to 37% of all cases recruited to the @neurIST (47% in the CC). This clearly contrasts with the observation made between 1967 and 1987 reported by Weir in 2002 wherein only 14% of patients were found to have UAs.
Location@neurIST contained significantly more patients with internal carotid aneurysms than reported by Weir et al14 (CC: 27%, TC: 23%, Weir: 10.4%; P<0.001). Patients with PC aneurysms (vertebrobasilar and basilar tip) were also more frequent in @neurIST than in Weir et al (16% versus 6.3%; P<0.01; Table).
Figure 2. Odds ratios of aneurysms dis-covered ruptured vs unruptured for each location compared with all other aneurysms included in the cohort. N is the number of aneurysms observed for each location or location cluster. AC indicates anterior circulation; AchIC, anterior choroidal artery segment of the ICA; AcoA, anterior com-municating artery; CI, confidence interval; IC bif, ICA bifurcation; MCA, middle cerebral artery; Oph IC, ophtalmic segment of the ICA; OR, odds ratio; PcoA, posterior com-municating artery; Per ACA, pericallosal segment of the ACA; PICA, posterior inferior cerebellar artery; and VB other, other loca-tion within the vertebrobasilar system.
Figure 3. Odds ratios of anterior communicating artery (AcoA) aneurysms being discovered ruptured vs unruptured relative to those of the middle cerebral artery (MCA) stratified by size. CI indicates confidence interval; and OR, odds ratio.
by guest on July 31, 2013http://stroke.ahajournals.org/Downloaded from

6 Stroke October 2013
Limited to patients with UAs, internal carotid aneurysms were significantly more represented in the @neurIST cohorts than in ISUIA and Weir et al14 (patient-based counting, respec-tively 35% versus 22.9% and 13.9%; P<0.01; Table I in the online-only Data Supplement). Comparing the distribution of aneurysms by location, aneurysms located in the ICA were significantly more frequent in @neurIST than in UCAS (aneu-rysm-based counting: 29% versus 19%; P<0.001); in contrast, aneurysms located in PcoA were significantly less frequent in @neurIST (11.9% versus 16.5%; P<0.05; Table III in the online-only Data Supplement). This latter observation may be attributable to differences in classifying aneurysms between the PcoA and the anterior choroidal artery segment of the ICA.
Unruptured AcoA aneurysms also formed a much greater fraction of the observed patients with aneurysms in the @neu-rIST cohort than those in Weir et al14 and ISUIA (24% versus 13.9% and 10.3%, respectively; P<0.001; Table I in the online-only Data Supplement). Comparing @neurIST and UCAS cohorts, a similar representation of unruptured AcoA aneurysm was observed (Table III in the online-only Data Supplement).
The pattern of aneurysm distribution varied slightly between @neurIST centers. Centers where neurosurgeons were less involved in the project reported fewer MCA and pericallosal segment of the ACA aneurysms (P<0.001) and proportionally more PcoA, basilar artery, and M1 aneurysms (P<0.001).
SizeThe average aneurysm size was similar between UCAS and @neurIST CC (Table I in the online-only Data Supplement), with progressively larger average aneurysm sizes being seen in the @neurIST TC, ISUIA, and Weir et al14 studies.
However, concerning the distribution of aneurysm sizes, the @neurIST TC was close to that of Weir et al,14 whereas the distribution for the @neurIST CC was closer to that of ISUIA, with the former pairing having slightly fewer small and more midsized aneurysms relative to the latter pairing.
UCAS was populated with significantly more patients with aneurysms <7 mm than ISUIA, TC, and CC (78.4% versus 62%, 53.4%, 65.2% respectively; P<0.01; Table II in the online-only Data Supplement).
DiscussionThis study was designed to evaluate AcoA aneurysm rupture risk relative to the anterior and PC location and size groupings used in ISUIA. Our motivation was the common perception that the behavior of AcoA aneurysms is not that suggested by the ISUIA results. Consistent with ISUIA, we found that aneurysms <7 mm in size and located in the AC (as defined in ISUIA) were less likely to be discovered ruptured than aneu-rysms in other locations or of larger size. More importantly, however, our results also provide statistical evidence that AcoA aneurysms rupture with smaller diameters than MCA aneurysms and, that generally, AcoA aneurysms rupture at least as frequently as those of the PC, in contrast to those in other AC locations. Furthermore, our data indicate that risk of rupture of aneurysms of <7 mm located in the internal carotid or MCA is low relative to the PC and AcoA, but not negli-gible. Thus, the AC as defined by ISUIA should not be consid-ered homogeneous for aneurysm rupture, and we suggest that because of unknown factors (ie, embryogenesis or blood flow coherence), both AcoA and PcoA be considered with the PC for risk stratification.
The distinct rupture risk of AcoA aneurysms seen in the present study has important implications for our understanding of the ISUIA and UCAS studies. As mentioned by the authors of ISUIA, “the potential limitations of the study include the nonrandomised nature of the unoperated, surgical and endo-vascular cohorts, which led to asymmetries within groups;…” We think that the implications of this possible recruitment bias have not been fully appreciated by the medical community. The assignment of patients to one of the 2 ISUIA cohorts (treated
Figure 4. Odds of aneurysms discovered ruptured vs unruptured for groups clustered according to location and size compared with a refer-ence group defined as aneurysms between 7 and 12 mm located in the anterior circulation aneurysm as defined by the International Study of Unruptured Intracranial Aneurysms, and for subsets of the anterior circulation. ACA indicates anterior cerebral artery; AcoA, anterior commu-nicating artery; CI, confidence interval; ICA, internal carotid artery; MCA, middle cerebral artery; OR, odds ratio; and PC, posterior circulation.
by guest on July 31, 2013http://stroke.ahajournals.org/Downloaded from

Bijlenga et al Risk of Aneurysm Rupture by Location and Size 7
or not treated) was “based on whether surgical or endovascular treatment of ≥1 unruptured intracranial aneurysm was planned on clinical grounds at the time the patient was first seen at the ISUIA center.” Although the study coordinators took steps to minimize bias, there is no description or discussion of how consecutive the recruitment was. It may have been for various unstated reasons, for example, a reputation to rupture at small diameters or surgical accessibility, that more patients with unruptured AcoA aneurysms were treated and not observed in ISUIA. This may explain why patients with AcoA aneurysms represented only 13.5% of patients enrolled, as opposed to 24% in @neurIST, and why 10.3% were followed up without surgery. Other possible reasons for this difference include the following: (1) increased opportunities and improved quality of cerebral imaging, leading to more patients being diagnosed with incidental aneurysms, (2) a decrease in the incidence of rupture of existing aneurysms, resulting in an increase of the prevalence of unruptured lesions, (3) an aging population that may increase the prevalence of aneurysms, and (4) changes in an environmental risk factor such as increased prohibition of smoking in public areas. These factors apart, patients in ISUIA with ICA and AcoA aneurysms were significantly more frequently assigned to treatment than those with PcoA aneu-rysms. All together, our observations suggest that the AcoA location was under-represented in the ISUIA study, and that the particular behavior of lesions in that location could not be distinguished from lesions in other AC sites. This conclusion is supported by our finding that when all AC aneurysms are included in 1 single group, the increased rupture risk associ-ated of AcoA aneurysms is masked (Figure 4).
Based on these considerations, we emphasize that the observation in ISUIA of a negligible rupture risk for AC aneu-rysms <7 mm in size is only applicable in the situation where expert clinicians had considered observation as an acceptable alternative to treatment.
In order that our data be valid as a basis for the above com-parison of our patient group with ISUIA, we sought to reduce case-selection bias as much as possible through a multicenter, population-based study (transversal study). Patients were recruited prospectively and consecutively in one of the clini-cal centers, and an audit was performed to verify that cases were not missed. All the other centers attempted to achieve these aims but were not able to provide checks that all cases were captured, and hence completeness in these sites is not guaranteed. To estimate and identify potential biases, a num-ber of characteristics of patients and aneurysms reported when the lesion was initially discovered were examined between the @neurIST cohorts. We observed that the proportion of inci-dentally discovered aneurysms in @neurIST was significantly higher than in historical reports but also that this trend was more pronounced in the CC where all aneurysms identified within the clinical center were captured. However, the pro-portion of patients with known risk factors (familial history, symptomatic, multiple aneurysms) was lower. These observa-tions suggest that selection biases are progressively attenuated because of the increased use and quality of head imaging. Despite differences in recruited populations, similar results were obtained in the 2 @neurIST cohorts and when analyzing separately cohorts recruited in each center.
All the studies of intracranial aneuryms, including the present, are affected by ≥2 limitations. First, the recruitment population can be naturally defined by the established, stable activity of the centers involved, but this is a difficult quantity to determine accurately. Furthermore, costs and ethical issues preclude screening for intracranial aneurysms in a randomly selected population. In consequence, we are not able to report absolute incidence, but rather must consider the odd ratios of aneurysm rupture associated with a condition in the fraction of the recruited population affected or not by the studied risk fac-tor. Therefore, it can be assumed that the OR for rupture was overestimated because of undiagnosed unruptured aneurysms mentioned above. In counterpoint, the loss of information on patients with lethal hemorrhage and dying before being brought to medical attention and the impact on natural history in treated cases would lead to an underestimation of the OR. The validity of our observation may therefore be affected by the selection of a population where the distribution of unrup-tured aneurysms according to location and size does not match the distribution in the overall population.
When analyzing the odds of aneurysm rupture by location, the AcoA location was the most frequent site of aneurysm rupture followed by PcoA and MCA bifurcation in both the consecutive and TC. To determine whether the observed high frequency of ruptured aneurysms is associated with a higher prevalence of aneurysm or a higher risk of aneurysm rup-ture, the prevalence of aneurysm by location and size groups was estimated from the population of patients diagnosed with unruptured aneurysms We could not identify factors that could explain why unruptured aneurysms in the AcoA should be underdiagnosed as compared with other locations. As for aneurysms located in the IC (close to bone structures), the incidence of unruptured aneurysms diagnosed increased between older and more recent studies.
Concerning risk associated with size, we made the assump-tion that if aneurysm rupture modifies the size or the mor-phology, it would happen regardless of location. Therefore, we decided to highlight the risk of rupture associated with aneurysm size by comparing AcoA with MCA, both loca-tions sharing high anatomic similarities. Aneurysms between 4 and 7 mm in the AcoA were significantly more frequently observed ruptured than similar size aneurysms in the MCA location. This observation also held when the AcoA location was compared with other AC locations.
It has been debated whether the risk of rupture of an UA can or cannot be extrapolated from size or morphology observa-tions of ruptured aneurysms as these features may be modified by the rupture itself.17,18 The Small Unruptured Intracranial Aneurysm Verification (SUAVe) study has demonstrated the different characteristics of aneuryms relative to their growth and rupture. Different types of aneurysm evolution have been described, from rapid aneurysm development and rupture at small sizes within days or months, to slower growing aneu-rysms with rupture occurring after years or remaining rupture free for decades. Based on a single evaluation at the time of diagnosis, our work is unsuited to answering questions of how aneurysms grow and what rupture rate to expect. Recently, the UCAS Japan reported results of a longitudinal follow-up study of patients enrolled from January 2001 through April
by guest on July 31, 2013http://stroke.ahajournals.org/Downloaded from
8 Stroke October 2013
2004 and follow-up until April 2010. A total of 5720 patients with 6697 aneurysms were studied; of which, 3050 aneurysms were treated during follow-up, and 3647 aneurysms were left for observation. A total of 11 660 aneurysm-years were recorded with 111 aneurysm ruptures. The overall annual rupture rate in the untreated population of patients in Japan was estimated at 0.95% (95% CI, 0.79–1.15). The authors report that compared with MCA aneurysms, lesions located in the AcoA or in the PcoA are more likely to rupture with hazard ratio of 1.90 (95% CI, 1.12–3.21) and 2.02 (95% CI, 1.13–3.58), respectively. As stated by the UCAS authors, however, this type of study can never be entirely free of case-selection bias. A significant proportion of small aneurysms were treated, and the characteristics of these aneurysms were different from the studied group. Therefore, it is difficult to extrapolate the observed rupture rate to the general population of incidentally discovered aneurysms. It would be extremely interesting to compare the OR and the rate of rupture for aneu-rysms stratified in identical location and size groups for both @neurIST and UCAS. @neurIST continues to record rupture or treatment of unruptured aneurysms in the CC cohort to provide longitudinal data on top of the transversal informa-tion reported herein. We may then extrapolate rupture rates in the clinically pertinent population by comparing ORs with homogenous aneurysm groups with known rupture rates and be able to propose estimates.
Currently, most studies apply multiple univariate analy-ses in evaluating rupture risk but these may be inadequate because, as illustrated by our results, location, size, and many other factors may influence aneurysm behavior, such as sex, smoking, alcohol consumption, and hypertension. New tools are being developed to assess the risk of rupture using genet-ics, transcriptomics, morphodynamic evaluation, and simula-tions, and new treatments are being explored. This progress puts ever greater demands on the scale of aneurysm studies required for adequate and appropriate statistical analyses to be performed. The only way to achieve this is through wider multicentric collaboration and rigorous patient documentation practices. Further projects need to be launched to integrate all this information and help clinicians provide individualized recommendations to patients and the general population.
ConclusionsAcoA aneurysms with a size between 4 and 7 mm have a higher risk of rupture than was inferred from the ISUIA observations. We recommend that in the absence of complicating comorbidi-ties, unruptured AcoA aneurysms >4 mm should be treated. Small aneurysms of <7 mm located in the internal carotid or middle cerebral arteries were seen to present lower risk of rup-ture. We recommend following these aneurysms with regular imaging.
Appendix
@neurIST InvestigatorsProject Board: Alejandro Frangi (Universitat Pompeu Fabra, Barcelona, Spain); Philippe Bijlenga (Hôpitaux Universitaire de Genève et Faculté de médecine de Genève, Geneva, Switzerland); Martin Hofmann-Apitius (Fraunhofer Institut Algorithmen und
Wissenschaftliches Rechnen, Sankt Augustin, Germany); Rod Hose (Royal Hallamshire Hospital and University of Sheffield, United Kingdom); Guy Lonsdale (NEC Laboratories Europe, IT Research Division, Sankt Augustin, Germany); Antonio Arbona (NEC Laboratories Europe, IT Research Division, Sankt Augustin, Germany); Peer Hasselmeyer (NEC Laboratories Europe, IT Research Division, Sankt Augustin, Germany); Daniel Rüfenacht (Hôpitaux Universitaire de Genève et Faculté de médecine de Genève, Geneva, Switzerland). Article writing team: Philippe Bijlenga (Hôpitaux Universitaire de Genève et Faculté de médecine de Genève, Geneva, Switzerland); Paul Summers (John Radcliffe Hospital, University of Oxford, Oxford, United Kingdom); Max Jägersberg (Hôpitaux Universitaire de Genève et Faculté de médecine de Genève, Geneva, Switzerland); Alister Rogers (Hôpitaux Universitaire de Genève et Faculté de mé-decine de Genève, Geneva Switzerland); Karl Schaller (Hôpitaux Universitaire de Genève et Faculté de médecine de Genève, Geneva, Switzerland); James Byrne (John Radcliffe Hospital, University of Oxford, Oxford, United Kingdom.). Ethical and legal review commit-tee: Jessica Wright (Durham University Department of Law, United Kingdom); Jeremy Wilkins (Durham University Department of Law, United Kingdom); Derick Beyleveld (Durham University Department of Law, United Kingdom); Bernice Elger (Hôpitaux Universitaire de Genève et Faculté de médecine de Genève, Geneva, Switzerland). Information platform development and maintenance: Alan Waterworth (Royal Hallamshire Hospital and University of Sheffield, United Kingdom); Steven Wood (Royal Hallamshire Hospital and University of Sheffield, United Kingdom); Jimison Iavindrasana (Hôpitaux Universitaire de Genève et Faculté de médecine de Genève, Geneva, Switzerland); Rodolphe Meyer (Hôpitaux Universitaire de Genève et Faculté de médecine de Genève, Geneva. Switzerland); Christoph Friedrich (Fraunhofer Institut Algorithmen und Wissenschaftliches Rechnen, Sankt Augustin, Germany); Christian Ebeling (Fraunhofer Institut Algorithmen und Wissenschaftliches Rechnen, Sankt Augustin, Germany). Epidemiology and statistics: Christian Ebeling (Fraunhofer Institut Algorithmen und Wissenschaftliches Rechnen, Sankt Augustin, Germany); Philippe Bijlenga (Hôpitaux Universitaire de Genève et Faculté de médecine de Genève, Geneva, Switzerland); Roelof Risselada (Erasmus University Medical Center, Rotterdam, The Netherlands); Christoph Friedrich (Fraunhofer Institut Algorithmen und Wissenschaftliches Rechnen, Sankt Augustin, Germany); Miriam CJM Sturkenboom (Erasmus University Medical Center, Rotterdam, The Netherlands).
Participating Centers (In Order of Number of Recruited Patients)Hôpitaux Universitaire de Genève et Faculté de médecine de Genève, Geneva, Switzerland (Philippe Bijlenga, Max Jägersberg, Alister Rogers, Bawarjan Schatlo, Patrick Teta, Karl Schaller, Vitor Mendes-Pereira, Ana Marcos Gonzalez, Ana Paula Narata, Karl O Lovblad, Daniel A. Rüfenacht); John Radcliffe Hospital, University of Oxford, Oxford, United Kingdom (Julia Yarnold, Paul Summers, Alison Clarke, Gulam Zilani, James Byrne); Hospital Clinic, Barcelona, Spain (Juan Macho, Jordi Blasco); University of Pècs Medical School, Pècs, Hungary (Peter Bukovics, Ferenc Kover, Istvan Hudak, Tamas Doczi); Erasmus University Medical Center, Rotterdam, The Netherlands (Roelof Risselada, Miriam CJM Sturkenboom); Royal Hallamshire Hospital, Sheffield, United Kingdom (Pankaj Singh, Alan Waterworth, Umang Patel, Stuart Coley, Patricia Lawford); Hospital General de Catalunya, San Cugat del Valles, Spain (Teresa Sola, Elio Vivas).
AcknowledgmentsThe authors are very grateful to all the trial participants and collaborators.
by guest on July 31, 2013http://stroke.ahajournals.org/Downloaded from

Bijlenga et al Risk of Aneurysm Rupture by Location and Size 9
Sources of FundingThe study was supported by the 6th framework program of the European Commission @neurIST project (www.aneurist.org) FP6-IST-2004–027703.
DisclosuresNeither sponsor nor funder had any part in study design, data col-lection, analysis, or reporting, which were organized by the project board. The corresponding author had full access to all the data in the study and had final responsibility for the decision to submit for publi-cation. The other authors have no conflict to report.
References 1. Rinkel GJ, Djibuti M, Algra A, van Gijn J. Prevalence and risk of rupture
of intracranial aneurysms: a systematic review. Stroke. 1998;29:251–256. 2. Linn FH, Rinkel GJ, Algra A, van Gijn J. Incidence of subarachnoid
hemorrhage: role of region, year, and rate of computed tomography: a meta-analysis. Stroke. 1996;27:625–629.
3. Vlak MH, Algra A, Brandenburg R, Rinkel GJ. Prevalence of unruptured intracranial aneurysms, with emphasis on sex, age, comorbidity, country, and time period: a systematic review and meta-analysis. Lancet Neurol. 2011;10:626–636.
4. Juvela S, Porras M, Heiskanen O. Natural history of unruptured intracranial aneurysms: a long-term follow-up study. J Neurosurg. 1993;79:174–182.
5. Unruptured intracranial aneurysms—risk of rupture and risks of surgical intervention. International Study of Unruptured Intracranial Aneurysms Investigators. N Engl J Med. 1998;339:1725–33.
6. Wiebers DO, Whisnant JP, Huston J III, Meissner I, Brown RD Jr, Piepgras DG, et al; International Study of Unruptured Intracranial Aneurysms Investigators. Unruptured intracranial aneurysms: natural
history, clinical outcome, and risks of surgical and endovascular treat-ment. Lancet. 2003;362:103–110.
7. UCAS Japan Investigators. The natural course of unruptured cerebral aneurysms in a Japanese cohort. N Engl J Med. 2012;366:2474–2482.
8. Rhoton AL Jr. The supratentorial arteries. Neurosurgery. 2002;51:53–120. 9. Ujiie H, Sato K, Onda H, Oikawa A, Kagawa M, Takakura K, et al.
Clinical analysis of incidentally discovered unruptured aneurysms. Stroke. 1993;24:1850–1856.
10. Yasui N, Suzuki A, Nishimura H, Suzuki K, Abe T. Long-term fol-low-up study of unruptured intracranial aneurysms. Neurosurgery. 1997;40:1155–1159, discussion 1159.
11. Morita A, Kimura T, Shojima M, Sameshima T, Nishihara T. Unruptured intracranial aneurysms: current perspectives on the origin and natural course, and quest for standards in the management strategy. Neurol Med Chir (Tokyo). 2010;50:777–787.
12. Sonobe M, Yamazaki T, Yonekura M, Kikuchi H. Small unruptured intracranial aneurysm verification study: SUAVe study, Japan. Stroke. 2010;41:1969–1977.
13. Weir B. Unruptured intracranial aneurysms: a review. J Neurosurg. 2002;96:3–42.
14. Weir B, Disney L, Karrison T. Sizes of ruptured and unruptured aneu-rysms in relation to their sites and the ages of patients. J Neurosurg. 2002;96:64–70.
15. Wermer MJ, van der Schaaf IC, Algra A, Rinkel GJ. Risk of rupture of unruptured intracranial aneurysms in relation to patient and aneurysm characteristics: an updated meta-analysis. Stroke. 2007;38:1404–1410.
16. Clarke M. Systematic review of reviews of risk factors for intracranial aneurysms. Neuroradiology. 2008;50:653–664.
17. Kataoka K, Taneda M, Asai T, Yamada Y. Difference in nature of rup-tured and unruptured cerebral aneurysms. Lancet. 2000;355:203.
18. Wiebers DO, Whisnant JP, Sundt TM Jr, O’Fallon WM. The sig-nificance of unruptured intracranial saccular aneurysms. J Neurosurg. 1987;66:23–29.
by guest on July 31, 2013http://stroke.ahajournals.org/Downloaded from

Supplementary Table I
Cohort
ISUIA no surgery (n=1692) ref
Weir et al unruptured (n=170) p
UCAS Not Surg (n=3647) p p p p*
Period of recruitment 1991-1998 1967-1987 2001-2004 2007-2012 2007-2012
Baseline characteristics of patients
Age (mean [SD]) 55.2 [13.1] 46[NA] NA 65.0 [10.4] <0.0001 57.35 [14.09] 0.03 56.67 [13.09] NS NS
Gender ratio (% of female) 1261/431 (74.5%) 124/46 (72.9%) NS 2480/1167 (68%) <0.0001 148/43 (77%) NS 262/81 (76%) NS NS
ratio of multiple aneurysms (% cases with multiple lesions) 679/1013 (40.3%) NA NA 1003/2641 (27.5%) <0.0001 59/132 (31%) <0.05 96/247 (28%) <0.001 NS
symptomatic patients 186/1506 [11%] 9% NA 171/5720 [3%] <0.0001 18/173 [9.4%] NS 58/285 [16.9%] <0.01 <0.05
number of aneurysms 2686 NA 6697 291 493
Max aneurysm diameter (mm) (mean [SD]) 7.4 [6.9] 7.76 [0.68"se"] NS 5.3[3.3] <0.0001 5.51 [4.23] <0.001 6.35 [4.8] <0.005 <0.05
Baseline characteristics of aneurysms
Size of aneurysm (number of patients [%])
0-1.9mm 4 [ 2.1%] NA 4 [ 1.2%] NA NS
2-6.9mm 1049 [62%] 79 [55%] NS 122 [63.9%] NS 181 [52.8%] <0.005 <0.05
7-12mm 390 [23%] 40 [28%] NS 50 [26.2%] NS 108 [31.5%] <0.005 NS
13-24 198 [12%] 15 [11%] NS 12 [ 6.3%] <0.05 42 [12.2%] NS <0.05
>24mm 55 [ 3%] 9 [ 6%] NS 3 [ 1.6%] NS 8 [ 2.3%] NS NS
Location of aneurysm (number of patients [%] number of aneurysms [%])
Cavernous part of carotid artery 210 [12.4%] 18 [10.6%] NS 22 [12%] 25[ 3%] NS 37 [11%] 42[ 3%] NS NS
Internal carotid artery 387 [22.9%] 22 [13.9%] <0.01 68 [36%] 81[28%] <0.0005 121 [35%] 144[29%] <0.0001 NS
Anterior communicating or anterior cerebral artery 175 [10.3%] 22 [13.9%] NS 58 [30%] 61[21%] <0.0001 82 [24%] 87[18%] <0.0001 NS
Middle cerebral artery 475 [28.1%] 61 [35.9%] <0.05 65 [34%] 82[28%] NS 114 [33%] 139[28%] NS NS
Posterior communicating artery 246 [14.5%] 37 [21.8%] <0.05 18 [ 9%] 19[ 6%] NS 39 [11%] 41[ 8%] NS NS
Vertebrobasilar system (other than basilar tip) 87 [ 5.1%] 5 [ 2.9%] NS 15 [ 8%] 15[ 5%] NS 21 [ 6%] 21[ 4%] NS NS
Tip of basilar artery 112 [ 6.6%] 5 [ 2.9%] NS 8 [ 4%] 8[ 3%] NS 19 [ 6%] 19[ 4%] NS NS
NS: non significant
NA: not available
p: p-value compared to ISUIA
p*: p-value comparing both @neurIST cohorts
Consecutive C. noSAH (N=191)
Total @neurist C. no SAH (N=343)
by guest on July 31, 2013http://stroke.ahajournals.org/Downloaded from

Supplementary Table II
Cohort Total UCAS cohort Not Surgically Surgically Consecutive cohort Total cohort
Treated before Treated before No SAH No SAH
Rupture Rupture
(N = 6697) (N = 3647) (N = 3050) (N=187) p p* (N=339) p p*
maximal aneurysm size
≥7 mm 1711 [25.5] 786 [21.6] 925 [30.3] 65 [34.8] <0.01 <0.0001 158 [46.6] <0.0001 <0.0001
3-4 mm 3132 [46.8] 2000 [54.8] 1132 [37.1]
5-6 mm 1854 [27.7] 861 [23.6] 993 [32.6]
p = compared to Total UCAS cohort
p*= compared to Not Surgically Treated before Rupture group from UCAS
<0.0001
UCAS @neurIST
4986 [74.5] 2861 [78.4] 2125 [69.7] 122 [65.2] <0.01 <0.0001 181 [53.4] <0.0001
by guest on July 31, 2013http://stroke.ahajournals.org/Downloaded from

Supplementary Table III
Total
% % % % p p* % p p*
Middle cerebral artery 2425 36.2 1210 33.2 1215 39.8 82 31 NS NS 139 31 <0.05 NS
Anterior communicating artery 1037 15.5 530 14.5 507 16.6 47 18 NS NS 63 14 NS NS
Internal carotid artery 1245 18.6 696 19.1 549 18 77 29 <0.001 <0.001 131 29 <0.001 <0.001
Internal carotid–posterior communicating artery 1037 15.5 602 16.5 435 14.3 23 9 <0.005 <0.001 54 12 <0.05 <0.05
Basilar tip and basilar–superior cerebellar artery 445 6.6 327 9 118 3.9 13 5 NS <0.05 25 6 NS <0.05
Vertebral artery–posterior inferior cerebellar artery and vertebrobasilar junction 123 1.8 80 2.2 43 1.4 8 3 NS NS 13 3 NS NS
Other 385 5.7 202 5.5 183 6 16 6 NS NS 27 6 NS NS
Total 6697 3647 3050 266 452
p = probability their is a difference compared to UCAS total
p*= probability their is a difference compared to UCAS Not surgical group
UCAS @neurIST
Not surgically treated before rupture
Surgically treated before rupture
Consecutive cohort no SAH
Total @neurIST C. no SAH
by guest on July 31, 2013http://stroke.ahajournals.org/Downloaded from

Supplementary Table IV
Cohort
ISUIA no surgery (n=1692) ref
UCAS Not Surg (n=3647) p
Consecutive C. noSAH (N=191) p
Total @neurist C. no SAH (N=343) p p*
Consecutive cohort (N=404) p
Total @neurist cohort (N=932) p p*
Medical History
Hypertension 732 (43·6%) 1665 (45.6%) NS 68 (35.6%) <0.05 144(42.0%) NS NS 110 (27.2 %) <0.001 320 (34.3 %) <0.001 <0.01
Hypertension therapy 637 (37·8%) 60 (31.4%) NS 126(36.7%) NS NS 88 (21.7 %) <0.001 258 (27.7 %) <0.001 <0.001
Valvular disease 37 (2·2%) 3/158 (1.9%) NS 4/305(1.3 %) NS NS 3 (1 %) NS 8 (1 %) <0.05 NS
Family History
Aneurysms 276 (18·4%) 416 (11.4%) <0.0001 15 (7.9%) <0.005 45 (13.1%) NS NS 22 (5.4%) <0.001 88 (9.4 %) <0.001 NS
Behavioural history
Alcohol (>5 drinks per week) 502 (30·2%) 29 (15.2%) <0.0001 54 (15.7%) <0.0001 NS 58 (14.4 %) <0.001 175 (18.7 %) <0.001 NS
Current smoker 693 (41·1%) 54 (28.3%) <0.001 92 (26.8%) <0.0001 NS 98 (24.2 %) <0.001 258 (28 %) <0.001 NS
551 (15%) <0.0001
Former smoker 602 (35·7%) 30 (15.7%) <0.0001 78 (22.7%) <0.0001 NS 57 (14.1 %) <0.001 204 (22 %) <0.001 <0.001
Use of stimulants 79 (4·7%) 5 (2.6%) NS 10 (2.9%) NS NS 6 [1.5%] <0.005 12 (1.3 %) <0.0001 NS
Associated disorders
Coarctation of aorta 9 (0·5%) 2 (0.9%) NS 3 (0.9%) NS NS 3 (0.7%) NS 4 (0.4%) NS NS
Polycystic kidney disease 25 (1·6%) 11 (0.3%) <0.0001 7 (3.6%) NS 10 (3%) <0.05 NS 8 (1.8%) NS 12(1.3%) NS NS
Arteriovenous malformation 34 (2·0%) 2 (0.9%) NS 3 (0.9%) NS NS 3 (0.7%) <0.06 7 (0.7%) <0.01 NS
Ehlers-Danlos syndrome 0 (0%) 1 (0.5%) NS 1(0.3%) NS NS 1 (0%) NS 1(0.1%) NS NS
Neurofibromatosis 0 (0%) 0 (0%) NS 0 (0%) NS NS 0 (0%) NS 1 (0.1%) NS NS
Tuberous sclerosis 0 (0%) 0 (0%) NS 0 (0%) NS NS 0 (0%) NS 0 (0%) NS NS
Moyamoya disease 0 (0%) 0 (0%) NS 1 (0.3%) NS NS 1 (0.2%) NS 2 (0.2%) NS NS
Hypocoagulable state 6 (0·4%) 0 (0%) NS 2 (0.6%) NS NS 0 (0%) NS 3 (0.3%) NS NS
Fibromuscular disease 14 (0·9%) 0 (0%) NS 0 (0%) NS NS 0 (0%) NS 2 (0.2%) NS NS
by guest on July 31, 2013http://stroke.ahajournals.org/Downloaded from

Supplementary Figure I
by guest on July 31, 2013http://stroke.ahajournals.org/Downloaded from

Supplemantal Table and Figure Legends
Supplementary table I: Base line characteristics of patients and aneurysms for cohorts of cases with unruptured aneurysms.
Supplementary table II:Distribution of aneurysms by size in UCAS and @neurIST no SAH cohorts.
Supplementary table III:Distribution of aneurysms by location in UCAS and @neurIST no SAH cohorts.
Supplementary table IV: Medical, family and behavioural history and associated disorders characteristics for all cohorts.
Supplementary figure I:
Odds of aneurysms discovered rupture versus unruptured for each location compared to the odds of all other aneurysms
included in the consecutive cohort (CC). N is the number of aneurysms observed for each location or location cluster.
by guest on July 31, 2013http://stroke.ahajournals.org/Downloaded from

Nature GeNetics ADVANCE ONLINE PUBLICATION �
l e t t e r s
Saccular intracranial aneurysms
are balloon-like dilations
of the intracranial arterial wall; their hemorrhage commonly results in severe neurologic impairment and death. We report a second genome-wide association study with discovery and replication cohorts from Europe and Japan comprising 5,89� cases and �4,�8� controls with ~832,000 genotyped and imputed SNPs across discovery cohorts. We identified three new loci showing strong evidence for association with intracranial aneurysms in the combined dataset, including intervals near RBBP8 on �8q��.2 (odds ratio (OR) = �.22, P = �.� × �0−�2), STARD13-KL
on �3q�3.� (OR = �.20, P = 2.5 × �0−9)
and a gene-rich region on �0q24.32 (OR = �.29, P = �.2 × �0−9). We also confirmed prior associations near SOX17 (8q��.23–q�2.�; OR = �.28, P = �.3 × �0−�2) and CDKN2A-B (9p2�.3; OR = �.3�, P = �.5 × �0−22). It is noteworthy that several putative risk genes play a role in cell-cycle progression, potentially affecting the proliferation and senescence of progenitor-cell populations that are responsible for vascular formation and repair.
Intracranial aneurysms affect approximately 2% of the general popula-tion and arise from the action of multiple genetic and environmental risk factors1. We previously reported the first genome-wide association study (GWAS) of intracranial aneurysms2 that identified three risk loci on chromosomes 8q11.23–q12.1, 9p21.3 and 2q33.1 with P < 5 × 10⁻⁸.
This previous study had limited power to detect loci imparting geno-typic relative risk (GRR) < 1.35 (Supplementary Table 1).
To increase the power to detect additional loci of similar or smaller effect, we ascertained and whole-genome sequenced
two new
European case cohorts (n = 1,616) and collected genotyping data from five additional European control cohorts (Supplementary Note, n = 11,955). We also increased the size of the original Japanese rep-lication cohort and added a new Japanese replication cohort (2,282 affected individuals (cases) and 905 controls) (Table 1). The new com-bined cohort had nearly threefold more cases than the original cohort and increased our power to detect variants with modest effect sizes. For example, this study had 89% and 64% average power to detect common variants (minor allele frequencies (MAF) ≥ 10%) with GRR of 1.25 and 1.20, respectively (Supplementary Table 1).
All subjects were genotyped using the Illumina platform. The new as well as the previously analyzed genotyping data were subjected to well-established quality-control measures (Supplementary Table 2). We sought to eliminate potential confounding due to population stratification and gender1,3 by matching cases and controls of the same gender based on inferred genetic ancestry. As previous studies demonstrated that the Finnish population forms an ancestry cluster distinct from other European populations similar to
those included in
this study4,5, we analyzed our Finnish cohort independently from the others. To maximize opportunities for genetic matching and analytic power, we analyzed all subjects in the remaining European cohorts together. The resulting matched case-control data consisted of 808
Genome-wide association study of intracranial aneurysm identifies three new risk lociKatsuhito Yasuno1–3*, Kaya Bilguvar1–3, Philippe Bijlenga4, Siew-Kee Low5, Boris Krischek6, Georg Auburger7, Matthias Simon8, Dietmar Krex9, Zulfikar Arlier1–3, Nikhil Nayak1–3, Ynte M Ruigrok10, Mika Niemela11, Atsushi Tajima12, Mikael von und zu Fraunberg13, Tamas Doczi14, Florentina Wirjatijasa7, Akira Hata15, Jordi Blasco16, Agi Oszvald17, Hidetoshi Kasuya18, Gulam Zilani19, Beate Schoch20, Pankaj Singh21,22, Carsten Stüer23, Roelof Risselada24, Jürgen Beck17, Teresa Sola25, Filomena Ricciardi7, Arpo Aromaa26, Thomas Illig27, Stefan Schreiber28, Cornelia M van Duijn29,30, Leonard H van den Berg10, Claire Perret31, Carole Proust31, Constantin Roder6, Ali K Ozturk1–3, Emília Gaál1–3,11, Daniela Berg32, Christof Geisen33, Christoph M Friedrich34, Paul Summers19, Alejandro F Frangi35, Matthew W State3,36,37, H Erich Wichmann27, Monique M B Breteler29,30, Cisca Wijmenga38, Shrikant Mane39, Leena Peltonen40, Vivas Elio25, Miriam C J M Sturkenboom26, Patricia Lawford41, James Byrne19, Juan Macho16, Erol I Sandalcioglu20, Bernhard Meyer23, Andreas Raabe17, Helmuth Steinmetz7, Daniel Rüfenacht42, Juha E Jääskeläinen13, Juha Hernesniemi11, Gabriel J E Rinkel10, Hitoshi Zembutsu5, Ituro Inoue12, Aarno Palotie40, François Cambien31, Yusuke Nakamura5, Richard P Lifton3,43,44 & Murat Günel1–3
*A full list of author affiliations appears at the end of the paper.
Received 10 December 2009; accepted 9 March 2010; published online XX XX 2010; doi:10.1038/ng.XXX

2 ADVANCE ONLINE PUBLICATION Nature GeNetics
l e t t e r s
cases and 4,393 controls in the Finnish cohort and 1,972 cases and 8,122 controls in the rest of the combined European cohort (Supplementary Table 3). We used the genotype data that passed quality-control filters
and phased chromosomes from the HapMap CEU sample to impute missing genotypes6. We based our further analyses on 831,534 SNPs that passed the quality-control filters both in the Finnish and European samples (Table 1 and Supplementary Table 2).
We tested for association of each quality control–passed SNP with intracranial aneurysms using conditional logistic regression, assum-ing a log-additive effect of allele dosage. We corrected each cohort for residual overdispersion (Table 1) using genomic control7, and com-bined the results from the Finnish and European cohorts to obtain P values, ORs and CIs for the discovery cohort of 2,780 cases and 12,515 controls using a fixed-effects model.
To evaluate the strength of association, in addition to obtaining
P values, we employed a Bayesian approach8. We used the Bayes fac-tor that represents the fold-change of the odds of association before and after observing the data9 and the posterior probability of asso-ciation (PPA), calculated through the Bayes factor, that provides a simple probabilistic measure of the evidence of association8,10. For every SNP, we assumed a uniform prior probability of association of 1/10,000 and set the prior of the logarithm of the per-allele OR as a normal distribution with a 95% probability for the OR to be between 0.67 and 1.5, with larger weights for smaller effect sizes9,11.
From the discovery results, we eliminated two imputed SNPs that showed PPAs of 0.97 and 0.94 because their association signals
were not supported by surrounding geno-typed SNPs and because their genotypes were not confirmed by direct genotyping results (data not shown
). This resulted in
831,532 SNPs that passed quality control (Supplementary Table 2).
We observed three regions that showed very high PPA (>0.995; Fig. 1a) and also a substan-tial excess of SNPs with P < 1 × 10⁻³ (1,295 SNPs versus 831 SNPs expected by chance) even after excluding those within previ-ously identified associated regions2 (Fig. 1b). Moreover, we observed a strong correlation between the P values and Bayes factors for the upper tail of the distribution (Fig. 1c).
We focused on five genomic regions (Fig. 1a) that contained at least one SNP with PPA >0.5 for which the hypothesis of association with intracranial aneurysm was more likely than the null hypothesis of no
association. The PPAs of the most highly associated SNPs in these intervals ranged from 0.6621 to >0.9999 and the P values ranged from 7.9 × 10⁻⁷ to 2.2 × 10⁻¹⁶ (Supplementary Table 4). The five chromosomal segments included three newly identified SNP clusters at 10q24.32, 13q13.1 and 18q11.2. The remaining two regions were previously identified loci at 8q11.23–q12.1 and 9p21.3 (Fig. 2; ref. 2). The third locus identified in our previous study, at 2q33, did not contain any SNPs with PPA >0.5. Furthermore, consistent with our previous results2, detailed analysis of the 8q11.23–q12.1 region detected two independent association signals within the <100-kb interval that spans the SOX17 locus (Fig. 2 and Supplementary Fig. 1); these two signals are hereafter referred to as 5′-SOX17 and 3′-SOX17
. Thus, the five chromosomal segments comprised six
independent association signals for follow-up.We performed replication genotyping in two Japanese cohorts
including 3,111 cases and 1,666 controls (JP1 and JP2, see Table 1). For each independent signal, we selected for replication the geno-typed SNP with the highest PPA and added up to two additional SNPs per locus. For the 5′-SOX17 region, we selected two SNPs analyzed previously, as they tag the best
SNP in the current study
(Supplementary Fig. 1).
table 1 Overview of the study cohorts
Cohort Case (n) Control (n)Quality control-passed
SNPs (n) GIF
Discovery Finland (FI) 808 4,393 1,303,876 1.070
Combined European (CE) 1,972 8,122 905,906 1.090
Total discovery 2,780 12,515 831,532 1.007
CE sub-cohorts NL 708 3,954 905,906 1.110
DE 789 2,228 905,906 1.060
AN 475 1,940 905,906 1.060
Replication Japan 1 (JP1) 829 761 12
Japan 2 (JP2) 2,282 905 13
Total replication 3,111 1,666 12
Total 5,891 14,181 12
Combined
European cohort consisted of all European subjects who were not ascertained in Finland. Sub-cohorts of
the European cohort were defined on the basis of case series; NL, cases from The Netherlands with matched controls; DE, German cases with matched controls; AN, @neurIST cases with matched controls. NL, DE and AN were exclusive subsets of the European cohort
(see also supplementary table 3). AN cases consisted of subjects from Germany, Great
Britain, Hungary, The Netherlands, Switzerland and Spain. JP1 and JP2 were two independent Japanese case-control cohorts. Genomic inflation factors of the Finnish and European cohorts (as well as NL, DE and AN) were calculated for 1,303,876 and 905,906 SNPs, respectively. The genomic inflation factor of the discovery cohort (total discovery) was based on the meta-analysis result for 831,532 SNPs after correcting each cohort for genomic control. The discovery data (combined Finnish and European cohorts) was not corrected for genomic control. GIF, genomic inflation factor.
1.00.90.80.70.60.5
PPA
0.40.30.20.1
15
10
Obs
erve
d
–log
10(P
)
5
0 1 2 3 4 5 6 0 2 4 6log10(BF)
PPA[0.0,0.01](0.01,0.1](0.1,0.5](0.5,0.9](0.9,0.99](0.99,0.999](0.999,1.0]
8 10 12 14Expected
0
15
10
5
0
1 2 3 4 5 6 7 8Chromosome
9 10 11 12 13 14 15 16 17 18 19 20 21 220
a
b c
Figure 1 Genome-wide association analysis results in the discovery cohort. (a) The PPAs for 831,532 quality control–passed SNPs that were analyzed specifying a prior probability of association of 1/10,000 are plotted against genomic locations of SNPs. A gray horizontal line at PPA = 0.5 indicates the cutoff value for follow-up genotyping. (b) Quantile-quantile plots of P values (−log10 scale) are shown for all the SNPs analyzed (black; n = 831,532); SNPs after excluding those within previously identified regions (red; n = 830,907); and SNPs after excluding all within the final associated intervals (blue; n = 830,158). (c) A scatter plot of −log10 P versus log10 Bayes factors is shown with color for each point indicating the range of PPA values. There are very close relationships among the P values for association, the Bayes factor and the PPA value. Note that, given a uniform prior probability of association, the PPA increases as the Bayes factor increases. A vertical line indicates the minimum PPA threshold at 0.5 (Bayes factor = 1.0 × 10⁴) for follow-up.

Nature GeNetics ADVANCE ONLINE PUBLICATION 3
l e t t e r s
All but one of the SNPs (rs12411886 on 10q24.32 in JP1) were successfully genotyped and passed quality-control filters. We tested for association of each SNP with intracranial aneurysm using logistic regression stratified by gender, specifying the same model as for the discovery cohort (Supplementary Table 5). We combined results from JP1 and JP2 using a fixed-effects model (Table 2 and Supplementary Table 4). We considered an association to be replicated if the Bayes factor increased the odds of association more than tenfold after observing the replication data
.
Of the six candidate loci, all but the 5′-SOX17 interval were rep-licated, with replication P values ranging from 0.0019 to 1.0 × 10⁻⁷, and the odds of association with intracranial aneurysm increasing by 22.9-fold
to 1.5 × 10⁵-fold, yielding robust evidence for replication
for each interval (Table 2).We combined the discovery and replication results using a fixed-
effects model. All of the five loci that replicated in the Japanese cohort surpassed the conventional threshold for genome-wide significance (P < 5 × 10⁻⁸), with P values ranging from 2.5 × 10⁻⁹ to 1.5 × 10⁻²², and all also had PPAs ≥ 0.998 (Table 2).
In order to determine each cohort’s contribution to the observed association and to assess the consistency of the effect size across cohorts, we analyzed each ascertained cohort separately (Table 1 and Supplementary Table 5) and then combined the results from the six cohorts using a random-effects model. The association results remained highly significant (Fig. 3). For the five loci that were rep-licated in the Japanese cohorts, we found no evidence of significant heterogeneity across cohorts (P > 0.1). Every cohort had the same risk allele and provided support for association with the exception of JP1 cohort for the 3-SOX17 locus, consistent with our previous study2 (Fig. 3).
The most significant association was detected in the previously reported2 9p21.3 region near CDKN2A and CDKN2B with P = 1.5 × 10⁻²² (OR = 1.32, PPA > 0.9999). All of the newly studied cohorts strongly supported this association with intracranial aneurysm (Fig. 3). These same alleles are also associated with coronary artery dis-ease, but not with type 2 diabetes12. Similarly, the previously reported 8q11.23–q12.1 region showed significant association. The 3′-SOX17
interval (rs92986506) showed robust association with P = 1.3 × 10⁻¹² (OR = 1.28, PPA > 0.9999) and all new cohorts supported the associa-tion of this SNP with intracranial aneurysm (Fig. 3). For the 5′-SOX17 region (rs10958409), the new cohorts introduced a substantial hetero-geneity across cohorts, lowering the PPA to 0.016 (Fig. 3).
Among the newly identified loci, the strongest association was found at rs11661542 on 18q11.2 (OR = 1.22, P = 1.1 × 10⁻¹², PPA > 0.9999). A cluster of SNPs that are associated with intracranial aneu-rysm spans the interval between 18.400 Mb and 18.509 Mb and are strongly correlated with rs11661542 (Fig. 2). A single gene, RBBP8 (encoding the
retinoblastoma binding protein 8), is located within
an extended linkage disequilibrium interval (Fig. 2).The second strongest new association was at rs12413409 on
10q24.32 (OR = 1.29, P = 1.2 × 10⁻⁹, PPA = 0.9990), which maps to intron 1 of CNNM2 (encoding cyclin M2) (Fig. 2). A cluster of SNPs strongly correlated with rs12413409 and located within a ~247-kb interval in the same linkage disequilibrium block supported the asso-ciation (Fig. 2).
The third new locus is defined by rs9315204 at 13q13.1 (OR = 1.20, P = 2.5 × 10⁻⁹, PPA = 0.9981) in intron 7 of STARD13 (encoding the STAR
-related lipid transfer (START) domain containing 13)
(Fig. 2). Two SNPs, rs1980781 and rs3742321, that are strongly cor-related with rs9315204 (r2 > 0.9) also showed significant association with intracranial aneurysm (Fig. 2 and Supplementary Table 4). These two SNPs are missense (lysine to arginine) and synonymous coding variants of STARD13, respectively. Another gene that has been implicated in aging phenotypes, KL (also known as
KLOTHO), is
located nearby13.
13 109876543210
rs10958409
SOX17
rs1333040
MTAP
CDKN2A
NOLC1 C10orf95
ELOVL3NFKB2
PSD
FBXL15
CUEDC2SUFU
ACTR1A
TRIM8
ARL3AS3MT
C10orf32
CYP17A1
CNNM2
NT5C2
INA
PCGF6
TAF5CALHM1
CALHM2
PDCD11
USMG5CALHM3
NEURL
SH3PXD2ASFXN2C10orf26
TMEM180
PITX3
GBF1
CDKN2B
rs12413409
RP1
PDS5B
KLSTARD13
CTAGE1
RBBP8
CABLES1
RIOK3LAMA3
C18orf8
C18orf45ANKRD29
NPC1
rs9298506 rs9315204
rs11661542
Chromosome 8q11.23–q12.1 Chromosome 13q13.1
Chromosome 18q11.2
121110
–log
10(P
)
–log
10(P
)–l
og10
(P)
cM/M
b
9876543210
40
20
2220181614121086420
10080604020
10987654
40
20
104.0 104.5 105.00
3210
21.8 21.9 22.0 22.1
Position (Mb) Position (Mb)
Discovery (genotyped)Discovery (imputed)Replication (JP1 + JP2)Replication (JP2)Combined (Discovery + JP1 + JP2)Combined (Discovery + JP2)
Position (Mb)
Chromosome 10q24.32
22.2 22.30
055.3 55.4 55.5
Position (Mb) Position (Mb)
Chromosome 9p21.3
55.6 55.7 55.8 32.2
18.0 18.5 19.0 19.5
32.4 32.6 32.8 33.0
–log
10(P
)–l
og10
(P)
cM/M
bcM
/Mb
10080604020
0
cM/M
bcM
/Mb
13121110
9876543210
40
20
0
Figure 2 Regional plots for associated regions. For each chromosomal interval, −log10 P values for association are plotted against the genomic coordinates (NCBI build 36) above; the recombination rates obtained from the HapMap database and the RefSeq genes (hg18) within the regions are shown below. Above, rs identifiers of SNPs listed in table 2 are shown and their positions are indicated by gray vertical lines. Gray dashed lines indicate locations of other SNPs genotyped in the replication cohorts. Dark blue and light blue dots represent results of genotyped and imputed SNPs for the discovery cohort, respectively; orange and light orange squares represent association results for the replication cohort using JP1 combined with JP2 and also JP2-only, respectively; combined results for SNPs genotyped both in the discovery and the replication cohort using JP1 plus JP2 and JP2-only are shown by red and light red diamonds, respectively.

4 ADVANCE ONLINE PUBLICATION Nature GeNetics
l e t t e r s
A search of the gene-expression database (eQTL browser, see URLs) for all the intracranial aneurysm-risk loci did not reveal any consistent pattern of association of intracranial aneurysm SNPs with variation in gene expression levels.
In this second GWAS of intracranial aneurysm, which included nearly three times as many cases as the initial study, we detected three new risk loci and obtained strong independent evidence for asso-ciation of two previously identified loci. The evidence that these are
table 2 representative sNPs analyzed both in the discovery and replication cohorts
Locus SNP Position GenesRisk allele Cohort P value log10 (Bayes) PPA
Per-allele OR (95% CI) Control RAF Case RAF
8q11.23 rs10958409 55,489,644 SOX17 A Discovery 4.2 × 10⁻⁷ 4.64 0.8128 1.24 (1.14–1.35) 0.15, 0.19 0.18, 0.22
Replication 0.12 –0.11 1.08 (0.98–1.20) 0.28 0.29
Combined 9.0 × 10⁻⁷ 4.30 0.6685 1.17 (1.10–1.25)
8q12.1 rs9298506 55,600,077 SOX17 A Discovery 1.2 × 10⁻¹⁰ 7.94 0.9999 1.33 (1.22–1.45) 0.81, 0.76 0.85, 0.81
Replication 0.0012 1.56 1.21 (1.08–1.36) 0.79 0.81
Combined 1.3 × 10⁻¹² 9.85 1.0–1.4 × 10⁻⁶ 1.28 (1.20–1.38)
9p21.3 rs1333040 22,073,404 CDKN2A, CDKN2B
T Discovery 2.5 × 10⁻¹⁶ 13.41 1.0–3.9 × 10⁻¹⁰ 1.32 (1.24–1.41) 0.56, 0.45 0.63, 0.53
Replication 1.0 × 10⁻⁷ 5.18 1.31 (1.19–1.45) 0.66 0.72
Combined 1.5 × 10⁻²² 19.48 1.0–3.3 × 10⁻¹⁶ 1.32 (1.25–1.39)
10q24.32 rs12413409 104,709,086 CNNM2 G Discovery 7.9 × 10⁻⁷ 4.29 0.6621 1.38 (1.22–1.57) 0.91, 0.91 0.94, 0.93
Replication 0.00014 2.34 1.23 (1.10–1.37) 0.74 0.77
Combined 1.2 × 10⁻⁹ 7.00 0.9990 1.29 (1.19–1.40)
13q13.1 rs9315204 32,591,837 KL, STARD13 T Discovery 3.3 × 10⁻⁷ 4.73 0.8443 1.21 (1.13–1.31) 0.21, 0.33 0.24, 0.39
Replication 0.0019 1.36 1.18 (1.06–1.31) 0.24 0.27
Combined 2.5 × 10⁻⁹ 6.72 0.9981 1.20 (1.13–1.28)
18q11.2 rs11661542 18,477,693 RBBP8 C Discovery 5.6 × 10⁻⁹ 6.39 0.9959 1.21 (1.14–1.30) 0.49, 0.44 0.54, 0.47
Replication 4.5 × 10⁻⁵ 2.79 1.22 (1.11–1.34) 0.61 0.65
Combined 1.1 × 10⁻¹² 9.92 1.0–1.2 × 10⁻⁶ 1.22 (1.15–1.28)
Genomic locations for SNPs are based on NCBI build 36, and risk alleles are aligned to the forward strand of the reference sequence. Control and case risk allele frequencies (RAFs) for the dis-covery cohort are shown in the form: RAF of European cohort, RAF of Finnish cohort. Log10 (Bayes) indicates the logarithm of the Bayes factor in favor of association. PPA, posterior probability of association. Genes closest to the listed SNPs within the same LD regions are shown.
Heterogeneity: τ2 = 0.0056, I
2 = 45.7, P = 0.10
Heterogeneity: τ2 = 0.0, I
2 = 0.0, P = 0.81
Heterogeneity: τ2 = 0.0, I
2 = 0.0, P = 0.87 Heterogeneity: τ2
= 0.0, I2 = 0.0, P = 0.79
Heterogeneity: τ2 = 0.0015, I
2 = 16.4, P = 0.31
Heterogeneity: τ2 = 0.00086, I
2 = 11.7, P = 0.34
8q:rs10958409 8q:rs9298506
10q:rs12413409
18q:rs1166154213q:rs9315204
9p:rs1333040
FI
FI
FI
FI
NL
NL
NL NL
DE
DE
DE DE
AN
AN
AN AN
JP1
JP1
JP1 JP1
JP2
JP2
JP2 JP2
Fixed-effects
Fixed-effects
Fixed-effects Fixed-effects
Random-effects
Random-effects
Random-effects
FI
FI
NL
NL
DE
DE
AN
AN
JP1
JP1
JP2
JP2
Fixed-effects
Fixed-effects
Random-effects
Random-effects
Random-effects
1.00
1.00
1.00
1.00
1.00
1.00
1.26 1.26
1.26
1.12
1.581.45
1.45 1.45
1.32
1.32 1.32
1.20
1.20 1.20
1.10
1.10 1.10
1.12
1.12
Odds ratio (log scale)
Odds ratio (log scale)
Odds ratio (log scale) Odds ratio (log scale)
Odds ratio (log scale)
Odds ratio (log scale)
1.41 1.41
1.41
1.58 1.58
1.58 1.78 2.00
1.23
1.39
1.20
1.20
1.20
1.16
1.15
1.13
1.25
1.27
1.32
1.32
1.26
1.41
1.25
1.31
1.30
1.39
1.27
1.22
1.22
1.20
1.24
1.19
1.30
1.23
1.14
1.29
1.29
1.21
1.27
1.44
1.66
1.23
1.43
1.34
1.15
1.14
1.25
1.28
1.28
0.0051
0.00040
0.0080
1.2E–22
1.2E–22
3.4E–05
5.4E–05
4.8E–05
5.3E–08
0.010
0.078
0.14
0.11
0.0026
0.00017
2.4E–09
2.4E–09
1.0E–05
4.6E–09
4.4E–05
9.1E–13
9.1E–13
0.0062
0.0073
0.021
0.096
0.042
0.00087
0.0023
0.0061
0.044
0.023
1.1E–09
4.9E–05
4.0E–05
1.8E–10
1.6E–12
0.0022
0.19
0.011
0.11
0.00011
0.30
0.013
0.061
0.60
1.03
19.59
19.59
1.94
2.76
0.88
2.66
2.72
5.29
6.74
6.74
0.79
0.15
0.02
0.04
1.26
2.25
2.66
7.79
9.76
1.33
–0.06
0.76
0.05
3.22
7.06
6.46
0.96
0.91
0.50
2.27
0.15
0.37
10.01
10.01
1.31
0.97
0.33
2.74
1.66
0.47
2.34
–0.22
–0.46
0.71
0.23
4.35
2.21
8.1E–07
0.00019
OR
OR
OR
OR
OR
OR
P
P
P
P
P
P
log10(BF)
log10(BF)
log10(BF)
log10(BF)
log10(BF)
log10(BF)
PPA
PPA
PPA
PPA
PPA
PPA
1.36
1.09
1.32
0.6914
> 0.9999
> 0.9999
0.9982
0.9982
0.9998
> 0.9999
0.9965
0.9991
> 0.9999
> 0.9999
0.0161
1.17
1.04
1.17
1.18
Figure 3 Consistency of association across cohorts. Forest plots are shown for meta-analysis of the SNPs listed in table 2. Squares and horizontal segments represent estimated per-allele ORs and 95% CIs for individual cohorts. Diamonds represent the summary OR estimates and 95% CIs for the meta-analyses of six cohorts (using
fixed- and random-effects models). Log10 (Bayes factor) > 0 supports association with intracranial aneurysm, whereas log10 (Bayes factor) < 0
supports no association with intracranial aneurysm. Analyzing the results here as six distinct cohorts rather than four cohorts (as in the primary analysis) resulted in only minor differences due to different weights given to sub-cohorts of the combined European cohort associated with genomic control correction.

Nature GeNetics ADVANCE ONLINE PUBLICATION 5
l e t t e r s
bona fide risk loci for intracranial aneurysm is very strong from both Bayesian measures and conventional P values.
Given our power (~90%) to detect variants that confer risk of intracranial aneurysm with GRR = 1.25 and MAFs ≥ 10%, we expect that we have identified most of these variants, limited principally by potential gaps in SNP coverage. Indeed, across the rest of the genome, there was no locus with PPA >0.22 and MAF ≥10%, whereas there were 14 loci with PPAs between 0.1 and 0.22 and ORs between 1.16 and 1.25 (data not shown). We expect that a fraction of these loci are genuine intracranial aneurysm risk loci, as suggested by the excess of SNPs with P < 1 × 10⁻³ (Fig. 1b); exploring this possibility will require analysis of larger intracranial aneurysm cohorts and/or genotyping of alleles with lower MAF.
Based on the results of the first GWAS of intracranial aneurysm and the role of the implicated gene products, encoded by SOX17 and in individuals with the genotype P15INK4b; P16INK4a, we previously hypothesized2 that the genes associated with intracranial aneurysm might play a role in determining cell cycle progression, and may affect the proliferation14 and senescence of progenitor-cell populations and/or the balance between production of progenitor cells versus cells committed to differentiation
. Genes located within the newly
identified regions support this idea. The protein encoded by RBBP8, located within the 18q11.2 region, influences progression through the cell cycle by interacting with BRCA115. Similarly, of the two genes located within the 13q13.1 interval, STARD13 contains the Rho-GAP and C-terminal STAR-related lipid transfer (START) domains and its overexpression results in suppression of cell proliferation16. The other gene implicated here
, KL, encodes a transmembrane protein that
modulates FGF receptor specificity17; mice lacking KL show acceler-ated aging in diverse organ systems13.
On the assumption that there is a fourfold increase in the risk of intracranial aneurysm among siblings of cases18,19 and that the SNPs combine to increase log-odds of disease in an additive fashion, the five intracranial aneurysm risk loci explain 5.2% (within the Finnish cohort), 4.0% (in the European cohort) and 3.5% (in the combined JP1 and JP2 cohort) of the familial risk of intracranial aneurysm. Under this model, the odds of developing an intracranial aneurysm varies 4.99- to 7.63-fold across the top and bottom 1% of genetic risk profiles at these loci in the populations studied here and 3.61- to 4.64-fold across the 5% extremes (Supplementary Fig. 2). When combined with traditional risk factors such as gender, blood pressure and smoking, these findings form the basis of future work aimed at preclinical identification of individuals who are at high risk of intra-cranial aneurysm formation and rupture.
URLs. eQTL browser, http://eqtl.uchicago.edu/.
MEthOdSMethods and any associated references are available in the online version of the paper at http://www.nature.com/naturegenetics/.
Note: Supplementary information is available on the Nature Genetics website.
ACKNOWLEDGMENTSWe are grateful to the participants who made this study possible. We thank A. Chamberlain, B. Meseck-Selchow and members of the Keck Foundation Biotechnology Resource Laboratory for their technical help. This study was supported by the Yale Center for Human Genetics and Genomics and the Yale Program on Neurogenetics, the US National Institute of Health (NIH) grants R01NS057756 (M.G.) and U24 NS051869 (S.M.) and the Howard Hughes Medical Institute (R.P.L.). The @neurIST project was funded by European Commission, VI Framework
Programme, Priority 2, Information Society Technologies, a European Public Funded Organization (Research Grant No. IST-FP6-027703). The Frankfurt case cohort collection was supported by BMBF
(01GI9907), Utrecht Control cohort by the Prinses
Beatrix Fonds and the Adessium foundation (L.H.v.d.B.). S.M. was supported in part by the Clinical and Translational Science Award UL1 RR024139, National Center for Research Resources, NIH. We would also like to acknowledge the use of Yale University Biomedical High Performance Computing Center (NIH grant: RR19895).
AuTHOR CONTRIBuTIONSStudy Cohorts: ascertainment, characterization and DNA preparation: M.N., M.v.u.z.F., E.G., J.E.J., J.H. and A.P. (Finnish case-control); Y.M.R. and G.J.E.R. (NL cases); P.B., T.D., J. Blasco., G.Z., P.S., R.R., T.S., C.M.F., P.S., A.F.F., V.E., M.C.J.M.S., P.L., J. Byrne., J.M. and D.R. (@neurIST case series); B.K., G.A., M.S., D.K., F.W., A.O., B.S., C.S., J. Beck., F.R., C.R., D.B., C.G., E.I.S., B.M., A.R. and H.S. (DE case series); A.T., A.H., H.K. and I.I. (JP1); S.-K.L
., H.Z. and Y.N. (JP2).
Control Cohorts: A.A., L.P. and A.P. (Health2000); A.A., L.P. and A.P. (NFBC1966); C.M.v.D. and M.M.B.B. (Rotterdam Study); L.H.v.d.B. and C.W. (Utrecht); T.I. and H.E.W. (KORA-gen); S.S. (PopGen). Genotyping: K.B., Z.A., N.N., A.K.O., E.G., S.M., R.P.L. and M.G. (Yale); C. Perret., C. Proust. and F.C. (Aneurist); S.-K.L., H.Z. and Y.N. (JP2). Data management and informatics: K.Y., K.B., Z.A., N.N. and M.G. (Yale); S.-K.L., H.Z. and Y.N. (JP2 cohort); Statistical analysis: K.Y. and M.G. Writing team: K.Y., K.B., M.W.S., R.P.L. and M.G. Study design and analysis plan: K.Y., R.P.L. and M.G
.
COMPETING FINANCIAL INTERESTSThe authors declare competing financial interests: details accompany the full-text HTML version of the paper at http://www.nature.com/naturegenetics/.
Published online at http://www.nature.com/naturegenetics/. Reprints and permissions information is available online at http://npg.nature.com/reprintsandpermissions/.
1. Rinkel, G.J., Djibuti, M., Algra, A. & van Gijn, J. Prevalence and risk of rupture of intracranial aneurysms: a systematic review. Stroke 29, 251–256 (1998).
2. Bilguvar, K. et al. Susceptibility loci for intracranial aneurysm in European and Japanese populations. Nat. Genet. 40, 1472–1477 (2008).
3. Iwamoto, H. et al. Prevalence of intracranial saccular aneurysms in a Japanese community based on a consecutive autopsy series during a 30-year observation period. The Hisayama study. Stroke 30, 1390–1395 (1999).
4. Salmela, E. et al. Genome-wide analysis of single nucleotide polymorphisms uncovers population structure in Northern Europe. PLoS One 3, e3519 (2008).
5. Jakkula, E. et al. The genome-wide patterns of variation expose significant substructure in a founder population. Am. J. Hum. Genet. 83, 787–794 (2008).
6. Marchini, J., Howie, B., Myers, S., McVean, G. & Donnelly, P. A new multipoint method for genome-wide association studies by imputation of genotypes. Nat. Genet. 39, 906–913 (2007).
7. Devlin, B. & Roeder, K. Genomic control for association studies. Biometrics 55, 997–1004 (1999).
8. Wakefield, J. A Bayesian measure of the probability of false discovery in genetic epidemiology studies. Am. J. Hum. Genet. 81, 208–227 (2007).
9. Wellcome Trust Case Control Consortium. Genome-wide association study of 14,000 cases of seven common diseases and 3,000 shared controls. Nature 447, 661–678 (2007).
10. Stephens, M. & Balding, D.J. Bayesian statistical methods for genetic association studies. Nat. Rev. Genet. 10, 681–690 (2009).
11. Wacholder, S., Chanock, S., Garcia-Closas, M., El Ghormli, L. & Rothman, N. Assessing the probability that a positive report is false: an approach for molecular epidemiology studies. J. Natl. Cancer Inst. 96, 434–442 (2004).
12. Helgadottir, A. et al. The same sequence variant on 9p21 associates with myocardial infarction, abdominal aortic aneurysm and intracranial aneurysm. Nat. Genet. 40, 217–224 (2008).
13. Kuro-o, M. et al. Mutation of the mouse klotho gene leads to a syndrome resembling ageing. Nature 390, 45–51 (1997).
14. Visel, A. et al. Targeted deletion of the 9p21 non-coding coronary artery disease risk interval in mice. Nature 464, 409–412 (2010).
15. Yun, M.H. & Hiom, K. CtIP-BRCA1 modulates the choice of DNA double-strand-break repair pathway throughout the cell cycle. Nature 459, 460–463 (2009).
16. Leung, T.H. et al. Deleted in liver cancer 2 (DLC2) suppresses cell transformation by means of inhibition of RhoA activity. Proc. Natl. Acad. Sci. USA 102, 15207–15212 (2005).
17. Urakawa, I. et al. Klotho converts canonical FGF receptor into a specific receptor for FGF23. Nature 444, 770–774 (2006).
18. Schievink, W.I. Genetics of intracranial aneurysms. Neurosurgery 40, 651–662 discussion 662–663 (1997).
19. Cannon Albright, L.A. et al. A genealogical assessment of heritable predisposition to aneurysms. J. Neurosurg. 99, 637–643 (2003).

� ADVANCE ONLINE PUBLICATION Nature GeNetics
l e t t e r s
1Department
of Neurosurgery and 2Department of Neurobiology, Yale University School of Medicine, New Haven, Connecticut, USA. 3Department of Genetics, Yale
Program on Neurogenetics, Yale Center for Human Genetics and Genomics, Yale University School of Medicine, New Haven, Connecticut, USA. 4Department of Clinical Neurosciences, Service de Neurochirurgie, Geneva University Hospital, Geneva, Switzerland. 5Human Genome Center, Institute of Medical Science, University of Tokyo, Tokyo, Japan. 6Department of Neurosurgery, University of Tuebingen, Tuebingen, Germany
. 7Department of Neurology, Goethe University, Frankfurt am
Main, Germany. 8Department of Neurosurgery, University of Bonn, Bonn, Germany. 9Klinik und Poliklinik für Neurochirurgie Universitätsklinikum Carl Gustav Carus der Technischen Universität Dresden, Dresden, Germany. 10Department of Neurology, Rudolf Magnus Institute of Neuroscience, University Medical Center Utrecht, Utrecht, The Netherlands. 11Department of Neurosurgery, Helsinki University Central Hospital, Helsinki, Finland. 12Division of Molecular Life Science, School of Medicine, Tokai University, Isehara, Kanagawa, Japan. 13Department of Neurosurgery, Kuopio University Hospital, Kuopio, Finland. 14Neurosurgery, University of Pècs Medical School, Pècs, Hungary. 15Department of Public Health, School of Medicine, Chiba University, Chiba, Japan. 16Department of Vascular Radiology, Hospital Clinic, Barcelona, Spain. 17Department of Neurosurgery, Goethe University, Frankfurt am Main, Germany. 18Department of Neurosurgery, Medical Center East, Tokyo Women’s University, Tokyo, Japan. 19Nuffield Department of Surgery, John Radcliffe Hospital, University of Oxford, Oxford, UK. 20Department of Neurosurgery, University Hospital, Essen, Germany. 21Department of Medical Physics and 22Department of Neurosurgery, Royal Hallamshire Hospital, Sheffield, UK. 23Department of Neurosurgery, Technical University of Munich, Munich, Germany. 24Department of Medical Informatics, Erasmus University Medical Center, Rotterdam, The Netherlands. 25Therapeutic Neuroangiography, Hospital General de Catalunya, San Cugat del Valles, Spain. 26Department of Health and Functional Capacity, National Public Health Institute, Helsinki, Finland. 27Institute of Epidemiology, German Research Center for Environmental Health, Helmholtz Zentrum München, Munich, Germany. 28Institute for Clinical Molecular Biology, Christian-Albrechts-University, Kiel, Germany. 29Genetic Epidemiology Unit, Department of Epidemiology and Biostatistics and 30Department of Clinical Genetics, Erasmus Medical Center, Rotterdam, The Netherlands. 31UMR Institut National de la Santé et de la Recherche Medicale (INSERM
) S937—University Pierre and Marie Curie, Paris, France. 32Center of Neurology, Department of Neurodegeneration and Hertie Institute for Clinical
Brain Research, University of Tuebingen, Tuebingen, Germany
. 33Institute of Transfusion Medicine and Immunohaematology, Department of Molecular Haemostasis,
DRK
Blood Donor Service Baden Wuerttemberg and Hessen, Frankfurt am Main, Germany. 34Fraunhofer-Institut for Algorithms and Scientific Computing, Sankt
Augustin, Germany. 35Center for Computational Imaging and Simulation Technologies in Biomedicine, Universitat Pompeu Fabra, Barcelona, Spain. 36Department of Psychiatry and 37Child Study Center, Yale University School of Medicine, New Haven, Connecticut, USA. 38Department of Genetics, University Medical Center Groningen and University of Groningen, Groningen, The Netherlands. 39Keck Foundation Biotechnology Resource Laboratory, Yale University, New Haven, Connecticut, USA. 40Wellcome Trust Sanger Institute, Wellcome Trust Genome Campus, Hinxton, Cambridge, UK. 41Academic Unit of Medical Physics, School of Medicine and Biomedical Sciences, University of Sheffield, Sheffield, UK. 42Neuroradiology - SNI - Clinic Hirslanden
, Zürich, Switzerland. 43Howard Hughes Medical Institute
and 44Department of Internal Medicine, Yale University School of Medicine, New Haven, Connecticut, USA. Correspondence should be addressed to R.P.L. ([email protected]) or M.G. ([email protected]).

Nature GeNeticsdoi:10.1038/ng.563
ONLINE MEthOdSGenotyping. Whole-genome genotyping for the discovery cohort was performed on the Illumina platform according to the manufacturer’s pro-tocol (Illumina). Bead chips used for individual cohorts are presented in Supplementary Table 2. Replication genotyping in the JP1 cohort was performed using either Taqman (Applied Biosystems) or MassARRAY (Sequenom) assays. For the JP2 cohort, genotyping for cases was performed using the multiplex PCR-based Invader assay (Third Wave Technologies Inc.); genotyping for controls was performed on an Illumina platform as described previously20.
Ethics. The study protocol was approved by the Yale Human Investigation Committee (HIC protocol #7680). Institutional review board approval for genetic studies, along with written consent from all study participants, was obtained at all participating institutions.
Data storage and analysis tools. We used PLINK21 v1.06 and R statistical environment v2.9.0 (in particular, the snpMatrix package22) for storage of genotype data and data analysis.
Preprocessing. Prior to the analysis of genotyping data, we excluded SNPs that were located either on mitochondrial DNA or sex chromosomes, SNPs with A/T or C/G alleles, those for which all subjects were assigned as ‘no call’, and those that were assayed on Hap300v1 or 550v1 but were dropped from newer versions
.
Sample quality control. We excluded subjects in the discovery cohort who did not conform to our study design on the basis of genotyping and information quality, cryptic relatedness and population outliers. We summarize the sample exclusion steps in Supplementary Table 2. This filtering process resulted in the inclusion of
835 cases and 6,529 controls in the Finnish cohort and 2,000 cases
and 8,722 controls in the rest of the combined European cohort.
Imputation. We performed imputation analysis with the HapMap phase II CEU reference panel (release 24) using the IMPUTE v1 software6. The analysis was performed separately for the Finnish and European cohorts. We converted posterior probabilities of three possible genotypes to fractional allele dosage scores (between 0 and 2) and used these scores for association tests in order to take into account the imputation uncertainty23. For the quality assessment of imputed SNPs, we also converted the posterior probabilities to the most likely genotypes with the threshold at 0.9.
Case-control matching. Population stratification and independent genotyp-ing of cases and controls are major causes of confounding in GWAS24. Because our study consisted of multiple independently ascertained cohorts that were genotyped separately, we performed a stringent analysis to control for these biases by inferring the genetic ancestries of subjects25,26. We used the Laplacian eigenmaps27 to infer population structure. Following the determination of the number of dimensions (K + 1) using the threshold given in Lee et al.28, we used the K-dimensional nontrivial generalized eigenvectors29 to calculate the Euclidean distance between any
two subjects.
In the course of this analysis, we excluded ‘isolated’ subjects who were identified by using the nearest-neighbor distance distributions in any of the two-dimensional sections. After excluding these subjects, we observed 13 dimensions in the Finnish cohort and 5 dimensions in the European cohort. The larger dimensions observed in the Finnish population could be attribut-able to the presence of many isolated populations in Finland5.
Before matching, we stratified data into males and females because female gender is a known risk factor of intracranial aneurysm1,3. We also set the maximum distance between cases and controls to match to be less than 0.028 in the Finnish cohort and 0.009 in the and European cohort. These values were determined by examining the distribution of the nearest-neighbor distances in K dimensions (data not shown). We matched cases and controls using the fullmatch function in the R-package optmatch30,31.
SNP quality control. For both genotyped and imputed SNPs in the discovery cohort, we applied quality-control filters to individual cohorts and to cases
and controls separately on the basis of the missing rate, MAF and the P value of the exact test of Hardy-Weinberg equilibrium32. For imputed SNPs, we also assessed imputation quality using the average posterior probability, MAF and allelic R2 metric33. Finally, we assessed differential missingness between cases and controls (Supplementary Table 2).
Any genotyped SNP that passed the quality-control filters both in the European and Finnish cohorts was referred to as a ‘genotyped SNP’, and any one for which we used the quality control–passed imputation data either in one or both of the cohorts was classified as an ‘imputed SNP’.
For genotyping data of the replication cohorts, we excluded SNPs if any of the following three conditions were met in either cases or controls: (i) miss-ing rate >0.05; (ii) P value of the exact test of Hardy-Weinberg equilibrium <0.001; or (iii) MAF <0.01.
Statistical analysis. Cohort-wise association analysis. We tested for association between each quality control–passed SNP and intracranial aneurysm using conditional and unconditional logistic regression for the discovery and repli-cation cohorts, respectively34. For the discovery cohort, we used the matched strata to correct for potential confounding due to population stratification and gender and for the replication cohorts we adjusted for gender. We assumed the log-additive effect of allele dosage on disease risk. We obtained P values from the score test (two-sided) and estimated the logarithm of per-allele ORs with standard errors (s.e.m
.) by maximizing the conditional or unconditional likeli-
hood. Both the test statistic and the s.e.m. of the log of the OR
were corrected
using genomic control7. We performed the association analysis for the Finnish and European cohorts, as well as sub-cohorts of the European group that consisted of NL cases, DE cases or @neurIST cases and their matched controls (Table 1 and Supplementary Table 3). We used the following R functions to perform the association analysis: clogit, glm and snp.rhs.tests22.
Meta-analysis. We combined the cohort-wise per-allele ORs in the Finnish and European cohorts using a fixed-effects model of meta-analysis for 831,534 quality control–passed SNPs to obtain the discovery results. For SNPs analyzed both in the discovery and replication cohorts, we combined JP1 and JP2 to obtain replication results and all four cohorts to obtain combined results. Our primary analysis was based on the fixed-effects model23. To assess the hetero-geneity of the effect size between cohorts, we first divided the European cohort into three groups as described above, aiming to analyze the data without aver-aging effect sizes over the combined European cohorts, and then combined our six cohorts using the random-effects model
. We employed the restricted
maximum likelihood procedure to estimate the between-cohort heterogeneity variance (τ2) using the R function MiMa35 (see URLs). From this estimate, we calculated the Cochran′s Q statistic and the I2 statistic
36.Bayesian evaluation of the strength of association. To evaluate the strength
of association with intracranial aneurysm
, we used a Bayesian approach9,37.
A limitation of the use of P values alone is that variability in factors such as effect size, MAF and sample size can result in identical statistics that might correspond to markedly different levels of evidence regarding the strength of association10. The Bayes factor provides an alternative that compares the probabilities of the data under the alternative hypothesis of association ver-sus the null hypothesis of no association
. For computational simplicity, we
approximated the Bayes factor as described by Wakefield8. For all SNPs, we assumed a single prior
for the log-OR: a normal distribution with mean of 0
and a standard deviation of log(1.5)/Φ−1(0.975), where Φ is the normal distribution function9.
The PPA10 provides a simple probabilistic measure of evidence by intro-ducing the prior probability of association, π1. We assumed a uniform prior, π1 = 1/10,000, for all the SNPs11. For Bayes factor >106, changing π1 to a more conservative value of 1/100,000 would result in little change in the PPA.
To combine the results from multiple cohorts, we extended the formula38 to be applicable to multiple (>2) cohorts.
Conditional analysis. For each region that contained a SNP with PPA >0.5, we examined the number of independent association signals by testing for association of every genotyped SNP with intracranial aneurysm by adjusting for the effect of a specified SNP (Supplementary Fig. 1).
Two-locus interaction analysis. We tested for deviation from a linear model, which assumes that two SNPs combine to increase the log-odds of disease in an additive fashion, using conditional (in the Finnish and European cohorts)

Nature GeNetics doi:10.1038/ng.563
or unconditional (in
JP1 plus JP2, stratified by cohorts and gender) logistic
regression. There was no significant deviation from the linear model (data not shown).
Cumulative effect. We evaluated potential clinical implications of the genetic profiles of the five intracranial aneurysm risk loci following the approach described by Clayton39. We fitted a five-locus conditional (Finnish and European cohorts) or unconditional (Japanese cohorts) logistic regression model including the additive and dominance-deviation terms for each locus
. Using the estimated
effect sizes and each individual’s genotype, we calculated the risk scores for every individual. The receiver-operating characteristic curve for each ethnic cohort (Finnish, European and Japanese) was depicted using the risk score.
We also calculated the ratio of the exponential of the mean of the risk scores for control subjects within the top versus bottom 5% or 1
% of each cohort to
obtain approximated odds ratios of disease between these classes.The sibling recurrence risk was estimated by assuming the polygenic model
that fits well to our data39. Fraction of the sibling recurrence risk attributable to all of the five loci was calculated by taking the ratio of the logarithm of this value and epidemiologically estimated value of 418,19.
URLs. The R function MiMa, http://www.wvbauer.com/.
23. de Bakker, P. et al. Practical aspects of imputation-driven meta-analysis of genome-wide association studies. Hum. Mol. Genet. 17, R122–R128 (2008).
24. Clayton, D.G. et al. Population structure, differential bias and genomic control in a large-scale, case-control association study. Nat. Genet. 37, 1243–1246 (2005).
25. Patterson, N., Price, A.L. & Reich, D. Population structure and eigenanalysis. PLoS Genet. 2, e190 (2006).
26. Price, A.L. et al. Principal components analysis corrects for stratification in genome-wide association studies. Nat. Genet. 38, 904–909 (2006).
27. Belkin, M. & Niyogi, P. Laplacian eigenmaps for dimensionality reduction and data representation. Neural Comput. 15, 1373–1396 (2003).
28. Lee, A., Luca, D., Klei, L., Devlin, B. & Roeder, K. Discovering genetic ancestry using spectral graph theory. Genet. Epidemiol. 34, 51–59 (2009).
29. von Luxburg, U. A tutorial on spectral clustering. Stat. Comput. 17, 395–416 (2007).
30. Rosenbaum, P. A characterization of optimal designs for observational studies. J. R. Statist. Soc. B 53, 597–610 (1991).
31. Hansen, B. & Klopfer, S. Optimal full matching and related designs via network flows. J. Comput. Graph. Statist. 15, 609–627 (2006).
32. Wigginton, J., Cutler, D. & Abecasis, G. A note on exact tests of Hardy-Weinberg equilibrium. Am. J. Hum. Genet. 76, 887–893 (2005).
33. Browning, B. & Browning, S. A unified approach to genotype imputation and haplotype-phase inference for large data sets of trios and unrelated individuals. Am. J. Hum. Genet. 84, 210–223 (2009).
34. Breslow, N. & Day, N. Statistical methods in cancer research. Volume I—the analysis of case-control studies. IARC Sci. Publ. 5–338 (1980).
35. Viechtbauer, W. Bias and efficiency of meta-analytic variance estimators in the random-effects model. J. Educ. Behav. Stat. 30, 261–293 (2005).
36. Higgins, J., Thompson, S., Deeks, J. & Altman, D. Measuring inconsistency in meta-analyses. Br. Med. J. 327, 557–560 (2003).
37. Goodman, S. Toward evidence-based medical statistics. 2: The Bayes factor. Ann. Intern. Med. 130, 1005–1013 (1999).
38. Wakefield, J. Reporting and interpretation in genome-wide association studies. Int. J. Epidemiol. 37, 641–653 (2008).
39. Clayton, D. Prediction and interaction in complex disease genetics: experience in type 1 diabetes. PLoS Genet. 5, e1000540 (2009).
20. Kamatani, Y. et al. A genome-wide association study identifies variants in the HLA-DP locus associated with chronic hepatitis B in Asians. Nat. Genet. 41, 591–595 (2009).
21. Purcell, S. et al. PLINK: a tool set for whole-genome association and population-based linkage analyses. Am. J. Hum. Genet. 81, 559–575 (2007).
22. Clayton, D. & Leung, H.T. An R package for analysis of whole-genome association studies. Hum. Hered. 64, 45–51 (2007).