The226Ra-Ba relationship in the North Atlantic during ...
36
1 The 226 Ra-Ba relationship in the North Atlantic during GEOTRACES-GA01 Emilie Le Roy 1 , Virginie Sanial 1,2,3 , Matthew A. Charette 2 , Pieter van Beek 1 , François Lacan 1 , Stéphanie H.M. Jacquet 4 , Paul B. Henderson 2 , Marc Souhaut 1 , Maribel I. García-Ibáñez 5 , Catherine Jeandel 1 , Fiz F. Pérez 5 , Géraldine Sarthou 6 5 1 LEGOS, Laboratoire d’Etudes en Géophysique et Océanographie Spatiales (Université de Toulouse, CNRS/CNES/IRD/UPS), Observatoire Midi Pyrénées, 14 Avenue Edouard Belin, 31400 Toulouse, France [[email protected]] 2 Department of Marine Chemistry and Geochemistry, Woods Hole Oceanographic Institution, Woods 10 Hole, MA 02543, USA 3 Now at Department of Marine Science, University of Southern Mississippi, Stennis Space Center, MS 39529, USA 4 Aix Marseille Université, CNRS/INSU, Université de Toulon, IRD, Mediterranean Institute of Oceanography (MIO), UM110, 13288 Marseille, France 15 5 Instituto de Investigaciones Marinas, IIM-CSIC, Vigo, E36208, Spain 6 Laboratoire des Sciences de l’Environnement Marin (LEMAR), UMR 6539, IUEM, Technopôle Brest Iroise, 29280 Plouzané, France Correspondance to: Emilie Le Roy ([email protected]) Abstract. We report detailed sections of radium-226 ( 226 Ra, T1/2 = 1602 y) activities and barium (Ba) 20 concentrations determined in the North Atlantic (Portugal-Greenland-Canada) in the framework of the international GEOTRACES program (GA01 section—GEOVIDE project, May-July 2014). Dissolved 226 Ra and Ba are strongly correlated along the GA01 section, a pattern that reflects their similar chemical behavior. Since 226 Ra and Ba have been widely used as tracers of water masses and ocean mixing, we investigated more thoroughly their behavior in this crucial region for thermohaline 25 circulation taking advantage of the contrasting biogeochemical patterns existing along the GA01 section. We used an Optimum Multiparameter (OMP) analysis to distinguish the relative importance of physical transport (water mass mixing) from non-conservative processes (sedimentary, river, or hydrothermal inputs; uptake by particles, and dissolved-particulate dynamics) on the 226 Ra and Ba distributions in the North Atlantic. Results show that 72 % of the 226 Ra and 68 % of the Ba can be 30 explained by conservative mixing along the section and therefore, they can be considered as conservative tracers of water mass transport in the ocean interior. However, regions where 226 Ra and Ba displayed non-conservative behavior were also identified, mostly at the ocean boundaries (seafloor, continental margins, and surface waters). Elevated 226 Ra and Ba concentrations found in deep waters of the West European Basin reflect that lower North East Atlantic Deep Water (NEADWl) accumulates 35 excess 226 Ra and Ba from sediment diffusion during transport. In the upper 1500 m, deficiencies in 226 Ra and Ba are likely explained by their incorporation in planktonic siliceous shells, or in barite (BaSO4) (Bishop, 1988). Finally, since Ba and 226 Ra display different source terms (mostly deep-sea sediments for 226 Ra and rivers for Ba), strong decoupling between 226 Ra and Ba were observed at the Biogeosciences Discuss., https://doi.org/10.5194/bg-2017-478 Manuscript under review for journal Biogeosciences Discussion started: 13 November 2017 c Author(s) 2017. CC BY 4.0 License.
-
Upload
khangminh22 -
Category
Documents
-
view
1 -
download
0
Transcript of The226Ra-Ba relationship in the North Atlantic during ...
1
The 226Ra-Ba relationship in the North Atlantic during
GEOTRACES-GA01
Emilie Le Roy1, Virginie Sanial1,2,3, Matthew A. Charette2, Pieter van Beek1, François Lacan1,
Stéphanie H.M. Jacquet4, Paul B. Henderson2, Marc Souhaut1, Maribel I. García-Ibáñez5,
Catherine Jeandel1, Fiz F. Pérez5, Géraldine Sarthou6 5
1LEGOS, Laboratoire d’Etudes en Géophysique et Océanographie Spatiales (Université de Toulouse,
CNRS/CNES/IRD/UPS), Observatoire Midi Pyrénées, 14 Avenue Edouard Belin, 31400 Toulouse,
France [[email protected]] 2Department of Marine Chemistry and Geochemistry, Woods Hole Oceanographic Institution, Woods 10
Hole, MA 02543, USA
3Now at Department of Marine Science, University of Southern Mississippi, Stennis Space Center, MS
39529, USA 4Aix Marseille Université, CNRS/INSU, Université de Toulon, IRD, Mediterranean Institute of
Oceanography (MIO), UM110, 13288 Marseille, France 15 5Instituto de Investigaciones Marinas, IIM-CSIC, Vigo, E36208, Spain 6 Laboratoire des Sciences de l’Environnement Marin (LEMAR), UMR 6539, IUEM, Technopôle Brest
Iroise, 29280 Plouzané, France
Correspondance to: Emilie Le Roy ([email protected])
Abstract. We report detailed sections of radium-226 (226Ra, T1/2 = 1602 y) activities and barium (Ba) 20
concentrations determined in the North Atlantic (Portugal-Greenland-Canada) in the framework of the
international GEOTRACES program (GA01 section—GEOVIDE project, May-July 2014). Dissolved
226Ra and Ba are strongly correlated along the GA01 section, a pattern that reflects their similar
chemical behavior. Since 226Ra and Ba have been widely used as tracers of water masses and ocean
mixing, we investigated more thoroughly their behavior in this crucial region for thermohaline 25
circulation taking advantage of the contrasting biogeochemical patterns existing along the GA01
section. We used an Optimum Multiparameter (OMP) analysis to distinguish the relative importance of
physical transport (water mass mixing) from non-conservative processes (sedimentary, river, or
hydrothermal inputs; uptake by particles, and dissolved-particulate dynamics) on the 226Ra and Ba
distributions in the North Atlantic. Results show that 72 % of the 226Ra and 68 % of the Ba can be 30
explained by conservative mixing along the section and therefore, they can be considered as
conservative tracers of water mass transport in the ocean interior. However, regions where 226Ra and Ba
displayed non-conservative behavior were also identified, mostly at the ocean boundaries (seafloor,
continental margins, and surface waters). Elevated 226Ra and Ba concentrations found in deep waters of
the West European Basin reflect that lower North East Atlantic Deep Water (NEADWl) accumulates 35
excess 226Ra and Ba from sediment diffusion during transport. In the upper 1500 m, deficiencies in
226Ra and Ba are likely explained by their incorporation in planktonic siliceous shells, or in barite
(BaSO4) (Bishop, 1988). Finally, since Ba and 226Ra display different source terms (mostly deep-sea
sediments for 226Ra and rivers for Ba), strong decoupling between 226Ra and Ba were observed at the
Biogeosciences Discuss., https://doi.org/10.5194/bg-2017-478Manuscript under review for journal BiogeosciencesDiscussion started: 13 November 2017c© Author(s) 2017. CC BY 4.0 License.
2
land-ocean boundaries. This is especially true in the shallow stations near the coasts of Greenland and
Newfoundland where high 226Ra/Ba ratios at depth reflect the diffusion of 226Ra from sediment and low
226Ra/Ba ratios in the upper water column reflect the input of Ba associated with meteoric waters.
1. Introduction
The primary source of radium-226 (226Ra, T1/2 = 1602 y) to the ocean was found to be the diffusion from 5
deep-sea sediments following the decay of its parent isotope, 230Th (Koczy, 1958; Kröll, 1953). This
mode of introduction led Koczy to use radium data to derive vertical eddy diffusivities and velocities in
the deep sea (Koczy, 1958). Since then, 226Ra has been widely used to study the ocean circulation and
mixing at a global scale (Chung and Craig, 1980; Ku et al., 1980). In the framework of the Geochemical
Ocean Sections Study (GEOSECS) program, special attention was given to 226Ra as its solubility and 10
half-life made it an ideal chronometer of the global thermohaline circulation. In particular, its 1602 y
half-life is more adapted than the longer half-life of carbon-14 (14C, T1/2=5730 y) that had also been
used for that purpose. Therefore, the global oceanic distribution of 226Ra in seawater was extensively
documented throughout the major ocean basins and a unique database was generated during the
GEOSECS program (Broecker et al., 1970, 1967; Chung et al., 1974; Ku et al., 1970; Ku and Lin, 15
1976).
Barium (Ba) is an alkaline earth element like 226Ra, therefore they share a similar geochemical
behavior in the ocean (Chan et al., 1976; Fanning et al., 1988; Mathieu and Wolgemuth, 1973). As such,
Ba was proposed as a stable analog of 226Ra in order to use the 226Ra/Ba ratio as a clock in a similar
manner as the 14C/12C ratio. However, the recognition that 226Ra and Ba participate in upper ocean 20
biological cycles (Ku and Luo, 1994) introduced additional complications for the use of the 226Ra/Ba
ratio as a time tracer for deep water ventilation. Both 226Ra and Ba indeed increase with increasing
depth, thus reflecting uptake due to biological processes in surface waters, particle scavenging and
subsequent release at depth through the dissolution of the settling particles (Broecker et al., 1967; Ku et
al., 1970; Ku and Luo, 1994). 226Ra and Ba are thus not only controlled by physical processes, but 25
appear to be incorporated in settling particles such as calcareous and siliceous shells (Chan et al., 1976),
or in barite (BaSO4) that precipitates in the mesopelagic zone (Dehairs et al., 1980). Hence, despite
different principal sources to the ocean, rivers in the case of Ba and marine sediment diffusion for 226Ra,
their distributions are affected by similar processes in the water column. Barium displays a linear
correlation with 226Ra in the global ocean, resulting in a fairly constant 226Ra/Ba ratio of 30
2.2 ± 0.2 dpm µmol-1 (dpm, disintegrations per minute)(Chan et al., 1976; Foster et al., 2004; Ku et al.,
1980; Li et al., 1973; Östlund et al., 1987). Similarly, strong correlations were also found between Ba-Si
(silicate) and 226Ra-Si. Such relationships appeared to be more surprising because Si is not a chemical
analog of Ra and Ba. It was first proposed that diatom frustules exported from the upper water column
could adsorb Ra and Ba, with these elements being released at depth following the dissolution of their 35
Biogeosciences Discuss., https://doi.org/10.5194/bg-2017-478Manuscript under review for journal BiogeosciencesDiscussion started: 13 November 2017c© Author(s) 2017. CC BY 4.0 License.
3
siliceous tests (Bishop, 1988; Chung, 1980; Dileep Kumar and Li, 1996). More recent studies showed
that the similar behaviors of Ba and Si (and alkalinity) reflect similar dissolved-particulate interactions
(Jeandel et al., 1996; McManus et al., 1999; Rubin et al., 2003). Indeed, Ba is not mechanistically
coupled with alkalinity or silicate. Rather, the observed relationships may result from the spatial
coherence of parallel carriers overprinted by hydrodynamics. The formation of biogenic silica, CaCO3 5
and barite in surface water and their subsequent dissolution in the deeper water column may generate
parallel oceanic distribution. While barite has been shown to be the main carrier that controls the Ba
water column distribution, the relationship between Ba-Ra remains unclear.
While the global GEOSECS program provided valuable information on the coupling between
biogeochemical cycles of 226Ra and Ba in the ocean, several unknowns still remain. In this work, we 10
take advantage of a new worldwide program, known as GEOTRACES, to provide new information on
the distribution of 226Ra and Ba and their relationship in the ocean. GEOTRACES program aims to
characterize the distribution of trace elements and their isotopes (TEIs) (sources, sinks, internal cycling)
in the ocean through a global survey consisting of ocean sections and regional process studies.
In the present study, we report dissolved 226Ra activities and dissolved Ba concentrations in the 15
North Atlantic Ocean and Labrador Sea (GEOVIDE project, GA01 section). The North Atlantic region
hosts a variety of globally significant water masses with complex circulation patterns (García-Ibáñez et
al., 2015; Lherminier et al., 2010). This area is crucial for the thermohaline circulation, and thus for
global climate, through its important role in the ventilation of the deep layer of the global ocean (Seager
et al., 2002). As part of this process, the Meridional Overturning Circulation (MOC) includes the 20
northward transport of warm subtropical waters. These surface waters are then cooled and transformed
into subpolar waters, and may reach the Labrador and Irminger Seas where deep-water formation and
deep convection take place (Bennett et al., 1985; Pickart and Spall, 2007; Yashayaev et al., 2007). We
propose to study the relationship between 226Ra and Ba and to test the conservative behavior of these
tracers in this specific region. We further document the Ra-Ba-Si relationship along the GA01 section, 25
as it was done in previous sections conducted during the GEOSECS program and more recently durging
the GEOTRACES GA03 section.
2. Materials and Methods
2.1. Study area; the GEOVIDE project
The GEOTRACES GA01 section (GEOVIDE project; PIs : Géraldine Sarthou, LEMAR, France 30
and Pascale Lherminier, LOPS, France) was conducted in the North Atlantic Ocean between Lisbon,
Portugal, and St John’s, Canada (15 May 2014-30 June 2014; Fig.1). The water samples described here
were collected on board the R/V Pourquoi Pas?. The section crossed different topographic features and
regions with contrasting biogeochemical patterns. It complemented the sections GA03 (U.S.-
Biogeosciences Discuss., https://doi.org/10.5194/bg-2017-478Manuscript under review for journal BiogeosciencesDiscussion started: 13 November 2017c© Author(s) 2017. CC BY 4.0 License.
4
GEOTRACES) and GA02 (Dutch GEOTRACES) also conducted in the Atlantic Ocean in the
framework of the GEOTRACES program. Seventy-eight stations were visited during the GEOVIDE
project.
2.2. Sample Collection
At 15 of the 78 stations completed during the GA01 cruise, up to 22 discrete 10-L seawater samples 5
were collected through the water column from Niskin bottles. The seawater samples were passed by
gravity through 10 g of acrylic fibers impregnated with MnO2 (so called “Mn fibers”), which
quantitatively adsorb radium isotopes (assumed to scavenge 100 % of Ra; (van Beek et al., 2010; Moore
and Reid, 1973). High-resolution vertical profiles of 226Ra were thus built to provide a detailed 226Ra
section. The samples were unfiltered since particulate 226Ra activities are typically two orders of 10
magnitude lower than the dissolved 226Ra activities (van Beek et al., 2007, 2010). From the same Niskin
bottles, 15 mL was collected to determine the Ba concentration, so that Ba and 226Ra analyses were
conducted from the same initial sample, which allows us to investigate the 226Ra/Ba ratio in the
samples. The Ba samples were collected in pre-cleaned polypropylene bottles (rinsed three times with
the same seawater sample), acidified with 15 μL of HCl (10 M, Merck, Suprapur) and kept at room 15
temperature for later analysis.
2.3. Analysis of dissolved 226Ra activities via 222Rn emanation
Radium-226 was determined via its daughter, radon-222 (222Rn; T1/2 = 3.8 days) using a radon
extraction system followed by alpha scintillation counting (Key et al., 1979). The Mn Fiber samples
were placed into gas-tight PVC cartridges(Peterson et al., 2009) that were flushed with helium (He) for 20
5 min at 250 mL min-1. The cartridges were sealed and held for approximately 2 weeks (minimum of 5
days) to allow for 222Rn ingrowth from 226Ra decay. The 222Rn was then flushed out from the cartridges
using He and cryo-trapped in copper tubing using liquid nitrogen. The copper trap was heated to allow
the 222Rn to be transferred to an evacuated “Lucas cells” via a stream of He. The “Lucas cells” are air-
tight chambers with inner walls coated with silver-activated zinc sulfide that emits photons when struck 25
by alpha decay particles (Key et al., 1979 ; Lucas, 1957 ; Peterson et al., 2009). The cells were held 3
hours to reach the secular equilibrium of all 222Rn decay chain daughters. After 3 hours, the samples
were counted overnight on a radon counting system (Model AC/DC-DRC-MK 10-2). The counting
uncertainties (1SD, Standard Deviation) were within the range of 2–5 % for 10 L volume samples. All
samples were appropriately ingrowth and decay corrected. The combined Lucas cell and detector 30
background was ~7 % of the typical total measured sample activity. The method was standardized using
NIST (U.S. National Institute of Standards & Technology) 226Ra (20 dpm) sorbed onto MnO2 fiber and
analyzed in the same manner as the samples, with uncertainties (1SD) of 5 % (Charette et al., 2015;
Henderson et al., 2013). Vertical profiles of 226Ra from the GEOTRACES GA01 (this study) and GA03
Biogeosciences Discuss., https://doi.org/10.5194/bg-2017-478Manuscript under review for journal BiogeosciencesDiscussion started: 13 November 2017c© Author(s) 2017. CC BY 4.0 License.
5
(Charette et al., 2015) sections that were located in close proximity off Portugal (Fig. 1) were compared,
and showed a good agreement with increasing activities with increasing depth (Fig. S1).
2.4. Analysis of Dissolved Ba Concentrations
Barium concentrations were measured using an isotope dilution (ID) method (Freydier et al., 1995;
Klinkhammer and Chan, 1990) by high resolution—inductively coupled plasma- mass spectrometry 5
(HR-ICP-MS). This method was adapted to a Thermo Finnigan Element XR instrument (MIO,
Marseille). The Ba measurements presented here are the sum of dissolved Ba and a very small fraction
(generally <1 % of total Ba) of particulate Ba released from the samples as a result of the acidification
step. Hence, while the measurements reported herein are total Ba, they are within analytical uncertainty
representative of the dissolved Ba pool. The samples (0.5 mL) were spiked with 300 µL of a 135Ba-10
enriched solution (93 % 135Ba; 95 nmol kg-1) and diluted with 15 mL of acidified (2 % HNO3, 14 M,
Optima grade) Milli-Q grade water (Millipore). The amounts of sample, spike and dilution water were
assessed by weighing. The reproducibility of this method is about 1.5 % (1 RSD, Relative Standard
Deviation) as tested on repeated preparations of the reference solution SLRS-5 (NRC-CNRC river water
reference material for trace metals). Average Ba values obtained for SLRS-5 were 13.48 ± 0.20 g L-1 15
(1 σ) with RSD of 1.5 %, which is in good agreement with the certified values (SLRS-5 13.4 ± 0.6 g L-
1). The limit of detection calculated as three times the standard deviation of the procedural blank was
0.09 nmol L-1.
2.5. Multiparameter Mixing Model
An Optimum MultiParameter (OMP) analysis was used to distinguish the relative importance of 20
physical transport (i.e., water mass mixing) from non-conservative processes (input from the sediments,
rivers or hydrothermal vents, dissolution of particles; uptake by particles and dissolved-particulate
dynamics) on the 226Ra and Ba distributions in the North Atlantic. We used the OMP analysis computed
for the GA01 section by Garcia Ibanez et al., (this issue) with 12 source water types (SWTs). Based on
historical data reported from the North Atlantic, we defined 226Ra and Ba endmember concentrations 25
associated with each SWT (Table S1). The characteristics of SWTs (potential temperature, salinity, and
geographical location) were used to determine the SWTs endmembers for 226Ra and Ba, reported by
Garcia Ibanez et al., (this issue). In some cases, data from the GA01 section were used for the SWT
endmember (Table S1). These 226Ra and Ba SWT endmembers were then used to calculate the 226Ra
and Ba concentrations that strictly result from mixing of the different water masses. In this way, we 30
estimated the conservative component of 226Ra and Ba, which can in turn be compared to the in situ
concentrations to generate the non-conservative component of 226Ra and Ba along the GA01 section.
Monte Carlo perturbation experiments were conducted to evaluate the sensitivity of the results with
respect to the SWT endmember variations. A total of 250 random perturbations for each SWT
Biogeosciences Discuss., https://doi.org/10.5194/bg-2017-478Manuscript under review for journal BiogeosciencesDiscussion started: 13 November 2017c© Author(s) 2017. CC BY 4.0 License.
6
endmembers were chosen in an arbitrarily range (considering perturbations up to ± 1 dpm 100 L-1 for
226Ra and ± 5 nmol L-1 for Ba). Then, for each data point of the section, the 226Ra activities and Ba
concentrations were calculated for each perturbation of the SWT endmembers. The resulting standard
deviations on the 226Ra and Ba concentrations gave information on the sensitivity of the conservative
component of 226Ra and Ba determined using OMP analysis. The Monte Carlo experiments allowed us 5
to conclude that the 226Ra and Ba anomalies determined from the OMP analysis can be considered as
conservative within a range of ± 1 SD, which correspond to 0.7 dpm 100 L-1 for 226Ra and 2.0
nmol L-1 for Ba. Outside of these ranges, 226Ra and Ba were considered as non-conservative. These non-
conservative values can either be positive (representative of a net addition of 226Ra and Ba) or negative
(representative of a net removal of 226Ra and Ba). 10
Note that the OMP analysis was not solved where non-conservative behavior of temperature and
salinity is expected: for waters above 100 m and for waters with salinities lower than 34.7. Changes in
water mass properties may be due to air-sea interaction or inputs of fresh waters (i.e., near Greenland
shelf;(Daniault et al., 2011).
3. Results 15
3.1. Hydrodynamic context
The OMP analysis was used to identify the different water masses crossing the GA01 section. The
potential temperature-salinity diagram for all the GA01 stations along with the different SWT
endmembers used in the OMP analysis are represented in Fig.2. The salinity section is shown in Fig.3.
The different water masses present along the GA01 section are described below. 20
3.1.1. Upper waters
Three main water masses were found in upper waters (<1000 m) in the investigated area (Fig.3).
First, the Central Waters occupied the upper eastern part of the GA01 section from the Iberian Peninsula
to the Reykjanes Ridge (stations 1 to 26). Their distribution was associated with the circulation of the
North Atlantic Current (NAC). The NAC transports warm and saline waters northward, connecting the 25
subtropical and the subpolar latitudes, and is part of the upper layer of the Atlantic Meridional
Overturning Circulation (AMOC) in the North Atlantic subpolar gyre. The NAC flows eastward from
the Grand Banks of Newfoundland, splitting into four branches at the Mid-Atlantic Ridge (MAR), while
incorporating local water masses (Fig.1). East of the MAR, the two northern branches of the NAC flow
northward into the Icelandic Basin, the Rockall Plateau and the Rockall Trough, while the two southern 30
branches flow southward into the West European Basin. The Central Waters can be identified by the
highest potential temperature of the entire GA01 section and are represented by two endmembers called
Biogeosciences Discuss., https://doi.org/10.5194/bg-2017-478Manuscript under review for journal BiogeosciencesDiscussion started: 13 November 2017c© Author(s) 2017. CC BY 4.0 License.

7
East North Atlantic Central Waters (ENACW16 and ENACW12). The ENACW16 is warmer (16 °C) than
the ENACW12 that can be identified with a potential temperature of 12.3 °C (Fig.2).
Part of the Central Waters carried by the NAC recirculates toward the Iceland Basin and the
Irminger Sea, leading to the formation of subpolar mode waters by mixing and cooling in the subpolar
gyre (Lacan and Jeandel, 2004; McCartney, 1992). Iceland Subpolar Mode Water (IcSPMW) is formed 5
in the Icelandic Basin and is located, along GA01, over the Reykjanes Ridges (stations 32 and 38)
(Fig.3). The IcSPMW is described by two endmembers, the SPMW7 and the SPMW8, which are
distinguished by their potential temperature of 7.0 °C and 8.0 °C, respectively (Fig.2). Once formed, the
IcSPMW follows the Irminger Current.
Finally, the Irminger Subpolar Mode Water (IrSPMW) is the result of the transformation of the 10
Central Waters and the IcSPMW, and is formed northwest of the Irminger Sea (Krauss, 1995). The
IrSPMW is located near Greenland (stations 53, 57 and 60) (Fig.3)(García-Ibáñez et al., 2015; Lacan
and Jeandel, 2004; Read, 2000).
3.1.2. Intermediate waters
The Subarctic Intermediate Water (SAIW) originates in the Labrador Current (Read, 2000). The 15
SAIW is associated with the advection of waters from the Labrador Sea within the NAC; it subducts
below the Central Waters at approximately 600 m. Low salinities (34.8 and 34.7) and potential
temperatures of 4.5 °C and 6 °C are representative of the two SAIWs, SAIW4 and SAIW6, respectively
(Fig.2).
Around the Rockall Plateau, the SAIW overlies the Mediterranean Water (MW). The MW enters 20
the North Atlantic through the Gibraltar Strait and flows northward while extending westward. The MW
can be identified in the West European Basin at approximately 1200 m (stations 1 and 13 in Fig.3) with
a salinity of 36.5 (Fig.2)(García-Ibáñez et al., 2015).
The Labrador Sea water (LSW) is found in multiple locations and at different water depths along
the GA01 section (Fig.3). The LSW is formed by progressive cooling and freshening in winter due to 25
deep convection. The LSW can be characterized by its minimum salinity (34.87) and its minimum
potential temperature (3 °C) (Fig.2). The LSW contributes to the stratification of the interior of the
North Atlantic and its boundary currents and spreads at intermediate depths in three different basins
intersected by the GA01 section (Fig.1). The three independent pathways are: (i) northward into the
Irminger Sea (station 44), (ii) eastward across the MAR, through the Charlie-Gibbs fracture zone, then 30
northward into the Iceland Basin (station 32) and eastward into the West European Basin (stations 21
and 26), and (iii) equatorward as a major component of the North Atlantic Deep Water in the Deep
Western Boundary Current (DWBC), which constitutes the lower limb of the AMOC. Along these
paths, the LSW mixes with both the overlying and underlying water masses and becomes warmer and
saltier (Lazier, 1973). 35
Biogeosciences Discuss., https://doi.org/10.5194/bg-2017-478Manuscript under review for journal BiogeosciencesDiscussion started: 13 November 2017c© Author(s) 2017. CC BY 4.0 License.
8
The Polar Intermediate Water (PIW) is characterized by very low salinity (34.9) and potential
temperature (less than 2 °C) (Fig.2) and is defined as a separate upper core on the Greenland slope. The
PIW is episodically injected into the Irminger Sea and originates from either the Arctic Ocean or the
Greenland shelf (Falina et al., 2012; Jenkins et al., 2015; Rudels et al., 2002).
3.1.3. Overflow waters and deep waters 5
The Iceland—Scotland Overflow Water (ISOW) originates at the Iceland-Scotland sill, and entrains
the overlying warm saline Atlantic waters (SPMW and LSW). ISOW identification features are a
potential temperature of 2.6 °C and a salinity of 34.98 (Fig.2(van Aken and Becker, 1996). ISOW was
found at stations located on the Eastern flank of the Reykjanes Ridge (stations 32 and 38) and near
Greenland (stations 60 and 64) at great depth (2000–3500 m) (Fig.3). 10
Overflow waters coming from the Denmark Strait mix with both the SPMW and the LSW during
descent into the Irminger Sea to form the Denmark Strait Overflow Water (DSOW) (Fig.1) (Read,
2000; Yashayaev and Dickson, 2008). DSOW is located at the northern end of the Irminger Sea
(station 44) and occupies the deepest part of the Greenland continental slope (stations 69 and 77)
(Fig.3). At bottom depth, DSOW is easily identified by a minimum potential temperature of 1.3 °C 15
(Fig.2).
In the Southern Ocean, the Antarctic Bottom water (AABW) is formed by deep winter convection
of surface waters. AABW flows to the north along the eastern side of the Atlantic and contributes to the
formation of the lower North East Atlantic Deep Water (NEADWl) once this water penetrates the
Iberian Abyssal Plain (Fig.1). The NEADWl is laying at the bottom of the West European Basin 20
(stations 1 to 26 in Fig.3) with a mean salinity of 34.895 and a potential temperature of 1.98 °C (Fig.2).
Then, the NEADWl recirculates into the Rockall Trough and meets ISOW in the Iceland Basin (van
Aken, 2000; McCartney, 1992; Schmitz and McCartney, 1993).
3.2. Distribution of 226Ra and Ba along the GA01 section
The 226Ra distribution for the GA01 section is presented in Fig.4 with Ba concentrations overlain. 25
The 226Ra activities and Ba concentrations in the water column range from 7 to 25 dpm 100 L-1 and
from 33.6 to 81.5 nmol L-1, respectively. These data are in good agreement with Atlantic data from the
GEOSECS program, which range from 6.8 to 23.4 dpm 100 L-1 for 226Ra and from 35 to 105 nmol L-1
for Ba (Broecker et al., 1976).
For both 226Ra and Ba, the vertical gradient is stronger in the eastern part of the section (West 30
European Basin) than on the western part of the section (from Reykjanes Ridge to Newfoundland). Both
are particularly high near the seafloor in the West European Basin (226Ra: 14 - 25 dpm 100 L-1; Ba:
63 - 82 nmol L-1) and are in agreement with data previously reported for this region (Broecker et al.,
1976; Charette et al., 2015). At intermediate depths, Ba concentrations range from 40 to 50 nmol L-1 in
Biogeosciences Discuss., https://doi.org/10.5194/bg-2017-478Manuscript under review for journal BiogeosciencesDiscussion started: 13 November 2017c© Author(s) 2017. CC BY 4.0 License.

9
the West European Basin (stations 1 and 21) and 226Ra activities range from 9.5 to 10.9 dpm 100 L-1,
also in good agreement with literature data (Charette et al., 2015; Schmidt and Reyss, 1996). Low 226Ra
and Ba are found in upper waters of the West European Basin and the Iceland Basin
(8.1 - 8.9 dpm 100 L-1 and 35- 43 nmol L-1, respectively). Intermediate 226Ra activities and Ba
concentrations (9 dpm 100 L-1 and 42 nmol L-1, respectively) are observed in bottom waters in Irminger 5
and Labrador Seas. Between the Reykjanes Ridge and Newfoundland, 226Ra activities range between 7–
10 dpm 100 L-1 in surface and intermediate waters. Similar to 226Ra, Ba concentrations are relatively
low in this area, ranging from 39–50 nmol L-1. The distributions in 226Ra and Ba are to a first order
explained by the different water masses present in the region, as discussed below.
4. Discussion 10
4.1. 226Ra-Ba and 226Ra-Ba-Si relationships
A linear correlation between 226Ra and Ba is observed for all data collected along the GA01 section
(Fig.5). The slope of the 226Ra-Ba linear regression obtained by this study in the North Atlantic is
2.5 ± 0.1 (2SD) dpm µmol-1 which agrees with the slope of the 226Ra-Ba linear regression of
2.3 dpm µmol-1 reported during the GEOSECS program for all the oceanic basins (Chan et al., 1976). 15
The intercept on the horizontal Ba axis is 4.4 nmol L-1 for the GA01 section, which is in agreement with
GEOSECS data (Chan et al., 1976; Li et al., 1973). This positive intercept may be the result a greater
input of 226Ra relative to Ba close to bottom sediments and a larger riverine Ba input relative to 226Ra
(Ku and Luo, 1994). The slope of the 226Ra-Ba linear regression reported from the GEOSECS program
is similar from one oceanic basin to the other. The 226Ra/Ba ratio (slightly different from the slope) is 20
also fairly constant throughout the global ocean (2.2 ± 0.2 dpm µmol-1; Östlund et al., 1987). This
pattern indicates that 226Ra and Ba behave similarly in the ocean. Since 226Ra and Ba are incorporated in
settling particles such as calcareous and siliceous shells, or barite (BaSO4), and are then released at
depth following the dissolution of these particles, the constant 226Ra/Ba ratio suggests small
fractionation between 226Ra and Ba during these processes. 25
Investigations conducted during the GEOSECS program further concluded that 226Ra and Ba were
tightly correlated to orthosilicic acid (Si(OH)4) (Chan et al., 1976; Chung, 1980; Ku et al., 1970; Ku and
Lin, 1976) despite the fact that 226Ra, Ba, and Si(OH)4 exhibit different chemical behavior in the water
column and different source terms. A Ra-Ba-Si relationship is also observed along the GA01 section
(Fig.5). Si(OH)4 concentrations generally increase with increasing depth, with a steeper gradient in the 30
West European Basin (Introduction Paper, 2017; This issue), as it was also the case for 226Ra and Ba
(Fig.S1).
Biogeosciences Discuss., https://doi.org/10.5194/bg-2017-478Manuscript under review for journal BiogeosciencesDiscussion started: 13 November 2017c© Author(s) 2017. CC BY 4.0 License.

10
The link between 226Ra, Ba and Si has been shown to reflect parallel dissolved-particulate
interactions between barite and biogenic silica (Bishop, 1988; Chung, 1980; Jacquet et al., 2005, 2007;
Jeandel et al., 1996), the main carrier of Ra in the ocean remains an open question.
In contrast to the 226Ra-Ba relationship, the slope of the 226Ra-Si(OH)4 relationship during
GEOSECS exhibited significant spatial variability from one oceanic basin to the other (Li et al., 1973). 5
In the case of GA01, the 226Ra-Si(OH)4 linear regression slope is 2.4 ± 0.9 (2SD) 103 dpm mol-1. As a
comparison, the 226Ra-Si(OH)4 slope reported for the GEOTRACES-GA03 section conducted south of
the GA01 section in the Atlantic Ocean was 2.1 103 dpm mol-1 (Charette et al., 2015). As a comparison,
the slope of the 226Ra-Si(OH)4 linear regression is 34.3 103 dpm mol-1in the Pacific ocean and 14.5
103 dpm mol-1 in the Antarctic Ocean. The 226Ra-Si(OH)4 relationship has an intercept with the vertical 10
axis of 7.3 ± 0.1 dpm 100 L-1, which represents the residual 226Ra resulting from the total usage of Si in
surface waters (Ku et al., 1970). According to (Shannon and Cherry, 1971), the removal of 226Ra in the
upper waters is limited by Si. For both the 226Ra-Ba and 226Ra-Si(OH)4 relationships, several values are
clearly outside of the linear regression trend (Fig.5), a pattern that indicates deviation from the
relationship usually observed between 226Ra and Ba (or Si(OH)4). Such deviations may result from non-15
conservative processes.
4.2. 226Ra and Ba distributions and their relationship with hydrography
A striking feature of the GA01 section is that the 226Ra activities and Ba concentrations are
particularly high in the West European Basin below 2000 m (Fig.4), due to the presence of the
NEADWl, which includes waters with a southern origin (Read, 2000). South of the Antarctic 20
Convergence, the surface waters contain high 226Ra activities from the upwelling of deep waters
enriched in 226Ra associated with the circumpolar current (Ku and Lin, 1976). These waters then sink
and circulate northward into the Atlantic Ocean. (Broecker et al., 1976) showed that the decrease in the
226Ra activities from south to north is produced by the mixing of the AABW and bottom waters of
northern origin. Figure 6 was computed combining GEOSECS and TTO data (226Ra, Si(OH)4, salinity 25
and temperature) gathered in the AABW that travels northward between 60°S and 40°N. The same data
(226Ra, Si(OH)4, salinity and temperature) determined in the NEADWl along GA01 are also reported.
Following the AABW, between 60 °S and the equator, the high 226Ra activities are associated with
relatively low salinity and temperature, and high Si(OH)4 (Fig.6). Then, while crossing the Mid-Atlantic
Ridge at the equator and at 11 °N, the AABW goes through an important transformation: 226Ra activities 30
and Si(OH)4 concentrations decrease while salinity and temperature tends to increase (Fig.6). The 226Ra
and Ba endmembers for the NEADWl were chosen at this specific location to coincide with the
NEADWl endmembers used for the OMP analysis (Fig.6; Fig.S2). When reaching the latitude of ca.
40 °N, these waters are then characterized by high 226Ra activities compared to the waters located in the
eastern part the GA01 section. This pattern can also be observed in the GA03 section conducted south 35
Biogeosciences Discuss., https://doi.org/10.5194/bg-2017-478Manuscript under review for journal BiogeosciencesDiscussion started: 13 November 2017c© Author(s) 2017. CC BY 4.0 License.
11
of the GA01 section (Charette et al., 2015), the two sections being separated by only ca. 500 km in that
basin.
In contrast, the lowest 226Ra activities and Ba concentrations reported on the GA01 section are
associated with the Central Waters (upper waters of the West European Basin; Fig.4). Central Waters
are derived from the NAC and mix with the SAIW and the SPMW. Along their path, Central Waters 5
remain in the upper water column, and therefore are not affected by the deep sedimentary source of
226Ra. West of the Iceland Basin between 200 and 400 m (stations 32 and 38), an increase in the 226Ra
activities and Ba concentrations is associated with the IcSPMW.
A slight increase in 226Ra is observed between 1000–1600 m in the West European Basin (Fig.4;
Stations 1 and 13) where a salinity maximum is identified. This pattern is associated with the MW. This 10
is corroborated by the slightly higher Ba concentrations and lower 226Ra/Ba ratios, as observed in the
Western Mediterranean Sea (van Beek et al., 2009), spreading westward. At these depths, the OMP
analysis confirms the presence of the MW at about 41 % - 66 % (stations 1 and 21; Garcia Ibanez et al.,
2017; this issue).
Relatively uniform and low 226Ra activities and Ba concentrations are found between the surface 15
and 2500 m in the Labrador Sea, up to 2000 m in the Iceland Basin and deeper in the Irminger Basin
(Fig.5). These distributions can be related to the LSW which is formed by winter convection in the
Labrador Sea (Fröb et al., 2016; Pickart et al., 2003; Yashayaev and Loder, 2016). When formed, the
LSW transports the low 226Ra activities and Ba concentrations characteristic of surface waters to the
deep ocean. The LSW then spreads into the Irminger and the Iceland Basin while conserving its low 20
226Ra and Ba signatures. Relatively low 226Ra activities and Ba concentrations are found at bottom
depths in the Irminger and Labrador Seas and may be associated with DSOW, which is also a recently
ventilated water mass (Lazier, 1973).
Finally, according to the OMP analysis, ISOW is present at several stations along the GA01
section (Garcia-Ibanez et al., 2017, this issue). First, on the eastern flank of the Reykjanes Ridge 25
(station 32), 60 % of the water between 2700 and 3000 m is considered as ISOW. Then, in the Labrador
Sea (stations 69 and 77), an average of 54 % of the water between 2100 and 3000 m is identified as
ISOW. The slight increase in 226Ra activities and Ba concentrations observed at these locations may
thus be related to the ISOW.
4.3. Conservative versus non-conservative behavior of 226Ra and Ba 30
The use of an Optimum Multiparameter (OMP) analysis allowed us to distinguish the relative
importance of physical transport (i.e., mixing of water masses) from non-conservative processes on the
226Ra and Ba distributions in the North Atlantic (Fig.7). The OMP analysis reveals that 72 % of 226Ra
can be considered as conservative (activities due to mixing and transport) along the GA01 section (72 %
of the 226Ra anomalies are within the [-0.7 and 0.7 dpm 100 L-1] interval), whereas 68 % of the Ba can 35
Biogeosciences Discuss., https://doi.org/10.5194/bg-2017-478Manuscript under review for journal BiogeosciencesDiscussion started: 13 November 2017c© Author(s) 2017. CC BY 4.0 License.
12
be considered as conservative (68 % of the Ba anomalies are within the [-2.0 and 2.0 nmol L-1]
interval). Thus, 226Ra and Ba are predominantly conservative at intermediate depths: mostly between
500 m to 2000 m, but slightly deeper in the center of deep basins such as at stations 21, 44 and 69
(Fig.7). These locations correspond to the depths where the waters are far from the main sources and
sinks of 226Ra and Ba. The non-conservative 226Ra (28 % of the 226Ra) is mostly distributed close to the 5
interfaces such as surface/subsurface waters and bottom waters (both in the deep West European Basin
and the Labrador Sea), near the main sources (seafloor or shallow sediments deposited onto the
margins). The non-conservative Ba is mostly distributed in the upper 1500 m and in the deep West
European Basin (Fig.7).
The discrepancy between the vertical profiles of 226Ra and Ba determined along the GA01 section, 10
and those derived from OMP analysis (Fig.8) clearly indicates deviations from the conservative
behavior and reflects either an input of 226Ra or Ba (positive anomalies highlighted in red; same color
code as in Fig.7) or a removal of 226Ra or Ba (negative anomalies highlighted in blue; same color code
as in Fig.8). The 226Ra/Ba ratios determined throughout the water column are also reported and can be
compared to the 2.2 ± 0.2 dpm µmol-1 value, which is the mean ratio determined during the GEOSECS 15
program (Östlund et al., 1987) and is also the mean ratio determined along the GA01 section. 77 % of
the 226Ra/Ba ratios determined along the GA01 section are within the confidence interval [2.0-2.4
dpm µmol-1], indicating little deviation from the mean ratio, a pattern that is associated with the similar
chemical behavior between 226Ra and Ba.
4.3.1. 226Ra inputs and their relationship with Ba 20
Deep waters of the West European Basin display positive 226Ra and Ba anomalies (stations 1 to
26; Fig.8). The 226Ra anomalies are initiated at shallower depths (ca. 300-2000 m) than the Ba
anomalies (ca. 1000-2000 m) (Fig.8). Between 11 °N and the GA01 section (Fig.6), salinity,
temperature, and Si(OH)4 concentrations display relatively constant trends indicating no major
modifications of the NEADWl along its northward transport. In contrast, the 226Ra activities display a 25
significant spatial variability north of 11°N, and clearly increase towards the north (Fig.6). This increase
is decoupled from salinity, temperature, and Si(OH)4), was also shown by the positive anomalies
deduced from the OMP analysis (Fig.8). The 226Ra anomalies observed in the West European Basin
may thus be explained by inputs of 226Ra along the northward transport of these waters.
The positive anomalies result from the input of 226Ra (and Ba) following either i) 30
dissolution/remineralization of settling particles that incorporated 226Ra and Ba in the upper water
column (this includes the dissolution of barite, since the waters of Atlantic Ocean are undersaturated
with respect to barite(Monnin et al., 1999) and/or ii) diffusion of 226Ra and Ba from deep-sea sediments
(Cochran and Krishnaswami, 1980) (see 4.4). Of special note are stations in the West European Basin,
which are especially deep (down to 5500 m). Deep sediments generally display elevated 230Th activities 35
Biogeosciences Discuss., https://doi.org/10.5194/bg-2017-478Manuscript under review for journal BiogeosciencesDiscussion started: 13 November 2017c© Author(s) 2017. CC BY 4.0 License.

13
due to scavenging of 230Th from the entire water column (Bacon and Anderson, 1982; Nozaki, 1984).
The highest dissolved 230Th activities reported along the GA01 section were thus observed in the deep
waters of the West European Basin (Deng et al., 2017, this issue). Consequently, because 226Ra is
produced by the decay of 230Th in the sediment, the 226Ra diffusive flux in this area is expected to be
especially high. 5
The input of 226Ra, in the West European Margin, is accompanied by a Ba input since i) positive
Ba anomalies are also observed in the deep waters and ii) the 226Ra/Ba ratios do not significantly deviate
from the mean GEOSECS 226Ra/Ba ratio (Fig.8a). One exception is found at station 21 in the West
European Basin, which displays high 226Ra/Ba at approximately 4000 m (up to 3.17 dpm µmol-1). At
several stations (21, 26, 32, 38, 44, 60, 64 and 77), lower beam transmission values near the seafloor 10
indicate presence of suspended sediments likely associated with a nepheloid layer. Nepheloid layers are
turbid layers formed episodically by strong and intense abyssal currents that are transported along
isopycnals away from the site of resuspension of bottom sediments (McCave, 1986). The presence of a
benthic nepheloid layer is also indicated by high particulate iron concentrations at these stations
(Gourain et al., 2017; this issue). Such process may thus contribute to release 226Ra (and potentially Ba) 15
to the deep water column, following desorption or dissolution of the particles. Similar 226Ra maxima
have been observed in the deep waters of the Northeast Pacific suggesting that the 226Ra flux is not
uniform over the ocean bottom even on a regional scale (Chung, 1976).
Positive 226Ra anomalies are also found in deep waters at several other stations located in
relatively deep basins (> 1200 m) along the GA01 section (e.g. stations 32, 38, 44, 60, 64, 69 and 77). 20
Most of these anomalies are associated with 226Ra/Ba ratios higher than 2.4 dpm µmol-1. The 226Ra
positive anomalies observed at the stations mentioned above are thus best explained by the diffusion of
226Ra from the sediment. However, these latter stations do not exhibit a positive Ba anomaly and Ba
tends to be conservative. Consequently, the 226Ra/Ba ratios in the deep waters of these stations are often
significantly higher than the mean GEOSECS value (stations 21, 32, 38, 60, 64; Fig.8). This pattern is 25
different to that observed in the West European Basin, a discrepancy that may be explained by the
different sediment composition in the two regions and/or by the different residence time of deep waters
in contact with deep-sea sediments.
A strong 226Ra positive anomaly is observed in the deepest sample collected at station 38 above
the Reykjanes Ridge. It cannot be completely excluded that this positive anomaly is attributed to 30
hydrothermal vent since hydrothermal systems are known in the area (Fig.1). High particulate iron and
aluminum concentrations were also observed at these stations (Gourain et al., 2017 ; Menzel et al.,
2017 ; this issue). Enrichment in 226Ra have indeed been observed in hydrothermal systems plume at
mid-ocean Ridges (Kadko, 1996; Kadko and Moore, 1988; Kipp et al., 2017; Rudnicki and Elderfield,
1992). Moreover, the 226Ra enrichments are accompanied by slight Ba enrichments, which may support 35
Biogeosciences Discuss., https://doi.org/10.5194/bg-2017-478Manuscript under review for journal BiogeosciencesDiscussion started: 13 November 2017c© Author(s) 2017. CC BY 4.0 License.
14
the hydrothermal origin hypothesis, since hydrothermal venting at mid-ocean Ridge constitutes the
second major external source of Ba to the ocean (Edmond et al., 1979).
Finally, positive 226Ra and Ba anomalies are also observed in shallow coastal waters (Fig.8c). The
positive 226Ra anomalies are found close to the bottom, in agreement with the input of 226Ra from the
sediment (station 61), whereas the positive Ba anomalies are found in the subsurface (stations 57, 61 5
and 78) in association with low salinities (Fig.S2). The positive Ba anomalies are thus explained by the
input of meteoritic waters in coastal areas, as such waters are known to be the predominant source of Ba
to the ocean (Martin and Meybeck, 1979; Wolgemuth and Broecker, 1970). In these shallow stations
(140 m-550 m), the different source terms between 226Ra and Ba therefore leads to lower 226Ra/Ba ratios
(Fig.8c.; stations 53, 57, 61 and 78). In contrast, the input of 226Ra from sediment leads to higher 10
226Ra/Ba ratios near the seafloor (stations 53 and 61). These observations clearly indicate that 226Ra may
sometimes be decoupled from Ba.
4.3.2. 226Ra removal its relationship with Ba
Very few 226Ra negative anomalies were found along the GA01 section. In the deep open-ocean
stations, they are mostly observed in the upper 1000 m (Fig.8; stations 38, 44 and 77), but can also be 15
found as deep as 2000 m (i.e., stations 64 and 69). In most cases, the negative 226Ra anomalies are
associated with significant negative Ba anomalies (stations 32, 44, 60 and 69). Such features are likely
explained by biological mediated processes including incorporation of 226Ra and Ba in planktonic
siliceous shells (Bishop, 1988), in acantharian skeletons made of celestite (SrSO4) or in barite (BaSO4)
crystals (van Beek et al., 2007; Chow and Goldberg, 1960; Shannon and Cherry, 1971; Szabo, 1967; 20
Wolgemuth and Broecker, 1970).
Particularly low dissolved 226Ra/Ba ratios (<2 dpm µmol-1) are found in the upper 50 m at
stations 21, 32, 64, 69 and 77, a pattern that was also observed in the upper 150 m of the Sargasso Sea,
where (van Beek et al., 2007) reported high 226Ra/Ba in suspended particles attributed to the
incorporation of 226Ra and Ba in acantharian skeletons. The low dissolved 226Ra/Ba ratios (e.g. 25
1.7 dpm µmol-1, station 77) observed in the upper 200 m along the GA01 section may thus be attributed
to acantharians, which have skeletons that incorporate 226Ra preferentially to Ba (van Beek et al., 2007,
2009; Bernstein et al., 1998). Previous studies reported the presence of these organisms in the North
Atlantic, especially in the Iceland Basin and in the East Greenland Sea (Antia et al., 1993; Barnard et
al., 2004; Martin et al., 2010). 30
Several phytoplankton blooms were observed along the GA01 section, as indicated by the
chlorophyll a concentrations (Chl-a) (Fig.SI2). The largest bloom was observed in the Labrador Sea in
May 2014. Since diatoms are the dominant species in the Irminger and Labrador Seas and on the
Greenland and Newfoundland margins during GA01 (up to 55 % of the total Chl-a concentration;
Tonnard et al., in prep), the diatom frustules may also contribute to the removal of 226Ra and Ba from 35
Biogeosciences Discuss., https://doi.org/10.5194/bg-2017-478Manuscript under review for journal BiogeosciencesDiscussion started: 13 November 2017c© Author(s) 2017. CC BY 4.0 License.
15
the water column in these areas that were characterized by noticeable negative anomalies. In contrast,
Chl-a was lower in May and June 2014 in the West European Basin and coccolithophorids were the
dominant species in that area. These two observations may thus explain why the 226Ra and Ba removal
was less intense in that latter basin.
Additionally, because the Labrador Sea was sampled in June, during the decline of the bloom, 5
barite that is presumably formed following the decay of settling organic matter may also contribute to
the removal of Ba (and 226Ra). High particulate excess Ba (Baxs) concentrations were indeed observed at
stations displaying significant Ba negative anomalies: Baxs concentrations reached a maximum at 400 m
at station 13 and between 400 and 800 m near Greenland, at stations 44, 64 and 69 (Lemaitre et al.,
2017, Ba paper, this issue). These Baxs profiles can be related to the relatively high particulate organic 10
carbon (POC) export flux determined at these stations (eg. at station 69, Lemaitre et al., 2017, Export
paper; this issue). This POC flux would promote barite formation in subsurface (Dehairs et al., 1980;
Legeleux and Reyss, 1996) but also deeper in the water column (van Beek et al., 2007), thus leading to
the “biologically” mediated removal of 226Ra. Similarly,(Jullion et al., 2017) – by using a parametric
OMP analyses as applied in the Mediterranean Sea – also reported quantification of the non-15
conservative component of the Ba signal and suggested that the Ba negative anomalies potentially
reflected Ba subtraction during barite formation occurring during POC remineralization. The winter
deep convection in the Labrador Sea may also potentially explain this relatively deep Ba anomalies by
transporting negative Ba and 226Ra anomalies waters toward the deep-sea (Jullion et al., 2017). With the
exception of the acantharian skeletons that may impact the dissolved 226Ra/Ba ratios in the upper 200 m, 20
the removal of 226Ra and Ba that takes place deeper in the water column or that involves other processes
(e.g. barite precipitation) does not seem to affect significantly the dissolved 226Ra/Ba ratios.
In the shallow coastal stations, lower 226Ra/Ba ratios are observed (Fig.8). These low ratios may
also result from the removal of 226Ra and Ba by planktonic shells and/or barite or scavenging onto
lithogenic particles. However, because these stations are coastal stations, various processes are at play 25
in a relatively shallow water column (i.e. diffusion of 226Ra from the sediments; input of Ba from
meteoritic water; removal of Ba and 226Ra by shells and barite) thus complicating the interpretation of
the vertical profiles. We note that the low 226Ra/Ba ratios observed in surface of shallow stations near
the coast of Greenland (stations 57 and 61) and Newfoundland (station 78) are associated with low
salinities (Fig.8c). This decoupling between 226Ra and Ba may be explained by input of freshwater into 30
the coastal zone.
Finally, at several stations, a decrease in the 226Ra activities is observed near the seafloor
(stations 13, 21, 44, 60, 64 and 77; Fig.8). Similar decreasing trends near the seafloor have been
reported in the Southwest Atlantic and North Pacific for 230Th (Deng et al., 2014; Okubo et al., 2012), a
reactive element that strongly adsorbs onto suspended particles. This trend for 230Th was explained by 35
nuclide scavenging at the seafloor (Deng et al., 2014; Okubo et al., 2012). Radium-226 – although it is
Biogeosciences Discuss., https://doi.org/10.5194/bg-2017-478Manuscript under review for journal BiogeosciencesDiscussion started: 13 November 2017c© Author(s) 2017. CC BY 4.0 License.

16
much less particle-reactive than 230Th – may also be scavenged by resuspended particles near the
seafloor and may adsorb onto the surfaces of Mn oxides(Moore and Reid, 1973). High particulate TEs
concentrations were also observed at stations 26, 38, and 69 and may be related to nepheloid layers that
impact the deep water column up to 200–300 m above the seafloor (Gourain et al., 2017 ; Menzel et al.,
2017 ; this issue). 5
4.4. Estimation of 226Ra and Ba input fluxes into the West European Basin
A strong positive anomaly is observed in the NEADWl between stations 1 and 21 and below
3500 m. On average, it is 3.3 dpm 100 L-1 over this vertical section. This anomaly reflects a
concentration difference between the 226Ra measured along GA01 and the 226Ra due to the water mass
mixing. This concentration difference is associated to the northward transport of the NEADWl, 10
estimated to be 0.9 ± 0.3 Sv (106 m3 s-1) at 45°N (GA01 section) (Daniault et al., 2016; McCartney,
1992). Therefore, the concentration anomaly can be converted into a 226Ra flux that can be calculated as
follows:
𝐹𝐼𝑁𝑃𝑈𝑇 = 𝐴 × 𝑇𝑁𝐸𝐴𝐷𝑊𝑙 (1)
where A is the mean positive anomaly of 226Ra (in dpm m-3) determined by the OMP analysis; 15
TNEADWl is the transport associated with the NEADWl (in m3 s-1).
Given that this flux does not result from the mixing of the water masses, the 226Ra flux thus
calculated has to reflect an input.
This input may be associated with a sedimentary source. The NEADWl at 45°N is made of up to 92
% of the 11°N NEADWl endmember. Therefore, the sedimentary input along the northward transport of 20
the NEADWl is calculated across a sediment area between 11°N and 45°N (Fig.S2). We consider the
distance of 4209 km between 11°N and the GA01 section and the distance of 1475 km between stations
1 and 21. This leads to an area of 6.21 106 km2 (assuming a constant bathymetry).
The 226Ra flux diffusing out of bottom sediments, FsedRa (in dpm cm-2 y-1) is calculated using
Eq.(2) : 25
𝐹𝑠𝑒𝑑 = 𝐹𝐼𝑁𝑃𝑈𝑇
𝑆 (2)
where S is the above described surface area (in cm2).
The calculated FsedRa is 14.8 ± 3.1 10-3 dpm cm-2 y-1, which is within the range of fluxes
reported in the literature. For example, (Cochran, 1980) reported FsedRa in the range of
1.5 10-3 dpm cm-2 y-1 for the Atlantic Ocean to 2.1 10-1 dpm cm-2 y-1 in the Pacific Ocean (Fig.9). (Li et 30
al., 1973) estimated 226Ra fluxes diffusing out of the sediment in the Southern Ocean and on the
Antarctic shelf of 6.2 10-4 dpm cm-2 y-1 and 1.6 10-3 dpm cm-2 y-1, respectively. The FsedRa calculated
here is thus slightly higher than the 226Ra sedimentary fluxes reported in the Atlantic Ocean by Cochran
(1980). Note, however, that the 226Ra fluxes released from the sediments vary locally as a function of
Biogeosciences Discuss., https://doi.org/10.5194/bg-2017-478Manuscript under review for journal BiogeosciencesDiscussion started: 13 November 2017c© Author(s) 2017. CC BY 4.0 License.
17
the sedimentary 230Th activity, bioturbation rates, but also the sediment type and composition (Chung,
1976; Cochran, 1980). The 226Ra fluxes reported in the Atlantic Ocean by Cochran (1980), which are
the lowest of all basins, are only available for calcareous ooze type sediment (Cochran, 1980). The
NEADWl may cross different types of sediments along its northward path in the Atlantic Ocean. This
includes calcareous oozes, fine-grained calcareous sediments and clay (Dutkiewicz et al., 2015). In 5
particular, 226Ra diffusion is expected to be higher in these two latter sediment types (Cochran, 1980).
As for Ba is concerned, the mean positive anomalies deduced from the OMP analysis is 7.0
nmol L-1. In the same way as 226Ra, a Ba sedimentary flux FsedBa of 3.16 ± 1.4 nmol cm-2 y-1 would be
required to explain the Ba anomalies in the West European Basin. This flux is on the low end of the Ba
sedimentary fluxes reported in different ocean basins, which range from 1.0 to 30 nmol cm2 y-1 (Chan et 10
al., 1977; Falkner et al., 1993; McManus et al., 1999; Paytan and Kastner, 1996).
Alternatively, it cannot be excluded that 226Ra and Ba released by settling particles contribute to the
226Ra and Ba anomalies. However, 226Ra activities and Ba concentrations in suspended particles
collected in the Atlantic Ocean range from 0.01 and 0.1 dpm 100 L-1 and from 0.05 to 0.3 nmol L-1,
respectively (van Beek et al., 2007; Dehairs et al., 1980). These latter 226Ra activities and Ba 15
concentrations respectively represent up to 3 % and 4 % of the mean 226Ra and Ba anomalies
(3.3 dpm 100 L-1 and 6.4 nmol L-1, respectively). Therefore, this source does not likely significantly
contribute to the positive Ra and Ba anomalies. The 226Ra and Ba positive anomalies observed in the
West European Basin are thus best explained by the accumulation of 226Ra and Ba that diffuse out of the
sediments. 20
5. Conclusion
We investigated the distribution of dissolved 226Ra activities and Ba concentrations in the North
Atlantic Ocean along the GA01 section. To a first order, the 226Ra and Ba patterns appear to be
correlated to the water masses (e.g. high 226Ra and Ba in NEADWl in the West European Basin; low
226Ra and Ba in Central Waters; slight increase of 226Ra in the MW). Using a mixing model, we show 25
that 226Ra and Ba are mostly conservative along the section, with 72 % of the 226Ra and 68 % of the Ba
being conservative. 226Ra and Ba are mostly conservative at intermediate depths (mostly between 500 m
and 2000 m) and slightly deeper in the middle of deep basins. These locations correspond to the depths
where the waters are away from the main sources of 226Ra and Ba. This indicates that the distributions
of 226Ra and Ba at these intermediate depths are largely governed by water mass transport and mixing. 30
The use of the 226Ra/Ba ratio as a clock to chronometer the thermohaline circulation may thus be
relevant when studying water masses at these intermediate depths.
Our study also highlighted several regions where significant input or loss of 226Ra and Ba takes
place. In the West European Basin, the deep waters (NEADWl) accumulate both 226Ra and Ba, a pattern
that we attribute to the diffusion of 226Ra and Ba out of the sediments, while the waters travel northward 35
Biogeosciences Discuss., https://doi.org/10.5194/bg-2017-478Manuscript under review for journal BiogeosciencesDiscussion started: 13 November 2017c© Author(s) 2017. CC BY 4.0 License.
18
from 11 ° N to the GA01 section. This pattern contrasts with that observed in the deep waters collected
elsewhere along the section that do not display Ba enrichment parallel to the 226Ra enrichment. Bottom
nepheloid layers may also contribute to the release of 226Ra (and Ba) to the deep water column at
several stations. Interestingly, nepheloid layer processes seem to also act as potential removal of 226Ra
(and Ba). Significant input of Ba - likely associated with meteoritic waters - is found in the upper water 5
column near Greenland. Finally, 226Ra and Ba are removed from the upper water column, primarily due
to biological mediated processes such as incorporation of 226Ra and Ba into barite (BaSO4) that are
presumably formed following the decay of settling organic matter and/or adsorption onto diatom
frustules, a mechanism that would explain the 226Ra-Ba-Si relationship reported here .
Our study also provides evidence of significant decoupling between 226Ra and Ba. In the upper 10
200 m, the 226Ra/Ba ratios reach low values (<2 dpm µmol-1), a pattern that has been observed in other
regions and was related to acantharian skeletons that incorporate 226Ra preferentially to Ba (van Beek et
al., 2007; Bernstein et al., 1998). Finally, deviations from the mean GEOSECS 226Ra/Ba ratios were
observed in the shallow coastal waters of Greenland and Newfoundland: the predominant input of Ba
due to input of meteoritic waters leads to lower 226Ra/Ba ratios whereas near the seafloor, the input of 15
sedimentary 226Ra leads to higher 226Ra/Ba ratios.
The absence of a stable isotope for radium led geochemists to consider Ba as a stable analog for
226Ra because 226Ra and Ba display a similar chemical behavior. This study confirms that 226Ra and Ba
behave similarly, both elements being mostly conservative along the GA01 section, thus 226Ra and Ba
can be considered as conservative tracers in the ocean interior. However, this study also highlights 20
regions where 226Ra and Ba deviate from conservative mixing, an important consideration when
considering the balance between the large-scale oceanic circulation and biological activity over long
time scales. Decoupling between 226Ra and Ba has been observed, in most cases at the ocean
boundaries. We are hopeful that these new constraints on oceanic 226Ra and Ba distributions will help to
refine the use of the 226Ra/Ba ratio as a clock to chronometer the thermohaline circulation, as was 25
proposed several decades ago during the GEOSECS program.
Biogeosciences Discuss., https://doi.org/10.5194/bg-2017-478Manuscript under review for journal BiogeosciencesDiscussion started: 13 November 2017c© Author(s) 2017. CC BY 4.0 License.
19
Figure Caption
Figure 1: Station locations of the GA01 section between Portugal and Newfoundland in the North Atlantic (black and blue dots). Stations
investigated for 226Ra and Ba are marked as blue dots. The main currents and water masses in the North Atlantic are also represented. The
major hydrothermal vents located near the GA01 section are indicated by black triangles. Stations investigated during the US-
GEOTRACES-GA03 section, also conducted in the Atlantic Ocean, are reported on the lower panel (red dots). 5
Figure 2: Potential temperature-salinity diagram—including a zoom for bottom waters—of the water samples (colored dots) from the
GA01 section. The properties of the source water types (based on García-Ibáñez et al., 2017; This issue) used in the Optimum
Multiparameter (OMP) analysis are reported with white circles. Isopycnals are also plotted (potential density referenced to 0 dbar).
Figure 3: Distribution of salinity (CTD data) along the GA01 section. The different water masses are also reported, following García-
Ibáñez et al. (2017; this issue). The station numbers are found on top of the figure. The sampling depths for 226Ra are shown for each 10 vertical profile (black dots).
Figure 4: Distribution of dissolved 226Ra activities (dpm 100 L-1) and dissolved Ba concentrations (nmol L-1; white contour lines) along
the GA01 section. Station numbers are found on top of the panel. The sampling depths for 226Ra are shown for each vertical profile (black
dots).
Figure 5: Relationships between 226Ra and Ba (red dots) and between 226Ra and Si(OH)4 (blue dots) along the GA01 section in the North 15 Atlantic. The best linear fit for the two plots is also reported (R=0.93 for the two plots).
Figure 6: Geographical variation of 226Ra activities (red dots), salinity (blue dots), temperature (yellow dots) and Si(OH)4 concentrations
(green dots) in AABW between 60°S and 45°N (GA01 section) in the Atlantic Ocean based on data from the GEOSECS and TTO
programs. The 226Ra activities, salinity, temperature and Si(OH)4 concentrations from GA01 are represented with open circles. The values
used as endmembers for the OMP analysis are also identified by the black circles. The shaded area represents the region where 20 transformation of the AABW into NEADWl takes place.
Figure 7: Difference between the measured concentrations and those calculated by the OMP analysis, for 226Ra (a) and Ba (b) along the
GA01 section. Positive anomalies reflect recent tracer addition, while negative ones reflect recent tracer removal. Station numbers are
found on top of both panels.
Figure 8: Vertical profiles of dissolved 226Ra activities and Ba concentrations determined along the GA01 section: (a) West European 25 Basin; (b) Iceland Basin and Irminger Sea, (c) the Greenland and Newfoundland margins, and (d) Labrador Sea. As a comparison, the
conservative 226Ra and Ba vertical profiles derived from the OMP analysis are also reported in solid grey lines. The discrepancy between
the two vertical profiles indicates deviation from the conservative behavior and reflects either an input of 226Ra or Ba (positive anomalies
highlighted in red; same color code as Fig.8) or a removal of 226Ra or Ba (negative anomalies highlighted in blue; same color code as
Fig.8). The OMP analysis has not been solved for the shallow coastal stations 53 and 78. The 226Ra/Ba ratios are also reported, together 30 with the mean GEOSECS 226Ra/Ba ratio (2.2 ± 0.2 dpm µmol-1; black dashed line) together with its one standard deviation (grey shaded
areas). Note that the scale may be different from one station to the other and the vertical axis was cut to 1000 m. The seafloor is
represented by the bottom axis.
Figure 9: 226Ra fluxes diffusing out of the sediment in relationship with bottom water 226Ra activities determined in different oceanic
basins (P=Pacific Ocean, A=Atlantic Ocean, I =Indian Ocean and AA=Southern Ocean) by Cochran (1980). The 226Ra flux calculated in 35 this study to explain the positive anomalies in the West European Basin is also reported (red dot).
Biogeosciences Discuss., https://doi.org/10.5194/bg-2017-478Manuscript under review for journal BiogeosciencesDiscussion started: 13 November 2017c© Author(s) 2017. CC BY 4.0 License.

20
Acknowledgement
The present research and Emilie Le Roy’s fellowship are co-funded by the European Union and the
Région Occitanie-Pyrénées-Méditerranée (European Regional Development Fund). We are grateful to
the captain and crew of the N/O Pourquoi Pas?. The GEOVIDE project is co-funded by the French
national program LEFE/INSU (GEOVIDE), ANR Blanc (GEOVIDE, ANR-13-BS06-0014) and 5
RPDOC (ANR-12-PDOC-0025-01), LabEX MER (ANR-10-LABX-19) and IFREMER. The
GEOVIDE cruise would not have been achieved without the technical skills and commitment of
Catherine Kermabon, Olivier Ménage, Stéphane Leizour, Michel Hamon, Philippe Le Bot, Emmanuel
de Saint-Léger and Fabien Pérault. We are grateful to Manon Le Goff, Emilie Grosstefan,
Morgane Gallinari and Paul Tréguer for Si(OH)4 sampling and analysis. This work was also co-funded 10
by the French national program LEFE/INSU “REPAP” (PI S. Jacquet) and the U.S. National Science
Foundation (PI M. Charette, OCE- 1458305; OCE- 1232669). For this work M.I. García-Ibáñez and
F.F. Pérez were supported by the Spanish Ministry of Economy and Competitiveness through the
BOCATS (CTM2013-41048-P) project co-funded by the Fondo Europeo de Desarrollo Regional 2014–
2020 (FEDER). Several figures were constructed using Ocean Data View (Schlitzer, 2003). Therefore, 15
R. Schlitzer is warmly thanked. Satellite chlorophyll-a visualizations used in this study were produced
with the Giovanni online data system, developed and maintained by the NASA GES DISC.
References
Antia, A. N., Bauerfeind, E., Bodungen, B. v and Zeller, U.: Abundance, encystment and sedimentation
of acantharia during autumn 1990 in the East Greenland Sea, J. Plankton Res., 15(1), 99–114, 20
doi:10.1093/plankt/15.1.99, 1993.
Bacon, M. P. and Anderson, R. F.: Distribution of thorium isotopes between dissolved and particulate
forms in the deep sea, J. Geophys. Res. Oceans, 87(C3), 2045–2056, doi:10.1029/JC087iC03p02045,
1982.
Barnard, R. T., Batten, S., Beaugrand, G., Buckland, C., Conway, D. V. P., Edwards, M., Finlayson, J., 25
Gregory, L. W., Halliday, N. C., John, A. W. G., Johns, D. G., Johnson, A. D., Jonas, T. D., Lindley, J.
A., Nyman, J., Pritchard, P., Reid, P. C., Richardson, A. J., Saxby, R. E., Sidey, J., Smith, M. A.,
Stevens, D. P., Taylor, C. M., Tranter, P. R. G., Walne, A. W., Wootton, M., Wotton, C. O. M. and
Wright, J. C.: Continuous plankton records: Plankton atlas of the North Atlantic Ocean (1958-1999). II.
Biogeographical charts, Mar. Ecol.-Prog. Ser., MEPS supplement(SUPPL.), 11–75, 2004. 30
Bennett, T., Broecker, W. S. and Hansen, J.: North Atlantic Deep Water Formation, 1985.
Bernstein, R. E., Byrne, R. H. and Schijf, J.: Acantharians: a missing link in the oceanic
biogeochemistry of barium, Deep Sea Res. Part Oceanogr. Res. Pap., 45(2), 491–505,
doi:10.1016/S0967-0637(97)00095-2, 1998.
Bishop, J. K. B.: The barite-opal-organic carbon association in oceanic particulate matter, Nature, 35
332(6162), 341–343, doi:10.1038/332341a0, 1988.
Biogeosciences Discuss., https://doi.org/10.5194/bg-2017-478Manuscript under review for journal BiogeosciencesDiscussion started: 13 November 2017c© Author(s) 2017. CC BY 4.0 License.

21
Broecker, W., Kaufman, A., Ku, T.-L., Chung, Y.-C. and Craig, H.: Radium 226 measurements from
the 1969 North Pacific Geosecs Station, J. Geophys. Res., 75(36), 7682–7685,
doi:10.1029/JC075i036p07682, 1970.
Broecker, W. S., Li, Y.-H. and Cromwell, J.: Radium-226 and Radon-222 : Concentration in Atlantic
and Pacific Oceans, Science, 158(3806), 1307–1310, 1967. 5
Broecker, W. S., Goddard, J. and Sarmiento, J. L.: The distribution of 226Ra in the Atlantic Ocean,
Earth Planet. Sci. Lett., 32(2), 220–235, doi:10.1016/0012-821X(76)90063-7, 1976.
Chan, L. H., Edmond, J. M., Stallard, R. F., Broecker, W. S., Chung, Y. C., Weiss, R. F. and Ku, T. L.:
Radium and barium at GEOSECS stations in the Atlantic and Pacific, Earth Planet. Sci. Lett., 32(2),
258–267, 1976. 10
Chan, L. H., Drummond, D., Edmond, J. M. and Grant, B.: On the barium data from the Atlantic
GEOSECS expedition, Deep Sea Res., 24(7), 613–649, doi:10.1016/0146-6291(77)90505-7, 1977.
Charette, M. A., Morris, P. J., Henderson, P. B. and Moore, W. S.: Radium isotope distributions during
the US GEOTRACES North Atlantic cruises, Mar. Chem., 177, Part 1, 184–195,
doi:10.1016/j.marchem.2015.01.001, 2015. 15
Chow, T. J. and Goldberg, E. D.: On the marine geochemistry of barium, Geochim. Cosmochim. Acta,
20(3), 192–198, doi:10.1016/0016-7037(60)90073-9, 1960.
Chung, Y.: Radium-barium-silica correlations and a two-dimensional radium model for the world
ocean, Earth Planet. Sci. Lett., 49(2), 309–318, doi:10.1016/0012-821X(80)90074-6, 1980.
Chung, Y., Craig, H., Ku, T. L., Goddard, J. and Broecker, W. S.: Radium-226 measurements from 20
three Geosecs intercalibration stations, Earth Planet. Sci. Lett., 23(1), 116–124, doi:10.1016/0012-
821X(74)90038-7, 1974.
Chung, Y.-C.: A deep 226Ra maximum in the Northeast Pacific, Earth Planet. Sci. Lett., 32, 249–257,
doi:10.1016/0012-821X(76)90065-0, 1976.
Chung, Y.-C. and Craig, H.: 226Ra in the Pacifique Ocean, Earth Planet. Sci. Lett., 49, 267–292, 1980. 25
Cochran, J. K.: The flux of226Ra from deep-sea sediments, Earth Planet. Sci. Lett., 49(2), 381–392,
doi:10.1016/0012-821X(80)90080-1, 1980.
Cochran, J. K. and Krishnaswami, S.: Radium, thorium, uranium, and 210 Pb in deep-sea sediments and
sediment pore waters from the North Equatorial Pacific, Am. J. Sci., 280, 849–889,
doi:10.2475/ajs.280.9.849, 1980. 30
Daniault, N., Lherminier, P. and Mercier, H.: Circulation and Transport at the Southeast Tip of
Greenland, J. Phys. Oceanogr., 41(3), 437–457, doi:10.1175/2010JPO4428.1, 2011.
Daniault, N., Mercier, H., Lherminier, P., Sarafanov, A., Falina, A., Zunino, P., Pérez, F. F., Ríos, A. F.,
Ferron, B., Huck, T., Thierry, V. and Gladyshev, S.: The northern North Atlantic Ocean mean
circulation in the early 21st century, Prog. Oceanogr., 146, 142–158, doi:10.1016/j.pocean.2016.06.007, 35
2016.
Dehairs, F., Chesselet, R. and Jedwab, J.: Discrete suspended particles of barite and the barium cycle in
the open ocean, Earth Planet. Sci. Lett., 49(2), 528–550, doi:10.1016/0012-821X(80)90094-1, 1980.
Biogeosciences Discuss., https://doi.org/10.5194/bg-2017-478Manuscript under review for journal BiogeosciencesDiscussion started: 13 November 2017c© Author(s) 2017. CC BY 4.0 License.
22
Deng, F., Thomas, A. L., Rijkenberg, M. J. A. and Henderson, G. M.: Controls on seawater 231Pa,
230Th and 232Th concentrations along the flow paths of deep waters in the Southwest Atlantic, Earth
Planet. Sci. Lett., 390, 93–102, doi:10.1016/j.epsl.2013.12.038, 2014.
Dileep Kumar, M. and Li, Y.-H.: Spreading of water masses and regeneration of silica and 226Ra in the
Indian Ocean, Deep Sea Res. Part II Top. Stud. Oceanogr., 43(1), 83–110, doi:10.1016/0967-5
0645(95)00084-4, 1996.
Dutkiewicz, A., Müller, R. D., O’Callaghan, S. and Jónasson, H.: Census of seafloor sediments in the
world’s ocean, Geology, 43(9), 795–798, doi:10.1130/G36883.1, 2015.
Edmond, J. M., Measures, C., McDuff, R. E., Chan, L. H., Collier, R., Grant, B., Gordon, L. I. and
Corliss, J. B.: Ridge crest hydrothermal activity and the balances of the major and minor elements in the 10
ocean: The Galapagos data, Earth Planet. Sci. Lett., 46(1), 1–18, doi:10.1016/0012-821X(79)90061-X,
1979.
Falina, A., Sarafanov, A., Mercier, H., Lherminier, P., Sokov, A. and Daniault, N.: On the Cascading of
Dense Shelf Waters in the Irminger Sea, J. Phys. Oceanogr., 42(12), 2254–2267, doi:10.1175/JPO-D-
12-012.1, 2012. 15
Falkner, K. K., klinkhammer, G. P., Bowers, T. S., Todd, J. F., Lewis, B. L., Landing, W. M. and
Edmond, J. M.: The behavior of barium in anoxic marine waters, Geochim. Cosmochim. Acta, 57(3),
537–554, doi:10.1016/0016-7037(93)90366-5, 1993.
Fanning, K. A., Vargo, G. A., Bell-Torres, L. and Young, R. W.: Covariation of reactive solutes in the
sea, Mar. Chem., 24(3-4), 215–238, 1988. 20
Foster, D. A., Staubwasser, M. and Henderson, G. M.: 226Ra and Ba concentrations in the Ross Sea
measured with multicollector ICP mass spectrometry, Mar. Chem., 87(1-2), 59–71, 2004.
Freydier, R., Dupre, B. and Polve, M.: Analyses by inductively coupled plasma mass spectrometry of
Ba concentrations in water and rock samples. Comparison between isotope dilution and external
calibration with or without internal standard, Eur. J. Mass Spectrom., 1(3), 283–291, 25
doi:10.1255/ejms.140, 1995.
Fröb, F., Olsen, A., Våge, K., Moore, G. W. K., Yashayaev, I., Jeansson, E. and Rajasakaren, B.:
Irminger Sea deep convection injects oxygen and anthropogenic carbon to the ocean interior, Nat.
Commun., 7, ncomms13244, doi:10.1038/ncomms13244, 2016.
García-Ibáñez, M. I., Pardo, P. C., Carracedo, L. I., Mercier, H., Lherminier, P., Ríos, A. F. and Pérez, 30
F. F.: Structure, transports and transformations of the water masses in the Atlantic Subpolar Gyre, Prog.
Oceanogr., 135, 18–36, doi:10.1016/j.pocean.2015.03.009, 2015.
Henderson, P., Morris, P., Moore, W. and Charette, M.: Methodological advances for measuring low-
level radium isotopes in seawater, J. Radioanal. Nucl. Chem., 296(1), 357–362, doi:10.1007/s10967-
012-2047-9, 2013. 35
Jacquet, S. H. M., Dehairs, F., Cardinal, D., Navez, J. and Delille, B.: Barium distribution across the
Southern Ocean frontal system in the Crozet–Kerguelen Basin, Mar. Chem., 95(3–4), 149–162,
doi:10.1016/j.marchem.2004.09.002, 2005.
Jacquet, S. H. M., Dehairs, F., Elskens, M., Savoye, N. and Cardinal, D.: Barium cycling along WOCE
SR3 line in the Southern Ocean, Mar. Chem., (1-2) [online] Available from: 40
http://vliz.be/en/imis?module=ref&refid=211233&basketaction=add (Accessed 20 January 2017), 2007.
Biogeosciences Discuss., https://doi.org/10.5194/bg-2017-478Manuscript under review for journal BiogeosciencesDiscussion started: 13 November 2017c© Author(s) 2017. CC BY 4.0 License.
23
Jeandel, C., Dupré, B., Lebaron, G., Monnin, C. and Minster, J.-F.: Longitudinal distributions of
dissolved barium, silica and alkalinity in the western and southern Indian Ocean, Deep Sea Res. Part
Oceanogr. Res., 43, 1–31, doi:10.1016/0967-0637(95)00098-4, 1996.
Jenkins, W. J., Smethie Jr., W. M., Boyle, E. A. and Cutter, G. A.: Water mass analysis for the U.S.
GEOTRACES (GA03) North Atlantic sections, Deep Sea Res. Part II Top. Stud. Oceanogr., 116, 6–20, 5
doi:10.1016/j.dsr2.2014.11.018, 2015.
Jullion, L., Jacquet, S. H. M. and Tanhua, T.: Untangling biogeochemical processes from the impact of
ocean circulation: First insight on the Mediterranean dissolved barium dynamics, Glob. Biogeochem.
Cycles, 2016GB005489, doi:10.1002/2016GB005489, 2017.
Kadko, D.: Radioisotopic studies of submarine hydrothermal vents, Rev. Geophys., 34(3), 349–366, 10
doi:10.1029/96RG01762, 1996.
Kadko, D. and Moore, W.: Radiochemical constraints on the crustal residence time of submarine
hydrothermal fluids: Endeavour Ridge, Geochim. Cosmochim. Acta, 52(3), 659–668,
doi:10.1016/0016-7037(88)90328-6, 1988.
Key, R. M., Guinasso, N. L. and Schink, D. R.: Emanation of radon-222 from marine sediments, Mar. 15
Chem., 7(3), 221–250, doi:10.1016/0304-4203(79)90041-0, 1979.
Kipp, L. E., Sanial, V., Henderson, P. B., van Beek, P., Reyss, J.-L., Hammond, D. E., Moore, W. S.
and Charette, M. A.: Radium isotopes as tracers of hydrothermal inputs and neutrally buoyant plume
dynamics in the deep ocean, Mar. Chem., doi:10.1016/j.marchem.2017.06.011, 2017.
Klinkhammer, G. P. and Chan, L. H.: Determination of barium in marine waters by isotope dilution 20
inductively coupled plasma mass spectrometry, Anal. Chim. Acta, 232, doi:10.1016/s0003-
2670(00)81249-0, 1990.
Koczy, F. F.: Natural radium as a tracer in the ocean, , 18, 351–357, 1958.
Krauss, W.: Currents and mixing in the Irminger Sea and in the Iceland Basin, J. Geophys. Res. Oceans,
100(C6), 10851–10871, doi:10.1029/95JC00423, 1995. 25
Kröll, V.: Vertical Distribution of Radium in Deep-Sea Sediments, Nature, 171(4356), 742–742,
doi:10.1038/171742a0, 1953.
Ku, T.-L. and Lin, M.-C.: 226Ra distribution in the Antarctic Ocean, Earth Planet. Sci. Lett., 32(2),
236–248, doi:10.1016/0012-821X(76)90064-9, 1976.
Ku, T.-L. and Luo, S.: New appraisal of radium 226 as a large-scale oceanic mixing tracer, J. Geophys. 30
Res. Oceans, 99(C5), 10255–10273, doi:10.1029/94JC00089, 1994.
Ku, T. L., Li, Y. H., Mathieu, G. G. and Wong, H. K.: Radium in the Indian-Antarctic Ocean south of
Australia, J. Geophys. Res., 75(27), 5286–5292, doi:10.1029/JC075i027p05286, 1970.
Ku, T. L., Huh, C. A. and Chen, P. S.: Meridional distribution of 226Ra in the eastern Pacific along
GEOSECS cruise tracks, Earth Planet. Sci. Lett., 49, 293–308, doi:10.1016/0012-821X(80)90073-4, 35
1980.
Lacan, F. and Jeandel, C.: Denmark Strait water circulation traced by heterogeneity in neodymium
isotopic compositions, Deep Sea Res. Part Oceanogr. Res. Pap., 51(1), 71–82, 2004.
Lazier, J. R. N.: The renewal of Labrador sea water, Deep Sea Res. Oceanogr. Abstr., 20(4), 341–353,
doi:10.1016/0011-7471(73)90058-2, 1973. 40
Biogeosciences Discuss., https://doi.org/10.5194/bg-2017-478Manuscript under review for journal BiogeosciencesDiscussion started: 13 November 2017c© Author(s) 2017. CC BY 4.0 License.
24
Legeleux, F. and Reyss, J.-L.: 228Ra226Ra activity ratio in oceanic settling particles: implications
regarding the use of barium as a proxy for paleoproductivity reconstruction, Deep Sea Res. Part
Oceanogr. Res. Pap., 43(11), 1857–1863, doi:10.1016/S0967-0637(96)00086-6, 1996.
Lherminier, P., Mercier, H., Huck, T., Gourcuff, C., Perez, F. F., Morin, P., Sarafanov, A. and Falina,
A.: The Atlantic Meridional Overturning Circulation and the subpolar gyre observed at the A25-OVIDE 5
section in June 2002 and 2004, Deep Sea Res. Part Oceanogr. Res. Pap., 57(11), 1374–1391,
doi:10.1016/j.dsr.2010.07.009, 2010.
Li, Y. H., Ku, T. L., Mathieu, G. G. and Wolgemuth, K.: Barium in the Antarctic Ocean and
implications regarding the marine geochemistry of Ba and226Ra, Earth Planet. Sci. Lett., 19(3), 352–
358, doi:10.1016/0012-821X(73)90085-X, 1973. 10
Lucas, H. F.: Improved Low-Level Alpha-Scintillation Counter for Radon, Rev. Sci. Instrum., 28(9),
680, doi:10.1063/1.1715975, 1957.
Martin, J.-M. and Meybeck, M.: Elemental mass-balance of material carried by major world rivers,
Mar. Chem., 7(3), 173–206, doi:10.1016/0304-4203(79)90039-2, 1979.
Martin, P., Allen, J. T., Cooper, M. J., Johns, D. G., Lampitt, R. S., Sanders, R. and Teagle, D. A. H.: 15
Sedimentation of acantharian cysts in the Iceland Basin: Strontium as a ballast for deep ocean particle
flux, and implications for acantharian reproductive strategies, Limnol. Oceanogr., 55(2), 604–614,
doi:10.4319/lo.2010.55.2.0604, 2010.
Mathieu, G. G. and Wolgemuth, K.: Barium in the Antartic Ocean and Implication regarding the marine
geochemsitry of Ba ans 226Ra, EARTH Planet. Sci. Lett., 19, 352–358, 1973. 20
McCartney, M. S.: Recirculating components to the deep boundary current of the northern North
Atlantic, Prog. Oceanogr., 29, 283–383, 1992.
McCave, I. N.: Local and global aspects of the bottom nepheloid layers in the world ocean, Neth. J. Sea
Res., 20(2), 167–181, doi:10.1016/0077-7579(86)90040-2, 1986.
McManus, J., Berelson, W. M., Hammond, D. E. and Klinkhammer, G. P.: Barium Cycling in the North 25
Pacific: Implications for the Utility of Ba as a Paleoproductivity and Paleoalkalinity Proxy,
Paleoceanography, 14(1), 53–61, doi:10.1029/1998PA900007, 1999.
Monnin, C., Jeandel, C., Cattaldo, T. and Dehairs, F.: The marine barite saturation state of the world’s
oceans, Mar. Chem., 65(3), 253–261, doi:10.1016/S0304-4203(99)00016-X, 1999.
Moore, W. S. and Reid, D. F.: Extraction of radium from natural waters using manganese-impregnated 30
acrylic fibers, J. Geophys. Res., 78(36), 8880–8886, doi:10.1029/JC078i036p08880, 1973.
Nozaki, Y.: Excess 227Ac in deep ocean water, Nature, 310(5977), 486–488, doi:10.1038/310486a0,
1984.
Okubo, A., Obata, H., Gamo, T. and Yamada, M.: 230Th and 232Th distributions in mid-latitudes of
the North Pacific Ocean: Effect of bottom scavenging, Earth Planet. Sci. Lett., 339–340, 139–150, 35
doi:10.1016/j.epsl.2012.05.012, 2012.
Östlund, H. G., Craig, H. C., Broecker, W. S., Spencer, D. W. and GEOSECS: Shorebased
measurements during the GEOSECS Atlantic expedition, , doi:10.1594/PANGAEA.824123, 1987.
Paytan, A. and Kastner, M.: Benthic Ba fluxes in the central Equatorial Pacific, implications for the
oceanic Ba cycle, Earth Planet. Sci. Lett., 142(3), 439–450, doi:10.1016/0012-821X(96)00120-3, 1996. 40
Biogeosciences Discuss., https://doi.org/10.5194/bg-2017-478Manuscript under review for journal BiogeosciencesDiscussion started: 13 November 2017c© Author(s) 2017. CC BY 4.0 License.

25
Peterson, R. N., Burnett, W. C., Dimova, N. and Santos, I. R.: Comparison of measurement methods for
radium-226 on manganese-fiber, Limnol. Oceanogr. Methods, 7(2), 196–205,
doi:10.4319/lom.2009.7.196, 2009.
Pickart, R. S. and Spall, M. A.: Impact of Labrador Sea Convection on the North Atlantic Meridional
Overturning Circulation, J. Phys. Oceanogr., 37(9), 2207–2227, doi:10.1175/JPO3178.1, 2007. 5
Pickart, R. S., Straneo, F. and Moore, G. W. K.: Is Labrador sea water formed in the Irminger basin?,
Deep Sea Res. Part Oceanogr. Res. Pap., 50(1), 23–52, 2003.
Read, J. F.: CONVEX-91: water masses and circulation of the Northeast Atlantic subpolar gyre, Prog.
Oceanogr., 48(4), 461–510, doi:10.1016/S0079-6611(01)00011-8, 2000.
Rubin, S. I., King, S. L., Jahnke, R. A. and Froelich, P. N.: Benthic barium and alkalinity fluxes: Is Ba 10
an oceanic paleo-alkalinity proxy for glacial atmospheric CO2?, Geophys. Res. Lett., 30(17), 1885,
doi:10.1029/2003GL017339, 2003.
Rudels, B., Fahrbach, E., Meincke, J., Budéus, G. and Eriksson, P.: The East Greenland Current and its
contribution to the Denmark Strait overflow, ICES J. Mar. Sci., 59(6), 1133–1154,
doi:10.1006/jmsc.2002.1284, 2002. 15
Rudnicki, M. D. and Elderfield, H.: Helium, radon and manganese at the TAG and Snakepit
hydrothermal vent fields, 26° and 23°N, Mid-Atlantic Ridge, Earth Planet. Sci. Lett., 113(3), 307–321,
doi:10.1016/0012-821X(92)90136-J, 1992.
Schmidt, S. and Reyss, J.-L.: Radium as internal tracer of Mediterranean Outflow Water, J. Geophys.
Res. Oceans, 101(C2), 3589–3596, doi:10.1029/95JC03308, 1996. 20
Schmitz, W. J. and McCartney, M. S.: On the North Atlantic Circulation, Rev. Geophys., 31(1), 29–49,
doi:10.1029/92RG02583, 1993.
Seager, R., Battisti, D. S., Yin, J., Gordon, N., Naik, N., Clement, A. C. and Cane, M. A.: Is the Gulf
Stream responsible for Europe’s mild winters?, Q. J. R. Meteorol. Soc., 128(586), 2563–2586,
doi:10.1256/qj.01.128, 2002. 25
Shannon, L. V. and Cherry, R. D.: Radium-226 in marine phytoplankton, Earth Planet. Sci. Lett., 11(1),
339–343, doi:10.1016/0012-821X(71)90189-0, 1971.
Szabo, B. J.: Radium content in plankton and sea water in the Bahamas, Geochim. Cosmochim. Acta,
31(8), 1321–1331, doi:10.1016/S0016-7037(67)80018-8, 1967.
van Aken, H. M.: The hydrography of the mid-latitude northeast Atlantic Ocean. I: The deep water 30
masses, Deep-Sea Res. Part I, 47, 757–788, doi:10.1016/S0967-0637(99)00092-8, 2000.
van Aken, H. M. and Becker, G.: Hydrography and through-flow in the north-eastern North Atlantic
Ocean: the NANSEN project, Prog. Oceanogr., 38(4), 297–346, doi:10.1016/S0079-6611(97)00005-0,
1996.
van Beek, P., François, R., Conte, M., Reyss, J.-L., Souhaut, M. and Charette, M.: 228Ra/226Ra and 35
226Ra/Ba ratios to track barite formation and transport in the water column, Geochim. Cosmochim.
Acta, 71(1), 71–86, doi:10.1016/j.gca.2006.07.041, 2007.
van Beek, P., Sternberg, E., Reyss, J. L., Souhaut, M., Robin, E. and Jeandel, C.: 228Ra/226Ra and
226Ra/Ba ratios in the Western Mediterranean Sea : barite formation and transport in the water column,
Geochim. Cosmochim. Acta, 73, 4720–4737, doi:10.1016/j.gca.2009.05.063, 2009. 40
Biogeosciences Discuss., https://doi.org/10.5194/bg-2017-478Manuscript under review for journal BiogeosciencesDiscussion started: 13 November 2017c© Author(s) 2017. CC BY 4.0 License.

26
van Beek, P., Souhaut, M. and Reyss, J.-L.: Measuring the radium quartet (228Ra, 226Ra, 224Ra,
223Ra) in seawater samples using gamma spectrometry, J. Environ. Radioact., 101(7), 521–529,
doi:10.1016/j.jenvrad.2009.12.002, 2010.
Wolgemuth, K. and Broecker, W. S.: Barium in sea water, Earth Planet. Sci. Lett., 8(5), 372–378,
doi:10.1016/0012-821X(70)90110-X, 1970. 5
Yashayaev, I. and Dickson, B.: Transformation and Fate of Overflows in the Northern North Atlantic,
in Arctic–Subarctic Ocean Fluxes, edited by R. R. Dickson, J. Meincke, and P. Rhines, pp. 505–526,
Springer Netherlands. [online] Available from: http://link.springer.com/chapter/10.1007/978-1-4020-
6774-7_22 (Accessed 11 April 2016), 2008.
Yashayaev, I. and Loder, J. W.: Recurrent replenishment of Labrador Sea Water and associated 10
decadal-scale variability, J. Geophys. Res. Oceans, 121(11), 8095–8114, doi:10.1002/2016JC012046,
2016.
Yashayaev, I., Bersch, M. and van Aken, H. M.: Spreading of the Labrador Sea Water to the Irminger
and Iceland basins, Geophys. Res. Lett., 34(10), doi:10.1029/2006GL028999, 2007.
15
Biogeosciences Discuss., https://doi.org/10.5194/bg-2017-478Manuscript under review for journal BiogeosciencesDiscussion started: 13 November 2017c© Author(s) 2017. CC BY 4.0 License.
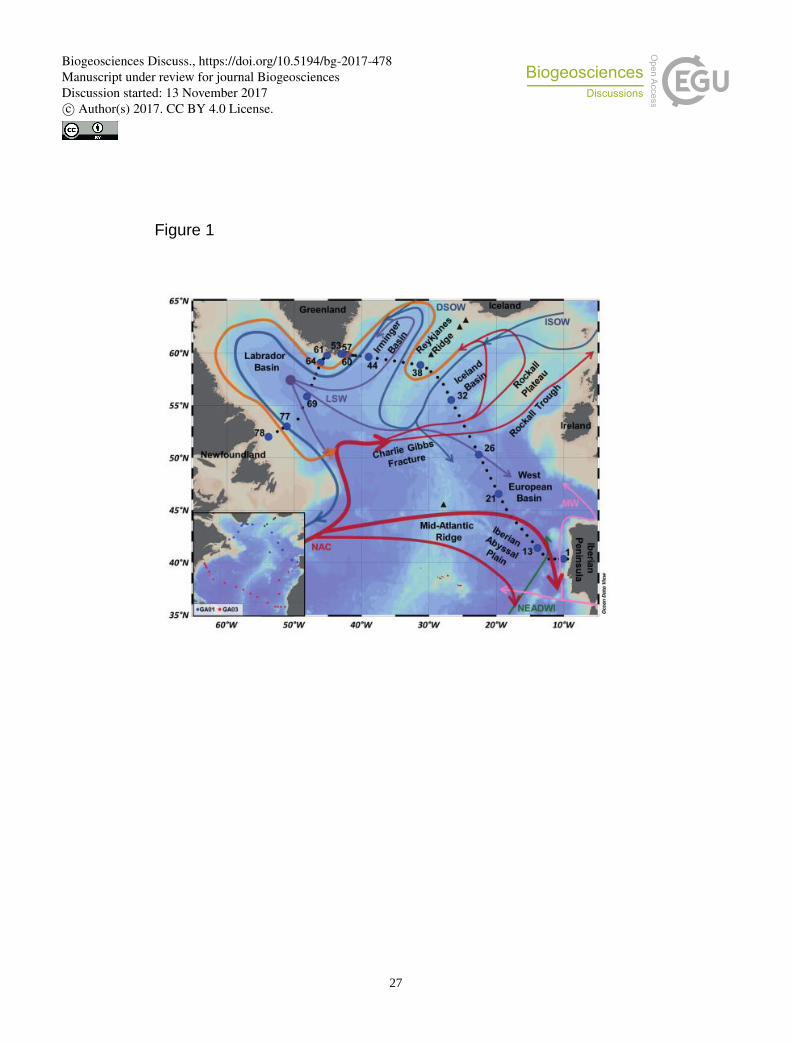
27
Figure 1
Biogeosciences Discuss., https://doi.org/10.5194/bg-2017-478Manuscript under review for journal BiogeosciencesDiscussion started: 13 November 2017c© Author(s) 2017. CC BY 4.0 License.
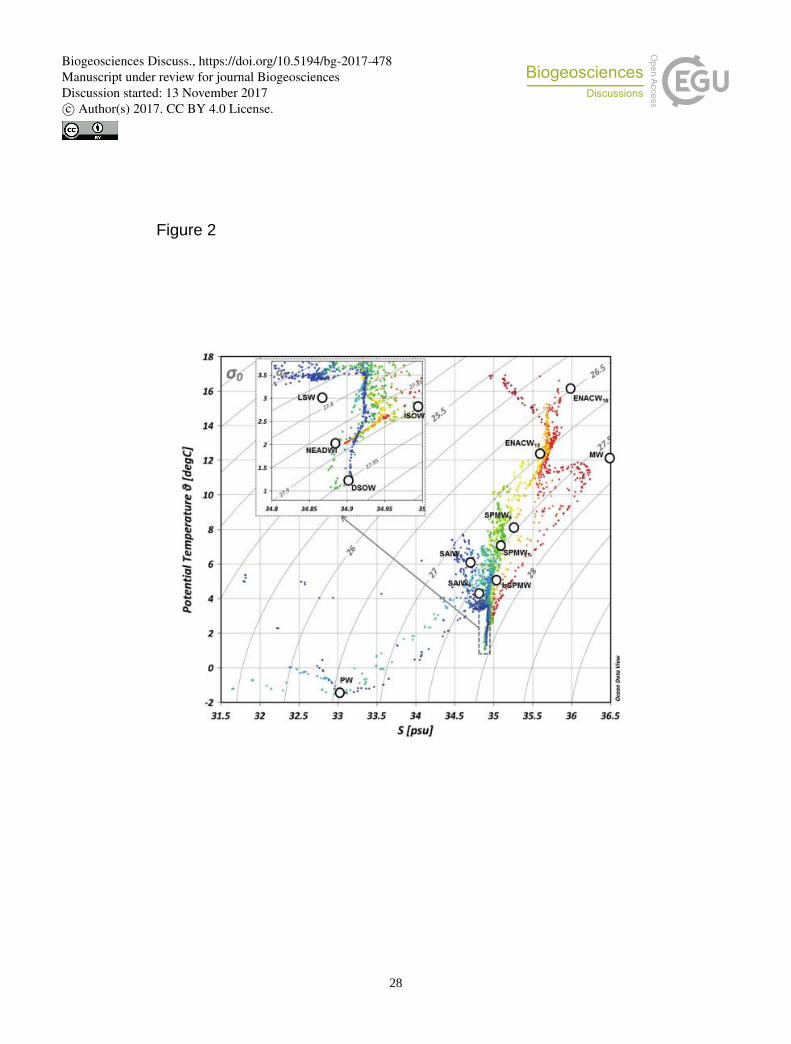
28
Figure 2
Biogeosciences Discuss., https://doi.org/10.5194/bg-2017-478Manuscript under review for journal BiogeosciencesDiscussion started: 13 November 2017c© Author(s) 2017. CC BY 4.0 License.
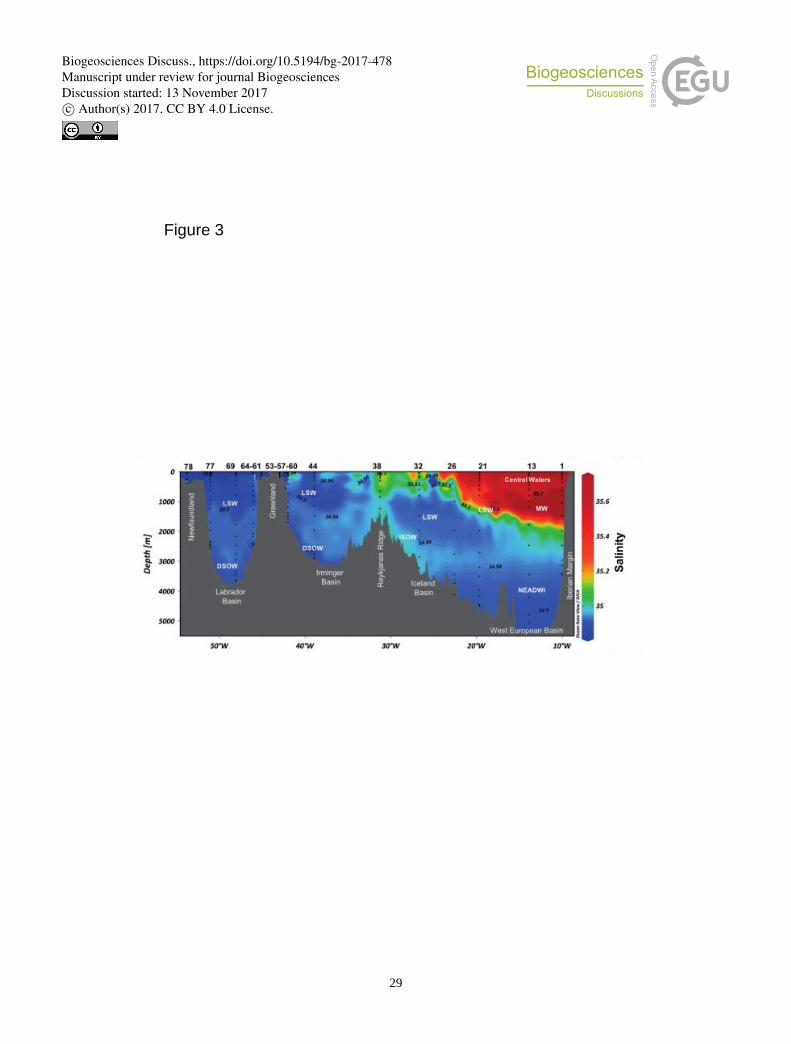
29
Figure 3
Biogeosciences Discuss., https://doi.org/10.5194/bg-2017-478Manuscript under review for journal BiogeosciencesDiscussion started: 13 November 2017c© Author(s) 2017. CC BY 4.0 License.
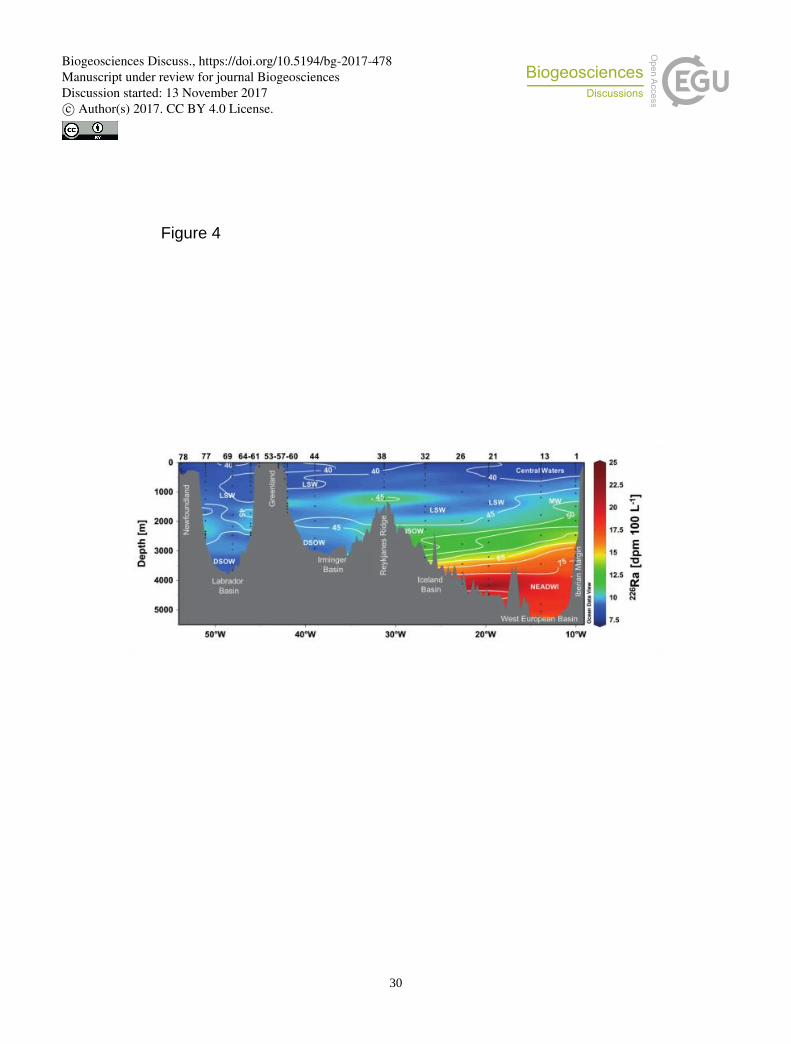
30
Figure 4
Biogeosciences Discuss., https://doi.org/10.5194/bg-2017-478Manuscript under review for journal BiogeosciencesDiscussion started: 13 November 2017c© Author(s) 2017. CC BY 4.0 License.

31
Figure 5
Ba (nmol L-1)
10 20 30 40 50 60 70 80
226R
a (
dpm
100 L
-1)
5
10
15
20
25
Si(OH)4 (µmol L-1)
0 10 20 30 40 50 60 70 80
Ba
Y=0.25x - 1.1 ± 0.3
Si(OH)4
Y=0.24x +7.3 ± 0.1
Biogeosciences Discuss., https://doi.org/10.5194/bg-2017-478Manuscript under review for journal BiogeosciencesDiscussion started: 13 November 2017c© Author(s) 2017. CC BY 4.0 License.
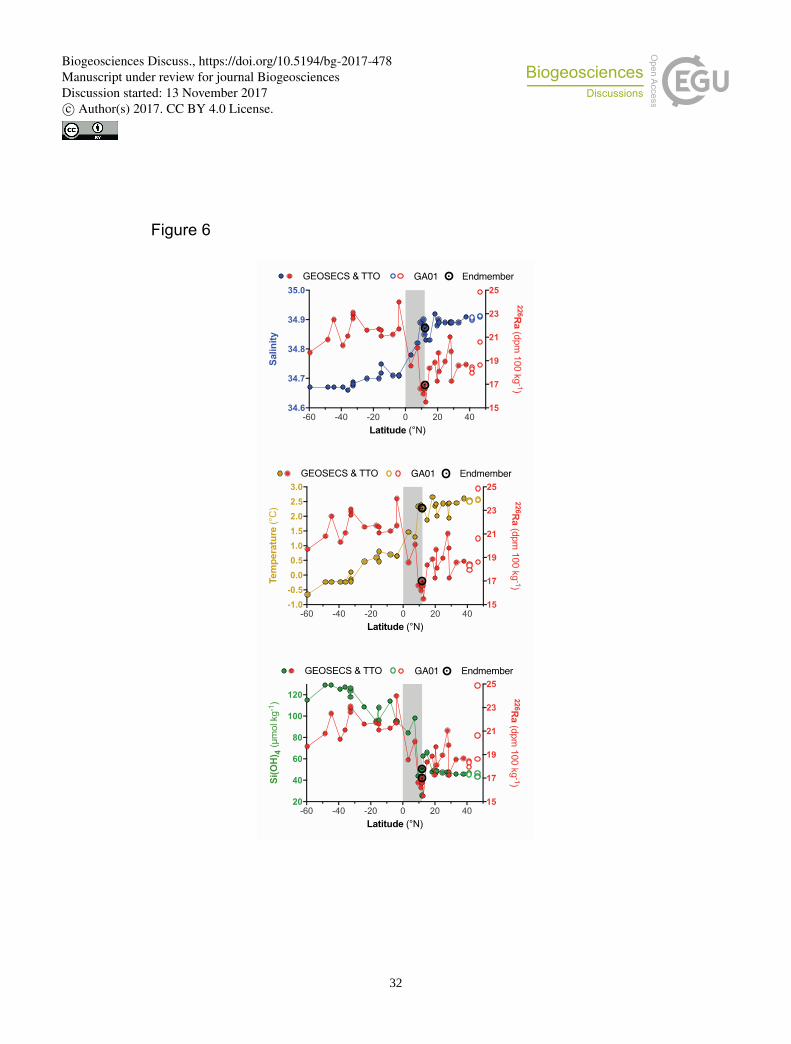
32
Biogeosciences Discuss., https://doi.org/10.5194/bg-2017-478Manuscript under review for journal BiogeosciencesDiscussion started: 13 November 2017c© Author(s) 2017. CC BY 4.0 License.
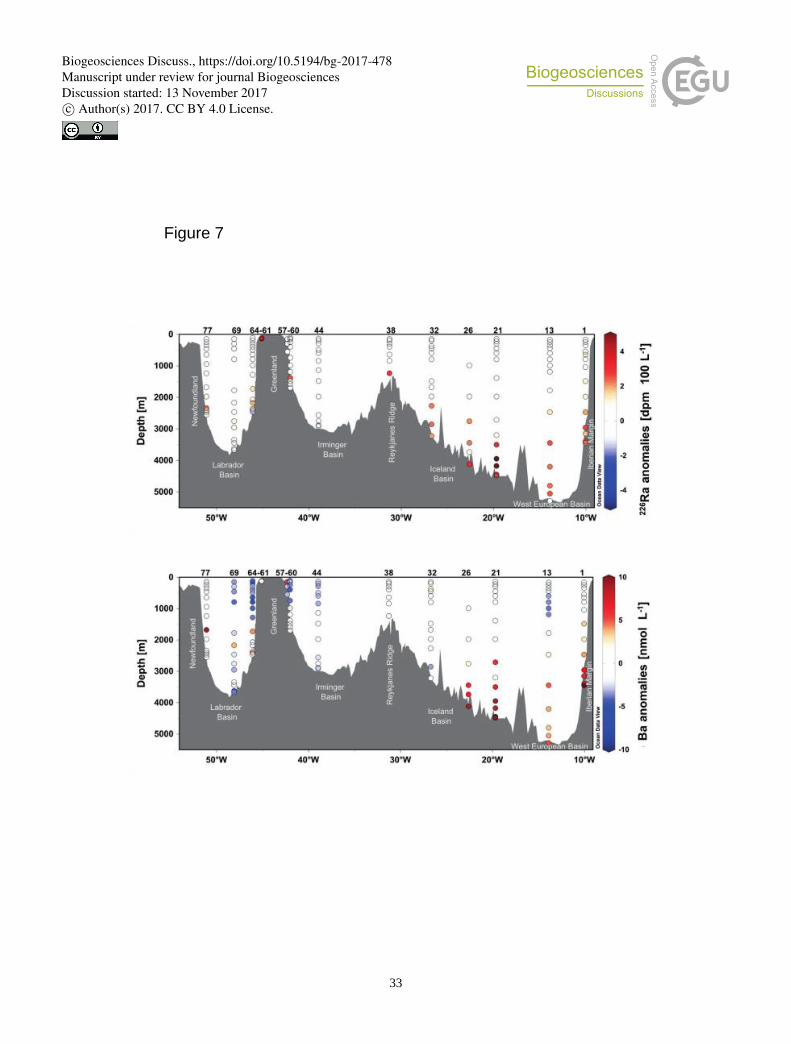
33
Figure 7
DSOW
Biogeosciences Discuss., https://doi.org/10.5194/bg-2017-478Manuscript under review for journal BiogeosciencesDiscussion started: 13 November 2017c© Author(s) 2017. CC BY 4.0 License.

34
Figure 8
B) Iceland and Irminger Basins
A) West European Basin
Biogeosciences Discuss., https://doi.org/10.5194/bg-2017-478Manuscript under review for journal BiogeosciencesDiscussion started: 13 November 2017c© Author(s) 2017. CC BY 4.0 License.
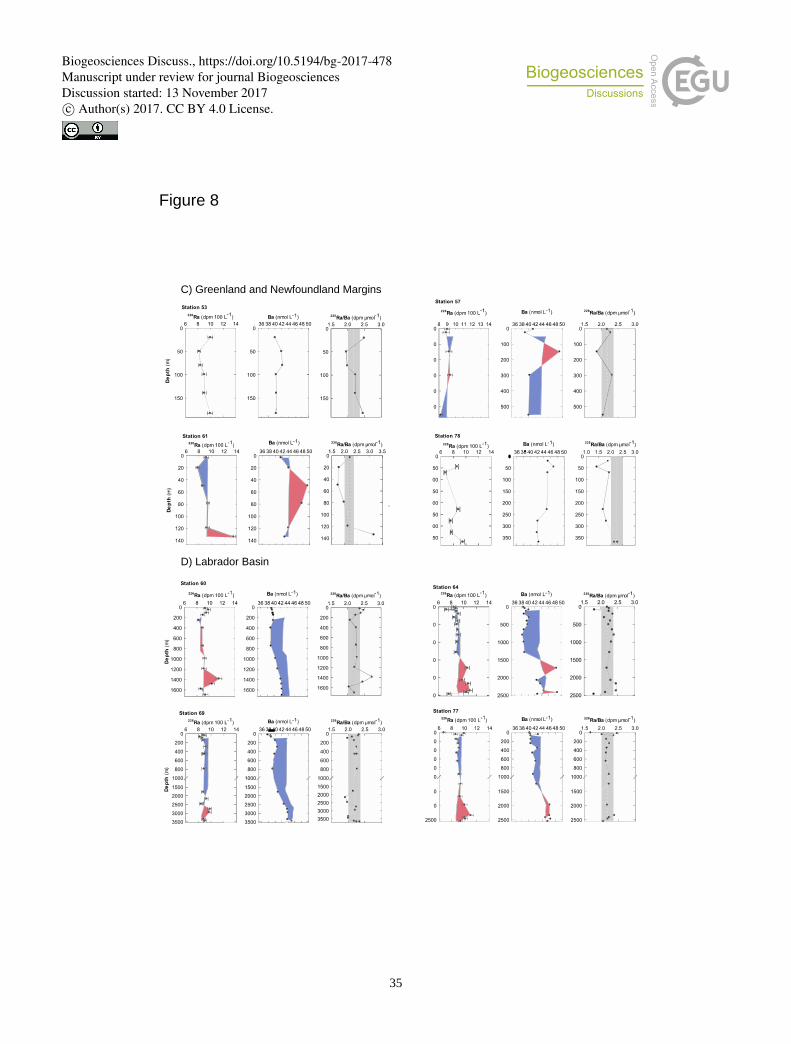
35
2.5
D) Labrador Basin
C) Greenland and Newfoundland Margins
Figure 8
Biogeosciences Discuss., https://doi.org/10.5194/bg-2017-478Manuscript under review for journal BiogeosciencesDiscussion started: 13 November 2017c© Author(s) 2017. CC BY 4.0 License.
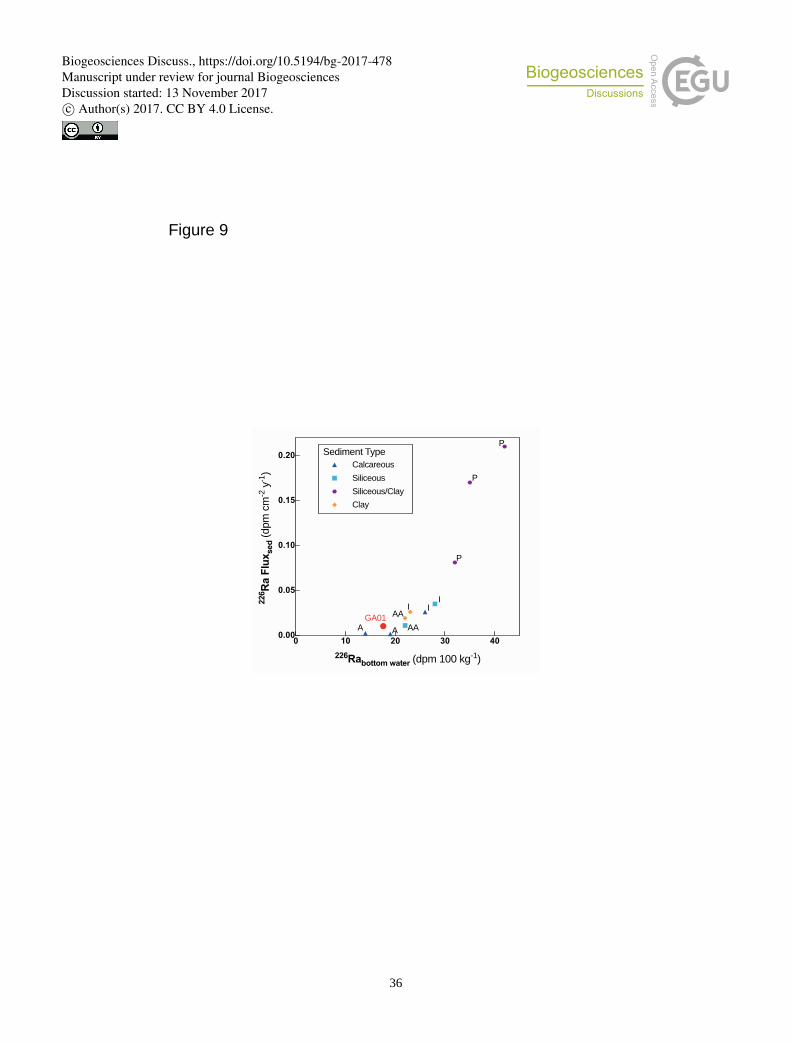
36
Figure 9
AGA01
AA
P
P
P
III
A AA
0 10 20 30 400.00
0.05
0.10
0.15
0.20
226Rabottom water (dpm 100 kg-1)
226R
a F
lux
sed (
dpm
cm
-2 y
-1)
Siliceous
Siliceous/Clay
Clay
Calcareous
Sediment Type
Biogeosciences Discuss., https://doi.org/10.5194/bg-2017-478Manuscript under review for journal BiogeosciencesDiscussion started: 13 November 2017c© Author(s) 2017. CC BY 4.0 License.