The wrong suspect. Revisiting the relationship between natural resources and civil war.
45
1 The wrong suspect Revisiting the relationship between natural resources and civil war Anouk S. Rigterink London School of Economics and Political Science Department of International Development Houghton Street London WC2A 2AE Email: [email protected] Phone: +44(0)20 7955 7434 Abstract This article investigates whether results from cross-country studies connecting natural resources and violent conflict are robust to addressing concerns regarding endogeneity and the mechanisms through which natural resources and conflict may be related. It concludes that results from studies that find the strongest effect of natural resources on civil war (Collier and Hoeffler 2004; Collier, Hoeffler, and Rohner 2009), are not robust to any of the proposed ways to address endogeneity. Furthermore, it concludes that the theoretical mechanism that receives the most empirical support emphasizes the opportunity costs of conflict and the role of wages, rather than ‘greed’. Acknowledgements I gratefully acknowledge financial support from Fundatie van de Vrijvrouwe van Renswoude, the Netherlands, and Prince Bernhard Cultuurfonds, the Netherlands. I am indebted to Dr. Ha-Joon
Transcript of The wrong suspect. Revisiting the relationship between natural resources and civil war.

1
The wrong suspect Revisiting the relationship between natural resources and civil war
Anouk S. Rigterink
London School of Economics and Political Science
Department of International Development
Houghton Street
London WC2A 2AE
Email: [email protected]
Phone: +44(0)20 7955 7434
Abstract
This article investigates whether results from cross-country studies connecting
natural resources and violent conflict are robust to addressing concerns regarding
endogeneity and the mechanisms through which natural resources and conflict may
be related. It concludes that results from studies that find the strongest effect of
natural resources on civil war (Collier and Hoeffler 2004; Collier, Hoeffler, and
Rohner 2009), are not robust to any of the proposed ways to address endogeneity.
Furthermore, it concludes that the theoretical mechanism that receives the most
empirical support emphasizes the opportunity costs of conflict and the role of
wages, rather than ‘greed’.
Acknowledgements
I gratefully acknowledge financial support from Fundatie van de Vrijvrouwe van Renswoude, the
Netherlands, and Prince Bernhard Cultuurfonds, the Netherlands. I am indebted to Dr. Ha-Joon
Chang, Dr. Macartan Humphreys, Dr. Anja Shortland, Dr. Diana Weinhold and (seminar)
participants at the London School of Economics, the Annual Conference of the Centre for the
Study of African Economies 2010 and the Brooks World Poverty Institute / Initiative for Policy
Dialogue Advanced Graduate Workshop on Poverty, Development and Globalization for insightful
comments and feedback. All errors remain my own.
Keywords
Natural resources, civil war, violence, endogeneity, natural resource trap
Introduction
Natural resources may not be a windfall but a burden. Research has associated natural resource
abundance with poor economic performance, undemocratic regime types and civil conflict (Collier
and Hoeffler 2004; Sachs and Warner 2001; Helmstaedt and Gurney 1995). This article investigates
the relationship between natural resources (specifically tradable primary commodities) and violent
civil conflict. Research employing cross-country regression analysis has been prominent in drawing
attention to this relationship: the most-cited article on this topic (Collier and Hoeffler 2004) uses
this method. As the idea has conquered a place in the public consciousness, not in the least through
the movie Blood Diamond and the best-selling book the Bottom Billion (Collier 2008), it is interesting to
examine more closely how rigorous the analyses that form the foundation of this belief are.
One particular concern is endogeneity. The studies that find a strong relationship between
natural resources and civil war onset (Collier and Hoeffler 2004; Collier, Hoeffler, and Rohner
2009) use natural resources as a percentage of GDP as a proxy for natural resource abundance.
Other studies use natural resource production or rents derived from it. Numerous authors make the
argument that exports of natural resources as a percentage of GDP is endogenous to civil war
(e.g.(Besley and Persson 2008; Blattman and Miguel 2009; Brunnschweiler and Bulte 2009;
Humphreys 2005; Ross 2004)). A high rate of natural resource exports as a percentage of GDP can
be a consequence of the anticipation of war. Alternatively, natural resource production as a
percentage of GDP can be correlated to weak economic structures, low institutional quality or a

government with a high discount rate, all factors that can plausibly be related to civil conflict.
Furthermore, numerous theoretical models on natural resources and violent conflict, which are
otherwise quite different in set-up, suggest that violent conflict may increase natural resource
production or exports, as well as the other way around (Besley and Persson 2008; Dal Bó and Dal
Bó 2004; Garfinkel, Skaperdas, and Syropoulos 2008).
However, the extent to which endogeneity drives conclusions of cross-country studies is a
matter for empirical investigation. This paper suggests a number of ways to address endogeneity
concerns, and investigates whether existing results from those cross-country studies finding the
strongest connection between natural resources and conflict (Collier and Hoeffler 2004; Collier,
Hoeffler, and Rohner 2009) are robust to incorporating these. I use two measures of natural
resource abundance that are deemed more exogenous to conflict, natural and subsoil capital
(Brunnschweiler 2008; World Bank 2006). I then reproduce the exact models estimated by Collier
and Hoeffler (2004) and Collier, Hoeffler and Rohner (2009), replacing the original proxy for
natural resource abundance with the plausibly more exogenous measures. When doing this, the
relationship between natural resources and conflict becomes insignificant or negative. Furthermore,
I use natural and subsoil capital as instruments for natural resource exports, and oil production.
Instrumental variable models also fail to find a positive relationship between civil conflict and
predicted natural resource exports or oil production respectively. I conclude that the results from
these studies are not robust to any of the proposed ways to address endogeneity.
Using the same data, and employing various ways to address endogeneity, this article then assesses
empirical support for a number of theoretical models detailing potential mechanisms connecting
natural resources and conflict. Recent theoretical mechanisms include the returns to conflict
(Garfinkel, Skaperdas, and Syropoulos 2008), the opportunity costs of conflict (Dal Bó and Dal Bó
2004) and the quality of government (Besley and Persson 2008). Most of these move away from
‘greed’ as an explanation for the relationship between natural resources and civil conflict (Collier
and Hoeffler 2004). The analysis presented provides the strongest support for the opportunity costs
mechanism. Interestingly, this mechanism appears to have gained least attention in policy circles.

The remainder of this article is organized as follows. The first section reviews existing empirical and
theoretical literature. The second section investigates the robustness of the conclusions from the
two selected studies to replacing, or instrumenting for, the original proxy of natural resources
abundance. The third section investigates empirical support for the theoretical models presented.
The final section concludes and highlights some policy implications.
Theory and literature
Cross-country empirical studies on natural resources and civil conflict
A great number of studies investigate the relationship between natural resources and civil conflict in
a cross-country setting (Brunnschweiler and Bulte 2009; Collier, Hoeffler, and Rohner 2009;
Collier, Hoeffler, and Söderbom 2004; De Soysa and Neumayer 2007; Elbadawi and Sambanis
2002; Fearon 2005; Fearon and Laitin 2003; Humphreys 2005; Lujala, Gleditsch, and Gilmore 2005;
Ross 2006). The basic set-up of these cross-country studies is similar. The dependent variable is a
dummy for civil war onset and one of the explanatory variables measures the presence or
production of natural resources. Some studies aggregate all natural resources into a single category,
others focus on specific resources, most commonly oil or diamonds.
Despite the similarities in set-up, conclusions from cross-country studies differ markedly.
Some studies find a strong relationship between natural resources and civil war (Collier and
Hoeffler 2004; Collier, Hoeffler, and Rohner 2009; Elbadawi and Sambanis 2002), whilst others
find no such relationship (Brunnschweiler and Bulte 2009; De Soysa and Neumayer 2007; Fearon
2005; Fearon and Laitin 2003). Most studies that do find that natural resources increase war risk use
primary commodity exports as a percentage of GDP as an independent variable, although Fearon
and Laitin (2003) and Fearon (2005) do not support this conclusion even though they use the same
measure. Studies using stocks of natural resources generally fail to find a connection between
resources and violent conflict onset.
Investigations into oil or fossil fuels give more uniform results: most studies conclude that
oil is significantly related to civil war onset and similar results are found for all but one measures of
oil abundance(De Soysa and Neumayer 2007; Fearon 2005; Fearon and Laitin 2003; Humphreys

2005; Ross 2006). The only notable exception is oil reserves, again a measure of resource stocks
(Humphreys 2005).
Cross-country empirical studies: endogeneity
A major concern with the studies identified above is that natural resource exports or production
may be endogenous to the models estimated. Natural resource exports as a percentage of GDP is
most suspicious in this regard. This indicator does not measure resource abundance, but rather
resource dependence (Brunnschweiler 2008). Countries that are resource dependent usually display
a number of other characteristics, such as poverty, ‘bad’ governance and ‘bad’ institutions, any one
of which can make a country more likely to experience a civil war. Expressing natural resource
exports as a percentage of GDP is a further source of endogeneity. It is plausible that productive
activity, and with that GDP, will decline in anticipation of civil war. Natural resource exports will
likely not decline as steeply, as these industries are location-specific and hence harder to move out
of the country. Thus, the ratio of natural resource exports as a percentage of GDP may increase in
anticipation of civil war, rather than the civil war breaking out in response to natural resource
exports (Ross 2004).
It has been argued that other measures of natural resources focussing on production
volume per capita are free of these endogeneity problems (Ross 2006). However, numerous
theoretical models suggest that natural resource production itself it endogenous to conflict. The
main argument for this is that the pace at which a country extracts natural resources is a choice that is
influenced by the country’s institutions and often made by its government. The pace of natural
resource extraction may be an indicator of the government’s discount rate, which is plausibly
related to conflict risk. Alternatively, the government’s discount rate, and willingness to extract
resources quickly, can be a function of the probability of it being overthrown (Besley and Persson
2008). Chichilinsky (1993) presents a model predicting that countries with poor property rights
exploit resources at a higher pace and thereby appear more resource abundant than countries with
an equal amount of resources but good property rights (Chichilnisky 1993). A theoretical model by
Robinson, Torvik and Verdier predicts that governments will over-extract resources compared to
the efficient extraction path, especially when their political position is insecure (Robinson, Torvik,
and Verdier 2006). Two of the theoretical models presented in the next section also predict that the

production and exports of natural resource respectively, increase as a consequence of conflict (Dal
Bó and Dal Bó 2004; Garfinkel, Skaperdas, and Syropoulos 2008).
Stocks of natural resources per capita are plausibly the least endogenous measure, as the
amount of resources a country possesses is a geological fact. It is not entirely free from suspicion
though, as the present stock of natural resources is a result of past extraction decisions and we may
simply not have discovered natural resource deposits in the world’s most unstable areas yet.
However, it seems harder for a government to meaningfully influence future resource stocks than
present resource extraction, and it seems doubtful that resources nobody knows about will affect
politics at all. As highlighted above, cross-country studies using stocks of natural resources generally
fail to find a relationship between natural resources and violent conflict. This may be exactly
because these measures are less vulnerable to endogeneity. This article will investigate this further.
Theoretical mechanisms connecting natural resources and civil conflict
Several theoretical models connecting natural resources to violent conflict have been proposed.
First, it is possible that natural resources affect the returns to conflict. This comes in two
variations: resources may either increase the returns to holding territory or the ‘prize’ of obtaining
government power. The first mechanism postulates that the prospect of being able to extract
resources from a particular territory may motivate fighting (Collier and Hoeffler 2004), or may
provide the necessary revenue to make fighting feasible (Collier, Hoeffler, and Rohner 2009). This
mechanism is usually associated with natural resources that are easily ‘lootable’, those that do not
involve industrial extraction processes and could be easily smuggled, such as timber, secondary
diamonds and narcotics. Garfinkel, Skaperdas and Syropoulos provide a formal model of this
mechanism. The ‘prize’ of governance mechanism emphasizes the returns to forming the
government, rather than holding territory. Forming the government may be advantageous, if it
means having the power to spend large flows of revenue from natural resources in a discretionary
way. This may include redistributing these revenues to the government’s ‘own’ group or stealing
them outright. The extent to which this is possible depends on the extent to which government is
constrained by institutions (Besley and Persson 2008). This mechanism is commonly associated
with natural resources that result in large revenue flows to government, such as oil.

Secondly, resources may affect the opportunity cost of conflict, through impacting the wage rate
(Dal Bó and Dal Bó 2004). Individuals who have better outside options in the ‘peaceful’ economy,
may be less vulnerable to recruitment because they have more to lose: because their opportunity
costs are higher. Whether the presence of natural resources impacts the wage rate positively or
negatively depends on how natural resources are produced, according to Dal Bó and Dal Bó. In
their model, the price of natural resources with a capital-intensive production process is negatively
related to the wage rate, and the converse is true for natural resources with a labour-intensive
production process. This implies that capital-intensive natural resources, such as oil or primary
minerals may be positively related to violent conflict, and labour-intensive resources, such as
agricultural products, may be negatively related to violent conflict.
A third possible mechanism suggests that natural resources affect the quality of government,
which in turn affects conflict risk. This has a connection with the ‘prize’ of government mechanism.
If a government is indeed at greater risk of being overthrown if it can spend large amounts of
natural resource revenue at will, it may have a shorter time horizon. This implies that the
government will invest less in the future, including in sound institutions (making government even
more of a ‘prize’) and future economic development (facilitating recruitment). This could lead to a
vicious circle of conflict risk, poor governance, low quality institutions and lack of development
(Besley and Persson 2008, 2010).
Empirical evidence for theoretical mechanisms
A number of studies empirically investigate the mechanisms linking natural resources and conflict.
They do this either by directly investigating the relationship between natural resources and some
indicator for the mechanism (government overthrow, income or the quality of government
respectively) or by distinguishing between different types of resources that would play a greater or
lesser role in spurring conflict according to each mechanism.
First, consider the opportunity cost of conflict mechanism. Bruckner and Ciccone (2010)
find a positive relationship between natural resource prices, GDP and the absence of war (Brückner
and Ciccone 2010). Bazzi and Blattman (2011) find no such results for resources in general, but do
find some similar evidence in the case of (labour-intensive) agricultural resources (Bazzi and
Blattman 2011). Dube and Vargas (2009) compare (capital-intensive) oil and (labour-intensive)

coffee, and find a positive relationship between oil prices and conflict and a negative relationship
between coffee prices and conflict, providing direct support for the model by Dal Bó and Dal Bó.
By contrast, Angrist and Kugler (2008) fail to find any evidence supporting the opportunity cost
mechanism in the case of coca (Angrist and Kugler 2008). Overall then, there is a reasonable
amount of research supporting the opportunity cost mechanism, although illegal drugs may be an
exception.
Moving on to the returns to conflict mechanism, existing studies generally fail to find
convincing evidence in favour of this mechanism. Dube and Vargas (2009) find a relationship
between oil and violence, but in oil-producing areas of Columbia, rather than the capital, where we
might expect more violence if the ‘prize’ of government is an inducement for conflict. Bazzi and
Blatmann (2011) conclude that an increase in the price of so-called ‘extractive’ resources does not
increase conflict risk. Cotet and Tsui (2010) find that the chance of experiencing a coup or irregular
leader transition does not increase after an oil discovery (Cotet and Tsui 2010).
Finally, studies investigating the relationship between natural resources and government
quality give mixed results. Some studies conclude that variation in the value or quantity of natural
resources is negatively related to polity score (Caselli and Tesei 2011) or positively related to
military spending (Cotet and Tsui 2010). However, the latter study does not find a commensurate
increase in the probability of civil war, coups or irregular leader transitions. Furthermore, other
authors find that oil price shocks are related to an improvement in democracy according to various
indicators (Brückner, Ciccone, and Tesei 2012).
Investigating endogeneity: is the relationship robust?
Although the argument that natural resource exports as a percentage of GDP is endogenous has
been made by numerous authors (Besley and Persson 2008; Blattman and Miguel 2009;
Brunnschweiler and Bulte 2009; Humphreys 2005; Ross 2006), the extent to which conclusions
from studies using this measure are driven by endogeneity is a matter for empirical investigation.
This section investigates this. To do so, I select the two studies that find the strongest relationship
between natural resources and civil war, those by Collier and Hoeffler (2004) and Collier, Hoeffler
and Rohner (2009). Because these studies find the strongest relationship initially, they provide the

‘toughest test’ when one wants to show that these results are in fact spurious. Both studies use
natural resource exports as a percentage of GDP as a proxy for resource abundance. I replace this
proxy for natural resource abundance with a number of plausibly more exogenous measures and
assess to what extent this affects the results obtained. In addition, I use the arguably exogenous
variables as instruments for potentially endogenous measures of natural resource abundance.
From the literature on the relationship between natural resources and economic growth,
we know that the measure of natural resource abundance used can have substantial impact on the
conclusions drawn. Brunnschweiler replaces natural resource exports as percentage of GDP with
natural and subsoil capital (measures of the value of the stock of natural resources per capita
explained in more detail below). Using the first measure one would conclude that natural resources
hamper growth, but when using the latter two measures, she finds no significant, or even a positive
relationship between natural resources and growth (Brunnschweiler 2008). It would be interesting
to see if a similar radical change would result from using these measures in the context of conflict.
Data: measuring natural resource abundance
The alternative measures of natural resource abundance used are natural and subsoil capital, two
measures of the value of the stock of natural resources in the economy. Unlike resource dependence
and resource production, the initial stock of natural resources in an economy is determined by
geography, and is therefore arguably more exogenous to conflict. The World Bank provides two
such stock measures: natural and subsoil capital for the years 1995, 2000 and 2005 (World Bank
1997, 2006, 2011).
Subsoil capital consists of the net present value (NPV) of the flow of rents from
exploitation of stocks of four fossil fuels1 and ten metals and minerals2, over an assumed lifespan.
The World Bank constructs this measure as follows (World Bank 2006). It estimates for each
country the size of the stock of each resource that can be economically extracted and the country-
specific rents derived from a unit produced (the unit price minus extraction costs). It assumes that
the stock of resources will be exploited within a time span of twenty years in each country. This
roughly corresponds to the world average reserve-to-production ratio for most of the resources
1 Oil, natural gas, hard coal and lignite (soft coal) 2 Bauxite, copper, gold, iron, lead, nickel, phosphate, silver, tin and zinc

included in the measure. Furthermore, it assumes that extraction occurs along an optimal path,
given a fixed growth rate of resources rents, and a fixed discount rate. The discount rate is set at
four per cent, which is the upper bound of estimated social return on investment for industrialized
countries.3
Note that the World Bank estimates of subsoil capital for 1995 and 2000 (World Bank
1997, 2006) artificially impose the same discount rate and time horizon for extraction on all
countries in the sample. These are exactly the factors that we would like to hold constant because
they are a potential source of endogeneity.
To arrive at a measure of natural capital, the World Bank adds the NPV of the flow of
income derived from cropland, timber, non-timber forest resources, pastureland and protected
areas to the value of subsoil capital for each country. To calculate the NPV of rents from cropland,
ten representative crops are identified.4 For each of these crops and each country, the NPV of
cropland is the product of the total area of cropland, country-specific yield per acre, world price
and a fixed rental rate (one minus the ratio of costs to revenue per acre, assuming the product is
sold at world prices), over an assumed lifespan of 25 years, discounted using a fixed four per cent
discount rate. Yields are assumed to increase at a fixed rate, which is different for developing and
developed countries.5 A similar method is used to determine the NPV of pastureland. The
representative products in this case are beef, lamb, wool and milk. The NPV of standing timber is
calculated using a similar method to subsoil capital, where the area of forest within 50 kilometres of
infrastructure equals the stock of timber. The assumed lifespan of extraction is 25 years, or the
estimated time to exhaustion of timber resources given current country-specific production and
timber growth, whichever is smaller.6 The NPV of non-timber forest resourcesis 0.1 times the size of
forested areas (the share of forests assumed accessible) multiplied by an assumed revenue per acre,
which is different for developing and developed countries, over a 25 year life span, discounted.
Finally, protected areas are a natural resource in the sense that they can bring income from tourism. Its
3 Later estimates of subsoil capital (World Bank 2011) are calculated using an extraction time-span of 25 years, a zero growth rate of resource rents and a country-specific discount rate based on the annual growth rate of per capita consumption. 4Maize, rice, wheat, bananas, grapes, apples oranges, soybeans coffee and a residual category which includes roots and pulses. 5 Later estimates use a rental rate of 0.3 for all crops, are based on production data from a different source and use a country-specific discount rate. 6(World Bank 2011) assumes zero growth of rents for both categories of countries.
NPV per acre is set at a rate lower than the country-specific NPV of crop and pastureland
(reflecting the opportunity cost of designating some land as a protected area). The life span is 25
years and the discount rate is four per cent (World Bank 2006).
As is clear from the above, when calculating the value of natural capital for 1995 and 2005,
the World Bank also imposes the same discount rate on all countries. However, unlike subsoil
capital, the way in which natural capital is measured introduces other potential sources of
endogeneity. Cropping patterns, patterns in the use of pastureland and yields per acre are likely
partially determined by a country’s political and economic conditions. Furthermore, the World
Bank assumes different parameters for developed and developing countries when calculating the
NPV of non-timber forest resources and the growth rate of rents to cropland and pastureland.
Lastly, the life span of standing timber is potentially dependent on the pace of extraction. For these
reasons, natural capital is not the preferred measure of natural resources in this article. However, in
aggregating all natural resources, including agricultural products, into a single measure, it is
conceptually most similar to the original measure employed by Collier and Hoeffler (2004) and
Collier, Hoeffler and Rohner (2009). When we wish to examine the impact of natural resources as a
single category on conflict, natural capital is the best alternative measure available.

Figure 1: World distribution of natural resources according to different measures
Panel A
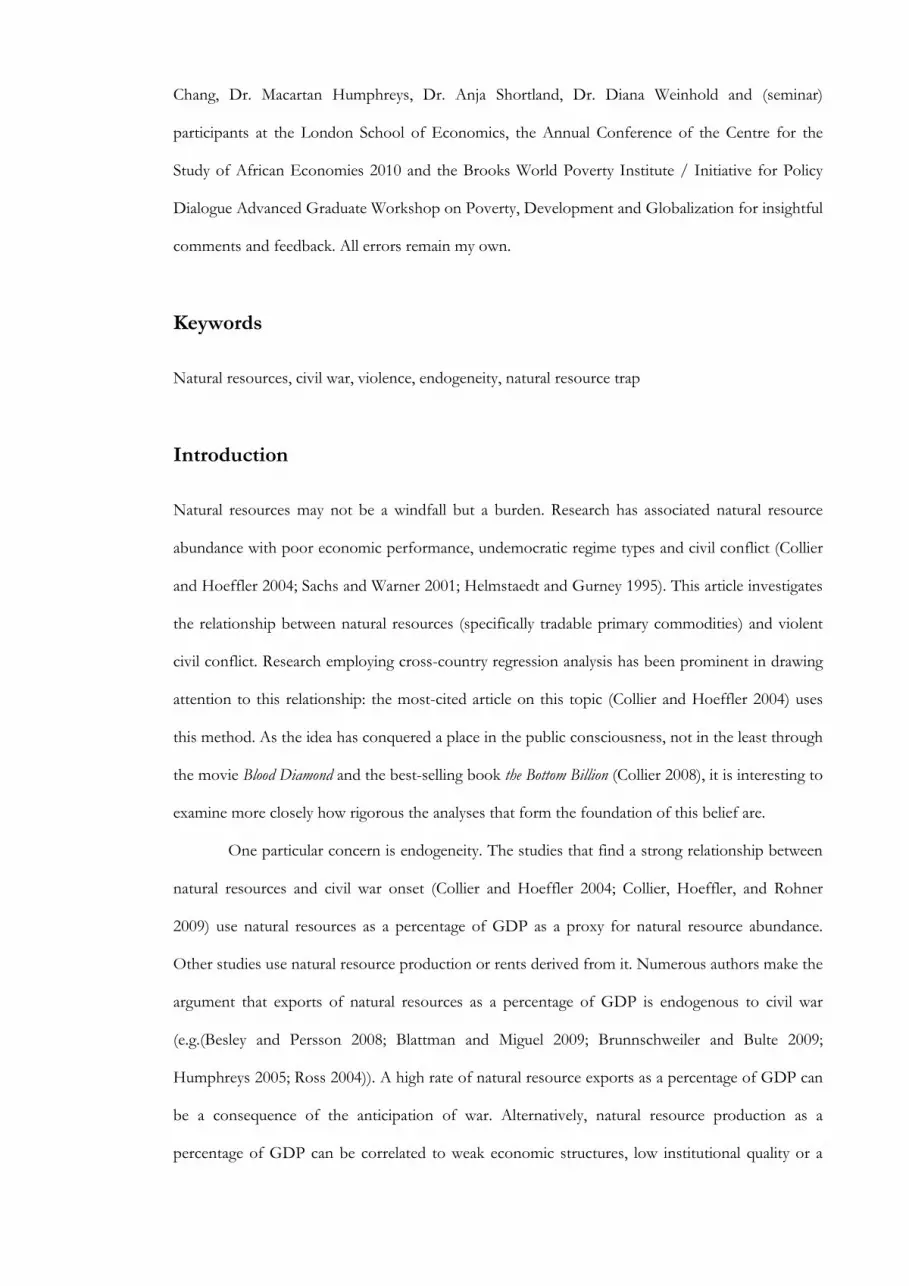
Panel B


Figure 1 gives a sense of the global distribution of natural resources according to various measures.
It displays countries with missing data (-999) in grey, countries without resources in white, and
classifies the remaining countries according to quartile.7 Panel A compares natural capital, natural
resource exports as a percentage of GDP and natural resource exports per capita. The latter is
constructed by multiplying Collier and Hoeffler’s (2004) original measure by total GDP at current
prices and dividing this by the size of the population.8 When focussing on natural resource exports
as a percentage of GDP, countries rich in natural resources are predominantly found in Africa and
the Middle-East, and to a lesser extent in Middle-America. However, weighting natural resource
exports by population rather than GDP shows an extremely different picture: Africa appears
particularly resource-poor according to this metric, and Europe, North America and South America
appear particularly rich in resources. Natural capital has considerable overlap with resource exports
per capita: Europe, North America and South America also appear resource-rich by this measure,
and variation within Africa is similar, to the extent that data on Africa is not missing.9 Natural
capital has little visual overlap with natural resource exports as a percentage of GDP. This
illustrates the argument that natural resource exports as a percentage of GDP reflect resource
dependency rather than the presence of resources: both natural capital and the reweighted measure
suggest that it may not be the case that the more developed areas of the world have fewer
resources, but rather that they are less dependent on them.
Panel B of Figure 1 compares subsoil capital, Collier and Hoeffler’s oil exports as
percentage of GDP10, this measure reweighted by population, and Humphreys (2005) indicators for
oil production and oil reserves. A somewhat similar, but less pronounced picture emerges. Oil
exports over GDP depict Africa as most oil-rich, whereas oil exports per capita indicate that the
Middle East has most oil. Subsoil capital visually overlaps more with the latter than the former,
although it includes more types of exhaustible resources and hence has fewer countries with zero
resources. The global distribution of resources looks broadly similar when taking either oil reserves
7 For oil reserves per capita, the quartile ranges are calculated excluding Saudi Arabia and the United Arab Emirates. These countries have extremely large oil reserves and including them would mean that only these two countries fall in the fourth quartile. 8 Both additional variables are obtained from the World Bank World Development Indicators 9 Although it would appear that missing data on Africa is a downside of the natural capital measure, many African countries are excluded from Collier and Hoeffler’s final analysis because they miss data on other variables – using natural capital leads to a loss of only 29 (out of 459) country-years. See Table 3. 10 They construct this by multiplying natural resources as percentage of GDP by a dummy for oil-producing countries.

or oil production per capita taken from Humphreys (2005) as a measure. Subsoil capital visually
overlaps with both these measures.
Natural and subsoil capital measure stocks of natural resources, but not initial stocks, rather stocks in
1995, 2000 and 2005. The main analysis uses data from 2000, because the 1995 measures are only
available for a reduced sample of countries, and the 2005 data is calculated using country-specific
discount rates. Using natural and subsoil capital implies explaining past conflict (going back to
1960) using stocks of natural capital in 2000 (or predicting past resource exports using stocks of
natural resources in 2000 - when using natural and subsoil capital as instruments). For this to be
meaningful, natural and subsoil capital should capture a country’s underlying predisposition to
possess natural resources, and thus be correlated to natural resource exports and production
throughout the time period under research.
Table 2 displays the correlation between natural and subsoil capital respectively, and
alternative measures of natural resource abundance. As expected from observing Figure 1, the
correlation between natural resource exports as a percentage of GDP and natural and subsoil
capital respectively, is very low. Correlation coefficients do not exceed 0.3 and are insignificant in a
number of cases. The correlation between subsoil capital and oil exports as a percentage of GDP is
much stronger; coefficients range from 0.46 to 0.55. Correlation coefficients increase in size
substantially when weighting natural resource exports by population rather than GDP; coefficients
obtained for natural capital and natural resource exports per capita, and subsoil capital and oil
exports per capita are of respectable size, ranging from 0.53 to 0.65. Correlations do not appear to
become meaningfully stronger over time. In fact the correlation coefficient for 1995 is the lowest in
both sets. This mitigates the concern that natural and subsoil capital in 2000 are poor predictors of
past natural resource exports.

Subsoil capital is also significantly correlated to Humphreys’ (2005) measures of oil
production and oil reserves. All coefficients are significant at the 1 per cent level. However, the size
of the correlation coefficient fluctuates quite strongly over time, peaking between 1985 and 1990. I
can offer no reasonable explanation for this. However, these series provide no strong evidence that
natural and subsoil capital in 2000 better predict later oil production or reserves: the coefficient on
oil reserves for 1999 is the lowest in the series, and the size of the coefficient on oil production for
1999 is roughly similar to that for 1975.
Table 1: Correlation between measures of resource abundance, over time
Panel A: correlation coefficient between natural capital (2000) and…
YEAR 1960 1965 1970 1975 1980 1985 1990 1995 Resource exports / GDP
0.1021 0.1047 0.1157 0.1148 0.2279 0.1848 0.2289 0.2371 * * ** **
Resource exports p.c.
0.6470 0.6418 0.5838 0.5655 0.6232 0.6079 0.5383 0.5330 *** *** *** *** *** *** *** ***
Panel B: correlation coefficient between subsoil capital (2000) and…
YEAR 1960 1965 1970 1975 1980 1985 1990 1995 1999 Resource exports / GDP
0.1730 0.1750 0.1682 0.1798 0.2963 0.2252 0.2722 0.2637 - * * * * ** ** *** ***
Resource exports p.c.
0.4677 0.5027 0.4554 0.5596 0.6419 0.5934 0.5158 0.4673 - *** *** *** *** *** *** *** ***
Resource exports/ GDP * oil dummy
0.5514 0.5519 0.5425 0.5629 0.5184 0.4602 0.4699 0.4643 - *** *** *** *** *** *** *** ***
Resource exports p.c. * oil dummy
0.5713 0.6030 0.6085 0.6048 0.6008 0.5874 0.5512 0.5350 - *** *** *** *** *** *** *** ***
Oil production 0.3506 0.4720 0.5762 0.6193 0.7888 0.9399 0.9317 0.8735 0.6762 *** *** *** *** *** *** *** *** ***
Oil reserves - 0.3703 0.3802 0.3857 0.3836 0.8244 0.6137 0.5716 0.2928 *** *** *** *** *** *** *** ***
*** 𝑝<0.01, ** 𝑝<0.05, * 𝑝<0.1

Another concern is that the year of measurement of natural and subsoil capital is a source of
endogeneity. One could argue that present stocks of natural resources reflect past exploitation rates.
Furthermore, natural and subsoil capital are constructed using known stocks, and resource discovery
might be endogenous to conflict. World Bank (2011) investigates the changes in natural and subsoil
capital from 1995 to 2005. It concludes that variation is mainly due to changes in world prices of
resources (which are the same for all countries in a given year). Where stocks have changed, they
have increased most strongly in Sub-Saharan Africa and the Middle East and North Africa. These
are two regions we would most strongly associate with violent conflict. Extrapolating this
backwards, 2000 levels of natural and subsoil capital are thus likely to overestimate past levels of
natural resource abundance in conflict-prone regions, biasing the relationship between natural
resource and conflict upward. This would make it more, not less challenging to prove that earlier
obtained results are due to endogeneity.
Empirical strategy
This section will investigate to what extent results obtained by Collier and Hoeffler (2004) and
Collier, Hoeffler and Rohner (2009) are driven by endogeneity, by replacing the proxy for natural
resource abundance, with subsoil capital and natural capital. Furthermore, it will use natural and
subsoil capital as instruments for natural resources exports as a percentage of GDP, natural
resource exports per capita and oil production. A detailed description of the control variables and
data sources is provided by Collier and Hoeffler (2004) and Collier, Hoeffler and Rohner and
reproduced in Appendix A and Appendix B respectively.
It is important to keep in mind which question(s) these analyses address. We may want to
know whether countries that are rich or abundant in natural resources are more likely to experience
civil conflict. Collier and Hoeffler (2004) and Collier, Hoeffler and Rohner (2009) appear to want to
address this question, when they state that natural resources exports as a percentage of GDP is a
proxy for natural resource abundance (see (Collier and Hoeffler 2004; Collier, Hoeffler, and Rohner
2009), Appendix A and Appendix B). Conceptually, this question calls for a cross-country set-up
and a measure of the amount of natural resources present. Stocks appear to be an adequate measure
of this. Replacing the original proxy for natural resource abundance with natural and subsoil capital,
and converting this to a cross-country set-up aims to provide an answer this question.

Alternatively, we may be interested in whether resource production, exports, or resource-
dependence increases the likelihood of civil war. This question calls for a time-series or panel data
analysis, and is subject to problems of endogeneity described above. Instrumenting for natural
resource production, exports and dependence with natural and subsoil capital is one strategy to
mitigate these endogeneity problems and arrive at a credible causal answer to this question.
To my knowledge, natural and subsoil capital are rarely used in the context of civil conflict, the
exceptions being De Soysa (2002) and Brunnschweiler and Bulte (2009). However, neither of these
articles are a direct test of whether earlier results are driven by endogeneity. These studies do not
only replace the measure of natural resource abundance, but also differ from previous studies in a
number of other ways. For instance, they use a different set of explanatory variables, a different
time span, a different dependent variable, or a different econometric estimation technique
compared to Collier and Hoeffler (2004) or Collier, Hoeffler and Rohner (2009). As results from
cross-country studies have been shown to be sensitive to such changes (Fearon 2005; Hegre and
Sambanis 2006; Sambanis 2004), we cannot be sure whether the changes in results De Soysa (2002)
and Brunnschweiler and Bulte (2009) observe are due to elimination of endogeneity or to different
changes to the specification. Furthermore, Brunnschweiler and Bulte (2009) use an instrumental
variable model, using natural and subsoil capital as two of a number of other instruments for
natural resource exports as percentage of GDP. This is problematic, because their additional
instruments likely violate the exclusion restriction. These are latitude (known to be correlated to
institutions (Rodrik, Subramanian, and Trebbi 2004)), percentage of land area in the tropics
(potentially correlated to malaria risk and long-term economic development (McArthur and Sachs
2001)) and distance to the nearest coast or navigable river (potentially correlated to economic
development). Hence, these instruments are plausibly correlated to violent conflict via a mechanism
other than natural resource abundance.
Results
Table 3 presents the model employed by Collier and Hoeffler (2004). Column (1) replicates the
logit regression presented in Collier and Hoeffler (2004) Table 5 column 3. The only difference
.
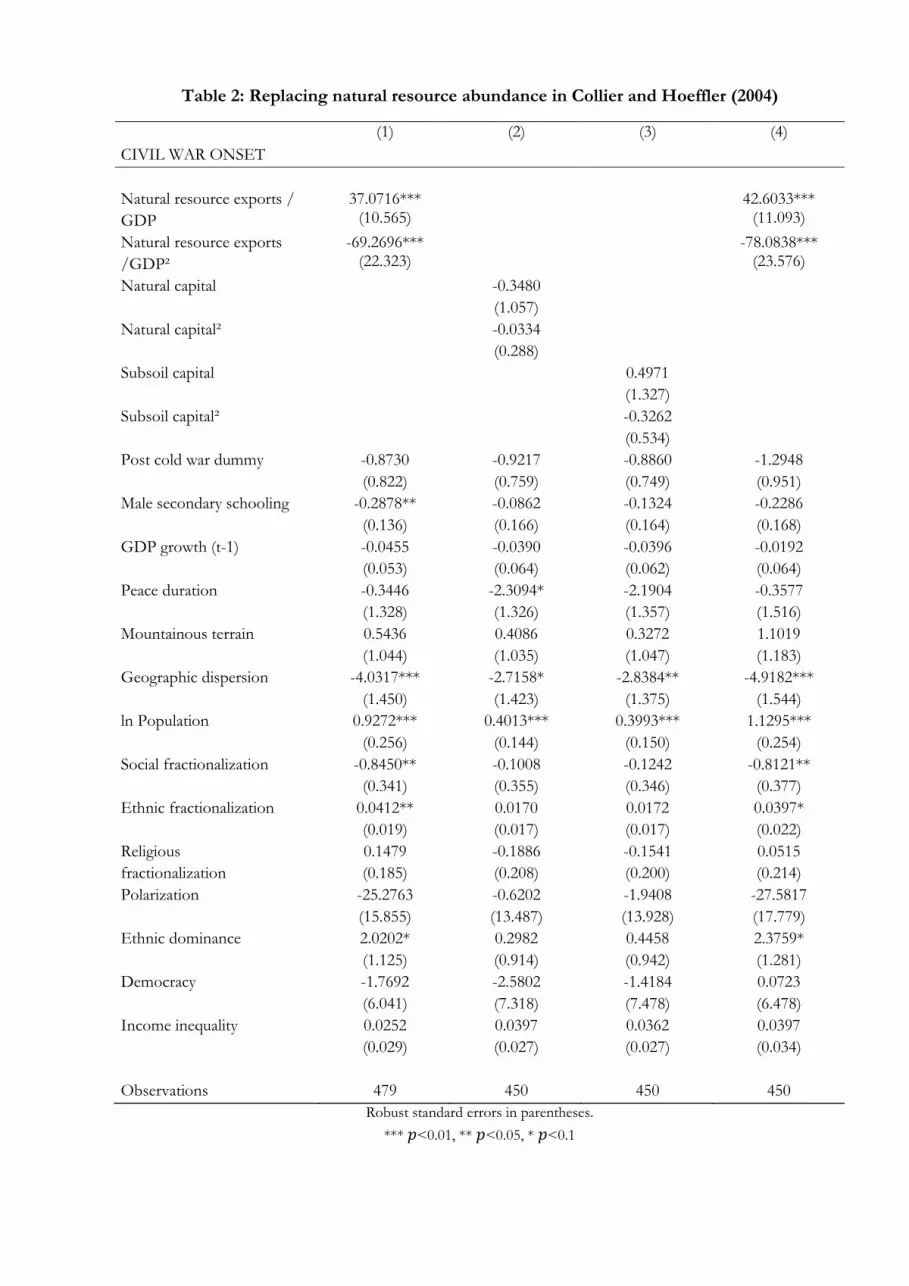
Table 2: Replacing natural resource abundance in Collier and Hoeffler (2004)
(1) (2) (3) (4) CIVIL WAR ONSET Natural resource exports / GDP
37.0716*** 42.6033*** (10.565) (11.093)
Natural resource exports /GDP²
-69.2696*** -78.0838*** (22.323) (23.576)
Natural capital -0.3480 (1.057) Natural capital² -0.0334 (0.288) Subsoil capital 0.4971 (1.327) Subsoil capital² -0.3262 (0.534) Post cold war dummy -0.8730 -0.9217 -0.8860 -1.2948 (0.822) (0.759) (0.749) (0.951) Male secondary schooling -0.2878** -0.0862 -0.1324 -0.2286 (0.136) (0.166) (0.164) (0.168) GDP growth (t-1) -0.0455 -0.0390 -0.0396 -0.0192 (0.053) (0.064) (0.062) (0.064) Peace duration -0.3446 -2.3094* -2.1904 -0.3577 (1.328) (1.326) (1.357) (1.516) Mountainous terrain 0.5436 0.4086 0.3272 1.1019 (1.044) (1.035) (1.047) (1.183) Geographic dispersion -4.0317*** -2.7158* -2.8384** -4.9182*** (1.450) (1.423) (1.375) (1.544) ln Population 0.9272*** 0.4013*** 0.3993*** 1.1295*** (0.256) (0.144) (0.150) (0.254) Social fractionalization -0.8450** -0.1008 -0.1242 -0.8121** (0.341) (0.355) (0.346) (0.377) Ethnic fractionalization 0.0412** 0.0170 0.0172 0.0397* (0.019) (0.017) (0.017) (0.022) Religious 0.1479 -0.1886 -0.1541 0.0515 fractionalization (0.185) (0.208) (0.200) (0.214) Polarization -25.2763 -0.6202 -1.9408 -27.5817 (15.855) (13.487) (13.928) (17.779) Ethnic dominance 2.0202* 0.2982 0.4458 2.3759* (1.125) (0.914) (0.942) (1.281) Democracy -1.7692 -2.5802 -1.4184 0.0723 (6.041) (7.318) (7.478) (6.478) Income inequality 0.0252 0.0397 0.0362 0.0397 (0.029) (0.027) (0.027) (0.034) Observations 479 450 450 450
Robust standard errors in parentheses. *** 𝑝<0.01, ** 𝑝<0.05, * 𝑝<0.1
between the original analysis and the one presented here is that I use robust standard errors, taking
into account possible heteroscedasticity and/or autocorrelation within panel data. As we can see
from column (1), natural resource exports as percentage of GDP and its square are significant at 1
per cent in the original analysis, suggesting an inverse U-shaped relationship between natural
resources and war.
In column (2), the original measures of natural resource abundance are replaced with
natural capital and its squared term. The relationship observed earlier loses its significance, and the
coefficient now carries a negative sign. Entering subsoil capital as a measure of natural resource
abundance similarly shows no significant relationship between resource and war onset (column (3)).
Using the natural logarithm of either two variables equally gives similar results (not shown).
Although replacing the original variable only results in a marginal loss of observations, one
might be concerned that this loss of significance is an artefact of a different sample composition.
Therefore, I run the original regression on the same sample as used in columns (2) and (3). As
shown in column (4), this does not cause the coefficient on natural resource exports as a percentage
of GDP to lose significance. In fact, the size of its coefficient increases somewhat. Sample
composition does not seem to drive the loss of significance. Experimenting with dropping various
control variables or step-wise deletion of insignificant controls equally does not cause either subsoil
or natural capital to become significant at any conventional level.
Table 3 shows us that using an arguably more exogenous measure of natural resource
abundance can have large consequences for the relationship observed. Using either exogenous
measure, no evidence can be found for a positive significant relationship between natural resource
abundance and civil conflict. The original results, concluding that this relationship does exist,
appear to have been driven by endogeneity.
One may be concerned that these results are sensitive to the year of measurement of natural and
subsoil capital, even though these measures have been shown to correlate systematically to past
resource exports in an earlier section. Therefore, Table 4 shows the results of replicating the
regressions in columns (2) and (3) of Table 3 using data on natural and subsoil capital for different
years, published by the World Bank in 2011. As highlighted earlier, these measurements are slightly
suspect, since they use a country-specific discount rate. Coefficients on the control variables are
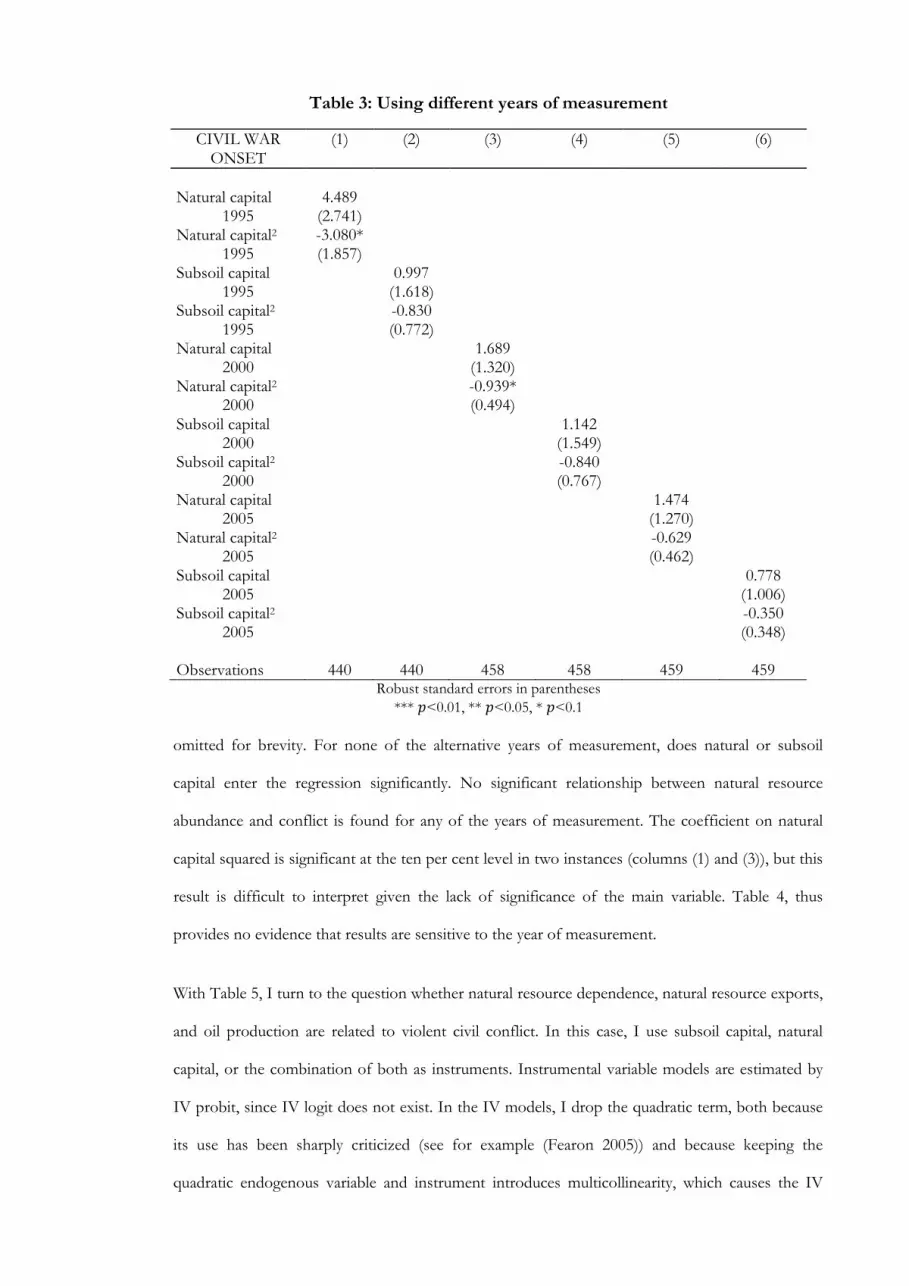
omitted for brevity. For none of the alternative years of measurement, does natural or subsoil
capital enter the regression significantly. No significant relationship between natural resource
abundance and conflict is found for any of the years of measurement. The coefficient on natural
capital squared is significant at the ten per cent level in two instances (columns (1) and (3)), but this
result is difficult to interpret given the lack of significance of the main variable. Table 4, thus
provides no evidence that results are sensitive to the year of measurement.
With Table 5, I turn to the question whether natural resource dependence, natural resource exports,
and oil production are related to violent civil conflict. In this case, I use subsoil capital, natural
capital, or the combination of both as instruments. Instrumental variable models are estimated by
IV probit, since IV logit does not exist. In the IV models, I drop the quadratic term, both because
its use has been sharply criticized (see for example (Fearon 2005)) and because keeping the
quadratic endogenous variable and instrument introduces multicollinearity, which causes the IV
Table 3: Using different years of measurement
CIVIL WAR (1) (2) (3) (4) (5) (6) ONSET
Natural capital 4.489
1995 (2.741) Natural capital2 -3.080*
1995 (1.857) Subsoil capital 0.997
1995 (1.618) Subsoil capital2 -0.830
1995 (0.772) Natural capital 1.689
2000 (1.320) Natural capital2 -0.939*
2000 (0.494) Subsoil capital 1.142
2000 (1.549) Subsoil capital2 -0.840
2000 (0.767) Natural capital 1.474
2005 (1.270) Natural capital2 -0.629
2005 (0.462) Subsoil capital 0.778
2005 (1.006) Subsoil capital2 -0.350
2005 (0.348) Observations 440 440 458 458 459 459
Robust standard errors in parentheses *** 𝑝<0.01, ** 𝑝<0.05, * 𝑝<0.1

probit model to fail to achieve convergence. For comparison, logit and probit models omitting the
quadratic terms are also given. In all models, the same control variables as in Table 3 are included,
but coefficients are omitted from the table.
Panel A of Table 5 again reproduces the original model from Collier and Hoeffler (2004)
(column (1)), and shows that the relationship between natural resource dependence and civil war is
robust to omitting the quadratic term and to shifting the method of estimation to probit (columns
(2) and (3)). It is not, however, robust to instrumenting for natural resource exports over GDP
using any combination of instruments. All coefficients in the IV models carry a negative sign, and
the coefficient in column (6), using only natural capital as instrument, is significant at the ten per
cent level. Again, the relationship between natural resources and conflict, more specifically the
relationship between natural resource dependence and civil war onset, turns insignificant when
addressing potential endogeneity.
In Panel B, natural resource exports weighted by population rather than GDP is used as
the independent variable of interest. Resulting coefficients in column (1) of panel B still carry
similar signs to those in panel A, but they are no longer significant. Instrumenting for natural
resource exports per capita again results in coefficients that are insignificant, of smaller size, and in
two cases negative. However, as columns (2) and (3) show, this may also be due to dropping the
quadratic term, or change in estimation method respectively.
Finally, panel C uses Humphreys (2000) measure of oil production. This is positively, yet
not significantly related to civil war onset in columns (1), (2) and (3). However, when instrumenting
for oil production using subsoil capital, the coefficient on oil production is negative, though again
insignificant.
In sum, results on natural resource dependence are similar to the ones obtained earlier this
section. I generally fail to find a significant positive relationship between civil war onset, and natural
resource exports and oil production respectively, using data from Collier and Hoeffler (2004).
Results obtained provide some suggestive evidence that addressing endogeneity problems can
change the size and sign of the coefficients, and thus the relationship observed, for these variables.

Table 4: Instrumental variable models
Panel A: Resource dependence CIVIL WAR (1) (2) (3) (4) (5) (6)
ONSET logit logit probit IVprobit IVprobit IVprobit
Natural resource 37.07*** 3.921** 1.853** -4.094 -3.235 -6.711** exports / GDP (10.56) (1.736) (0.892) (4.871) (4.958) (3.329) Natural resource -69.27*** exports / GDP² (22.32) Instruments: Natural and
subsoil capital Subsoil capital Natural capital
Observations 479 463 479 450 450 450
Panel B: Resource exports
CIVIL WAR (1) (2) (3) (4) (5) (6) ONSET logit logit probit IVprobit IVprobit IVprobit
Natural resource 45.87 0.158 -0.0356 -0.289 0.425 -4.213 exports p.c. (39.14) (6.726) (3.491) (5.278) (4.886) (6.384) Natural resource -548.9 exports p.c.² (457.6) Instruments: Natural and
subsoil capital Subsoil capital Natural capital
Observations 479 463 479 450 450 450
Panel C: Oil production
CIVIL WAR (1) (2) (3) (4) ONSET logit logit probit IVprobit
Oil production p.c. 118.2 27.32 12.79 -28.79 (78.41) (21.08) (11.07) (50.54) Oil production p.c. -2900 (2270) Instruments: Subsoil capital Observations 467 467 467 437
Robust standard errors in parentheses *** 𝑝<0.01, ** 𝑝<0.05, * 𝑝<0.1

Table 5: Cross-country models of natural resouce abundance and violent conflict
Avg
cas
ualti
es
(8)
28,1
96.2
5
(-114
,593
.99)
-39,
227.
09
(-213
,397
.63)
116
0.16
3
-9,0
49.0
4
-11,
996.
98
2,04
8.20
-2,4
79.0
8
95
0.19
2
-9,0
67.9
7
-12,
947.
07
2,54
9.84
-3,2
31.7
8
95
0.19
1
Stan
dard
err
ors i
n pa
rent
hese
s. D
epen
dent
var
iabl
es: (
a) w
ar o
ccur
renc
e 19
60-1
999
(Sar
kees
200
0) (b
) war
occ
urre
nce
1960
-199
9 (C
ollie
r and
H
oeff
ler 2
004)
(c):
num
ber o
f war
s 196
0-19
99 (S
arke
es 2
000)
(d) n
umbe
r of w
ars 1
960-
1999
(Col
lier a
nd H
oeff
ler 2
004)
(e) t
otal
nu m
ber o
f day
s at
war
196
0-19
99 (f
) ave
rage
num
ber o
f day
s per
war
(g) t
otal
num
ber o
f war
cas
ualti
es 1
960-
1999
(h) a
vera
ge n
umbe
r cas
ualti
es p
er w
ar.
Con
trol
s for
mal
e se
cond
ary
scho
olin
g, G
DP
grow
th, m
ount
aino
us te
rrai
n, g
eogr
aphi
c di
sper
sion,
ln p
opul
atio
n, so
cial
, eth
nic
and
relig
ious
fr
actio
naliz
atio
n, p
olar
izat
ion,
eth
nic
dom
inan
ce a
nd d
emoc
racy
are
incl
uded
. ***
𝑝<
0.01
, ** 𝑝<
0.05
, * 𝑝
<0.
1
Cas
ualti
es
(7)
51,4
85.5
3
(-232
,463
.31)
9,31
8.43
(-430
,963
.01)
109
0.16
4
-11,
738.
55
-30,
118.
58
3,15
7.34
-6,1
66.2
8
91
0.21
4
-16,
746.
48
-32,
892.
87
4,95
7.05
-8,1
04.7
5
91
0.21
5
Avg
dur
atio
n (6
)
1,12
7.13
(-3,3
88.2
4)
-4,5
70.2
2
(-6,3
10.2
0)
115
0.18
8
-903
.377
4**
-417
.109
157.
4169
*
-86.
316
94
0.22
-676
.615
-458
.52
148.
746
-114
.69
94
0.19
4
War
dur
atio
n (5
)
3,50
6.67
(-5,9
89.3
3)
-8,7
42.2
0
(-11,
104.
34)
108
0.19
8
-1,3
21.4
112*
-774
.327
227.
4073
-158
.742
90
0.23
2
-969
.628
-858
.124
211.
6285
-211
.864
90
0.21
5
# W
ars
(4)
4.42
97**
(-2.1
033)
-8.7
516*
*
(-3.8
978)
118
0.28
2
0.18
66
-0.2
63
-0.0
29
-0.0
54
97
0.27
9
0.42
-0.2
81
-0.0
87
-0.0
7
97
0.29
4
# W
ars
(3)
4.37
89*
(-2.5
089)
-8.7
144*
(-4.6
496)
118
0.25
8
0.03
44
-0.3
1
-0.0
04
-0.0
64
97
0.26
3
0.27
16
-0.3
34
-0.0
56
-0.0
83
97
0.26
9
War
dum
my
(2)
9.50
83
(-7.5
884)
-23.
7569
(-16.
1745
)
118
-1.1
09
-1.2
47
0.14
94
-0.3
32
97
0.78
85
-1.9
35
-0.4
19
-0.9
95
97
War
dum
my
(1)
8.43
55
(-7.4
263)
-21.
551
(-15.
6865
)
118
-0.6
21
-1.2
61
0.05
36
-0.3
69
97
1.57
-1.9
51
-0.7
38
-1.0
15
97
DE
PEN
DE
NT:
PA
NE
L A
Nat
ural
reso
urce
ex
port
s / G
DP
Nat
ural
reso
urce
ex
port
s /G
DP²
Obs
erva
tions
R-s
quar
ed
PAN
EL
B
Nat
ural
capi
tal
Nat
ural
cap
ital²
Obs
erva
tions
R-s
quar
ed
PAN
EL
C
Subs
oil c
apita
l
Subs
oil c
apita
l²
Obs
erva
tions
R-s
quar
ed
Let us now return to the relationship between natural resource abundance and civil war. It was
observed earlier that this is conceptually a cross-sectional question. Furthermore, since natural
capital and subsoil capital are time-invariant, as are many of the control variables, the time
dimension seems to add little to the new analysis. Therefore, I convert the data into cross-sectional
data. As a rule, this involves taking the average of the available data for each variable, by country.
The only exceptions are social and religious fractionalization: since these variables only change at
one point in time, the 1960 value is used, analogous to ethnic fractionalization. The dummy for the
post-Cold War period and the peace duration variable (days since the last war) are dropped. Lastly,
income inequality was dropped, allowing more countries in the sample. Including it would lead to a
radical loss of observations, while not changing the coefficients of interest meaningfully.
An advantage of the cross-section analysis is that I can construct multiple dependent
variables. This allows me to investigate the effect of natural resource abundance on various
indicators for civil war. One possible dependent variable is a dummy indicating whether a war
started in a given country at any time between 1960 and 1999. Alternatively, the number of wars
occurring in the same period could be used. I construct both variables twice, once using the list
ofwars printed in Collier and Hoeffler’s article and once using an updated version of the Singer and
Small dataset they use (Sarkees 2000). The variables differ considerably, both because the set-up of
the dataset has been changed (see Sarkees 2000 for details) and because Collier and Hoeffler seem
to have made additions to the original dataset (Elbadawi and Sambanis 2002). Using the updated
Singer and Small dataset, I can also obtain the number of days a country was at war between 1960-
1999, the average number of days per war, the total number of casualties and the average number
of casualties per war. As most of these dependent variables are no longer dichotomous I use linear
regression instead of logit regression, except in the case of both dummy variables corresponding to
war starts.
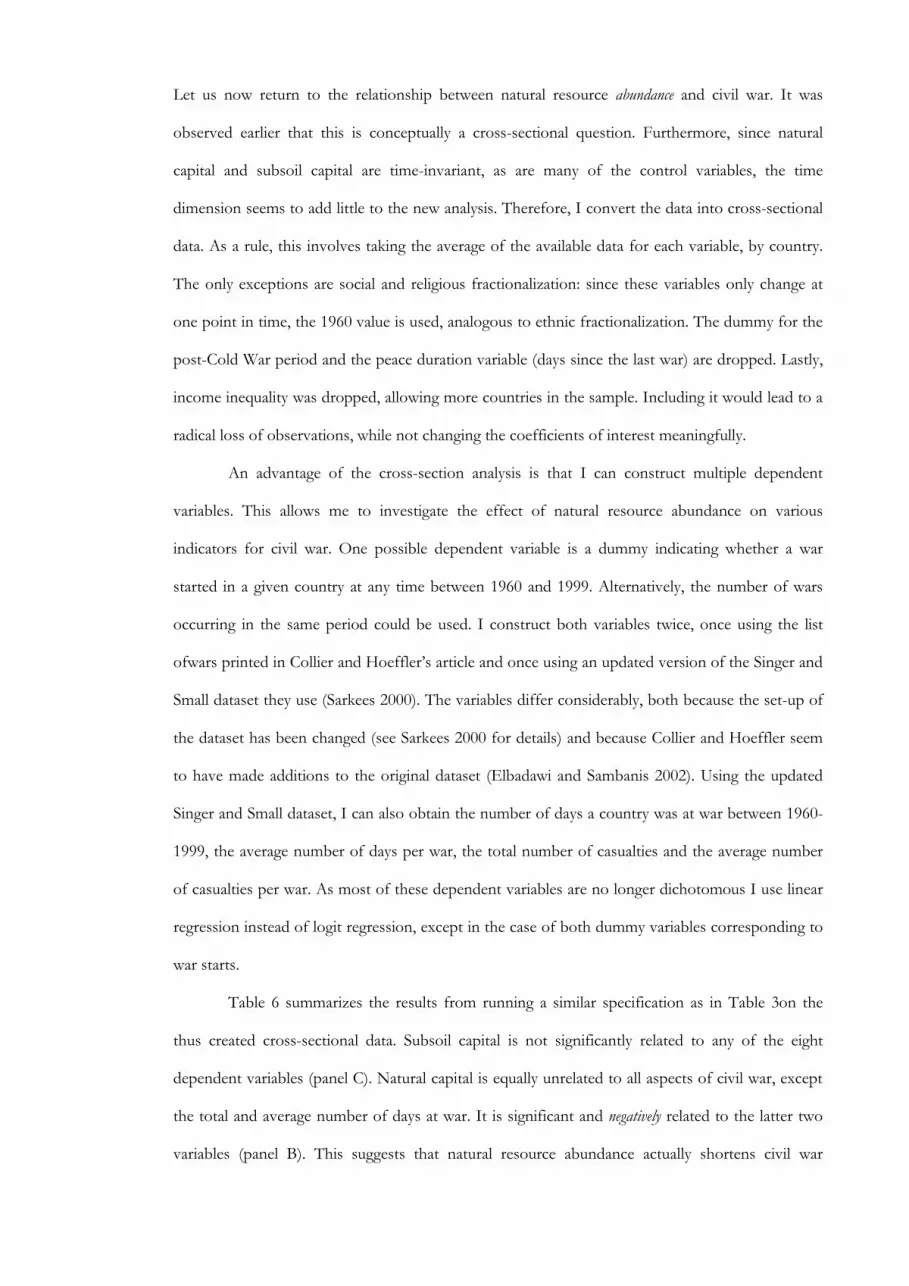
Table 6 summarizes the results from running a similar specification as in Table 3on the
thus created cross-sectional data. Subsoil capital is not significantly related to any of the eight
dependent variables (panel C). Natural capital is equally unrelated to all aspects of civil war, except
the total and average number of days at war. It is significant and negatively related to the latter two
variables (panel B). This suggests that natural resource abundance actually shortens civil war

duration, a result that has been obtained before by Humphreys (2005). He argues that natural
resource abundance can facilitate military victory if the benefits accrue to the strongest party to a
conflict. However, the same pattern cannot be found using subsoil capital, so this result is not
robust. The coefficients on both squared terms are consistently insignificant, providing little
evidence that a quadratic relationship exists. The strong relationship between natural resources as a
percentage of GDP and civil war only partly survives the conversion to cross-section: it is only
significant (at the ten per cent level) using the number of wars as a dependent variable (panel A).
This exercise shows that within this cross-section dataset, no positive significant
relationship can be found between natural and subsoil capital and any aspect of civil war.
Addressing endogeneity causes the conclusions found by Collier and Hoeffler(2004) to change
quite dramatically. However, Collier and Hoeffler have published a second version of their analysis
in 2009 together with Dominique Rohner, one they state is an improvement over their 2004 one.
Therefore, it is interesting to see if using natural and subsoil capital in this new analysis has a similar
impact.
Table 7 presents the results using this new specification. Column (1) replicates the result
obtained by Collier, Hoeffler and Rohner (again the only difference being the use of robust
standard errors). Description of the control variables and data sources reproduced from Collier,
Hoeffler and Rohner (2009) can be found in Appendix B.Natural resource exports as a percentage
of GDP and its square are significantly related to conflict, though at a considerably lower level than
in the previous analysis (10 per cent).
Column (2) and (3) show the same models, replacing the original measure of natural
resource abundance. Results are very similar to those obtained for the Collier and Hoeffler (2004)
study. Again, replacing the original proxies for natural resource abundance with natural and subsoil
capital causes the relationship observed by Collier, Hoeffler and Rohner (2009) to disappear: it
results in insignificant coefficients that are small in size. The only difference is that subsoil capital
squared is significant at 10 per cent level, but with subsoil capital itself being insignificant, this result
seems hard to interpret

Table 6: Replacing natural resource abundance in Collier, Hoeffler and Rohner (2009)
(1) (2) (3) (4) (5) (6) (7) CIVIL WAR ONSET logit logit logit logit probit ivprobit ivprobit Natural resource 7.1495* 4.7999 -0.1011 -1.1046 -4.0282* /exports / GDP (3.9831) (5.0865) -0.54 -2.426 -2.165 Natural resource -14.5810* -9.4272 Exports / GDP² (7.7718) (11.6577) Natural capital 0.4188 (0.951) Natural capital² -0.2957 (0.278) Subsoil capital 1.3613 (1.085) Subsoil capital² -0.7700* (0.465) ln GDP -0.2323* -0.3445* -0.4437** -0.3607** -0.1399** -0.1804** -0.1572** (0.1206) (0.1924) (0.1801) (0.1462) -0.056 -0.073 -0.07 GDP growth -0.1477*** -0.0969* -0.0915* -0.1205*** -0.0816*** -0.0676*** -0.0594*** (0.0346) (0.0558) (0.0535) (0.0442) -0.017 -0.022 -0.022 Post cold war -0.1349 -0.2139 -0.2096 -0.0342 -0.1054 -0.0215 -0.0738 dummy (0.3710) (0.4364) (0.4273) (0.4459) -0.196 -0.233 -0.214 Previous -0.0818 0.0355 0.0666 -0.1376 0.0694 -0.045 -0.0181 war dummy (0.4879) (0.5125) (0.5103) (0.5671) -0.221 -0.249 -0.228 Years since -0.0579*** -0.0441*** -0.0420** -0.0540*** -0.0268*** -0.0263*** -0.0227*** previous war (0.0154) (0.0165) (0.0168) (0.0176) -0.007 -0.008 -0.008 Former French -1.2032** -0.7685 -0.7162 -0.8593 -0.6285** -0.4758 -0.4383 African colony (0.6046) (0.6246) (0.6326) (0.6898) -0.306 -0.333 -0.309 Social 2.1734*** 1.9105** 1.7676* 1.8951** 1.1782*** 1.1034** 1.3450*** fractionalization (0.7820) (0.9291) (0.9351) (0.9662) -0.397 -0.558 -0.454 Proportion of 12.4933 18.2281** 18.4066** 18.1814** 5.1783 9.8109** 11.3898*** young men (7.9723) (8.2574) (8.2181) (8.4871) -3.486 -4.578 -3.863 Population 0.2764*** 0.1810** 0.1566** 0.2097** 0.1278*** 0.0676 -0.011 (0.0856) (0.0743) (0.0765) (0.1063) -0.039 -0.074 -0.075 Mountanous 0.0110 0.0188*** 0.0185** 0.0190** 0.0046 0.0073 0.0035 terrain (0.0074) (0.0072) (0.0075) (0.0082) -0.004 -0.005 -0.005 Democracy 0.0123 0.0888 0.0976* 0.0800 0.0057 0.0255 0.0063 (0.0452) (0.0567) (0.0582) (0.0586) -0.022 -0.031 -0.029 Instrument Subsoil
capital Natural capital
Observations 1063 863 863 828 1063 828 828
Robust standard errors in parentheses. *** 𝑝<0.01, ** 𝑝<0.05, * 𝑝<0.1

In this analysis, considerably more observations are lost when replacing natural resource
production as a percentage of GDP with natural and subsoil capital. Running the original analysis
on exactly the same reduced sample is not possible in this case, as the original variable is not
available for 35 observations that do have values for natural and subsoil capital. The results
obtained by also omitting these 35 observations are presented in column (4). The fact that natural
resource production as a percentage of GDP and its square enter this regression insignificantly
indicates that we cannot exclude the possibility that (part of) the loss of significance is due to
changes in sample composition. As noted before, results from cross-country studies have been
shown to be fragile to relatively minor changes in specification.
Column (5) reinforces this impression: the coefficient on natural resource exports as a
percentage of GDP loses significance and decreases in size when omitting the quadratic term and
switching to a probit model. This is due to the former change: a probit model including the
quadratic term gives results qualitatively similar to those in column (1). Columns (6) and (7) show
the results obtained when instrumenting for natural resource exports using natural and subsoil
capital. As before, this decreases the size of the coefficients of interest considerably. Natural
resource exports as instrumented by natural capital even enters the regression negative and
significant, at the ten per cent level, see column (7).
As with the Collier and Hoeffler 2004 analysis, I subsequently converted the data into a
cross-sectional model. The results mirror the ones obtained before. No evidence consistent with a
positive relationship between natural or subsoil capital and war can be found in a cross-section
analysis.
In conclusion: the relationship between natural resource abundance and conflict observed by the
two articles under study is driven to a large extent by endogeneity. Replacing the potentially
endogenous proxy for natural resource abundance with two arguably more exogenous measures, or
using the latter as instruments for the former, changes the conclusion of the analysis radically. The
relationship between natural resource abundance and conflict onset disappears.

Investigating mechanisms
The section on literature has identified four potential theoretical mechanisms through which natural
resources can lead to violent conflict: returns to conflict (either the returns to holding territory or
the ‘prize’ of obtaining government), opportunity cost of conflict, quality of government and
relieving a credit constraint. Using the same data as in the previous section, I will now investigate
which of these mechanisms is supported, while addressing concerns regarding endogeneity.
The opportunity cost of conflict versus the returns to conflict mechanism
The analysis in the previous section occasionally provides some support for the opportunity cost
mechanism, but no support for the returns to conflict mechanism. Note that natural capital
includes agricultural resources that could be characterized as labour-intensive, as it includes rents
derived from cropland and pastureland. Subsoil capital, including fossil fuels and minerals, includes
natural resources commonly considered capital-intensive. Subsoil capital is not significantly related
to civil war onset in any of the regressions presented in the previous section. When using natural
capital, we observe a significant negative relationship between natural resources and violent conflict
in some cases. Natural capital appears to be negatively related to war duration (Table 6, columns (5)
and (6)) and instrumenting for natural resource exports using natural capital results in a negative
relationship between natural resources and war onset (Table 5, column (6), Table 7, column (7)).
The relationship between natural capital and civil war is not significant in any other regressions.
However, natural capital is an aggregation of subsoil capital and various types of natural
resources that could be considered labour-intensive. This could weaken the results. To investigate
this, I subtract subsoil capital from natural capital, so that the resulting measure only includes rents
derived from cropland, pastureland, forests and protected areas. I call this measure agricultural
capital. I enter this variable in the models by Collier and Hoeffler (2004), Collier, Hoeffler and
Rohner (2009) and in the cross-sectional models presented in the previous section. The quadratic
term is dropped, because there is no theoretical reason to believe that the relationship between
agricultural capital and civil war is U-shaped. All models include the same set of control variables as
before.

Table 8 presents the coefficients on agricultural capital in the various models. In all four
models of war occurrence, agricultural capital is negatively related to civil war onset. All coefficients
are significant at the five per cent level. Countries abundant in agricultural capital appear to be
significantly less likely to enter into a civil war. Agricultural capital appears to be unrelated to the
number of wars, war duration or war intensity in the cross-section models however. The previously
observed negative relationship between natural capital and war duration is not replicated for
agricultural capital.
The results presented in Table 8 thus present evidence in favour of the opportunity cost
mechanism in the case of civil war onset, in line with most of the existing literature.
Quality of government mechanism
The model by Besley and Persson (2008) suggests that when institutions are of high-quality (i.e. if
they do not allow preferential distribution of proceeds from natural resources to the ruler’s own
group), the presence of natural resources need not increase war risk. I investigate this in the cross-
section. In this model, I include an interaction term between subsoil capital and institutional quality.
Subsoil, rather than natural capital is included because proceeds from subsoil capital are most likely
to accrue to the national government. Four measures of institutional quality are used: average
protection against expropriation (Acemoglu, Johnson, and Robinson 2001), the legal structure and
security of property rights (Fraser Institute 2008), government effectiveness (Kaufmann, Kraay, and
Table 7: Opportunity cost of conflict mechanism
Model Coefficient on agricultural capital
Robust standard error agricultural capital
Collier and Hoeffler (2004) -0.4138** (1.7934) Collier, Hoeffler and Rohner (2009) -2.3161** (1.0788) Cross-section: War occurrence (Sarkees 2000) -5.7410** (2.556) War occurrence (Collier and Hoeffler 2004) -6.3396** (2.642) Number of wars (Sarkees 2000) -0.1438 (0.234) Number of wars (Collier and Hoeffler 2004) -0.1074 (0.199) War duration -553.8688 (569.925) Average war duration -353.1364 (321.901) Total war casualties 3,390.9326 (21,902.872) Average war casualties per war -870.0355 (9,090.698)
*** 𝑝<0.01, ** 𝑝<0.05, * 𝑝<0.1

Mastruzzi 2008) and overall institutional quality (Mehlum, Moene, and Torvik 2006), henceforth
called MMT IQ. All measures score institutional quality on some scale, with a higher value
indicating better institutions. When appropriate, I compute the average of the available scores over
the relevant period (1960-2000). Since institutions can be assumed to be endogenous to civil war, I
instrument for institutional quality and for the interaction between institutional quality and subsoil
capital using the inverse of the colonial settler mortality rate (Acemoglu, Johnson, and Robinson
2001) and the interaction between the inverse of the settler mortality rate and subsoil capital.
Because this instrument is only available for a subsample of ex-colonies, a considerable number of
observations are lost. The dependent variable is the number of wars over the period according to
Sarkees (2000).
Table 9 shows the results. The signs of the coefficients are consistent with the quality of
government mechanism as modelled by Besley and Persson (2008), but results are rarely significant.
The coefficients on the subsoil capital are consistently positive, which is expected if natural
resources increase the number of civil wars in countries with poor institutional quality. The
interaction term enters all regressions with a negative sign, which is again expected if natural
resources do not increase the number of civil wars in countries with good institutions. With the
exception of column (2), the signs of the coefficients on institutional quality are negative, consistent
with the idea that countries with good institutions experience civil war less often. However, given
Table 8: Quality of government mechanism
NUMBER OF (1) (2) (3) (4) CIVIL WARS Subsoil capital 0.0952 0.0134 0.199 0.107 (0.0715) (0.102) (0.300) (0.110) IQ MMT -1.310 (2.641) Government 1.383 effectiveness (4.351) Property rights -2.571 (4.682) Average protection -0.131 against expropriation (0.288) Interaction -0.179* -0.0539 -0.0539 -0.0179 (0.106) (0.0942) (0.0525) (0.0145) Observations 52 55 51 55
Robust standard errors in parentheses. *** 𝑝<0.01, ** 𝑝<0.05, * 𝑝<0.1

that only the interaction term in column (1) enters the regression significantly, this cannot be
considered strong evidence in favour of the quality of government mechanism.
In conclusion, the results in this section are in line with the current state of research on which
mechanisms connects natural resources and violence. It provides evidence in favour of the
opportunity cost mechanism and no evidence in favour of the returns to conflict mechanism.
Results on the quality of government mechanism are extremely weak.
Conclusion and Policy Implications
This article has investigated empirically to what extent conclusions from cross-country studies
investigating the relationship between natural resources and violent civil conflict are driven by
endogeneity, by replicating two such studies (Collier and Hoeffler 2004; Collier, Hoeffler, and
Rohner 2009) and replacing, or instrumenting for, the original proxy for natural resource
abundance by two plausibly more exogenous measures. The article shows that results are not robust
to any of the proposed ways to address concerns regarding endogeneity. The article then reviewed
empirical support for various theoretical mechanisms potentially connecting natural resources and
conflict. Overall, the article finds that there is little evidence for the returns to conflict mechanism,
but substantial evidence for the opportunity cost of conflict mechanism. Further study is needed
with regard to the quality of government mechanisms.
With regard to the quality of government mechanisms, a promising future avenue for
research would be to investigate the relationship between political repression, or otherwise
unproductive government policies that could arise from revenue flows from natural resources to
the government, and violent conflict. To do so, it appears necessary to find more disaggregated
indicators of repression or government policy, as catch-all indicators such as polity score or military
spending have been investigated reasonably extensively already, without clear-cut results.
What are the implications of these conclusions for research and policy? In the case of research,
results presented shows that endogeneity is a very real concern if one wants to establish what
effectnatural resource abundance has on civil war risk. However, endogeneity is not always
addressed. Hegre and Sambanis (2006) for example state: “Since very few of the papers in the

literature on civil war deal with the issue ofendogeneity, we also ignore it […]”. This article shows
that, in order to draw sensible conclusions on the causes of civil war, possible endogeneity has to be
taken into account, as not doing so could lead to a spurious correlation between natural resource
abundance and civil war onset. Since this type of research has drawn a great deal of attention from
policy makers and a number of policy initiatives is based on the proposition that natural resource
abundance is related to war risk, this seems especially undesirable.
In the case of policy, consider two well-known policies intending to break the link between natural
resources and conflict: a ban on the export of natural resources from conflict zones and initiatives
to improve the transparency of revenue flows associated with resources. The rationale for these
policies appears to be the returns to conflict mechanisms and the quality of government mechanism
respectively. Neither mechanism has received strong empirical support. Interestingly, the
mechanism that has received the strongest empirical support in the wider literature, does not appear
to have been directly translated into policy.
Trade bans can take the form of a blanket ban on the export of a particular natural
resource (commonly oil) or a selective ban on the trade in illegally obtained resources that may
finance conflict. An example of the latter is the Kimberley Process Certification Scheme (KPCS),
which forbids signatory countries to import or export diamonds that do not carry a certificate
stating they were legally mined. Proponents of trade bans often appear to have some variation of
the returns to conflict mechanism in mind. The reasoning seems to be that if we take trade in
illegally obtained resources away, this would decrease the incentive to fight over territory and/or
insurgents would lack the capital to continue violence. However, neither the returns to conflict, nor
the credit constrains mechanism have received much empirical support. Trade bans do not
necessarily decrease the incentive for violence if we think obtaining government is the ‘prize’ of
conflict, especially if selective trade bans consider all government-traded resources legal (for
example, in the KPCS, it is the government that issues the certificates of ‘clean health’ for
diamonds). Furthermore, blanket bans are often lifted after one party has obtained some decisive
victory and forms a recognized government, so this may still be a high-return goal to strive for.
Whether the opportunity cost mechanism predicts a trade ban to be effective depends on
whether the ban hits a capital or a labour intensive resource. In the former case, it gives cause for

high hopes, but in the latter, the opportunity cost mechanism would suggest that a trade ban can
have the adverse effect of decreasing wages and thereby increasing violence.
A second policy attempts to improve the transparency of revenue flows, with the intention
of inciting governments to use proceeds from natural resources for socially beneficial goals such as
education. An example of this is the Extractive Industries Transparency Initiative (EITI). This
policy appears to be inspired by the quality of government and/or the government as ‘prize’
mechanism, attempting to either directly improve governance or to prevent natural resource
proceeds to be distributed as rents. However, there is no strong empirical evidence in favour of
either mechanism.
In sum, it can be argued that policies exist based on some variation of all but one
mechanism connecting natural resources and violent conflict. Interestingly, the possible exception
is the opportunity cost mechanism, the mechanism garnering most empirical support. What policies
would this mechanism suggest? One suggestion that comes to mind is to directly support the wage
rate, by labour-intensive (reconstruction) spending. In theory, this could decrease the probability of
conflict and thereby benefit society as a whole, even if the labour hired through such a scheme is
completely unproductive (Dal Bó and Dal Bó 2004). In practice, labour-intensive reconstruction
spending by the US military has proven to be successful in decreasing violence in Iraq (Iyengar,
Monten, and Hanson 2011), suggesting it may be an effective short-term policy. Despite initial
success, the execution of such a policy seems key: if these schemes would become another source
of rents to be distributed by the government they could even have adverse effects.

References Acemoglu, Daron, Simon Johnson, and James A. Robinson. 2001. The colonial origins of
comparative development: An empirical investigation. American Economic Review 91 (5):1369-
1401.
Angrist, Joshua D. , and Adriana D. Kugler. 2008. Rural windfall or a new resource curse? Coca,
income, and civil conflict in Colombia. The Review of Economics and Statistics 90 (2):191-215.
Barrett, David B., George T. Kurian, and Todd M. Johnson. 1982. World christian encyclopedia.
Nairobi: Oxford University Press.
Barro, Robert J. . 1997. Determinants of Economic Growth. Cambridge M.A.: MIT Press.
Bazzi, Samuel, and Christopher Blattman. 2011. Economic Shocks and Conflict. The (Absence of?)
Evidence from Commodity Prices. UCSD, Yale University.
Besley, Timothy, and Torsten Persson. 2008. The incidence of civil war: theory and evidence.
NBER Working Paper No. 14585.
Besley, Timothy, and Torsten Persson. 2010. State capacity, conflict and development. Econometrica
78 (7):1-34.
Blattman, Christopher, and Edward Miguel. 2009. Civil war. NBER Working Paper Series #14801.
Brückner, Markus, and Antonio Ciccone. 2010. International community prices, growth and the
outbreak of civil war in Sub-Saharan Africa. The Economic Journal 120:519-534.
Brückner, Markus, Antonio Ciccone, and Andrea Tesei. 2012. Oil Price Shocks, Income, and
Democracy. The Review of Economics and Statistics 94 (2):389-399.
Brunnschweiler, Christa. 2008. Cursing the blessings? Natural resource abundance, institutions and
economic growth. World Development 36 (3):399-419.
Brunnschweiler, Christa, and Erwin H. Bulte. 2009. Natural resources and violent conflict.
Resource abundance, dependence and the onset of civil wars. Oxford Economic Papers
61:651-674.
Caselli, Francesco, and Andrea Tesei. 2011. Resource windfalls, political regimes, and political
stability. In NBER Working paper series. Cambridge MA: National Bureau of Economic
Research.

Chichilnisky, Graciela. 1993. North-South trade and the dynamics of renewable resources. Structural
Change and Economic Dynamics 4 (2):219-248.
Collier, Paul. 2008. The bottom billion. Oxford: Oxford University Press.
Collier, Paul, and Anke Hoeffler. 2004. Greed and grievance in civil war. Oxford Economic Papers
56:563-595.
Collier, Paul, Anke Hoeffler, and Dominic Rohner. 2009. Beyond greed and grievance: Feasibility
and civil war. Oxford Economic Papers 61:1-27.
Collier, Paul, Anke Hoeffler, and Måns Söderbom. 2004. On the duration of civil war. Journal of
Peace Research 41 (3):253-273.
Cotet, Anca M. , and Kevin K. Tsui. 2010. Oil and Conflict. What Does the Cross-Country
Evidence Really Show? American Economic Journal: Macroeconomics 5 (1):49-80.
Dal Bó, Ernesto, and Pedro Dal Bó. 2004. Workers, warriors and criminals. Social conflict in
general equilibrium. Journal of the European Economic Association 6 (4):646-677.
De Soysa, Indra, and Eric Neumayer. 2007. Recourse wealth and civil war onset. Results from a
new dataset of natural resource rents 1970-1999. Conflict Management and Peace Science 24:201-
218.
Deininger, Klaus, and Lyn Squire. 1996. A new data set measuring income inequality. The World
Bank Economic Review 10 (3):565-591.
Elbadawi, Ibrahim, and Nicholas Sambanis. 2002. How much war will we see? Explaining the
prevalence of civil war. Journal of Conflict Resolution 46 (3):307-334.
Fearon, James. 2005. Primary commodities exports and civil war. Journal of Conflict Resolution 49
(4):483-507.
Fearon, James, and David Laitin. 2003. Ethnicity, insurgency and civil war. American Political Science
Review 97 (1):75-90.
Fraser Institute. 2008. Economic Freedom of the World. Annual Report. Vancouver: Fraser Institute.
Garfinkel, Michelle, Stergios Skaperdas, and Constantinos Syropoulos. 2008. Globalization and
domestic conflict. Journal of International Economics 76:269-308.
Gerrard, John. 2000. What is a mountain. Washington D.C.: World Bank.

Gleditsch, Kristian. 2004. A revised list of wars between and within independent states, 1816-2002.
International Interactions 30:231-262.
Gleditsch, Nils Petter, Peter Wallensteen, Mikael Eriksson, Margareta Sollenberg, and Håvard
Strand. 2002. Armed Conflict 1946-2001: A New Dataset. Journal of Peace Research 39
(5):615-637.
Hegre, Håvard, and Nicholas Sambanis. 2006. Sensitivity analysis of emperical results on civil war
onset. Journal of Conflict Resolution 50 (4):508-535.
Helmstaedt, H.H., and J.J. Gurney. 1995. Geotectonic controls of primary diamond deposits:
implications for area selection Journal of Geochemical Exploration 53 (1-3):125-144.
Humphreys, Macartan. 2005. Natural resources, conflict and conflict reslution. Uncovering the
mechanisms. Journal of Conflict Resolution 49 (4):508-537.
Iyengar, Radha, Jonathan Monten, and Matthew Hanson. 2011. Building Peace: The impact of aid
on the labor market for insurgents. NBER Working Paper Series No. 17297.
Jaggers, Keith, and Ted Robert Gurr. 1995. Tracking democracy's third wave with the Polity III
data. Journal of Peace Research 32 (4):469-482.
Kaufmann, Daniel, Aart Kraay, and Massimo Mastruzzi. 2008. Governance matters VII:
Governance indicators for 1996-2007. Dataset. World Bank Policy Research June 2008.
Lujala, Päivi, Nils Petter Gleditsch, and Elizabeth Gilmore. 2005. A diamond curse? Civil war and a
lootable resource. Journal of Conflict Resolution 49 (4):538-562.
Mauro, Paolo. 1995. Corruption and growth. The Quarterly Journal of Economics 110 (3):681-712.
McArthur, John W., and Jeffrey D. Sachs. 2001. Institutions and Geography: Comment on
Acemoglu, Johnson and Robinson. NBER Working Paper Series # 8114.
Mehlum, Halvor, Karl Moene, and Ragnar Torvik. 2006. Institutions and resource curse. The
Economic Journal 116:1-20.
Robinson, James A., Ragnar Torvik, and Thierry Verdier. 2006. Political foundations of the
resource curse. Journal of Development Economics 79 (2):447-468.
Rodrik, Dani, Arvind Subramanian, and Francesco Trebbi. 2004. Institutions Rule: The Primacy of
Institutions over Geography and Integration in Economic Development. Journal of Economic
Growth 9:131-165.

Ross, Michael. 2004. What do we know about natural resources and civil war. Journal of Peace Research
41 (3):337-356.
Ross, Michael. 2006. A closer look at oil, diamond and civil war. Annual Review of Political Science
9:265-300.
Sachs, Jeffrey D., and Andrew M. Warner. 2001. The curse of natural resources. European Economic
Review 45:827-838.
Sambanis, Nicholas. 2004. What is civil war? Conceptual and empirical complexities of an
operational definition. Journal of Conflict Resolution 48 (6):814-858.
Singer, J. David, and Melvin Small. 1994. Correlates of war project: international and civil war data,
1816-1992. Inter-University Consortium for Political and Social Research.
Small, Melvin, and J. David Singer. 1982. Resort to arms: International and civil wars, 1816-1980. Beverly
Hills: Sage Publications.
Summers, Robert, and Alan Heston. 1991. The Penn World Table (Mark 5): An Expanded Set of
International Comparisons, 1950-1987. The Quarterly Journal of Economics 106 (2):327-368.
USSR. 1964. Atlas Narodov Mira. Moscow: Department of Geodesy and Cartography of the State
Geological Committee of the USSR.
World Bank. 1997. Expanding the measure of wealth. Indicators of environmentally sustainable
development. In Environmentally sustainable development studies and monograph series no. 17.
Washington DC: The International Bank for Reconstruction and Development.
World Bank. 2006. Where is de wealth of nations? Measuring capital for the 21st century.
Washington DC: The International Bank for Reconstruction and Development.
World Bank. 2006. World Development Indicators. Washington D.C.: World Bank.
World Bank. 2011. The Changing Wealth of Nations. Measuring Sustainable Development in the New
Millennium. Washington D.C.: The International Bank for Reconstruction and
Development.

Appendix A
Source: (Collier and Hoeffler 2004)
Democracy: The degree of openness of democratic institutions is measured on a scale of zero (low) to
ten (high). Source: http://www.cidm.umd.edu/polity/index.html. The data are described in
(Jaggers and Gurr 1995).
Diaspora: We used the data on foreign born population from the US Bureau of the Census and
divided these numbers by the total population in the country of origin.
http://www.census.gov/population
Ethnic dominance: Using the ethno-linguistic data from the original data source (USSR 1964) we
calculated an indicator of ethnic dominance. This variable takes the value of one if one single
ethno-linguistic group makes up 45 to 90% of the total population and zero otherwise. We would
like to thank TomilaLankina for the translation of the original data source.
Forest coverage: We used the FAO measure of the proportion of a country’s terrain which is covered
in woods and forest. Source: http://www.fao.org/forestry
GDP per capita: We measure income as real PPP adjusted GDP per capita. The primary data set is the
Penn World Tables 5.6 (Summers and Heston 1991). Since the data are only available from 1960-92
we used the growth rates of real PPP adjusted GDP per capita data from the World Bank’s World
Development Indicators 1998 in order to obtain income data for the 1990s. These GDP per capita
data were used to calculate the average annual growth rate over the previous five years.
Geographic dispersion of the population: We constructed a dispersion index of the population on a
country by country basis. Based on population data for 400 km2 cells we generated a Gini
coefficient of population dispersion for each country. A value of 0 indicates that the population is
evenly distributed across the country and a value of 1 indicates that the total population is
concentrated in one area. Data is available for 1990 and 1995. For years prior to 1990 we used the
1990 data. We would like to thank Uwe Deichman of the World Bank’s Geographic Information
System Unit for generating this data. He used the following data sources: Center for International

Earth Science Information Network (CIESIN), Columbia University; International Food Policy
Research Institute (IFPRI); and World Resources Institute (WRI). 2000. Gridded Population of the
World (GDP), Version 2. Palisades, NY: IESIN, Columbia University. Available at
http://sedac.ciesin.org/plue/gpw.
Inequality: Inequality was either measured as income inequality (Deininger and Squire 1996) or as
inequality in land ownership (source: Deininger and Squire, unpublished). Both inequality measured
are provided as a Gini coefficient.
Male secondary school enrolment rates: We measure male secondary school enrolment rates as gross
enrolment ratios, i.e. the ratio of total enrolment, regardless of age, to the population of the age
group that officially corresponds to the level of education shown. Secondary education completes
the provision of basic education that began at the primary level, and aims at laying the foundations
for lifelong learning and human development, by offering more subject- or skill-oriented instruction
using more specialized teachers. Source: World Bank Development Indicators, 1998.
Mountainous terrain: The proportion of a country’s terrain which is mountainous was measured by
John Gerrard, a physical geographer specialized in mountainous terrain. His measure is based not
just on altitude but takes into account plateaus and rugged uplands. The data are presented in
(Gerrard 2000).
Peace duration: This variable measures the length of the peace period (in months) since the end of the
previous civil war. For countries which never experienced a civil war we measure the peace period
since the end of World War II.
Population: Population measures the total population. The data source is the World Bank’s World
Development Indicators 1998.
Primary commodity exports/GDP: The ratio of primary commodity exports to GDP proxies the
abundance of natural resources. The data on primary commodity exports and GDP were obtained
from the World Bank. Export and GDP data are measured in current US dollars.

Social, ethnolinguistic, and religious fractionalization: We proxy social fractionalization in a combined
measure of ethnic and religious fractionalization. Ethnic fractionalization is measured by the ethno-
linguistic fractionalization index. It measures the probability that two randomly drawn individuals
from a given country do not speak the same language. Data are only available for 1960. In the
economics literature this measure was first used by (Mauro 1995). Using data from (Barrett, Kurian,
and Johnson 1982) on religious affiliations we constructed an analogous religious fractionalization
index. Following (Barro 1997) we aggregated the various religious affiliations into nine categories:
Catholic, Protestant, Muslim, Jew, Hindu, Buddhist, Eastern Religions (other than Buddhist),
Indigenous Religions, and no religious affiliation.
The fractionalization indices range from zero to 100. A value of zero indicates that the
society is completely homogenous whereas a value of 100 would characterize a completely
heterogeneous society.
We calculated our social fractionalization index as the product of the ethno-linguistic
fractionalization and the religious fractionalization index plus the ethno-linguistic or the religious
fractionalization index, whichever is the greater. By adding either index we avoid classifying a
country as homogenous (a value of zero) if the country is ethnically homogenous but religiously
divers, or vice versa.
War data: A civil war is defined as an internal conflict in which at least 1,000 battle realted deaths
(civilian and military) occurred per year. We use mainly the data collected by (Small and Singer
1982) and according to their definitions (Singer and Small 1994) we updated their data set for 1992-
99.

Appendix B
Source: (Collier, Hoeffler, and Rohner 2009)
Democracy: We measure democracy with the democracy indicator from the Polity IV data set. It
ranges from 0 (autocratic) to 10 (fully democratic). Data source:
http://www.cidcm.umd.edu/inscr/polity/
Economic growth: Using World Bank World Development Indicators (WDI) data for GDP per
capitawe calculated the annual growth rates(World Bank 2006).
Former French African colony: This dummy takes a value of one for the following countries: Benin,
Burkina Faso, Cameroon, Central African Republic, Chad, Congo, Rep., Cote d’Ivoire, Djibouti,
Gabon, Guinea, Madagascar, Mali, Mauritania, Niger, Senegal, Togo. This variable is zero for all
countries for the last period 2000–04.
GDP per capita: We measure GDP per capita annually. Data are measured in constant 1995
USdollars and the data source is World Bank, 2006.
Peace: The number of years since the end of the last civil war. If the country never experienced a
civil war we count all years since the end of World War II.
Population: Population measures the total population, in our regressions we take the natural
logarithm. Data source: World Bank, 2006.
Primary commodity exports: The ratio of primary commodity exports to GDP proxies the abundance
of natural resources. The data on primary commodity exports and GDP were obtained from the
World Bank. Export and GDP data are measured in current US dollars.
Social, ethnolinguistic, and religious fractionalization: We proxy social fractionalization in a combined
measure of ethnic and religious fractionalization. Ethnic fractionalization is measured by the

ethno-linguistic fractionalization index. It measures the probability that two randomly drawn
individuals from a given country do not speak the same language. The religious fractionalization
index measures this probability for different religious affiliations. The fractionalization indices
range from zero to one. A value of zero indicates that the society is completely homogenous
whereas a value of one would characterize a completely heterogeneous society. We calculated our
social fractionalization index as the product of the ethno-linguistic fractionalization and the
religious fractionalization. Data source: Fearon and Laitin (2003).
War starts: Our main measure is based on (Gleditsch 2004) and can be downloaded from
http://weber.ucsd.edu/_kgledits/expwar.html (12 July 2006). Our alternative measure comes
from the Armed Conflict Database (Gleditsch et al. 2002) and can be found on
http://www.prio.no/page/CSCW_research_detail/Programme_detail_CSCW/9649/45925.html
(12 July 2006).
Young men: We define this variable as the proportion of young men aged 15–49 of the total
population (%). Data Source: UN Demographic Yearbook 2005