THE WORLD BANK | BANCO MUNDIAL Working for a World Free of Poverty
68
THE WORLD BANK | BANCO MUNDIAL Working for a World Free of Poverty Economic developments and issues shaping Angola’s future After being hit hard by the global financial crisis, Angola’s economy is now gathering momentum, with robust GDP growth supported by strong fiscal and external balances, a stable exchange rate and moderate inflation. Enhanced fiscal controls and tighter public financial management would enable the government to accelerate public investment to support broad economic diversification and more rapid job creation, while reducing Angola’s considerable vulnerability to external shocks. Improvements in the investment climate and in the financial regulatory structure have enabled the rapid expansion of the banking sector, though systemic constraints in credit access significantly impair the efficiency of the economy as a whole. ` JUNE 2013 | ISSUE 1
Transcript of THE WORLD BANK | BANCO MUNDIAL Working for a World Free of Poverty

THE WORLD BANK | BANCO MUNDIAL Working for a World Free of Poverty
Economic developments and issues shaping Angola’s future
After being hit hard by the global financial crisis, Angola’s economy is now gathering momentum, with robust GDP growth supported by strong fiscal and external balances, a stable exchange rate and moderate inflation. Enhanced fiscal controls and tighter public financial management would enable the government to accelerate public investment to support broad economic diversification and more rapid job creation, while reducing Angola’s considerable vulnerability to external shocks. Improvements in the investment climate and in the financial regulatory structure have enabled the rapid expansion of the banking sector, though systemic constraints in credit access significantly impair the efficiency of the economy as a whole.
`
JUNE 2013 | ISSUE 1


ANGOLA ECONOMIC UPDATE | June 2013 i
Preface
The Angola Economic Update analyzes recent economic developments in Angola and
situates them in a medium-term global context. It evaluates the implications of
macroeconomic trends and policy reforms in terms of the government’s stated
development objectives. Each edition covers a selected topic and includes a Special
Focus Section highlighting a subject area of particular importance. The Angola
Economic Update is intended for a wide audience, including policymakers, business
leaders, international organizations, and the community of analysts and professionals
engaged in Angola’s evolving economy.
This First Edition of the Angola Economic Update was prepared by the World Bank’s
Poverty Reduction and Economic Management Unit in the Africa Region. The team
was led by Marco Antonio Hernandez (Country Economist) under the supervision of
Julio Revilla (Lead Economist). The team consisted of Sean Lothrop, Jorge Loyola,
Andrew Blackman, David Stephan, Vasco Molini, Anna Kochanova and Roger Sullivan.
John Panzer (Sector Manager) and Laurence Clarke (Country Director) provided
overall guidance. Partnership with key Angolan policy makers was instrumental in the
production of this report.
The findings, interpretations, and conclusions expressed herein are those of the
authors and do not necessarily reflect the views of the World Bank’s Board of
Executive Directors or the countries they represent. The World Bank does not
guarantee the accuracy of the data included in this report, nor does it endorse the
boundaries, titles or other information shown on any map in this report.
For more information about the World Bank and its activities in Angola please visit
www.worldbank.org/angola. If you would like to be included in an email distribution
list for the Angola Economic Update series and related publications please contact
For questions and comments relating to this publication, please contact
Marco Antonio Hernandez at [email protected].

ii WORLD BANK | BANCO MUNDIAL
Abbreviations and Acronyms
ACR Africa Competitiveness Report
AfDB African Development Bank
BoP Balance of Payments
BNA Banco Nacional de Angola (National Bank of Angola)
BUE Balcão Único do Empreendedor (Single Desk for Entrepreneurs) CIRC Central de Informação de Riscos de Credito (Central Credit-Risk
Information Registry)
COMEF Financial Stability Committee
CPI Consumer Prices Index
DB Doing Business
EU European Union
FDI Foreign Direct Investment
FSC Financial Stability Committee
FSDEA Fundo Soberano de Angola (Angolan Sovereign Fund)
FY Fiscal Year
GDP Gross Domestic Product
HDI Human Development Index
HHI Herfindahl-Hirshman Index
ICT Information and Communication Technologies
IFC International Finance Corporation
IMF International Monetary Fund
INE Instituto Nacional de Estatística (National Statistics Institute)
LMIC Lower Middle-Income Country
LNG Liquid Natural Gas
MBPD Million Barrels Per Day
MPC Monetary Policy Committee
MTFF Medium-Term Fiscal Framework
OECD Organization for Economic Cooperation and Development
OPEC Organization of Petroleum Exporting Countries
PIM Public Investment Management
QFO Quasi-Fiscal Operation
REER Real Effective Exchange Rate
SMEs Small and Medium Enterprises
SSA Sub-Saharan Africa
SWF Sovereign Wealth Fund
TFP Total Factor Productivity
US United States of America
WEF World Economic Forum
WBES World Bank Enterprise Surveys
WDI World Development Indicators

ANGOLA ECONOMIC UPDATE | June 2013 iii
ANGOLA ECONOMIC UPDATE
Angola’s Economic Recovery and Challenges Ahead June 2013 | Issue 1
Contents
i Preface
ii Abbreviations and Acronyms
Contents iii
List of Figures iv
List of Tables v
vi I. EXECUTIVE SUMMARY
A Strong Recovery, but the Economy Remains Vulnerable to External Shocks vii
1 II. RECENT ECONOMIC DEVELOPMENTS
Angola’s Economy: Regaining Momentum 1
Inflation is Declining, but Structural Issues Remain 7
Fiscal Policy: Challenges and Opportunities 8
Balance of Payments: A Comfortable yet Vulnerable Surplus 14
Monetary and Exchange Rate Policy: A Focus on Stabilization and Resilience 16
III. ECONOMIC OUTLOOK AND RISKS 19
The Global Outlook: Gathering steam? 19
Angola’s Outlook: Solid Growth despite an Uncertain Global Environment 22
Risk Scenarios: Angola’s Sensitivity to Global Shocks 25
IV. SPECIAL FOCUS SECTION: THE RAPID GROWTH OF ANGOLA’S FINANCIAL SECTOR IN A
CONTEXT OF STRUCTURAL CHALLENGES 29
Introduction 29
The Angolan Financial Sector 31
Credit Access and Its Impact on Firms 36
Financial Regulations and Related Institutions 43
Conclusion 47
V. ANNEXES 48
VI. BIBLIOGRAPHY 54

iv WORLD BANK | BANCO MUNDIAL
List of Figures
Figure 1: Angola’s economy expanded strongly in 2012… .......................................................................................1
Figure 2: …supported by rising oil production and prices .........................................................................................1
Figure 3: The global economic recovery slowed in 2012...........................................................................................2
Figure 4: But global economic activity may be picking up ........................................................................................2
Figure 5: Strong gains in cement production point to robust construction activity ....................................................3
Figure 6: The recovery in oil production and prices, and rising incomes provided stimulus across the economy ....3
Figure 7: Sustainable Economic Development Requires Comprehensive Natural-Resource Management ..............6
Figure 8: Headline and core inflation are decreasing .................................................................................................7
Figure 9: Volatile foodstuffs dominate the consumer basket, and food price fluctuations drive changes in
consumer-price inflation .............................................................................................................................................8
Figure 10: Angola’s inflation rate remains high by regional standards ......................................................................8
Figure 11: Angola’s reliance on non-renewable resource revenues combined with a relatively low reserve horizon
leaves the economy in a vulnerable position to improve its weak human development indicators .........................10
Figure 12: Oil prices remain pivotal to Angola’s external accounts, with changes in prices driving changes in the
trade balance and current account… ........................................................................................................................15
Figure 13: …which in turn drive fluctuations in the BoP, while financial account flows remain much smaller than
trade flows. ...............................................................................................................................................................15
Figure 14: The real effective appreciation of Angola’s kwanza is eroding the competitiveness of the economy ...18
Figure 15: Economic activity in Angola’s Major Trading Partners is projected to rise modestly over the
projections ................................................................................................................................................................19
Figure 16: Commodity prices are projected to track global growth, with prices relatively stable through 2013-
2014 ..........................................................................................................................................................................19
Figure 17: World oil demand continues to be driven by growing demand in emerging markets .............................20
Figure 18: OECD oil inventories increased over 2012, stabilizing international oil prices .....................................20
Figure 19: Angola is projected to outperform peer economies in 2013 ...................................................................22
Figure 20: Angola remains one of the lowest ranked economies in the Doing Business survey .............................24
Figure 21: Angola’s logistic performance remains below the SSA average ............................................................25
Figure 22: An oil-price shock would have a negative impact on export earnings and tax revenues ........................26
Figure 23: A food price shock would negatively affect inflation and consumptions ...............................................27
Figure 24: Credit to the Angolan private sector grew robustly until 2009, but has remained flat since the onset of
the global financial crisis. .........................................................................................................................................31
Figure 25: Angolan firms’ access to credit is far below the averages for comparable countries. ............................32
Figure 26: Loans to firms in Angola are more likely to require collateral than for firms in comparator countries. 34
Figure 27: Angolan firms rely on internal resources to finance investments far more than firms in comparable
countries. ..................................................................................................................................................................35
Figure 28: Access to financial services for Angolan SMEs has improved, but remains low relative to SMEs in
comparator countries… ............................................................................................................................................37
Figure 29: …with similar trends for SMEs access to overdraft facilities. ................................................................37
Figure 30: Smaller, younger and locally-owned firms are less likely to have access to financing ..........................37

ANGOLA ECONOMIC UPDATE | June 2013 v
Figure 31 Angolan SMEs grow more slowly than either SMEs in comparable countries or large firms in Angola,
with deeply negative implications for market competition and economic dynamism .............................................40
Figure 32: Firm concentration in Angola is dramatically higher than in comparable countries ..............................41
Figure 33: Fewer than 25 percent of firms in Angola operate in a market with more than five competitors ...........41
Figure 34: Credit constraints are particularly severe for small manufacturers, while the growth performance of
large manufacturers is similar to firms in comparator countries ..............................................................................42
Figure 35: Angola’s banking sector has one of the highest concentration rates in the region .................................43
List of Tables
Table 1: Food production in Angola has grown rapidly in recent years, but low yields pose a threat to food
security .......................................................................................................................................................................4
Table 2: On the expenditure side, GDP growth has been led by private consumption ..............................................4
Table 3: The fiscal position has strengthened, and expenditures remain weighted towards current expenditures ....9
Table 4: Angola has a very low rate of investment compared to most countries in Sub-Saharan Africa, along with
a relatively low ratio of public external debt to GDP ...............................................................................................11
Table 5: Four Types of Sovereign Wealth Fund ......................................................................................................13
Table 6: Angola’s BoP continues to be driven by developments in the trade surplus, while financial flows remain
relatively small .........................................................................................................................................................15
Table 7: Monetary policy has been conservative, with the MPC making relatively few adjustments .....................17
Table 8: Oil, construction and commerce are projected to drive GDP growth, with other sectors also contributing
..................................................................................................................................................................................22
Table 9: Forecast of key economic indicators for Angola ........................................................................................23
Table 10: The business climate has improved across a handful of indicators, but Angola lags SSA’s averages ....24
Table 11: An oil-price shock would slash GDP growth, turning twin current-account and fiscal surpluses into
deficits ......................................................................................................................................................................26
Table 12: An increase in global food prices is expected to significantly raise inflation and reduce private
consumption .............................................................................................................................................................28
Table 13: The Growth of Financial Assets and Lending and the Expansion of Financial-Sector Infrastructure .....31
Table 14: Reasons for Not Applying for a Loan, by Firm Size, 2006 and 2010 ......................................................35

vi WORLD BANK | BANCO MUNDIAL
I. EXECUTIVE SUMMARY Angola’s economy is rebounding after a period of relatively weak growth, with GDP expanding by an estimated 8.1 percent in 2012. From 2009 to mid-2011 GDP growth stagnated due to a decline in global oil prices and a slowdown in domestic oil production. The resulting drop in oil revenues, the primary source of government revenue, impacted the non-oil economy through diminished private consumption, cuts to public spending and the accumulation of substantial arrears to domestic firms, particularly in the construction sector. By 2012, however, a combination of high oil prices and rising production boosted GDP growth and generated a large increase in fiscal revenues, enabling the government to clear its arrears and increase public expenditures. In 2012 the government’s fiscal position strengthened, inflation declined to single digits, and international reserves continued to accumulate. The recovery of the oil sector allowed the government to boost public spending while maintaining a strong overall fiscal surplus, which is estimated at 8.6 percent of GDP. Inflation fell to 9 percent, the lowest rate in more than two decades, due to declining global food prices and the efforts of the Angolan central bank (Banco Nacional de Angola—BNA) to stabilize the nominal exchange rate. In the external sector, strong export earnings and foreign direct investment (FDI) inflows bolstered aggregate demand, leading to a rise in imports and a moderate decrease in the current account surplus, now estimated at 6.7 percent of GDP. Solid net capital inflows allowed Angola to increase its international reserves to the equivalent of 7.4 months of imports, two-and-a-half times their 2009 level. Among the most salient features of the Angolan economy are its very low levels of investment, both public and private. Angola’s total investment rate is currently about 13 percent of GDP, well below the three-year average for Sub-Saharan Africa (SSA) of 24 percent. Public investment accounts about 10 percent of its GDP, while private investment represents just 3 percent,1 compared to a SSA average of 13 percent. Since the recovery began, the authorities have taken steps to increase public investment, which rose by about 15 percent in 2011 and 29 percent in 2012, in nominal terms. The 2013 budget calls for a steep increase of 60 percent in capital expenditures. There is fiscal space to increase public investment without destabilizing the public finances. With a fiscal surplus, significant savings, and a low and manageable public debt burden (at around 20 percent of GDP), Angola is in a position to boost investment spending over the medium term. An expanded public investment program could finance critical infrastructure projects and accelerate growth, particularly in the non-resource economy. However, ensuring that new investment is directed to priority development objectives, that new spending is executed efficiently, and that lessons learned through past projects are applied to future efforts, will require enhancing the effectiveness of the public investment process. Strengthening public investment management (PIM) systems would help to maximize the impact of expanded public investment. Enhancing PIM would allow the government to scale-up investment spending while ensuring that financing is directed to projects that advance its priority objectives, especially in terms of strengthening macroeconomic resilience and international competitiveness. PIM could be enhanced by expanding competitive bidding for public contracts, along with reforms designed to improve the selection, implementation, and monitoring of public investment projects. Assessing the targeting and equity of public spending would help to
1 The available data on private investment in Angola are limited. Expanding the collection and publication of data on real and nominal private-investment rates, disaggregated by economic sector and by region, would allow for a more comprehensive assessment of the dynamics of economic growth and further the government’s efforts to promote private-sector development and accelerate broad-based employment creation.

ANGOLA ECONOMIC UPDATE | June 2013 vii
further strengthen the linkages between public expenditure, fiscal sustainability, and sector-specific development strategies. The authorities have made significant strides in improving the transparency and accountability of public financial management, but challenges remain. The government has improved collection and reporting processes for oil revenues and transfers, which is expected to enhance transparency and accountability in oil-sector management. Notably, the 2013 National Budget includes, for the first time, quasi-fiscal operations undertaken by the state-owned company Sonangol, which will help to reduce the budgetary uncertainty associated with oil-revenue flows. Angola’s recently established sovereign wealth fund could do much to stabilize expenditures against oil-price volatility and/or accumulate long-term savings in anticipation of the eventual decline of the oil sector, though it would be important that its mandate and governing framework is more clearly specified. Ongoing efforts to enhance macroeconomic management could be complemented by a medium-term fiscal framework, which would further facilitate the implementation of large, multi-year public investment projects. Over the medium term, rebalancing the composition of public expenditures from current to capital spending would help to alleviate infrastructure bottlenecks and boost growth in the non-oil sectors. Current expenditures account for three-quarters of all public spending, and over the past three years they have grown at twice the rate of capital expenditures. Angola’s fuel-subsidy costs are estimated to be the highest in SSA, estimated at about 5 percent of GDP in 2012—equivalent to half of all capital spending. The fuel-subsidy program is based in part on social-welfare objectives, but the international experience suggests that only a small fraction of these subsidies reaches the poor.
A Strong Recovery, but the Economy Remains Vulnerable to External Shocks The oil sector grew by 5.2 percent in 2012 on the strength of rising oil prices and the resolution of production problems. Oil-sector output declined by 5.6 percent in 2011 due to unexpected technical difficulties; however, after falling to an average of less than 1.6 million barrels per day (mbpd) in the first half of 2011, oil production recovered to an average of almost 1.8 mbpd in 2012. In 2012 oil accounted for 46 percent of Angola’s GDP and 96 percent of exports. Responsible fiscal management during the recovery of the oil sector had positive spillover effects for commerce and construction. Tighter fiscal policies and strong oil revenues improved the government’s fiscal position, enabling it to clear arrears incurred during the 2008-09 crisis. This, together with a surge in oil-related FDI, pushed the growth in the construction sector to a remarkable 21.8 percent in 2012, up from an already strong growth rate of 12 percent in 2011. The commercial sector is estimated to have grown by 9.3 percent in 2012, with consumer demand driving robust commercial activity. Rising per capita incomes have encouraged international retailers to enter the domestic market, generating additional construction activity. Growth in agriculture and manufacturing has been fairly strong in recent years, but both sectors continue to perform below their potential. Agriculture, which employs two-thirds of the Angolan labor force, grew by a relatively robust 7.3 percent in 2012, but remained below its 10-year average rate of 13 percent. In 2012 drought conditions reduced yields for many staple crops, including maize. Meanwhile, the growth of the manufacturing sector was very modest at an estimated 1.3 percent, down sharply from 13 percent in 2011 and 10.7 percent in 2010. Increasing investment to boost productivity in agriculture and manufacturing could make a strong contribution to employment creation, particularly given the human-capital dynamics of the Angolan labor force. The appreciation of the Angolan kwanza is significantly diminishing the competitiveness of the non-oil economy by making imports relatively cheap compared to domestic goods. Monetary policies designed to stabilize the nominal exchange rate in a context of large FDI inflows caused Angola’s real effective exchange rate

viii WORLD BANK | BANCO MUNDIAL
to appreciate by 9 percent between 2011 and 2012. A stronger kwanza has had a negative impact on Angolan manufacturers and especially farmers, who are also facing a decline in the cost of imported food. Nevertheless, Angola’s overall economic outlook is positive, with GDP growth projected at 7.2 percent in 2013 and 7.5 percent in 2014. These projections are based on sustained increases in oil production, relatively stable international prices, and continued growth in the non-oil sectors, particularly construction. Net capital inflows are expected to remain solid, bolstering foreign exchange reserves and reinforcing the government’s fiscal position, while inflation is expected to continue its gradual decline. Finally, the production of liquid natural gas (LNG), expected to begin in 2013, could contribute an additional 2 percentage points to the GDP growth rate during its first year alone. Despite its favorable near-term outlook, Angola’s reliance on oil revenues and imports leaves the economy highly vulnerable to external shocks. Oil exports are responsible for an overwhelming share of Angola’s fiscal and external revenues, and simulation analysis suggests that a shock to global oil prices would significantly reduce GDP growth. In addition, Angola’s reliance on both strategic and consumer-goods imports—particularly food—means that any substantial increase in international food prices would translate into rapidly rising inflation and reduced consumption. Consequently, a significant food-price shock would have a devastating effect on the country’s poor.
Angola’s Financial Sector: Rapid Growth in a Context of Structural Challenges The supply of credit to the Angolan private sector has increased dramatically over the past decade: the number of banks has risen rapidly, and firms have access to an expanding range of financial services. Following the end of the Civil War in 2002 the government launched an ambitious financial liberalization program. By the end of the decade only one of Angola’s three largest banks was state-owned. The financial sector’s total assets grew from less than US$3 billion in 2003 to over US$57 billion in 2011, while the number of banks operating in the country rose from 9 to 23. Whereas in 2006 Angolan firms were among the least likely in the world to utilize basic financial services, by 2010 the percentage of Angolan firms with savings and checking accounts had approached the averages for SSA and lower-middle-income countries worldwide. The rapid growth of financial capital was driven by the oil sector but not restricted to it, and the supply of capital to all major economic sectors has grown steadily, albeit unevenly. However, the Angolan financial industry suffers from structural inefficiencies arising from the inability of lenders to accurately gauge the creditworthiness of prospective borrowers. The system-wide lack of reliable financial information is due in part to the relative newness of the sector as a competitive, private-sector-led industry and exacerbated by weaknesses in its key supportive institutions, both public and private. Complementary private markets that would otherwise generate credit information—including insurance, accounting, and private equity markets—are either underdeveloped or nonexistent. And although the government has expanded its property-registration and public recordkeeping capacities, its ability to clearly define property rights and certify asset ownership is not yet comprehensive. Due to inadequate financial information lenders exhibit clear preferences for firms that possess certain characteristics, which are used as imprecise proxy indicators of creditworthiness. An analysis of two World Bank Enterprise Surveys in Angola, conducted in 2006 and 2010, supported by comparisons with other countries shows that pervasive information asymmetry is damaging the efficiency of the Angolan financial system. Larger, older firms enjoy significantly better access to credit than their smaller, younger counterparts; foreign-owned firms are less credit-constrained than domestic firms; and firms located in Luanda have better access than firms based outside the capital. Lending practices designed to help banks cope with a low-information financial sector reinforce the advantages of large, older, urban-based and foreign-owned firms: collateral is required for nearly all loans, liquid assets and personal guarantees are the preferred collateral types, and a large share of loans is rejected

ANGOLA ECONOMIC UPDATE | June 2013 ix
on the basis of inadequate collateral. Consequently, firms are heavily dependent on their own internal resources for investment financing. These conditions have deeply negative implications for market competition, price mechanisms, and rates of technological uptake. Because of uneven credit access many of Angola’s key economic sectors are comprised of a handful of very large firms and a multitude of very small ones, demonstrating a ‘missing middle’ effect. This results in imperfectly-competitive markets dominated by a tiny cohort of very large firms, which enjoy large price-cost margins and in some cases may be capable of exercising significant market power. The financial sector itself is extremely concentrated, and its demonstrated preference for larger, more well-established firms over smaller startups has produced a highly atypical growth pattern throughout the economy. Unlike other countries, where small and medium enterprises typically scale-up rapidly to compete with larger firms and then experience slowing growth as diminishing returns set in, large firms in Angola grow as quickly or even more quickly than small and medium enterprises. Consequently, the size difference between them does not change over time, market shares remain heavily concentrated, competitive incentives are diminished, and dominant firms can exploit their market power to maximize profits at the expense of consumers, further damaging the efficiency of the economy as a whole. The government has made substantial progress in establishing the necessary conditions for the financial sector to thrive, but critical challenges remain. Angolan firms now enjoy greatly expanded access to the financial system, but the system is not yet capable of evaluating them accurately on their merits as borrowers. Continuing strengthening its institutions and regulatory framework would support a diverse, efficient and competitive financial sector, which will be a vital asset to Angola’s continued growth and development.


THE WORLD BANK | BANCO MUNDIAL Working for a World Free of Poverty
II. RECENT ECONOMIC DEVELOPMENTS
Angola’s Economy: Regaining Momentum
Angola’s GDP grew by 8.1 percent in 2012, up sharply from 3.4 percent in 2011. After struggling to cope with the downturn in external conditions that began in 2008—the impact of which was magnified by production problems in the domestic oil sector—the Angolan economy is now rebounding, and growth is projected to remain strong in the near term. The economic slowdown was exacerbated by the accumulation of arrears to government contractors, highlighting the budget’s vulnerability to oil-revenue shocks and structural issues related to the performance of the state-owned oil company Sonangol. However, in 2012 a combination of high oil prices and rising production volumes boosted export receipts, strengthening the government’s fiscal position and enabling the clearance of arrears, which provided an infusion of capital to the non-oil economy, especially the construction industry. Increasing oil revenues enabled the government to return public expenditures to pre-crisis levels, and spending is projected to rise over the near term. Although agriculture grew by a robust 7.3 percent, marginal productivity in the sector remains very low. More than two-thirds of Angolans are employed in agriculture, and the continued low productivity of the sector has major implications for employment, poverty and income inequality, as well as food security and macroeconomic vulnerability to global food-price shocks. The oil sector remains the driving force of the Angolan economy, and rising oil production coupled with high oil prices led the recovery of growth in 2012. Oil currently accounts for about 46 percent of Angola’s GDP and 96 percent of its exports. Growth in the oil sector rebounded from a 5.6 percent decline in 2011 to grow by an estimated 5.2 percent in 2012, contributing 1.8 percentage points to overall GDP growth (Figure 1). After falling to below 1.6 mbpd in the second quarter of 2011 oil production recovered in 2012, reaching an estimated average of almost 1.8 mbpd for the year. Prices for Angolan oil (the “Angola mix”), remained stable at around US$110 in 2012 (Figure 2). Output in the diamond sector also recovered, driven by rising diamond prices, with the sector growing by 4.6 percent in 2012 following a modest decline of 0.7 percent in 2011. Extractive industries overall expanded by an estimated 5.2 percent in 2012 after contracting by 5.3 percent in 2011.
Figure 1: Angola’s economy expanded strongly in 2012…
(Real GDP growth, annual percent change)
Figure 2: …supported by rising oil production and prices
(World Bank oil price index; oil production in mbpd)
Note: (e) = estimate; mbpd = million barrels per day.
Source: Angolan authorities and World Bank staff estimates.
-8
-4
0
4
8
12
-8
-4
0
4
8
12
2009 2010 2011 2012(e)
Oil Non-Oil GDP
0
20
40
60
80
100
120
140
1.4
1.5
1.6
1.7
1.8
1.9
2.0
2.1
Jan-08 Jan-09 Jan-10 Jan-11 Jan-12
Oil Production (LHS)
Oil Price (RHS)
Pazflor Platform

2 WORLD BANK | BANCO MUNDIAL
The recovery of the oil sector was complemented by reforms in public financial management, which helped the government clear its arrears to the private sector and spurred the rapid expansion of the construction industry. The drop in revenues during the crisis led to a buildup of cross-arrears between Sonangol, the Treasury, and private contractors, particularly construction firms tasked with implementing public-investment projects.2 However, tighter fiscal
2 The drop in oil prices following the 2008-09 crisis compounded a downward trend in domestic oil production, significantly weakening Angola’s fiscal position. Due to lower oil revenues, the state-owned oil company Sonangol accumulated arrears with the Treasury, which in turn led the government to default on a series of payments, particularly contracts with construction firms for public infrastructure projects. The BNA estimated that the amount of arrears accumulated between 2008 and 2009 at US$6.8 billion.
Box 1 A Slow, Uneven Recovery Recent Developments in the Global Economy
Angola’s economy continues to be adversely impacted by a world economy still struggling more than four years after the
start of the global financial crisis. Growth in high-income countries remains subdued, while developing economies slowed
during 2012 to among their lowest aggregate growth rates in a decade. In response to deteriorating external conditions a
number of central banks implemented monetary stimulus packages, yet commodity prices remained depressed through early
2012. High levels of debt, large fiscal deficits and unresolved sovereign debt issues in advanced economies, particularly in the
euro zone, pose significant risks to global financial and commodity markets.
Global growth remained weak in 2012 at 2.3 percent, its lowest rate since the start of the global financial crisis. Aggregate
euro zone GDP contracted by 0.3 percent, while the United States’ economy grew by 2.1 percent in 2012, up from 1.8 percent
in the previous year but still below its long-run potential. Meanwhile, growth also weakened in major emerging economies:
China’s GDP grew by 7.9 percent—its slowest rate since the late-1990s—while India’s economy slowed to 5.2 percent from 7.7
percent in 2011. These low growth rates impacted Angola’s economy primarily though diminished export demand (Figure 3).
Figure 3: The global economic recovery slowed in 2012
(Real GDP growth, percent)
Figure 4: But global economic activity may be picking up
(OECD composite leading indicator index, 100=long-term
trend of activity)
Note: Growth of trading partners is weighted by Angola’s export values. (e) = estimate.
Source: World Bank staff estimates based on data from the World Bank’s DEC Prospects Group and OECD.
Nevertheless, global economic activity has begun to show a number of positive signs, which may indicate an incipient
recovery in major global markets. After remaining sluggish through the first half of 2012, industrial production in advanced and
emerging economies ticked up in early 2012. Several partial indicators—such as the OECD composite leading indicator index,
the global manufacturing-related Purchasing Managers Index, and consumer confidence indicators in large economies—have
improved (Figure 4). Global commodity prices moderated in mid-2012 as global growth eased, but then picked up late in the
year in line with the increase in global activity. Recent data, however, indicate that the recovery in emerging markets, including
China, is more gradual than earlier predictions suggested, while recent financial market jitters related to sovereign debt issues
in Cyprus have also tempered the global recovery
-2
0
2
4
6
8
10
12
Angola US Euro Area China India MTP
2010 2011 2012(e)
93
95
97
99
101
103
105
Feb-08 Feb-09 Feb-10 Feb-11 Feb-12 Feb-13
US Euro China
India Japan

ANGOLA ECONOMIC UPDATE | June 2013 3
policies improved the government’s revenue position, enabling the clearance of arrears accumulated during the 2008-09 crisis. This injection of liquidity boosted growth in the construction sector to a remarkable 21.8 percent in 2012, up from an already strong growth rate of 12 percent in 2011. Higher tax revenues also allowed the government to invest in large-scale infrastructure projects, such as the 10,000 hectare international airport in Luanda, currently under construction. The recovery of the construction industry bolstered its input suppliers, such as cement production, which surpassed pre-crisis levels in 2012 (Figure 5). While the construction sector remains tightly linked to public spending, private sector demand for housing, offices and commercial buildings has provided additional stimulus. Strong export earnings and rising incomes are driving growth in the commercial sector and spurring major investments in retail. Consolidating its recovery after the crisis, the commercial sector is estimated to have grown by 9.3 percent in 2012. Increasing per capita incomes have encouraged large retailers, such as Teixeira Duarte Group (from Portugal) to enter the local market, generating additional activity in the construction industry (Figure 6). Service sectors such as telecommunications and finance are also seeing robust growth. Angola’s communications and information-technology industries are expanding rapidly, with the launch of 4G services in Luanda taking place in late-2012. The use of both mobile phone and internet services has expanded steadily, reaching an estimated 52 percent and 12 percent of the population, respectively, in 2012. The financial sector continues to develop, with the credit market growing by average of 50 percent per year for the past five years. However, while the Angolan banking sector is now one of the largest in Sub-Saharan Africa (SSA) important constraints and distortions remain. These issues are discussed in detail in the Special Focus Section included in this Economic Update. Manufacturing slowed in 2012 after several years of solid growth. Value added in the manufacturing sector rose by a modest 1.3 percent in 2012, after growing by 13 percent in 2011 and 10.7 percent in 2010. From mid-2011 through 2012 the production of textiles, as well as machinery and equipment, contracted significantly, which negatively affected the performance of the sector. Angola’s manufacturing sector remains small, accounting for less than 6 percent of GDP in 2012. With both capital- and consumer-goods imports meeting a large share of domestic demand, there is considerable room to expand the domestic manufacturing sector. Its long-term growth would also be supported by sustained increases in per capita income and continued urbanization. Important structural issues constrain the development of the manufacturing sector. The most salient of these is the appreciation of the real effective exchange rate, which is associated with the extractive sector and its high-value commodity exports.3 The second is the availability of credit—discussed further in the Special Focus Section of this
3 Known as the ‘Dutch disease’ effect, high-value commodity exports can damage the broader economy through the appreciation of the real effective exchange rate. Foreign demand for resource exports drives demand for the exporting country’s currency, and rising demand for that currency increases its relative value. As a result the resource-rich country’s other exports effectively become more
Figure 5: Strong gains in cement production point to
robust construction activity
(Tons of cement production, value-added)
Source: Angolan authorities and World Bank staff estimates
Figure 6: The recovery in oil production and prices, and
rising incomes provided stimulus across the economy
(Contributions to real GDP growth, percentage points)
Source: Angolan authorities and World Bank staff estimates
0
12
24
36
48
60
0
100
200
300
400
500
Sep-08 Sep-09 Sep-10 Sep-11 Sep-12
Construction Value Added (RHS)
Cement Production (LHS)
-4
-2
0
2
4
6
8
10
-4
-2
0
2
4
6
8
10
2009 2010 2011 2012 (e)
Agriculture Petroleum Manufacturing
Construction Commerce Services
Other GDP Growth
4 WORLD BANK | BANCO MUNDIAL
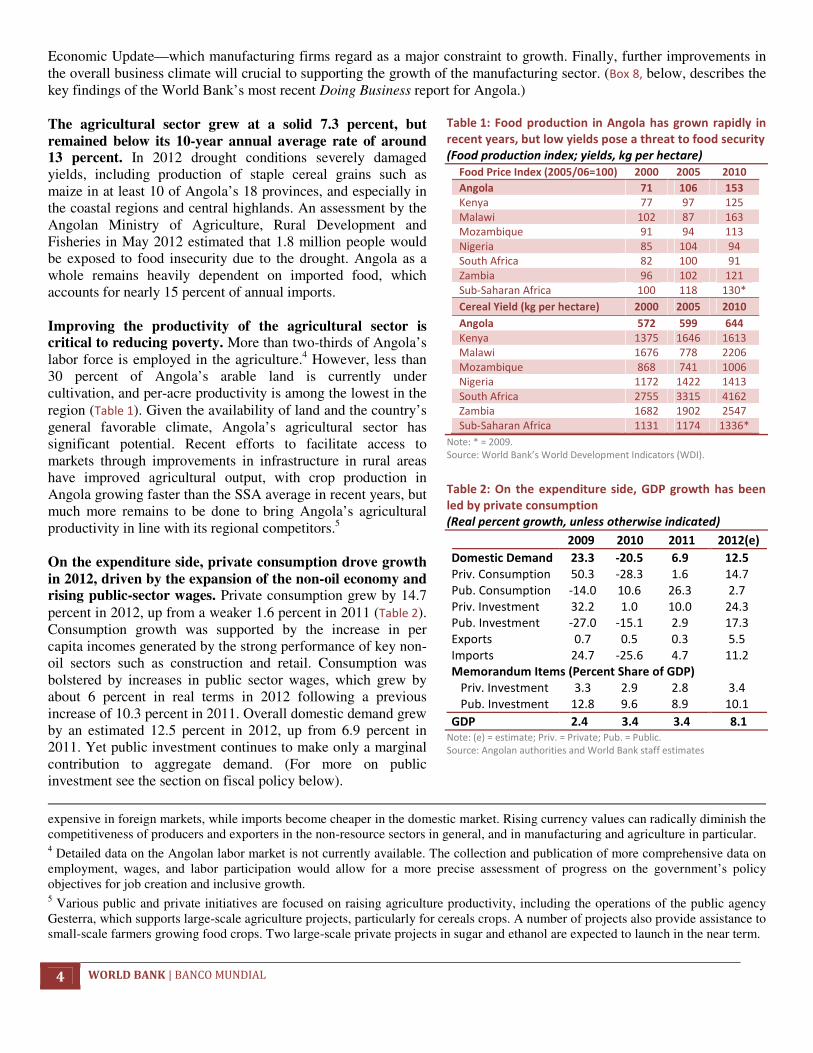
Economic Update—which manufacturing firms regard as a major constraint to growth. Finally, further improvements in the overall business climate will crucial to supporting the growth of the manufacturing sector. (Box 8, below, describes the key findings of the World Bank’s most recent Doing Business report for Angola.) The agricultural sector grew at a solid 7.3 percent, but remained below its 10-year annual average rate of around 13 percent. In 2012 drought conditions severely damaged yields, including production of staple cereal grains such as maize in at least 10 of Angola’s 18 provinces, and especially in the coastal regions and central highlands. An assessment by the Angolan Ministry of Agriculture, Rural Development and Fisheries in May 2012 estimated that 1.8 million people would be exposed to food insecurity due to the drought. Angola as a whole remains heavily dependent on imported food, which accounts for nearly 15 percent of annual imports. Improving the productivity of the agricultural sector is critical to reducing poverty. More than two-thirds of Angola’s labor force is employed in the agriculture.4 However, less than 30 percent of Angola’s arable land is currently under cultivation, and per-acre productivity is among the lowest in the region (Table 1). Given the availability of land and the country’s general favorable climate, Angola’s agricultural sector has significant potential. Recent efforts to facilitate access to markets through improvements in infrastructure in rural areas have improved agricultural output, with crop production in Angola growing faster than the SSA average in recent years, but much more remains to be done to bring Angola’s agricultural productivity in line with its regional competitors.5 On the expenditure side, private consumption drove growth in 2012, driven by the expansion of the non-oil economy and rising public-sector wages. Private consumption grew by 14.7 percent in 2012, up from a weaker 1.6 percent in 2011 (Table 2). Consumption growth was supported by the increase in per capita incomes generated by the strong performance of key non-oil sectors such as construction and retail. Consumption was bolstered by increases in public sector wages, which grew by about 6 percent in real terms in 2012 following a previous increase of 10.3 percent in 2011. Overall domestic demand grew by an estimated 12.5 percent in 2012, up from 6.9 percent in 2011. Yet public investment continues to make only a marginal contribution to aggregate demand. (For more on public investment see the section on fiscal policy below).
expensive in foreign markets, while imports become cheaper in the domestic market. Rising currency values can radically diminish the competitiveness of producers and exporters in the non-resource sectors in general, and in manufacturing and agriculture in particular. 4 Detailed data on the Angolan labor market is not currently available. The collection and publication of more comprehensive data on employment, wages, and labor participation would allow for a more precise assessment of progress on the government’s policy objectives for job creation and inclusive growth. 5 Various public and private initiatives are focused on raising agriculture productivity, including the operations of the public agency Gesterra, which supports large-scale agriculture projects, particularly for cereals crops. A number of projects also provide assistance to small-scale farmers growing food crops. Two large-scale private projects in sugar and ethanol are expected to launch in the near term.
Table 1: Food production in Angola has grown rapidly in
recent years, but low yields pose a threat to food security
(Food production index; yields, kg per hectare)
Food Price Index (2005/06=100) 2000 2005 2010
Angola 71 106 153
Kenya 77 97 125
Malawi 102 87 163
Mozambique 91 94 113
Nigeria 85 104 94
South Africa 82 100 91
Zambia 96 102 121
Sub-Saharan Africa 100 118 130*
Cereal Yield (kg per hectare) 2000 2005 2010
Angola 572 599 644
Kenya 1375 1646 1613
Malawi 1676 778 2206
Mozambique 868 741 1006
Nigeria 1172 1422 1413
South Africa 2755 3315 4162
Zambia 1682 1902 2547
Sub-Saharan Africa 1131 1174 1336*
Note: * = 2009.
Source: World Bank’s World Development Indicators (WDI).
Table 2: On the expenditure side, GDP growth has been
led by private consumption
(Real percent growth, unless otherwise indicated)
2009 2010 2011 2012(e)
Domestic Demand 23.3 -20.5 6.9 12.5
Priv. Consumption 50.3 -28.3 1.6 14.7
Pub. Consumption -14.0 10.6 26.3 2.7
Priv. Investment 32.2 1.0 10.0 24.3
Pub. Investment -27.0 -15.1 2.9 17.3
Exports 0.7 0.5 0.3 5.5
Imports 24.7 -25.6 4.7 11.2
Memorandum Items (Percent Share of GDP)
Priv. Investment 3.3 2.9 2.8 3.4
Pub. Investment 12.8 9.6 8.9 10.1
GDP 2.4 3.4 3.4 8.1
Note: (e) = estimate; Priv. = Private; Pub. = Public.
Source: Angolan authorities and World Bank staff estimates

ANGOLA ECONOMIC UPDATE | June 2013 5
Box 2 The Paradox of Plenty Understanding the Challenges and Opportunities of Natural-Resource Management
Angola’s natural-resource sector is the driving force of its economy, and the country’s oil reserves can support rapid GDP
growth over the medium term. However, perhaps the most important policy question facing Angola is how to convert its
resource wealth into sustainable economic and social development outside of the oil sector, building the foundation for
continued growth as the country’s resource reserves are gradually but inevitably depleted. In this context, the ‘Natural
Resource Management Value Chain’ approach6 provides a useful framework for addressing this complex and critically important
question. The value chain outlines what steps the Angolan government can take to effectively convert the country’s oil wealth
into productive capital. It also highlights important governance and technical challenges that Angola would need to overcome in
order to achieve its development goals.
Because its degree of export concentration is one of the highest in the world, the challenge of natural-resource management
is more acute in Angola than in many other countries. With oil alone accounting for over 95 percent of its export revenue
Angola is the least export-diverse country in Africa, and rivals Iraq for least export-diverse worldwide. Angola’s extraordinary
reliance on oil affects the economy in several ways. First, oil exports generate inflows of foreign currency, causing the kwanza to
appreciate; this undermines the competitiveness of the non-oil sector by effectively making Angolan goods more expensive for
foreign consumers while foreign goods become cheaper for domestic consumers. Second, the oil sector and its ancillary
industries tend to offer the highest returns to both financial and human capital, and they consequently attract the lion’s share
of domestic credit and employ the best educated and most experienced labor in the country. This further damages the
competitiveness of the non-oil industries, which must cope with an environment of scarce and expensive investment capital and
high labor costs for skilled workers. Finally, the revenue generated by the oil sector boosts domestic demand for non-tradable
goods and services, such as electricity and construction, which increases production costs in the non-oil tradable sector. This
effect is illustrated by the significant extent to which the Angolan construction, real estate, and domestic commercial sectors (all
non-tradables) has consistently outpaced growth in agriculture and manufacturing (both tradables). The explosion of property
values and retail prices in Luanda in recent years provides a further indication of the oil sector’s distortive effects on the
broader economy: according to the Mercer cost-of-living survey, Luanda is now the world’s second-most expensive city after
Tokyo.
The international experience provides numerous examples of the ways in which the ostensible blessing of natural resource
wealth can in fact become a curse; however, it also offers examples of countries that have escaped that curse by using their
resource reserves to support diversification and competitiveness outside the resource sector. If there is one overarching
lesson from the experience of natural-resource management it is that good governance, administrative competency and
institutional integrity are absolutely essential to a country’s success or failure. Resource-rich countries with weak institutions
are susceptible to corruption and rent-seeking; poorly managed resource revenues can have devastating impacts on a country’s
economy, its environment and even its political stability—in some cases leading to violent conflict over resource rights. And
even countries with strong and stable institutions can suffer deeply negative economic consequences if they do not take
appropriate action to account for the effects of resource exports. This was the experience of The Netherlands in the 1970s,
when the country suffered lasting economic damage (despite its administrative sophistication) because it was not able to
develop an effective policy response to offset the impact of natural-gas exports on the competitiveness of other sectors, as a
result of which this phenomenon is now known as “Dutch disease”. Yet in more recent times a number of countries have
demonstrated that effective policy responses are indeed possible, and there is now a growing international community of
natural-resource success stories.
The lessons of both the successes and the cautionary examples have been consolidated into the “Natural Resource
Management Value Chain” approach, which provides a guide to developing natural-resource policies based on transparency,
accountability and sound macroeconomic management. The value chain approach is designed to ensure that revenue from
non-renewable resources is converted into enduring, inclusive economic development. Figure 7 illustrates the basic elements of
the value chain. Each ‘link’ in the chain is important: the initial awarding of contracts and licenses, the collection of revenues,
the management and allocation of those revenues, and the implementation of sustainable development policies and projects.
6 For a more comprehensive description of this approach see Barma et al. (2011).

6 WORLD BANK | BANCO MUNDIAL
Figure 7: Sustainable Economic Development Requires Comprehensive Natural-Resource Management
Source: World Bank.
The value chain approach has three core components, each of which emphasizes the institutional and technical competencies
necessary for successful resource management. The first component is extraction, which covers the awarding of contracts and
licenses as well as the monitoring of resource operations. It is vital that Angola establish and maintain the appropriate legal and
regulatory frameworks to ensure maximum value for tendered projects. The second component is taxation, particularly the
efficiency of tax collection and the governance and management of revenue flows. Angola has recently made important
progress in improving the transparency of oil revenues, including the publication of flow-of-funds reports. The final core
component is the investment of resource rents. Measures to improve Angola’s public financial management framework,
particularly public investment management, would help to ensure revenues are invested in high-quality public projects that
deliver broad-based growth and poverty reduction.
Transparency and accountability in the management of resource revenues is critical to ensure that the maximum value is
obtained from the exploitation of resource wealth. The value chain approach highlights the need for timely and accessible
information on resource revenues. Specifically, the transfer of resource revenues to the budget should be based on clear,
predictable and public guidelines, so that revenue management is not a matter of administrative discretion. The investment of
resource revenues should be based on similarly simple and transparent guidelines. Angola’s recent inclusion of oil-related
revenues in the 2013 National Budget and curtailing of quasi-fiscal operations by Sonangol represent positive recent steps.
In terms of broader macroeconomic management, the value chain highlights the need to maintain strict fiscal and monetary
discipline. In addition to Angola’s recently established sovereign wealth fund (see Box 4, below) implementing a medium-term
fiscal framework (MTFF) based on conservative oil-price and production assumptions would allow for consistent fiscal surpluses
to be generated over time; financial reserves could be accumulated during years of especially high oil revenues and used to
sustain consistent fiscal spending when oil revenues eventually fall. Strengthening the institutional capacity and enhancing
coordination between economic-policy agencies is essential to effective and responsive policies, while independent monitoring
and evaluation is critical to determine the overall efficiency of public expenditures.
Award of Contracts and
Licenses
Regulation and Monitoring of
Operations
Collection of Taxes and Royalties
Revenue Management and Allocation
Implementation of Sustainable Development Policies and
Projects
Non-Renewable
Resources
Sustainable
Development
Overarching Imperatives: Ensure Transparency and Accountability across the Entire Value Chain, as well
as Sound Macroeconomic Management of Fiscal Flows

ANGOLA ECONOMIC UPDATE | June 2013 7
Inflation is Declining, but Structural Issues Remain
Food imports are a major component of Angola’s consumption basket, and as a result consumer-price inflation is highly sensitive to changes in global food prices and in the exchange rate. In recent years a decrease in global food prices, coupled with measures by the BNA to stabilize the nominal exchange rate, has produced a consistent decline in inflation. After peaking in 2010 inflation is now at historic lows. Nevertheless, structural inflationary pressures remain problematic. The headline inflation rate fell to single digits at the end of 2012 for the first time in over 20 years. Annual inflation declined from 15.3 percent in 2010 to 11.4 percent in 2011 and dropped to 9.0 percent in December 2012. While the overall trend is downward, recent food-price increases are keeping the rate higher than it would otherwise be. International food prices rose by more than 12 percent between 2011 and 2012. Given the large share of imported goods in the consumer basket the BNA has focused its policies on stabilizing the nominal exchange rate to reduce inflationary pressures (Figure 8). Core inflation has fallen faster than headline inflation over the past several months.7 Core inflation—a measure of underlying structural inflation that excludes volatile food and energy prices—has dropped sharply in recent months due to steep declines in prices for transportation and accommodations, and cafes and restaurants, two important categories for core inflation. The combined inflation rate for these two categories fell from over 25 percent in 2010 to single digits in 2012 (Figure 9). Despite the declining trend of inflation, the cost of living in Angola remains high compared to neighboring countries. Even with the recent drop to single digits Angola still experienced the highest overall inflation rate for 2006-2012 among both oil exporters and lower-middle-income countries in the SSA region (Figure 10). While conservative monetary and fiscal policies have helped to curb inflation and reduce price volatility, structural inflation remains high due to the country’s reliance on imports, bottlenecks in basic infrastructure including transportation and energy, uncompetitive and geographically truncated markets, and other factors that constrain the flow of goods. The fact that all of this is occurring in a context of rising per capita incomes means that economic growth is having a strong impact on inflationary pressures.
7 Core inflation is an indicator that explains the trend of inflation typically associated to demand factors. Demand shocks reflect persistent imbalances between the evolution of expenditure and potential growth of the economy that may affect evolution of prices permanently. In response, monetary policy should respond appropriately to correct the imbalance. In contrast, although supply shocks can cause significant changes in prices, these cause only temporary effects, so it does not require monetary policy responses.
Figure 8: Headline and core inflation are decreasing
(Year-on-year growth, percent)
Source: Angolan authorities and World Bank staff estimates.

8 WORLD BANK | BANCO MUNDIAL
Figure 9: Volatile foodstuffs dominate the consumer
basket, and food price fluctuations drive changes in
consumer-price inflation
(Expenditure component shares of the consumer basket,
percentage)
Figure 10: Angola’s inflation rate remains high by regional
standards
(End-of-period inflation, average percentage rate, 2006-
2012)
Source: Angolan authorities and World Bank staff estimates.
Fiscal Policy: Challenges and Opportunities
As a resource-rich developing country, Angola’s fiscal policies are essential to its medium-term growth. Effective fiscal policies can stabilize the economy against external shocks, and public investment, especially in infrastructure, is a primary mechanism for transforming the revenues of the resource sector into valuable public goods capable of supporting economic diversification and inclusive growth. While the authorities have taken steps to improve the resilience of the economy since the onset of the global financial crisis, there remains considerable scope to strengthen fiscal policy. Angola’s level of public investment is very low in comparison to other countries in the region, and at present current expenditures—including energy subsidies—account for the majority of public spending. Angola’s strong public debt profile and the revenue boost provided by the recovery of the oil sector offer a valuable opportunity to expand development spending and attract greater private-sector investment in the non-oil economy. However, in order to maximize its impact, new public spending must be efficient and productive. Sound fiscal rules and strong public investment management systems are essential to ensuring high-quality fiscal policy. Recent reforms to curtail quasi-fiscal operations by Sonangol and to increase the transparency of oil-revenue management are positive steps. Angola’s recently established sovereign wealth fund (SWF) can strengthen the country’s macroeconomic stability by isolating oil revenues and minimizing their inherent volatility, but its mandate and governing framework have yet to be defined in detail. Ensuring the success of the SWF will require establishing clear and simple guidelines for its operations, and laying out the circumstances and rules under which the budget can draw upon the fund for stabilization or other approved purposes. Further fiscal policy reforms could include the introduction of a medium-term fiscal framework that supports multi-year budget planning, allowing infrastructure spending to be more effectively executed over multiple budget cycles. Angola currently enjoys a strong fiscal position supported by low public-debt indicators, and its fiscal savings have returned to pre-crisis levels. As oil revenues fell during the 2008-09 crisis the government moved to consolidate public spending. As a result the government’s fiscal and debt dynamics remained manageable, and in 2012 the overall fiscal surplus reached 8.6 percent of GDP. Meanwhile, after reaching over 100 percent of non-oil GDP during the crisis, the non-oil primary deficit decreased to an estimated 51.6 percent of non-oil GDP in 2012. This improvement in the non-oil deficit was driven by solid growth in non-oil revenue, and by moderation in the growth of the public wage bill and public procurement costs. As the economy has recovered the public debt burden declined to around 20 percent of GDP, less than half of what it was in 2004.
46.61
12.5
11.3
8.3
6.5
6.0
12.5
3.0
0 10 20 30 40 50
Food and beverages
Housing and utilities
Transport and comunication
Other goods and services
Clothing and footwear
Household equipment and appliances
Health and education
Restaurants
0
2
4
6
8
10
12
14
0
2
4
6
8
10
12
14
Ang
ola
Ghana
Nig
eria
Zam
bia
Bots
wana
Sw
azila
nd
Nam
ibia
Le
soth
o
Sou
th A
fric
a
Eq.
Guin
ea
Mau
ritius
Chad
Re
p. C
ongo
Ca
pe V
erd
e
Ca
mero
on
Gabon
Côte
d'Iv
oire
Seneg
al

ANGOLA ECONOMIC UPDATE | June 2013 9
Both revenue and expenditure growth moderated in 2012. Revenues rose by 4.1 percent, following dramatic increases of 44.9 percent and 59.2 percent in 2011 and 2010, respectively (Table 3). While oil production increased by 5.2 percent in 2012 the average oil price remained broadly unchanged from 2011, limiting the growth of oil revenues. Non-oil revenues, particularly income taxes, grew strongly in 2012, but still represented only 15 percent of all revenues. In line with slower revenue growth, expenditure growth moderated to 7.1 percent in 2012, well below the growth of 36.8 percent in 2011. Capital expenditures grew by 29 percent in 2012, well above the rate of 15.3 percent in 2011. Current expenditures continue to dominate the expenditure side of the budget. Current expenditures represent around three-quarters of total public spending, with roughly half of that allocated to procurement of goods and services and to transfer payments. Spending on subsidies also remains very high, accounting for 18 percent of current expenditures; most of these funds are direct transfers to public enterprises, including Sonangol, to cover losses arising from below-market pricing policies maintained by the government. Fuel-subsidy costs are estimated at about 5 percent of GDP in 2012—the highest rate in SSA—equivalent to half of total capital spending. Table 3: The fiscal position has strengthened, and expenditures remain weighted towards current expenditures
(Selected fiscal indicators for the Angolan Central Government; percent of GDP unless otherwise indicated) 2008 2009 2010 2011 2012(e)
Revenues and Grants 52.1 35.7 43.2 50.2 46.0
Of which: Oil 42.1 25.0 32.8 40.1 37.5
Of which: Non-Oil 10.0 10.7 10.4 10.1 8.5
Expenditures 54.7 41.1 35.3 38.7 36.5
Current Expenditures 40.2 28.3 25.7 29.8 26.4
Of which: Subsidies 7.2 6.1 6.6 8.1 4.8
Of which: Other Transfers (incl. to Sonangol) 15.5 4.1 1.5 1.7 1.7
Capital Expenditures 14.5 12.8 9.6 8.9 10.1
Primary Fiscal Balance -2.6 -5.4 7.9 11.5 9.6
Non-Oil Primary Fiscal Balance* -106.1 -56.2 -48.3 -55.6 -51.6
Overall Fiscal Balance -4.6 -7.6 6.8 10.5 8.6
Memorandum Items (Annual Percent Change, Nominal)
Revenues -35.6 59.2 44.9 4.1
Current Expenditures -33.9 19.3 44.8 0.5
Capital Expenditures -16.7 -1.3 15.3 29.0 Notes: (e) = estimate. * = Percent of non-oil GDP.
Source: Angolan authorities and World Bank staff estimates.
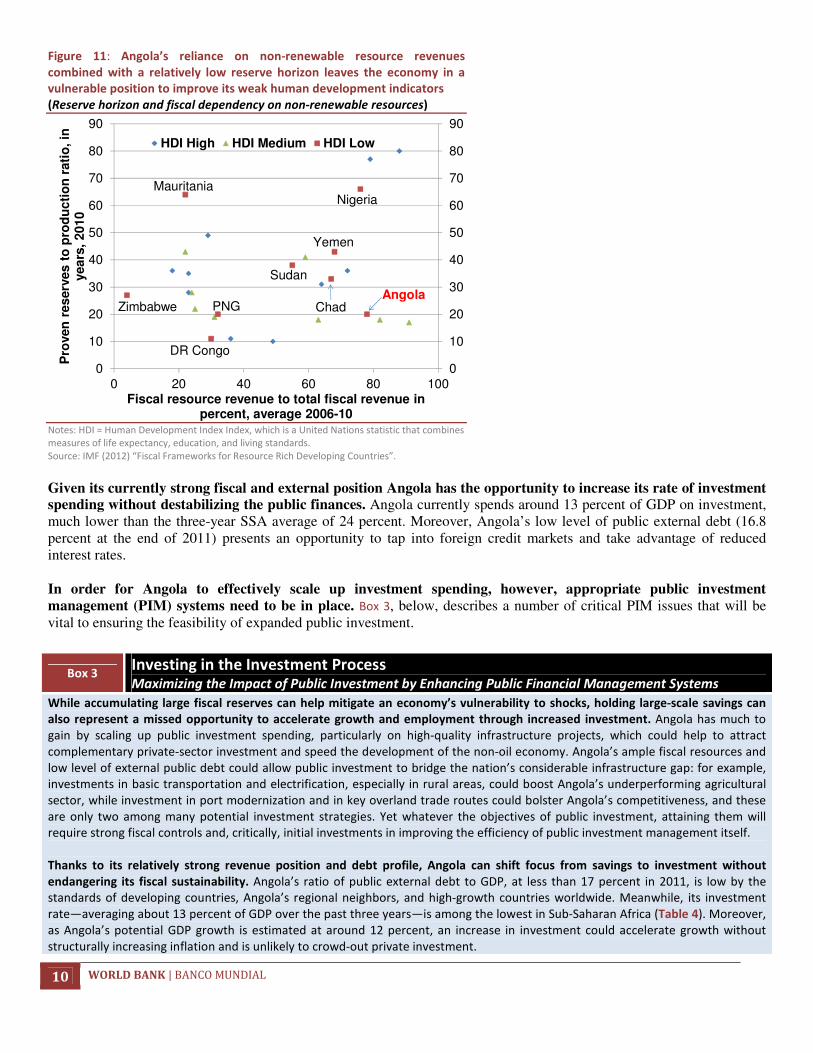
Angola faces the dual challenge of being highly dependent on oil revenues while having a relatively short oil-reserve horizon. Figure 11 highlights Angola’s extreme fiscal dependency on the resource sector against its comparatively low proven natural resource wealth. Angola currently derives around 80 percent of its public revenue from the oil sector, and annual spending is highly correlated with annual oil revenues (with a correlation coefficient of over 0.6), highlighting the country’s fiscal sensitivity to volatile oil markets. Fortunately Angola has available a number of options that can bolster long-term fiscal sustainability of the budget, including the expansion of the non-oil tax base through administrative reforms and economic diversification to increase non-oil revenues, which are currently less than 9 percent of GDP. Alongside Angola’s high dependence on oil revenues, the horizon of proven natural resource reserves (reserves/production) is relatively low in comparison with other resource-rich countries.
10 WORLD BANK | BANCO MUNDIAL
Figure 11: Angola’s reliance on non-renewable resource revenues
combined with a relatively low reserve horizon leaves the economy in a
vulnerable position to improve its weak human development indicators
(Reserve horizon and fiscal dependency on non-renewable resources)
Notes: HDI = Human Development Index Index, which is a United Nations statistic that combines
measures of life expectancy, education, and living standards.
Source: IMF (2012) “Fiscal Frameworks for Resource Rich Developing Countries”.
Given its currently strong fiscal and external position Angola has the opportunity to increase its rate of investment spending without destabilizing the public finances. Angola currently spends around 13 percent of GDP on investment, much lower than the three-year SSA average of 24 percent. Moreover, Angola’s low level of public external debt (16.8 percent at the end of 2011) presents an opportunity to tap into foreign credit markets and take advantage of reduced interest rates. In order for Angola to effectively scale up investment spending, however, appropriate public investment management (PIM) systems need to be in place. Box 3, below, describes a number of critical PIM issues that will be vital to ensuring the feasibility of expanded public investment.
0
10
20
30
40
50
60
70
80
90
0
10
20
30
40
50
60
70
80
90
0 20 40 60 80 100
Pro
ven
res
erv
es
to
pro
du
cti
on
rati
o,
in
yea
rs,
201
0
Fiscal resource revenue to total fiscal revenue in percent, average 2006-10
HDI High HDI Medium HDI Low
Angola
Mauritania
Zimbabwe
Nigeria
Yemen
Sudan
PNG
DR Congo
Chad
Box 3 Investing in the Investment Process Maximizing the Impact of Public Investment by Enhancing Public Financial Management Systems
While accumulating large fiscal reserves can help mitigate an economy’s vulnerability to shocks, holding large-scale savings can
also represent a missed opportunity to accelerate growth and employment through increased investment. Angola has much to
gain by scaling up public investment spending, particularly on high-quality infrastructure projects, which could help to attract
complementary private-sector investment and speed the development of the non-oil economy. Angola’s ample fiscal resources and
low level of external public debt could allow public investment to bridge the nation’s considerable infrastructure gap: for example,
investments in basic transportation and electrification, especially in rural areas, could boost Angola’s underperforming agricultural
sector, while investment in port modernization and in key overland trade routes could bolster Angola’s competitiveness, and these
are only two among many potential investment strategies. Yet whatever the objectives of public investment, attaining them will
require strong fiscal controls and, critically, initial investments in improving the efficiency of public investment management itself.
Thanks to its relatively strong revenue position and debt profile, Angola can shift focus from savings to investment without
endangering its fiscal sustainability. Angola’s ratio of public external debt to GDP, at less than 17 percent in 2011, is low by the
standards of developing countries, Angola’s regional neighbors, and high-growth countries worldwide. Meanwhile, its investment
rate—averaging about 13 percent of GDP over the past three years—is among the lowest in Sub-Saharan Africa (Table 4). Moreover,
as Angola’s potential GDP growth is estimated at around 12 percent, an increase in investment could accelerate growth without
structurally increasing inflation and is unlikely to crowd-out private investment.

ANGOLA ECONOMIC UPDATE | June 2013 11
8 The list of key PIM features is adapted from Rajaram et al. (2008) via Ley (2010). See also: Harberger (2005) and Petrie (2009).
Table 4: Angola has a very low rate of investment compared to most countries in Sub-Saharan Africa, along with a relatively
low ratio of public external debt to GDP
(Key economic indicators, metrics as indicated)
Public External
Debt
% of GDP
(a)
Real GDP
Growth
(b)
Investment
% of GDP
(b)
National
Savings
% of GDP
(b)
Current
Account
% of GDP
(b)
Growth
Premium
(c)
Investment
Premium (d)
Angola 16.8 5.0 12.6 21.5 9.0
Congo, DR. 25.2 7.1 23.8 13.1 -10.7 YES YES
Cote d’Ivoire 40.7 2.5 10.3 14.8 4.5
Ethiopia 26.2 7.5 26.1 22.0 -3.1 YES YES
Ghana 18.9 9.8 20.2 10.1 -10.2 YES YES
Mozambique 28.3 7.3 34.1 11.0 -23.1 YES YES
Niger 18.3 8.0 43.4 22.7 -20.7 YES YES
Nigeria 2.4 7.2 23.5 28.9 5.4 NO NO
Rwanda 15.2 7.7 22.2 14.2 -8.0 NO NO
Sierra Leone 33.0 10.4 26.4 -4.7 -31.0 YES YES
South Africa 11.4 3.0 19.4 15.5 -4.2 YES
Uganda 17.6 4.9 23.8 13.0 -10.9 YES YES
Zambia 7.2 7.3 24.8 26.5 1.7 NO YES
Avg.of Selected SSA 20.1 6.7 23.9 16.0 -7.8 YES YES
Notes: (a) Level at end of 2011; (b) Three-year average, 2010-2012.
(c) Of those countries with higher average real GDP growth than Angola, is the ratio of public external debt to GDP higher?
(d) Of those countries with a higher average investment rate than Angola, is the ratio of public external debt to GDP higher?
Sources: World Bank’s World Development Indicators (WDI), IMF World Economic Outlook April 2012, and World Bank staff estimates.
Angola is in an excellent position to increase investment spending without exposing the economy to excessive risk; however, the
ultimate impact of an expanded public investment program will depend on the quality of the government’s PIM systems. Building
the necessary administrative and institutional capacity to effectively scale up investment spending will help to ensure that financing
is directed to projects that further the government’s development goals, that these projects are executed efficiently and
transparently, and that monitoring and evaluation mechanisms are in place to review performance and incorporate lessons learned
into the design of subsequent projects.
The international experience8 highlights several key features of a well-functioning PIM system. Taken together, these comprise
the fundamental institutional framework necessary to maximize the returns to public investment and ensure the essential
efficacy and transparency of PIM:
•••• Investment Guidance and Preliminary Screening: Broad strategic guidance for public investment is important to anchor
government decisions and guide sector-level decision-makers. This guidance may be derived from the national development
plan or a medium- or long-term strategic document that establishes clear economy-wide policy priorities. A first-level screening
of all project proposals can help to ensure that they are consistent with these strategic goals and that they meet the budget-
classification tests for inclusion as a project rather than as a recurrent spending item.
•••• Formal Project Appraisal: Projects or programs that pass the initial screening should undergo more rigorous scrutiny of their
cost effectiveness. The project selection process must ensure that projects proposed for financing have been evaluated based
on their social and economic value. The quality of ex-ante project evaluation depends on the quality of this analysis, which in
turn depends on the capacity of the staff and on their project-evaluation skills. Consequently, investing in project-evaluation
training is an important aspect of an effective PIM system.
•••• Independent Review of Appraisal: Where departments and ministries (rather than a central unit) undertake the appraisal an
independent peer review might be necessary in order to check any subjective, self-serving bias in the evaluation. It is crucial to
kill bad projects before they develop a strong constituency—even the worst projects have beneficiaries and promoters.
12 WORLD BANK | BANCO MUNDIAL
The authorities have recently enacted important reforms designed to enhance the management of the public finances. Following the onset of the global financial crisis the government has implemented a number of key measures to increase the transparency of oil revenues and reduce quasi-fiscal operations (QFOs) by state-owned enterprises.9 Between January and October 2011 alone QFOs by Sonangol were estimated to have amounted to US$7.7 billion, seriously undermining the execution, accounting and overall integrity of fiscal policy. Incorporating these QFOs into the budget is an important step in consolidating the fiscal accounts. The authorities have also improved the collection and reporting of oil revenues and related transfers by completing a flow-of-funds report, which is expected to improve transparency and accountability in the management of oil revenues, as well as reducing the uncertainty of revenue flows from Sonangol. Further public financial management reforms will help to reduce the vulnerability of the budget and improve the efficiency of public spending. Going forward, the government should consider moving towards a medium-term fiscal framework (MTFF). Currently, macroeconomic policy decisions are limited to a one-year horizon, meaning spending programs in annual budgets are determined only by the revenue prospects for the coming year. Despite the government’s adoption of a conservative approach to specifying the oil-export prices on which revenue projections are based this system can still yield sharp vacillations in spending, which can prove unsustainable in the long run. A superior approach would be to establish annual ceilings for public expenditures on medium-term revenue forecasts based on a long-run oil price. Under this approach, consistent fiscal surpluses could be generated over time so that financial reserves could be accumulated when oil revenues are high to sustain spending commitments when oil revenues eventually fall. An MTFF can also help to reduce the procyclical bias of Angola’s fiscal policy, and mitigate the domestic economy’s vulnerability to fluctuations in global oil prices. An MTFF could also allow for greater coordination of macroeconomic policy between the Ministry of Finance, the BNA, and the National Statistics Institute (Instituto Nacional de Estatística—INE). The recent establishment of a sovereign wealth fund (SWF) represents very important development in terms of Angola’s fiscal policy and expenditure planning. The SWF could serve as a pillar of macroeconomic stability by insulating the annual budget from volatile oil-revenue inflows. The initial size of the fund will be US$5 billion, with the funds to be invested both internationally and domestically. However, the government has yet to specify the primary
9 Financial operations by state-owned enterprises that impact the overall fiscal balances, but are not recorded in the budget.
•••• Project Selection and Budgeting: The process of appraising and selecting public investment projects should be linked to the
budget cycle. The fiscal framework and the annual budget must establish envelopes for public investment to ensure that project
financing is sustainable. Efficient investment also depends on whether the recurrent budget is adjusted to reflect the fiscal
impact of capital projects.
•••• Project Implementation: Project design should include clear organizational arrangements and a realistic timetable to ensure that
adequate institutional capacity is available to implement the project.
•••• Project Adjustment: The funding review process should have some flexibility in the disbursement profile to account for changes
in project circumstances. Each funding request should be accompanied by an updated cost-benefit analysis and a reminder to
the project’s sponsors of their accountability for the project’s outcome. These funding mechanisms can reinforce the monitoring
process, making it an active rather than a passive exercise. Governments need to create the capacity to monitor implementation
in a timely way and to address problems proactively as they are identified.
•••• Facility Operation: Asset registries must be maintained and should include clearly defined asset values and ownership rights.
Ideally, governments should require their operating agencies to compile balance sheets on which the value of assets created
through new fixed-capital expenditures can be recorded.
•••• Ex-Post Project Evaluation: The evaluation of completed projects should focus on comparing the project’s outcome against its
original objectives. Good-practice principles suggest that the project’s evaluation criteria should be included in its design and
that the lessons learned from ex-post evaluations should inform further improvements to the entre PIM process.
Enhanced PIM systems will be critical to ensure that scaling-up public investment delivers the maximum returns to productivity
and growth. In Angola, enhancing PIM will require that the government focus on building its capacity to conduct technically sound
and politically independent project tender, appraisal and selection processes based on the general good-practice principles
described above. Transparency and accountability in PIM systems is vital to ensure that resources are directed to their most valuable
use and that expanded public investment delivers the maximum impact on economic growth.

ANGOLA ECONOMIC UPDATE | June 2013 13
objectives and administrative structure of the fund, or detail its relationship to key macroeconomic institutions and major policy tools. The most important elements of an SWF are the rules and governance arrangements that safeguard the fund and manage its inherent risks. Box 4, below, describes the issues surrounding the SWF in greater detail, drawing on the international experience in successfully managing natural-resource revenues.
Box 4 Treating Resource Wealth As If It Belonged to Your Children The Fundo Soberano de Angola (FSDEA): Angola’s Sovereign Wealth Fund
A Sovereign Wealth Fund (SWF) can be an effective policy tool to manage large and volatile revenues from extractive
industries. SWFs can cushion fluctuations in commodity prices, stabilizing public spending and mitigating the fiscal and
economic impacts of external shocks; SWFs can also hold long-term savings, offsetting the depletion of natural capital and
promoting intergenerational equity; or they can serve a range of more specific policy purposes. Developed in the 1950s to
manage revenues from extractive industries in resource-rich countries such as Kuwait and Kiribati, SWFs rose to prominence in
the 1990s after Norway established an SWF, which allocated a portion of the country’s oil revenues to finance its social-security
liabilities. By 2012 SWFs around the world had grown to over US$5.2 trillion, 57 percent of which represents revenues from oil
and gas industries. Table 5 describes four types of SWF currently in use by both advanced and developing economies to support
a variety of specific objectives.
Table 5: Four Types of Sovereign Wealth Fund
Objective Type of Fund Country
Smooth budgetary cycles Stabilization
Fund
Ghana, Iran, Mexico, Russia, Peru,
Trinidad and Tobago, Brazil.
Promote intergenerational equity Future Fund Australia, Botswana, East Timor, Kuwait,
United States (Alaska), Iran.
Invest in revenue-generating capital to offset the
eventual depletion of resources
Endowment
Fund
United Arab Emirates (Abu Dhabi), Chile,
Russia.
Meet long-term contingent liabilities, maximize returns
on government financial assets, etc.
Special Purpose
Fund
Norway, Singapore, China, Chile, Korea,
New Zealand, Malaysia.
Source: World Bank staff.
In October 2012 the Government of Angola launched its own SWF, the Fundo Soberano de Angola (FSDEA). The authorities
have stated that the FSDEA—with an initial endowment of US$5 billion to be topped up by revenues accrued from the sale of
100,000 barrels of oil per day, about US$3.5 billion per year at current prices—will be used to save and invest Angola’s oil
revenues and stabilize the economy against fluctuations in global oil prices, suggesting that the FSDEA could perform a dual
function as both an endowment and a stabilization fund. However, at present the FDSEA’s primary mandate remains unclear
and a detailed description of the FSDEA’s objectives and operational rules has not yet been made public. Moreover, it is
uncertain what the FSDEA’s relationship will be with the country’s Petroleum Fund (Fundo Petrolífero), which was established
in 2011 with an initial capitalization of US$7 billion under the management of the BNA and shares a similar set of broad
objectives.10
Going forward it will be essential that the government clarify the SWF’s institutional mechanisms and governing
regulatory framework as well as a precise description of its place within the government’s broader strategy for managing oil
revenues, including its relationship to the Petroleum Fund, its role in the medium-term fiscal framework, and its potential
impact on the BNA’s stock of foreign reserves.
Angola’s FSDEA could serve as an important policy tool to guard against volatility in global oil prices, decouple public
expenditures from commodity price movements, and promote sustainable development outside the resource sector.
However, an SWF is only as good as its operational design and the integrity of its management. Determining how resources are
allocated to the FSDEA, how its reserves are managed, and under what circumstances and rules the government can draw upon
the fund for fiscal stabilization or other approved purposes will be critical to its efficacy. The FSDEA’s institutional and
regulatory framework should include guidance on how to coordinate the fund’s operations with monetary and fiscal policy,
10 The fund will ostensibly be capitalized using revenues accrued from the sale of 100,000 barrels of oil per day (about US$3.5 billion per year at current prices); this is the same amount that will be managed by the BNA under the Petroleum Fund. In March 2011 the government announced that the Petroleum Fund’s objective was to channel oil revenues to infrastructure spending, yet the current status of the fund remains unclear.

14 WORLD BANK | BANCO MUNDIAL
maximizing its contribution to macroeconomic stability, and the government will need to clarify how the SWF will be accounted
for in the fiscal and external accounts. Fiscal rules can help to anchor the annual budget process, channeling savings to the SWF
when commodity prices are high and drawing upon those foreign reserves when commodity prices are low. Fiscal rules can also
increase the transparency of the budget, as long as they are simple, clear, and easily to monitor. Finally the international
experience suggests that it is important that the government adheres to these rules, as the reputational effects of consistent,
predictable SWF operations are essential to its value as a policy tool.
Effectively managing the composition of Angola’s SWF will require a prudent investment strategy that balances the
authorities’ risk tolerance with the objectives of the fund, including expected returns. Typically, SWFs have a long-term
horizon, with a portfolio consisting of investments in equities, fixed income, and commodities. The authorities have indicated
that the FSDEA’s primary focus will be on investing in crucial infrastructure, yet they have also stated that the SWF’s precise
investment strategy has yet to be determined. Whatever course is ultimately chosen, a robust governance structure will be
necessary to ensure sound investment management.
Another major decision facing the Angolan authorities will be to determine the proportion of the nation’s resource revenues
that should be invested in immediate development efforts and the proportion allocated to long-term savings. This decision
will need to balance the immediate priorities of promoting immediate growth, employment and poverty reduction through
investments in basic infrastructure and social services with building sufficient savings to provide for the economy’s post-oil
future. Whether the SWF will be used to stabilize fluctuations over the business cycle or to ensure intergenerational equity by
providing a future income stream via dividends on long-term assets reflects a tradeoff between investment and savings, and
between immediate consumption and future consumption.
The international experience shows that getting these decisions, regulatory frameworks, and institutional structures right
can yield significant benefits for a resource-rich economy. Botswana and Chile are two examples of how a well-designed SWF
can transform a nation’s natural resources into valuable productive capital, facilitating sustainable economic growth and
avoiding many of the adverse effects to which developing countries with abundant natural resources are often subject. Both
Botswana and Chile have enjoyed strong real GDP growth rates averaging around 5 percent annually over the past two
decades, as well as investment rates of around 25-30 percent of GDP and low, manageable inflation. Through their SWFs they
accrued large-scale reserves during commodity booms in the mid-2000s, which they were able draw upon to finance
countercyclical fiscal policies to mitigate the impact of the global financial crisis later in the decade. However, it is important to
recognize that the economic success of these two countries was driven in large part by their strong governance and robust
institutions, rather than as an immediate consequence of their natural resource wealth. The lesson for other resource-rich
developing nations such as Angola is that fostering reliable institutions and sound governance is critical to harnessing the
development opportunities offered by natural-resource wealth.
Balance of Payments: A Comfortable yet Vulnerable Surplus
The recent recovery in the oil sector has driven the balance of payments (BoP) back into surplus. Following the sharp decreases in production and global prices in 2008-09, rising production volumes and rebounding oil prices have now pushed the trade surplus to above pre-crisis levels. Yet despite its status as a crude-oil producer, Angola relies heavily on imports of processed fuels, as well as imported food. Strong growth in domestic consumption and construction activity has increased demand for imports, narrowing the current-account surplus. With the economy rebounding, rising net capital inflows—including foreign direct investment (FDI) to both the oil and non-oil sectors—have boosted international reserves. Reserves are now at two and a half times their levels during the global crisis, sufficient to cover 7.4 months of imports, which compares favorably to Angola’s neighbors in SSA and to oil-exporting countries worldwide. The current-account surplus narrowed in 2012 due to rising consumer and capital goods imports and services
related to the oil sector. Angola’s current account is estimated to have registered a surplus of US$7.5 billion in 2012 (6.7
percent of GDP), down from a very high surplus of US$11.3 billion (11.2 percent of GDP) in 2011. The narrowing of the
current-account surplus is mainly explained by developments in the trade balance (Figure 12). Nevertheless, the services
and income deficits also widened due to increasing freight and insurance, as well as rising business services related to oil
products and greater repatriation of oil profits by local subsidiaries to foreign-owned parent companies (Figure 13).

ANGOLA ECONOMIC UPDATE | June 2013 15
Figure 12: Oil prices remain pivotal to Angola’s external
accounts, with changes in prices driving changes in the
trade balance and current account…
(US$ oil price; goods trade and current account in US$
millions)
Figure 13: …which in turn drive fluctuations in the BoP,
while financial account flows remain much smaller than
trade flows.
(Balance of Payments by component, US$ billions)
Source: Angolan authorities and World Bank staff estimates.
Export volumes are recovering as oil production continues to increase. After several years of weak growth, goods and services export volumes are estimated to have grown by 5.5 percent in 2012, up from 0.3 percent in 2011. Strong global demand for oil products supported the rise in export volumes, as did increases in production capacity. Much of this demand has come from large emerging markets such as China and India, with exports to China now accounting for 50 percent of Angola’s total goods exports. By contrast, exports to major traditional trading partners contracted. Imports increased in line with developments in the oil sector and rising investment activity. Import volumes are estimated to have grown by 11.2 percent in 2012, more than doubling their 2011growth rate of 4.7 percent. The rise in imports is due to the expansion of fixed-capital imports related to oil production and consumer-goods imports financed by oil-related income. In addition, over a quarter of imports are business services related to the oil sector, and imports have largely tracked fluctuations in oil-sector revenue. Imports are also dependent on the strength of domestic demand. Recent growth in public investment and private consumption has also increased the demand for imports. Consumer goods accounted for around half of the growth in goods imports in 2012. International reserves grew by US$4.5 billion in 2012 to reach US$30.6 billion. Following a steep drop in reserves of US$11.3 billion (equivalent to 3.2 months of imports) in 2009, the current-account surplus has supported a robust recovery of reserves (Table 6), which are now sufficient to cover 7.4 months of imports, the third highest import coverage in SSA, after South Africa and Nigeria, and significantly higher than the average for oil-exporting countries (5.2 months).11
11 Oil-exporting countries (excluding Saudi Arabia) comprise Russia, Iraq, Nigeria, Norway, Kuwait, Netherlands, Venezuela, Canada and the US. Saudi Arabia had coverage of over 32 months of imports in 2011.
-10
-5
0
5
10
15
20
0
20
40
60
80
100
120
140
Mar-08 Mar-09 Mar-10 Mar-11 Mar-12
Angolan Oil Price (LHS) Goods Trade (RHS) Current Account (RHS)
millions US$US$
6
-5
6 85
-50
-40
-30
-20
-10
0
10
20
30
40
50
60
2008 2009 2010 2011 2012(e)
Goods Services Income Fin Acc BOP
Table 6: Angola’s BoP continues to be driven by developments in
the trade surplus, while financial flows remain relatively small
(Balance of payments, US$ billions)
2009 2010 2011 2012(e)
Balance of Payments -5.2 6.2 8.5 4.5
Current Account -7.6 7.5 11.3 7.5
Trade Balance 18.3 33.9 46.8 45.9
o/w Oil 35.1 45.5 61.1 62.7
Services Balance -18.6 -17.9 -23.1 -25.2
Income Balance -6.8 -8.2 -11.9 -12.7
Transfers Balance -0.4 -0.4 -0.5 -0.5
Capital and
Financial Account
2.3 -1.3 -2.8 -3.0
Foreign Reserves 11.3 17.4 26.0 30.6 Note: (e) = estimate.
Source: Angolan authorities and World Bank staff estimates.
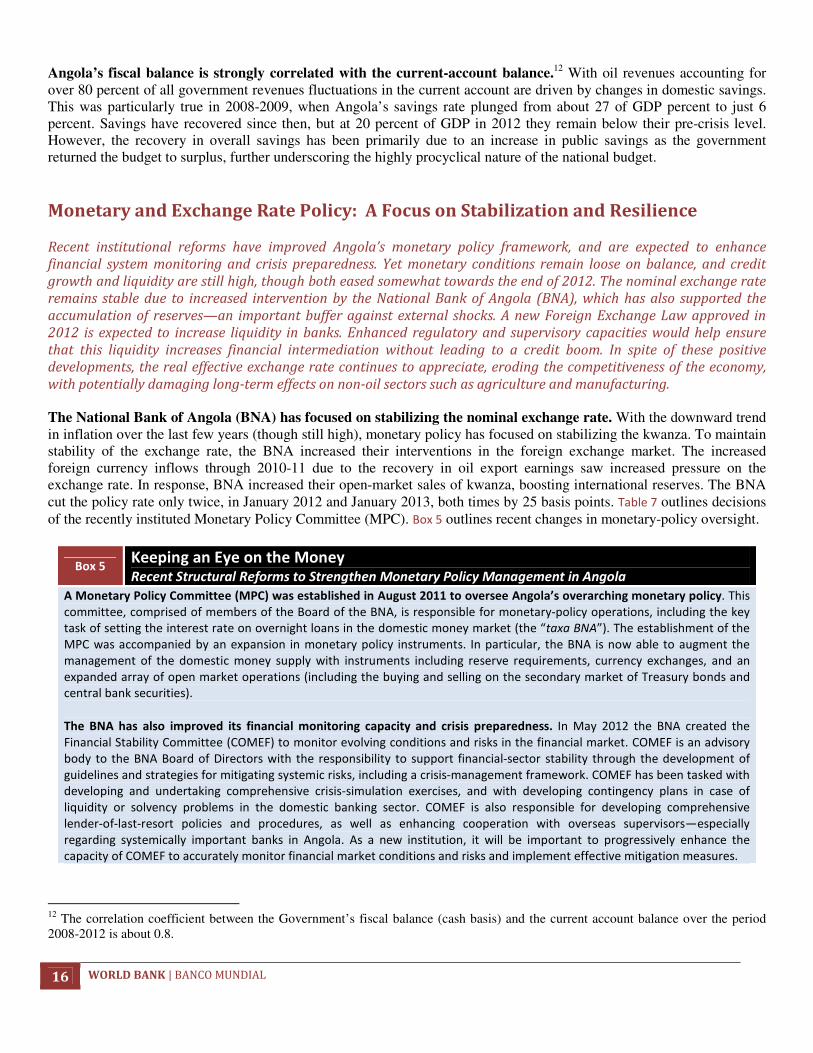
16 WORLD BANK | BANCO MUNDIAL
Angola’s fiscal balance is strongly correlated with the current-account balance.12 With oil revenues accounting for over 80 percent of all government revenues fluctuations in the current account are driven by changes in domestic savings. This was particularly true in 2008-2009, when Angola’s savings rate plunged from about 27 of GDP percent to just 6 percent. Savings have recovered since then, but at 20 percent of GDP in 2012 they remain below their pre-crisis level. However, the recovery in overall savings has been primarily due to an increase in public savings as the government returned the budget to surplus, further underscoring the highly procyclical nature of the national budget.
Monetary and Exchange Rate Policy: A Focus on Stabilization and Resilience
Recent institutional reforms have improved Angola’s monetary policy framework, and are expected to enhance financial system monitoring and crisis preparedness. Yet monetary conditions remain loose on balance, and credit growth and liquidity are still high, though both eased somewhat towards the end of 2012. The nominal exchange rate remains stable due to increased intervention by the National Bank of Angola (BNA), which has also supported the accumulation of reserves—an important buffer against external shocks. A new Foreign Exchange Law approved in 2012 is expected to increase liquidity in banks. Enhanced regulatory and supervisory capacities would help ensure that this liquidity increases financial intermediation without leading to a credit boom. In spite of these positive developments, the real effective exchange rate continues to appreciate, eroding the competitiveness of the economy, with potentially damaging long-term effects on non-oil sectors such as agriculture and manufacturing. The National Bank of Angola (BNA) has focused on stabilizing the nominal exchange rate. With the downward trend in inflation over the last few years (though still high), monetary policy has focused on stabilizing the kwanza. To maintain stability of the exchange rate, the BNA increased their interventions in the foreign exchange market. The increased foreign currency inflows through 2010-11 due to the recovery in oil export earnings saw increased pressure on the exchange rate. In response, BNA increased their open-market sales of kwanza, boosting international reserves. The BNA cut the policy rate only twice, in January 2012 and January 2013, both times by 25 basis points. Table 7 outlines decisions of the recently instituted Monetary Policy Committee (MPC). Box 5 outlines recent changes in monetary-policy oversight.
Box 5 Keeping an Eye on the Money Recent Structural Reforms to Strengthen Monetary Policy Management in Angola
A Monetary Policy Committee (MPC) was established in August 2011 to oversee Angola’s overarching monetary policy. This
committee, comprised of members of the Board of the BNA, is responsible for monetary-policy operations, including the key
task of setting the interest rate on overnight loans in the domestic money market (the “taxa BNA”). The establishment of the
MPC was accompanied by an expansion in monetary policy instruments. In particular, the BNA is now able to augment the
management of the domestic money supply with instruments including reserve requirements, currency exchanges, and an
expanded array of open market operations (including the buying and selling on the secondary market of Treasury bonds and
central bank securities).
The BNA has also improved its financial monitoring capacity and crisis preparedness. In May 2012 the BNA created the
Financial Stability Committee (COMEF) to monitor evolving conditions and risks in the financial market. COMEF is an advisory
body to the BNA Board of Directors with the responsibility to support financial-sector stability through the development of
guidelines and strategies for mitigating systemic risks, including a crisis-management framework. COMEF has been tasked with
developing and undertaking comprehensive crisis-simulation exercises, and with developing contingency plans in case of
liquidity or solvency problems in the domestic banking sector. COMEF is also responsible for developing comprehensive
lender-of-last-resort policies and procedures, as well as enhancing cooperation with overseas supervisors—especially
regarding systemically important banks in Angola. As a new institution, it will be important to progressively enhance the
capacity of COMEF to accurately monitor financial market conditions and risks and implement effective mitigation measures.
12 The correlation coefficient between the Government’s fiscal balance (cash basis) and the current account balance over the period 2008-2012 is about 0.8.

ANGOLA ECONOMIC UPDATE | June 2013 17
Table 7: Monetary policy has been conservative, with the MPC making relatively few adjustments
(Key Monetary Policy Committee decisions, 2011 – 2012)
Month Decision
October 2011 Establish the BNA base interest rate at 10.5 percent.
January 2012
Reduced the base interest rate to 10.25 percent, and cut the reserve requirement ratio and
rediscount rate by 500 basis points each (from 25 percent to 20 percent for both).
Passed the new Foreign Exchange Law for oil companies.
February 2012 Maintained the taxa BNA at 10.25 percent, but reduced the Lending Facility Liquidity interest rate
by 0.5 percentage points, from 12.5 percent to 12 percent.
May 2012
Maintained the taxa BNA at 10.25 percent, but reduced the Lending Facility Liquidity interest rate
from 12 percent to 11.75 percent and the Absorption Facility Liquidity interest rate from 2 percent
to 1.5 percent.
January 2013 Reduced the base interest rate by 25 basis points to 10.0 percent, highlighting a record low inflation
rate.
Source: National Bank of Angola (BNA).
The policy focus on maintaining a stable exchange rate has allowed for growth in credit and liquidity, though both have moderated recently due to the new Foreign Exchange Law. Credit to the economy grew by 24 percent in 2012, and was mainly directed to the extractive industries, construction, and manufacturing sectors. Overall credit growth was driven by an expansion in local-currency credit, which expanded by 55 percent in 2012. Liquidity growth (M313), which had been as high as 20 percent in real terms, fell to negative growth of 1 percent in December 2012, driven by a contraction in real foreign-currency liquidity in preparation for the new foreign-exchange regulations (see Box 6).
Box 6 Getting Over the Greenback Angola’s New Foreign Exchange Law
In an effort to reduce the Angolan economy’s dependence on US Dollars, in January 2012 the Government passed the
Foreign Exchange Law for the Petroleum Sector (Law No. 2/2012). This law is designed to progressively reduce financial
dollarization and generate a large increase in kwanza liquidity, spurring the growth of kwanza-denominated credit to the
private sector and boosting Angola’s currently low rate of investment lending. The law requires oil companies, including the
state-owned oil company Sonangol, to conduct at least 80 percent of their financial transactions related to the procurement of
goods and services through kwanza-denominated accounts in domestic banks by the end of 2013. The law also requires that all
tax obligations and domestic payments (i.e., labor and other input costs) be paid in kwanza.
Since the approval of the law, the ratio of foreign-currency credit to domestic-currency credit (i.e., the dollarization ratio)
has steadily decreased, falling from over 50 percent in April 2011 to about 43 percent in December 2012. In the past the
large share of foreign-currency credit had magnified the economy’s vulnerability to fluctuations in dollar-denominated oil
prices and in the exchange rate. Foreign-currency credit fell from 34 percent of non-oil GDP in October 2010 to 30 percent in
October 2012; domestic-currency credit expanded sharply in 2012, averaging over 55 percent year-on-year growth.
The new Foreign Exchange Law presents both opportunities and risks for the Angolan economy. On one hand, the increase in
kwanza liquidity may increase the scope for financial intermediation and promote innovation in the domestic banking sector,
expanding both overall access to credit and the range of financial products available to domestic borrowers. On the other
hand, the law may also lead to excessive risk-taking by domestic banks if increasing kwanza liquidity creates a credit boom,
which would ultimately weaken banks’ balance sheets.
Improvements in the operational capacity of the BNA and the regulatory structure for commercial banks could help the
financial sector absorb the expansion of domestic-currency liquidity without exacerbating its existing vulnerabilities.
Enhancements in financial-sector oversight and in the supervisory capacity of the BNA, with an emphasis on improved risk-
monitoring, could significantly lessen potential risks arising from the new Foreign Exchange Law. (For more information on
recent developments in the financial sector see the Special Focus Section of this Economic Update.)
13 M3 is the broadest measure of the money supply. It comprises currency, demand deposits, savings deposits, time deposits, other checkable deposits, and traveler’s checks.

18 WORLD BANK | BANCO MUNDIAL
The BNA’s policy of stabilizing the nominal exchange rate has contributed to the appreciation of the real effective exchange rate (REER); the REER may now be misaligned with economic fundamentals, hampering the competitiveness of the non-oil industries. Large foreign currency inflows have not been fully sterilized by the BNA, putting upward pressure on inflation. Between 2009 and 2012 the REER appreciated by about 23 percent (Figure 14). Meanwhile, Angola’s average annual inflation rate over the past four years, though low by historical standards, still exceeded average inflation in the country’s major trading partners by 7-10 percentage points. This contributed to the continued appreciation of the REER over the past decade, with an average appreciation rate of around 12 percent per year since 2004. The rapid appreciation of the REER has significant negative implications for the non-oil economy by eroding the price-competitiveness of Angolan firms.
Figure 14: The real effective appreciation of Angola’s kwanza is eroding
the competitiveness of the economy
(Real effective exchange rate (REER) index, Average Jan-Dec 2010 = 100)
Note: The REER measures the relationship between domestic prices in Angola and foreign
prices (i.e., the prices of Angola’s main trading partners). It accounts for the weighted
average of the inflation rate (price effect) and the evolution of the exchange rate
(currency effect). A higher REER reflects a real effective appreciation of the kwanza.
Source: World Bank staff estimates.
January 200034.7
November 200146.5
March 2010113.5
December 2012140.5
0
20
40
60
80
100
120
140
Percent Change of the REER:
(Average REER, Jan-Dec)
2012 vs. 2011: 9.0%
2012 vs. 2010: 13.9%
2012 vs. 2009: 9.2%
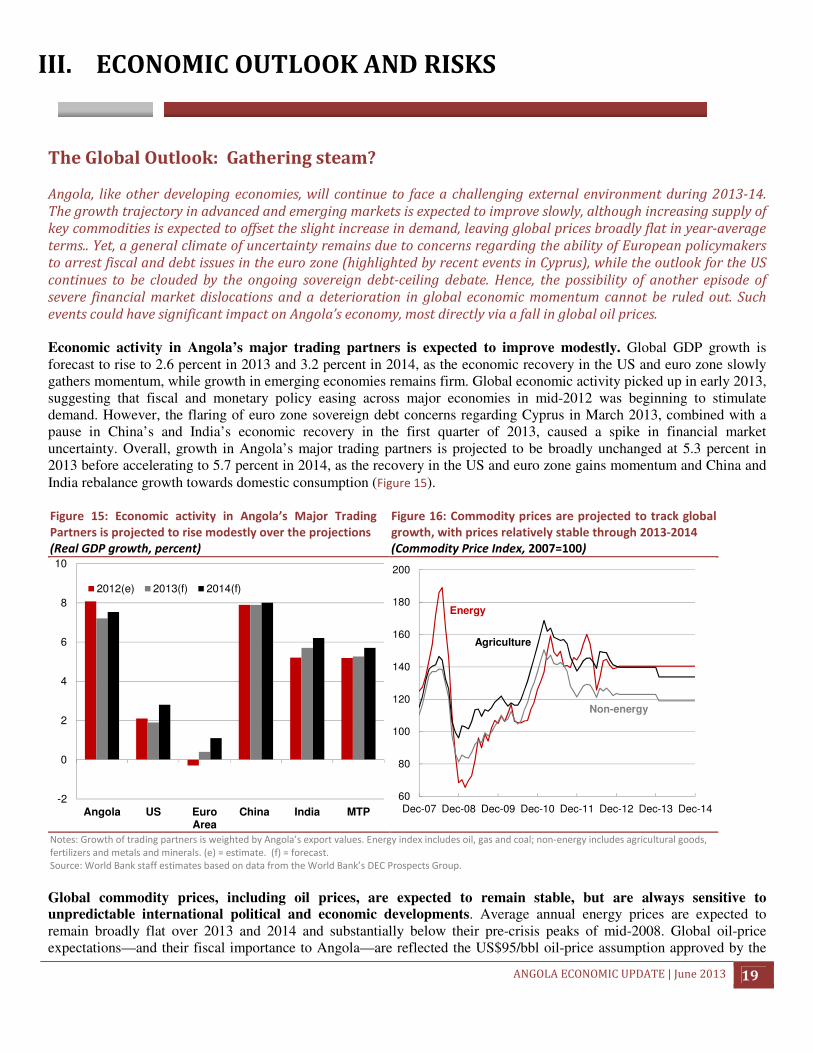
ANGOLA ECONOMIC UPDATE | June 2013 19
III. ECONOMIC OUTLOOK AND RISKS
The Global Outlook: Gathering steam?
Angola, like other developing economies, will continue to face a challenging external environment during 2013-14. The growth trajectory in advanced and emerging markets is expected to improve slowly, although increasing supply of key commodities is expected to offset the slight increase in demand, leaving global prices broadly flat in year-average terms.. Yet, a general climate of uncertainty remains due to concerns regarding the ability of European policymakers to arrest fiscal and debt issues in the euro zone (highlighted by recent events in Cyprus), while the outlook for the US continues to be clouded by the ongoing sovereign debt-ceiling debate. Hence, the possibility of another episode of severe financial market dislocations and a deterioration in global economic momentum cannot be ruled out. Such events could have significant impact on Angola’s economy, most directly via a fall in global oil prices. Economic activity in Angola’s major trading partners is expected to improve modestly. Global GDP growth is forecast to rise to 2.6 percent in 2013 and 3.2 percent in 2014, as the economic recovery in the US and euro zone slowly gathers momentum, while growth in emerging economies remains firm. Global economic activity picked up in early 2013, suggesting that fiscal and monetary policy easing across major economies in mid-2012 was beginning to stimulate demand. However, the flaring of euro zone sovereign debt concerns regarding Cyprus in March 2013, combined with a pause in China’s and India’s economic recovery in the first quarter of 2013, caused a spike in financial market uncertainty. Overall, growth in Angola’s major trading partners is projected to be broadly unchanged at 5.3 percent in 2013 before accelerating to 5.7 percent in 2014, as the recovery in the US and euro zone gains momentum and China and India rebalance growth towards domestic consumption (Figure 15). Figure 15: Economic activity in Angola’s Major Trading
Partners is projected to rise modestly over the projections
(Real GDP growth, percent)
Figure 16: Commodity prices are projected to track global
growth, with prices relatively stable through 2013-2014
(Commodity Price Index, 2007=100)
Notes: Growth of trading partners is weighted by Angola’s export values. Energy index includes oil, gas and coal; non-energy includes agricultural goods,
fertilizers and metals and minerals. (e) = estimate. (f) = forecast.
Source: World Bank staff estimates based on data from the World Bank’s DEC Prospects Group.
Global commodity prices, including oil prices, are expected to remain stable, but are always sensitive to unpredictable international political and economic developments. Average annual energy prices are expected to remain broadly flat over 2013 and 2014 and substantially below their pre-crisis peaks of mid-2008. Global oil-price expectations—and their fiscal importance to Angola—are reflected the US$95/bbl oil-price assumption approved by the
-2
0
2
4
6
8
10
Angola US EuroArea
China India MTP
2012(e) 2013(f) 2014(f)
60
80
100
120
140
160
180
200
Dec-07 Dec-08 Dec-09 Dec-10 Dec-11 Dec-12 Dec-13 Dec-14
Agriculture
Non-energy
Energy

20 WORLD BANK | BANCO MUNDIAL
government as the basis for the 2013 National Budget. Food prices, on the other hand, are expected to remain above their pre-crisis levels, although supply constraints experienced during 2012 (primarily due to reduced US production caused by a prolonged drought in the country’s Midwest region) are expected to ease in 2013, and food prices should contract slightly (Figure 16). Energy prices remain susceptible to shocks to global financial markets and are sensitive to investor sentiment; issues of particular concern include geopolitical tensions in the Middle East, potential supply-side shocks due to EU and US sanctions on Iran, and ongoing political uncertainty in Libya (see Box 7). Although risks to the global economy have moderated somewhat in recent months, they remain titled toward the downside. Financial-market instability and fiscal consolidation in advanced economies (especially austerity measures in the euro zone) will be recurring sources of downside risk during the foreseeable future. Tensions in the euro zone were highlighted in March with the agreement on a controversial bailout package for Cyprus, and a loss of access to capital markets by vulnerable euro zone countries cannot be ruled out. Although Angola’s economy remains relatively isolated from direct financial-market spillovers, another severe shock to euro-zone banks could be transmitted to the domestic economy through an international credit crunch. Moreover, the US government’s inability to establish a long-term budget policy and the uncertainty generated by a contentious and unpredictable political process could slow or even derail the global recovery. In addition, slowing growth rates in China and India could have negative implications for global growth in general and oil demand in particular. Even in the absence of a full-blown crisis Angola’s external environment is likely to remain characterized by sluggish demand growth and an unstable financial climate.
Box 7 Oil is Well? Recent Developments and Outlook for the Global Oil Market
Over the past 18 months global oil prices have fluctuated within a remarkably tight band at around US$ 105/barrel (bbl).14
These
fluctuations have been driven primarily by geopolitical instability in the Middle East, unresolved European debt issues, and
changing developing-country growth prospects (Figure 17). Price increases in late 2012 were largely driven by ongoing political and
security concerns in the Middle East, on the supply side, coupled with an improving global economic outlook on the demand side.
However, in early 2013 crude prices began to decrease once again as global supply conditions improved. As a result, crude prices
are now roughly 6 percent lower than at the beginning of the year (Figure 18).
On the supply side, the growth of oil production in non-OPEC countries is expected to continue its upward trend. High prices
have prompted expanded investment in exploration—including potential deep-water offshore reserves and shale liquids—as well
as in new extractive technologies to increase output from existing wells. Significant production increases are expected in Brazil, the
Caspian Sea region, and West Africa, which together with the United States and Canada are likely to more than offset production
declines in older fields, such as those in the North Sea region.
Figure 17: World oil demand continues to be
driven by growing demand in emerging markets
(World oil demand growth, mbpd)
Source: IEA and World Bank’s DEC Prospects Group
Figure 18: OECD oil inventories increased over 2012,
stabilizing international oil prices
(Oil prices and OECD oil stocks)
Source: IEA and World Bank’s DEC Prospects Group
14
Figures based on World Bank oil-price averages.
-4
-2
0
2
4
Mar-03 Mar-05 Mar-07 Mar-09 Mar-11 Mar-13
Non-OECD, ex China
China
OECD
2,500
2,600
2,700
2,800
2,900
20
40
60
80
100
120
140
Jan-07 Jan-08 Jan-09 Jan-10 Jan-11 Jan-12 Jan-13
Oil Price (World Bank average)
OECD oil inventories

ANGOLA ECONOMIC UPDATE | June 2013 21
Production by OPEC countries has risen by 1.7 mbpd since the end of 2010 (notwithstanding disruptions in Libya), with Saudi
Arabia accounting for 1.5 mbpd of the net gain. The rise in OPEC production initially reduced its total spare capacity to 3.5 mbpd,
but spare capacity has since returned to 4.8 mbpd, nearly two-thirds of which is in Saudi Arabia. The Saudi government has
promised to keep the world market well-supplied, but expects to continue exporting oil at or above US$100/bbl.
Global oil demand has increased modestly. Worldwide demand grew by less than 0.8 percent, or 0.6 mbpd, in 2012. Japan was the
only OECD economy in which crude oil consumption increased (by 1 mbpd), and this was primarily due to the substantial loss of
nuclear power resulting from the destruction of the Fukushima Reactor during the Tohoku earthquake. Overall oil consumption
among OECD countries has fallen by 10 percent, or almost 5 mbpd, from its 2005 peak. Non-OECD demand remains robust, with
non-OECD countries accounting for almost half of global crude oil consumption and, as of 2012, the entire increase in global
demand.
Nominal oil prices are projected to average US$103/bbl in 2013, and then increase marginally to $105/bbl in 2014 as global
supply adjusts to accommodate moderate demand growth. Over the longer term, real oil prices are projected to decline as a
result of expanding supplies of both conventional and especially unconventional oil, as well as efficiency gains, and substitution
effects spurred by high nominal prices. The assumptions underpinning these projections reflect the upper-end cost of developing
additional oil capacity, notably from oil sands in Canada, which is currently estimated by the industry at about US$80/bbl in
constant 2013 dollars. OPEC is expected to continue to limit oil production in order to keep global prices elevated; however, the
organization will also be wary of letting prices rise too high for fear of incentivizing technological changes in energy markets that
could alter the long-term price of oil.
This forecast is subject to both downside and upside risks. Downside risks include a possible weakening of oil demand if growth
prospects deteriorate sharply, especially among the emerging economies that are driving demand growth. Over the longer term, oil
demand may suffer if the substitution of other types of energy for crude oil accelerates. However, a major oil supply shock could
result in prices spiking by $50 or more; considering the current geopolitical tensions involving a number of key oil producers in the
Middle East and North Africa, such an event cannot be ruled out. The ultimate outcome of a supply shock would depend on
numerous factors, including the severity and duration of the cutback in production, political decisions in consumer countries
regarding the release of strategic oil reserves, changes in the global demand structure, and the response of the OPEC nations. A key
area of uncertainty concerns the reaction of OPEC—and especially Saudi Arabia—to changing global oil demand and the growth of
non-OPEC suppliers. In recent years OPEC has responded to subsequent price declines by cutting supply, but the organization has
not been as willing to intervene when prices increased. As non-OPEC suppliers continue to expand production and demand shifts in
response to persistently elevated prices, the sustainability of this approach may come into question.
Source: World Bank’s DEC Prospects Group.
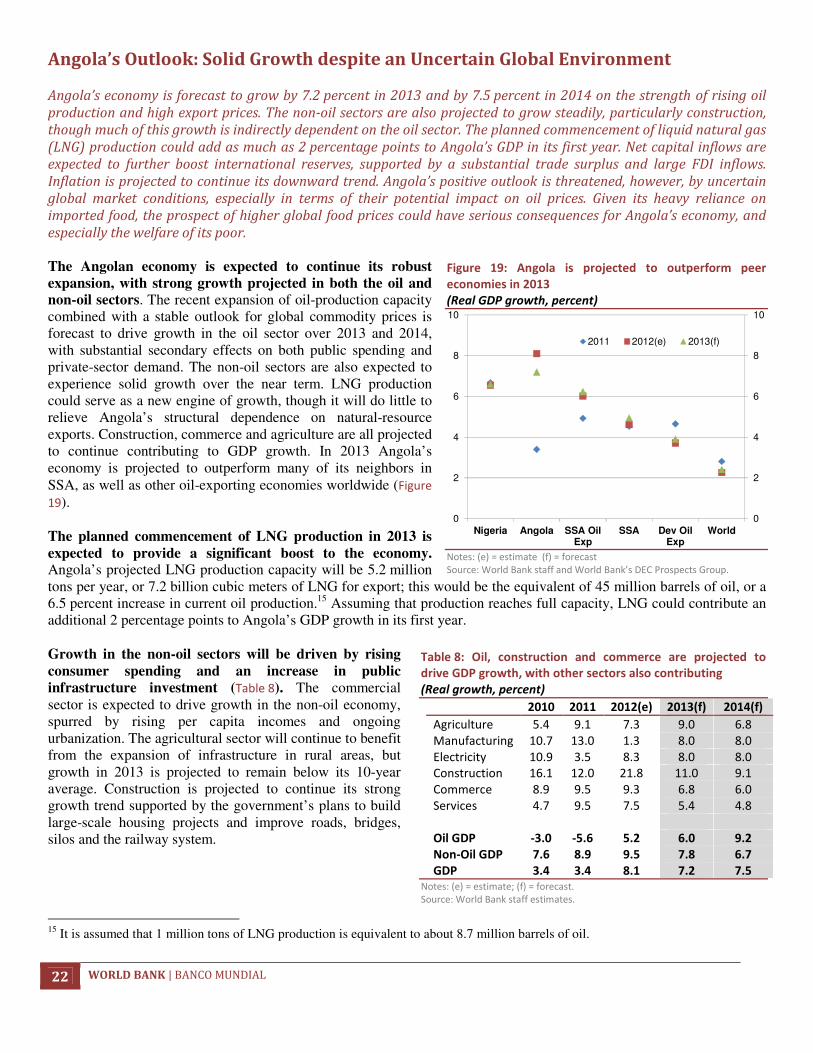
22 WORLD BANK | BANCO MUNDIAL
Angola’s Outlook: Solid Growth despite an Uncertain Global Environment
Angola’s economy is forecast to grow by 7.2 percent in 2013 and by 7.5 percent in 2014 on the strength of rising oil production and high export prices. The non-oil sectors are also projected to grow steadily, particularly construction, though much of this growth is indirectly dependent on the oil sector. The planned commencement of liquid natural gas (LNG) production could add as much as 2 percentage points to Angola’s GDP in its first year. Net capital inflows are expected to further boost international reserves, supported by a substantial trade surplus and large FDI inflows. Inflation is projected to continue its downward trend. Angola’s positive outlook is threatened, however, by uncertain global market conditions, especially in terms of their potential impact on oil prices. Given its heavy reliance on imported food, the prospect of higher global food prices could have serious consequences for Angola’s economy, and especially the welfare of its poor. The Angolan economy is expected to continue its robust expansion, with strong growth projected in both the oil and non-oil sectors. The recent expansion of oil-production capacity combined with a stable outlook for global commodity prices is forecast to drive growth in the oil sector over 2013 and 2014, with substantial secondary effects on both public spending and private-sector demand. The non-oil sectors are also expected to experience solid growth over the near term. LNG production could serve as a new engine of growth, though it will do little to relieve Angola’s structural dependence on natural-resource exports. Construction, commerce and agriculture are all projected to continue contributing to GDP growth. In 2013 Angola’s economy is projected to outperform many of its neighbors in SSA, as well as other oil-exporting economies worldwide (Figure
19). The planned commencement of LNG production in 2013 is expected to provide a significant boost to the economy. Angola’s projected LNG production capacity will be 5.2 million tons per year, or 7.2 billion cubic meters of LNG for export; this would be the equivalent of 45 million barrels of oil, or a 6.5 percent increase in current oil production.15 Assuming that production reaches full capacity, LNG could contribute an additional 2 percentage points to Angola’s GDP growth in its first year. Growth in the non-oil sectors will be driven by rising consumer spending and an increase in public infrastructure investment (Table 8). The commercial sector is expected to drive growth in the non-oil economy, spurred by rising per capita incomes and ongoing urbanization. The agricultural sector will continue to benefit from the expansion of infrastructure in rural areas, but growth in 2013 is projected to remain below its 10-year average. Construction is projected to continue its strong growth trend supported by the government’s plans to build large-scale housing projects and improve roads, bridges, silos and the railway system.
15 It is assumed that 1 million tons of LNG production is equivalent to about 8.7 million barrels of oil.
Figure 19: Angola is projected to outperform peer
economies in 2013
(Real GDP growth, percent)
Notes: (e) = estimate (f) = forecast
Source: World Bank staff and World Bank’s DEC Prospects Group.
Table 8: Oil, construction and commerce are projected to
drive GDP growth, with other sectors also contributing
(Real growth, percent)
2010 2011 2012(e) 2013(f) 2014(f)
Agriculture 5.4 9.1 7.3 9.0 6.8
Manufacturing 10.7 13.0 1.3 8.0 8.0
Electricity 10.9 3.5 8.3 8.0 8.0
Construction 16.1 12.0 21.8 11.0 9.1
Commerce 8.9 9.5 9.3 6.8 6.0
Services 4.7 9.5 7.5 5.4 4.8
Oil GDP -3.0 -5.6 5.2 6.0 9.2
Non-Oil GDP 7.6 8.9 9.5 7.8 6.7
GDP 3.4 3.4 8.1 7.2 7.5
Notes: (e) = estimate; (f) = forecast.
Source: World Bank staff estimates.
0
2
4
6
8
10
0
2
4
6
8
10
Nigeria Angola SSA OilExp
SSA Dev OilExp
World
2011 2012(e) 2013(f)

ANGOLA ECONOMIC UPDATE | June 2013 23
The current-account surplus is expected to narrow slightly. This is consistent with a slight contraction in the trade surplus, as import growth outpaces export growth, until export earnings boost the trade surplus in 2014 in line with the projected acceleration of the global economy. Net capital inflows are expected to contribute to the growth of international reserves, which are projected to cover 9.3 months of imports by end-2014 (Table 9). Inflation is expected to continue its declining trend, although rising world food prices and Angola’s recent drought present significant inflationary risks. Headline inflation is forecast to reach 8.0 percent at the end of 2013 and 7.5 percent by the end of 2014. The stabilization of the nominal exchange rate has contributed to reducing inflationary pressures. However, as the economy strengthens the authorities will need to remain vigilant against the inflationary effects of income growth and the potential pass-through of imported food-price inflation to domestic inflation (see the section on Risk Scenarios, below). The government’s 2013 budget projects a deficit for the first time since 2009. On February 14 the Angolan Parliament approved the first budget deficit since the height of the global financial crisis. This deficit, projected at 3.4 percent of GDP in 2013, will result from a large increase in infrastructure spending. Planned spending is set to rise by 27 percent, though execution capacity may be insufficient to reach this target. Capital expenditures, which are primarily related to new construction and the renovation of infrastructure, are projected to rise by 60 percent. Wages and pension contributions are projected to rise by 38 percent. Revenues are forecast to fall by 4 percent despite an expected increase in oil prices to US$96/bbl and the planned expansion of oil production to 1.9 mbpd. Gross external financing is projected to reach US$8.1 billion, coupled with US$3.0 billion in gross domestic borrowing.
Box 8 The Business Dilemma Angola’s 2013 Doing Business Rankings
A major objective of Angola’s Vision 2025 strategy is to spur employment creation by diversifying the economy. Achieving this
goal will largely depend on the success of efforts to promote private-sector development and ensure that firms operating in
Angola enjoy a favorable business climate. International experience suggests that private firms, particularly small- and medium-
sized enterprises (SMEs) are the primary drivers of job creation, innovation, and competition. For the private sector to thrive, the
regulatory environment should encourage investment in SMEs and facilitate their growth.
There are considerable opportunities to increase private investment in Angola, both in the resource and non-resource sectors,
which could be realized by removing key barriers to investment. Since 2002 the Angolan authorities have made significant
efforts to rebuild the country’s infrastructure and foster robust private-sector development. While these efforts have improved
the country’s business climate, an inefficient regulatory structure continues to impose excessive administrative and transaction
costs, slowing the growth of Angolan firms and diminishing their competitiveness.
The World Bank Group’s 2013 Doing Business (DB) report analyzes business regulation in 185 economies by focusing on ten
dimensions of the business climate (www.doingbusiness.org). The DB report includes an ordinal ranking on the overall ease of
doing business, as well as individual rankings for each dimension of doing business. While the report does not reflect all aspects
of the business environment that matter to firms—for instance, it does not address public security, macroeconomic stability,
infrastructure quality, or official corruption—the rankings provide a useful guide to which countries are relatively business-
friendly and which present a more problematic business climate. The rankings may also reveal important regulatory bottlenecks,
such as the number of days needed to start a business, the procedures required for registering property and obtaining permits,
and the costs associated with paying taxes or setting up an electricity connection.
Angola ranks 172nd
out of the 185 economies in the 2013 DB report, suggesting that its business environment is one of the
least conducive in the world (Figure 20). Compared to the SSA average, Angola performs somewhat better in terms of getting
electricity and protecting investors, and the government has recently implemented business-friendly regulations in key areas,
including starting a business and registering property. Yet, in many other areas such as enforcing contracts, trading across
Table 9: Forecast of key economic indicators for Angola
(Selected indicators, as indicated)
2011 2012(e) 2013(f) 2014(f)
Percent growth
GDP 3.4 8.1 7.2 7.5
Consumer Prices* 11.4 9.0 8.0 7.5
Percent of GDP unless otherwise indicated
Overall Fiscal Balance 10.5 8.6 4.5 4.6
Current Account Balance 11.2 6.7 5.1 5.0
Nominal Exchange Rate** 94.1 95.6 98.5 103.5
Foreign Reserves* 25.8 27.1 29.6 32.3
Note: (e) = estimate; (f) = forecast; * = end of period; ** = Kwanza/US$.
Source: World Bank staff estimates.
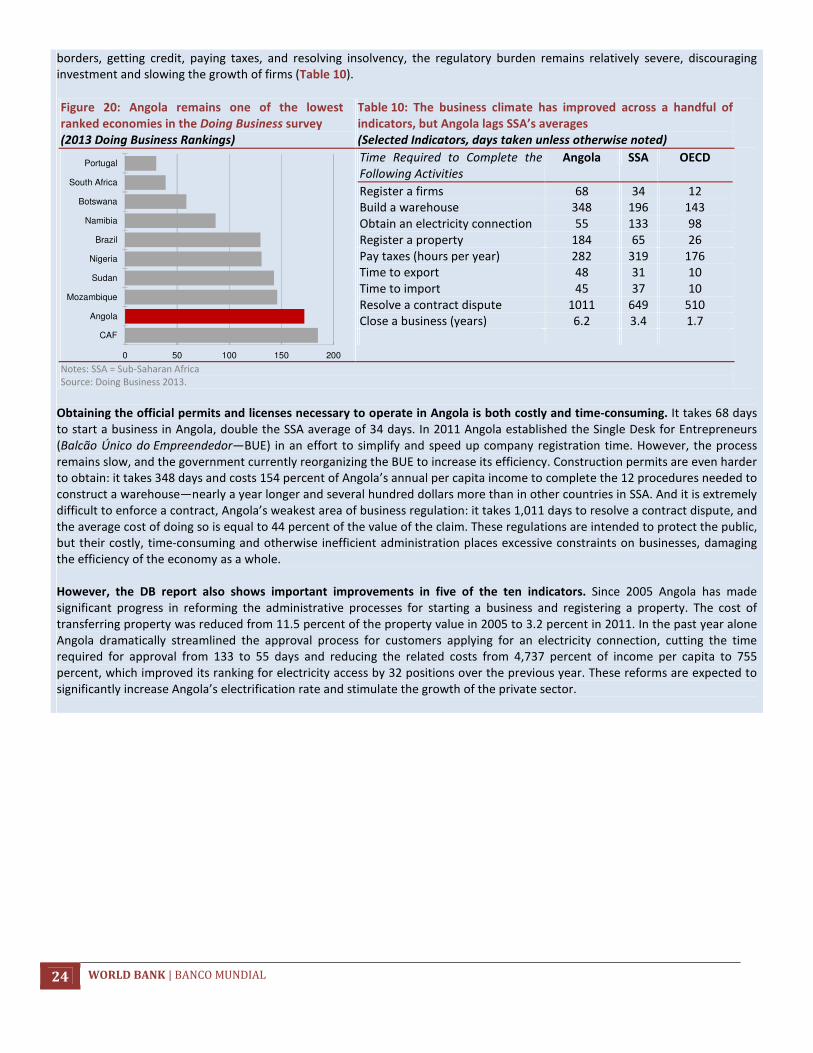
24 WORLD BANK | BANCO MUNDIAL
borders, getting credit, paying taxes, and resolving insolvency, the regulatory burden remains relatively severe, discouraging
investment and slowing the growth of firms (Table 10).
Figure 20: Angola remains one of the lowest
ranked economies in the Doing Business survey
(2013 Doing Business Rankings)
Table 10: The business climate has improved across a handful of
indicators, but Angola lags SSA’s averages
(Selected Indicators, days taken unless otherwise noted)
Time Required to Complete the Following Activities
Angola SSA OECD
Register a firms 68 34 12
Build a warehouse 348 196 143
Obtain an electricity connection 55 133 98
Register a property 184 65 26
Pay taxes (hours per year) 282 319 176
Time to export 48 31 10
Time to import 45 37 10
Resolve a contract dispute 1011 649 510
Close a business (years) 6.2 3.4 1.7
Notes: SSA = Sub-Saharan Africa
Source: Doing Business 2013.
Obtaining the official permits and licenses necessary to operate in Angola is both costly and time-consuming. It takes 68 days
to start a business in Angola, double the SSA average of 34 days. In 2011 Angola established the Single Desk for Entrepreneurs
(Balcão Único do Empreendedor—BUE) in an effort to simplify and speed up company registration time. However, the process
remains slow, and the government currently reorganizing the BUE to increase its efficiency. Construction permits are even harder
to obtain: it takes 348 days and costs 154 percent of Angola’s annual per capita income to complete the 12 procedures needed to
construct a warehouse—nearly a year longer and several hundred dollars more than in other countries in SSA. And it is extremely
difficult to enforce a contract, Angola’s weakest area of business regulation: it takes 1,011 days to resolve a contract dispute, and
the average cost of doing so is equal to 44 percent of the value of the claim. These regulations are intended to protect the public,
but their costly, time-consuming and otherwise inefficient administration places excessive constraints on businesses, damaging
the efficiency of the economy as a whole.
However, the DB report also shows important improvements in five of the ten indicators. Since 2005 Angola has made
significant progress in reforming the administrative processes for starting a business and registering a property. The cost of
transferring property was reduced from 11.5 percent of the property value in 2005 to 3.2 percent in 2011. In the past year alone
Angola dramatically streamlined the approval process for customers applying for an electricity connection, cutting the time
required for approval from 133 to 55 days and reducing the related costs from 4,737 percent of income per capita to 755
percent, which improved its ranking for electricity access by 32 positions over the previous year. These reforms are expected to
significantly increase Angola’s electrification rate and stimulate the growth of the private sector.
0 50 100 150 200
CAF
Angola
Mozambique
Sudan
Nigeria
Brazil
Namibia
Botswana
South Africa
Portugal

ANGOLA ECONOMIC UPDATE | June 2013 25
The conclusions of the DB report are confirmed by other
indicators of the business environment. The World Economic
Forum’s 2010-11 Global Competitiveness Report outlines the three
most problematic factors for doing business in Angola. These were
an inefficient government bureaucracy, a poorly educated
workforce, and an inadequate supply of infrastructure.
Furthermore, the 2012 World Bank’s Logistic Performance Index (www.worldbank.org/lpi), which measures the efficiency and
quality of a country’s transportation and trade infrastructure, also
highlighted key areas in which Angola lags behind comparable
countries (Figure 21).
Pro-business reforms are essential to enable firms to compete
more effectively in the global economy, especially when other
countries are continuously improving their business climates.
Moreover, within Angola there appear to be significant regional
differences in administrative efficiency and regulatory costs.
Operating a business in the provinces can be more difficult that in
the capital of Luanda. A subnational Doing Business report could
measure the relative ease of doing business across regions and
provide recommendations to improve the regulatory environment at the local level; the World Bank Group provides subnational
analyses for several of the countries included in the DB report, but none is currently available for Angola.
Figure 21: Angola’s logistic performance remains below
the SSA average
(LPI index, 0-5 score)
Notes: The LPI measures the logistics "friendliness" of countries. It is
based on a worldwide survey of operators on the ground, such as global
freight forwarders and express carriers.
Source: World Bank.
Risk Scenarios: Angola’s Sensitivity to Global Shocks
Continued uncertainty in the global economy remains the key risk to Angola’s projected growth. The country’s dependence on oil exports leaves its economy highly sensitive to global economic trends; and changes in oil prices have a significant and immediate impact on the external and fiscal accounts. Angola’s experience with the global financial crisis in 2008-09 demonstrated the far-reaching spillover effects of oil-price shocks on the domestic economy, including pro-cyclical effects transmitted through the budget. Due to Angola’s heavy reliance on imported food, global food prices also pose a significant risk to the economy. Food-price shocks have a potentially devastating impact on the poor, and external sensitivity exacerbates Angola’s preexisting food insecurity stemming from its low agricultural productivity and sensitivity to unpredictable weather conditions. Simulation analysis shows that another oil shock comparable to that experienced in 2008-09 would slash GDP growth dramatically, turning Angola’s twin fiscal and external surpluses into deficits. Meanwhile, a significant international food-price shock would be directly passed through to domestic prices, with a hugely detrimental impact on the living standards of the poor. To understand the risks that shocks in international commodity markets pose to the Angolan economy, it is necessary to identify the specific transmission channels involved and to quantify their potential impacts. In this section we consider two scenarios. Each scenario applies a shock to a commodity market in isolation, outlines the transmission channels by which the effects of the shock are passed through to the Angolan economy, and estimates its potential impacts.
Scenario 1: A Negative Shock to Global Oil Demand and Export Prices An oil-price shock would be transmitted to the domestic economy primarily through lower export earnings and tax revenues, which would then have indirect effects on investment and consumption (Figure 22). A drop in export earnings would affect profits and incomes, thereby lowering private investment and consumption.
0
0.5
1
1.5
2
2.5
3LPI Score
Customs
Infrastructure
Internationalshipments
Logisticscompetence
Tracking &tracing
Timeliness
Angola 2012 Sub-Saharan Africa

26 WORLD BANK | BANCO MUNDIAL
Figure 22: An oil-price shock would have a negative impact on export earnings and tax revenues
(Transmission mechanisms of an oil shock)
Source: World Bank staff.
Simulation analysis shows that a drop of 45 percent in the price of oil (relative to the baseline scenario) lasting for two years would slash GDP growth by over 8 percentage points during the first year of the shock, and by over 3 percentage points during the second year. Under this scenario Angola’s oil production is assumed to drop as a result of a weakening global demand, falling 17 percent from an average of almost 1.8 mbpd in 2012 to an average of 1.5 mbpd in 2013. Similar to the price shock that occurred during the global financial crisis of 2008-09, this scenario assumes that the international oil price would fall from an average of US$110 per barrel in 2012 to an average of US$60 per barrel in 2013, which would produce a sharp deterioration in Angola’s terms of trade.16 This price shock is assumed to last for two years. In this scenario, the authorities are assumed to react to the decline in tax revenues by cutting capital expenditures, but without incurring arrears (Table 11). The sharp deterioration in export earnings would significantly impact the current account, and twin fiscal and external surpluses would turn into twin deficits. Even though this scenario assumes that the impact on the current account would be partly offset by a reduction in the repatriation of profits by foreign companies through the income balance, Angola’s external position would still deteriorate. Specifically, the current account balance would fall by 15 percentage points, from a surplus of 6.7 percent in 2012 to a deficit of 21.4 percent in 2013.The drop in exports would also affect tax revenues, and the overall fiscal balance is projected to deteriorate from a surplus of 8.6 percent of GDP in
16 During the financial crisis of 2008-09, Angola’s oil production fell by 5 percent (from 1.9 to 1.8 mbpd) and the oil price fell by 35 percent (from US$94 to US$61 per barrel). The current account deteriorated by almost 20 percentage points; GDP fell 11 percentage points, and the fiscal balance deteriorated by 3 percentage points. The government also accumulated arrears equivalent to about 9 percent of GDP between 2008 and 2009.
Fall in oil prices
Drop in global
demand for oil
Export
revenues
Income
factor
balance
Volume of
exports
Current account
balance
GDP (Hydrocarbons sector),
consumption, and investment
components
Fiscal
revenuesOverall
balance
Table 11: An oil-price shock would slash GDP growth, turning
twin current-account and fiscal surpluses into deficits
(Baseline scenario versus an oil shock)
Baseline Oil Shock
2012 2013 2014 2013 2014
Oil production (mbpd) 1.8 1.9 2.1 1.5 1.5
Oil price (US$/barrel) 110 105 105 60 60
Annual Percent Change
GDP 8.1 7.2 7.5 -1.1 4.1
Export Earnings 4.0 -1.5 6.0 -52.9 -2.5
Terms of Trade -5.9 -6.5 -2.1 -23.4 -20.3
Percent of GDP
Current Account Balance 6.7 5.1 5.0 -8.6 -10.6
Overall Fiscal Balance 8.6 4.5 4.6 -21.4 -23.6
Note: 2012 figures are estimates; 2013 and 2014 are projections.
Source: World Bank staff estimates.

ANGOLA ECONOMIC UPDATE | June 2013 27
2012 to a deficit of over 8 percent of GDP during the first year of the shock (i.e., in 2013). Both current-account and fiscal deficits would continue through the second year of the shock (2014) as export values remain low and foreign companies delay planned investment.
Scenario 2: A 30-Percent Increase in Imported Food Prices A 30 percent increase in food-import prices (relative to the baseline) would double the inflation rate; it would cut GDP growth by 1.1 percentage points in the first year of the shock and by a further 0.6 percentage points in the second year. The impact of the shock, which is assumed to last for two years, would be transmitted to the Angolan economy first through higher inflation, which is projected to rise to 18 percent during the first year of the shock, thereby reducing the purchasing power of households, particularly among the poor (Figure 23).
Private consumption would contract with rising prices. This would occur through three channels. First, the rise in imported food prices would decrease the demand for food imports. Second, the lower purchasing power of household would result in lower consumption of imports other than food.17 Third, this scenario assumes that the Angolan authorities would counter the effects of rising inflation by depreciating the exchange rate, which in turn would lower the volume of imports. Lower private consumption and higher inflation will affect the poor disproportionally due to the higher food component of their consumption basket. The fall in goods imports is expected to partially offset the impact of lower consumption on GDP growth. Tax revenues are not projected to deteriorate significantly due to the small share of import taxes. On the current account, the fall in the volume of imports will offset the higher prices of grains (Table 12).
17 The scenario assumes a price-elasticity equivalent to 0.75.
Figure 23: A food price shock would negatively affect inflation and consumptions
(Transmission mechanisms for a food price shock)
Source: World Bank staff.
Increase in the
price of grains
Lower import of
grains
Price of
imports
Volume of
imports
Current account
balance
GDP
(consumption)
Fiscal
expenditure
(higher subsidies)
and revenues
(lower imports)
Overall balance
Domestic
inflation
Real effective
exchange rate
Monetary
policy
response
(nominal
exchange

28 WORLD BANK | BANCO MUNDIAL
Table 12: An increase in global food prices is expected to
significantly raise inflation and reduce private consumption
(Baseline scenario versus a shock to global food prices)
Baseline Food Price Shock
2012 2013 2014 2013 2014
Price (US$ per Metric Ton) Wheat 276 331 324 430 421
Corn 274 276 245 359 319
Rice 567 556 547 723 711
Soybean 543 533 526 693 684
Annual Percent Change
GDP 8.1 7.2 7.5 6.1 6.9
Private Consumption 14.7 7.8 7.4 3.2 6.0
Imports/Services Volume 11.1 7.2 7.7 4.9 7.5
CPI 9.0 8.0 7.5 17.7 7.5
Terms of Trade -5.9 -6.5 -2.1 -11.8 -2.5
Percent of GDP
Current Account Balance 6.7 5.1 5.0 4.8 4.7
Overall Fiscal Balance 8.6 4.5 4.6 3.8 3.8
Note: 2012 figures are estimates; 2013 and 2014 are projections.
Source: World Bank staff estimates.
In conclusion, while Angola’s short-term economic outlook is broadly positive, strengthening the structural resilience of the economy would help reduce its vulnerability to uncertain global conditions. External shocks have the potential to significantly affect macroeconomic stability, but Angola has a range of options that can bolster its resilience. These include accelerating efforts to improve the efficiency of public spending to promote economic diversification, as well as strengthening the financial system’s ability to mobilize savings and spur private sector investment. Agriculture is another area where Angola has the potential to expanding productivity and job creation, which could significantly mitigate its reliance on imported food. Increased competitiveness through greater economic diversification would allow Angola to reduce its dependence on oil exports over the medium-term. In this context the efficiency of the domestic financial market is especially critical. Widespread access to investment financing is essential to both diversification and competitiveness, and there is evidence that at present the Angolan financial sector is operating well below its potential. These issues are examined in greater detail below in the Special Focus Section of this Economic Update.

ANGOLA ECONOMIC UPDATE | June 2013 29
IV. SPECIAL FOCUS SECTION: THE RAPID GROWTH OF
ANGOLA’S FINANCIAL SECTOR IN A CONTEXT OF
STRUCTURAL CHALLENGES
Introduction A robust and competitive private sector requires a well-functioning financial market. Small businesses must be able to access credit to expand their operations and exert competitive pressure on established firms. The availability of credit facilitates the introduction of new technologies and new ways of doing business, helping to ensure that efficiency incentives remain strong and that price mechanisms function effectively. Given the rapid growth rate of the Angolan economy, and considering the market distortions that firms in the non-resource sectors already face, increasing the supply of credit and improving the efficiency of its distribution would do much to support the government’s medium-term objectives for employment growth, economic diversification and sustainable poverty reduction. This Special Focus Section evaluates the current state of the Angolan financial sector and its relationship with the non-resource economy.18 The analysis shows that despite its rapid expansion over the past two decades the sector remains underdeveloped, and a lack of reliable financial information limits the efficiency of its operations. Firms in Angola face high, often prohibitive collateral requirements, and are frequently forced to rely on their own internal resources to finance investments. Key complementary markets and institutions, including equity and insurance markets, accounting and auditing services, and property-registration agencies, are either weak or absent, and are largely unable to generate reliable financial information. Due to the scarcity of that information Angolan lenders demonstrate systematic preferences for firms which possess certain characteristics that are not directly related to their creditworthiness. Larger, older firms are less credit constrained than smaller startups, and many of Angola’s key sectors are dominated by a small group of very large firms. Uneven credit access and heavy market concentration have negative implications the competitiveness, diversification and long-term growth of the Angolan economy. Many of the Angola’s financial system’s limitations are due to its relative newness as a competitive, private-sector-led industry, and many of the problems caused by Angola’s underdeveloped financial sector are shared by other developing countries. Though these issues are understandable, even common, they are nonetheless problematic. In addition, there is evidence that financial-market distortions in Angola are especially severe compared to both SSA averages and conditions in lower middle income countries (LMICs) worldwide. The root of the financial sector’s problems can be traced to the fact that Angolan banks and other lenders do not have enough information to accurately differentiate between good credit risks and bad, and as a result they cannot allocate loans efficiently. Or, looked at from another perspective, borrowers cannot effectively signal their creditworthiness to prospective lenders. A pervasive lack of credible financial information not only reduces the total supply of credit available to the private sector, but also skews its distribution in favor of firms that possess certain characteristics. Larger, older, foreign-owned firms, and those based in the capital city of Luanda are systematically more able to access credit than are their smaller, younger, domestically owned and non-Luanda-based counterparts. Because possessing these favored characteristics does not necessarily reflect a firm’s soundness as a borrower, allocating credit based on these criteria creates distortions through the economy.
18 The focus of the analysis is exclusively on commercial lending, and it does not examine access to financial services at the household level. The complex interaction between the Angolan financial sector, the country’s natural-resource industries, and international credit markets is discussed elsewhere in this Economic Update and merits further research.

30 WORLD BANK | BANCO MUNDIAL
The low-information nature of the Angolan financial system appears to diminish competition between firms, weakening the responsiveness and dynamism of the economy. Credit constraints consistently reinforce the advantages of larger, older firms, insulating them against pressure from smaller, younger competitors. An inefficient financial sector also tends to slow the reallocation of productive capital, not only preventing small firms from scaling up but reducing the ability of large firms to downsize. The result is a phenomenon known as the ‘missing middle’: many of Angola’s key sectors are characterized by vast multitude of small firms that together account for only a small share of their industry, a tiny cohort of very large firms that are structurally protected against market forces, and an absence of medium-sized firms caused not only by the tendency of small firms not to grow, but also the tendency of large firms not to shrink. The analysis presented below explores these complex relationships and interactions using firm-level data. It relies principally on the two World Bank Enterprise Surveys (WBES) for Angola conducted in 2006 and 2010 (see Box 9), as well as the Angolan government’s most recent enterprise census, and analytical work by the World Bank, the IMF, and other development partners. It is important to note that while the available evidence is sufficient for a basic diagnostic assessment of conditions in the Angolan financial system and various sectors of the non-resource economy, further analysis would be necessary to establish a clear causal relationship between them. Conclusions should therefore be regarded as circumstantial and represent important opportunities for additional investigation.19
Box 9 You Can Only Improve What You Can Measure
Firm-Level Data in Angola
Economic data collection in Angola has improved substantially in recent years, but limitations remain. The macroeconomic data
recorded by the government and published by its agencies—including INE, BNA, and various line ministries—are relatively
comprehensive and statistical reports are published on a regular basis. Yet microeconomic data, including information on firm-level
constraints, is harder to obtain, and data quality remains a concern. Recent efforts to improve the availability of microeconomic
data include the INE’s biennial firm census, Estatísticas do Ficheiro de Unidades Empresariais, the results of which are used to inform the
National Accounts. The government now publishes regular reports summarizing the census’ findings. Publication of the census’ raw
data and other relevant datasets would allow for independent analysis and support the continuous improvement of data quality.
In this context, the World Bank Enterprise Survey (WBES) presents a valuable tool for microeconomic research in Angola. The
WBES is a survey of firms that provides a vital complement to the government’s enterprise census as well as other data sources on
the investment climate including the World Bank Group’s Doing Business dataset. The WBES describes economic conditions and
constraints from the perspective of Angolan firms themselves. It covers a broad range of topics across dozens of indicators
including access to finance, the business regulatory framework, infrastructure, competition, corruption, crime, and informality,
which together provide an in-depth look at the challenges facing Angolan firms. The WBES also allows for international
comparisons. For more information on the WBES, including the raw datasets and a description of its methodology, see
www.enterprisesurveys.org.
To date, two WBES (2006 and 2010) have been completed for Angola. These surveys have expanded the possibilities for
microeconomic analysis in Angola by providing data on a sample of firms broken down by a number of key characteristics, including
the firm’s economic sector, its size, location, and ownership type, among others. As noted in Angola’s 2010 WBES, “the Enterprise
Surveys collect information from a representative sample of the non-agricultural formal private economy. In addition to collecting
information on the business environment the surveys collect information on the characteristics of the firms interviewed.
Consequently, the data collected provides a description of the representative private firm in the country and also an estimate of
how some of the attributes of the average firm are distributed across the population of firms.” Important data limitations,
however, should be noted. While the survey sample is designed to be representative of the economy as a whole, the samples used
in the two previous WBES are not sufficiently large to guarantee accuracy. In addition, although the WBES includes sample weights,
these weights may not fully reflect the diversity of firms in Angola. In this Focus Section we use medium sample weights to ensure
that the data are as representative as possible. An expanded WBES with larger samples and more comprehensive content would
strengthen the quality of future analysis of Angola’s business environment.
19 It should be noted that the two WBES surveys have a different coverage of firms. Further analysis is limited by the availability and quality of the data. As noted in the latest IMF Article IV consultation, notwithstanding significant improvements in data collection and publication of statistical reports by the Angolan authorities in recent years, it remains critical to improve the timeliness and reliability of economic data.

ANGOLA ECONOMIC UPDATE | June 2013 31
The Angolan Financial Sector
How Has the Angolan Financial Sector Evolved in Recent Years? The government’s ongoing reform process has led to a surge in the number of Angolan banks and the diversity of financial services available to firms. In the early 2000s the financial sector comprised just nine banks, the two largest of which were state-owned; it now consists of over twenty, and privately owned banks command a dominant share of the market. Meanwhile, the financial sector’s total assets grew from less than US$ 3 billion in 2003 to more than US$ 57 billion in 2011 (BNA 2012). The liberalization of the sector has resulted in the dramatic growth of financial assets, infrastructure, and transaction volumes. Bank branches have proliferated throughout the country, extending even to remote and rural areas, while ATMs and credit cards are becoming increasingly common. Although the overall supply of credit to the economy remains both limited and inefficiently allocated—as will be discussed in detail below—the Angolan credit market has been growing by a remarkable average of over 50 percent per year for the past five years. Figure 24 shows the sustained increase in credit to the private sector experienced over the past decade, both in absolute terms and in proportion to the overall economy, while Table 13highlights contemporaneous improvements in a broad range of financial-sector indicators.
Table 13: The Growth of Financial Assets and Lending and the
Expansion of Financial-Sector Infrastructure
2003/04 2010/11
Compound Annual
Growth Rate
Number of Banks 9 23 12.4
Total Assets (US$
billions)
2.9 57 45.1
Total Loans (US$
billions)
0.7 16 56.4
ATMs 85 1,250 56.5
ATM Transactions
(US$ millions)
1.4 61.2 87.7
Debit/Credit Cards
(millions)
0.1 1.3 53.3
Source: “Angola: Private Sector Country Profile”, AfDB (2012)
In 2006 Angolan firms were among the least likely in the world to use basic financial services, but by 2010 Angola’s firm ‘bancarization’20 rate had significantly increased and was in line with the SSA average. Although Angola remains towards the bottom of the distribution globally, the considerable progress achieved in just a few years in expanding firms’ access to financial services is highly encouraging. Despite these improvements, however, Angola’s financial system continues to suffer from a number of critical limitations. The financial sector is still relatively new as competitive private market, and it its inherent weaknesses are exacerbated by deficiencies in the financial regulatory structure as well as the absence of key supportive institutions, both public and private.
20 “Bancarization,” refers to the percentage of firms that use basic banking services such as a savings account.
Figure 24: Credit to the Angolan private sector grew
robustly until 2009, but has remained flat since the
onset of the global financial crisis.
(Domestic credit to the private sector, percent of GDP)
Source World Bank World Development Indicators.
0
5
10
15
20
25
2004 2005 2006 2007 2008 2009 2010 2011

32 WORLD BANK | BANCO MUNDIAL
Inefficiencies in the financial sector create uneven credit constraints that appear to distort the growth patterns of firms in other sectors, leading to the excessive concentration of market shares among firms that conform to the preferences of Angolan banks. Because Angolan banks often lack essential information about prospective borrowers the financial sector’s demonstrated preferences do not reflect an accurate appraisal of relative creditworthiness. Lenders’ efforts to cope with inadequate information results in a structurally biased distribution of credit that diminishes competition, skews efficiency incentives, slows the adoption of new technologies, and reduces the overall dynamism of the Angolan economy.
What Does the State of the Angolan Financial System Mean for Firms Looking to Borrow? The efficiency of a country’s financial system is largely determined by the quality of information available to lenders. Prospective borrowers must be able to effectively signal their creditworthiness to financial institutions, which in turn must be able to accurately assess the risks and returns presented by alternative investments. This information is provided by a combination of public institutions and private markets. Government agencies define and adjudicate property rights and maintain extensive tax records, verifying asset ownership, income history and other basic financial data. Insurance companies evaluate asset values and estimate a wide range of risks, auditing and accounting firms certify financial records, and private equity markets generate a wealth of financial information as a byproduct of their operations. In a well-functioning financial system, lenders can draw on any or all of these information sources to determine the solvency potential borrowers. In Angola, however, public recordkeeping is inadequate, and information-generating private markets are either underdeveloped or nonexistent. In the absence of reliable financial information Angolan lenders tend to favor firms that possess certain characteristics which serve as imperfect proxy indicators for creditworthiness. This effect occurs to some extent in all financial systems, but in a context where accurate and reliable information is especially difficult to obtain the resulting uncertainty both suppresses the overall supply of credit and biases its allocation. As a result Angolan firms still have far less access to credit than firms in comparable countries despite the rapid growth of the financial sector (Figure 25). Among Angolan firms at least four factors can be identified as significant determinants of credit access, none of which is directly related to solvency. These factors are (i) the size of the firm, (ii) its age, (iii) whether it is foreign-owned or domestic, and (iv) whether it is based in the capital city of Luanda.21 The analysis suggests that firms which are larger, older, foreign-owned, and based in Luanda are significantly more able to access credit, less dependent on the domestic financial system, or in some cases both, giving them a major advantage over their competitors. As a result, Angola’s non-resource industries tend to be dominated by a few firms that are relatively insulated from competitive pressure, and sector-specific data indicate that highly imperfect, even monopolistic, competition is common.
21 See Annex A “Data and Definitions” for more detail on the definitions used here (e.g. “small” vs. “large” firms) and how these characteristics are determined.
Figure 25: Angolan firms’ access to credit is far below the averages for
comparable countries.
(Percentage of Firms with an Active Loan or Credit Line, by Size)
Source: World Bank Staff estimates based on WBES 2006 and 2010
Note: Data weighted using sample medium weights. For comparison groups the most recent
data available between 2006 and 2010 are used.
0
0.1
0.2
0.3
0.4
0.5
0.6
Angola 2006 Angola 2010 SSA LIMC
Small Firms (1-20) Large Firms (21+)

ANGOLA ECONOMIC UPDATE | June 2013 33
Angolan lenders rely on a set of largely arbitrary preferences when deciding which firms to lend to, and these preferences systematically skew competitive advantages throughout the economy. While data limitations should be borne in mind (see Box 9), evidence from the WBES from 2006 and 2010 indicates that uneven credit access inhibits competition between Angolan firms—in some cases to such an extent that dominant firms are capable of directly influencing prices in their respective markets. Economy-wide credit constraints also appear to have reduced incentives for innovation and the incorporation of new technologies, while structural weaknesses in the financial market slow the reallocation of productive capital between industries and sectors, diminishing Angola’s economic dynamism. The problems affecting credit allocation are exacerbated by serious weaknesses in Angola’s financial regulatory framework and in its network of supportive institutions. Although considerable progress has been made since the early 2000s in reforming the financial sector, competition between lenders remains limited, financial products and services are basic and undiversified, and complex application procedures make the administrative costs of accessing the financial system prohibitive for many small firms. Improving the functioning of the financial sector is not solely a matter of government policy, but will require joint efforts between the public and private sectors to build the necessary institutions and markets to ensure a well-functioning financial system.22 Before effective policy solutions can be formulated, however, it is important to understand the current state of the Angolan financial sector and the nature of the challenges facing it.
What Are the Key Constraints in the Angolan Financial Sector? Angolan firms’ limited and uneven access to credit, the mechanics of which are described in detail below, appears to be the result of pervasive “information asymmetry” in the financial sector. This term describes a situation in which two parties to a transaction have unequal access to essential information about that transaction. In this case, borrowers cannot effectively communicate their relative creditworthiness to lenders; or, conversely, lenders cannot accurately “screen” potential borrowers according to the risks and returns offered by different prospective investments. Left unchecked, information asymmetry can distort the mechanisms that link price and quality, preventing markets from functioning efficiently.23 The information provided by the WBES for 2006 and 2010 indicates that information asymmetry is seriously damaging the efficiency of the Angolan financial sector. The high collateral requirements imposed by Angolan banks and other lenders,24 the overwhelming share of loans for which collateral is necessary, and the very large number of credit applications that are rejected on the basis of insufficient collateral all strongly suggest that lenders cannot accurately estimate the credit risk posed by prospective borrowers. Because lenders cannot efficiently sort out the “good” credit risks from the “bad” they protect themselves by establishing high collateral requirements across the board. These requirements help to insure lenders against losses stemming from their inability to gauge creditworthiness, but they also seriously limit the availability of credit and systematically favor borrowers that already have substantial assets to use as collateral.
22 Prospective measure could include strengthening the regulatory framework governing the financial sector, the establishment of a national stock market, the further expansion and diversification of the insurance industry, and the development of standardized and credible domestic credit-rating, accounting and auditing services, in addition to continued progress in expanding property registration and public informational services as fundamental and universal public goods. 23 The seminal work on information asymmetry is George Akerlof’s “The Market for Lemons: Quality Uncertainty and the Market Mechanism” (1970). 24. According to the World Bank’s 2006 Enterprise Survey, collateral requirements were close to 100 percent of the loan value, relatively high in absolute terms but significantly lower than the SSA and LMIC averages. The 2010 Enterprise Survey, however, recorded collateral requirements of over 200 percent, very high and well above comparable averages, but this finding was not validated by a sufficient number of responses. Nevertheless, the large share of loan applications that are rejected on the basis of insufficient collateral—and the frequency with which firms cite inadequate collateral as a reason for not applying for a loan—make it clear that collateral requirements are a significant obstacle many prospective borrowers in Angola.
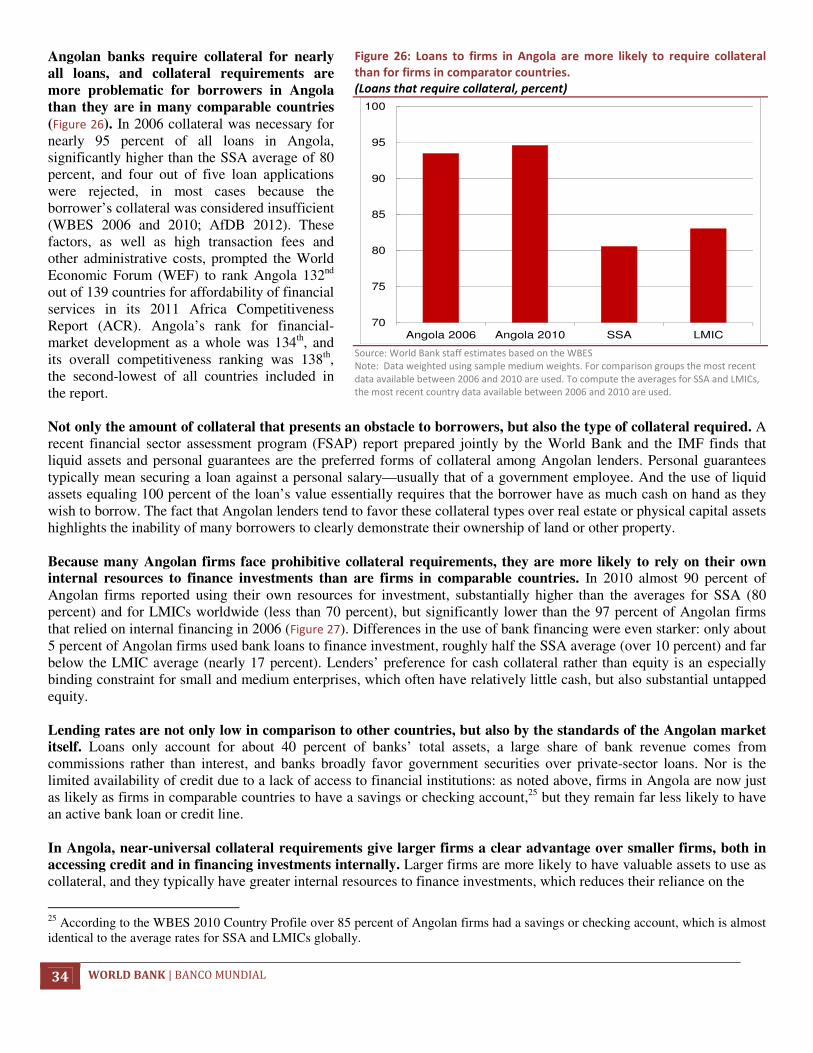
34 WORLD BANK | BANCO MUNDIAL
Angolan banks require collateral for nearly all loans, and collateral requirements are more problematic for borrowers in Angola than they are in many comparable countries (Figure 26). In 2006 collateral was necessary for nearly 95 percent of all loans in Angola, significantly higher than the SSA average of 80 percent, and four out of five loan applications were rejected, in most cases because the borrower’s collateral was considered insufficient (WBES 2006 and 2010; AfDB 2012). These factors, as well as high transaction fees and other administrative costs, prompted the World Economic Forum (WEF) to rank Angola 132nd out of 139 countries for affordability of financial services in its 2011 Africa Competitiveness Report (ACR). Angola’s rank for financial-market development as a whole was 134th, and its overall competitiveness ranking was 138th, the second-lowest of all countries included in the report. Not only the amount of collateral that presents an obstacle to borrowers, but also the type of collateral required. A recent financial sector assessment program (FSAP) report prepared jointly by the World Bank and the IMF finds that liquid assets and personal guarantees are the preferred forms of collateral among Angolan lenders. Personal guarantees typically mean securing a loan against a personal salary—usually that of a government employee. And the use of liquid assets equaling 100 percent of the loan’s value essentially requires that the borrower have as much cash on hand as they wish to borrow. The fact that Angolan lenders tend to favor these collateral types over real estate or physical capital assets highlights the inability of many borrowers to clearly demonstrate their ownership of land or other property. Because many Angolan firms face prohibitive collateral requirements, they are more likely to rely on their own internal resources to finance investments than are firms in comparable countries. In 2010 almost 90 percent of Angolan firms reported using their own resources for investment, substantially higher than the averages for SSA (80 percent) and for LMICs worldwide (less than 70 percent), but significantly lower than the 97 percent of Angolan firms that relied on internal financing in 2006 (Figure 27). Differences in the use of bank financing were even starker: only about 5 percent of Angolan firms used bank loans to finance investment, roughly half the SSA average (over 10 percent) and far below the LMIC average (nearly 17 percent). Lenders’ preference for cash collateral rather than equity is an especially binding constraint for small and medium enterprises, which often have relatively little cash, but also substantial untapped equity. Lending rates are not only low in comparison to other countries, but also by the standards of the Angolan market itself. Loans only account for about 40 percent of banks’ total assets, a large share of bank revenue comes from commissions rather than interest, and banks broadly favor government securities over private-sector loans. Nor is the limited availability of credit due to a lack of access to financial institutions: as noted above, firms in Angola are now just as likely as firms in comparable countries to have a savings or checking account,25 but they remain far less likely to have an active bank loan or credit line. In Angola, near-universal collateral requirements give larger firms a clear advantage over smaller firms, both in accessing credit and in financing investments internally. Larger firms are more likely to have valuable assets to use as collateral, and they typically have greater internal resources to finance investments, which reduces their reliance on the
25 According to the WBES 2010 Country Profile over 85 percent of Angolan firms had a savings or checking account, which is almost identical to the average rates for SSA and LMICs globally.
Figure 26: Loans to firms in Angola are more likely to require collateral
than for firms in comparator countries.
(Loans that require collateral, percent)
Source: World Bank staff estimates based on the WBES
Note: Data weighted using sample medium weights. For comparison groups the most recent
data available between 2006 and 2010 are used. To compute the averages for SSA and LMICs,
the most recent country data available between 2006 and 2010 are used.
70
75
80
85
90
95
100
Angola 2006 Angola 2010 SSA LMIC

ANGOLA ECONOMIC UPDATE | June 2013 35
financial system.26 In Angola, firm size, measured as the total number of employees, shows a strong negative correlation with credit constraints: firms with fewer than 50 employees face serious obstacles in accessing credit, while credit constraints become insignificant for firms with more than 100 employees (World Bank 2010). Credit constraints are especially binding for small firms, and this is due to a number of related factors. In Angola, larger firms are more than three times as likely as smaller firms to have a bank loan or line of credit. However, collateral requirements only partially explain this difference. In the 2010 WBES, 7 percent of small firms reported insufficient collateral as a reason they had not applied for a loan, while none of the larger firms surveyed cited inadequate collateral as a constraint (Table 14).
Table 14: Reasons for Not Applying for a Loan, by Firm Size, 2006 and 2010
2006 2010
% of firms citing as main reason for not
applying for loans:
Small
Firms
Large
Firms Total
Small
Firms
Large
Firms Total
No need for a loan - establishment has
sufficient capital 15.7 36.4 17.6 52.30 64.04 56.94
Application procedures for loans or lines
of credit are complex 34.5 12.1 32.4 16.09 12.28 14.58
Interest rates are not favorable 16.3 21.2 16.8 14.94 11.40 13.54
Collateral requirements are too high 7.7 0.0 6.9 11.49 8.77 10.42
Size of loan and maturity are insufficient 5.1 12.1 5.8 3.45 0.88 2.43
Did not think it would be approved 18.2 6.1 17.1 1.15 1.75 1.39
Other 2.6 12.1 3.5 0.57 0.88 0.69 Source: World Bank staff estimates based on the WBES.
Note: For the purpose of this comparison, “Small Firms” are those with 20 employees or fewer, while “Large Firms” have more than 20 employees.
26 It should be noted that current research into the relationship between firms’ internal cash holdings and access to credit is inconclusive. As Ayyagari, Demirguc-Kunt and Maksimovic (2012) point out, “While some studies find that cash and lines of credit are liquidity substitutes, others find that lines of credit are the dominant source of corporate liquidity, and that firms use cash only as insurance against future cash flow shortfalls.” In either case, however, it is clear that firms with both significant internal financial reserves and greater access to credit—i.e. larger firms in Angola—possess a considerable advantage over those that have neither.
Figure 27: Angolan firms rely on internal resources to finance
investments far more than firms in comparable countries.
(Financing sources as a percentage of total investment)
Source: World Bank staff estimates based on the WBES.
Note: Data weighted using sample medium weights. For comparison groups the most
recent data available between 2006 and 2010 are used.
60%
70%
80%
90%
100%
Angola 2006 Angola 2010 SSA LMIC
Internal Equity Banks
Non-bank institutions Trade Credit Other

36 WORLD BANK | BANCO MUNDIAL
Credit Access and Its Impact on Firms
What Determines Credit Access in Angola? Firm size, age, location and ownership all play important roles in determining access to credit in Angola’s information-scarce financial sector. Some of these factors, such as foreign ownership, reflect the superior ability of certain firms to demonstrate their solvency to lenders; others, such as firm size and age, are likely regarded by lenders as indirect indicators of creditworthiness, which lenders are forced to rely on in the absence of credible financial information. However, allocating credit based on proxy indicators is imprecise and exposes the financial system to high risks (e.g. non-performing loans), prompting lenders to adopt a very cautious attitude towards all potential borrowers and reinforcing the need for pervasive, and often prohibitive, collateral requirements. This both reduces the availability of credit throughout the economy and severely distorts competitive incentives within and between economic sectors, resulting in a set of mutually-reinforcing distortions described in Box 10. Most Angolans firms regard access to finance as a serious constraint to growth, but small firms are especially likely to cite limited credit access as a major obstacle. In the 2010 WBES access to credit topped Angolan firms’ list of reported constraints, with 55 percent of firms identifying limited credit access as either a “major” or “very severe” constraint to growth. Reporting credit constraints was also negatively correlated with firm size: 56 percent, 52 percent and 40 percent of small, medium and large firms, respectively, described access to credit as a serious problem. The perception that credit constraints are especially binding for small enterprises is borne out by the tiny share of SMEs with access to even the most basic financial services. Ayyagari, Demirguc-Kunt and Maksimovic (2012) find that just 4.2 percent of Angolan SMEs have a loan or line of credit, comparable to Guinea-Bissau and the Democratic Republic of Congo. This is less than half of Angola’s economy-wide average (9.5 percent) and far below the averages for SSA and LMICs. Access to overdraft facilities is even more limited at 1.7 percent, comparable to Guinea-Bissau and Liberia. World Bank staff re-estimated these indicators using the most recent available data, which present a similar picture (Figure 28 and Figure 29), with Angola ranking between Gabon and the Democratic Republic of Congo for SME’s use of loans and credit lines, and between Guinea and Tanzania in terms of SME’s access to overdraft facilities. While the data also shows considerable improvements in these indicators between 2006 and 2010, SMEs in Angola remain far less able to use basic financial services than their competitors in SSA and LMICs worldwide.
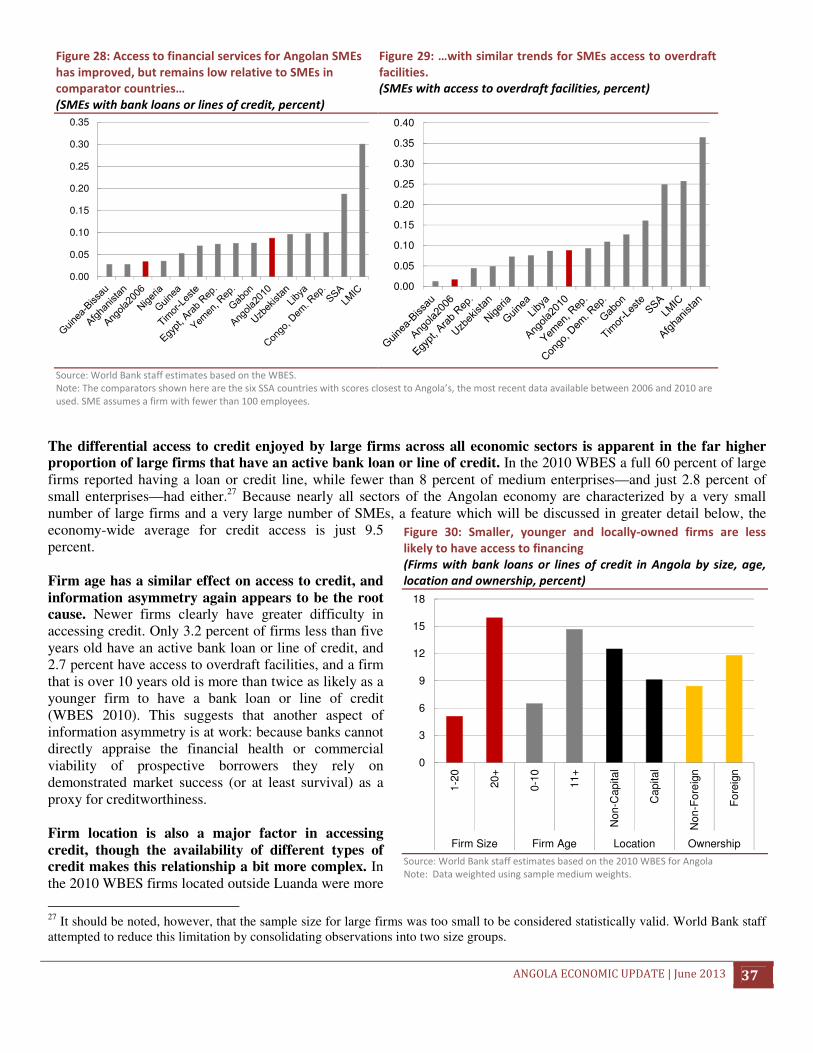
ANGOLA ECONOMIC UPDATE | June 2013 37
Figure 28: Access to financial services for Angolan SMEs
has improved, but remains low relative to SMEs in
comparator countries…
(SMEs with bank loans or lines of credit, percent)
Figure 29: …with similar trends for SMEs access to overdraft
facilities.
(SMEs with access to overdraft facilities, percent)
Source: World Bank staff estimates based on the WBES.
Note: The comparators shown here are the six SSA countries with scores closest to Angola’s, the most recent data available between 2006 and 2010 are
used. SME assumes a firm with fewer than 100 employees.
The differential access to credit enjoyed by large firms across all economic sectors is apparent in the far higher proportion of large firms that have an active bank loan or line of credit. In the 2010 WBES a full 60 percent of large firms reported having a loan or credit line, while fewer than 8 percent of medium enterprises—and just 2.8 percent of small enterprises—had either.27 Because nearly all sectors of the Angolan economy are characterized by a very small number of large firms and a very large number of SMEs, a feature which will be discussed in greater detail below, the economy-wide average for credit access is just 9.5 percent. Firm age has a similar effect on access to credit, and information asymmetry again appears to be the root cause. Newer firms clearly have greater difficulty in accessing credit. Only 3.2 percent of firms less than five years old have an active bank loan or line of credit, and 2.7 percent have access to overdraft facilities, and a firm that is over 10 years old is more than twice as likely as a younger firm to have a bank loan or line of credit (WBES 2010). This suggests that another aspect of information asymmetry is at work: because banks cannot directly appraise the financial health or commercial viability of prospective borrowers they rely on demonstrated market success (or at least survival) as a proxy for creditworthiness. Firm location is also a major factor in accessing credit, though the availability of different types of credit makes this relationship a bit more complex. In the 2010 WBES firms located outside Luanda were more
27 It should be noted, however, that the sample size for large firms was too small to be considered statistically valid. World Bank staff attempted to reduce this limitation by consolidating observations into two size groups.
0.00
0.05
0.10
0.15
0.20
0.25
0.30
0.35
0.00
0.05
0.10
0.15
0.20
0.25
0.30
0.35
0.40
Figure 30: Smaller, younger and locally-owned firms are less
likely to have access to financing
(Firms with bank loans or lines of credit in Angola by size, age,
location and ownership, percent)
Source: World Bank staff estimates based on the 2010 WBES for Angola
Note: Data weighted using sample medium weights.
0
3
6
9
12
15
18
1-2
0
20+
0-1
0
11+
Non-C
apital
Capital
Non-F
ore
ign
Fo
reig
n
Firm Size Firm Age Location Ownership

38 WORLD BANK | BANCO MUNDIAL
than twice as likely to identify credit constraints as a severe impediment to growth than were firms based in the capital, and firms located outside Luanda were far more likely to use their own resources to finance investments.28 The difference is not a matter of availability, as firms outside Luanda were marginally more likely to have an active bank loan than firms in the capital (Figure 30), but the advantage of non-Luanda firms’ in accessing loans is more than offset by their greatly reduced access to trade credit from suppliers and advances from customers, both of which are close to negligible. The apparently total absence of overdraft facilities outside of Luanda may also explain the large number of non-Luanda-based firms reporting serious credit constraints. The structural weaknesses and scarcity of information in the Angolan financial sector likely contribute to foreign-owned firms’ advantage in accessing credit. Foreign-owned firms are often integrated into more efficient financial markets outside of Angola, which not only lessens their dependence on Angolan banks, but can also give them a significant edge over their domestic competitors in the information-scarce Angolan financial sector. Screening borrowers to determine their creditworthiness is a costly and time-consuming process, which is made more difficult by limited documentation, a slow or unreliable bureaucracy, and inadequate information technology. Domestic banks can benefit second-hand from the information generated by more efficient overseas financial systems, and the preexisting credit ratings and independently audited financial records of foreign firms may make them substantially more attractive as borrowers.
Why Do Credit Constraints Matter to the Growth of the Angolan Economy? Recent analytical work highlights the complex relationship between credit conditions faced by firms and economic development. Box 10 describes several elements of this relationship, which not only relate to the impact of credit constraints on a country’s overall growth rate but also encompass multiple dimensions of competiveness and economic dynamism. Among the most important of these is the effect of systematic credit constraints on competition between firms and on the concentration of market shares.
28 Firms outside Luanda reported that 94 percent of their short-term financing came from internal funds or retained earnings, compared to just 79 percent for firms located in Luanda. This distribution is similar, though far less pronounced, for long-term financing: 91 percent for firms outside Luanda, 88 percent for firms in Luanda.

ANGOLA ECONOMIC UPDATE | June 2013 39
Due in part to the credit constraints described above, Angola’s formal-sector markets tend to be dominated by a few large, well-established firms that face limited competition. Imperfectly competitive markets diminish large firms’ incentive to maximize efficiency, and in some cases a dominant firm or group of firms may even be capable of exercising market power,29 altering prices and distorting competitive incentives throughout a given industry with secondary impacts on industries related to it. Many of Angola’s key domestic markets, including the manufacturing industry and the financial sector itself, are dominated by a handful of powerful firms. In some cases these firms enjoy a price-margin verging on oligopoly. In other words, they command such an enormous share of the market that they are capable of directly manipulating prices, boosting their profits at the expense of consumers and the efficiency of the economy as a whole.
29 “Market power” is the ability of a single firm or a collaborating group of firms to deliberately alter prices, either by changing their individual production decisions or through anticompetitive collusion. In a perfectly competitive market no firm or group of firms is able to exert market power, but in a market with serious barriers to entry one or more firms may be able to use their position as producers (or, in rare instances, their position as buyers) to affect prices for all firms in that industry, with the goal of increasing their profits at the expense of consumers or forcing other firms out of the market.
Box 10 Ties that Bind Links between Credit Constraints and Economy-wide Growth and Development
There is a clear connection between the development of a country’s financial sector and the growth of its economy. More
efficient and sophisticated financial systems make a strong, positive contribution to a country’s long-term growth, while a weak
or underdeveloped financial sector can significantly hinder it. Pervasive financial constraints prevent the swift and efficient
reallocation of resources, reducing the dynamism of the economy. Emerging industries grow more slowly than they otherwise
would, while declining industries tend to linger on, using scarce capital that could be employed more profitably elsewhere. In
addition, there are several specific microeconomic channels through which financial constraints adversely affect firms in other
sectors and create systemic distortions in the economy as a whole.
One transmission channel relates to entrepreneurship and the entry of new firms into the market. Financial access is directly
correlated with the proliferation of startup firms (Klapper, Laeven and Rajan, 2006). Conversely, financial constraints effectively
protect established firms from new competitors. Despite the preponderance of small and medium enterprises (SMEs) in the
Angolan economy, a heavily concentrated and structurally inefficient financial sector is likely preventing the entry of additional
small firms.
A second channel affects the growth of small firms and their ability to directly compete with larger enterprises. Startups that
are able to overcome the initial barrier to entry posed by a weak financial sector continue to face credit constraints as they
attempt to scale up their operations. According to Beck (2007) SMEs in developing countries consistently rate access to finance
as the most serious challenge to their continued growth, and Beck, Demirguc-Kunt, and Maksimovic (2005) find that “small
firms…face higher financing obstacles than larger firms and are more severely affected when they face financing constraints”.
This effect perpetuates the economy-wide imbalance between small and large firms and further curtails market competition.
Existing firms are protected from new competitors, and larger firms are protected from smaller firms.
A third transmission channel involves the effect of financial constraints on firm-level innovation. In a study of 47 developing
countries from 2002 to 2005 Ayyagari, Demirguc-Kunt, and Maksimovic (2011) determine that the proportion of firms’
investment expenditures that are financed by external funds (primarily bank loans and lines of credit) is positively correlated
with multiple dimensions of innovation. ‘Innovation,’ in this context, refers not only to the introduction of new technologies and
the development of new product lines, but also to a range of activities and organizational features that reflect firms’ ability to
incorporate new skills, competencies and business methods. Limited innovation slows the transfer of knowledge and
perpetuates the use of outdated physical and organizational technologies, compounding the reduced efficiency of an imperfectly
competitive market.
Finally, financial constraints create distortions both within and between different industries and sectors, misallocating
resources throughout the economy. Industries in which external financing is especially crucial are more negatively affected by
credit constraints (Rajan and Zingales, 1998); as a result, the presence of a weak financial sector tends to favor the growth of
industries with low capital requirements, even if those industries would not otherwise be best suited to local economic
conditions. In addition, within a given industry financial constraints may promote labor-intensive production techniques over
more capital-intensive methods regardless of their relative technical efficiency.

40 WORLD BANK | BANCO MUNDIAL
The continuing dominance of a few powerful firms has serious implications for Angola’s competitiveness. In most countries successful small firms tend to scale up rapidly at first and then experience slowing growth as diminishing returns set in. This dynamic is fundamental to market competition: the faster growth rate of smaller firms allows them to expand their operations and directly compete with larger firms; this helps to prevent the excessive concentration of market shares as new enterprises continuously jockey for position with established firms. In Angola, however, the evidence indicates that this is not the case, and that large firm s tend grow at faster rates than their smaller competitors. This implies that systematic constraints on the growth of smaller firms may be substantially reducing competition within the domestic economy, weakening efficiency incentives and leaving Angolan firms less able to compete in international markets. Data on firm-level innovation suggest that credit constraints are diminishing the capacity of Angolan firms to adopt new production methods, develop new product lines, and incorporate new technologies. Angola’s score in the Africa Competitiveness Report (ACR) for “innovation and sophistication”, as well as indicators specifically related to the availability and adoption of new technologies, are among the lowest in the world. Angola ranked 130th in “technological readiness” and last among all countries surveyed for “innovation and sophistication” (WEF 2011). An inadequate supply of investment credit directly slows rates of innovation and technological uptake, and this effect is exacerbated by uneven access to credit though its impact on competitive incentives.
Box 11 The David-Goliath Ratio Two Key Characteristics of Angolan Firms
The 2006 and 2010 WBES provide a wealth of detail on the unique features of Angolan firms and markets. The WBES serves as
an important compliment to the nationwide enterprise census, the Estatísticas do Ficheiro de Unidades Empresariais, conducted
by the National Statistical Institute (INE). It reveals at least two firm characteristics that are especially relevant to the present
analysis and which are not captured by the INE census. The first is that Angolan firms tend to be either very small or very large—
only a small fraction of firms are medium-sized. The second is that the small firms vastly outnumber the large ones, with large
firms often facing only a bare handful of comparably sized competitors.
While this distribution is not uncommon, particularly in developing countries in SSA, in Angola it appears to be especially
pronounced. Around 80 percent of Angolan firms have fewer than 50 employees, just 9 percent have between 50 and 100, and
only the remaining 11 percent have more than 100 (WBES 2010). Moreover, these few large firms tend to be very, very large: so
large in fact that their share of the market is not balanced out by the combined share of the far more numerous small firms. Not
only do the big firms in Angola tend to be giants, but their size is not offset by the abundance of smaller firms—many Davids do
not equal one Goliath.
In SSA and in LMICs globally, smaller firms typically grow at much faster rates than larger firms, but in Angola the opposite is the case. Figure 31 compares Angolan firms’ annual growth rates with the averages for SSA and LMICs worldwide. The results are striking: small firms in Angola grow at a much slower pace than small firms in other countries, lagging a remarkable 4-5 percent behind the SSA average in each size category. However, once they reach 50-100 employees Angolan firms’ growth rates shoot up dramatically to match the SSA average. As a result, not only do small firms in Angola grow more slowly than small firms in other countries, they also grow more slowly than large firms in Angola. This finding goes against the standard pattern, with deeply negative consequences for the competiveness and dynamism of the Angolan economy.
Figure 31 Angolan SMEs grow more slowly than either SMEs in
comparable countries or large firms in Angola, with deeply negative
implications for market competition and economic dynamism
(Average yearly growth rates from start-up, percent)
Source: World Bank staff estimates based on the WBES.
Note: the results obtained from the regressions with age, sector, and year dummies
controlled, weighted by average size. For Angola, both 2006 and 2010 data are used;
comparison groups use the most recent data available between 2006 and 2010.
0
2
4
6
8
10
12
1-5 6-10 11-20 21-50 51-100 100+
Angola SSA LMIC
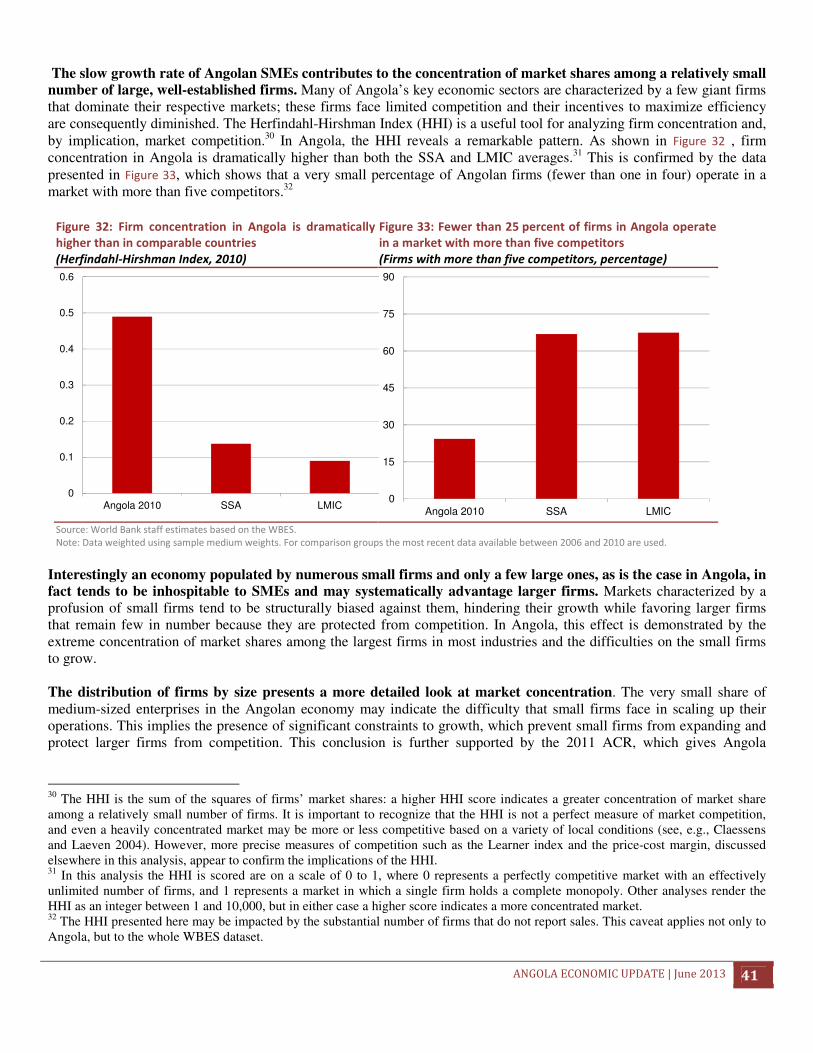
ANGOLA ECONOMIC UPDATE | June 2013 41
The slow growth rate of Angolan SMEs contributes to the concentration of market shares among a relatively small number of large, well-established firms. Many of Angola’s key economic sectors are characterized by a few giant firms that dominate their respective markets; these firms face limited competition and their incentives to maximize efficiency are consequently diminished. The Herfindahl-Hirshman Index (HHI) is a useful tool for analyzing firm concentration and, by implication, market competition.30 In Angola, the HHI reveals a remarkable pattern. As shown in Figure 32 , firm concentration in Angola is dramatically higher than both the SSA and LMIC averages.31 This is confirmed by the data presented in Figure 33, which shows that a very small percentage of Angolan firms (fewer than one in four) operate in a market with more than five competitors.32
Figure 32: Firm concentration in Angola is dramatically
higher than in comparable countries
(Herfindahl-Hirshman Index, 2010)
Figure 33: Fewer than 25 percent of firms in Angola operate
in a market with more than five competitors
(Firms with more than five competitors, percentage)
Source: World Bank staff estimates based on the WBES.
Note: Data weighted using sample medium weights. For comparison groups the most recent data available between 2006 and 2010 are used.
Interestingly an economy populated by numerous small firms and only a few large ones, as is the case in Angola, in fact tends to be inhospitable to SMEs and may systematically advantage larger firms. Markets characterized by a profusion of small firms tend to be structurally biased against them, hindering their growth while favoring larger firms that remain few in number because they are protected from competition. In Angola, this effect is demonstrated by the extreme concentration of market shares among the largest firms in most industries and the difficulties on the small firms to grow. The distribution of firms by size presents a more detailed look at market concentration. The very small share of medium-sized enterprises in the Angolan economy may indicate the difficulty that small firms face in scaling up their operations. This implies the presence of significant constraints to growth, which prevent small firms from expanding and protect larger firms from competition. This conclusion is further supported by the 2011 ACR, which gives Angola
30 The HHI is the sum of the squares of firms’ market shares: a higher HHI score indicates a greater concentration of market share among a relatively small number of firms. It is important to recognize that the HHI is not a perfect measure of market competition, and even a heavily concentrated market may be more or less competitive based on a variety of local conditions (see, e.g., Claessens and Laeven 2004). However, more precise measures of competition such as the Learner index and the price-cost margin, discussed elsewhere in this analysis, appear to confirm the implications of the HHI. 31 In this analysis the HHI is scored are on a scale of 0 to 1, where 0 represents a perfectly competitive market with an effectively unlimited number of firms, and 1 represents a market in which a single firm holds a complete monopoly. Other analyses render the HHI as an integer between 1 and 10,000, but in either case a higher score indicates a more concentrated market. 32 The HHI presented here may be impacted by the substantial number of firms that do not report sales. This caveat applies not only to Angola, but to the whole WBES dataset.
0
0.1
0.2
0.3
0.4
0.5
0.6
Angola 2010 SSA LMIC0
15
30
45
60
75
90
Angola 2010 SSA LMIC

42 WORLD BANK | BANCO MUNDIAL
extremely low scores for “intensity of local competition”, “extent of market dominance”, and “effectiveness of anti-monopoly policy”. Angola’s overall ranking for the efficiency of its goods market was 133rd out of 139 countries.
How Concentrated is the Financial Sector Itself? The Angolan financial sector is characterized by extreme market concentration and the dominance of a few very large financial firms. Despite the rapid expansion of financial services in Angola, with 14 new banks entering the market in just 20 years, as of 2011 Angola remained one of only five SSA countries with a CR3 score of over 85 percent (World
Box 12 Assembly Line, Last in Line Financial Constraints in the Manufacturing Sector
Credit constraints appear to be especially pronounced among manufacturing firms, which already face an array of adverse
conditions related to the rise of Angola’s natural-resource sector. 63 percent of Angolan manufacturing firms identified access
to credit as a “major” or “very severe” constraint to growth, substantially higher than the economy-wide average. In 2012
manufacturing accounted for just 10 percent of all private-sector credit. Services, by contrast, received a full 42 percent, while
commerce, transport, real estate and utilities accounted for another 30 percent. Each of these sectors is strongly associated
with the extractive industries, either directly or through the appreciation of the real exchange rate, which is boosting demand
for nontradables.
Moreover, small manufacturing firms were far more likely than larger firms to single out credit constraints as a major
obstacle (68 percent and 40 percent, respectively). The perceptions of credit constraints among manufacturing firms are borne
out by lending data, by the distribution of manufacturing firms by size, and by the relatively high concentration of market share
among manufacturing firms. The growth rate for small manufacturing firms is even lower relative to large firms than it is for the
economy as a whole, with similar effects on market concentration (Figure 34).
Figure 34: Credit constraints are particularly severe for small
manufacturers, while the growth performance of large
manufacturers is similar to firms in comparator countries
(Average yearly growth rates from start-up, percent)
Source: World Bank staff estimates based on WBES
Note: the results obtained from the regressions with age, sector, and year
dummies controlled, weighted by average size, sample is restricted to
manufacturing sectors. For Angola, both 2006 and 2010 data are used; comparison
groups use the most recent data available between 2006 and 2010.
The distribution by size also indicates that market
concentration is severe in the manufacturing sector,
though the HHI shows higher levels of concentration in
construction and especially wholesale and retail
commerce. According to the Angolan government’s
previous enterprises census (INE 2005) 72 percent of
manufacturing-sector firms have fewer than 10
employees, 13 percent have fewer than 20, and only the
remaining 14 percent have more than 20. This strongly
suggests that manufacturing firms face serious obstacles
to growth, especially considering the typically labor-
intensive nature of manufacturing in developing countries
and the generally high returns to economies of scale. It is
important to note that finance is far from the only
constraint faced by small firms attempting to expand, but,
as described below, it is among the most consequential.
While manufacturing firms face serious credit
constraints, there is evidence that these constraints are
even more severe in the construction industry and the
wholesale and retail sector. Manufacturing firms tend to
be small, and the sector is characterized by limited
competition, but market shares among firms in the
construction and domestic commercial sectors are even
more heavily concentrated. In addition, the Angolan
financial sector is itself dominated by a few large firms (see below). Together, these factors diminish competitive incentives,
slow the adoption of new technologies and production methods, and create systematic distortions throughout the economy—
the more Angolan firms concentrate, the more they lose their edge.
0
2
4
6
8
10
12
14
1-5 6-10 11-20 21-50 51-100 100+
Angola SSA LMIC

ANGOLA ECONOMIC UPDATE | June 2013 43
Bank 2011).33 This means that the country’s three largest banks together commanded more than 85 percent of the financial sector. The dynamics of market concentration in the financial sector are revealed in more precise measures of competition and market power such as the Lerner index. The Lerner index reflects banks’ ability to directly influence prices in the financial sector.34 From 2001-2009 Angola’s average Lerner index score for the financial sector was 0.46, one of the highest in the world, indicating that Angolan banks exercise an extraordinary degree of market power (Love and Martinez Peria 2012) (Figure 35). Angolan banks’ ability to influence prices for financial services enhances their profitability, but it does so at the expense of the efficiency of the banking system, disproportionately harming borrowers who rely exclusively on the domestic financial sector. Love and Martinez Peria (2012) demonstrate that “low competition, measured by high values in the Lerner index, diminishes firms’ access to finance”, while Claessens (2009) notes that “as in other industries, the degree of competition in the financial sector matters for the efficiency of production of financial services, the quality of financial products and the degree of innovation in the sector [and] the access of firms and households to financial services.”35 The excessive concentration of the Angolan financial sector and the limited competition between financial firms create systemic distortions throughout the economy, leading to excessive concentration and limited competition in other sectors. As described above, Angolan markets tend to be characterized by the dominance of a few large, well-established firms, which enjoy significant advantages over SMEs. A recent World Bank report on finance in developing countries (World Bank 2008) finds that the excessive concentration of the banking industry is one way in which underdeveloped and imperfectly competitive financial markets transmit negative effects to the broader economy, damaging its long-term growth prospects.
Financial Regulations and Related Institutions
What Are the Authorities Doing to Enhance the Efficiency of the Financial Sector? The institutional and regulatory climate plays a major role in determining the efficiency of the financial sector; in Angola, the sector’s past is partially responsible for many of its current weaknesses. Although much progress has been achieved during a reform process that now spans more than two decades, much more remains to be done to
33 The other four were Algeria, Malawi, Mauritius and Sudan. The CR3 average for SSA was 68 percent. 34 The Lerner index is the market price faced by a firm minus the firm’s marginal cost expressed as a share of the market price. It is equivalent to the negative inverse of the price elasticity of demand. Similar to the HHI, the Lerner index is given as a decimal between 0 and 1, where 0 indicates a perfectly competitive market in which firms exercise no market power, and 1 indicates a complete monopoly. 35 However, Claessens also finds evidence that excessive competition may promote instability in the financial system and determines that “the view that competition in financial services is unambiguously good is more naive than in other industries.”
Figure 35: Angola’s banking sector has one of the highest concentration
rates in the region
(Lerner Index Scores, Angola, Selected Comparison Countries, LMIC and
SSA Averages)
Source: Source: Love and Martinez Peria (2012).
Note: The comparators shown here are the six SSA countries with scores closest to Angola’s
0
0.1
0.2
0.3
0.4
0.5
0.6

44 WORLD BANK | BANCO MUNDIAL
modernize the policy structure of the Angolan financial sector and free it from its long legacy of structural volatility, interventionist policies and distorted incentives. Prior to the end of the Civil War in 2002 Angola’s financial industry was dominated by large state-owned banks, which faced almost no significant competition from the private sector. Inflation repeatedly reached triple digits during the 1990s, leading to the widespread dollarization of financial holdings. By the final years of the conflict the Angolan kwanza had become so unstable that the country’s banks converted 70 percent of their total assets to US dollars (Aguemon, Mireles, and Ogilvie, 2009). Though the government has since made a credible and sustained effort to rebuild confidence in the kwanza, high rates of financial dollarization persist.36 The dominance of state-owned banks had negative implications for financial-sector stability and the availability of credit. Reserve requirements for government deposits were extremely high, and remain at 100 percent—meaning that for every government-deposited kwanza loaned out by a bank, another kwanza must be held in reserve. In a sector where state-owned banks were the major financial players, government deposits accounted for the lion’s share of bank assets, and high reserve requirements severely restricted the availability of credit. From the 1990s through the early 2000s the Angolan government progressively implemented a series of reforms designed to liberalize the financial sector. After 2002 private banks began to enter the sector in force, and by the end of the decade only one of Angola’s three largest banks was state-owned. The total number of banks rose dramatically, from 9 in 2002 to 18 in 2009 and to 23 in 2012. This process did much to attenuate the sector’s weaknesses. As the inflation rate fell and stabilized, dollarization rates declined; when the global financial crisis reversed this trend, the Angolan Central Bank took swift and decisive steps to manage exchange rate volatility and inject liquidity into the financial sector, effectively stemming the return of dollarization. The credibility of BNA policies and a positive overall economic outlook have prompted the three premier international credit-rating agencies, Moody’s, Fitch and Standard and Poor’s, to upgrade Angola’s long-term foreign-currency ratings to Ba3, BB- and BB-, respectively. Meanwhile the spread of private-sector banks substantially increased private deposits, which face much lower reserve requirements (currently 25 percent for deposits in kwanza) and consequently boosted the availability of credit. The new foreign exchange law described above is further accelerating the growth of kwanza liquidity as part of an effort to curb financial dollarization. Finally, and perhaps most importantly, as the government curtailed its interventions in the sector bank failures and the explicit use of political influence in the banking system became increasingly rare.
36 The dollarization of the financial sector involves significant tradeoffs between short- and long-term stability. In a context of high and unpredictable inflation holding assets in dollars presents considerable advantages, and dollarization may help to limit the impact of macroeconomic volatility on the broader economy. However, high rates of financial dollarization also contribute to systemic solvency and liquidity risks, and may seriously undermine the effectiveness of the government’s monetary policy. See De Nicolo, Honohan and Ize, 2003.

ANGOLA ECONOMIC UPDATE | June 2013 45
Box 13 Growing Pains Current Analysis of the Angolan Financial Sector and Its Governing Policy Framework
Recent joint IMF-World Bank analytical work has provided valuable insights into the ongoing development of the Angolan
financial system, many of which are germane to the analysis presented here. Among these is the enormous progress observed
in the reform of the financial sector, outlined above, which has been reflected in the rapid growth and diversification of financial
services over the past two decades. The government’s most significant recent achievements include establishing the legislative
framework for a public credit registry, which is discussed further below.
However, despite the proliferation of financial firms offering an expanding range of services, the sector faces serious system-
wide challenges. Many Angolan banks remain undercapitalized in the wake of the global financial crisis, and the financial sector
as a whole is exposed to significant vulnerabilities related to the extractive industries and the large, volatile foreign exchange
inflows generated by them. Direct government intervention in the financial sector, especially via the state-owned oil
conglomerate Sonangol, distorts the operations of financial markets, and its role in the sector is only slowly diminishing. In
addition, regulatory and oversight mechanisms are inadequate, banks themselves frequently suffer from significant internal
governance issues, and neither the authorities nor the private sector is adequately prepared to manage external shocks—the
prospect of which is magnified by the large share of European banks in the financial sector (nearly 50 percent), which exposes
Angola to the uncertainty of the ongoing euro zone sovereign debt crisis, though the government is taking action to mitigate this
risk.
Current trends in the Angolan financial sector indicate a number of significant changes, as potentially serious challenges, in
the coming years. A new law governing foreign-exchange inflows is expected to greatly increase the liquidity of Angolan banks,
potentially a very positive development given the sector’s low lending rates and dubious capital-adequacy ratios. Yet rapidly
increasing liquidity also raises the prospect of promoting high-risk banking practices, and adequate safeguards are either not yet
in place or insufficiently enforced. Meanwhile, projected increases in oil revenues are expected to exacerbate the potential for
unsustainable lending. The government and is currently working to resolve these concerns in collaboration with the IMF and
other cooperating partners.
What Role Can Institutions Play in Improving Firms’ Access to Finance? In addition to its excessive concentration, a number of the financial sector’s complimentary private markets are either underdeveloped or nonexistent, including the long-delayed establishment of a national stock exchange. Throughout much of the world, and in a growing number of countries in SSA, selling ownership shares in a stock market is among the most common ways for a company to raise investment capital. Although launching a national stock exchange (the prospective “Luanda bourse”) has long been among the Angolan government’s top economic policy objectives,37 establishing a private equity market will require developing an appropriate administrative and legal framework to govern its operations. The public listing of Angolan firms and the information generated by the operations of a stock exchange—for example, through the disclosure required by private shareholders—would be extremely valuable to financial institutions attempting to weigh the relative creditworthiness of Angolan firms. The general lack of standardized and reliable accounting and auditing services greatly exacerbates the inefficiency of the financial sector. Only 20 percent of Angolan firms have annual financial statements verified by external auditors, while the average for the rest of Africa is over 40 percent. Without dependable third-party verification of firms’ financial records it is very difficult for lenders to determine their solvency. Larger firms are typically better equipped to hire external auditors and therefore communicate their creditworthiness, both because of their greater available resources and because there is typically an economy of scale in auditing—it is more expensive to audit the accounts of a large firm than a small firm, but the difference in cost is not proportional to their difference in size.
37 The building which will house the stock market has already been constructed, with private funds, and was originally scheduled to open in 2008. To date it remains vacant.

46 WORLD BANK | BANCO MUNDIAL
The domestic insurance market’s ability to support the financial sector remains seriously limited, despite its ongoing expansion. Following the implementation of a far-reaching set of market-oriented reforms in the 1990s and early 2000s the insurance industry grew at a remarkable pace, with the number of insurance providers rising from just one state-owned firm to more than 20 private firms over the past two decades; yet the industry remains largely focused on the natural-resource sector, and insurance in other markets is very limited The government is attempting to address some of these deficiencies in financial markets, and the recent establishment of a public credit registry is an especially positive development. The Central de Informação de Riscos de Credito (CIRC), current in its pilot phase, is managed by the BNA. Its primary function is to collect and share information on bank transactions, which it does on a reciprocal basis: only banks that report their transactions to the system can access information from it. Even at this early stage, the BNA reports that 95 percent of banks are already participating in the CIRC system, a further indication of how valuable credit information is in the Angolan financial market. In addition, the authorities continue to extend basic public information and record-keeping services. Property registration and appraisal in particular has failed to keep pace with the rapid growth and increasing sophistication of the Angolan economy. Although the government is attempting to address this through the expansion of land- and asset-registry systems, publicly available property registries remain incomplete and unreliable, and the registration process itself is extremely time-consuming, requiring an average of 184 days—far longer than in comparable countries. Moreover, Angola currently has no functioning collateral registries. Well defined property rights and independent verification of property values will be especially valuable for small firms attempting to borrow against equity.
What Challenges Still Lie ahead? Although the government has made progress in reforming some aspects of the financial sector, less has been achieved in terms of its vital supportive institutions, both public and private. The efficiency of the Angolan financial industry and the availability of credit throughout the economy are constrained by deficiencies in basic public recordkeeping, weaknesses in the judicial system, and the absence of key financial-sector institutions. As a result, information is scarce, legal processes are costly and unpredictable, and the scope of financial services remains very limited. Although this focus section is primarily intended to be descriptive rather than prescriptive, a discussion of the Angolan financial sector must at least touch on the reform process and the government’s available policy options. The government continues to pursue efforts to expand property registration, improve the efficiency of the judicial system, and reduce the costs of legal procedures related to banking and finance, but much remains to be done in each of these areas. A thorough evaluation of these efforts is beyond the scope of the present analysis, but while progress is being made, the inefficiency of the public administration continues to significantly slow the growth and elaboration of financial services, hindering the development of the economy as a whole. In a survey conducted for the 2011 ACR a plurality of respondents listed “inefficient government bureaucracy” as the single most significant obstacle to doing business in Angola (WEF 2011).
The financial barriers to the entry and expansion of small firms described above are compounded by fundamental weaknesses in the business and regulatory climate. While the government’s reform program is ongoing, Angola remains well behind its comparators in nearly all dimensions of economic competitiveness. As noted above, high administrative and regulatory costs topped the list of constraints to doing business reported by firms in the 2012 ACR, and Angola’s infrastructure ranked 136th out of 139 countries (WEF 2011). Perhaps most troubling, however, is the difficulty of starting a business. Despite the consolidation of licensing procedures under a “single desk for entrepreneurs” (Balcão Único do Empreendedor) in 2011, Angola ranked 171st out of 185 countries for ease of doing business in the 2013 Doing Business (DB) report, slipping four places from its 2012 position (IFC 2013). The government has recently taken important steps to address the governance of the financial sector and strengthen the supervisory capacity of the BNA. Prompted by the rapid expansion of the banking sector, the proliferation of financial firms, and the strong and sustained growth of credit supply the authorities are attempting to enhance transparency and ensure accountability in bank management. By the end of 2014 banks operating in Angola will

ANGOLA ECONOMIC UPDATE | June 2013 47
be required to comply with stringent new reporting rules, including the disclosure of shareholders and ownership stakes, as well as a variety of risk-management regulations covering auditing, compliance and mandatory stress-testing. These reforms are highly positive and an encouraging sign of the government’s strong commitment to financial-sector oversight.
Conclusion Angolan firms are characterized by a number of particular features, as a result of the credit constraints they face and to the distortions produced by those constraints. The unique characteristics of Angolan firms are a result of numerous interrelated factors, led by the uneven access to credit. The evidence clearly shows that larger, older firms are significantly and consistently more able to access credit than are smaller, younger firms. Foreign-owned firms are less credit-constrained than domestic firms, and firms located outside Luanda experience more severe credit constraints than firms based in Luanda. While the Angolan financial system has grown and diversified at a remarkable pace over the past two decades, critical weaknesses in the sector itself and in its key supportive institutions, both public and private, continue to negatively impact its efficiency. In particular, many of the atypical features of the Angolan economy appear to be caused by the inability of lenders to effectively determine the creditworthiness of potential borrowers. In order to function properly a financial system must be able to generate credible information about firms’ financial health and solvency, and those firms must be able to communicate that information to lenders. This is no simple task. Producing financial information is a complex process involving a network of mutually supportive public and private institutions, from the registration and licensing agencies that record ownership of firms’ assets, to the insurance providers that calculate and hedge against risks, to the credit-rating services that specialize in evaluating creditworthiness. Without these supportive institutions lenders are forced to rely on less precise indicators, potentially leading to an inefficient, or even structurally biased, allocation of credit. The Angolan financial sector and its supportive institutions are insufficiently developed and cannot generate the information necessary for efficient lending, creating distortions that ripple out through the rest of the economy. The manufacturing, construction, and commercial sectors are all dominated by a small number of large, well established firms, and the financial sector effectively protects these firms from smaller competitors. Market competition is consequently limited throughout the economy, diminishing efficiency incentives and slowing the adoption of new technologies and the spread of new production methods. Meanwhile, foreign firms with access to more developed financial systems abroad enjoy a considerable advantage over Angolan enterprises. The government has made progress in establishing the necessary conditions for the financial sector to thrive, and this has been reflected in the rapid proliferation of banks and other financial service providers, but challenges remain. Until Angolan firms have access to financial system capable of judging them accurately on their merits as borrowers they will be unable to reach their potential as drivers of growth and employment. In order to reach its development objectives, the Angolan government must redouble its efforts to building the necessary institutions and regulatory framework to support a diverse, efficient and competitive financial sector.

48 WORLD BANK | BANCO MUNDIAL
V. ANNEXES

ANGOLA ECONOMIC UPDATE | June 2013 49
Annex 1: Angola – Selected Economic Indicators, 2009-2014
2009 2010 2011 2012(e) 2013(f) 2014(f)
Real economy (percent change, except where noted)
Real GDP 2.4 3.4 3.4 8.1 7.2 7.5
Oil sector -5.1 -3.0 -5.6 5.2 6.0 9.2
Non-oil sector 8.1 7.6 8.9 9.5 7.8 6.7
Nominal GDP -6.1 31.4 24.9 13.5 10.9 14.8
GDP deflator -8.3 27.0 20.8 5.0 3.5 6.7
Consumer prices (period average) 13.7 14.4 13.5 10.3 8.7 7.7
Consumer prices (end of period) 14.0 15.3 11.4 9.0 8.0 7.5
GDP (billions of USD) 72 83 101 113 122 133
GDP (billions of AOA) 5801 7621 9519 10800 11981 13753
Non-oil GDP (billions of AOA) 3138 3921 4894 5852 6843 7854
Central government (percent of GDP)
Revenues and grants 35.7 43.2 50.2 46.0 43.1 42.4
Of which: Oil revenues 25.0 32.8 40.1 37.5 33.8 33.8
Total expenditures 41.1 35.3 38.7 36.5 37.6 37.0
Current expenditures 28.3 25.7 29.8 26.4 27.1 26.5
Capital expenditures 12.8 9.6 8.9 10.1 10.6 10.6
Primary balance -5.4 7.9 11.5 9.6 5.5 5.4
Interest payments 2.2 1.2 1.0 1.0 1.0 0.8
Overall balance -7.6 6.8 10.5 8.6 4.5 4.6
Non-oil primary balance/non-oil GDP -56.2 -48.3 -55.6 -51.6 -49.7 -49.8
Balance of payments (Billions of USD, except where noted)
Exports of goods 40.9 50.6 67.0 69.7 68.5 72.4
Of which: Oil exports 39.4 48.6 64.5 67.4 66.0 69.7
Imports of goods 22.7 16.7 20.2 23.9 25.5 27.3
Trade balance 18.3 33.9 46.8 45.9 43.0 45.1
Terms of trade (percent change) -18.2 14.5 12.3 -5.9 -6.5 -2.1
Current account balance -7.6 7.5 11.3 7.5 6.2 6.7
(as a percentage of GDP) -10.4 9.0 11.2 6.7 5.1 5.0
NIR in months of imports 3.2 5.9 7.1 7.4 8.4 9.3
Exchange rate
Exchange rate (period average, AOA/USD) 79.8 92.2 94.1 95.6 98.5 103.5
Exchange rate (end of period, AOA/USD) 89.6 92.9 95.5 95.7 100.9 105.8
Nominal exchange rate change 6.1 15.6 2.1 1.6 3.0 5.1
E: estimates, F: forecasts
Source: Angolan authorities and World Bank staff estimates and projections.

50 WORLD BANK | BANCO MUNDIAL
Annex 2: Angola – Gross Domestic Product
2009 2010 2011 2012(e) 2013(f) 2014(f)
Sectoral Gross Domestic Product (percent, annual)
Agriculture and Fishing 27.8 5.4 9.1 7.3 9.0 6.8
Extractive Industry -4.4 -3.5 -5.3 5.2 5.9 8.8
Petroleum -5.1 -3.0 -5.6 5.2 6.0 9.2
Other 4.6 -10.3 -0.7 4.6 4.0 4.0
Manufacturing 5.3 10.7 13.0 1.3 8.0 8.0
Electricity 21.3 10.9 3.5 8.3 8.0 8.0
Construction 23.7 16.1 12.0 21.8 11.0 9.1
Commerce -1.5 8.9 9.5 9.3 6.8 6.0
Services 6.0 4.7 9.5 7.5 5.4 4.8
Import Duties 3.3 4.3 -10.3 12.5 6.7 8.1
Sectoral Gross Domestic Product (percent of GDP)
Agriculture and Fishing 9.9 9.1 9.0 9.4 10.0 10.1
Extractive Industry 46.9 49.5 49.5 46.6 43.7 43.6
Petroleum 45.9 48.5 48.6 45.8 42.9 42.9
Other 1.0 0.9 0.9 0.8 0.8 0.7
Manufacturing 5.9 5.7 5.8 5.7 6.1 6.2
Electricity 0.1 0.1 0.1 0.1 0.1 0.1
Construction 7.3 7.4 7.5 8.9 9.7 9.9
Commerce 20.1 19.1 19.0 20.1 21.1 21.0
Services 7.4 6.7 6.7 7.0 7.2 7.1
Import Duties 2.5 2.5 2.3 2.1 2.1 2.1
Expenditure Gross Domestic Product (percent, annual)
Domestic Demand 23.3 -20.5 6.9 12.5 7.2 7.0
Private Consumption 50.3 -28.3 1.6 14.7 7.8 7.4
Public Consumption -14.0 10.6 26.3 2.7 5.0 5.5
Private Investment 32.2 1.0 10.0 24.3 10.8 9.3
Public Investment -27.0 -15.1 2.9 17.3 6.7 6.6
Exports 0.7 0.5 0.3 5.5 7.1 8.4
Imports 24.7 -25.6 4.7 11.2 7.1 7.7
Source: Angolan authorities and World Bank staff estimates and projections.

ANGOLA ECONOMIC UPDATE | June 2013 51
Annex 3: Angola – Fiscal Operations of the Central Government (percent of GDP)
2009 2010 2011 2012(e) 2013(f) 2014(f)
Revenues and grants 35.7 43.2 50.2 46.0 43.1 42.4
Tax revenues 34.3 40.6 47.6 44.3 40.7 40.2
Oil revenues 25.0 32.8 40.1 37.5 33.8 33.8
Non-oil revenues 9.3 7.8 7.5 6.8 6.9 6.4
Of which: Income taxes 3.4 3.1 3.3 3.2 3.4 3.3
Non-tax revenues 1.4 2.6 2.6 1.7 2.3 2.2
Grants 0.0 0.0 0.0 0.0 0.0 0.0
Total expenditures 41.1 35.3 38.7 36.5 37.6 37.0
Current expenditures 28.3 25.7 29.8 26.4 27.1 26.5
Wages 11.5 9.4 9.2 8.6 8.8 8.8
Good and services 6.6 8.1 10.8 11.4 11.7 11.5
Transfers 10.2 8.2 9.7 6.4 6.5 6.1
Capital expenditures 12.8 9.6 8.9 10.1 10.6 10.6
Primary Balance -5.4 7.9 11.5 9.6 5.5 5.4
Interest payments 2.2 1.2 1.0 1.0 1.0 0.8
Domestic 1.6 0.4 0.6 0.6 0.6 0.6
External 0.6 0.8 0.4 0.3 0.3 0.3
Overall Balance -7.6 6.8 10.5 8.6 4.5 4.6
Change in total payments arrears (net) -0.3 0.0 1.6 -0.7 0.0 0.0
Domestic 0.3 0.0 1.6 -0.7 0.0 0.0
External -0.6 0.0 0.0 0.0 0.0 0.0
Overall Balance (cash basis) -7.9 6.8 12.1 7.9 4.5 4.6
Financing 7.9 -6.8 -12.1 -7.9 -4.5 -4.6
External financing (net) 2.2 2.5 1.1 0.8 2.1 2.1
Domestic financing (net) 5.7 -9.3 -13.3 -8.6 -6.6 -6.6
Bank credit (net credit to government) 11.3 -3.8 -5.4 -4.5 -7.2 -7.8
Net central gov claims on the Central Bank 11.0 -3.3 -4.5 -3.1 -6.0 -6.8
Net central gov claims on deposits of banks 0.3 -0.5 -1.0 -1.4 -1.2 -1.0
Non-Monetary Sector -5.7 -5.5 -7.8 -4.1 0.6 1.2
Source: Angolan authorities and World Bank staff estimates and projections.

52 WORLD BANK | BANCO MUNDIAL
Annex 4: Angola – Balance of Payments
Source: Angolan authorities and World Bank staff estimates and projections.
ANGOLA: BALANCE OF PAYMENTS
(millions of USD)
2009 2010 2011 2012E
2013F
2014F
Current account -7,553 7,455 11,306 7,545 6,243 6,706
Trade balace 18,288 33,927 46,806 45,862 42,994 45,146
Exports 40,948 50,594 66,996 69,744 68,480 72,417
Oil crude 39,391 48,630 64,473 67,366 65,985 69,741
Refined oil products and gas 532 722 1,027 943 1,050 1,166
Diamonds 833 970 1,187 1,173 1,175 1,222
Others 192 272 308 262 271 288
Imports 22,660 16,667 20,189 23,882 25,487 27,271
Oil products 4,326 3,159 3,383 4,646 4,971 5,319
Agriculture products and food 3,185 2,774 3,891 4,824 5,094 5,451
Others 15,149 10,734 12,916 14,412 15,421 16,501
Services -18,648 -17,864 -23,086 -25,181 -25,304 -27,157
Exports 623 856 532 457 678 861
Imports 19,271 18,720 23,618 25,638 25,983 28,018
Income -6,823 -8,171 -11,938 -12,660 -10,927 -10,717
Credit (net receipts) 131 134 138 138 138 138
Debit (net payments) 6,954 8,305 12,076 12,798 11,065 10,855
Transfers -371 -438 -476 -476 -520 -567
Of which: workers´remittances -397 -395 -456 -496 -540 -587
Capital and financial account 2,316 -1,286 -2,820 -3,018 -784 109
Short and long term Private C&F account 203 -2,955 -3,965 -4,394 -3,278 -2,642
a) Foreign Direct Investment (FDI) 2199 -4567 -5574 -3,500 -1,500 1,000
From Which:
Reinvestment 2,743 3,325 4,899 5,157 4,371 4,240
b) Medium, long and short term private capital -1,996 1,612 1,609 -894 -1,778 -3,642
Public External financing 1,524 2,093 1,144 1,376 2,494 2,751
Borrowing 1,719 2,433 2,689 2,637 1,494 1,751
Disbursements 4,579 5,702 5,959 5,910 5,220 5,220
Amortization -2,860 -3,270 -3,270 -3,274 -3,726 -3,469
Government deposits abroad (Escrow account flows) -195 -339 -1,545 -1,260 1,000 1,000
Errors and omissions 589 -424 0 0 0 0
Overall Balance -5,237 6,169 8,486 4,527 5,458 6,814
Financing 5,237 -6,169 -8,486 -4,527 -5,458 -6,814
Net international reserves 4,828 -6,100 -8,616 -4,527 -5,458 -6,814
Excepcional financing 409 -69 130 0 0 0
Notes:
Trade balace (percent of GDP) 25.3 41.1 46.3 40.6 35.4 34.0
Current account (percent of GDP) -10.4 9.0 11.2 6.7 5.1 5.0
Stock of Net international reserves (percent of GDP) 15.7 21.1 25.8 27.1 29.6 32.3
E: estimates, F: forecasts

ANGOLA ECONOMIC UPDATE | June 2013 53
Annex 5: Statistical Appendix for Special Focus Section
Sample Statistics of the World Bank Enterprise Surveys for Angola, 2006 and 2010
Source: World Bank Enterprise Surveys
Size Frequency Percent Frequency Percent
Small (1-19 employees) 355 83.5 184 51.1
Medium (20-99 employees) 64 15.1 131 36.4
Large (100+ employees) 6 1.4 45 12.5
Total 425 100.0 360 100.0
Size Frequency Percent Frequency Percent
Small (1-19 employees) 355.7 83.7 193.8 53.8
Medium (20-99 employees) 62.4 14.7 127.3 35.4
Large (100+ employees) 6.9 1.6 38.9 10.8
Total 425 100.0 360 100.0
Without Sample Weights
2006 2010
2006 2010
With Sample Weights
54 WORLD BANK | BANCO MUNDIAL
VI. BIBLIOGRAPHY
� AfDB (2012). “Angola Private Sector Country Profile”, Tunis: African Development Bank. � AfDB et al. (2012), “Angola, in African Economic Outlook 2012: Promoting Youth Employment” OECD � Aguemon, H., I. Mireles and S. Ogilvie (2009). “Angola Financial Systems”,
http://fic.wharton.upenn.edu/fic/africa/angola%20final-final.pdf � Akerlof, G. (1970). “The Market for Lemons: Quality Uncertainty and the Market Mechanism” The Quarterly
Journal of Economics 84 (3): 488-500. � Alba, E. (2009). “The Extractive Industries Value Chain: A Comprehensive Integrated Approach to Developing
Extractive Industries” Africa Region Working Paper Series #125. Washington DC: The World Bank � Ayyagari, M., A Demirguc-Kunt and V. Maksimovic, (2011). “Small vs. Young Firms across the World:
Contributions to Employment, Job Creation, and Growth”, World Bank Policy Research Working Paper 5631. Washington DC: The World Bank.
� Ayyagari, M., A. Demirguc-Kunt and V. Maksimovic (2012). “Financing of Firms in Developing Countries: Lessons from Research”, World Bank Policy Research Working Paper 6036. Washington DC: The World Bank
� Barma, N., K. Kaiser, T.M. Le and L. Viñuela (2012). “Rents to Riches? The Political Economy of Natural Resource -Led Development” Washington DC: World Bank
� Beck, T. (2007). “Financing Constraints of SMEs in Developing Countries: Evidence, Determinants and Solutions”, Washington DC: World Bank.
� Beck, T., A. Demirgüç-Kunt and V. Maksimovic (2005). “Financial and Legal Constraints to Firm Growth: Does Firm Size Matter?” Journal of Finance no. 60, pp. 137-177.
� BNA (2012). “Determinantes da Inflação em Angola”, Luanda: Banco Nacional de Angola. � BNA (2012). “Relatório de Inflação - III trimestre de 2012”, Luanda: Banco Nacional de Angola. � BNA (2012). “Relatório de Estabilidade - I Semestre de 2012”, Luanda: Banco Nacional de Angola. � Claessens, S. (2009). "Competition in the Financial Sector: Overview of Competition Policies", World Bank Research
Observer, World Bank Group, vol. 24(1), pages 83-118. � Claessens, S., and L. Laeven (2004). "What Drives Bank Competition? Some International Evidence" Journal of
Money, Credit and Banking vol. 36(3), pp. 563-83. � De Nicoló, G., P. Honohan and A. Ize (2003). “Dollarization of the Banking System: Good or Bad?” World Bank
Policy Research Working Paper 3116. Washington DC: World Bank. � Herberger, A. (2005). “On the Process of Growth and Economic Policy in Developing Countries” USAID PPC Issue
Paper no. 13. Washington DC: USAID � IMF (2012). “2012 Article IV Consultation and Post Program Monitoring”, IMF Country Report 12/215. Washington
DC: The International Monetary Fund. � IMF (2012). “Fiscal Frameworks for Resource-Rich Developing Countries” Washington DC: The International
Monetary Fund. � INE (2012). “Estatísticas do Ficheiro de Unidades Empresariais” Luanda: Instituto Nacional de Estatística. � Klapper, L., L. Laeven and R. Rajan (2006). “Entry Regulation as a Barrier to Entrepreneurship” Journal of Financial
Economics vol. 82 (3) pp.591– 629. � Klein, N. (2010). “The Linkage between the Oil and the Non-oil Sectors—A Panel VAR Approach”, IMF Working
Paper 10/118. Washington DC: The International Monetary Fund. � Klein, N. and A. Kyei (2009). “Understanding Inflation Inertia in Angola”, IMF Working Paper 09/98. Washington
DC: International Monetary Fund. � Ley, E. (2010) “Exhaustible Resources and Fiscal Policy: Copper Mining in Zambia” Zambia PER Background
Paper. Washington DC: The World Bank � Love, L. and M. Martinez Peria (2012). “How Bank Competition Affects Firms’ Access to Finance”, World Bank
Policy Research Working Paper 6163. Washington DC: The World Bank. � Petrie, M. (2009) “Public Investment Management in Resource Rich Countries: Overview Paper” Washington DC:
The World Bank (unpublished)

ANGOLA ECONOMIC UPDATE | June 2013 55
� Raghuram R., and L. Zingales (1998). “Financial Dependence and Growth” The American Economic Review vol. 88, (3), pp. 559-586.
� Rajaram, A., T.M. Le, N. Biletska and J. Brumby, (2008). “A Diagnostic Framework for Assessing Public Investment Management” Washington DC: The World Bank
� WEF (2011). “The Africa Competitiveness Report 2011”, World Economic Forum, the World Bank and the African Development Bank.
� World Bank (2006). “Angola Country Profile 2006”, World Bank Enterprise Survey. Washington DC: World Bank � _____ (2007). “Angola Country Economic Memorandum: Oil, Broad-based Growth, and Equity”, Washington DC:
The World Bank. � _____ (2010). “Angola Country Profile 2010”, World Bank Enterprise Survey. Washington DC: The World Bank � _____ (2013). “Doing Business 2013: Smarter Regulations for Small and Medium-Size Enterprises”, Washington,
DC: The World Bank. � _____ (2013). Global Economic Prospects vol. 6 Washington, DC: World Bank

56 WORLD BANK | BANCO MUNDIAL
The World Bank | Banco Mundial
Largo Albano Machado, 23/25
Luanda, Angola
www.worldbank.org/angola
Tel. +244 222 394727
+244 222 394928
© 2013 The World Bank
All Rights Reserved