The WINSOM Solid Modeller and its Application to Data Visualization
21
The WINSOM solid modeller and its application to data visualization The IBM United Kingdom Scientific Centre's WINches- ter SOlid Modelling system (WINSOM) is a set-theoretic, constructive solid geometry (CSG)modeller based on recursive division techniques. It specializes in handling complex models and provides graphical facilities in- tended for engineering applications. This paper de- scribes WINSOM and some of the many programs that are linked to it, and gives examples of their application to problems of data visualization. T he WINchester SOlid Modelling system, here- after referred to as WINSOM, has been under development at the IBM United Kingdom Scientific Centre since 1983. 1 The main feature that differen- tiates WINSOM from most of the many other solid modelling systems currently available is its ability to handle large models efficiently. WINSOM is distinguished from other systems in a number of additional respects. First, it is able to represent a wide domain of shapes. A large range of conventional geometric primitives as well as uncon- ventional ones such as numerically defined fields are available in WINSOM. Shape operations such as bends and blends are also supported. Second, a number of different methods are used to create WINSOM models. WINSOM has its own simple 548 BURRIDGE ET AL by J. M. Burridge B. M. Collins B. N. Galton A. R. Halbert T. R. Heywood W. H. Latham R. W. Phippen P. Quarendon P.Reilly M. W. Ricketts J. Simmons S.J.P. Todd A. G. N. Walter J. R. Woodwark language, but this has recently been supplemented by the ESME (Extensible Solid Model Editor) lan- guage, which has special geometric data types and geometric and programming constructs. The lan- guage is designed to support interactive graphical editing. These general-purpose input media are fur- ther augmented by a number of programs which generate models from databases, Prolog fact bases, and image analysis. Third, WINSOM is distinguished from other systems by being oriented more toward picture production than most engineering solid modellers; a wide spec- trum of different rendering techniques are available in WINSOM and its associated programs. These range from simple approximate wire frames for quick view- ing to ray-traced textured pictures. The range of tasks for which WINSOM has been used is one of the reasons why it has acquired such a wide repertoire of modelling and rendering techniques. © Copyright 1989by International BusinessMachines Corporation. Copying in printed form for private use is permitted without payment of royalty provided that (I) each reproduction is done without alteration and (2) the Journal reference and IBM copyright notice are included on the first page. The title and abstract, but no other portions, of this paper may be copied or distributed royalty free without further permission by computer-based and other information-service systems. Permission to republish any other portion of this paper must be obtained from the Editor. IBM SYSTEMS JOURNAL, VOL 28, NO 4, 1989
Transcript of The WINSOM Solid Modeller and its Application to Data Visualization
The WINSOM solid modellerand its application to datavisualization
The IBM United Kingdom Scientific Centre's WINches-ter SOlid Modelling system (WINSOM) is a set-theoretic,constructive solid geometry (CSG) modeller based onrecursive division techniques. It specializes in handlingcomplex models and provides graphical facilities in-tended for engineering applications. This paper de-scribes WINSOM and some of the many programs thatare linked to it, and gives examples of their applicationto problems of data visualization.
T he WINchester SOlid Modelling system, here-after referred to as WINSOM, has been under
development at the IBM United Kingdom ScientificCentre since 1983.1 The main feature that differen-tiates WINSOM from most of the many other solidmodelling systems currently available is its ability tohandle large models efficiently.
WINSOM is distinguished from other systems in anumber of additional respects. First, it is able torepresent a wide domain of shapes. A large range ofconventional geometric primitives as well as uncon-ventional ones such as numerically defined fields areavailable in WINSOM. Shape operations such as bendsand blends are also supported.
Second, a number of different methods are used tocreate WINSOM models. WINSOM has its own simple
548 BURRIDGE ET AL
by J. M. BurridgeB. M. CollinsB. N. GaltonA. R. HalbertT. R. HeywoodW. H. LathamR. W. PhippenP. QuarendonP.ReillyM. W. RickettsJ. SimmonsS.J.P. ToddA. G. N. WalterJ. R. Woodwark
language, but this has recently been supplementedby the ESME (Extensible Solid Model Editor) lan-guage, which has special geometric data types andgeometric and programming constructs. The lan-guage is designed to support interactive graphicalediting. These general-purpose input media are fur-ther augmented by a number of programs whichgenerate models from databases, Prolog fact bases,and image analysis.
Third, WINSOM is distinguished from other systemsby being oriented more toward picture productionthan most engineering solid modellers; a wide spec-trum of different rendering techniques are availablein WINSOM and its associated programs. These rangefrom simple approximate wire frames for quick view-ing to ray-traced textured pictures.
The range of tasks for which WINSOM has been usedis one of the reasons why it has acquired such a widerepertoire of modelling and rendering techniques.
© Copyright 1989by International BusinessMachines Corporation.Copying in printed form for private use is permitted withoutpayment of royalty provided that (I) each reproduction is donewithout alteration and (2) the Journal referenceand IBM copyrightnotice are included on the first page. The title and abstract, but noother portions, of this paper may be copied or distributed royaltyfree without further permission by computer-based and otherinformation-service systems. Permission to republish any otherportion of this paper must be obtained from the Editor.
IBM SYSTEMS JOURNAL, VOL 28, NO 4, 1989
This extends far beyond the usual engineering com-ponent design role-one for which WINSOM is per-haps least well suited, and which we have hardlyexplored. The applications that have been exploredvary from molecular graphics to computer sculptureand from the generation of single images to theproduction often-minute animations. The only ob-vious link between these applications is that they allinclude large sets of three-dimensional geometricdata, and WINSOM is thus best represented as a datavisualization modeller.
Modelling techniques
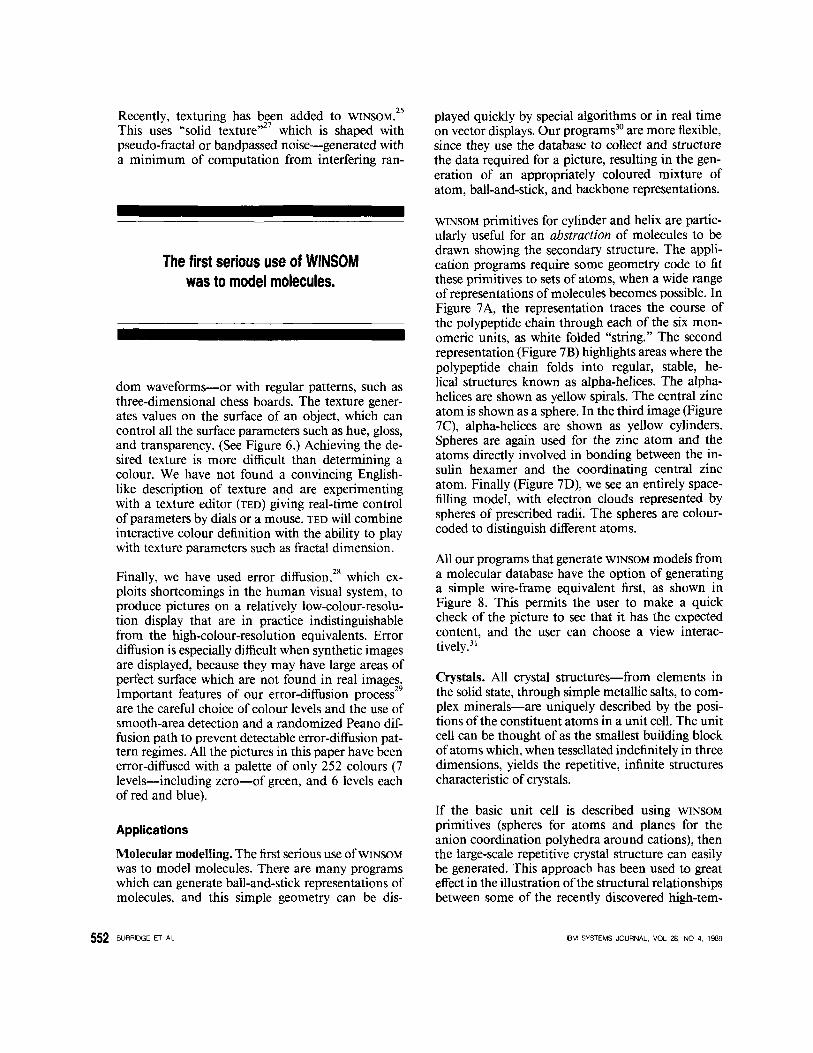
While it does not impinge upon the average user,WINSOM is unusual in being a set-theoretic or eSG(constructive solid geometry) modeller. This meansthat it represents solids as the set-theoretic combi-nation ofsimple primitive shapes (Figure IA to ID).Thus, shapes such as spheres and cones can be addedto or subtracted from one another to create a morecomplex shape. This contrasts with the majority oftoday's systems, which represent solids as theirboundary surfaces, linked into a coherent whole bytopological information. Although many other mod-ellers use the set-theoretic operations as input tech-niques, they build a boundary model internally; WIN-SOM does not. Virtues of this approach include nu-merical stability and compactness; disadvantagesinclude nonuniqueness and the absence of localizedsurface information, such as edges and vertices.
Recursive division. Historically, the lack oflocalizedinformation has made computations using set-theo-retic models very expensive, since the entire modelmust be processed to find even the simplest feature,such as part of the surface of the model. WINSOMovercomes this problem by using a technique knownas spatial division, which was first implemented inVOLE (VOLume Bvaluator)." Instead of searching themodel to try to find its surface, the space that themodel occupies is divided into smaller subspaces.For each of these subspaces, new set-theoretic "sub-models" are created by replacing those primitivesthat do not have a surface in the subspace by theempty or universal set and performing elementarysimplifications.' These new submodels, which areusually smaller and simpler, are only valid in theappropriate subspace.
In the basic WINSOM algorithm for creating pictures,the space occupied by the whole model is a frustumofa pyramid whose apex is at the viewpoint. This issegmented by eight-way division into smaller sec-
IBM SYSTEMS JOURNAL, VOL 28, NO 4, 1989
tions, and this process is repeated recursively. Itcontinues until a subspace is proved to be entirelyempty, or until it is the size of a pixel on the screen,
Simple submodels areavailable just where they are needed
to compute parts of the picture.
meaning that the area of the pixel corresponds to theface of the frustum facing the viewpoint. Thus, thesimple submodels are available just where they areneeded to compute parts of the picture.
To enforce hidden-surface elimination, division pro-ceeds in a front-to-back order, and the current pic-ture is maintained using a quad tree. (For a generaldiscussion of quad-tree structures, see Reference 4.)When a quad has been coloured, the volume behindit is not divided further. By this means, the WINSOMalgorithm avoids most of the computation in regionsof space that are hidden, even if they contain com-plex data.
We have improved the original VOLE algorithm in anumber of ways, in particular by dealing more effi-ciently with the small submodels generated by thespatial division process. These small models are rep-resented as truth tables.' This speeds membershiptesting and also automatically ignores redundant andrepeated primitives. It greatly improves WINSOM'Sperformance.
Similar techniques are used for other types of ren-dering. To produce wire frames, or ray-traced pic-tures, the division is performed on an original cuboidcontaining the model and does not terminate untila limiting value of complexity is reached. (This topicis discussed further in Reference 6.) At this point,Fastfrraw' generates segments of a wire frame; theray-tracer stores the divided model and then firesrays into it during picture production.Y'"
BURRIDGE ET AL. 549
Input to WINSOM
As it was first written, WINSOM included a simpleinput language. This allowed primitives to be de-fined, transformed, and combined with the set-the-oretic operators. Further commands specified theview to be produced and the lighting required. WhenWINSOM started being used for large-scale molecularmodelling, the shortcomings of this interfaceemerged. It became necessary to generate modelsautomatically. A programmable interface, connectedvia a relational database1
1-13 or PROLOG,14,15 extracts
Asingle shape may have more thanone definition.
molecular information from the Brookhaven data-bank. 16 The same interface is also applicable to gen-erating WINSOM models from other databases andProlog fact bases.
ESME. While the database and image work was verysuccessful, no improvement was made to the generalusability of WINSOM. In 1986, work started on theESME (Extensible Solid Model Editor) language."This language includes conveniences such as specialgeometric data types (e.g., vectors) and operations(e.g., vector products), together with programmingfacilities such as variables, loops, and subprograms.Other set-theoretic languages such as SML (SolidModelling Language)" and SID (Set-theoretic Inputto DORA)9have these facilities, but the design of ESMEhas been taken a stage further by the inclusion offeatures which are designed to assist the building ofinteractive graphical editors for particular applica-tions.
Despite the programming excellence of ESME, thereare still severe problems that prevent us from writinggeneral graphical editors. These hinge on the non-uniqueness ofthe set-theoretic model. A single shapemay have more than one definition. We have lookedat the simplification of set-theoretic models throughthe elimination of redundant primitives" which re-lieves the designer of some worry about the set-theoretic efficiency of a model.
550 BURRIDGE ET AL
The set-theoretic definition of a model cannot bededuced from the picture on the screen. Thus, if wetry to modify the model by interacting with thepicture-for instance by moving a primitive-theeffect depends on the original definition and is thussomewhat unpredictable. One tool that we havefound to attack this problem is the active zoneconcept of Rossignac and Voelcker. 20 The activezone of a primitive is the region of the model thatcan be affected by changing the geometry of theprimitives. It depends on the model definition as wellas its shape. By displaying the active zone, we getsome indication of what a particular change willachieve."
Output from WINSOM
Static pictures. The basic WINSOM algorithm pro-duces coloured and shaded images, which may be litby multiple light sources, but shadows and reflectionscannot be modelled. These pictures are more thanadequate for most of the data-visualization applica-tions with which we are involved. As mentionedabove, there is also a ray-tracing module in WINSOM,and this is able to produce the shadows and reflec-tions so beloved by computer graphics aficionados.There is a time penalty for this, although in thisprogram the spatially-divided model may be reusedfor a number of views. At the other extreme, low-resolution pictures are easy to produce quickly usingthe WINSOM algorithm and are widely used for modeland view verification. Wire frames may be generatedusing the FastDraw program, and these can be ani-mated on a device such as the IBM 5080. Figure 2shows the different types of rendering produced byWINSOM: Figure 2A shows the central WINSOM algo-rithm; Figure 2B shows ray-tracing into a dividedmodel; and Figure 2C shows wire-frame generation.This model is made up of 55 planes, 131 spheres,and 340 cylinders. Wire-frame output is about fourorders of magnitude cheaper than ray-tracing, withthe central WINSOM algorithm positioned betweenthese two extremes. However, these differences arereduced for complex models.
FastDraw sacrifices accuracy to speed. As divisionprogresses, the ratio ofmodel complexity to subspacesize is monitored. If it becomes too large, work onthat subspace is halted and the submodel is aban-doned. This avoids spending time on complex re-gions that contribute little to the visual impact of thefinal model. For models containing hundreds ofprimitives, these wire frames can be computed inunder a second on an IBM 3081 processor and are
IBM SYSTEMS JOURNAL, VOL 28, NO 4, 1989
used for verifying input and some view planning.The wires in the wire frame inherit the colours ofneighboring surfaces to enhance the legibility of thedisplay. Nevertheless, as with all wire frames, inter-preting the picture becomes difficult as model sizeincreases. FastDraw can also prepare a polygon sur-face from a model. Using polygon sorting or z-buffering (a technique for the removal of hiddensurfaces by discarding all but the nearest surface atevery pixel) on appropriate hardware, this can givea series oflow-quality rendered hidden-surface viewsclose to real time.
Animation. Static WINSOM images can help the re-searcher to visualize, analyse, and validate the dataand support proposed theories. Over the last fewyears, we have increasingly been drawn into usingWINSOM to produce frames for (longer and longer)animation sequences, and we are demonstrating thatanimation can dramatically enhance visualization.Not only can animation provide structured "tours"in, around, and through our solid models, but it canalso convey the evolution of those models in time-a capability which can be of great value in scientificapplications.
Our first animation was a "fly-through" of a recon-struction of the Saxon minster in Winchester (shownlater in Figure 13), and we have recently undertakenlonger animations. Figure 3A to 3C shows framesfrom an animation for an exhibition of the work ofLeonardo da Vinci. These frames illustrate sequencesshowing the "growth" of a church from the groundplan. Figure 20, shown later, depicts sequences of acomputer sculpture in motion.
Nongraphical output. WINSOM is able to computevolume and surface area properties (which tradition-ally are used to prove that the model really is solid).The ability to obtain nongraphical data interactivelyis more interesting: A tablet is used to identify apoint on a picture. Once the visible object is found,properties such as surface normal (i.e., surface ori-entation), colour, and location can be identifiedwithin the model definition. 22
,23
Low-level detailing. Within the WINSOM environ-ment, there are a number of utilities which, althoughnot associated with modelling, contribute strongly tothe system's ability to produce acceptable pictures.One problem encountered early in producing col-oured images is that of obtaining shades of colourthat have the user's approval. We have extended theColour Naming System'" to include names for sur-
IBM SYSTEMS JOURNAL. VOL 28, NO 4, 1989
face rendering parameters such as glossiness andpolish" (Figure 4).
The following commands were used to generate thepicture in Figure 4:
DRAW 0 at(l,9,O) cnsx(blue)U 0 at(3,9,O)cnsx(green)U 0 at(5,9,O)cnsx(bluish green)U 0 at(7,9,0) cnsx(grayish bluish green)U 0 at(9,9,O)cnsx(medium grayish bluish green)
U 0 at(2,6,O)cnsx(yellow)U 0 at(4,6,O) cnsx(glossy yellow)U 0 at(6,6,O) cnsx(very polished glossy yellow)U 0 at(8,6,O)cnsx(plastic matt yellow)
The first row in the figure shows control of basiccolour. Blue, green, and bluish green control hue,grayish controls saturation, and medium controlsbrightness. The second row in the figure shows con-trol of the highlights (specular reflection). Glossy andmatt control the strength of highlight, verypolishedcontrols the size of the highlight, and plasticcontrolsits colour.
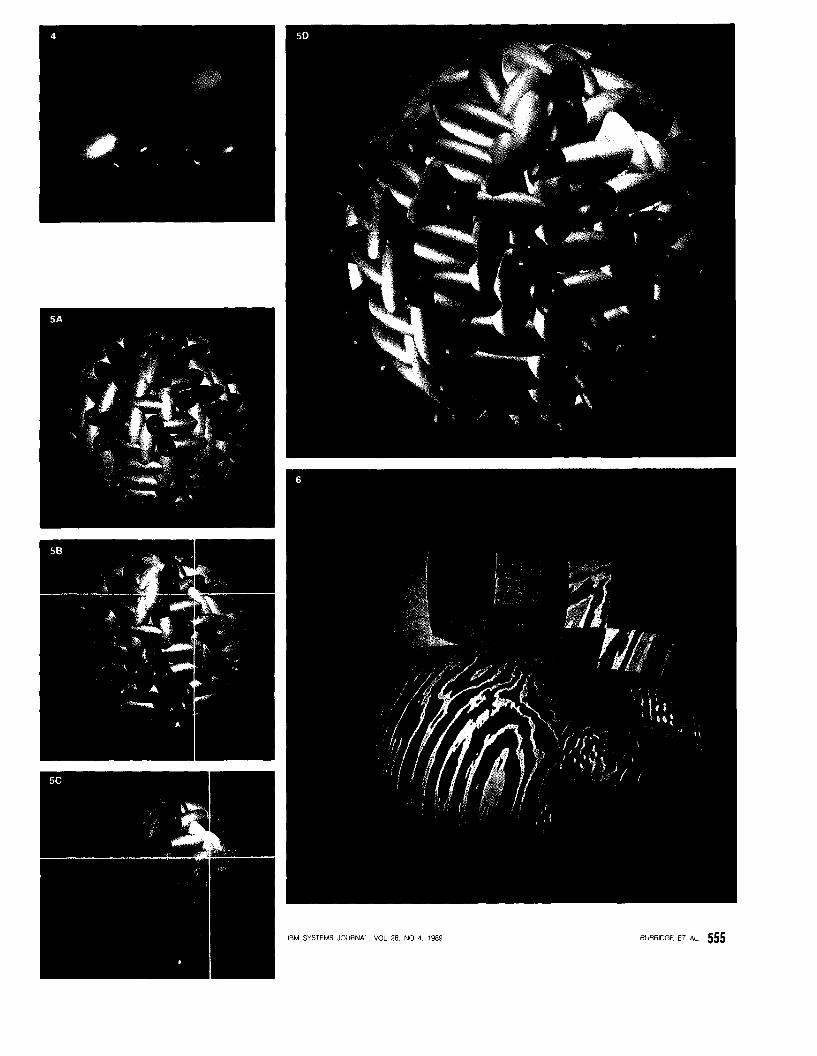
Having dealt with colour, we must determine theappropriate lighting for a scene. Positioning anddirecting lights in the imaginary space of a solidmodel is known to be difficult. We believe that ourSLED (Solid Lighting EDitor) program" presents anoriginal solution to this difficulty. WINSOM is able toproduce an augmented image type, in which pixelsare labelled with depth and surface normal as wellas colour. SLED accepts a picture in this form andallows the user to vary the lighting parameters. Be-cause a normal WINSOM run does not produce shad-ows and reflections, the result of new lighting param-eters can be displayed explicitly (Figure 5A). Work-ing at low resolution, the system is fast enough togive an interactive "feel." In Figure 5B, the cursorhas identified the target of an alternative light. InFigure 5C, the cursor has set the spread of thespotlight. The final picture, Figure 5D, is the resultof adding two more lights.
However, the main feature of SLED is that the lightscan be specified both by their position (which can bedifficult to fix) and by their effect on the scene. Theuser specifies the highlights on the displayed object,and the system works backward from these specifi-cations to determine the light position. The angle ofthe beam and its position can be determined. Thisis important because the user can indicate the sizeas well as the position of the desired highlights.
BURRIDGE ET Al. 551
Recently, texturing has been added to WINSOM.25
This uses "solid texture'r" which is shaped withpseudo-fractal or bandpassed noise-generated witha minimum of computation from interfering ran-
The first serious use of WINSOMwas to model molecules.
dom waveforms-or with regular patterns, such asthree-dimensional chess boards. The texture gener-ates values on the surface of an object, which cancontrol all the surface parameters such as hue, gloss,and transparency. (See Figure 6.) Achieving the de-sired texture is more difficult than determining acolour. We have not found a convincing English-like description of texture and are experimentingwith a texture editor (TED) giving real-time controlof parameters by dials or a mouse. TED will combineinteractive colour definition with the ability to playwith texture parameters such as fractal dimension.
Finally, we have used error diffusion," which ex-ploits shortcomings in the human visual system, toproduce pictures on a relatively low-colour-resolu-tion display that are in practice indistinguishablefrom the high-colour-resolution equivalents. Errordiffusion is especially difficult when synthetic imagesare displayed, because they may have large areas ofperfect surface which are not found in real images.Important features of our error-diffusion process"are the careful choice of colour levels and the use ofsmooth-area detection and a randomized Peano dif-fusion path to prevent detectable error-diffusion pat-tern regimes. All the pictures in this paper have beenerror-diffused with a palette of only 252 colours (7levels-including zero-of green, and 6 levels eachof red and blue).
Applications
Molecular modelling. The first serious use of WINSOMwas to model molecules. There are many programswhich can generate ball-and-stick representations ofmolecules, and this simple geometry can be dis-
552 BURRIDGE ET AL
played quickly by special algorithms or in real timeon vector displays. Our programs" are more flexible,since they use the database to collect and structurethe data required for a picture, resulting in the gen-eration of an appropriately coloured mixture ofatom, ball-and-stick, and backbone representations.
WINSOM primitives for cylinder and helix are partic-ularly useful for an abstraction of molecules to bedrawn showing the secondary structure. The appli-cation programs require some geometry code to fitthese primitives to sets of atoms, when a wide rangeof representations of molecules becomes possible. InFigure 7A, the representation traces the course ofthe polypeptide chain through each of the six mon-omeric units, as white folded "string." The secondrepresentation (Figure 7B) highlights areas where thepolypeptide chain folds into regular, stable, he-lical structures known as alpha-helices. The alpha-helices are shown as yellow spirals. The central zincatom is shown as a sphere. In the third image (Figure7C), alpha-helices are shown as yellow cylinders.Spheres are again used for the zinc atom and theatoms directly involved in bonding between the in-sulin hexamer and the coordinating central zincatom. Finally (Figure 7D), we see an entirely space-filling model, with electron clouds represented byspheres of prescribed radii. The spheres are colour-coded to distinguish different atoms.
All our programs that generate WINSOM models froma molecular database have the option of generatinga simple wire-frame equivalent first, as shown inFigure 8. This permits the user to make a quickcheck of the picture to see that it has the expectedcontent, and the user can choose a view interac-tively."
Crystals. All crystal structures-from elements inthe solid state, through simple metallic salts, to com-plex minerals-are uniquely described by the posi-tions of the constituent atoms in a unit cell. The unitcell can be thought of as the smallest building blockof atoms which, when tessellated indefinitely in threedimensions, yields the repetitive, infinite structurescharacteristic of crystals.
If the basic unit cell is described using WINSOMprimitives (spheres for atoms and planes for theanion coordination polyhedra around cations), thenthe large-scale repetitive crystal structure can easilybe generated. This approach has been used to greateffectin the illustration ofthe structural relationshipsbetween some of the recently discovered high-tem-
IBM SYSTEMS JOURNAL, VOL 28, NO 4, 1989
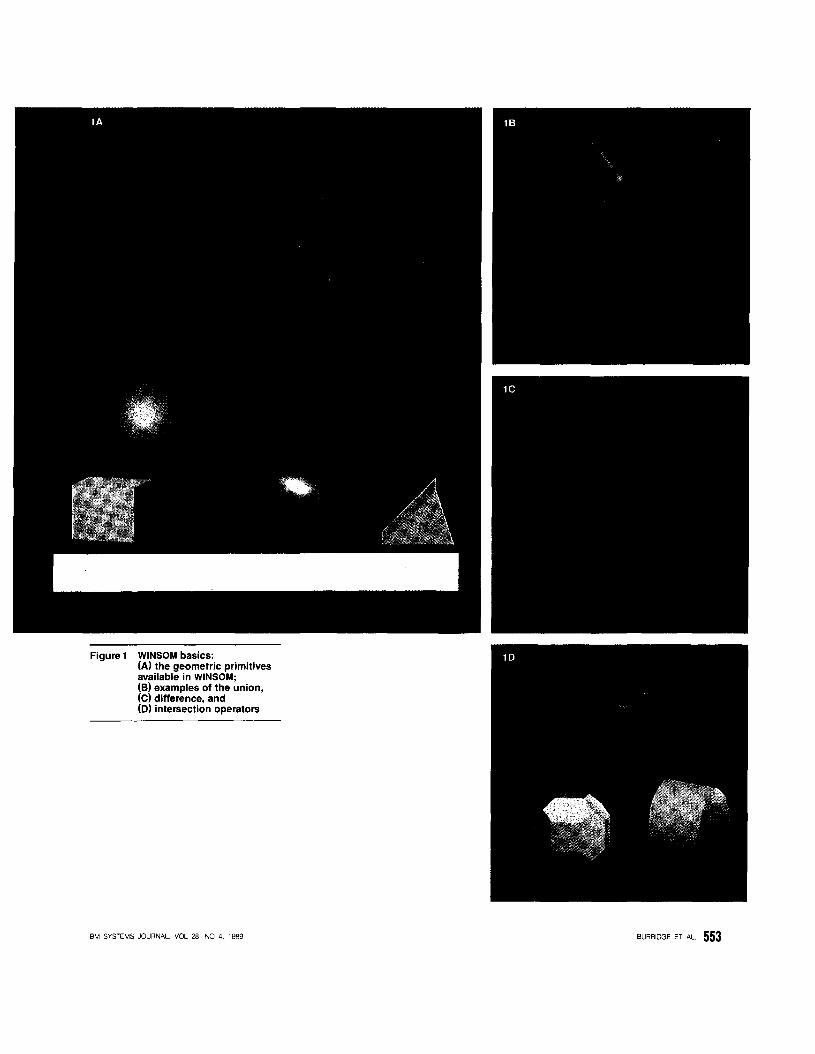
Figure 1 WINSOM basics:(A) the geometric primitivesavailable in WINSOM;(8) examples of the union,(e) difference, and(0) intersection operators
IBM SYSTEMS JOURNAL, VOL 28, NO 4, 1989 BURRIOGE ET AL, 553
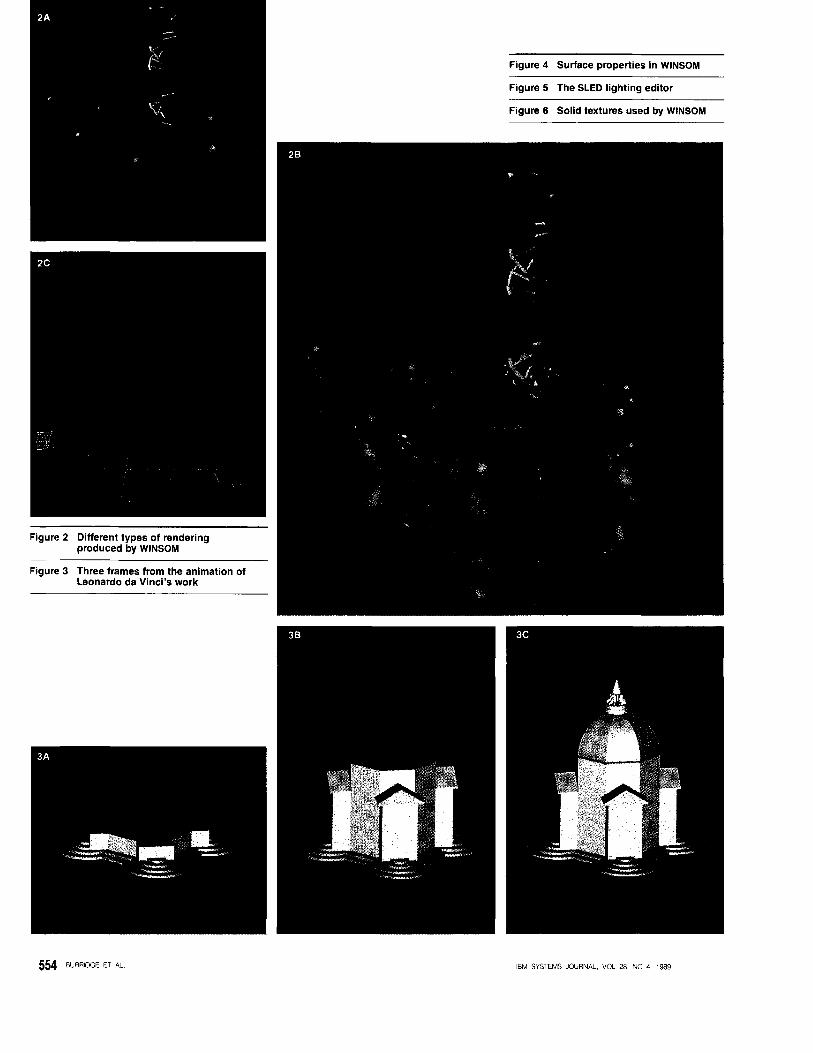
Figure 3 Three frames from the animation ofLeonardo da Vinci's work
554 BURRIDGE ET AL
Figure 4 Surface properties in WINSOM
Figure 5 The SLED lighting editor
Figure 6 Solid textures used by WINSOM
IBM SYSTEMS JOURNAL, VOL 28, NO 4, 1989
IBM SYSTEMS JOURNAL, VOL 28, NO 4, 1989 BURRIDGE ET Al 555
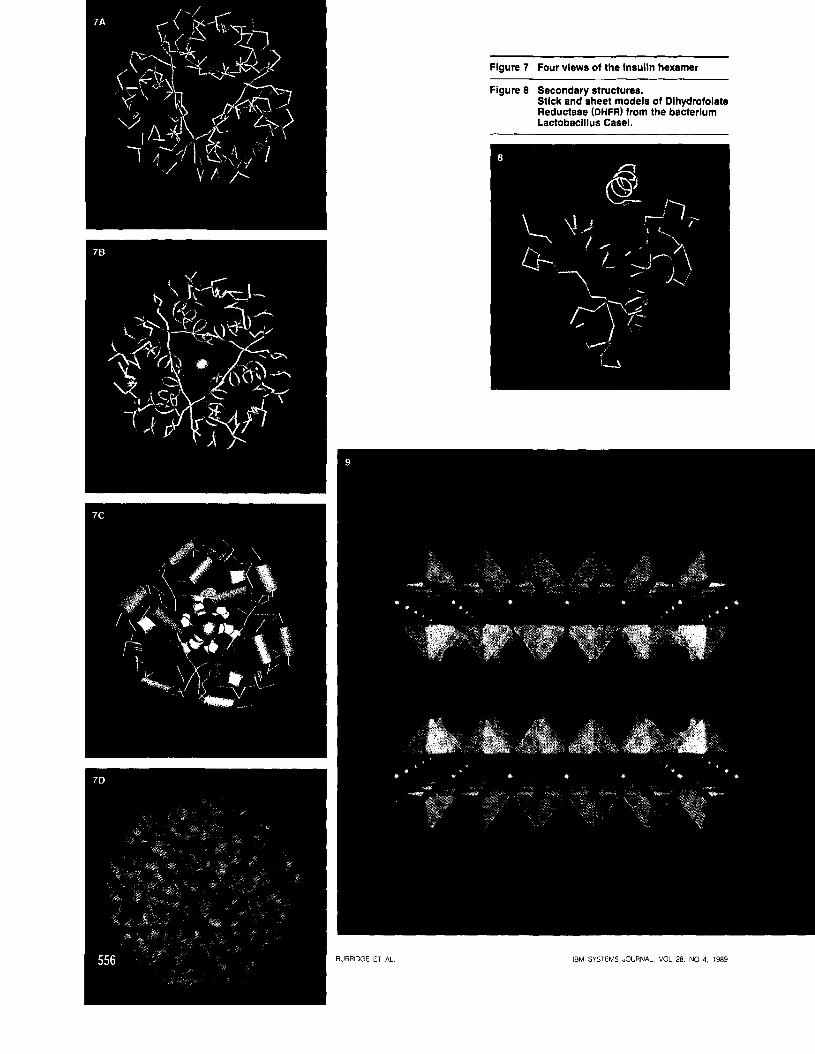
Figure 7 Four views of the Insulin hexamer
Figure 8 Secondary structures.Stick and sheet models of DlhydrofolateReductase (DHFR) from the bacteriumlactobacillus Casel.
BURRIDGE ET AL IBM SYSTEMS JOURNAL, VOL 28, NO 4, 1989
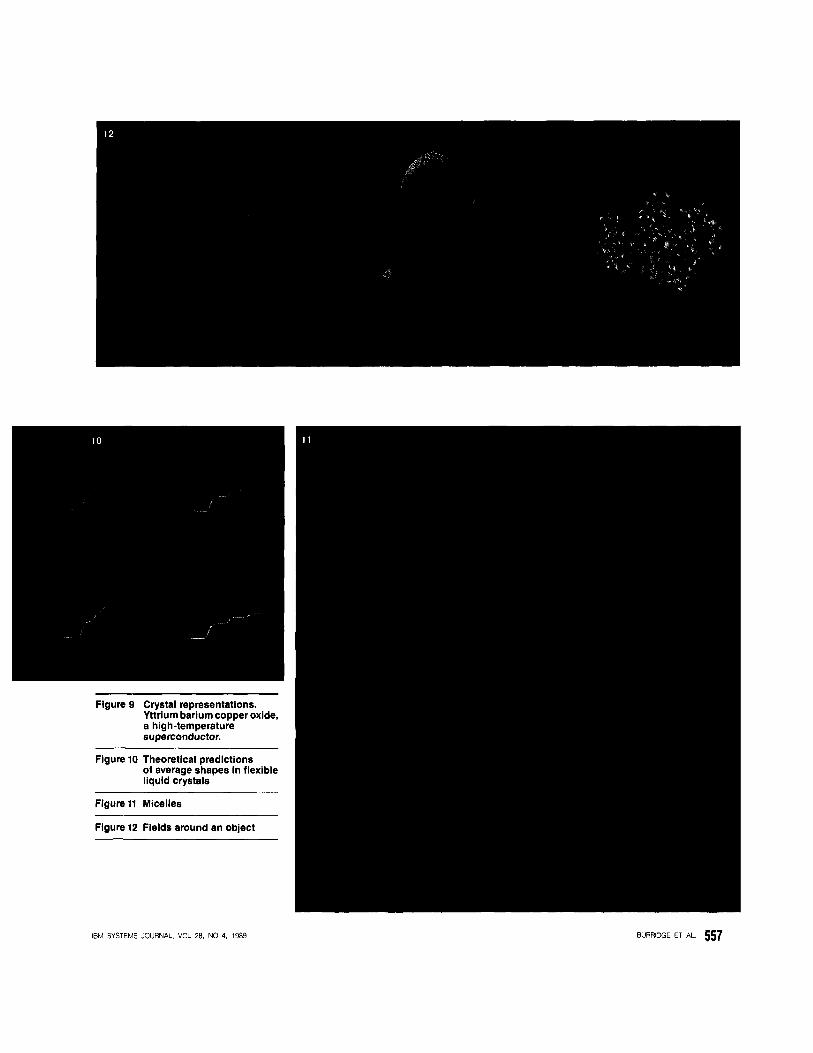
Figure 9 Crystal representations.Yttrium barium copper oxide,a high-temperaturesuperconductor.
Figure 10 Theoretical predictionsof average shapes in flexibleliquid crystals
Figure 11 Micelles
Figure 12 Fields around an object
IBM SYSTEMS JOURNAL. VOL 28. NO 4. 1989 BURRIDGE ET AL 557
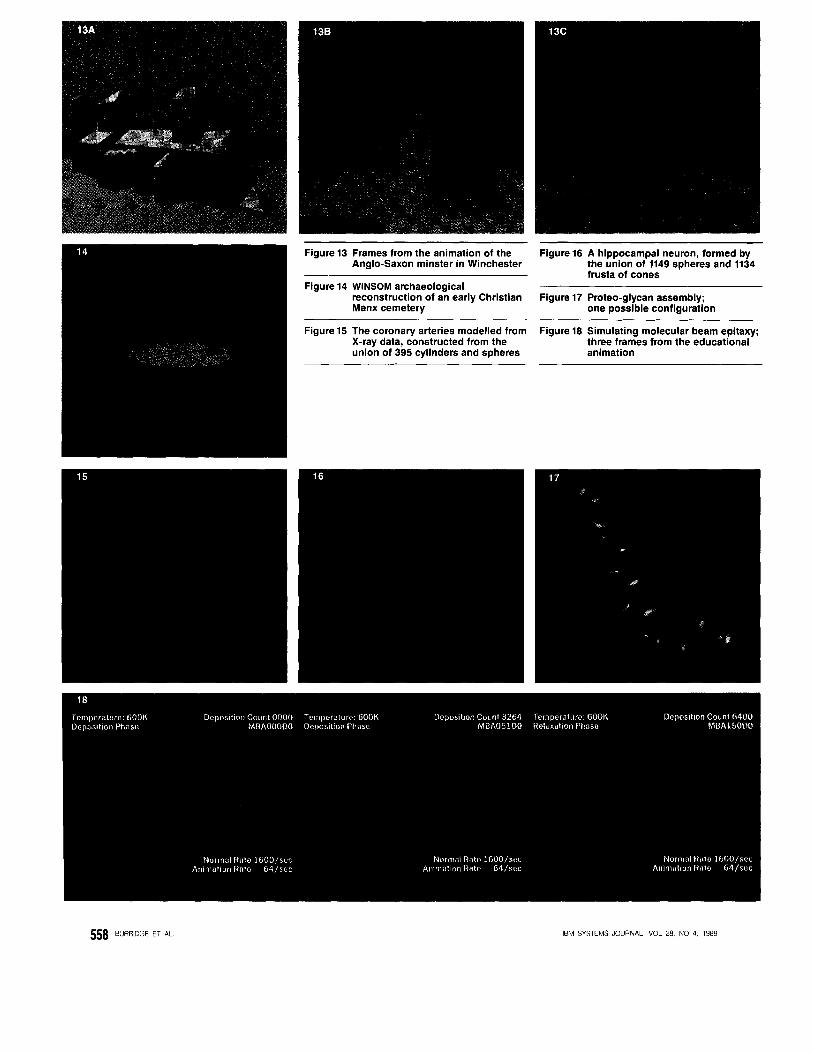
Figure 13 Frames from the animation of theAnglo-Saxon minster in Winchester
Figure 14 WINSOM archaeologicalreconstruction of an early ChristianManx cemetery
Figure 15 The coronary arteries modelled fromX-ray data, constructed from theunion of 395 cylinders and spheres
Figure 16 A hippocampal neuron, formed bythe union of 1149 spheres and 1134frusta of cones
Figure 17 Proteo-glycan assembly;one possible configuration
Figure 18 Simulating molecular beam epitaxy;three frames from the educationalanimation
558 BURRIDGE ET AL. IBM SYSTEMS JOURNAL, VOL 28, NO 4. 1989
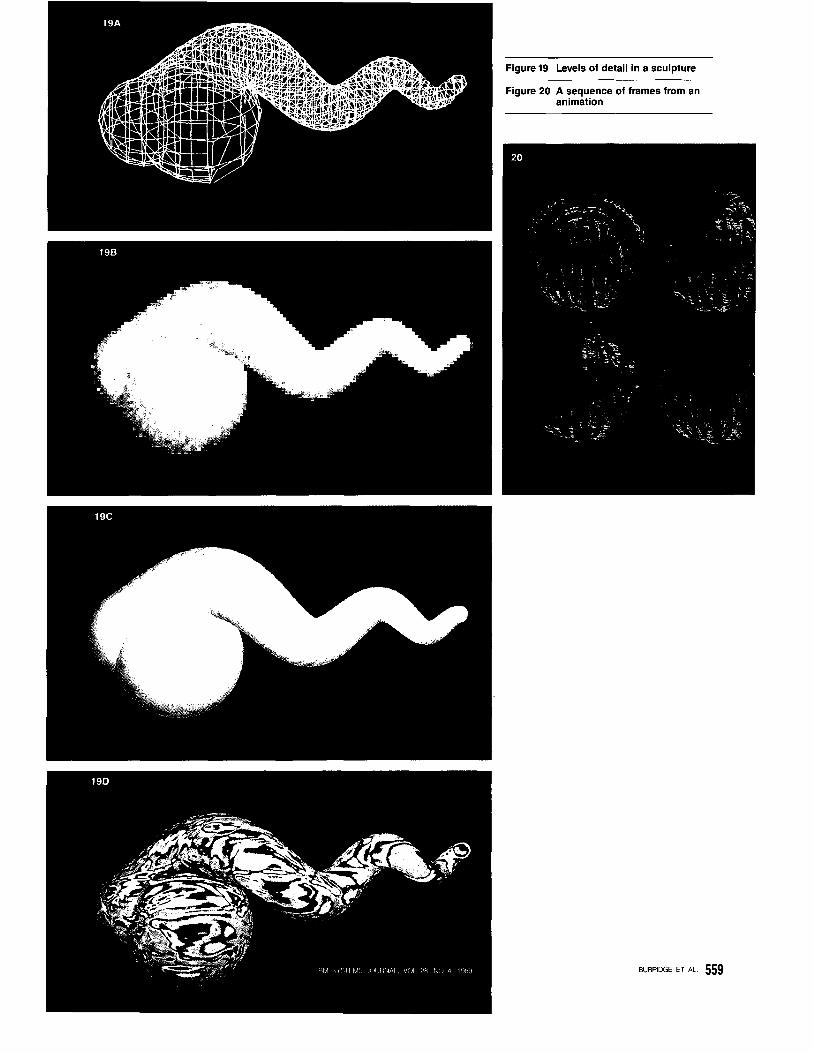
Figure 19 Levels of detail in a sculpture
Figure 20 A sequence of frames from ananimation
BURRIDGE ET AL 559
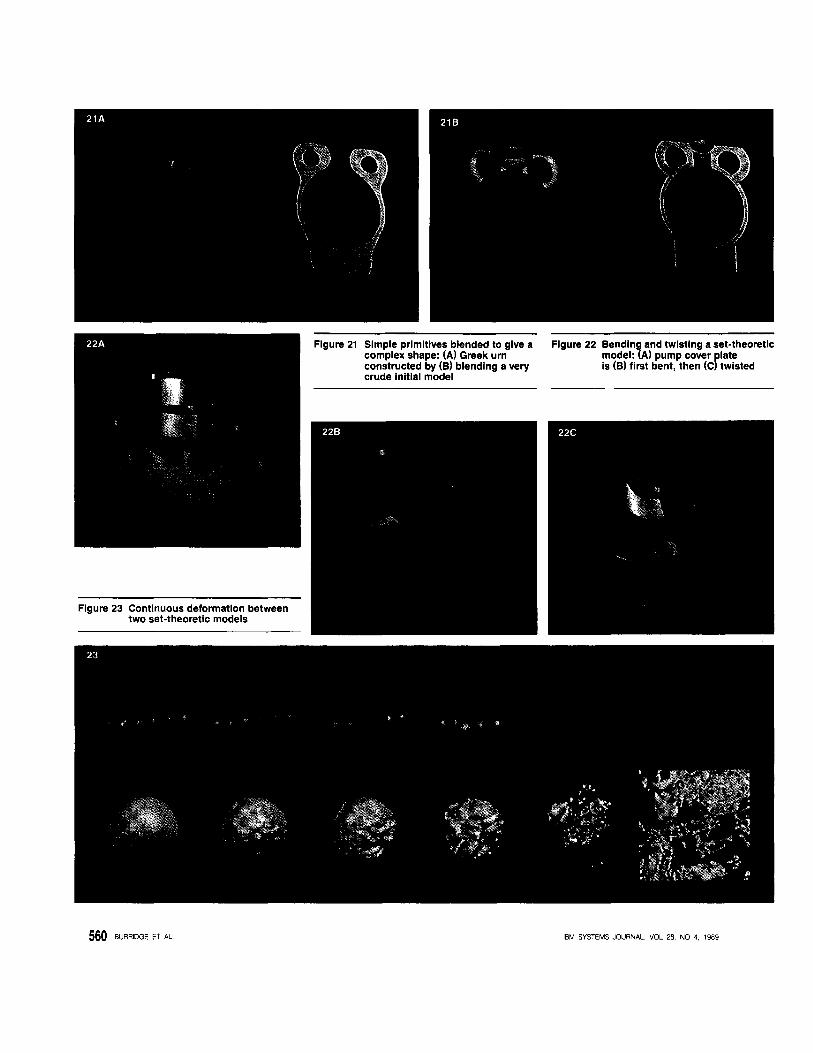
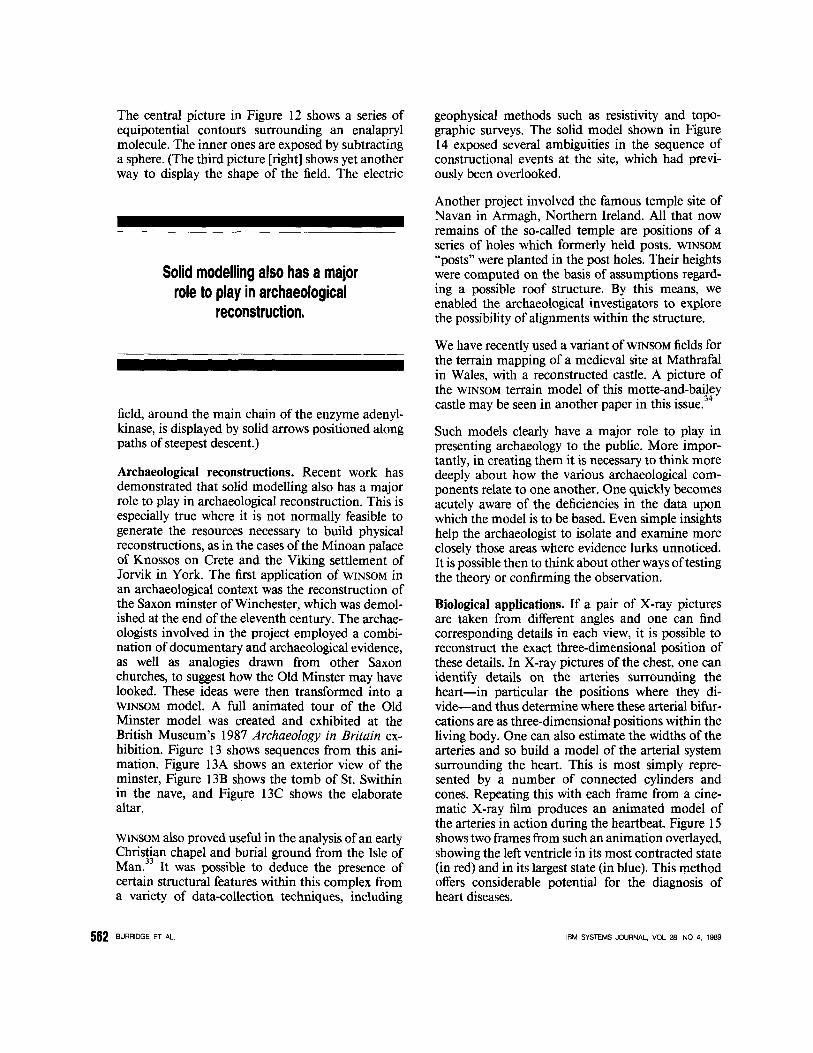
Figure 23 Continuous deformation betweentwo set-theoretic models
560 BURRIDGE ET AL
Figure 21 Simple primitives blended to give acomplex shape: (A) Greek urnconstructed by (B) blending a verycrude Initial model
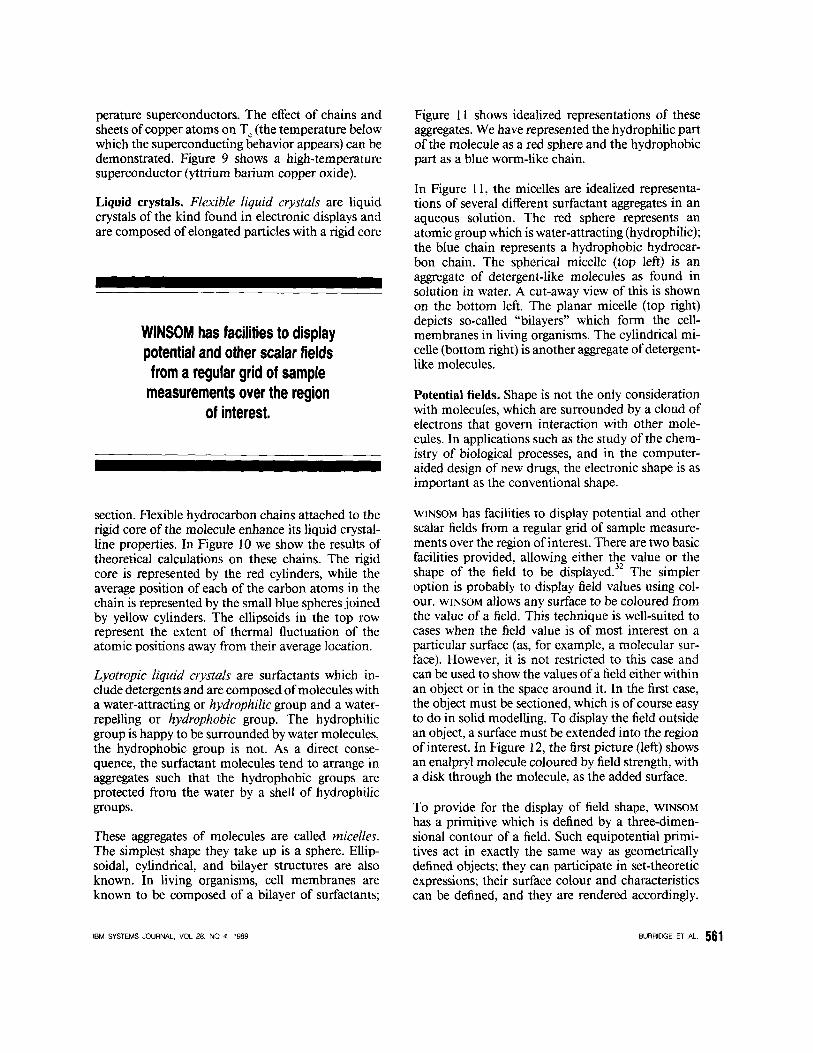
Figure 22 Bending and twisting a set-theoreticmodel: IA) pump cover flateis (B) first bent, then (C twisted
IBM SYSTEMS JOURNAL, VOL 28, NO 4, 1989
perature superconductors. The effect of chains andsheets of copper atoms on T, (the temperature belowwhich the superconducting behavior appears) can bedemonstrated. Figure 9 shows a high-temperaturesuperconductor (yttrium barium copper oxide).
Liquid crystals. Flexible liquid crystals are liquidcrystals of the kind found in electronic displays andare composed of elongated particles with a rigid core
WINSOM has facilities to displaypotential and other scalar fields
from aregular grid of samplemeasurements over the region
of interest.
section. Flexible hydrocarbon chains attached to therigid core of the molecule enhance its liquid crystal-line properties. In Figure lOwe show the results oftheoretical calculations on these chains. The rigidcore is represented by the red cylinders, while theaverage position of each of the carbon atoms in thechain is represented by the small blue spheres joinedby yellow cylinders. The ellipsoids in the top rowrepresent the extent of thermal fluctuation of theatomic positions away from their average location.
Lyotropic liquid crystals are surfactants which in-clude detergents and are composed of molecules witha water-attracting or hydrophilic group and a water-repelling or hydrophobic group. The hydrophilicgroup is happy to be surrounded by water molecules,the hydrophobic group is not. As a direct conse-quence, the surfactant molecules tend to arrange inaggregates such that the hydrophobic groups areprotected from the water by a shell of hydrophilicgroups.
These aggregates of molecules are called micelles.The simplest shape they take up is a sphere. Ellip-soidal, cylindrical, and bilayer structures are alsoknown. In living organisms, cell membranes areknown to be composed of a bilayer of surfactants;
IBM SYSTEMS JOURNAL, VOL 28, NO 4, 1989
Figure II shows idealized representations of theseaggregates. We have represented the hydrophilic partof the molecule as a red sphere and the hydrophobicpart as a blue worm-like chain.
In Figure 11, the micelles are idealized representa-tions of several different surfactant aggregates in anaqueous solution. The red sphere represents anatomic group which is water-attracting (hydrophilic);the blue chain represents a hydrophobic hydrocar-bon chain. The spherical micelle (top left) is anaggregate of detergent-like molecules as found insolution in water. A cut-away view of this is shownon the bottom left. The planar micelle (top right)depicts so-called "bilayers" which form the cell-membranes in living organisms. The cylindrical mi-celle (bottom right) is another aggregateof detergent-like molecules.
Potential fields. Shape is not the only considerationwith molecules, which are surrounded by a cloud ofelectrons that govern interaction with other mole-cules. In applications such as the study of the chem-istry of biological processes, and in the computer-aided design of new drugs, the electronic shape is asimportant as the conventional shape.
WINSOM has facilities to display potential and otherscalar fields from a regular grid of sample measure-ments over the region of interest. There are two basicfacilities provided, allowing either the value or theshape of the field to be displayed.32 The simpleroption is probably to display field values using col-our. WINSOM allows any surface to be coloured fromthe value of a field. This technique is well-suited tocases when the field value is of most interest on aparticular surface (as, for example, a molecular sur-face). However, it is not restricted to this case andcan be used to show the values of a field either withinan object or in the space around it. In the first case,the object must be sectioned, which is ofcourse easyto do in solid modelling. To display the field outsidean object, a surface must be extended into the regionof interest. In Figure 12, the first picture (left) showsan enalpryl molecule coloured by field strength, witha disk through the molecule, as the added surface.
To provide for the display of field shape, WINSOMhas a primitive which is defined by a three-dimen-sional contour of a field. Such equipotential primi-tives act in exactly the same way as geometricallydefined objects; they can participate in set-theoreticexpressions; their surface colour and characteristicscan be defined, and they are rendered accordingly.
BURRIDGE ET AL. 561
The central picture in Figure 12 shows a series ofequipotential contours surrounding an enalaprylmolecule. The inner ones are exposed by subtractinga sphere. (The third picture [right] shows yet anotherway to display the shape of the field. The electric
Solid modelling also has amajorrole to play in archaeological
reconstruction.
field, around the main chain of the enzyme adenyl-kinase, is displayed by solid arrows positioned alongpaths of steepest descent.)
Archaeological reconstructions. Recent work hasdemonstrated that solid modelling also has a majorrole to play in archaeological reconstruction. This isespecially true where it is not normally feasible togenerate the resources necessary to build physicalreconstructions, as in the cases of the Minoan palaceof Knossos on Crete and the Viking settlement ofJorvik in York. The first application of WINSOM inan archaeological context was the reconstruction ofthe Saxon minster of Winchester, which was demol-ished at the end of the eleventh century. The archae-ologists involved in the project employed a combi-nation of documentary and archaeological evidence,as well as analogies drawn from other Saxonchurches, to suggesthow the Old Minster may havelooked. These ideas were then transformed into aWINSOM model. A full animated tour of the OldMinster model was created and exhibited at theBritish Museum's 1987 Archaeology in Britain ex-hibition. Figure 13 shows sequences from this ani-mation. Figure 13A shows an exterior view of theminster, Figure 13B shows the tomb of St. Swithinin the nave, and Figure 13C shows the elaboratealtar.
WINSOM also proved useful in the analysis of an earlyChristian chapel and burial ground from the Isle ofMan.33 It was possible to deduce the presence ofcertain structural features within this complex froma variety of data-collection techniques, including
562 BURRIDGE ET AL.
geophysical methods such as resistivity and topo-graphic surveys. The solid model shown in Figure14 exposed several ambiguities in the sequence ofconstructional events at the site, which had previ-ously been overlooked.
Another project involved the famous temple site ofNavan in Armagh, Northern Ireland. All that nowremains of the so-called temple are positions of aseries of holes which formerly held posts. WINSOM"posts" were planted in the post holes. Their heightswere computed on the basis of assumptions regard-ing a possible roof structure. By this means, weenabled the archaeological investigators to explorethe possibility of alignments within the structure.
We have recently used a variant of WINSOM fieldsforthe terrain mapping of a medieval site at Mathrafalin Wales, with a reconstructed castle. A picture ofthe WINSOM terrain model of this motte-and-baileycastle may be seen in another paper in this issue."
Such models clearly have a major role to play inpresenting archaeology to the public. More impor-tantly, in creating them it is necessary to think moredeeply about how the various archaeological com-ponents relate to one another. One quickly becomesacutely aware of the deficiencies in the data uponwhich the model is to be based. Even simple insightshelp the archaeologist to isolate and examine moreclosely those areas where evidence lurks unnoticed.It is possible then to think about other waysof testingthe theory or confirming the observation.
Biological applications. If a pair of X-ray picturesare taken from different angles and one can findcorresponding details in each view, it is possible toreconstruct the exact three-dimensional position ofthese details. In X-ray pictures of the chest, one canidentify details on the arteries surrounding theheart-in particular the positions where they di-vide-and thus determine where these arterial bifur-cations are as three-dimensional positions within theliving body. One can also estimate the widths of thearteries and so build a model of the arterial systemsurrounding the heart. This is most simply repre-sented by a number of connected cylinders andcones. Repeating this with each frame from a cine-matic X-ray film produces an animated model ofthe arteries in action during the heartbeat. Figure 15showstwo frames from such an animation overlayed,showing the left ventricle in its most contracted state(in red) and in its largest state (in blue). This methodoffers considerable potential for the diagnosis ofheart diseases.
IBM SYSTEMS JOURNAL, VOL 28, NO 4, 1989
In a project concerned with gaining a greater under-standing of the operation of the Hippocampus regionof the rat's brain," WINSOM is used to display a solidmodel of a single neuron. Photographs of opticalsections of the entire cell volume, obtained utilizingthe small depth of field of a microscope, are image-processed to find the centre line and width of the "infocus" parts of the dendrite structure and its topog-raphy in three dimensions." This geometric infor-mation is used to construct a WINSOM model as aunion of spheres and frusta of cones. The pictureshows one view of the three-dimensional dendriticstructure of a typical cell. The measured volume andsurface area of the structure are used in theoreticalpredictions, which are then compared with electro-physiological measurements on each cell, with theaim of broadening the theory of cell operation (Fig-ure 16).
Another biological application is the study of proteo-glycan assemblies. These are very large moleculeswhose approximate chemistry is known, but the onlyevidence for their shape comes from electron micro-scope pictures. We have used the programmingpower of ESME to produce a range of possible shapesbased on available statistical information. One con-figuration of a proteo-glycan assembly is shown inFigure 17. Probably none of these is a "correct"picture of a proteo-glycan assembly, but each gavethe researchers a much clearer idea of the three-dimensional nature of the molecule.
Physics. Recent work on the simulation of molecularbeam epitaxy illustrates how theory can explain thegrowth of semiconductor substrate surfaces underthe influence of directed atomic and molecularbeams. The theory was known to be consistent withgross experimental observations, but a WINSOM ani-mation (see Figure 18) of the time-dependent proc-esses immediately yielded much information on thenature of individual growth mechanisms, which wasfundamental to the understanding of the epitaxialprocess.
Another recent scientific animation addresses evenmore fundamental issues-those of quantum chro-modynamics, a discipline which attempts to com-prehend the basic forces of nature. Earlier work inthis area" has used WINSOM to visualize the energyfields surrounding t'Hooft-Polyakov magnetic mon-opoles, a concept predicted by recent theories. Theanimation combines this work with results stemmingfrom mathematical topology to show how the shape,motion, and even basic nature of a monopole canchange in the presence of another monopole.
IBM SYSTEMS JOURNAL, VOL 28, NO 4, 1989
Sculpture. Although WINSOM was not designed withartists in mind, William Latham has used it toproduce a wide range of sculptures." For this appli-cation, the ability of WINSOM to handle models witha large number of primitives is crucial. The program-ming power of ESME permits a few simple programsto create a wide range of branching horn forms, andthe artist concentrates on choosing and combiningcontrasting forms to make novel three-dimensionalcomputer sculptures. The addition of texture in-creases the visual impact of the result.
As with so many of our applications, preparation ofa sculpture begins with wire-frame pictures. As sat-isfactory forms are designed, the work proceeds tomore complete renderings as illustrated in Figure 19.This figure shows a sculpture in wire-frame form(Figure 19A), low-resolution rendered (Figure 19B),high-resolution rendered (Figure 19C), and textured(Figure 19D). The final form of the sculptures islarge high-resolution photographs and animations inwhich the viewer seems to move around (or through)the sculpture, or during which the sculpture itselfgrows, as shown in Figure 20.
Further developments of WINSOM
Much effort is put into helping potential users ofWINSOM get the best from their system. This time israrely wasted, as applications often lead to importantdevelopments. In addition to such fortuitous ad-vances, we are currently focusing on a number offacets of the system.
WINSOM II. Various special applications of WIN-SOM caused us to extend the conventional set-theo-retic modelling capabilities in new directions. Wenow realize that many of these extensions can becombined under a single umbrella of algebraic mod-elling. WINSOM II is an experimental system thatimplements some of these ideas.
Attempts to use WINSOM in design (as opposed toscience or engineering) led to the implementation ofa blend system similar to that of Ricci39 (Figure 21),and thus to several operations generalized beyondthe usual set operations. Design applications alsorequired perspective and then more complex viewingprojections. We found these could be used to distortthe objects themselves, as well as our views of them.This permitted blending and bending operations onsolid objects (Figure 22) similar to those of Barr.40
The introduction of contoured potential fields" de-scribed elsewhere in this paper (see also Figure 12)
BURRIDGE ET AL 563
was the key to the integration of these concepts. InWINSOM II, all objects are considered as fields. Nolonger does a primitive sphere just have an insideand an outside, but rather every point in space hasa potential that gives some measure of howfar insideor outside the sphere it is. To make a solid, wecontour the potential: points with a negative poten-tial are inside the sphere, and points with a positivepotential are outside the sphere.
The operations of union and intersection of solidsare replaced by the minimum and maximum ofpotentials. As a potential defines a number at eachpoint in space, we can also apply the standard arith-metic operations to add and subtract potentials, oreven to take sines and logarithms. This permits usto generate complex blend functions based on poten-tials. Using the weighted average of the potentialfunctions for two objects permits us to define acontinuous deformation from one to the other (Fig-ure 23).
In Figure 23, the upper sequence shows a line ofspheres averaged with a cube in increasing propor-tion (left to right) of the latter. The lower sequenceshows a sphere averaged with pseudo-fractal solidtexture in a similar way. The ability to see solidtexture as a solid may not yet have many applicationsbut illustrates our desire to harmonize intuitivelydifferent types of modelled entity.
The basic potential fields X, Y, and Z have as theirvalues the value of the x, y, and z coordinates of apoint, respectively. These can be used to generate anobject from any algebraically defined function inthree dimensions. In this respect, WINSOM II is similarto earlier work done at the University of Bath41andits derivatives42,43 which use complex polynomialexpressions to generate primitives for blending. Fol-lowing the work at Bath, WINSOM II is currentlyimplemented using interval-arithmetic techniques.In the future we feel that algebra-system techniqueswill make models of this type both quicker and morereliable to evaluate. We are collaborating on theconstruction of an algebra system specifically aimedat geometric problems."
Animation. Despite having produced several success-ful animations, we are aware of shortcomings in ouranimation capability. WINSOM does not utilize anyinterframe coherence, since we currently know no
I · h' I" bl 45.46 W hway to exp O1t t IS re ia y. e are, owever,exploring the possibilities for running WINSOM onparallel processors, and we are collaborating on an
564 BURRIDGE ET AL.
implementation that runs on an array of Transpu-ters'M.47
In any case, raw frame-generation times are not theonly problem. The difficulty is that of planning andchoreographing an animation effectively.Shortcom-ings in this respect often surface at frame-generationtime, when sequences need to be repeated! We cur-
It has been exciting and rewardingto develop solid modelling
techniques suitable for areasoutside engineering and actually
to apply them.
rently plan to make animation less painful by de-signing a computerized storyboard system compati-ble with WINSOM and, more importantly, with ESME.
Conclusion
WINSOM'S ability to render complex shapes at reason-able cost has put it in the vanguard of the applicationof shape modelling techniques to data visualization,a topic which is getting so much notice today. It hasbeen exciting and rewarding to develop solid mod-elling techniques suitable for areas outside engineer-ing and actually to apply them. One lesson we havelearned is that we could never have done this withoutthe help of the many subject specialists who havecollaborated with us over the last ten years.
Acknowledgments
We are grateful to everyone who worked with us onthe WINSOM projects, both those from non-IBM insti-tutions and research Fellows at the IBM United King-dom Scientific Centre (UKSC). In particular, wewould like to mention collaboration with the follow-ing: on the static modelling of magnetic mono-poles-A. J. G. Hey and J. H. Merlin (SouthamptonUniversity) and M. T. Vaughan (Northeastern Uni-versity, Boston); on the dynamic modelling of mag-netic monopoles-M. F. Atiyah and N. J. Hitchin
IBM SYSTEMS JOURNAL, VOL 28, NO 4, 1989
(Oxford University), J. H. Merlin (SouthamptonUniversity), and D. L. Pottinger (UKSC Fellow); onmolecular beam epitaxy-D. D. Vvedensky and S.Clarke (Imperial College, London); on the recon-struction of hippocampal neurons-H. V. Wheal(Southampton University) and H. M. Cole (UKSCFellow); on the modelling of liquid crystals-G. R.Luckhurst and D. J. Tildesley (Southampton Uni-versity); on geometric algebra systems-J. H. Dav-enport and A. Bowyer (Bath University); on theparallel-processing version of WINSOM-P. M. Dewand D. Morris (LeedsUniversity); on the reconstruc-tion of the Saxon minster-B. Kelbye-Biddle (Wes-sex Archaeological Trust); on the Mathrafal proj-ect-c. J. Arnold, J. W. Huggett, and C. J.Springham; on the Leonardo exhibition anima-tions-P. Steadman (Open University); on the mod-elling of proteo-glycan assemblies-K. Parker andP. Winlove (Imperial Cancer Research Institute) andM. Baylissand T. Hardingham (Kennedy Institute);on all of the UKSC projects-students from variousuniversities and polytechnics.
Transputers is a trademark of INMOS Ltd.
Cited references
I. P. Quarendon, WINSOM User's Guide, IBM UK ScientificCentre Report 123, 1984.
2. J. R. Woodwark and K. M. Quinlan, "Reducing the effect ofcomplexity on volume model evaluation," Computer-AidedDesign 14, No.2, 89-95 (March 1982).
3. J. R. Woodwark and K. M. Quinlan, "The derivation ofgraphics from volume models by recursive subdivision of theobject space," Proceedings of Computer Graphics 80 Confer-ence, Brighton, Online Publications, Ltd. (1980), pp. 335-343.
4. H. Samet, "The quadtree and related hierarchical data struc-tures," ACM Computing Surveys 16, No.2, 187-260 (June1984).
5. A. R. Halbert and S. J. P. Todd, Fast Redundant PrimitiveRemovalin CSG Processing, IBM UK ScientificCentre Report175, in preparation.
6. J. R. Woodwark, "Generating wireframes from set-theoreticsolid models," Computer-Aided Design 18, No.6, 307-315(July 1986).
7. A, R. Halbert and S. J. P. Todd, FastDraw: A Fast DrawingSystem for Constructive Solid Geometry, IBM UK ScientificCentre Report 179, in preparation.
8. A. S. Glassner, "Space subdivision for fast ray tracing," IEEEComputerGraphics and Applications 4, No. 10, 15-22 (1984).
9. J. R. Woodwark and A. Bowyer, "Better and faster picturesfrom solid models," Computer-Aided Engineering Journal3,No. I, 17-24 (February 1986).
10. R. G. Oliver, Hierarchical DataStructuresforSolidModelling,Ph.D. thesis, University of Leeds, 1987.
II. S. J. P. Todd, "The Peterlee relational test vehicle-A systemoverview," IBM Systems Journal15, No.4, 285-308 (1976).
12. T. R. Heywood, B. N. Galton, J. Gillett, A. J. Morffew, P.Quarendon, S. J. P. Todd, and W. V. Wright, "The WinchesterGraphics System: a technical overview," Computer Graphics
IBM SYSTEMS JOURNAL, VOL 28, NO 4, 1989
Forum (Proceedings of Eurographics UK 84, April 1984) 3,61-70 (1984).
13. A. J. Morffew, S. J. P. Todd, and M. J. Snelgrove, "The useofa relational database for holding molecule data in a molec-war graphics system," Computersand Chemistry 7, No. 1,9-15 (1983).
14. J. M. Burridge, A. J. Morffew,and S. J. P. Todd, "Experimentsin the use of PROLOG for protein querying," Journal ofMolecular Graphics (Proceedings of the Molecular GraphicsSociety 4th International Meeting, April 1985) 3, No.3, 109-III (September 1985).
15. A. J. Morffew and S. J. P. Todd, "The use of PROLOG as aprotein querying language," Computers and Chemistry 10,No. 1,9-14, (January 1986).
16. E. E. Ahola, F. C. Bernstein, S. H. Bryant, T. F. Koetzle, andJ. Weng, "Protein data bank," in Crystallographic Databases,F. H. Allen, G. Bergerhoff, and R. Sievers, Editors, publishedby the Data Commission of the International Union ofCrys-tallography, Bonn/Cambridge/Chester (1987).
17. S. J. P. Todd, ESME, an ExtensibleSolid Model Editor, IBMUK Scientific Centre Report 176, in preparation.
18. J. J. van Wijk, "SML: A solid modelling language," Computer-Aided Design18, No.8, 443-449 (October 1986).
19. J. R. Woodwark, "Eliminating redundant primitives from set-theoretic solid models by a consideration of constituents,"IEEE Computer Graphics and Applications 8, No.3, 38-47(1988).
20. J. R. Rossignac and H. B. Voelcker, "Active zones in construc-tive solid geometry for redundancy and interference detec-tion," ACM Transactions on Graphics 8, No. 1,51-87 (Jan-uary 1989).
21. A. R. Halbert, S. J. P. Todd, and J. R. Woodwark, "General-izing active zones for set-theoretic models," ComputerJournal32, No. 1,86-89 (1989).
22. A. F. Wallis and J. R. Woodwark, "Interrogating solidmodels," Proceedings of the CAD 84 Conference, Brighton,Butterworths (April 1984), pp. 236-243.
23. A. F. Wallisand J. R. Woodwark, "Creating large solid modelsfor NC toolpath verification," Proceedings of the CAD 84Conference, Brighton, Butterworths (April 1984), pp. 455-460.
24. A. Berk, L. Brownston, and A. Kaufman, "A new colournaming system for graphics languages," IEEE ComputerGraphics and Applications 2, No.5, 37-44 (May 1982).
25. S. J. P. Todd, Winchester Colour and Texture Facilities:WINCAT, IBM UK Scientific Centre Report 203, in prepa-ration.
26. S. J. P. Todd, SLED, A Solid Lighting Editor, IBM UKScientific Centre Report 177, in preparation.
27. K. Perlin, "An image synthesizer," ACM ComputerGraphics(Proceedings of SIGGRAPH 85) 9, No.3, 287-296 (1985).
28. R. W. Floyd and L. Steinberg, "An adaptive algorithm forspacial grey scale," SID 75 Digest, 36-37 (1975).
29. S. J. P. Todd, Error Diffusion for Grey Scale and ColourImages: How to Make It Work, IBM UK Scientific CentreReport 180, in preparation.
30. J. M. Burridge, A. J. Morffew, P. Quarendon, and S. J. P.Todd, "WGS: a flexible combination of interactive and solidmolecular modelling," UCLA-GENEXSymposium on ProteinStructure, Foldingand Design,March 1985.
31. J. M. Burridge and S. J. P. Todd, "An interactive interface forprotein secondary structure representation," JournalofMolec-ularGraphics 2, No. 53 (June 1984).
32. P. Quarendon, A System for Displaying Three-DimensionalFields, IBM UK Scientific Centre Report 171, 1987.
33. P. Reilly and A. R. Halbert, Using Computing Graphics to
BURRIDGE ET AL. 565
Analyse Archaeological Survey Data from the Isle of Man,IBM UK ScientificCentre Report 153, 1987.
34. P. Reilly, "Data visualization in archaeology," IBM SystemsJournal 28, No.4, 569-579 (1989, this issue). See Figure 9.
35. H. M. Cole, T. R. Harris, E. W. Stockley, and H. V. Wheal,"Interactive three-dimensional display of reconstructed neu-rons," Journal of the Physiological Society 400, 5p (January1988).
36. J. Simmons and A. B. Johnson, Obtaining S-DimensionalModels of Dendritic Structures, IBM UK Scientific CentreReport 202, in preparation.
37. A. J. G. Hey, J. H. Merlin, M. W. Ricketts, M. T. Vaughn,and D. C. Williams, "Topological solutions in gauge theoryand their computer graphic representation," Science 240,1163-1168 (May 1988).
38. W. Latham and S. J. P. Todd, "Visualisation of sculpture,"Proceedingsofa BCS Displays Group Conference on Realismand Visualisation, London (December 1987).
39. A. Ricci, "A constructive geometry for computer graphics,"Computer Journal 16, 157-160 (1973).
40. A. H. Barr, "Global and local deformations of solid primi-tives," Computer Graphics 18, No.3, 21-31 (1983).
41. J. R. Woodwark, "Blends in geometric modelling," Proceed-ings of2nd IMA Conference on the Mathematics ofSurfaces,Cardiff, Oxford University Press (1986), pp. 255-297.
42. D.-Y. Zhang and A. Bowyer, "CSG set-theoretic solid mod-elling and NC machining of blend surfaces," Proceedings ofthe ACM2nd Symposium on Computational Geometry, York-town Heights, NY (1986), pp. 236-245.
43. D.-Y. Zhang, CSG Solid Modelling and Automatic NC Ma-chining of Blend Surfaces, Ph.D thesis, University of Bath,1986.
44. A. Bowyer, J. Davenport, P. Milne, J. Padget, and A. F.Wallis,"A geometric algebra system," in Geometric Reasoning(Proceedingsof a Conference at the IBM UK ScientificCentre,December 1986),Oxford University Press (to appear, 1989).
45. A. S. Glassner, "Spacetime ray tracing for animation," IEEEComputer Graphics and Applications 8, No.3, 60-70 (March1988).
46. J. R. Woodwark "Spacetime ray tracing," letter to the editor,IEEE Computer Graphics and Applications 8, No.5, 8 (1988).
47. N. S. Holliman, D. T. Morris, P. M. Dew, and A. de Penning-ton, "An evaluation of the processor farm model for visualisingconstructive solid geometry," ProceedingsofComputer Visionand Display, Leeds University Conference, to appear.
Jane M. Burridge IBM UK Scientific Centre. Athelstan House.St. Clement Street, Winchester, Hampshire S023 9DR. UnitedKingdom. Dr. Burridge holds a B.A.degree from Keele University,UK, and a D.Phil. from Oxford University, UK. After academicresearch in structural molecular biology at Oxford and the Uni-versity of California, San Diego, she joined IBM at the UKScientific Centre in 1983 on a two-year Research Fellowship toexplore the potential of computer graphics for visualizing molec-ular structures and properties. Dr. Burridge accepted a permanentposition with IBM in 1984, continuing to work on data visualiza-tion at the UK ScientificCentre. In 1987, she joined the softwaretechnology group to develop an "electronic book" on molecularbiology,in collaboration with Oxford University Press. Publicationis scheduled for 1990. Dr. Burridge is currently working on coor-dinating European market development for chemical and phar-maceutical industries at the IBM European headquarters in Paris.
566 BURRIDGE ET AL.
Brian M. Collins IBM UK Scientific Centre, Athelstan House, St.Clement Street, Winchester, Hampshire S023 9DR, United King-dom. Dr. Collins obtained his B.A. and D.Phil. degrees fromOxford University, UK, in chemistry. He carried out research intothe synthesis and structure of mixed-metal oxide perovskites usingpowder neutron diffraction. Dr. Collins is currently working onthe application of three-dimensional computer graphics to thedisplay and comparison of scalar and vector properties in generaland particularly to those properties of small organic molecules ascalculated by ab initio and semiempirical computational chemistryprograms. This is mainly as part of a joint project with a phar-maceutical company.
B. Neil Galton IBM UK Scientific Centre, Athelstan House, St.Clement Street, Winchester, Hampshire S023 9DR, United King-dom. Neil Galton graduated from Nottingham University, UK, in1968 with a degree in chemistry. He joined IBM InformationServices at Havant in 1969, as an applications programmer. Hewas assigned to New York in 1971 to work on the developmentof a new customer order processing system. Upon his return in1973, Mr. Galton joined the Product Test Laboratory at IBMHursley to provide system and application programming support.From 1977, he coordinated the assurance activities of various textprocessing and distributed officecommunication system products.Mr. Galton transferred to the IBM UK Scientific Centre in 1983to work initially in the graphics research group. He is now involvedwith the work of the European data visualization group at theCentre.
Alan R. Halbert IBM UK Scientific Centre, Athelstan House, St.Clement Street. Winchester, Hampshire S023 9DR, United King-dom. Alan Halbert joined IBM in 1976 and is currently workingon CICSat the IBM UK Laboratory at Hursley. He was previouslya member of the graphics research group at the IBM UK ScientificCentre, where his research interest centered on the developmentof new display techniques for set-theoretic models. He worked onseveral enhancements to the WINSOM program and developedthe first version of the FastDraw wire-frame display program. Mr.Halbert obtained his B.Sc. in mathematics at Bristol University,UK, in 1969 and his M.Sc. in pure mathematics at SheffieldUniversity, UK, in 1970.
Thomas R. Heywood IBM UK Scientific Centre, AthelstanHouse, St. Clement Street, Winchester, Hampshire S023 9DR,United Kingdom. Tom Heywood joined IBM in 1963 at the IBMUK Laboratory at Hursley. While there he held both technical andmanagement posts in PLfI, VTAM, CICS, and graphics products.In 1983, Dr. Heywood joined the UK Scientific Centre as firstmanager of the graphics research group. The group's scope ofresearch includes most aspects of data visualization and parallelprocessing for high-speed visualization. In 1989, Dr. Heywoodreturned to the laboratory as manager of strategic projects.
IBM SYSTEMS JOURNAL. VOL 28, NO 4, 1989
William H. Latham IBM UK Scientific Centre, Athelstan House,St. Clement Street, Winchester, Hampshire S023 9DR, UnitedKingdom. William Latham initially trained as a printmaker, sculp-tor, and animator and obtained a B.F.A. in fine art from OxfordUniversity, UK, and an M.A. from the Royal College of Art inLondon. In 1987, Mr. Latham became a Research Fellow in theGraphics Applications group at the IBM UK Scientific Centre inWinchester. There he has specialized in using three-dimensionalsolid modeling and computer photo-realist techniques to createcomputer sculptures. An exhibition of Mr. Latham's work iscurrently touring the UK, and his animations have appearedinternationally on television and at film festivals. His recent film,The Conquest of Form, was shown at the 1989 SIGGRAPHComputer Graphics Theater.
Robert W. Phippen IBM UK Scientific Centre, Athelstan House,St. Clement Street, Winchester, Hampshire S023 9DR, UnitedKingdom. Robert Phippen has been working at the IBM UKScientific Centre since 1986 as a Research Fellow attached to thegraphics group. Dr. Phippen has been working on data visualiza-tion applied to theoretical studies of liquid crystals. His researchhas concentrated on molecular dynamics and Monte-Carlo simu-lations of model liquid crystalline systems, coupled to developmentof theoretical techniques to predict the results of these simulations.Dr. Phippen obtained a B.Sc. in chemistry at Southampton Uni-versity, UK, in 1983. He remained there to do research in liquidcrystals and statistical mechanics. Dr. Phippen was awarded hisPh.D. degree in 1988. He is a member of the British Liquid CrystalSociety.
Peter Quarendon IBM UK Scientific Centre, Athelstan House,St. Clement Street, Winchester, Hampshire S023 9DR, UnitedKingdom. Peter Quarendon graduated in natural sciences at Cam-bridge University, UK. He joined the IBM Laboratory at Hursleyin 1968 as a programmer. Dr. Quarendon worked on PLjI com-pilers and other topics related to programming languages, includ-ing a precursor to Prolog. In 1973,he went to Newcastle Universityunder the Advanced Education Scheme to continue this research.After obtaining a Ph.D. degree there, he returned to IBM Hursleyand began work on low-cost graphics. This eventually resulted inthe GDDM program product and the availability of a graphicsfeature on all IBM mainframe terminals. Dr. Quarendon movedto the IBM UK Scientific Centre in 1983, where he initiated workon the WINSOM solid modeler and its application. After a periodas manager of the graphics research group, he assumed responsi-bility for technical aspects of graphics research.
Paul Reilly IBM UK Scientific Centre, Athelstan House. St. Clem-ent Street. Winchester. Hampshire S023 9DR. United Kingdom.Dr. Reilly received a B.A. Honours degree in archaeology andhistory at the University of Leeds, UK, and the Ph.D. degree incomputer-based archaeological research at the Research Centre forComputer Archaeology in Staffordshire Polytechnic, UK. He hasworked on many archaeological excavation and field survey proj-ects in Britain and elsewhere in Europe. During the period 1986-1989, Dr. Reilly was a Research Fellow at the IBM UK ScientificCentre and became an IBM Research Scientist in 1989. He haswritten over 20 papers and a book relating to computer applica-tions in archaeological research.
IBM SYSTEMS JOURNAL. VOL 28, NO 4, 1989
M. William Ricketts IBM UK Scientific Centre, Athelstan House.St. Clement Street. Winchester. Hampshire S023 9DR, UnitedKingdom. Mr. Ricketts graduated in mathematics at Oxford Uni-versity, UK, in 1969. In the same year, he joined the IBM UKLaboratory at Hursley. Mr. Ricketts worked on the PLjI checkoutcompiler until 1977, at which time he moved into work in char-acter graphics (later to become GDDM) where he specialized insystem environments. In 1986, Mr, Ricketts joined the graphicssystems research group at the IBM UK Scientific Centre. Initially,he investigated the applicability of parallel processing to graphicssystems. More recently, Mr. Ricketts has focused on data visuali-zation activities and is now working on new implementations ofthe WINSOM concepts.
John Simmons IBM UK Scientific Centre, Athelstan House. St.Clement Street. Winchester, Hampshire S023 9DR. United King-dom. Dr. Simmons received the B.Sc.and Ph.D. degrees in physicsat the University of Birmingham, England. He worked for manyyears on pattern recognition techniques as applied to the evalua-tion of bubble chamber experiments in the field of high-energyphysics. He joined the IBM UK Laboratory at Hursley in 1974and has been associated with workstation development since thattime. Following an initial design study at Hursley, Dr. Simmonsspent two years at the Vimercate Plant in Italy, working on thedetailed design and prototyping of the IBM 7350 Image ProcessingSystem. On returning to Hursley, he worked on a number ofgraphics projects culminating in the display graphics system forPC systems. Dr. Simmons joined the IBM UK Scientific Centrein 1988, where he has been involved with the application of three-dimensional graphics techniques to the visualization of biologicalstructures.
Stephen J. P. Todd IBM UK Scientific Centre. Athelstan House,St. Clement Street. Winchester, Hampshire S023 9DR, UnitedKingdom. Professor Todd studied mathematics at Oxford Univer-sity, UK, from 1965-1971. In 1971, he joined the IBM UKScientific Centre at Peterlee. He developed the Peterlee RelationalTest Vehicle, one of the first relational database systems. He wasalso involved in research in image processing. He spent 1979 to1981 at the IBM Research Laboratory in San Jose, California,where he worked in text processing and coding theory. He rejoinedthe UK Scientific Centre in 1981. Since then, Professor Todd hasresearched a number of graphics areas, including picture genera-tion from databases, languages to create solid models for a varietyof applications, and the realistic rendering of these solid models.
Andrew G. N. Walter IBM UK Scientific Centre.Athelstan House,St. Clement Street, Winchester, Hampshire S023 9DR, UnitedKingdom. Andrew Walter read engineering science at Oxford,University, UK. He worked for ten years in industry, specializingin real-time microprocessor control systems, loosely coupled par-allel processing, and two-dimensional, real-time pattern recogni-tion systems. He joined the IBM Scientific Centre in Winchesterfive years ago, and has since been working on computer graphicsapplications and animation. He was responsible for producing TheOld Minster. Winchester,which was the first movie produced usingthe WINSOM solid modeler.
BURRIDGE ET AL. 567

JohnR. Woodwark IBM UK Scientific Centre, Athelstan House,St. Clement Street, Winchester, Hampshire S023 9DR, UnitedKingdom. Dr. Woodwarkjoined IBM in 1985 and now managesthe graphics research group at the UK Scientific Centre. Beforejoining IBM, he was a lecturer in manufacturing engineering atBath University, UK, where he was involved in projects withindustry ranging from display technology to robotics. His work onmodeling and graphics concentrated on improving the computa-bility of the set-theoretic solid model. Applications included areconstruction of the Roman baths at Bath which was shown onBBC television in 1984. His publications include A Programmer'sGeometry coauthored with Dr. Adrian Bowyer, first published in1983 and now being reprinted for the second time, and ComputingShape, published in 1986. He obtained his B.Sc. at Leeds Univer-sity, UK, as a Rolls-Royce university apprentice. Subsequently hereturned to Leeds to do research in computer-aided manufactureand received a Ph.D. in 1978.
Reprint Order No. G321-5374.
568 BURRIDGE ET AL. IBM SYSTEMS JOURNAL. VOL 28, NO 4, 1989