The-Vienna-consenus_Lab-KPI.pdf - ESHRE
17
Review The Vienna consensus: report of an expert meeting on the development of ART laboratory performance indicators ESHRE Special Interest Group of Embryology and Alpha Scientists in Reproductive Medicine a,b, * a European Society of Human Reproduction and Embryology, Meerstraat 60, B-1852 Grimbergen, Belgium b ALPHA Scientists in Reproductive Medicine, 19 Mayis Mah. 19 Mayis Cad. Nova Baran Center No:4 34360 Sisli, Istanbul, Turkey KEY MESSAGE This proceedings report presents 19 Indicators, including 12 Key Performance Indicators (KPIs), 5 Performance Indicators (PIs), and 2 Reference Indicators (RIs) from an international workshop supported by the European Society of Human Reproduction and Embryology (ESHRE) and Alpha Scientists in Reproduction (Alpha), designed to es- tablish consensus on definitions and recommended values for the assisted reproductive technology (ART) laboratory. ABSTRACT This proceedings report presents the outcomes from an international workshop supported by the European Society of Human Reproduction and Em- bryology (ESHRE) and Alpha Scientists in Reproductive Medicine, designed to establish consensus on definitions and recommended values for Indicators for the assisted reproductive technology (ART) laboratory. Minimum performance-level values (‘competency’) and aspirational (‘benchmark’) values were recommended for a total of 19 Indicators, including 12 Key Performance Indicators (KPIs), five Performance Indicators (PIs), and two Reference Indicators (RIs). © 2017 The Author(s). Published by Elsevier Ltd on behalf of Reproductive Healthcare Ltd. This is an open access article under the CC BY-NC-ND license (http://creativecommons.org/licenses/by-nc-nd/4.0/). Introduction Performance Indicators (PIs) are objective measures for evaluating critical healthcare domains (patient safety, effectiveness, equity, patient-centeredness, timeliness and efficiency) (Kohn et al., 2000). In the setting of a clinical laboratory, quality indicators are necessary for systematically monitoring and evaluating the laboratory’s con- tribution to patient care (ISO-15189:2012) and they represent an important element within the quality management system (QMS) (ESHRE Guideline Group on Good Practice in IVF Labs et al, 2016; Mortimer and Mortimer, 2015). Currently, there are no established PIs for assisted reproductive technology (ART) laboratories, and there is very little published evidence on the topic. This consensus document, which has not been subjected to independent peer review by the editors of Reproductive BioMedicine Online, is being published simultaneously by Reproductive BioMedicine Online and Human Reproduction Open. * Corresponding authors. E-mail addresses: [email protected] (G Cotichio); [email protected] (ZP Nagy). http://dx.doi.org/10.1016/j.rbmo.2017.06.015 1472-6483/© 2017 The Author(s). Published by Elsevier Ltd on behalf of Reproductive Healthcare Ltd. This is an open access article under the CC BY-NC-ND license (http://creativecommons.org/licenses/by-nc-nd/4.0/). ARTICLE IN PRESS Please cite this article in press as: ESHRE Special Interest Group of Embryology and Alpha Scientists in Reproductive Medicine, The Vienna consensus: report of an expert meeting on the development of ART laboratory performance indicators, Reproductive BioMedicine Online (2017), doi: 10.1016/j.rbmo.2017.06.015
-
Upload
khangminh22 -
Category
Documents
-
view
1 -
download
0
Transcript of The-Vienna-consenus_Lab-KPI.pdf - ESHRE
Review
The Vienna consensus: report of an expert meeting on thedevelopment of ART laboratory performance indicators
ESHRE Special Interest Group of Embryology and Alpha Scientists inReproductive Medicine a,b,*a European Society of Human Reproduction and Embryology, Meerstraat 60, B-1852 Grimbergen, Belgiumb ALPHA Scientists in Reproductive Medicine, 19 Mayis Mah. 19 Mayis Cad. Nova Baran Center No:4 34360 Sisli, Istanbul, Turkey
KEY MESSAGEThis proceedings report presents 19 Indicators, including 12 Key Performance Indicators (KPIs), 5 PerformanceIndicators (PIs), and 2 Reference Indicators (RIs) from an international workshop supported by the European Societyof Human Reproduction and Embryology (ESHRE) and Alpha Scientists in Reproduction (Alpha), designed to es-tablish consensus on definitions and recommended values for the assisted reproductive technology (ART) laboratory.
A B S T R A C T
This proceedings report presents the outcomes from an international workshop supported by the European Society of Human Reproduction and Em-
bryology (ESHRE) and Alpha Scientists in Reproductive Medicine, designed to establish consensus on definitions and recommended values for Indicators
for the assisted reproductive technology (ART) laboratory. Minimum performance-level values (‘competency’) and aspirational (‘benchmark’) values
were recommended for a total of 19 Indicators, including 12 Key Performance Indicators (KPIs), five Performance Indicators (PIs), and two Reference
Indicators (RIs).
© 2017 The Author(s). Published by Elsevier Ltd on behalf of Reproductive Healthcare Ltd. This is an open access article under the CC BY-NC-ND
license (http://creativecommons.org/licenses/by-nc-nd/4.0/).
Introduction
Performance Indicators (PIs) are objective measures for evaluatingcritical healthcare domains (patient safety, effectiveness, equity,patient-centeredness, timeliness and efficiency) (Kohn et al., 2000).In the setting of a clinical laboratory, quality indicators are necessary
for systematically monitoring and evaluating the laboratory’s con-tribution to patient care (ISO-15189:2012) and they represent animportant element within the quality management system (QMS)(ESHRE Guideline Group on Good Practice in IVF Labs et al, 2016;Mortimer and Mortimer, 2015). Currently, there are no establishedPIs for assisted reproductive technology (ART) laboratories, and thereis very little published evidence on the topic.
This consensus document, which has not been subjected to independent peer review by the editors of Reproductive BioMedicine Online, is beingpublished simultaneously by Reproductive BioMedicine Online and Human Reproduction Open.
* Corresponding authors.E-mail addresses: [email protected] (G Cotichio); [email protected] (ZP Nagy).
http://dx.doi.org/10.1016/j.rbmo.2017.06.0151472-6483/© 2017 The Author(s). Published by Elsevier Ltd on behalf of Reproductive Healthcare Ltd. This is an open access article under the CCBY-NC-ND license (http://creativecommons.org/licenses/by-nc-nd/4.0/).
ARTICLE IN PRESS
Please cite this article in press as: ESHRE Special Interest Group of Embryology and Alpha Scientists in Reproductive Medicine, The Vienna consensus: report of an expertmeeting on the development of ART laboratory performance indicators, Reproductive BioMedicine Online (2017), doi: 10.1016/j.rbmo.2017.06.015

Any PI should be reliable and robust, and routine data collectionfor the indicator should be straightforward. Furthermore, the bio-logical or technical process to be monitored should be defined, andrelevant qualifiers, confounders and endpoints should be identified.Key Performance Indicators (KPIs) are Indicators deemed essentialfor evaluating the introduction of a technique or process; establish-ing minimum standards for proficiency; monitoring ongoingperformance within a QMS (for internal quality control (IQC), exter-nal quality assurance (EQA)); benchmarking and quality improvement.In general, the results of a series of KPIs will provide an adequateoverview of the most important steps in the IVF laboratory process(Salinas et al., 2010).
The aim of the consensus meeting and report was to establishKPIs for ART laboratories for use in monitoring ‘fresh’ IVF and ICSIcycles and provide the basis for several of the quantitative perfor-mance criteria needed to create competency profiles for clinicalembryologists. More specifically, the purpose was to achieve aninternational consensus regarding: (i) a minimum list of IVF labora-tory indicators and KPIs that in the future can be further extendedand/or revised; (ii) specific definitions for these indicators (includ-ing necessary case inclusion/exclusion criteria; and calculationformulae); and (iii) recommended values for each KPI (minimum ‘com-petency’ limit; and ‘aspirational goal’ benchmark).
Based on the information presented here, each laboratory shoulddevelop its own set of KPIs founded on laboratory organization andprocesses, and develop a systematic, transparent, and consistent ap-proach to data collection and analysis and calculation of KPIs (ESHREGuideline Group on Good Practice in IVF Labs et al, 2016; Mayer et al.,2003; Mortimer and Mortimer, 2015; Salinas et al., 2010).
Methodology
This report is the result of a 2-day consensus meeting of expert pro-fessionals (participants are listed in Table 1). As a starting point forthe discussion at the meeting, two surveys were organized to collectinformation on indicators used in IVF laboratories. The first, the ‘Alphasurvey’, was sent to national and international societies of ART labo-ratory directors and clinical embryologists, and to the members ofthe European Society of Human Reproduction and Embryology (ESHRE)committee of national representatives. Eighteen responses were re-ceived out of 34 sent, with opinions from Australia, Austria, Belgium,Bulgaria, Canada, Croatia, France, Germany, Ireland, Italy, Japan, Slo-venia, Sweden, South Africa, Turkey, UK, and USA, and the resultsof this survey informed the expert panel on minimum expected, orcompetence, values (i.e. values that any laboratory should be able toachieve), and aspirational, or benchmark, values (i.e. values that canbe employed as a best practice goal), for a range of quality indica-tors. Where possible, responses were based on standardizedinformation (national collected data, or large datasets), but in mostcountries such data are not available. Another survey, the ‘ESHREsurvey’, provided information on current practice (How many KPIs aremeasured, frequency of measurement, characteristics of a refer-ence population for KPIs) and the degree of importance of someindicators. This survey was sent to 2413 members of the ESHRE SpecialInterest Group (SIG) of Embryology, and 384 responses were re-ceived. In addition, where relevant, published data were collected froma literature search and summarized, although for most indicators,
especially in ART, there is a general lack of evidence to support theirimportance, scientific soundness and usefulness (Shahangian andSnyder, 2009).
During the consensus meeting, the results of the surveys, scien-tific evidence and personal clinical experience were integrated intopresentations by experts on specific topics. For each indicator, in-formation was presented in a fixed format: definition, rationale,qualifiers, formula, data sources, KPI strengths and weaknesses, fre-quency of data collection and reference values for minimum expectedand target values based on 50 and 75 percentile values, respec-tively. After the presentation for the topic, each proposed indicatorwas discussed until consensus was reached within the group.
After the meeting, a report was prepared describing the presen-tations (workshop report) and the consensus points. After approvalof the report by the meeting participants, the national and interna-tional societies that contributed to the questionnaires were invitedto review the report and submit comments. The final version of themanuscript was approved by the Executive Committees of ESHRE andAlpha before publication.
This paper is divided into two parts: the workshop report, and therecommendations of the Expert Panel.
Workshop report
Effects of ovarian stimulation on embryology parameters
The methods of ovarian stimulation have been evolving since the ear-liest days of clinical IVF, in the search for the best stimulation protocol.With that goal in mind, there has been an enormous effort to develop
Table 1 – Consensus workshop participants and contributors.
Participant/contributorname
Affiliation
Susanna Apter Fertilitetscentrum Stockholm, SwedenBasak Balaban American Hospital of Istanbul, TurkeyAlison Campbella CARE Fertility Group, UKJim Catt Optimal IVF, Melbourne, AustraliaGiovanni Coticchio Biogenesi, Monza, ItalyMaria José de los Santosa IVI Valencia, Valencia, SpainSophie Debrocka Leuven University Fertility Centre,
Leuven, BelgiumThomas Ebnera Kepler University, Linz, AustriaStephen Harbottle Cambridge IVF, UKCiara Hughes Rotunda IVF, Dublin, IrelandRonny Janssens Centre for Reproductive Medicine,
Brussels, BelgiumNathalie Le Clef ESHRE Central Office, Grimbergen, BelgiumKersti Lundin Sahlgrenska University Hospital, SwedenCristina Maglia SISMER, Bologna, ItalyDavid Mortimera Oozoa Biomedical, Vancouver, CanadaSharon Mortimer Oozoa Biomedical, Vancouver, CanadaZsolt Peter Nagy Reproductive Biology Associates,
Atlanta, USAJohan Smitza Centre for Reproductive Medicine,
Brussels, BelgiumArne Sunde St Olav’s University Hospital,
Trondheim, NorwayNathalie Vermeulen ESHRE Central Office, Grimbergen, Belgium
a Presenter at the consensus workshop.
ARTICLE IN PRESS
Please cite this article in press as: ESHRE Special Interest Group of Embryology and Alpha Scientists in Reproductive Medicine, The Vienna consensus: report of an expertmeeting on the development of ART laboratory performance indicators, Reproductive BioMedicine Online (2017), doi: 10.1016/j.rbmo.2017.06.015
2 R E P R O D U C T I V E B I O M E D I C I N E O N L I N E ■ ■ ( 2 0 1 7 ) ■ ■ – ■ ■
the best pharmaceuticals and protocols, but in practice economicfactors as well as prevailing opinion can influence treatment deci-sions beyond consideration of the patient’s endocrine background.
Despite the thousands of smaller studies on this subject in theliterature, there are very few large multicentre randomized con-trolled trials (RCT) beyond those organized by pharmaceuticalcompanies, and these do not consider ‘non-standard’ groups of pa-tients. Furthermore, the meta-analyses that have been conductedare often unclear about their inclusion criteria. As a result, theprevailing approach is to use what works within each clinic, and isoften uncorrected for the patients’ weight, body mass index (BMI),or endocrine background. Some clinics also do not monitor cyclesfor financial reasons, which can have an influence on the cycleoutcome.
In general, a ‘good’ stimulation is one that produces a homoge-neous cohort of mature oocytes, with the least inconvenience and riskto the patient, and results in the birth of a healthy singleton. Fromthe Clinical Embryologist’s perspective, a good stimulation resultsin the retrieval of well-expanded cumulus-oocyte complexes (COC),as is expected from each follicle >14 mm in diameter, with a high pro-portion of metaphase II (MII) oocytes (Ectors et al., 1997; Nogueiraet al., 2006; Scott et al., 1989). On the other hand, a poor stimula-tion, caused, for example, by sub-optimal decisions regarding timingor stimulation dose, is one that may result in a high rate of abnor-mal COC morphology observed at the time of oocyte retrieval, possiblyresulting in an increased rate of abnormal fertilization (e.g. 1 pro-nucleus [PN], 3PN, etc.) and/or decreased rate of normal fertilizationand an increased aneuploidy rate (Soares et al., 2003).
Aggressive ovarian stimulation has effects on the patient’s well-being, by increasing the risk of ovarian hyperstimulation syndrome(OHSS) (Delvigne, 2009; Rizk, 2009), as well as on the endometriumand the ovaries. There are studies showing an increased likelihoodof embryo aneuploidy in connection with aggressive ovarian stimu-lation, even in patients younger than 35, including post-zygoticsegregation errors and maternal segregation errors (Baart et al., 2007;Haaf et al., 2009), as well as having a negative impact on the main-tenance of genomic imprints during early embryogenesis (Denommeand Mann, 2012; Fauque et al., 2007; Saenz-de-Juano et al., 2016).It has been shown that in patients belonging to either high or low strataof antimüllerian hormone (AMH) concentration an inverse correla-tion exists between the daily dose of recombinant human folliclestimulating hormone (rhFSH) used in the stimulation and the pro-portion of blastocyst formation (Arce et al., 2014).
To determine whether there is a stimulation method that couldyield a higher number of competent oocytes, one first needs to con-sider the effects of LH and FSH as the principal drivers of ovarianstimulation, and their pharmacodynamics. In a natural cycle, FSH re-ceptor expression peaks during the early follicular phase then declines,while LH receptor expression increases from mid-follicular phase,indicating that LH is likely to be involved in follicular development(Jeppesen et al., 2012). This could explain, at least in part, why fol-licular recruitment is compromised in women with profound pituitarydownregulation (Ferraretti et al., 2004). The role of the theca cellsin ovarian responsiveness to FSH is also illustrated by compro-mised follicular recruitment in women older than 35 years (Hugueset al., 2010; Humaidan et al., 2004; Piltonen et al., 2003), particu-larly those with reduced ovarian sensitivity to FSH (Davison et al., 2005)and reduced ovarian capacity to secrete androgens under basal LHconditions (Spencer et al., 2007). In addition, it has been shown thatLH induces epidermal growth factor-like factors in the mural
granulosa. Amphiregulin, one of these factors, has been correlatedwith good oocyte quality (Sugimura et al., 2015; Zamah et al., 2010).
The time of oocyte retrieval relative to the time of the ovulationtrigger is typically in the range of 34–38 h. In a meta-analysis includ-ing 5 RCT with a total of 895 women, it was found that a time of oocyteretrieval relative to the time of the ovulation trigger of >36 hours com-pared to <36 hours resulted in a higher oocyte maturation rate, butno difference in fertilization rate, implantation rate or pregnancy rate(Wang et al., 2011). Deviations from the locally established protocolshould be documented and taken into consideration.
In conclusion, to optimize outcomes, there is a need for individu-alization of the treatment protocol. As stimulation can affect a rangeof systems, closely monitoring the patient’s response could reducemany of the risks associated with ovarian stimulation, as stimula-tion can affect a range of systems, which will also have an impacton the success of treatment.
Because of the interlinked effects of ovarian stimulation on oocytequality and developmental competence, it is logical that the most suc-cessful clinics are those in which the embryologists and cliniciansspeak with each other and communicate regularly and effectively aboutoutcomes related to stimulation (and other procedures) (Van Voorhiset al., 2010).
Oocytes
Not all oocytes collected from a patient following ovarian stimula-tion for ART will have the same developmental competence, whichis illustrated by the observation that only 5% of oocytes collected even-tually result in a live birth (Lemmen et al., 2016). Intrinsic oocytecompetence is derived not only from the degree of nuclear maturityof the oocytes, but also from their cytoplasmic maturity (Garrido et al.,2011; Lemmen et al., 2016; Patrizio and Sakkas, 2009). Further-more, oocyte developmental competence is affected by a range ofintrinsic patient-related and external factors. These patient-relatedfactors include age, BMI, lifestyle factors, and type of infertility. Theexternal factors include ovarian stimulation, laboratory procedures(such as oocyte retrieval, denudation, cryopreservation, preparationfor ICSI), culture conditions (temperature, pH, pO2), environmental con-ditions (light, air quality, humidity) and culture medium.
Against that background, the question is whether any laboratoryindicator can provide a measure of the intrinsic oocyte competenceat the time of oocyte retrieval, as all of the subsequent events couldbe influenced by laboratory procedures, and/or by the genetic con-tribution of the spermatozoon. In other words, is quality measurablefor oocytes, or perhaps more pertinently, is there any measure thatcould pinpoint where a dysfunction occurred during the long processof oocyte development?
There are a number of possible markers for oocyte competence,but these are largely research-based, and have not found wide-spread application in clinical service. These include assessment ofbiochemical markers in follicular fluid, gene expression studies offollicular cells, and oxygen uptake assessments (Nagy et al., 2009;Nel-Themaat and Nagy, 2011). Other markers, such as assessmentof oocyte morphology, spindle imaging, and polar body biopsy can beincorporated into clinical service, but this is not a universal ap-proach (Braga et al., 2013; Patrizio et al., 2007; Rienzi et al., 2011).
When the results of the Alpha and ESHRE surveys were com-bined, respondents identified oocyte recovery rate and oocyte maturityrate as the most important indicators for oocytes. Although, strictlyspeaking, they do not provide an indication of laboratory performance,
ARTICLE IN PRESS
Please cite this article in press as: ESHRE Special Interest Group of Embryology and Alpha Scientists in Reproductive Medicine, The Vienna consensus: report of an expertmeeting on the development of ART laboratory performance indicators, Reproductive BioMedicine Online (2017), doi: 10.1016/j.rbmo.2017.06.015
3R E P R O D U C T I V E B I O M E D I C I N E O N L I N E ■ ■ ( 2 0 1 7 ) ■ ■ – ■ ■
they do provide an estimate of response to stimulation, and there-fore a general estimation of the likely developmental competence ofthe oocytes.
In the Alpha survey, oocyte recovery rate was defined as the like-lihood of aspirating a COC from each follicle over a certain size asmeasured on the day of triggering. The rationale for this is the ex-pectation that those follicles that have achieved a certain size, witha good response to FSH and a sufficient number of LH receptors infollicular cells, will respond appropriately to the ovulation signallingcascade, resulting in the release of the COC into the follicular fluid,thereby facilitating its aspiration. A concern with this potential indi-cator was its reliance on the accuracy of follicular scanning, and theneed for a consistent time interval between ovulation trigger and oocyteretrieval. However, while a range of follicle sizes were identified inthe survey as the ‘ideal’ size for triggering, the expected recovery rateswere remarkably similar, generally ranging from 70–80% as the com-petence level, and 85–100% as the benchmark value.
Oocyte maturity rate is generally related to nuclear maturity, beingdefined as the proportion of oocytes at MII stage. Its potential valueis as a marker of the efficiency of ovarian stimulation and trigger-ing. Of the Alpha survey respondents, 80% indicated that theirlaboratory determined the MII rate, with median competence andbenchmark values of 75% and 90%, respectively. It was noted thatthe timing of this assessment is an important factor, as it is not pos-sible to assess oocyte maturity at the time of oocyte retrieval in thecase of insemination by routine IVF. Since this assessment requiresthe removal of the cumulus and corona cells, it can be performedat the time of denudation of the oocytes prior to ICSI, but for a uni-versal competence and benchmark value to be established, aconsistent time interval between the time of trigger and the time ofcumulus cell removal would be required (e.g. 40 ± 1 h post ovula-tion triggering).
A third potential indicator, oocyte grade, was defined as the pro-portion of COC with expanded cumulus at the time of oocyte retrieval.As ovulation triggers cumulus expansion by mediating the synthe-sis of hyaluronic acid and the organization of a stable cellular matrix(Russell and Salustri, 2006), this indicator provides an assessmentof the quality of communication between the oocyte and its cumuluscells. The potential problems associated with the use of this indica-tor are a lack of objective criteria for making this assessment, anda concern that there is not always a good correlation between nuclearmaturity and cumulus cell expansion (Balaban and Urman, 2006).
Other indicators that were proposed, but not considered valu-able or reliable by the survey respondents were: rate of degenerated(or empty) zonae pellucidae; rate of germinal vesicle (GV) oocyte re-covery; definition of the minimum number of follicles to justify flushing;and oocyte degeneration rate at the time of oocyte retrieval. Oocytedegeneration rate after removal of cumulus cells is discussed in thesection on ICSI.
Overall, the responses to the surveys highlighted the lack of con-sistent data for the evaluation of oocyte quality and competence, andidentified an opportunity for national and international registries topromote the collection of this information.
Spermatozoa
Proposed andrology laboratory PIs were sperm recovery rate, andsperm motility post-wash. In addition, sperm parameters were dis-cussed in relation to the decision for intrauterine insemination (IUI),IVF or intracytoplasmic sperm injection (ICSI).
Survey responses revealed such wide ranges in perceived semenanalysis minima for suitability for IUI, IVF or ICSI, as well as expectedsperm recovery post-wash, as to make it impossible to determinerobust recommendations for competency and benchmark values forany of these criteria.
With regards to sperm preparation, it is possible that respon-dents were confused when reporting the ‘recovery rate’, and thesubstantial variability in terms of the expected/required number ofspermatozoa in the final preparation likely included confusion between% recovery (‘yield’) values and the actual number of spermatozoa (mil-lions); hence these data were considered unreliable. However, theexpected proportion of motile spermatozoa in the final washed prepa-ration showed coherence across the respondents, with both medianand mode values of 90% for competency and 95% for the benchmark.
A major issue when considering semen analysis data is that manyART laboratories do not employ methods that meet the minimumstandards required by either the World Health Organization (WHO)or the ESHRE SIG Andrology (Björndahl et al., 2010; World HealthOrganization, 2010). Therefore, reported values for sperm concen-tration and motility must be understood to have high uncertainty ofmeasurement, and hence need to be considered as inaccurate andunreliable (Bjorndahl et al., 2016; Sanchez-Pozo et al, 2013). As a con-sequence, any association between semen analysis characteristics,yield and fertility potential will remain unclear if based on studies usinginappropriate semen analysis techniques. From a best practice stand-point, any clinical laboratory providing semen analysis or post-preparation values that are to be used for diagnostic or treatmentmanagement purposes should participate in an external quality as-surance (EQA) programme which provides a comparison between theparticipating laboratories’ results and established reference (‘correctanswer’) values so as to permit quality improvement in laboratory work(Björndahl et al., 2010).
Moreover, there is a general concern that semen analysis refer-ence values have little or no value for ART procedures (Bjorndahl,2011). In particular, the WHO reference values for sperm concentra-tion, motility and vitality were derived from populations of men whohad achieved in-vivo conceptions (Cooper et al., 2010), and there-fore these cut-off values have no a priori relevance in regard to ARTpatients, and hence the need or suitability for any form of ART treat-ment should not be decided based on these reference values.
The Tygerberg Strict Criteria for normal sperm morphology werederived in regard to ART success (Coetzee et al., 1998; Kruger et al.,1988), so these cut-off values might be pertinent in differentiatingbetween the need for IUI, IVF or ICSI – although concern regardingmeasurement uncertainty cannot be ignored (Menkveld et al., 2011).While a cut-off of 4% normal forms might help define sub-populationsof patients with differing prognoses, at the level of individual pa-tients a result of 4% based on 200 spermatozoa evaluated is not veryinformative since the result has a statistical expectation ranging from2–8% (Björndahl et al., 2010), and to be able to differentiate between3% and 5% with statistical robustness would require the assess-ment to have been made evaluating over 1500 spermatozoa.
Because of the limitations of semen analysis cut-off values, a de-cision on the suitability of IUI or routine IVF for a couple should bemade based on post-preparation sperm number/concentration andmotility, ideally assessed during a pre-treatment ‘trial wash’ (whilestill taking into account the uncertainty of measurement). In case ofICSI, there should not be any cut-off based on semen analysis char-acteristics, the only logical criterion would be having sufficient(in comparison with the expected number of oocytes) spermatozoa
ARTICLE IN PRESS
Please cite this article in press as: ESHRE Special Interest Group of Embryology and Alpha Scientists in Reproductive Medicine, The Vienna consensus: report of an expertmeeting on the development of ART laboratory performance indicators, Reproductive BioMedicine Online (2017), doi: 10.1016/j.rbmo.2017.06.015
4 R E P R O D U C T I V E B I O M E D I C I N E O N L I N E ■ ■ ( 2 0 1 7 ) ■ ■ – ■ ■

that are, ideally, viable, and preferably motile or hypo-osmotic swell-ing (HOS) test positive (Nagy et al., 1995). As a general principle,laboratories should develop and apply their own criteria for decid-ing on IUI, IVF or ICSI, based on the couple’s clinical situation andreproductive history rather than on semen analysis.
Regarding andrology laboratory PIs, results from the Alpha surveyindicated that only post-preparation sperm motility would be a valu-able indicator, as it monitors the effectiveness of the sperm washingprocedure. Therefore, post-wash sperm motility should be moni-tored for fresh ejaculate specimens that show normozoospermia asper the WHO5 guidelines (World Health Organization, 2010), but stilltaking into account the poor reliability of sperm motility data, non-robust classification of semen samples based on the high uncertaintyof semen analysis data, and variability in sperm preparation methods.
Sperm recovery rate, defined as the percentage recovery of pro-gressively motile sperm after washing as compared to pre-washing(Björndahl et al., 2010), can be used as a laboratory KPI, providinguseful information for inter-operator comparison and proficiencytesting. However, given the high uncertainty in counting and the dif-ferent protocols for sperm preparation (notably with density gradientwashing resulting in higher recovery rates compared with direct swim-up from semen), no competence values can be provided. Laboratoriesshould develop their own standards according to their own clinicaland laboratory practice.
Fertilization after insemination by ICSI
Although several potential KPIs have been identified in ICSI, the pre-sentation focused on the four most pertinent: normal fertilization rate,oocyte degeneration rate, poor fertilization rate and failed fertiliza-tion rate.
The definition used most often for the ICSI normal fertilization rateis the proportion of injected oocytes with 2PN the day after injec-tion, except for the Spanish Registry and the Istanbul Consensus whichinclude the observation of two polar bodies (PB) in the definition (AlphaScientists In Reproductive Medicine and ESHRE Special Interest Groupof Embryology, 2011). The suggested competence and benchmarkvalues for this indicator were consistent among respondents rangingfrom 60–80% and 70–100%, respectively. The UK’s Association of Clini-cal Embryologists (ACE) proposed benchmark for the 2PN rate is >65%,including only patients below 40 years of age with at least three oocytescollected (Hughes and Association of Clinical Embryologists, 2012).From the literature it was found that ICSI results in an average fer-tilization rate of 70% (Heindryckx et al., 2005; Kashir et al., 2010), whichwas similar to 68.7% based on over 20,000 unselected MII oocytesat the CARE Fertility laboratories (personal communication, AlisonCampbell). ICSI fertilization rate is a commonly reported and effec-tive indicator that is informative of gamete quality and operatorcompetence. ICSI 2PN rate does depend on the various criteria usedfor performing ICSI, which can be considered a weakness of theindicator.
The ICSI damage rate or oocyte degeneration rate was ranked asimportant. In the Alpha survey, the minimum expected value and targetvalue ranged from 3–30% and 0–10%, respectively. Oocyte damagecan be observed at three time points during the ICSI process fromthe start at stripping, during ICSI, or at the fertilization assessmenton Day 1. Oocyte damage probably occurs most frequently during in-jection, but without immediate signs of damage this is not detecteduntil the fertilization check. In addition, as both the damage de-tected at injection and at fertilization check reflect damage from the
ICSI process, these should not be recorded and calculated sepa-rately. Damage at denudation/stripping can be monitored separatelyas it mainly reflects operator competency, but it has a very low fre-quency. ICSI damage rate is therefore defined as the number of oocytesdamaged during ICSI, and/or observed at fertilization check over thenumber of injected oocytes. It is useful to monitor this indicator foroperator competence, oocyte quality, and laboratory performance. Thedamage rate can also be indicative of technical problems (e.g. cumuluscell removal stress, vibration). Alternatively, the term ‘ICSI oocyte sur-vival rate’ can be used.
Poor fertilization rate is defined as the proportion of cycles in which<25% of the injected oocytes are fertilized. The responses from thesurvey are much divided, ranging from 5%–20% for the competenceand from 0–15% for the benchmark value. Poor fertilization rate cangive an indication of operator competence and reflect gamete quality.
Failed fertilization rate scored relatively low in importance in thesurveys. Failed fertilization rate is defined as the proportion of cyclesin which none of the injected oocytes are fertilized. The indicator canbe informative of gamete quality/function and/or operator skill. A de-ficiency in the mechanism of oocyte activation is regarded as theprincipal cause of ICSI fertilization failure or abnormally low fertil-ization. Complete (or ‘virtually complete’) fertilization failure with ICSIoccurs in 1–5% of cycles (Flaherty et al., 1998; Kashir et al., 2010;Liu et al., 1995; Mahutte and Arici, 2003; Yanagida, 2004). From theAlpha survey there was a wide range in the competence values forthis indicator ranging from 2–15% (median 5%), with a benchmarkof <1%, respectively.
For these and other KPIs, a reference population could be rel-evant. With regard to ICSI fertilization rate, it could be relevant toexclude cases where reduced fertilization rates are anticipated, in-cluding in-vitro matured MI oocytes (although inconclusive data),artificially activated oocytes, use of testicular sperm, and cases ofglobozoospermia and asthenozoospermia (Rubino et al., 2016).However, due to the low prevalence, including these cases may notsignificantly affect the indicators in most clinics.
In conclusion, from the surveys and collected evidence, ICSIdamage rate and ICSI normal fertilization rate are considered rel-evant and important KPIs, while the value of ICSI low/failed fertilizationrate as a KPI is less clear. Oocyte maturity rate and 1PN/3PN ratewere not specifically discussed for ICSI. The ICSI rate, defined as theproportion of cycles that use ICSI, was not commonly recorded by thesurvey respondents, judging this as a less relevant PI.
Fertilization after (routine) IVF insemination
This section deals with normal fertilization rate, polyspermy rate, poorfertilization rate, and zygote morphology after routine IVF insemination.
Pronuclear formation occurs 1.5–2.0 hours earlier in oocytes in-seminated by ICSI compared with those inseminated by conventionalIVF (Montag et al, 2001; Nagy et al., 1998). This should be taken intoconsideration when setting the time for fertilization check, relativeto the time elapsed since insemination (recommended as 17 ± 1 h)(Alpha Scientists In Reproductive Medicine and ESHRE Special InterestGroup of Embryology, 2011). A normally fertilized oocyte should havetwo pronuclei (2PN) of similar size that are closely apposed and cen-trally located (Alpha Scientists In Reproductive Medicine and ESHRESpecial Interest Group of Embryology, 2011). Although the prov-enance of micronuclei remains unclear, their presence could beconsidered to be abnormal, as could the presence of pronuclei of dif-ferent sizes. From the literature, the normal fertilization rate (i.e. the
ARTICLE IN PRESS
Please cite this article in press as: ESHRE Special Interest Group of Embryology and Alpha Scientists in Reproductive Medicine, The Vienna consensus: report of an expertmeeting on the development of ART laboratory performance indicators, Reproductive BioMedicine Online (2017), doi: 10.1016/j.rbmo.2017.06.015
5R E P R O D U C T I V E B I O M E D I C I N E O N L I N E ■ ■ ( 2 0 1 7 ) ■ ■ – ■ ■

proportion of inseminated oocytes with 2PN at the time of the fer-tilization check on Day 1) is expected to be around 67%, with a rangeof reported values from 53–81%. This range was reflected in the Alphasurvey results, where the median value for competency was 61% ofinseminated oocytes, with a median benchmark value of 77%.
The presence of three or more pronuclei is indicative of an ab-normal fertilization, arising from either failure to extrude the secondpolar body or polyspermy. Polyspermy may be the result of eitheroocyte immaturity (causing failure of the cortical reaction), oocyteovermaturity, and/or an extremely high concentration of motile sper-matozoa in the insemination volume (Wang et al., 2003). From theliterature, the incidence of ≥3PN is 4–7% in IVF (Joergensen et al.,2015). This agrees well with the median values from the Alpha surveyof <9% for competence, and <4.5% as a benchmark.
The calculation of the total fertilization rate following IVF in-cludes all fertilized oocytes with ≥2PN. Although, as already stated,oocytes with >2PN are abnormally fertilized, this parameter pro-vides an indication of the ability of the culture system to support spermcapacitation and sperm–oocyte interaction in IVF cycles. Of the pub-lished studies that included >100 oocytes, the median total fertilizationrate was 76% (range 69–87%) in selected patient populations. Thisis similar to the Alpha survey results which suggested a compe-tency level of at least 63% and a benchmark of at least 84%.
Oocytes with a single pronucleus after insemination by IVF, whichoccurs in 1–5% of cases, can be indicative of fertilization and syngamy,asynchronous appearance of pronuclei (an extremely rare event, asevidenced by the use of time-lapse microscopy), or parthenogeneticactivation (Levron et al., 1995). The incidence of diploidy in 1PN oocytesfollowing conventional IVF has been reported to be in the range of45–50% (Kai et al., 2015; Staessen and Van Steirteghem, 1997; Sultanet al., 1995). In contrast, 1PN oocytes arising after ICSI have a re-ported diploidy rate of only 7–14%, with genetic abnormalities in thesubsequent embryos (Mateo et al., 2013).
The incidence of poor fertilization (<25% of inseminated COC with2PN) or total failure of fertilization (no oocytes with signs of fertil-ization) could be indicative of a problem with sperm function, too fewmotile spermatozoa during insemination, or failure of oocyte activa-tion (Ebner et al, 2015). There is very little evidence in the literatureregarding the expected incidence of either poor or failed fertiliza-tion. However, the Alpha survey results suggested competency andbenchmark levels for poor and failed fertilization of 14% and 6%, and8% and 4%, respectively.
Although the Istanbul Consensus made recommendations aboutgrading zygote morphology (Alpha Scientists In Reproductive Medicineand ESHRE Special Interest Group of Embryology, 2011), the ques-tion remains as to whether indicators referring to zygote morphologyare useful, especially as differences in pronuclear pattern could berelated to the insemination method and timing of the observation(Ebner et al., 2003; Montag et al, 2001).
Cleavage-stage embryos
Proposed indicators for cleavage-stage embryos are early cleavagerate, cleavage rate, embryo development rates, embryo fragmenta-tion rate, and rate of good quality embryos (embryo score or grade).
Early cleavage rate is defined as the proportion of cleaved zygotesat the early cleavage check on Day 1 (26 ± 1 h post-ICSI or 28 ± 1 hpost-IVF) (Alpha Scientists In Reproductive Medicine and ESHRESpecial Interest Group of Embryology, 2011), but other time inter-vals after insemination have been used for assessing early cleavage.
This indicator reflects the ability of the culture system to support earlycleavage of fertilized oocytes and the viability and quality of the embryos(Shoukir et al., 1997). There are conflicting results on the impor-tance of early cleavage. Studies have shown that early cleavage,together with other factors, can be used as an embryo selectionmethod (Ciray et al., 2005; Lundqvist et al., 2001). Early cleavage ratehas also been shown to correlate with blastocyst implantation andpregnancy rates (Balaban and Urman, 2003; Shoukir et al., 1997) andit is a better independent marker of implantation potential than zygotemorphology (Brezinova et al., 2009). In contrast, early cleavage wasnot found to be an independent predictor of implantation in IVF pa-tients with good prognosis (Thurin et al., 2005). In addition, prematureoccurrence of early cleavage can be negatively, instead of posi-tively, associated with embryo implantation potential (Meseguer et al.,2011). Furthermore, it was not a reliable predictor for embryo im-plantation rate when good quality embryos are transferred (de losSantos et al., 2014; Sundstrom and Saldeen, 2008), or when using aGnRH antagonist protocol (Yang et al., 2015). In the Alpha survey, com-petence and benchmark values ranged from 10–50% and 15–60%,respectively.
Cleavage rate reflects the ability of the culture system to supportcellular division of fertilized oocytes. It is an indicator of embryo vi-ability and has the ability to detect culture media contaminants. Thepresence of non-cleaved embryos or arrested zygotes on Day 3 is as-sociated with a decrease in quality of the remaining cohort, but withouta negative impact on clinical outcome (Machtinger et al., 2015). Cleav-age rate is considered important and widely monitored, and definedas the proportion of zygotes which cleave to become embryos on Day2 at 44 ± 1 h post-insemination (Alpha Scientists In ReproductiveMedicine and ESHRE Special Interest Group of Embryology, 2011).Cleavage rate should be calculated not only in the total population,but also in reference groups (IVF versus ICSI, female age, ejacu-lated versus surgically retrieved sperm), and controlled for confounders(the timing of observation and oocyte maturity). Also, the presenceof a refractile body in the oocyte is associated with reduced cleav-age rates and impaired embryo development, while the cytoplasmicgranularity did not seem to have an effect on embryo development(Fancsovits et al., 2012). Cleavage rate should be calculated fre-quently (at least once per month). In the Alpha survey the competencevalues ranged from 80–95%, with a benchmark of 90–100%.
Embryo development rate is defined as the proportion of 4-cellembryos on Day 2 among the 2PN zygotes (measured at 44 ± 1 h post-insemination), the proportion of 8-cell embryos on Day 3 (measuredat 68 ± 1 h post-insemination), and the proportion of morula-stageembryos on Day 4 (92 ± 2 h post-insemination) (Alpha Scientists InReproductive Medicine and ESHRE Special Interest Group ofEmbryology, 2011). This indicator reflects the ability of the culturesystem to support cleavage according to the expected developmen-tal stages and the quality and viability of embryos, especially for Day2 or Day 3 transfer, while less important for blastocyst transfer. Pos-sible confounders are the timing of laboratory observations and thetype of culture media used. Although dependent on iatrogenic factorslike the culture conditions, embryo development rate is an impor-tant indicator; in well-defined categories of patients, it reflects theoverall laboratory performance. It was stated that sufficient numbersof embryos or longer data collection are necessary, as this indica-tor is influenced by short-term variations. Calculation of a sliding meancan be helpful for detecting long-term variations. The value and prac-ticability of the morula check on Day 4 was questioned, as centresperforming Day 5 embryo transfer often do not assess the embryo
ARTICLE IN PRESS
Please cite this article in press as: ESHRE Special Interest Group of Embryology and Alpha Scientists in Reproductive Medicine, The Vienna consensus: report of an expertmeeting on the development of ART laboratory performance indicators, Reproductive BioMedicine Online (2017), doi: 10.1016/j.rbmo.2017.06.015
6 R E P R O D U C T I V E B I O M E D I C I N E O N L I N E ■ ■ ( 2 0 1 7 ) ■ ■ – ■ ■

development at Day 4. Also, instead of assessing the number of 4-cellembryos on Day 2, or 8-cell embryos on Day 3, a combination of 4-celland 8-cell embryos on Day 2 and Day 3 can be used. This was analysedin a study by van Royen, who thereby characterized a top-qualityembryo as having 4–5 cells on Day 2 and ≥ 7 cells on Day 3 (Van Royenet al., 1999). In larger centres, assessing the embryos at the speci-fied time points can be difficult, and counting 4- and 5-cell embryoson Day 2, and 7-, 8- and 9-cell embryos on Day 3 may be more relevant.
The rate of good-quality embryos is defined as the proportion ofDay 2 and Day 3 embryos with high score or grade. Many differentscoring systems exist, based on different variables, including cellnumber, fragmentation, cell size and multinucleation (Alpha ScientistsIn Reproductive Medicine and ESHRE Special Interest Group ofEmbryology, 2011) and blastomere nuclear status (Fauque et al., 2013).A recent study evaluating which set of embryo variables is most pre-dictive for live birth rate (LBR) reported that blastomere number,proportion of mononucleated blastomeres, degree of fragmenta-tion, and variation in blastomere size were significantly associatedwith LBR in univariate analysis, while symmetry of the embryo wasnot (Rhenman et al., 2015). Furthermore, the grading systems arenot robust, but can be used as internal quality assessment param-eters. The importance of this parameter is also affected by the limitedsignificance of the fragmentation rate.
Embryo fragmentation rate, defined as the proportion of Day 2 andDay 3 embryos with <10% fragmentation, reflects the quality and vi-ability of embryos. From the Alpha survey the competence value forthis parameter ranged from 20–90% (median 50%) and the bench-mark from 30–90% (median 70%). These large ranges underline thedifficulties with this parameter: embryo fragmentation rate is re-ported to be a subjective parameter and difficult to evaluate as onehas to differentiate between a cell and a fragment and then esti-mate the relative proportion of fragments (Paternot et al., 2011).
Embryo utilization rate is defined as the number of embryos uti-lized (transferred or cryopreserved) per number of 2PN zygotes inthe same cycle. This parameter is often presented in studies, but com-petence and benchmark values cannot be calculated due to itsdependence on strategies for embryo transfer and cryopreservation,as well as patient request.
In conclusion, embryo cleavage rate and embryo development rateare extremely important indicators, while early cleavage rate, rateof good-quality embryos, and embryo fragmentation rate are less im-portant as quality indicators.
Blastocyst development
In the case of blastocyst-stage embryo transfer, several param-eters were suggested as indicators: blastocyst development rate, goodblastocyst development rate, the proportion of good quality blasto-cysts, and Day 5 embryo transfer rate.
The blastocyst development rate, defined as the proportion of 2PNzygotes (not just of cleaved zygotes) which are at the blastocyst stageat Day 5 (116 ± 2 h post-insemination) (Alpha Scientists In ReproductiveMedicine and ESHRE Special Interest Group of Embryology, 2011), wasrated important because it reflects the efficiency of the whole culturesystem. Blastocyst development rates can be calculated on Day 5, Day6 or Day 5/Day 6 combined. Assessment and calculation on Day 5,consistent with previous consensus, is preferred based on limitednumbers of embryos available on Day 6. The competence and bench-mark values for blastocyst development rate on Day 5 ranged from25–60% and 44–80%, respectively. The blastocyst development rate
is an objective parameter, but dependent on the assessment of blas-tocyst morphology, which is straightforward in the case of good qualityblastocysts, but can be challenging for embryos showing an at-tempted cavitation. Confounders can be the timing of laboratoryobservation, the culture medium and the culture conditions (in par-ticular the pO2).
The good blastocyst development rate is defined as the propor-tion of 2PN zygotes which are good-quality blastocysts on Day 5 (116± 2 h post-insemination) (Alpha Scientists In Reproductive Medicineand ESHRE Special Interest Group of Embryology, 2011). Similar toblastocyst development rate, measuring this as an indicator only onDay 5 could make the indicator more robust. Blastocyst quality shouldbe based on (i) blastocoele expansion, (ii) appearance of trophecto-derm (TE), and (iii) appearance of inner cell mass (ICM). Although allthree parameters have been shown to be correlated to pregnancy andLBR (Van den Abbeel et al., 2013), only TE was found to be a statis-tically significant independent predictor of live birth outcome afteradjustment for known confounders (Ahlstrom et al., 2011). Even thoughICM is important, a strong TE layer is essential at this stage of embryodevelopment, allowing successful hatching and implantation (Ahlstromet al., 2011). In the Alpha survey, the competence and benchmarkvalues for good blastocyst development rate on Day 5 ranged from15–45% and 25–80%, respectively.
The proportion of good-quality blastocysts can be calculated fromthe blastocyst development rates and the good-quality blastocyst de-velopment rates. There is no evidence pertaining to the significanceof this parameter in the literature, and no data from the Alpha survey.
Day 5 embryo transfer (ET) rate was defined as the proportion ofcycles with ≥1 2PN zygotes on Day 1 that had ≥1 blastocyst for trans-fer on Day 5. From the Alpha survey there was a large variation inthe values for competence and benchmarks (ranging from 25–90%and 40–100%, respectively), which is assumed to be due to differ-ences in the time of blastocyst assessment, and different grade ofexpansion. In addition, this parameter depends on different policiesfor transfer in different settings. Cycles for preimplantation geneticdiagnosis (PGD) or preimplantation genetic screening (PGS) – glob-ally indicated as preimplantation genetic testing (PGT), comprisingPGD for single gene disorders or for chromosome structural abnor-malities, and PGS for aneuploidy – should be excluded from thiscalculation. Some possible confounders are the timing of labora-tory observation (ideally at 116 ± 2 h post-insemination), but in somelaboratories the time of observation depends on the timing of ET(physician availability), the culture medium and other culture condi-tions (e.g. pO2), and the grade of blastocyst expansion.
Fresh cleavage or fresh blastocyst transfer?Recently, a Cochrane review summarized evidence from RCT com-paring the reproductive outcomes after fresh cleavage-stage versusfresh blastocyst-stage embryo transfer (Glujovsky et al., 2016). Basedon low-quality evidence, they concluded that the LBR following freshtransfer was higher in the blastocyst-stage transfer group com-pared with the cleavage-stage transfer group (OR 1.48, 95% CI 1.20–1.82; 13 RCT, 1630 women, I2 = 45%). This translated to a LBR of 29%after fresh cleavage-stage transfer, and between 32% and 42% afterfresh blastocyst-stage transfer. The 5 RCT that reported cumula-tive pregnancy rates after fresh and frozen transfers showed nosignificant difference after one oocyte retrieval (based on very low-quality evidence). The main limitation was serious risk of bias,associated with failure to describe acceptable methods of random-ization, and unclear or high risk of attrition bias (Glujovsky et al., 2016).
ARTICLE IN PRESS
Please cite this article in press as: ESHRE Special Interest Group of Embryology and Alpha Scientists in Reproductive Medicine, The Vienna consensus: report of an expertmeeting on the development of ART laboratory performance indicators, Reproductive BioMedicine Online (2017), doi: 10.1016/j.rbmo.2017.06.015
7R E P R O D U C T I V E B I O M E D I C I N E O N L I N E ■ ■ ( 2 0 1 7 ) ■ ■ – ■ ■

Another review reported that blastocyst (Day 5/6) transfer in a freshIVF/ICSI treatment cycle significantly increased LBR (OR 1.77; 95%CI 1.32–2.37), clinical pregnancy rate, implantation rate, and ongoingpregnancy rate, and reduced first trimester miscarriage rate, in com-parison with cleavage-stage (Day 2/3) embryo transfer based on 7 RCTand 1446 cases (Wang and Sun, 2014).
Implantation rate and live birth rate
Implantation rate is judged an important indicator that reflects theoverall performance of the laboratory, and an overall low implanta-tion rate is a serious alert. Implantation rate is defined as the numberof gestational sacs observed divided by the number of embryos(cleavage-stage or blastocysts) transferred (Zegers-Hochschild et al,2009), or as the proportion of fetal heartbeats detected relative to thenumber of embryos transferred (Alpha Scientists In ReproductiveMedicine, 2012). Implantation rate reflects the efficiency of the wholeculture system, but it can be influenced by uterine receptivity, andby different policies for embryo transfer in different centres.
LBR may be considered as the ultimate KPI for checking IVF clinicperformance and is defined as the likelihood of a baby being born perembryo transferred. LBR is largely affected by a series of clinical ma-ternal factors pertaining to post-implantation development, rather thanreflecting laboratory performance. This parameter can be calcu-lated annually, but it is often difficult to collect the data.
Preimplantation genetic testing (preimplantation geneticdiagnosis/screening)
The indicators proposed for PGD/PGS (PGT) were successful biopsyrate/tubing rate, rate of no biopsy, proportion of samples submittedto analysis where no results were available (no DNA was detected),embryos not found on warming. Other indicators suggested in thesurvey were ‘survival after warming’, embryo transfer per PGT cycle,and miscarriage rate, but there were very few responses for thesevariables in the Alpha survey.
The successful biopsy rate is defined as the proportion of biopsiedand tubed/fixed samples where DNA is detected. It was suggestedthat this combined parameter be used – combining the tubing rate(the proportion of embryos where cells were tubed) and the propor-tion of samples submitted to analysis where no DNA was detected –as the tubing of cells can often not be inspected visually and will onlybe detected by the presence of DNA after amplification. A bench-mark for the tubing rate of 95% was reported in the Alpha survey.Confounders for the successful biopsy rate are embryo quality, andthe criteria for biopsy (for Day 3 embryos: presence of a visible nucleus;for Day 5/6: grade of hatching, TE quality). From the data of the ESHREPGD Consortium, of 254,820 samples that were biopsied, 91.3% werediagnosed (De Rycke et al., 2015). It is important to underline that,as already mentioned, these data mainly refer to Day 3 biopsies andthat, in the case of PGT for aneuploidy (generally known as PGS)the analysis of biopsies was mainly done by Fluorescence In SituHybridization (FISH), a technique requiring cells to be fixed on aglass slide. FISH is now being replaced by other methods providing24-chromosome testing, which require tubing of cell biopsies.
The rate of no biopsy is defined as the proportion of intended PGD/PGS (PGT) cases where there were no embryos available to biopsy.This parameter was rated important, but it reflects patient-relatedfactors and the ability of the culture system to support cleavage/blastocyst formation, rather than the performance ability of the
laboratory to perform a PGD/PGS (PGT) treatment/analysis. Further-more, the parameter is different whether biopsy is performed at thecleavage or blastocyst stage, and depends on the timing of labora-tory observation, culture medium and culture conditions (e.g. pO2),criteria for biopsy, the time point of assisted hatching (Day 3 or Day 5),and patient selection. The parameter should also be calculated forPGD and PGS separately, based on the difference in patient popula-tions. From the Alpha survey, the median competence value andbenchmark were 20% and 10%, respectively. In the last data collec-tion of the ESHRE PGD Consortium, out of 45,163 reported cycles, 2.8%were cancelled before biopsy (De Rycke et al., 2015). However, as thisdata collection covers cycles performed up to 2010, this figure refersto Day 3 biopsies, implying that possibly a higher value could be ex-pected for Day 5 biopsies.
For a number of samples, no results are available after amplifi-cation. Results can be inconclusive even with a strong DNAamplification band in the agarose gel, which can be due to early frag-mentation of DNA. In single gene analysis, results can be inconclusiveif information is found only on a reduced number of markers, or thegene of interest failed to amplify. Although this indicator is not strictlyrelated to the performance of the laboratory, it is relevant to informclinicians of the total number of embryos where PGD/PGS (PGT) resultsare available. The number of samples where no results are avail-able after amplification was reported in the Alpha survey with abenchmark of <5%, which corresponds with the converse of the tubingrate.
Nowadays, the majority of PGT cycles are based on blastocystbiopsy and cryopreservation. The proportion of embryos not found onwarming and embryos degenerated after warming mainly reflect op-erator skill. In the Alpha survey, the median competence values were3% and 10% for not-found and degenerated embryos, respectively.These indicators can also be reported as one combined indicator. Itwas mentioned that clinicians should be aware that although labo-ratories strive for 100% recovery, not all embryos submitted to PGD/PGS (PGT) will be recovered after warming.
Reference values for implantation rate and LBR after PGT can bederived from the data from the ESHRE PGD Consortium. The im-plantation rate was 26% for PGD and 22% in PGS, with delivery rates(per oocyte retrieval) of 21% and 14%, respectively (De Rycke et al.,2015).
Indicators for cryopreservation: addition to the previousconsensus (Alpha Scientists In Reproductive Medicine, 2012)
Blastocyst re-expansion rate is defined as the proportion of warmedblastocysts that show re-expansion within a defined time period (e.g.2 h). Recent evidence shows that there is an impact on the perfor-mance results depending on the quality/expansion of the blastocystswhich are cryopreserved (Cobo et al., 2012). Also, in blastocyst freshtransfer, multivariate analysis showed that the odds of live birth in-creased by 36% for each grade of expansion (P = 0.0061) and decreasedby 29% for blastocysts with grade B TE compared with grade A TE(P = 0.0099). Furthermore, after thawing, the odds of live birth in-creased by 39% (P = 0.0042) for each 10% increase in degree of re-expansion. Therefore, blastocoel expansion and TE grade were selectedas the most significant pre-freeze morphological predictors of livebirth and degree of re-expansion was selected as the best post-thawparameter for prediction of live birth (Ahlstrom et al., 2013). Con-founding factors are time of observation, female age and fertilization
ARTICLE IN PRESS
Please cite this article in press as: ESHRE Special Interest Group of Embryology and Alpha Scientists in Reproductive Medicine, The Vienna consensus: report of an expertmeeting on the development of ART laboratory performance indicators, Reproductive BioMedicine Online (2017), doi: 10.1016/j.rbmo.2017.06.015
8 R E P R O D U C T I V E B I O M E D I C I N E O N L I N E ■ ■ ( 2 0 1 7 ) ■ ■ – ■ ■

method. These observations do not include embryos that had beenbiopsied on Day 3 as they have a different hatching dynamic (Lopeset al., 2015).
Recommendations of the expert panel
General comments
1. Regarding frequency of data collection for indicators, it was theconsensus opinion that this should be done, ideally, on a monthlybasis. However, it was recognized that this is not always practi-cal, based on caseload, and therefore either a longer timeframeor a specific predetermined number of cases might be used instead.The minimum number will depend on the stability of the indica-tor and will need to be developed by the laboratory, although aninitial dataset of 30 cases could be used as a guideline. Nonethe-less laboratories should remain vigilant and respond promptly tounexpected fluctuations.
2. The discussions identified three different types of indicator:reference indicators (RIs), PIs, and KPIs:RIs were related to the oocytes coming into the laboratory, andso were proxy indicators of the response to ovarian stimulation.PIs were those for which data should be documented and stored,even if they are not routinely reported in a control chart.KPIs were those related to the ‘core business’ of the ARTlaboratory.
3. The values for indicators are presented as competency and bench-mark values, as was done for the cryopreservation consensus(Alpha Scientists In Reproductive Medicine, 2012). The gap betweenthe competency and the benchmark values is the ‘desirable range’.
4. It was the opinion of the Expert Panel that ovarian stimulation canhave an impact on the overall treatment cycle but is less likelyto have an impact on any single laboratory PI.
5. To apply the recommended values:The time of oocyte retrieval relative to the time of the ovulationtrigger is typically in the range of 34–38 h (most commonly 36h).Deviations from the locally established protocol should be docu-mented and taken into consideration.Timing of all observations should be made as recommended inthe Istanbul consensus (Alpha Scientists In Reproductive Medicineand ESHRE Special Interest Group of Embryology, 2011)
6. Individual clinics should decide whether it is more practical to sub-divide their results into specific patient groups for KPI and PI
determinations, based on their clinical practice. The Indicator valuespresented here were derived relative to cycles that met the cri-teria for a ‘reference population’. With the exception of Indicatorswith specific qualifiers identified, these criteria were:female patients <40 years old;own fresh oocytes;ejaculated spermatozoa (fresh or frozen);no PGD/PGS (PGT); andall insemination methods (i.e. routine IVF and ICSI).
7. It was the opinion of the panel that national and international reg-istries should be encouraged to gather data that can be used forthe derivation of KPI standard values.
8. Any selection procedure in addition to embryo morphology, e.g.PGD/PGS (PGT) or time-lapse imaging, is not expected to in-crease the cumulative pregnancy/LBR, but in the case of PGS itmay result in reduced time to pregnancy/live birth.
Indicators
The results of the discussions have been summarized for the ma-jority of the Indicators. The values for Indicators have also beenpresented in Tables 2–4, but these should be read in association withthe summary for each Indicator.
Proportion of oocytes recoveredThis RI (Table 2) is defined as the number of oocytes retrieved as afunction of the number of ovarian follicles seen at ultrasound as-sessment. It is useful as a measure of whether the quantity of oocytesis maximized. The values are not influenced by laboratory practice,and so cannot be held to be laboratory PI, but values outside the ex-pected range could prompt an investigation of any changes instimulation practice. Having this information is an important factor
Table 2 – Reference indicators.
Reference Indicator Calculation BenchmarkValue
Proportion ofoocytes recovered(stimulated cycles)
no. oocytes retrieved × 100no. follicles on dayof trigger
80–95%of folliclesmeasured
Proportion of MIIoocytes at ICSI
no. MII oocytes at ICSI × 100no. COC retrieved
75–90%
COC = cumulus-oocyte complexes; MII = metaphase II.
Table 3 – Performance indicators.
Performance Indicator Calculation Competency value Benchmark value
Sperm motility post-preparation (for IVF and IUI) progressively motile sperm × 100all sperm counted
90% ≥95%
IVF polyspermy rate no. fertilized oocytes with > 2PN × 100no. COC inseminated
<6%
1PN rate (IVF) no. 1PN oocytes × 100no. COC inseminated
<5%
1PN rate (ICSI) no. 1PN oocytes × 100no. MII oocytes injected
<3%
Good blastocyst development rate no. good quality blastocysts on Day 5 × 100no. 2PN/2PB oocytes on Day 1
≥30% ≥40%
COC = cumulus-oocyte complexes; ICSI = intracytoplasmic sperm injection; IUI = intrauterine insemination; PB = polar body; PN = pronucleus.
ARTICLE IN PRESS
Please cite this article in press as: ESHRE Special Interest Group of Embryology and Alpha Scientists in Reproductive Medicine, The Vienna consensus: report of an expertmeeting on the development of ART laboratory performance indicators, Reproductive BioMedicine Online (2017), doi: 10.1016/j.rbmo.2017.06.015
9R E P R O D U C T I V E B I O M E D I C I N E O N L I N E ■ ■ ( 2 0 1 7 ) ■ ■ – ■ ■
in troubleshooting. The expected range is 80–95% of follicles mea-sured in stimulated cycles.
Proportion of MII oocytes at ICSIThis RI (Table 2) is defined as the proportion of oocytes that havenuclear maturity at the time of injection, and so acts as a proxy in-dication of the effectiveness of ovarian stimulation. It is not a laboratoryPI, as values are not influenced by laboratory practice, but rather re-flects factors that influence the competence of oocytes coming intothe laboratory. The expected range is 75–90% at 40 ± 1 h post-trigger for all COC retrieved. Values outside this range could prompta review of any changes in ovarian stimulation, triggering, or follicleaspiration practice, as changes in the proportion of MII oocytes couldbe a factor in changes in fertilization rates and/or embryo develop-ment. Instability in this value could indicate changes in the stimulation,resulting in a higher proportion of either immature or post-matureoocytes.
Notes:• Since this value is expected to be stable, laboratories may choose
‘reporting by exception’ – only reporting on it when it falls outsidethe expected range.
• It should be noted that nuclear maturity does not necessarily in-dicate cytoplasmic maturity of the oocyte (Coticchio et al., 2012;Eppig, 1996; Sundstrom and Nilsson, 1988).
• Clinics should consider whether they should sub-divide their as-sessment of this Indicator based on patient demographics.
• Good communication between laboratory and clinic (cycle plan-ning and cycle review) were cited as being vital to excellentoutcomes in IVF programs (Van Voorhis et al., 2010).
Semen analysis characteristics
Sperm concentration, motility and vitality. Unless semen analy-ses are performed employing analytical methods as per the ESHRESIG Andrology (Björndahl et al., 2010) or WHO5 (World HealthOrganization, 2010) results for sperm concentration, motility and vi-tality will be subject to unacceptably high uncertainty of measurement(Bjorndahl et al., 2016; Sanchez-Pozo et al, 2013).
Sperm morphology. Sperm morphology assessment is subjectiveand so is dependent on consistent training. Since the Tygerberg StrictCriteria cut-off of 4% normal forms was derived in relation to IVFsuccess, it could be pertinent in differentiating between the need forIUI, IVF or ICSI (Menkveld, 2010; Mortimer and Menkveld, 2001).However, the current visual evaluation of 200 or 400 spermatozoa usedin the vast majority of laboratories to assess ‘% normal forms’ hassuch a large uncertainty of measurement that it cannot be consid-ered a reliable predictor for IVF success/failure for individual men(Björndahl et al., 2010; Kvist and Bjorndahl, 2002). Unless deter-mined using a more robust methodology, sperm normal forms shouldnot be used to direct ART treatment options.
Sperm motility post-preparationThis PI is defined as the proportion of progressively motile sperma-tozoa in the sperm preparation for insemination, and includes onlyfresh normozoospermic ejaculate specimens. Sperm motility afterwashing should be very high, and low values would indicate prob-lems with the preparation procedure. In this case, progressive motility
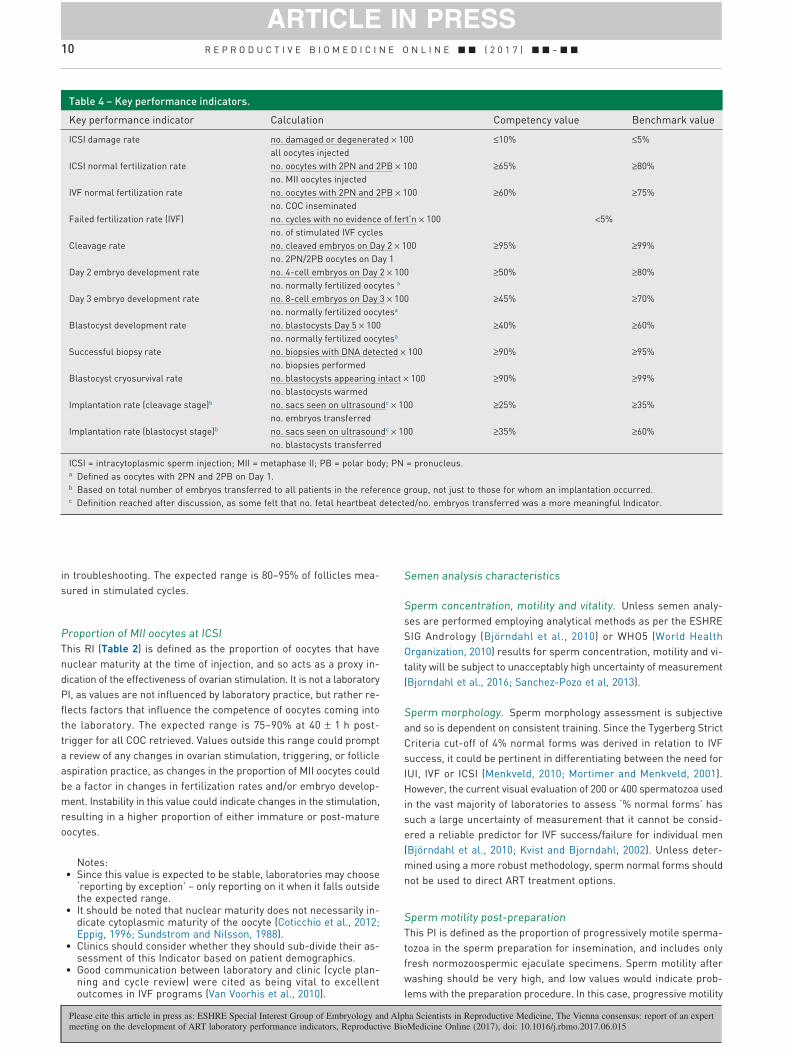
Table 4 – Key performance indicators.
Key performance indicator Calculation Competency value Benchmark value
ICSI damage rate no. damaged or degenerated × 100all oocytes injected
≤10% ≤5%
ICSI normal fertilization rate no. oocytes with 2PN and 2PB × 100no. MII oocytes injected
≥65% ≥80%
IVF normal fertilization rate no. oocytes with 2PN and 2PB × 100no. COC inseminated
≥60% ≥75%
Failed fertilization rate (IVF) no. cycles with no evidence of fert’n × 100no. of stimulated IVF cycles
<5%
Cleavage rate no. cleaved embryos on Day 2 × 100no. 2PN/2PB oocytes on Day 1
≥95% ≥99%
Day 2 embryo development rate no. 4-cell embryos on Day 2 × 100no. normally fertilized oocytes a
≥50% ≥80%
Day 3 embryo development rate no. 8-cell embryos on Day 3 × 100no. normally fertilized oocytesa
≥45% ≥70%
Blastocyst development rate no. blastocysts Day 5 × 100no. normally fertilized oocytesa
≥40% ≥60%
Successful biopsy rate no. biopsies with DNA detected × 100no. biopsies performed
≥90% ≥95%
Blastocyst cryosurvival rate no. blastocysts appearing intact × 100no. blastocysts warmed
≥90% ≥99%
Implantation rate (cleavage stage)b no. sacs seen on ultrasoundc × 100no. embryos transferred
≥25% ≥35%
Implantation rate (blastocyst stage)b no. sacs seen on ultrasoundc × 100no. blastocysts transferred
≥35% ≥60%
ICSI = intracytoplasmic sperm injection; MII = metaphase II; PB = polar body; PN = pronucleus.a Defined as oocytes with 2PN and 2PB on Day 1.b Based on total number of embryos transferred to all patients in the reference group, not just to those for whom an implantation occurred.c Definition reached after discussion, as some felt that no. fetal heartbeat detected/no. embryos transferred was a more meaningful Indicator.
ARTICLE IN PRESS
Please cite this article in press as: ESHRE Special Interest Group of Embryology and Alpha Scientists in Reproductive Medicine, The Vienna consensus: report of an expertmeeting on the development of ART laboratory performance indicators, Reproductive BioMedicine Online (2017), doi: 10.1016/j.rbmo.2017.06.015
10 R E P R O D U C T I V E B I O M E D I C I N E O N L I N E ■ ■ ( 2 0 1 7 ) ■ ■ – ■ ■
is defined as spermatozoa that are moving with net space gain of thehead, and so includes hyperactivated spermatozoa. Although therewas excellent agreement among the survey responses, potential weak-nesses of this PI include: possible poor reliability of % motility data;non-robust classification of cases based on uncertainty of semen analy-sis data; variability in sperm preparation method used; and abnormalresponse of the sperm to the preparation method used. The refer-ence values were competence 90% and benchmark ≥95%.
Notes:• There is no sperm recovery rate KPI recommended because this
is so heavily dependent on the processing method.• Recommendations for IUI or IVF treatment: It was the recom-
mendation of the Expert Panel that decisions regarding a man’ssuitability or need for an appropriate ART treatment modality (IUI,IVF or ICSI) should be based on number of spermatozoa and mo-tility assessments determined in a pre-treatment ‘trial preparation’.The competency threshold value was agreed as at least 90% pro-gressive motility post-wash with a benchmark of at least 95%progressive motility.
• Recommendations for ICSI Treatment: There was no cut-off valuerecommended for ICSI treatment, beyond the spermatozoa ideallybeing alive. In this case, the best evidence of vitality is motility,the second-best evidence, in the absence of motility, is a posi-tive hypoosmotic swelling (HOS) test (Björndahl et al., 2010),although other methodologies also exist.
ICSI damage rateThis KPI (Table 4) is defined as the proportion of oocytes that aredamaged during the ICSI injection, or have degenerated by the timeof fertilization assessment on Day 1. It is informative of gamete qualityand/or operator skill, and excludes damage from oocyte stripping,which should be very rare. The results can be skewed by the patientmix or the stimulation protocols used, so all cycles should be in-cluded to reduce the relative impact of these variables. The Alphasurvey gave similar median and mode values for each level. Thesevalues were agreed by the Expert Panel in relation to those recom-mended by ACE (Hughes and Association of Clinical Embryologists,2012). The reference values for ICSI damage rate are: competence≤10%; benchmark ≤5%.
ICSI normal fertilization rateThis KPI (Table 4) is defined as the number of fertilized oocytes onDay 1 (presence of 2PN and 2PB assessed at 17 ± 1 h post-injection)(Alpha Scientists In Reproductive Medicine and ESHRE Special InterestGroup of Embryology, 2011), as a function of all MII oocytes in-jected. This is a common, broad, effective indicator of good laboratorypractice, as it is informative of gamete quality and/or operator skill.This KPI includes ejaculated spermatozoa only (fresh or frozen) asresults may be lower with surgically-retrieved spermatozoa, and ex-cludes in-vitro matured oocytes, as well as thawed/warmed oocytes(this was dealt with in the cryopreservation consensus) (AlphaScientists In Reproductive Medicine, 2012). Reference values wereagreed by the Expert Panel: competence ≥ 65%; benchmark ≥80%.
Notes:• Total ICSI failed fertilization rate: It was the consensus of the Expert
Panel that complete failure to achieve normal fertilization in anICSI cycle did not need to be a PI, but should be reported by ex-ception, meaning that every case should be investigated. Thisincludes only stimulated cycles, as natural cycles are expectedto have only 1 oocyte.
• Poor ICSI fertilization rate: Although opinion regarding the ex-pected incidence of cycles with ICSI fertilization rates <25% wassought in the Alpha survey, the consensus of the Expert Panel was
to exclude this Indicator, as it did not add to the information alreadycollected.
• Giant oocytes should not be injected due to published evidenceof chromosomal abnormality (Balakier et al., 2002; Lehner et al.,2015; Rosenbusch et al., 2002).
• Regarding oocytes with smooth endoplasmic reticulum clusters(SER), more recent publications reporting outcomes suggest thatthe Istanbul consensus recommendation not to inject/inseminatethese oocytes may need to be revisited (Mateizel et al., 2013). Itwas the opinion of the Expert Panel that, in the meantime, the de-cision to inject SER-positive oocytes should be reviewed by theclinical team on a case-by-case basis. Follow-up of results, in-cluding pregnancy outcome and babies born after inseminationand transfer of the resulting embryos, should be performed.
Normal IVF fertilization rateThis KPI (Table 4) is defined as the number of fertilized oocyteson Day 1 (presence of 2PN and 2PB assessed at 17 ± 1 h post-insemination (Alpha Scientists In Reproductive Medicine and ESHRESpecial Interest Group of Embryology, 2011)), as a function of all COCinseminated. IVF normal fertilization rate is an important indicatorof laboratory performance, as it relies upon effective gamete han-dling and culture, and so is a measure of the whole in-vitro fertilizationsystem. The reference values are: competency ≥60%; benchmark≥75%. It should be noted that the benchmark value was determinedbased on a rounding of the product of the benchmark rates for MIIoocytes (90%) and fertilization rate of MII oocytes (80%).
IVF polyspermy rateThis PI (Table 3) is defined as the proportion of inseminated oocyteswith more than two pronuclei on Day 1 (17 ± 1 h post-insemination).It is needed to provide the information to interpret any observed varia-tions in the normal fertilization rate. It was the consensus value thatpolyspermy rate should be <6%. Observed values above this rate shouldbe reported and investigated.
1PN rate following IVF or ICSIThis PI (Table 3) is defined as the proportion of inseminated oocyteswith one pronucleus on Day 1 (17 ± 1 h post-insemination). It canprovide a marker of a problem in gamete handling or culture con-ditions and so should be low under normal conditions. It was theconsensus that the 1PN rate should be <5% for IVF cycles, and <3%for ICSI cycles. The difference between IVF and ICSI is related to thepre-selection of oocytes prior to ICSI injection. Observed values abovethis rate should be reported and investigated.
Failed fertilization rate (IVF cycles)This KPI (Table 4) is defined as the proportion of IVF cycles (ex-cludes ICSI cycles) with no evidence of fertilization (i.e. 0 oocytes with≥2PN) on Day 1 (17 ± 1 h post-insemination). It can provide a markerof a problem in gamete quality (sperm function, oocyte activation,gamete receptors), sperm processing, or in the number of sperma-tozoa used for insemination. It should be low, under normal conditions.Based on the Alpha survey, and on the values recommended by ACE(Hughes and Association of Clinical Embryologists, 2012), it was theconsensus that the IVF failed fertilization rate should be <5% forstimulated cycles. Observed values above this rate should be re-ported and investigated.
Zygote grade (IVF cycles)Zygote grade is an evaluation of the quality of the fertilized oocyte,conducted 17 ± 1 h post-insemination. It was the consensus that therewere not enough data to recommend Indicator values for this measure.
ARTICLE IN PRESS
Please cite this article in press as: ESHRE Special Interest Group of Embryology and Alpha Scientists in Reproductive Medicine, The Vienna consensus: report of an expertmeeting on the development of ART laboratory performance indicators, Reproductive BioMedicine Online (2017), doi: 10.1016/j.rbmo.2017.06.015
11R E P R O D U C T I V E B I O M E D I C I N E O N L I N E ■ ■ ( 2 0 1 7 ) ■ ■ – ■ ■

In the discussion related to micronuclei, it was agreed that while mi-cronuclei are abnormal, there is no evidence to confirm the identityof these dynamic manifestations.
Early cleavage rateEarly cleavage rate is the proportion of fertilized oocytes that haveundergone the first round of cleavage by 26 ± 1 h post-inseminationby ICSI or 28 ± 1 h post-insemination by IVF. There is evidence thatearly cleavage, together with other factors, can be used as an embryoselection method as it has been correlated with implantation rate(Balaban and Urman, 2003; Brezinova et al., 2009; Ciray et al., 2005;Lundqvist et al., 2001; Shoukir et al., 1997). However, as it is not rou-tinely calculated, it was the consensus that while this Indicator canbe useful for troubleshooting purposes, there were no recommen-dations for expected values.
Cleavage rateThis KPI (Table 4) is defined as the proportion of zygotes that cleaveto become embryos on Day 2 (44 ± 1 h post-insemination) (AlphaScientists In Reproductive Medicine and ESHRE Special Interest Groupof Embryology, 2011). It provides an indication of the ability of theculture system to support cleavage of fertilized oocytes (i.e. with oc-currence of cellular division), and of embryo viability, so a low cleavagerate could be a warning that the culture system has been impactedby an extrinsic factor. Furthermore, there is evidence that the pres-ence of at least 1 non-cleaved embryo is predictive of reduced embryoquality for the remaining cohort (Machtinger et al., 2015). The ref-erence values are: competency >95%; benchmark >99%.
Embryo development rateThis KPI (Table 4) is defined as the proportion of cleaved embryosat the 4-cell stage on Day 2 (44 ± 1 h post-insemination) or at the 8-cellstage on Day 3 (68 ± 1 h post-insemination) per normally fertilizedoocyte. This is an indicator of the ability of the culture system to supportcleavage according to the expected stages, as well as providing anindication of the viability and quality of embryos. This KPI just con-siders the developmental stage of the embryo, regardless of grade,because developmental stage has been reported to give the highestdegree of predictive power and has the advantage of being an objec-tive measure. It was acknowledged that not all clinics consider thespecific cell stages defined here, and that the culture system usedcan affect the kinetics of embryo development.
The reference values, based on the median and maximum resultsfrom the participants’ laboratories are: Day 2, competency ≥50% andbenchmark ≥80%; and Day 3, competency ≥45% and benchmark ≥70%.
Notes:• It was the decision of the Expert Panel not to consider Day 4 embryo
development rate.• This KPI is most relevant to clinics that transfer embryos on Day
2 or Day 3.
Embryo and blastocyst utilization ratesThese potential Indicators were defined as the number of embryos(or blastocysts) suitable for transfer or cryopreservation as a func-tion of the number of normally fertilized (2PN) oocytes observed onDay 1. Although it was agreed that these Indicators could be of valuefor internal laboratory comparison, the consensus opinion was thatbecause there are so many differences in laboratory and clinical prac-tice, it was not practical to suggest any values for these Indicators.
Blastocyst development rateThis KPI (Table 4) is defined as the proportion of blastocysts ob-served at 116 ± 2 h post-insemination as a function of the numberof normally fertilized oocytes. It estimates the ability of the culturesystem to support blastocyst formation from fertilized oocytes (i.e.with formation of ICM, trophectoderm cells and a blastocoele cavity),and provides an indication of embryo viability. It should be noted thatthis definition only considers blastocyst formation, with no consid-eration of blastocyst stage or blastocyst quality.
The reference values are: competency ≥ 40%; benchmark ≥ 60%(Day 5). A possible additional PI might be the development of anadditional 10–15% blastocysts by 140 ± 2 h post-insemination (i.e. byDay 6).
Good blastocyst development rateThis PI (Table 3) is defined as the number of good-quality blasto-cysts as a function of the number of normally fertilized oocytes.Blastocyst quality is as defined in the Istanbul consensus (AlphaScientists In Reproductive Medicine and ESHRE Special Interest Groupof Embryology, 2011). This Indicator estimates the ability of the culturesystem to support the formation of high-grade blastocysts from fer-tilized oocytes (i.e. with formation of ICM, trophectoderm cells anda blastocoele cavity), and an indication of embryo viability. The ref-erence values are: competency ≥ 30%; benchmark ≥ 40% (Day 5). Apossible additional PI might be the development of an additional 5–15%blastocysts by 140 ± 2 h post-insemination (i.e. by Day 6), dependingupon the culture system.
Proportion of good blastocystsThis PI is defined as the proportion of blastocysts with a grade of ‘good’or higher. There was no discussion of reference values for this In-dicator, as they can be inferred from the preceding two Indicators.
Day 5 embryo transfer rateThis PI is defined as the proportion of cycles with at least one utiliz-able blastocyst on Day 5 relative to the presence of at least one 2PNoocyte on Day 1, to allow for the inclusion of cycles in which the de-cision has been made to cryopreserve all embryos. This Indicatorreflects the efficiency of the whole culture system, but is only rel-evant for those clinics that have a blanket strategy of Day 5 transfers.It was the consensus opinion that as there are too many clinic-specific variables, including different embryo transfer policies indifferent centres, clinics should develop their own expectations forthis Indicator, depending on when the decision to go to Day 5 trans-fer is made (e.g. Day 0 versus Day 3).
Implantation rateFor this consensus, this KPI (Table 4) is defined as the number ofgestational sacs divided by the total number of embryos trans-ferred, irrespective of whether a pregnancy was established(Zegers-Hochschild et al, 2009). There was some dissent about theuse of sacs, rather than fetal heartbeat – which was felt to be a moremeaningful indicator of implantation rate – however sacs are usedby most national/international registries. Following discussion, it wasagreed to use sacs for the purpose of this consensus, but that theuse of fetal heartbeat as the numerator should be revisited in thefuture.
ARTICLE IN PRESS
Please cite this article in press as: ESHRE Special Interest Group of Embryology and Alpha Scientists in Reproductive Medicine, The Vienna consensus: report of an expertmeeting on the development of ART laboratory performance indicators, Reproductive BioMedicine Online (2017), doi: 10.1016/j.rbmo.2017.06.015
12 R E P R O D U C T I V E B I O M E D I C I N E O N L I N E ■ ■ ( 2 0 1 7 ) ■ ■ – ■ ■

Implantation rate provides an indication of the overall perfor-mance of the laboratory, so an overall low implantation rate is a serioussign of a systemic problem. Values would be expected to be lowerfor Day 2 and Day 3 transfers than for blastocyst transfers. In addi-tion, results will be influenced by clinical factors (e.g. uterinereceptivity) and the existence of different policies in different centresfor deciding the day of embryo transfer.
Reference values for implantation rates.
Planned transfers of cleavage-stage embryos (Day 2 or Day 3):competency ≥ 25%; benchmark ≥ 35%Blastocyst transfers: competency ≥ 35%; benchmark ≥ 60% (thepanel was divided between 55% and 60%, but agreed that 60% wasan aspirational goal)
Note: These values could be affected if there are a large numberof patients in the cohort who have had a large number of previous,unsuccessful cycles or significant clinical adverse factors. In addi-tion, individual clinics may wish to further stratify their results basedon patient age groups.
Live birth rateIt was the consensus that there are too many other variables to supportthe use of LBR as a laboratory indicator for either cleavage-stage orblastocyst-stage embryo transfers.
Successful biopsy rateThis KPI (Table 4) is defined as the proportion of biopsied and tubed/fixed samples where DNA is detected. It is a measure of the abilityof embryologists to transfer the biopsied samples to test tubes, asproven by positive DNA amplification.
Based on data from the surveys and the PGD Consortium, whichreported 91% diagnosis rate in 254,820 biopsies (De Rycke et al., 2015),the reference values were: competency ≥ 90%; benchmark ≥ 95%(Table 4).
No biopsyThis Indicator was defined as the proportion of treatment cycles thathad no embryos available for biopsy. It was the consensus that nothaving good-quality blastocysts for biopsy is not an indication of thequality of the PGD/PGS service. It is an expression of blastocyst de-velopment rates, and so no further values were developed for thisIndicator.
No embryos found on warming or degenerated embryos foundon warmingNowadays, the majority of PGT cycles are based on blastocystbiopsy and cryopreservation. It was agreed that no embryos found onwarming or degenerated embryos found on warming should be a KPI,as it provides a reflection of operator skill, and/or the device used.However, since not finding an embryo is a rare event, the panel wasunable to estimate a competency value, as the value would be verylow.
Due to greater experience with blastocyst vitrification, the rate ofdegeneration on warming should now be lower than that estimated
in the previous cryopreservation consensus (Alpha Scientists InReproductive Medicine, 2012). Similarly, it was the consensus that re-expansion does not differ between (warmed) biopsied and non-biopsied blastocysts.
Notwithstanding some device differences, the reference ratesfor blastocyst cryosurvival could now reasonably be expected to be:competency ≥ 90%; benchmark ≥ 99% (Table 4).
Implantation rate of biopsied embryosIt was the consensus that the implantation rate for blastocysts biopsiedfor PGS should exceed that expected for the age-matched patient popu-lation in the same clinic. From the literature, a meta-analysis reportedan improvement of 30% sustained implantation rate after the trans-fer of PGS-selected blastocysts relative to controls (Dahdouh et al.,2015; Scott et al., 2013).
Time-lapse imagingDespite there being an increasing number of IVF cycles incorporat-ing time-lapse imaging for embryo assessment and selection, the panelconsidered it premature to propose time-lapse related perfor-mance indicators for the IVF laboratory, due to the limited and varieddata associating precise timings of human embryo development withviability or good laboratory practice. It was accepted, however, thatdue to the detailed morphological and kinetic information collectedper embryo, time-lapse imaging may prove to be a future early warningtool for compromised culture conditions, providing a (intra-)laboratoryPI, specifically if a change in mean timings for embryos to reach de-velopmental milestones may be detected more readily and rapidly thanwith standard assessment methods.
A time-lapse assay of mouse embryo development linked spe-cific morphokinetic changes to toxicity of mineral oil. This demonstratesthe sensitivity of mouse embryo cleavage timings to the quality of theculture environment and the potential value of time-lapse in detect-ing such changes (Wolff et al., 2013). To date, no studies of this typehave been performed on human embryos.
The current recommendation, therefore, was that clinics may wishto establish time-lapse KPI and benchmarks based on their own ex-perience. It was suggested that the frequency of anomalous cleavageevents, such as trichotomous mitosis (direct cleavage to three cells),which is known to be relatively common (6–8%) and associated withreduced implantation potential, could be monitored for future use asa KPI (Athayde Wirka et al., 2014; Rubio et al., 2012). In addition, itwas considered that clinics using validated time-lapse algorithms forembryo selection may develop benchmarks associated with the pro-portion of embryos which ranked highest using morphokineticmodelling. Large-scale population studies are, however, required inorder to identify which, if any, morphokinetic markers can be devel-oped into universal and useful laboratory KPIs. It is also importantto point out that morphokinetic embryo performance is believed tobe highly associated with clinical and laboratory practices, and maytherefore be difficult to compare between laboratories.
Acknowledgement
The consensus meeting and writing of the paper were supported by fundsfrom ESHRE and Alpha. Alpha gratefully acknowledges the following
ARTICLE IN PRESS
Please cite this article in press as: ESHRE Special Interest Group of Embryology and Alpha Scientists in Reproductive Medicine, The Vienna consensus: report of an expertmeeting on the development of ART laboratory performance indicators, Reproductive BioMedicine Online (2017), doi: 10.1016/j.rbmo.2017.06.015
13R E P R O D U C T I V E B I O M E D I C I N E O N L I N E ■ ■ ( 2 0 1 7 ) ■ ■ – ■ ■
organizations for their financial support, through the provision of un-restricted educational grants: Global Fertility Alliance, Merck KGaA,Origio, and Vitrolife. We also thank the respondents to the question-naires for their valuable contribution to this consensus. This manuscriptwas prepared by Nathalie Vermeulen and Sharon Mortimer.
A R T I C L E I N F O
Article history:
Received 14 June 2017
Accepted 21 June 2017
Keywords:
Embryo
IVF
KPI
Oocyte
Performance indicator
Sperm
R E F E R E N C E S
Ahlstrom, A., Westin, C., Reismer, E., Wikland, M., Hardarson, T., 2011.Trophectoderm morphology: an important parameter for predictinglive birth after single blastocyst transfer. Hum. Reprod. 26, 3289–3296.
Ahlstrom, A., Westin, C., Wikland, M., Hardarson, T., 2013. Prediction oflive birth in frozen-thawed single blastocyst transfer cycles by pre-freeze and post-thaw morphology. Hum. Reprod. 28, 1199–1209.
Alpha Scientists In Reproductive Medicine, 2012. The Alpha consensusmeeting on cryopreservation key performance indicators andbenchmarks: proceedings of an expert meeting. Reprod. Biomed.Online 25, 146–167.
Alpha Scientists In Reproductive Medicine, ESHRE Special InterestGroup of Embryology, 2011. The Istanbul consensus workshop onembryo assessment: proceedings of an expert meeting. Hum.Reprod. 26, 1270–1283. and Reprod Biomed Online 22:1632–1646(simultaneous publication).
Arce, J.C., Andersen, A.N., Fernandez-Sanchez, M., Visnova, H., Bosch,E., Garcia-Velasco, J.A., Barri, P., de Sutter, P., Klein, B.M., Fauser,B.C., 2014. Ovarian response to recombinant human follicle-stimulating hormone: a randomized, antimullerian hormone-stratified, dose-response trial in women undergoing in vitrofertilization/intracytoplasmic sperm injection. Fertil. Steril. 102,1633–1640, e1635.
Athayde Wirka, K., Chen, A.A., Conaghan, J., Ivani, K., Gvakharia, M.,Behr, B., Suraj, V., Tan, L., Shen, S., 2014. Atypical embryophenotypes identified by time-lapse microscopy: high prevalenceand association with embryo development. Fertil. Steril. 101, 1637–1648, e1631-1635.
Baart, E.B., Martini, E., Eijkemans, M.J., Van Opstal, D., Beckers, N.G.,Verhoeff, A., Macklon, N.S., Fauser, B.C., 2007. Milder ovarianstimulation for in-vitro fertilization reduces aneuploidy in the humanpreimplantation embryo: a randomized controlled trial. Hum.Reprod. 22, 980–988.
Balaban, B., Urman, B., 2003. Embryo culture as a diagnostic tool.Reprod. Biomed. Online 7, 671–682.
Balaban, B., Urman, B., 2006. Effect of oocyte morphology on embryodevelopment and implantation. Reprod. Biomed. Online 12, 608–615.
Balakier, H., Bouman, D., Sojecki, A., Librach, C., Squire, J.A., 2002.Morphological and cytogenetic analysis of human giant oocytes andgiant embryos. Hum. Reprod. 17, 2394–2401.
Bjorndahl, L., 2011. What is normal semen quality? On the use andabuse of reference limits for the interpretation of semen analysisresults. Hum. Fertil. (Camb.) 14, 179–186.
Bjorndahl, L., Barratt, C.L., Mortimer, D., Jouannet, P., 2016. ‘How tocount sperm properly’: checklist for acceptability of studies basedon human semen analysis. Hum. Reprod. 31, 227–232.
Björndahl, L., Mortimer, D., Barratt, C.L., Castilla, J.A., Menkveld, R.,Kvist, U., Alvarez, J.G., Haugen, T.B., 2010. A Practical Guide toBasic Laboratory Andrology. Cambridge University Press,Cambridge, UK.
Braga, D.P., Setti, A.S., Figueira Rde, C., Machado, R.B., Iaconelli, A., Jr.,Borges, E., Jr., 2013. Influence of oocyte dysmorphisms onblastocyst formation and quality. Fertil. Steril. 100, 748–754.
Brezinova, J., Oborna, I., Svobodova, M., Fingerova, H., 2009. Evaluationof day one embryo quality and IVF outcome–a comparison of twoscoring systems. Reprod. Biol. Endocrinol. 7, 9.
Ciray, H.N., Karagenc, L., Ulug, U., Bener, F., Bahceci, M., 2005. Use ofboth early cleavage and day 2 mononucleation to predict embryoswith high implantation potential in intracytoplasmic sperm injectioncycles. Fertil. Steril. 84, 1411–1416.
Cobo, A., de los Santos, M.J., Castello, D., Gamiz, P., Campos, P.,Remohi, J., 2012. Outcomes of vitrified early cleavage-stage andblastocyst-stage embryos in a cryopreservation program: evaluationof 3,150 warming cycles. Fertil. Steril. 98, 1138–1146, e1131.
Coetzee, K., Kruge, T.F., Lombard, C.J., 1998. Predictive value of normalsperm morphology: a structured literature review. Hum. Reprod.Update 4, 73–82.
Cooper, T.G., Noonan, E., von Eckardstein, S., Auger, J., Baker, H.W.,Behre, H.M., Haugen, T.B., Kruger, T., Wang, C., Mbizvo, M.T.,Vogelsong, K.M., 2010. World Health Organization reference valuesfor human semen characteristics. Hum. Reprod. Update 16, 231–245.
Coticchio, G., Dal-Canto, M., Guglielmo, M.C., Mignini-Renzini, M.,Fadini, R., 2012. Human oocyte maturation in vitro. Int. J. Dev. Biol.56, 909–918.
de los Santos, M.J., Arroyo, G., Busquet, A., Calderon, G., Cuadros, J.,Hurtado de Mendoza, M.V., Moragas, M., Herrer, R., Ortiz, A., Pons,C., Ten, J., Vilches, M.A., Figueroa, M.J., Embryology, A.I.G.I., 2014.A multicenter prospective study to assess the effect of earlycleavage on embryo quality, implantation, and live-birth rate. Fertil.Steril. 101, 981–987.
Dahdouh, E.M., Balayla, J., Garcia-Velasco, J.A., 2015. Comprehensivechromosome screening improves embryo selection: a meta-analysis. Fertil. Steril. 104, 1503–1512.
Davison, S.L., Bell, R., Donath, S., Montalto, J.G., Davis, S.R., 2005.Androgen levels in adult females: changes with age, menopause,and oophorectomy. J. Clin. Endocrinol. Metab. 90, 3847–3853.
De Rycke, M., Belva, F., Goossens, V., Moutou, C., SenGupta, S.B.,Traeger-Synodinos, J., Coonen, E., 2015. ESHRE PGD Consortiumdata collection XIII: cycles from January to December 2010 withpregnancy follow-up to October 2011. Hum. Reprod. 30, 1763–1789.
Delvigne, A., 2009. Symposium: update on prediction and managementof OHSS. Epidemiology of OHSS. Reprod. Biomed. Online 19, 8–13.
Denomme, M.M., Mann, M.R., 2012. Genomic imprints as a model forthe analysis of epigenetic stability during assisted reproductivetechnologies. Reproduction 144, 393–409.
Ebner, T., Moser, M., Sommergruber, M., Tews, G., 2003. Selectionbased on morphological assessment of oocytes and embryos atdifferent stages of preimplantation development: a review. Hum.Reprod. Update 9, 251–262.
Ebner, T., Montag, M., Oocyte Activation Study Group, Montag, M., Vander Ven, K., Van der Ven, H., Ebner, T., Shebl, O., Oppelt, P.,Hirchenhain, J., Krussel, J., Maxrath, B., Gnoth, C., Friol, K., Tigges,J., Wunsch, E., Luckhaus, J., Beerkotte, A., Weiss, D., Grunwald, K.,Struller, D., Etien, C., 2015. Live birth after artificial oocyte activationusing a ready-to-use ionophore: a prospective multicentre study.Reprod. Biomed. Online 30, 359–365.
ARTICLE IN PRESS
Please cite this article in press as: ESHRE Special Interest Group of Embryology and Alpha Scientists in Reproductive Medicine, The Vienna consensus: report of an expertmeeting on the development of ART laboratory performance indicators, Reproductive BioMedicine Online (2017), doi: 10.1016/j.rbmo.2017.06.015
14 R E P R O D U C T I V E B I O M E D I C I N E O N L I N E ■ ■ ( 2 0 1 7 ) ■ ■ – ■ ■

Ectors, F.J., Vanderzwalmen, P., Van Hoeck, J., Nijs, M., Verhaegen, G.,Delvigne, A., Schoysman, R., Leroy, F., 1997. Relationship of humanfollicular diameter with oocyte fertilization and development afterin-vitro fertilization or intracytoplasmic sperm injection. Hum.Reprod. 12, 2002–2005.
Eppig, J.J., 1996. Coordination of nuclear and cytoplasmic oocytematuration in eutherian mammals. Reprod. Fertil. Dev. 8, 485–489.
ESHRE Guideline Group on Good Practice in IVF Labs, De los Santos,M.J., Apter, S., Coticchio, G., Debrock, S., Lundin, K., Plancha, C.E.,Prados, F., Rienzi, L., Verheyen, G., Woodward, B., Vermeulen, N.,2016. Revised guidelines for good practice in IVF laboratories (2015).Hum. Reprod. 31, 685–686.
Fancsovits, P., Tothne, Z.G., Murber, A., Rigo, J., Jr., Urbancsek, J.,2012. Importance of cytoplasmic granularity of human oocytes in invitro fertilization treatments. Acta Biol. Hung. 63, 189–201.
Fauque, P., Jouannet, P., Lesaffre, C., Ripoche, M.A., Dandolo, L.,Vaiman, D., Jammes, H., 2007. Assisted Reproductive Technologyaffects developmental kinetics, H19 Imprinting Control Regionmethylation and H19 gene expression in individual mouse embryos.BMC Dev. Biol. 7, 116.
Fauque, P., Audureau, E., Leandri, R., Delaroche, L., Assouline, S.,Epelboin, S., Jouannet, P., Patrat, C., 2013. Is the nuclear status ofan embryo an independent factor to predict its ability to develop toterm? Fertil. Steril. 99, 1299–1304, e1293.
Ferraretti, A.P., Gianaroli, L., Magli, M.C., D’Angelo, A., Farfalli, V.,Montanaro, N., 2004. Exogenous luteinizing hormone in controlledovarian hyperstimulation for assisted reproduction techniques.Fertil. Steril. 82, 1521–1526.
Flaherty, S.P., Payne, D., Matthews, C.D., 1998. Fertilization failures andabnormal fertilization after intracytoplasmic sperm injection. Hum.Reprod. 13 (Suppl. 1), 155–164.
Garrido, N., Bellver, J., Remohi, J., Simon, C., Pellicer, A., 2011.Cumulative live-birth rates per total number of embryos needed toreach newborn in consecutive in vitro fertilization (IVF) cycles: a newapproach to measuring the likelihood of IVF success. Fertil. Steril.96, 40–46.
Glujovsky, D., Farquhar, C., Quinteiro Retamar, A.M., Alvarez Sedo, C.R.,Blake, D., 2016. Cleavage stage versus blastocyst stage embryotransfer in assisted reproductive technology. Cochrane DatabaseSyst. Rev. (6), CD002118.
Haaf, T., Hahn, A., Lambrecht, A., Grossmann, B., Schwaab, E.,Khanaga, O., Hahn, T., Tresch, A., Schorsch, M., 2009. A high oocyteyield for intracytoplasmic sperm injection treatment is associatedwith an increased chromosome error rate. Fertil. Steril. 91, 733–738.
Heindryckx, B., Van der Elst, J., De Sutter, P., Dhont, M., 2005.Treatment option for sperm- or oocyte-related fertilization failure:assisted oocyte activation following diagnostic heterologous ICSI.Hum. Reprod. 20, 2237–2241.
Hughes, C., Association of Clinical Embryologists, 2012. Association ofclinical embryologists–guidelines on good practice in clinicalembryology laboratories 2012. Hum. Fertil. (Camb.) 15, 174–189.
Hugues, J.N., Theron-Gerard, L., Coussieu, C., Pasquier, M., Dewailly,D., Cedrin-Durnerin, I., 2010. Assessment of theca cell functionprior to controlled ovarian stimulation: the predictive valueof serum basal/stimulated steroid levels. Hum. Reprod. 25, 228–234.
Humaidan, P., Bungum, M., Bungum, L., Yding Andersen, C., 2004.Effects of recombinant LH supplementation in women undergoingassisted reproduction with GnRH agonist down-regulation andstimulation with recombinant FSH: an opening study. Reprod.Biomed. Online 8, 635–643.
Jeppesen, J.V., Kristensen, S.G., Nielsen, M.E., Humaidan, P., Dal Canto,M., Fadini, R., Schmidt, K.T., Ernst, E., Yding Andersen, C., 2012. LH-receptor gene expression in human granulosa and cumulus cellsfrom antral and preovulatory follicles. J. Clin. Endocrinol. Metab. 97,E1524–E1531.
Joergensen, M.W., Labouriau, R., Hindkjaer, J., Stougaard, M., Kolevraa,S., Bolund, L., Agerholm, I.E., Sunde, L., 2015. The parental origincorrelates with the karyotype of human embryos developing fromtripronuclear zygotes. Clin Exp Reprod Med 42, 14–21.
Kai, Y., Iwata, K., Iba, Y., Mio, Y., 2015. Diagnosis of abnormal humanfertilization status based on pronuclear origin and/or centrosomenumber. J. Assist. Reprod. Genet. 32, 1589–1595.
Kashir, J., Heindryckx, B., Jones, C., De Sutter, P., Parrington, J.,Coward, K., 2010. Oocyte activation, phospholipase C zeta andhuman infertility. Hum. Reprod. Update 16, 690–703.
Kohn, L.T., Corrigan, J.M., Donaldson, M.S., 2000. To Err is Human:Building a Safer Health System. National Academies Press.
Kruger, T.F., Acosta, A.A., Simmons, K.F., Swanson, R.J., Matta, J.F.,Oehninger, S., 1988. Predictive value of abnormal spermmorphology in in vitro fertilization. Fertil. Steril. 49, 112–117.
Kvist, U., Bjorndahl, L., 2002. Manual on Basic Semen Analysis. OxfordUniversity Press.
Lehner, A., Kaszas, Z., Murber, A., Rigo, J., Jr., Urbancsek, J.,Fancsovits, P., 2015. Giant oocytes in human in vitro fertilizationtreatments. Arch. Gynecol. Obstet. 292, 697–703.
Lemmen, J.G., Rodriguez, N.M., Andreasen, L.D., Loft, A., Ziebe, S.,2016. The total pregnancy potential per oocyte aspiration afterassisted reproduction-in how many cycles are biologicallycompetent oocytes available? J. Assist. Reprod. Genet. 33, 849–854.
Levron, J., Munne, S., Willadsen, S., Rosenwaks, Z., Cohen, J., 1995.Male and female genomes associated in a single pronucleus inhuman zygotes. Biol. Reprod. 52, 653–657.
Liu, J., Nagy, Z., Joris, H., Tournaye, H., Smitz, J., Camus, M., Devroey,P., Van Steirteghem, A., 1995. Analysis of 76 total fertilization failurecycles out of 2732 intracytoplasmic sperm injection cycles. Hum.Reprod. 10, 2630–2636.
Lopes, A.S., Frederickx, V., Van Kerkhoven, G., Campo, R., Puttemans,P., Gordts, S., 2015. Survival, re-expansion and cell survival ofhuman blastocysts following vitrification and warming using twovitrification systems. J. Assist. Reprod. Genet. 32, 83–90.
Lundqvist, M., Johansson, U., Lundkvist, O., Milton, K., Westin, C.,Simberg, N., 2001. Does pronuclear morphology and/or earlycleavage rate predict embryo implantation potential? Reprod.Biomed. Online 2, 12–16.
Machtinger, R., Bormann, C.L., Ginsburg, E.S., Racowsky, C., 2015. Isthe presence of a non-cleaved embryo on day 3 associated withpoorer quality of the remaining embryos in the cohort? J. Assist.Reprod. Genet. 32, 677–683.
Mahutte, N.G., Arici, A., 2003. Failed fertilization: is it predictable? Curr.Opin. Obstet. Gynecol. 15, 211–218.
Mateizel, I., Van Landuyt, L., Tournaye, H., Verheyen, G., 2013. Deliveriesof normal healthy babies from embryos originating from oocytesshowing the presence of smooth endoplasmic reticulum aggregates.Hum. Reprod. 28, 2111–2117.
Mateo, S., Parriego, M., Boada, M., Vidal, F., Coroleu, B., Veiga, A., 2013.In vitro development and chromosome constitution of embryosderived from monopronucleated zygotes after intracytoplasmicsperm injection. Fertil. Steril. 99, 897–902, e891.
Mayer, J.F., Jones, E.L., Dowling-Lacey, D., Nehchiri, F., Muasher, S.J.,Gibbons, W.E., Oehninger, S.C., 2003. Total quality improvement inthe IVF laboratory: choosing indicators of quality. Reprod. Biomed.Online 7, 695–699.
Menkveld, R., 2010. Clinical significance of the low normal spermmorphology value as proposed in the fifth edition of the WHOLaboratory Manual for the Examination and Processing of HumanSemen. Asian J. Androl. 12, 47–58.
Menkveld, R., Holleboom, C.A., Rhemrev, J.P., 2011. Measurement andsignificance of sperm morphology. Asian J. Androl. 13, 59–68.
Meseguer, M., Herrero, J., Tejera, A., Hilligsoe, K.M., Ramsing, N.B.,Remohi, J., 2011. The use of morphokinetics as a predictor ofembryo implantation. Hum. Reprod. 26, 2658–2671.
Montag, M., van der Ven, H., German Pronuclear Morphology StudyGroup, 2001. Evaluation of pronuclear morphology as the only
ARTICLE IN PRESS
Please cite this article in press as: ESHRE Special Interest Group of Embryology and Alpha Scientists in Reproductive Medicine, The Vienna consensus: report of an expertmeeting on the development of ART laboratory performance indicators, Reproductive BioMedicine Online (2017), doi: 10.1016/j.rbmo.2017.06.015
15R E P R O D U C T I V E B I O M E D I C I N E O N L I N E ■ ■ ( 2 0 1 7 ) ■ ■ – ■ ■

selection criterion for further embryo culture and transfer: resultsof a prospective multicentre study. Hum. Reprod. 16, 2384–2389.
Mortimer, D., Menkveld, R., 2001. Sperm morphology assessment–historical perspectives and current opinions. J. Androl. 22, 192–205.
Mortimer, S.T., Mortimer, D., 2015. Quality and Risk Management in theIVF Laboratory. Cambridge University Press.
Nagy, Z.P., Liu, J., Joris, H., Verheyen, G., Tournaye, H., Camus, M.,Derde, M.C., Devroey, P., Van Steirteghem, A.C., 1995. The result ofintracytoplasmic sperm injection is not related to any of the threebasic sperm parameters. Hum. Reprod. 10, 1123–1129.
Nagy, Z.P., Janssenswillen, C., Janssens, R., De Vos, A., Staessen, C.,Van de Velde, H., Van Steirteghem, A.C., 1998. Timing of oocyteactivation, pronucleus formation and cleavage in humans afterintracytoplasmic sperm injection (ICSI) with testicular spermatozoaand after ICSI or in-vitro fertilization on sibling oocytes withejaculated spermatozoa. Hum. Reprod. 13, 1606–1612.
Nagy, Z.P., Jones-Colon, S., Roos, P., Botros, L., Greco, E., Dasig, J.,Behr, B., 2009. Metabolomic assessment of oocyte viability. Reprod.Biomed. Online 18, 219–225.
Nel-Themaat, L., Nagy, Z.P., 2011. A review of the promises and pitfallsof oocyte and embryo metabolomics. Placenta 32 (Suppl. 3), S257–S263.
Nogueira, D., Friedler, S., Schachter, M., Raziel, A., Ron-El, R., Smitz, J.,2006. Oocyte maturity and preimplantation development in relationto follicle diameter in gonadotropin-releasing hormone agonist orantagonist treatments. Fertil. Steril. 85, 578–583.
Paternot, G., Wetzels, A.M., Thonon, F., Vansteenbrugge, A., Willemen,D., Devroe, J., Debrock, S., D’Hooghe, T.M., Spiessens, C., 2011.Intra- and interobserver analysis in the morphological assessmentof early stage embryos during an IVF procedure: a multicentrestudy. Reprod. Biol. Endocrinol. 9, 127.
Patrizio, P., Sakkas, D., 2009. From oocyte to baby: a clinical evaluationof the biological efficiency of in vitro fertilization. Fertil. Steril. 91,1061–1066.
Patrizio, P., Fragouli, E., Bianchi, V., Borini, A., Wells, D., 2007.Molecular methods for selection of the ideal oocyte. Reprod.Biomed. Online 15, 346–353.
Piltonen, T., Koivunen, R., Ruokonen, A., Tapanainen, J.S., 2003. Ovarianage-related responsiveness to human chorionic gonadotropin.J. Clin. Endocrinol. Metab. 88, 3327–3332.
Rhenman, A., Berglund, L., Brodin, T., Olovsson, M., Milton, K.,Hadziosmanovic, N., Holte, J., 2015. Which set of embryo variables ismost predictive for live birth? A prospective study in 6252 singleembryo transfers to construct an embryo score for the ranking andselection of embryos. Hum. Reprod. 30, 28–36.
Rienzi, L., Vajta, G., Ubaldi, F., 2011. Predictive value of oocytemorphology in human IVF: a systematic review of the literature.Hum. Reprod. Update 17, 34–45.
Rizk, B., 2009. Symposium: update on prediction and management ofOHSS. Genetics of ovarian hyperstimulation syndrome. Reprod.Biomed. Online 19, 14–27.
Rosenbusch, B., Schneider, M., Glaser, B., Brucker, C., 2002.Cytogenetic analysis of giant oocytes and zygotes to assess theirrelevance for the development of digynic triploidy. Hum. Reprod. 17,2388–2393.
Rubino, P., Vigano, P., Luddi, A., Piomboni, P., 2016. The ICSI procedurefrom past to future: a systematic review of the more controversialaspects. Hum. Reprod. Update 22, 194–227.
Rubio, I., Kuhlmann, R., Agerholm, I., Kirk, J., Herrero, J., Escriba, M.J.,Bellver, J., Meseguer, M., 2012. Limited implantation success ofdirect-cleaved human zygotes: a time-lapse study. Fertil. Steril. 98,1458–1463.
Russell, D.L., Salustri, A., 2006. Extracellular matrix of the cumulus-oocyte complex. Semin. Reprod. Med. 24, 217–227.
Saenz-de-Juano, M.D., Billooye, K., Smitz, J., Anckaert, E., 2016. Theloss of imprinted DNA methylation in mouse blastocysts is inflictedto a similar extent by in vitro follicle culture and ovulation induction.Mol. Hum. Reprod. 22, 427–441.
Salinas, M., Lopez-Garrigos, M., Gutierrez, M., Lugo, J., Sirvent, J.V.,Uris, J., 2010. Achieving continuous improvement in laboratoryorganization through performance measurements: a seven-yearexperience. Clin. Chem. Lab. Med. 48, 57–61.
Sanchez-Pozo, M.C., Mendiola, J., Serrano, M., Mozas, J., Bjorndahl, L.,Menkveld, R., Lewis, S.E., Mortimer, D., Jorgensen, N., Barratt, C.L.,Fernandez, M.F., Castilla, J.A., Special Interest Group in Andrologyof the European Society of Human Reproduction and Embriology,2013. Proposal of guidelines for the appraisal of SEMen QUAlitystudies (SEMQUA). Hum. Reprod. 28, 10–21.
Scott, R.T., Hofmann, G.E., Muasher, S.J., Acosta, A.A., Kreiner, D.K.,Rosenwaks, Z., 1989. Correlation of follicular diameter with oocyterecovery and maturity at the time of transvaginal follicularaspiration. J. In Vitro Fert. Embryo Transf. 6, 73–75.
Scott, R.T., Jr., Upham, K.M., Forman, E.J., Hong, K.H., Scott, K.L.,Taylor, D., Tao, X., Treff, N.R., 2013. Blastocyst biopsy withcomprehensive chromosome screening and fresh embryo transfersignificantly increases in vitro fertilization implantation and deliveryrates: a randomized controlled trial. Fertil. Steril. 100, 697–703.
Shahangian, S., Snyder, S.R., 2009. Laboratory medicine qualityindicators: a review of the literature. Am. J. Clin. Pathol. 131, 418–431.
Shoukir, Y., Campana, A., Farley, T., Sakkas, D., 1997. Early cleavage ofin-vitro fertilized human embryos to the 2-cell stage: a novelindicator of embryo quality and viability. Hum. Reprod. 12, 1531–1536.
Soares, S.R., Rubio, C., Rodrigo, L., Simón, C., Remohí, J., Pellicer, A.,2003. High frequency of chromosomal abnormalities in embryosobtained from oocyte donation cycles. Fertil. Steril. 80, 656–657.
Spencer, J.B., Klein, M., Kumar, A., Azziz, R., 2007. The age-associateddecline of androgens in reproductive age and menopausal Black andWhite women. J. Clin. Endocrinol. Metab. 92, 4730–4733.
Staessen, C., Van Steirteghem, A.C., 1997. The chromosomalconstitution of embryos developing from abnormally fertilizedoocytes after intracytoplasmic sperm injection and conventional in-vitro fertilization. Hum. Reprod. 12, 321–327.
Sugimura, S., Ritter, L.J., Rose, R.D., Thompson, J.G., Smitz, J.,Mottershead, D.G., Gilchrist, R.B., 2015. Promotion of EGF receptorsignaling improves the quality of low developmental competenceoocytes. Dev. Biol. 403, 139–149.
Sultan, K.M., Munne, S., Palermo, G.D., Alikani, M., Cohen, J., 1995.Chromosomal status of uni-pronuclear human zygotes followingin-vitro fertilization and intracytoplasmic sperm injection. Hum.Reprod. 10, 132–136.
Sundstrom, P., Nilsson, B.O., 1988. Meiotic and cytoplasmic maturationof oocytes collected in stimulated cycles is asynchronous. Hum.Reprod. 3, 613–619.
Sundstrom, P., Saldeen, P., 2008. Early embryo cleavage and day 2mononucleation after intracytoplasmatic sperm injection forpredicting embryo implantation potential in single embryo transfercycles. Fertil. Steril. 89, 475–477.
Thurin, A., Hardarson, T., Hausken, J., Jablonowska, B., Lundin, K.,Pinborg, A., Bergh, C., 2005. Predictors of ongoing implantation inIVF in a good prognosis group of patients. Hum. Reprod. 20, 1876–1880.
Van den Abbeel, E., Balaban, B., Ziebe, S., Lundin, K., Cuesta, M.J.,Klein, B.M., Helmgaard, L., Arce, J.C., 2013. Association betweenblastocyst morphology and outcome of single-blastocyst transfer.Reprod. Biomed. Online 27, 353–361.
Van Royen, E., Mangelschots, K., De Neubourg, D., Valkenburg, M., Vande Meerssche, M., Ryckaert, G., Eestermans, W., Gerris, J., 1999.Characterization of a top quality embryo, a step towards single-embryo transfer. Hum. Reprod. 14, 2345–2349.
Van Voorhis, B.J., Thomas, M., Surrey, E.S., Sparks, A., 2010. What doconsistently high-performing in vitro fertilization programs in theU.S. do? Fertil. Steril. 94, 1346–1349.
Wang, S.S., Sun, H.X., 2014. Blastocyst transfer ameliorates live birthrate compared with cleavage-stage embryos transfer in fresh in
ARTICLE IN PRESS
Please cite this article in press as: ESHRE Special Interest Group of Embryology and Alpha Scientists in Reproductive Medicine, The Vienna consensus: report of an expertmeeting on the development of ART laboratory performance indicators, Reproductive BioMedicine Online (2017), doi: 10.1016/j.rbmo.2017.06.015
16 R E P R O D U C T I V E B I O M E D I C I N E O N L I N E ■ ■ ( 2 0 1 7 ) ■ ■ – ■ ■

vitro fertilization or intracytoplasmic sperm injection cycles: reviewsand meta-analysis. Yonsei Med. J. 55, 815–825.
Wang, W., Zhang, X.H., Wang, W.H., Liu, Y.L., Zhao, L.H., Xue, S.L., Yang,K.H., 2011. The time interval between hCG priming and oocyteretrieval in ART program: a meta-analysis. J. Assist. Reprod. Genet.28, 901–910.
Wang, W.H., Day, B.N., Wu, G.M., 2003. How does polyspermy happen inmammalian oocytes? Microsc. Res. Tech. 61, 335–341.
Wolff, H.S., Fredrickson, J.R., Walker, D.L., Morbeck, D.E., 2013.Advances in quality control: mouse embryo morphokinetics aresensitive markers of in vitro stress. Hum. Reprod. 28, 1776–1782.
World Health Organization, 2010. WHO Laboratory Manual for theExamination and Processing of Human Semen. p. 287.
Yanagida, K., 2004. Complete fertilization failure in ICSI. Hum. Cell 17,187–193.
Yang, W.J., Hwang, Y.C., Lin, C.S., Hwu, Y.M., Lee, R.K., Hsiao, S.Y., 2015.Embryonic early-cleavage rate is decreased with aging in GnRHagonist but not inantagonist protocols. J. Assist. Reprod. Genet. 32,789–795.
Zamah, A.M., Hsieh, M., Chen, J., Vigne, J.L., Rosen, M.P., Cedars, M.I.,Conti, M., 2010. Human oocyte maturation is dependent on LH-stimulated accumulation of the epidermal growth factor-like growthfactor, amphiregulin. Hum. Reprod. 25, 2569–2578.
Zegers-Hochschild, F., Adamson, G.D., de Mouzon, J., Ishihara, O.,Mansour, R., Nygren, K., Sullivan, E., van der Poel, S., InternationalCommittee for Monitoring Assisted Reproductive Technology, WorldHealth Organization, 2009. The International Committee forMonitoring Assisted Reproductive Technology (ICMART) and theWorld Health Organization (WHO) Revised Glossary on ARTTerminology, 2009. Hum. Reprod. 24, 2683–2687.
ARTICLE IN PRESS
Please cite this article in press as: ESHRE Special Interest Group of Embryology and Alpha Scientists in Reproductive Medicine, The Vienna consensus: report of an expertmeeting on the development of ART laboratory performance indicators, Reproductive BioMedicine Online (2017), doi: 10.1016/j.rbmo.2017.06.015
17R E P R O D U C T I V E B I O M E D I C I N E O N L I N E ■ ■ ( 2 0 1 7 ) ■ ■ – ■ ■