
The variation in user drawn outlines on digital images: Effects on quantitative autoradiography
9
Computerized Medical imaging und Graphm, Vol. 14, No. 5, pp. 331-339, 1990 Printed in the USA. All rights reserved. 0895.6!11/‘90 $3.00 T .OO Copyright E’!990 Pergamon Press plc VARIATION IN USER DRAWN OUTLINES ON DIGITAL IM EFFECTS ON QUANTITATIVE AUTORADIOGRAPHY James L. Eilbert* Department of Mathematical Sciences, Drexel University, Philadelphia, PA 19104 C. R. Gallistel-i_ Department of Psychology, University of Pennsylvania, Philadelphia, PA 19104 and Donald L. McEachron Image Processing Center and Biomedical Engineering and Science Institute, Drexel University, Philadelphia, PA 19104 (Received 14 February 1990) Abstract-Variation in user outlines drawn to delineate neural regions is the only source of error add autoradiographic images after the images have been digitized. By analyzing data compiled from many ou drawn by several different investigators, it was demonstrated that this variation constitutes a major source of error affecting quantitative autoradiography. Both the gray level variation and average within a region, as well as the specific pixels included in an outline, were affected. However, using the intersection of multip attempts surrounding any given region and a consistent set of outlining criteria, it was possible to region which remained consistent from user to user. A technique for automating the consistent outlin is discussed. Key W~~~~~ Image processing, Autoradiography, Brain, 2-Deoxyglucose, Densitomefiy, Outlining INTRODUCTION Quantitative film autoradiography is an experimental technique with many steps, including experimental de- sign, exposure of brain tissue or animal to the radioiso- tope, experimental treatment, tissue preparation, film exposure and development, and quantification of the resultant autoradiograms. This last step includes both the digitization of the optical density data and the delinea- tion of important regions on the digitized image from which to collect such data. At each step in the process, there are both avoidable and unavoidable sources of error. For example, before the experiment is even begun, there is the inevitable variation due to the animals’ individual differences as well as largely avoidable dis- parities which might occur if the treatment groups were handled differently. If video densitometry is used as the *Present address: Grumman Aerospace Corporation, Grumman Corporate Research Center, Bethpage, New York 11714-3580. i-Present address: Department of Psychology, University of California at Los Angeles, Los Angeles, CA. Send reprint requests and correspondence to Dr. McEachron at above address. method of quantification, potential errors include varia- tion in illumination, camera response, and even the image processing hardware. Much of this variation can be controlled throug:h good experimental technique, careful selection of system components, an computer algorithms for image correction. However, there is one source of error which is added after these corrections are made and has yet to be investigated properly. This source of error involves user variability in designating neural regions for analysis. If autoradiography is to become a truly quantitalive method, then the total error in the process must be reduced as much as possible. Our approach at the Drexel University Image Processing Center has been to isolate potential sources of error at each stage, quantify their relative contribution to the overall variation, and design methods of reducing the error if it proves to be sig& cant. Our previous efforts have focusse perfor- mance of video cameras (1) and the video densitometric system (2). During the course of these studies, we discovered that variation in user delineation of brain regions for analysis (henceforth referred to as outlining) was one of the larger sources of error in the autoradiographic process. In the current study, we mea- sure the size of this error in several different ways, 331
-
Upload
independent -
Category
Documents
-
view
0 -
download
0
Transcript of The variation in user drawn outlines on digital images: Effects on quantitative autoradiography

Computerized Medical imaging und Graphm, Vol. 14, No. 5, pp. 331-339, 1990 Printed in the USA. All rights reserved.
0895.6!11/‘90 $3.00 T .OO Copyright E’ !990 Pergamon Press plc
VARIATION IN USER DRAWN OUTLINES ON DIGITAL IM EFFECTS ON QUANTITATIVE AUTORADIOGRAPHY
James L. Eilbert* Department of Mathematical Sciences, Drexel University, Philadelphia, PA 19104
C. R. Gallistel-i_ Department of Psychology, University of Pennsylvania, Philadelphia, PA 19104
and
Donald L. McEachron Image Processing Center and Biomedical Engineering and Science Institute, Drexel University, Philadelphia, PA 19104
(Received 14 February 1990)
Abstract-Variation in user outlines drawn to delineate neural regions is the only source of error add autoradiographic images after the images have been digitized. By analyzing data compiled from many ou drawn by several different investigators, it was demonstrated that this variation constitutes a major source of error affecting quantitative autoradiography. Both the gray level variation and average within a region, as well as the specific pixels included in an outline, were affected. However, using the intersection of multip attempts surrounding any given region and a consistent set of outlining criteria, it was possible to region which remained consistent from user to user. A technique for automating the consistent outlin is discussed.
Key W~~~~~ Image processing, Autoradiography, Brain, 2-Deoxyglucose, Densitomefiy, Outlining
INTRODUCTION
Quantitative film autoradiography is an experimental technique with many steps, including experimental de- sign, exposure of brain tissue or animal to the radioiso- tope, experimental treatment, tissue preparation, film exposure and development, and quantification of the resultant autoradiograms. This last step includes both the digitization of the optical density data and the delinea- tion of important regions on the digitized image from which to collect such data. At each step in the process, there are both avoidable and unavoidable sources of error. For example, before the experiment is even begun, there is the inevitable variation due to the animals’ individual differences as well as largely avoidable dis- parities which might occur if the treatment groups were handled differently. If video densitometry is used as the
*Present address: Grumman Aerospace Corporation, Grumman Corporate Research Center, Bethpage, New York 11714-3580.
i-Present address: Department of Psychology, University of California at Los Angeles, Los Angeles, CA.
Send reprint requests and correspondence to Dr. McEachron at above address.
method of quantification, potential errors include varia- tion in illumination, camera response, and even the image processing hardware. Much of this variation can be controlled throug:h good experimental technique, careful selection of system components, an computer algorithms for image correction. However, there is one source of error which is added after these corrections are made and has yet to be investigated properly. This source of error involves user variability in designating neural regions for analysis.
If autoradiography is to become a truly quantitalive method, then the total error in the process must be reduced as much as possible. Our approach at the Drexel University Image Processing Center has been to isolate potential sources of error at each stage, quantify their relative contribution to the overall variation, and design methods of reducing the error if it proves to be sig& cant. Our previous efforts have focusse perfor- mance of video cameras (1) and the video densitometric system (2). During the course of these studies, we discovered that variation in user delineation of brain regions for analysis (henceforth referred to as outlining) was one of the larger sources of error in the autoradiographic process. In the current study, we mea- sure the size of this error in several different ways,
331
332 Computerized Medical Imaging and Graphics September-Octoberil990, Volume 14, Number 5
examine its impact on quantitation, present statistical methods of reducing user outlining variation, and discuss automated techniques of reducing variability.
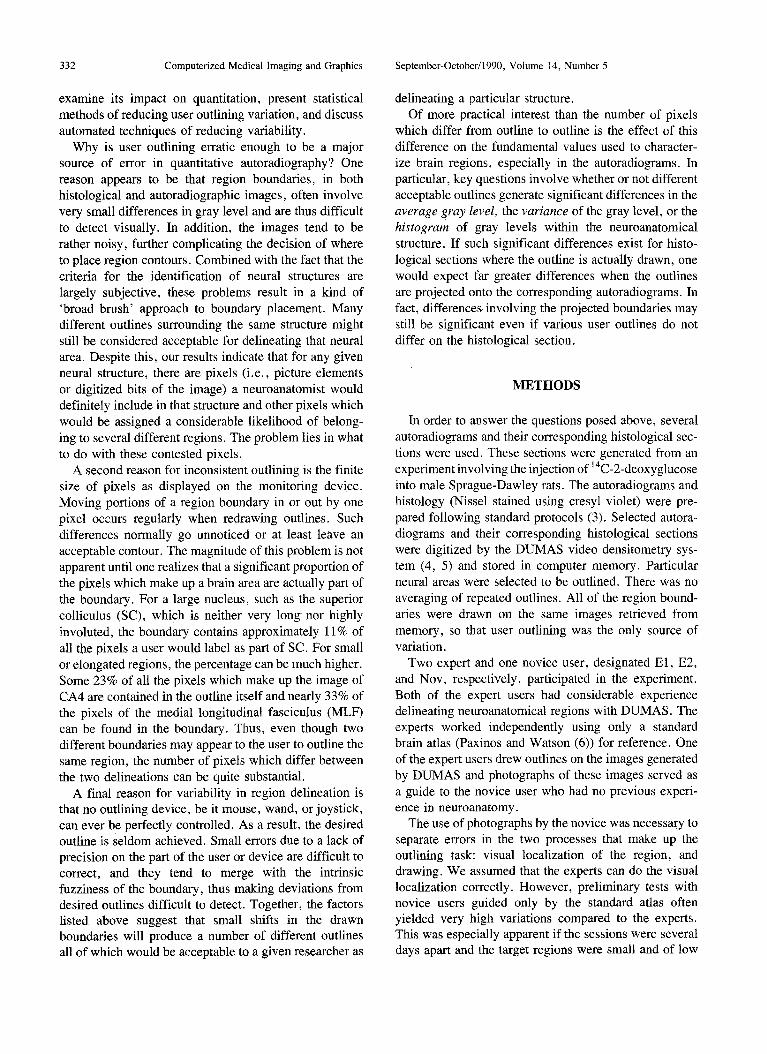
Why is user outlining erratic enough to be a major source of error in quantitative autoradiography? One reason appears to be that region boundaries, in both histological and autoradiographic images, often involve very small differences in gray level and are thus difficult to detect visually. In addition, the images tend to be rather noisy, further complicating the decision of where to place region contours. Combined with the fact that the criteria for the identification of neural structures are largely subjective, these problems result in a kind of ‘broad brush’ approach to boundary placement. Many different outlines surrounding the same structure might still be considered acceptable for delineating that neural area. Despite this, our results indicate that for any given neural structure, there are pixels (i.e., picture elements or digitized bits of the image) a neuroanatomist would definitely include in that structure and other pixels which would be assigned a considerable likelihood of belong- ing to several different regions. The problem lies in what to do with these contested pixels.
A second reason for inconsistent outlining is the finite size of pixels as displayed on the monitoring device. Moving portions of a region boundary in or out by one pixel occurs regularly when redrawing outlines. Such differences normally go unnoticed or at least leave an acceptable contour. The magnitude of this problem is not apparent until one realizes that a significant proportion of the pixels which make up a brain area are actually part of the boundary. For a large nucleus, such as the superior colliculus (SC), which is neither very long nor highly involuted, the boundary contains approximately 11% of all the pixels a user would label as part of SC. For small or elongated regions, the percentage can be much higher. Some 23% of all the pixels which make up the image of CA4 are contained in the outline itself and nearly 33% of the pixels of the medial longitudinal fasciculus (MLF) can be found in the boundary. Thus, even though two different boundaries may appear to the user to outline the same region, the number of pixels which differ between the two delineations can be quite substantial.
A final reason for variability in region delineation is that no outlining device, be it mouse, wand, or joystick, can ever be perfectly controlled. As a result, the desired outline is seldom achieved. Small errors due to a lack of precision on the part of the user or device are difficult to correct, and they tend to merge with the intrinsic fuzziness of the boundary, thus making deviations from desired outlines difficult to detect. Together, the factors listed above suggest that small shifts in the drawn boundaries will produce a number of different outlines all of which would be acceptable to a given researcher as
delineating a particular structure. Of more practical interest than the number of pixels
which differ from outline to outline is the effect of this difference on the fundamental values used to character- ize brain regions, especially in the autoradiograms. In particular, key questions involve whether or not different acceptable outlines generate significant differences in the average gray level, the variance of the gray level, or the histogram of gray levels within the neuroanatomical structure. If such significant differences exist for histo- logical sections where the outline is actually drawn, one would expect far greater differences when the outlines are projected onto the corresponding autoradiograms. In fact, differences involving the projected boundaries may still be significant even if various user outlines do not differ on the histological section.
METHODS
In order to answer the questions posed above, several autoradiograms and their corresponding histological sec- tions were used. These sections were generated from an experiment involving the injection of “C-2-deoxyglucose into male Sprague-Dawley rats. The autoradiograms and histology (Nissel stained using cresyl violet) were pre- pared following standard protocols (3). Selected autora- diograms and their corresponding histological sections were digitized by the DUMAS video densitometry sys- tem (4, 5) and stored in computer memory. Particular neural areas were selected to be outlined. There was no averaging of repeated outlines. All of the region bound- aries were drawn on the same images retrieved from memory, so that user outlining was the only source of variation.
Two expert and one novice user, designated El, E2, and Nov, respectively, participated in the experiment. Both of the expert users had considerable experience delineating neuroanatomical regions with DUMAS. The experts worked independently using only a standard brain atlas (Paxinos and Watson (6)) for reference. One of the expert users drew outlines on the images generated by DUMAS and photographs of these images served as a guide to the novice user who had no previous experi- ence in neuroanatomy .
The use of photographs by the novice was necessary to separate errors in the two processes that make up the outlining task: visual localization of the region, and drawing. We assumed that the experts can do the visual localization correctly. However, preliminary tests with novice users guided only by the standard atlas often yielded very high variations compared to the experts. This was especially apparent if the sessions were several days apart and the target regions were small and of low

Variation in user drawn outlines 0 J. L. EILBERT, C. R. GALLISTEL and D. L.. MCEACHRON 333
04 Fig. 1. (a) The digitized image of a histologically stained rat brain section used for outlining in this paper. (b) The actual
regions outlined by the user are shown, using typical outlines of the eight sections analyzed.
contrast. This erratic outlining was interpreted to mean that a novice was failing to correctly locate the specific brain region. For the present investigation, we wished to focus solely on variation in the drawing process. There- fore, one of the experts provided photographs of the brain sections with outlines already drawn to serve as a guide to the novice user, assuming that using actual photographs of expert outlines would solve the visual localization problem. The assumption proved to be
correct insofar as outlines made by the novice working from photographs were quite similar to those of the expert users. Thus, the outlining variation we report appears to represent the variation intrinsic to the drawing process for both the experts and the novice.
Each user outlined the same seven nemoanatomical structures on an image of a single histological section eight times. Figure 1 shows the brain section used and the regions outlined. N’ote the limited range of intensity

334 Computerized Medical Imaging and Graphics
Table 1. The ratio of disputed to consensus points for all regions and outlines.
Region Names Expert 1 Expert 2 Novice
CA4 0.7000 0.5431 0.7161 CGD 0.6667 0.9914 0.8977 DR 1.0089 2.9643 1.0089 MLF 0.7049 0.9800 1.3617 PN 0.6217 0.9118 0.8739 s5 0.2437 0.2656 0.3913 SC 0.3633 0.4029 0.4215
shown in the image. All seven different regions were outlined in one session before any region was outlined again. The order of outlining was randomized between session. The regions were ranked according to: (a) the degree of difficulty in determining the boundary; (b) size; (c) user performing the outlining.
From each user’s eight outlines of a region, the 28 pairwise unions and intersections were computed. (Note that given eight samples there are 8!/(6!)(2!) = 28 distinct pairs that can be selected.) In addition, the grand union (i.e., the union of all eight outlines of a region) and grand intersection were computed for each of these composite pictures. The consensus points were defined as those pixels lying within the intersection of all of the outlines in a given set. The disputed points were defined as the points lying in the difference between the union and intersection of all the outlines in the set. The outlines of each neuroanatomical structure drawn on the histology were projected onto the corresponding autora- diograms, and the unions and intersections were com- puted on these images as well.
RESULTS
One measure of consistency in outlining is the ratio of disputed points to consensus points. This ratio, as shown in Table 1, was quite large for all regions examined regardless of the user, ranging from 0.26 to 2.96, with a mean of 0.8, and a variance of 0.1. Even a 0.26 ratio is a substantial discrepancy, since this indi- cates that at least 26% of the points in any given region as determined by the drawn outline were disputed (i.e., differed from outline to outline).
The huge range of the ratio of disputed to consensus points was due to the dependence of this ratio on both the size of the region and the difficulty of delineating it (i.e., how noisy and similar to the background a region was). Figure 2 shows that the union/consensus points ratio was clearly correlated with the size of the region outlined (as indicated by the square root of points in the
September-October/l990, Volume 14, Number 5
union). The slope of the line was found to be - 0.0276 with a significance level of 0.029. The slope remained the same, but the significance improved if a correction for difficulty (contrast of the outlined region with the surrounding area) was made. For example, the superior colliculus (SC) is a troublesome area to delineate, but had a larger ratio than the smaller S5, which is an easy region to outline.
Our results indicated that there was an internal region of consensus points for each area which stabilized after a few intersections, even if the outlines being intersected were drawn by different users. As seen in Fig. 3, very few points were ever lost after the fifth intersection. Similarly, the grand union also tended to stabilize after 4 or 5 unions although not as reliably as the grand intersection. In fact, the coefficient of variation was at least three times as large for the disputed points as for the consensus points in any region.
Having established a large variation for a single user when outlining the same structure, an obvious question is how does this within user variation compare to the between user variation. Table 1 displays the ratio of disputed to consensus points for each brain region-user pairing. Paired t-tests yielded a significance of .196 for El vs. E2, .062 for El vs. Nov, and .536 for E2 vs. Nov when comparing the ratio between users. Thus, the ratio of disputed to consensus points was not signifi- cantly different between users.
To more directly compare the specific points chosen by users, an artificial user was created. The fourth user, El-E2 represents outlines obtained by combining four randomly selected outlines from Expert 1 with four outlines from Expert 2. Paired t-tests for differences in the mean number of points in the grand intersection of outlines between El and El-E2 and between E2 and El -E2 resulted in no significant differences. In addition, El-E2’s grand intersections for each region contained virtually the same points as either expert alone. Thus, grand intersections obtained from combining informa- tion from more than one user were not significantly different from that which would be obtained by users considered separately. The unions showed much greater variation between users.
Examination of the intersections of pairs of outlines from a single region, drawn by a single user, shows a similar trend. As before, the disputed points were always a substantial portion of the consensus points. Table 2 shows the ratio of disputed to consensus points on any pair of outlines averaged around .2 for CA4, a large well defined region; and around .32 for MLF, a smaller less well defined region. The ratios are, in fact, quite similar to the ratio of points in the boundary of the union divided by the total points in the union (i.e., .33 for MLF and .21 for CA4). The ratio when intersecting

Variation in user drawn outlines ??J. L. EILBERT, C. R. GALLISTEL and D. 1,. MCEACHRON 335
UNION SQRT
Fig. 2. The inverse relation between size of the region and the ratio of disputed to consensus points is shown based on all of the grand intersections and unions collected in the study.
outlines drawn by two different users tended to be slightly larger than the ratio when intersecting two outlines from the same user. However, as indicated previously by the data on the grand intersections and unions, this difference disappeared by the time 4 or 5 outlines had been intersected. The consistency between users suggests that carefully established criteria for determining the boundaries of selected neural areas, when combined with an intersection procedure, can largely overcome the variation in user outlining.
Next we examined the effect of user variation on the gray level statistics of the histology and the autoradio- graph. The benefits of working with the intersection of user outlines are demonstrated by the larger gray level variance of the grand union points compared to the in- tersection or consensus points associated with the same region. In fact, as seen in Table 3, this ratio ranges from 1.3 to 4.1. In addition to the large difference in vari- ance, the results for the average gray value or optical density reveal a small, highly significant difference between the average gray values reported for the union of outlines compared to the consensus points using the histological sections, as seen in Table 4 (the null hypothesis was that the ratio of average gray values was 1). Note that a region may be bounded by either lighter
or darker areas. Thus, the difference between the aver- age gray level values for the union and for the consensus points is equally likely to be positive or negative.
Although all the users end up with approximately the same variances and averages for the grand union and grand intersection, the approach to this final result is rather different. Looking at the difference between pairwise intersection .and the unions in @A4 and MLF, we find that E2 obtains much more consistent gray level scores that the other ‘two users. This is reflected in his smaller difference between the average gray value of union and the average gray value of intersection; and in his smaller standard deviation in all measurements. Nonetheless, this pairwise superiority in accuracy is not transferred to the grand intersection, where t-tests show E2’s results are indistinguishable from the others.
Under actual experimental conditions, the histology serves as a guide in identifying important neural areas in the autoradiograms. Thus, outlines created on a histo- logic1 section are projected onto the corresponding auto- radiogram prior to analysis. Using these projected out- lines, it was possible to determine the effects of user variability on both the average gray value and variance in densities reported for the regions that were investi- gated.

336 Computerized Medical Imaging and Graphics September-Octoberi1990, Volume 14, Number 5
(4
03 Cd)
Fig. 3. The intersection and unions of 2, 3, 4, and 8 outlines are shown in panels a, b, c, and d, respectively. The solid interior shows the intersection of the outlines. while the larger outline surrounding the solid section shows the union.
When comparing the consensus point vs. union of points projected on to autoradiograms, several outcomes were observed. Using t-tests on all pairwise combinations as repeated tests of the same hypothesis, the MLF, pontine nuclei (PN) and sensory root of the trigeminal(S5) were shown to have highly significant differences between the average gray value of the unions and intersections. The test was based on a x2 statistic with 2K degrees of
Table 2. Average ratio of disputed to consensus points for pairs of outlines from the same or different users.
User Name MLF Regions
CA4
EXPERT 1 0.241 + 0.076 0.217 +- 0.109 EXPERT 2 0.320 k 0.093 0.197 k 0.042 NOVICE 0.366 f 0.131 0.196 5 0.031 El vs. E2 0.475 k 0.075 El vs. NOVICE 0.306 ‘- 0.81
freedom, where K was the number of pairwise combi- nations. The x2 statistic was x2 = 2 2 ui from 1 to K, ui = -lnP,, and Pi is the probability associated with the t-tests. This result indicates that optical density values reported for certain regions on the autoradiograms will differ from outline to outline. For both the PN and S5,
Table 3. Ratio of the variance in gray levels found in the grand union compared to the variance found in the grand
intersection of all region outlines.
Region Names Expert 1 Expert 2 Novice El-E2
CA4 3.0991 2.4467 3.4300 2.8632 CGD 1.3416 1.7167 1.8665 1.8699 DR 1.7740 2.8138 1.7740 MLF 3.4345 2.3775 5.6552 2.8564 PN 1.7275 2.0151 2.3094 1.8322 s5 4.1686 3.7469 5.5874 SC 1.6181 1.6166 1.5220 1.5412

Variation in user drawn outlines ??J. L. EILBERT, C. R. GALLISTEL and D. L.. MCEACHRON 337
Table 4. Ratio of the average gray levels found in the grand union compared to the average found in the grand
intersection of all region outlines.
Region Names Expert 1 Expert 2 Novice El-E2
CA4 1.1498 i.1134 1.1756 1.1458 CGD 1.0134 1.0227 1.0160 1.0206 DR 1.0162 1.0216 1.0162 MLF 0.9787 0.9887 0.9644 0.9804 PN 1.0174 1.0260 1.0218 1.0237 S5 0.9816 0.9861 0.9828 SC 1.0037 1.0033 1.0020 1.0037
there was also significant difference in the variance of the pixels between the union and intersections. How- ever, the factors were not always in agreement. The MLF, for example, was found to have a significant difference in average gray value but not in the variance of gray values. Apparently, the variability of the outlin- ing itself was so great that a significant difference in variability was not achieved despite the difference in the mean values. For the dentate gyrus (DG), the situation was reversed with a significant difference in the variance while the average gray values of the unions and inter- sections remained virtually identical.
Well-defined regions on the histology do not always correspond to well defined regions in the autoradiogram, and vice versa. When regions in both histology and autoradiograms do correspond, the conclusions reached about the effects of user outlining variability are fully valid. When the correspondence is not visible, changes in the histological outlines still affect the gray value statistics of the autoradiogram, but in unpredictable ways.
CONCLUSION
In summary, we have found that user variation in determining the boundaries of neural regions is a major source of error in the quantitative analysis of autoradio- grams. This is especially true for small brain areas where the number of points contained within the outline is comparable to the number of points in the interior. The gray level means and variances change significantly from outline to outline, as do the number of points contained in the outline itself. This result holds true for individuals who outline on either stained sections or autoradiograms. Finally, we found that structures present in a stained section are not necessarily clearly defined in the image of the autoradiogram and vice versa.
The current practice in the quantitative analysis of autoradiograms is to report only the average gray level of
a region in terms of some derived measure, such as concentrations, white matter ratios, or local cerebral glucose utilization, and changes due to the experimental treatment are characterized in terms of this quantity. However, it is common knowledge among workers in the field that experimental manipulations often lead to changes in the internal distribution of gray values (and thus the derived measure) within a single region. For example, hypoxia, leads to a pronounced streak in the inferior colliculus of male rats (McEachron, unpublished observations). In response to other experimental treat- ments, an area might develop a mottled appearance. These changes might or might not coincide with alter- ations in the overall gray level of the region in question. In order to obtain more information from autoradia- grams, some method of characterizing internal distribu- tions and the changes in them associated with experi- mental treatments is needed. Unfortunately, user varia- tion in region identifi.cation and outlining represents a significant obstacle to this effort.
Some methods of discriminating treatments using changes in the internal distribution of gray levels within a single region have previously been presented (7). The major difficulty in implementing any of that the changes in internal distribution associated with variation in user outlining can be on the same order of magnitude as the effects of experimental manipulations themselves. Thus, in order to use internal variations to characterize experimental treatments, it must be possible to find a consistent outline of the region in question.
The results of this experiment indicate that repeated outlining can produce a stable, consistent outline even when different users are compared. Given that autorad- iographic experiments already produce images far faster than they can be analyzed, to increase the time spent per autoradiogram by having the user repeatedly outline each area manually does not appear to be practical. A better solution to the problem is to develop an automated procedure which mimics the effect of repeated outlining. This algorithm should give the same answer for a large set of different regions as well as producing an outline whose variance is less than any of the user drawn outlines.
Preliminary results show that a variance-reduction algorithm, described below, solves this problem in a large fraction of cases, The basic idea is to find an extended boundary around the one that the user drew. The extended boundary might consist of all the points one pixel inside and two outside of the original user’s outline. The average and variance of the interior of the region is then computed. Points in the extended bound- ary with the same value as the internal average are marked for inclusion in the minimum variance outline.

338 Computerized Medical Imaging and Graphics September-Octobedl990, Volume 14, Number 5
The variance of the region with these new points is then computed. If the calculated variance decreases, then those pixels in the extended boundary one gray level different from the internal average are marked for inclusion. This process continues until the calculated variance increases. At that point, the new pixels are not added and the program stops. The algorithm is designed to work on the images from stained sections and occa- sionally runs into difficulty when there are internal structures within the outlined region. In such cases, a more intelligent algorithm which removes the internal structures from the variance minimization calculation will be required.
The algorithm described finds the minimum variance of an outlined region independent of the precise set of points designated by the user. However, the set of points found in this manner forms a cloud of pixels scattered throughout the extended boundary. This fuzzy boundary is adequate for quantitative purposes, but looks rather messy when displayed on a monitor. To find a specific boundary to be displayed, one must find local line segments that optimize the density of points with values close to the mean in the thickened boundary. The ends of adjacent segments must then be forced to match so that a smooth boundary can be drawn.
expect that similar problems exist when MRI images are used to identify regions in PET images, an analogous situation to the technique of quantitative film autorad- iography examined here. Results indicate that there is a consensus region to each neural area identified upon which all users agree. This consensus region can be obtained by intersecting repeated outlines, or by auto- mated techniques that find a single canonical outline given any one of the outlines that a user provides. Given that such regions do exist, it is potentially possible to develop computer-aided segmentation to identify these areas with increased precision. The initial stages of such a parcellation protocol are discussed by Waks and Tretiak (9).
REFERENCES
1.
2.
3.
The problem of accurately identifying and linking neuroanatomical regions with functional maps neural activity is not limited to quantitative film autoradiogra- phy. The exact analogous situation occurs when MRI images, which serve the function of histology, are used to identify regions of metabolic uptake of receptor concentration generated by positron emission tomogra- phy (PET). Variability in region delineation is also likely a problem in this application, although we do not know of an analogous study to quantify the effect. One comforting aspect of the present results is the clear indication that there are defined neuroanatomical regions which can be reliably located, a prerequisite to any sort of computer-aided approach to region identification, segmentation, or parcellation. Approaches to this prob- lem of computerized image segmentation are discussed by Waks and Tretiak (9).
Tretiak, O.J.; Chu, C-L.; McEachron, D.L. The evaluation of cameras for quantitative autoradiographic video densitometry. 16th Annual Meeting of the Society for Neuroscience. Nov. 9-14, 1986. Abstracts, Part I: 32.19, pg. 112. McEachron, D.L.; Gallistel, C.R.; Eilbert, J.L.; Tretiak, 0. J. The analytic and functional accuracy of a video densitometry system. J. Neurosci. Methods 25: 63-74; 1988. McEachron, D.L.; McClellan; D.E.; Mass, J.H. Experimental design and functional mapping. In McEachron, D.L., ed. Func- tional mapping in biology and medicine: Computer-assisted auto- radiography. Volume 11 in the Experimental Biology and Medicine Series (A. Wolsky, Series Editor). Basel, Switzerland: S. Karger; 1986: 143-174.
4.
5.
6.
I.
8.
9.
McEachron, D.L.; Tretiak, O.J.; Feingold, E. Autoradiography and video densitometry: Image processing with DUMAS, Part 1. Functional Photography 22: 30-36,44; 1987. McEachron, D.L.; Tretiak, O.J.; Feingold, E. Autoradiography and video densitometry: Image processing with DUMAS, Part 2. Functional Photography 22: 26-31; 1987. Paxinos, G.; Watson, C. The rat brain in stereotaxic coordinates, New York, NY: Academic Press; 1982. Eilbert, J.L. Quantitative analysis of autoradiographs. In McEach- ron, D.L., ed. Functional mapping in biology and medicine: Computer-assisted autoradiography. Volume 11 in the Experimen- tal Biology and Medicine Series (A. Wolsky, Series Editor). Basel, Switzerland: S. Karger; 1986: 122-142. McEachron, D.L. Functional mapping in biology and medicine: Computer-assisted autoradiography. Volume 11 in the Experimen- tal Biology and Medicine Series (A. Wolsky, Series Editor). Basel, Switzerland: S. Karger; 1986. Waks, A.; Tretiak, O.J. Recognition of regions in brain sections. Comp. Med. Imag. Graphics 14: 341-352; 1990.
SUMMARY
In an experiment in which we compared the variability of user drawn outlines delineating neural structures on histological sections of rat brain, we found that such variability is a major source of error in the digital analysis of autoradiographs. This is especially true if one wishes to use within-region changes in gray level distri- bution, rather than just changes in the mean gray level of the area, to characterize experimental effects (7, 8). We
About the Author-km L. EILBERT was born in Pittsburgh, PA in 1950. He holds a BS (1973) in Physics from the State University of New York at Stony Brook, an MS (1975) in Applied Mathematics from the Courant Institute at New York University, and a Ph.D. (1980) in Biomathematics from North Carolina State University. Currently, he is a Senior Research Scientist at Grumman Corporate Research Center in Bethpage, NY. He has done work in neural network architectures and in neural network models of attentional mechanisms. His other areas of research include model-based vision and machine learning.
About the Author-Dr. C. R. GALLISTEL is professor of psychology at UCLA, having just moved there from the University of Pennsylvania, where he taught for 23 years after getting his Ph.D. in psychology from Yale in 1966. His research focuses on the identification of the neural system underlying electrical self-stimulation of the brain. He was led to

Vtiation in user drawn outlines ??J. L. EILBERT. C. R. GALLISTEL and D. I,. MCEACHRON 339
work on image processing and to his association with the Image Processing Center at Drexel through his use of 2DG autoradiography to visualize the neural systems activated by the stimulation.
About tbe Author-Dr, DGNALD L. MCEACHRON received his B.A. in Behavior Genetics from the University of California at Berkeley in 1977 and his Ph.D. in Neuroscience from the University of California at San Diego in 1984. He has authored numerous articles on a variety of subjects including human evolution, psychopharmacology, circa- dian rhythms, and image processing. In 1986, he edited Volume 11 in
the series Experimental Biology and Medicine entitled Functional Mapping in Biology and Medicine: Computer-Assisted Autoradiogra- phy and in 1989 was a Guest Editor for a special issue of Computerized Medical Imaging and Graphics entitled Diversity in Biomedical Imaging. Dr. McEachron is presently a Research Assistant Professor in the Biomedical Engineering and Science Institute at Drexel University as well as Director of Life Science Research at Drexel’s Image Processing Center. He is also an Adjunct Assistant Professor in the College of Allied Health Science at Thomas Jefferson University and a Research Associate in the Department of Psychology at the University of Pennsylvania.
![Quantitative receptor autoradiography using [3H]Ultrofilm: application to multiple benzodiazepine receptors](https://static.fdokumen.com/doc/165x107/631e9902dc32ad07f307a894/quantitative-receptor-autoradiography-using-3hultrofilm-application-to-multiple.jpg)


![Outlines of general history [microform]](https://static.fdokumen.com/doc/165x107/6313015f755dce2ed90cdae5/outlines-of-general-history-microform.jpg)