Spatial mapping of phosphorus influx in bean root systems using digital autoradiography
12
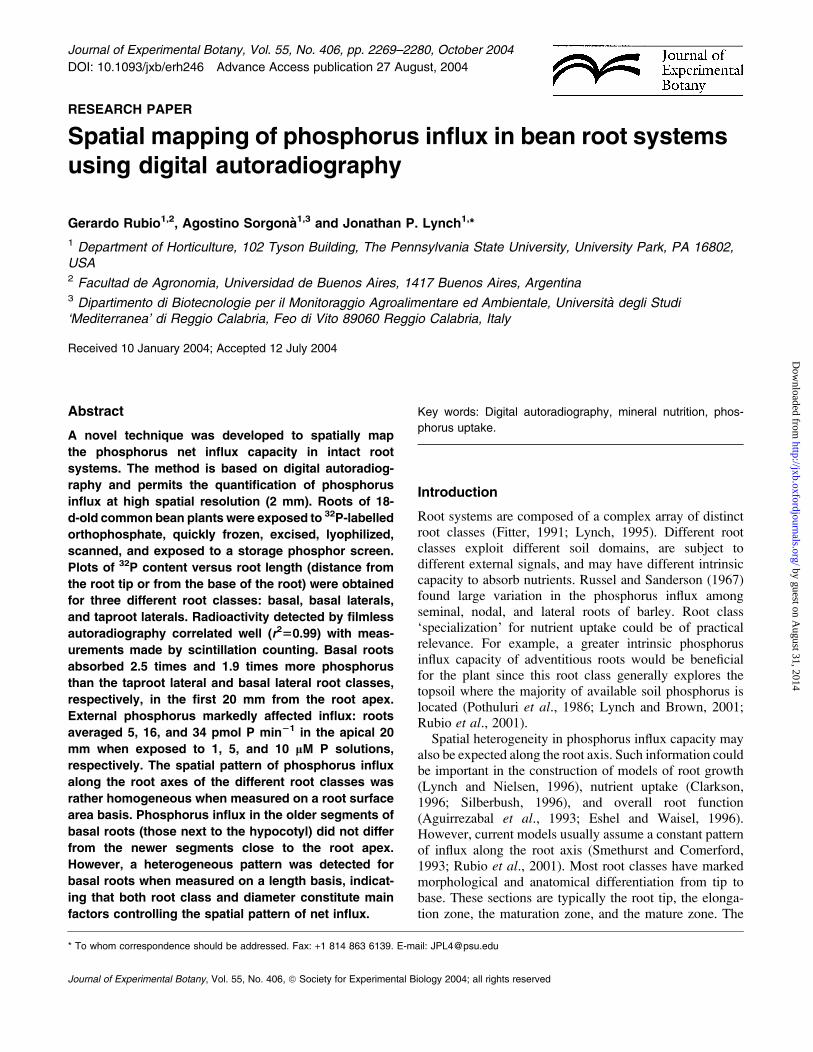
RESEARCH PAPER Spatial mapping of phosphorus influx in bean root systems using digital autoradiography Gerardo Rubio 1,2 , Agostino Sorgona ` 1,3 and Jonathan P. Lynch 1, * 1 Department of Horticulture, 102 Tyson Building, The Pennsylvania State University, University Park, PA 16802, USA 2 Facultad de Agronomia, Universidad de Buenos Aires, 1417 Buenos Aires, Argentina 3 Dipartimento di Biotecnologie per il Monitoraggio Agroalimentare ed Ambientale, Universita`degli Studi ‘Mediterranea’ di Reggio Calabria, Feo di Vito 89060 Reggio Calabria, Italy Received 10 January 2004; Accepted 12 July 2004 Abstract A novel technique was developed to spatially map the phosphorus net influx capacity in intact root systems. The method is based on digital autoradiog- raphy and permits the quantification of phosphorus influx at high spatial resolution (2 mm). Roots of 18- d-old common bean plants were exposed to 32 P-labelled orthophosphate, quickly frozen, excised, lyophilized, scanned, and exposed to a storage phosphor screen. Plots of 32 P content versus root length (distance from the root tip or from the base of the root) were obtained for three different root classes: basal, basal laterals, and taproot laterals. Radioactivity detected by filmless autoradiography correlated well (r 2 50.99) with meas- urements made by scintillation counting. Basal roots absorbed 2.5 times and 1.9 times more phosphorus than the taproot lateral and basal lateral root classes, respectively, in the first 20 mm from the root apex. External phosphorus markedly affected influx: roots averaged 5, 16, and 34 pmol P min 21 in the apical 20 mm when exposed to 1, 5, and 10 lM P solutions, respectively. The spatial pattern of phosphorus influx along the root axes of the different root classes was rather homogeneous when measured on a root surface area basis. Phosphorus influx in the older segments of basal roots (those next to the hypocotyl) did not differ from the newer segments close to the root apex. However, a heterogeneous pattern was detected for basal roots when measured on a length basis, indicat- ing that both root class and diameter constitute main factors controlling the spatial pattern of net influx. Key words: Digital autoradiography, mineral nutrition, phos- phorus uptake. Introduction Root systems are composed of a complex array of distinct root classes (Fitter, 1991; Lynch, 1995). Different root classes exploit different soil domains, are subject to different external signals, and may have different intrinsic capacity to absorb nutrients. Russel and Sanderson (1967) found large variation in the phosphorus influx among seminal, nodal, and lateral roots of barley. Root class ‘specialization’ for nutrient uptake could be of practical relevance. For example, a greater intrinsic phosphorus influx capacity of adventitious roots would be beneficial for the plant since this root class generally explores the topsoil where the majority of available soil phosphorus is located (Pothuluri et al., 1986; Lynch and Brown, 2001; Rubio et al., 2001). Spatial heterogeneity in phosphorus influx capacity may also be expected along the root axis. Such information could be important in the construction of models of root growth (Lynch and Nielsen, 1996), nutrient uptake (Clarkson, 1996; Silberbush, 1996), and overall root function (Aguirrezabal et al., 1993; Eshel and Waisel, 1996). However, current models usually assume a constant pattern of influx along the root axis (Smethurst and Comerford, 1993; Rubio et al., 2001). Most root classes have marked morphological and anatomical differentiation from tip to base. These sections are typically the root tip, the elonga- tion zone, the maturation zone, and the mature zone. The * To whom correspondence should be addressed. Fax: +1 814 863 6139. E-mail: [email protected] Journal of Experimental Botany, Vol. 55, No. 406, ª Society for Experimental Biology 2004; all rights reserved Journal of Experimental Botany, Vol. 55, No. 406, pp. 2269–2280, October 2004 DOI: 10.1093/jxb/erh246 Advance Access publication 27 August, 2004 by guest on August 31, 2014 http://jxb.oxfordjournals.org/ Downloaded from
-
Upload
independent -
Category
Documents
-
view
0 -
download
0
Transcript of Spatial mapping of phosphorus influx in bean root systems using digital autoradiography
RESEARCH PAPER
Spatial mapping of phosphorus influx in bean root systemsusing digital autoradiography
Gerardo Rubio1,2, Agostino Sorgona1,3 and Jonathan P. Lynch1,*
1 Department of Horticulture, 102 Tyson Building, The Pennsylvania State University, University Park, PA 16802,USA2 Facultad de Agronomia, Universidad de Buenos Aires, 1417 Buenos Aires, Argentina3 Dipartimento di Biotecnologie per il Monitoraggio Agroalimentare ed Ambientale, Universita degli Studi‘Mediterranea’ di Reggio Calabria, Feo di Vito 89060 Reggio Calabria, Italy
Received 10 January 2004; Accepted 12 July 2004
Abstract
A novel technique was developed to spatially map
the phosphorus net influx capacity in intact root
systems. The method is based on digital autoradiog-
raphy and permits the quantification of phosphorus
influx at high spatial resolution (2 mm). Roots of 18-
d-old common bean plants were exposed to 32P-labelled
orthophosphate, quickly frozen, excised, lyophilized,
scanned, and exposed to a storage phosphor screen.
Plots of 32P content versus root length (distance from
the root tip or from the base of the root) were obtained
for three different root classes: basal, basal laterals,
and taproot laterals. Radioactivity detected by filmless
autoradiography correlated well (r250.99) with meas-
urements made by scintillation counting. Basal roots
absorbed 2.5 times and 1.9 times more phosphorus
than the taproot lateral and basal lateral root classes,
respectively, in the first 20 mm from the root apex.
External phosphorus markedly affected influx: roots
averaged 5, 16, and 34 pmol P min21 in the apical 20
mm when exposed to 1, 5, and 10 lM P solutions,
respectively. The spatial pattern of phosphorus influx
along the root axes of the different root classes was
rather homogeneous when measured on a root surface
area basis. Phosphorus influx in the older segments of
basal roots (those next to the hypocotyl) did not differ
from the newer segments close to the root apex.
However, a heterogeneous pattern was detected for
basal roots when measured on a length basis, indicat-
ing that both root class and diameter constitute main
factors controlling the spatial pattern of net influx.
Key words: Digital autoradiography, mineral nutrition, phos-
phorus uptake.
Introduction
Root systems are composed of a complex array of distinctroot classes (Fitter, 1991; Lynch, 1995). Different rootclasses exploit different soil domains, are subject todifferent external signals, and may have different intrinsiccapacity to absorb nutrients. Russel and Sanderson (1967)found large variation in the phosphorus influx amongseminal, nodal, and lateral roots of barley. Root class‘specialization’ for nutrient uptake could be of practicalrelevance. For example, a greater intrinsic phosphorusinflux capacity of adventitious roots would be beneficialfor the plant since this root class generally explores thetopsoil where the majority of available soil phosphorus islocated (Pothuluri et al., 1986; Lynch and Brown, 2001;Rubio et al., 2001).
Spatial heterogeneity in phosphorus influx capacity mayalso be expected along the root axis. Such information couldbe important in the construction of models of root growth(Lynch and Nielsen, 1996), nutrient uptake (Clarkson,1996; Silberbush, 1996), and overall root function(Aguirrezabal et al., 1993; Eshel and Waisel, 1996).However, current models usually assume a constant patternof influx along the root axis (Smethurst and Comerford,1993; Rubio et al., 2001). Most root classes have markedmorphological and anatomical differentiation from tip tobase. These sections are typically the root tip, the elonga-tion zone, the maturation zone, and the mature zone. The
* To whom correspondence should be addressed. Fax: +1 814 863 6139. E-mail: [email protected]
Journal of Experimental Botany, Vol. 55, No. 406, ª Society for Experimental Biology 2004; all rights reserved
Journal of Experimental Botany, Vol. 55, No. 406, pp. 2269–2280, October 2004
DOI: 10.1093/jxb/erh246 Advance Access publication 27 August, 2004
by guest on August 31, 2014
http://jxb.oxfordjournals.org/D
ownloaded from
root tip, which includes the root cap and the meristematicregion, is thought to have a large nutrient demand(Clarkson, 1996). In the maturation zone, the developmentof root hairs from the epidermis and a functional CasparianBand in the endodermis facilitate nutrient uptake. In the ma-ture region of the root, the cortex may senesce, lateral rootsmay emerge, and in dicots, secondary growth becomes im-portant. The degree of cell vacuolization increases from theroot tip (where no cell vacuoles are present) to the base ofthe root. The relationship of the anatomical heterogeneityalong the root axis with nutrient acquisition has concernedresearchers for some time (Prevot and Steward, 1936), andappears to be nutrient-specific. For example, the absorptionof iron appears to be concentrated at the root tip (Clarkson,1996) and that of sulphur in the elongation zone immedi-ately behind the meristematic region (Holobrada, 1977).Colmer and Bloom (1998) found consistent differences inthe pattern of nitrogen uptake between maize and rice roots,probably brought about by the presence of a layer ofsclerenchymatous fibres in rice roots. In the case ofphosphorus, contrasting results have been found. Someresearchers observed that all regions of the root are effectivein absorbing phosphorus (Burley et al., 1970), whereasothers reported that phosphorus is absorbed more activelyat the apical regions of the root axis (Bar-Yosef et al., 1972).To quantify nutrient uptake capacity at high spatial
resolution, either stationary or vibrating ion-selective micro-electrodes and radionuclide tracers have been the mostcommon approaches. Ion-selective stationary microelectro-des have been used to detect ammonium and nitrate intakein barley (Colmer and Bloom, 1998; Henriksen et al., 1990)and potassium in maize (Newman et al., 1987). Vibratingmicroelectrodes were originally used to measure extracel-lular calcium gradients and then used to measure potassiumand calcium fluxes in maize roots (Kochian et al., 1992).Microelectrode approaches have not been useful for studies ofphosphorus uptake because of the lack of good phosphorus-sensing electrodes. Root uptake capacity for phosphorushas been measured mainly with labelled ions (Epstein et al.,1963; McNaughton and Chapin, 1985; Rubio et al., 1997).Standard autoradiographic techniques consist of the expo-sure of the studied object to a radioactive compound. Theradiolabelled object is then exposed to a photographic emul-sion to obtain a map of radionuclide distribution (Yeung,1984). Standard autoradiography has been extensively usedto study the dynamics and extension of nutrient depletionzones (Jungk, 1987; Krauss et al., 1987; Owusu-Bennoahand Wild, 1979), the radial distribution of phosphorus indifferent regions of the roots (Ferguson andClarkson, 1976),and the rate of phosphorus uptake by various root zones(Clarkson et al., 1978). More recently, digital autoradiog-raphy has been used to describe hyphal 32P transport inmycorrhizal root cultures (Nielsen et al., 2002) and rootmorphological characteristics such as root diameter, length,and branching patterns quantitatively (Moran et al., 2000).
The objective of this work was to evaluate the variationof phosphorus influx along the axis of the different rootclasses of common bean. The experimental approach usedhere included two phases. First, the experimental conditionsin which phosphorus translocation along the root axis canbe neglected were analysed so that net influx in each rootsection can be estimated. With these results, in the secondphase, a new method using quantitative autoradiographywas developed to estimate phosphorus influx at high spatialresolution.
Materials and Methods
Plant cultivation
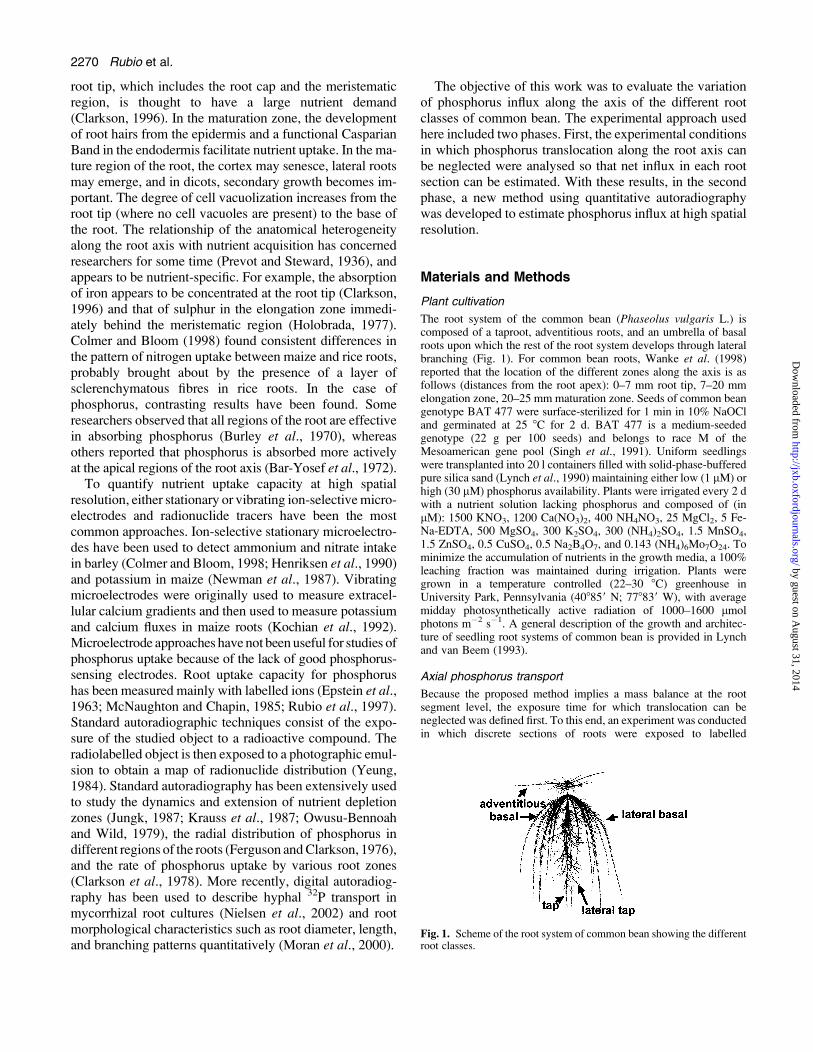
The root system of the common bean (Phaseolus vulgaris L.) iscomposed of a taproot, adventitious roots, and an umbrella of basalroots upon which the rest of the root system develops through lateralbranching (Fig. 1). For common bean roots, Wanke et al. (1998)reported that the location of the different zones along the axis is asfollows (distances from the root apex): 0–7 mm root tip, 7–20 mmelongation zone, 20–25 mm maturation zone. Seeds of common beangenotype BAT 477 were surface-sterilized for 1 min in 10% NaOCland germinated at 25 8C for 2 d. BAT 477 is a medium-seededgenotype (22 g per 100 seeds) and belongs to race M of theMesoamerican gene pool (Singh et al., 1991). Uniform seedlingswere transplanted into 20 l containers filled with solid-phase-bufferedpure silica sand (Lynch et al., 1990) maintaining either low (1 lM) orhigh (30 lM) phosphorus availability. Plants were irrigated every 2 dwith a nutrient solution lacking phosphorus and composed of (inlM): 1500 KNO3, 1200 Ca(NO3)2, 400 NH4NO3, 25 MgCl2, 5 Fe-Na-EDTA, 500 MgSO4, 300 K2SO4, 300 (NH4)2SO4, 1.5 MnSO4,1.5 ZnSO4, 0.5 CuSO4, 0.5 Na2B4O7, and 0.143 (NH4)6Mo7O24. Tominimize the accumulation of nutrients in the growth media, a 100%leaching fraction was maintained during irrigation. Plants weregrown in a temperature controlled (22–30 8C) greenhouse inUniversity Park, Pennsylvania (408859 N; 778839 W), with averagemidday photosynthetically active radiation of 1000–1600 lmolphotons m�2 s�1. A general description of the growth and architec-ture of seedling root systems of common bean is provided in Lynchand van Beem (1993).
Axial phosphorus transport
Because the proposed method implies a mass balance at the rootsegment level, the exposure time for which translocation can beneglected was defined first. To this end, an experiment was conductedin which discrete sections of roots were exposed to labelled
Fig. 1. Scheme of the root system of common bean showing the differentroot classes.
2270 Rubio et al.
by guest on August 31, 2014
http://jxb.oxfordjournals.org/D
ownloaded from
phosphorus in order to estimate phosphorus translocation along theroot axes and the experimental conditions where it can be neglected.After 18 d of growth, basal roots of bean plants were placed on
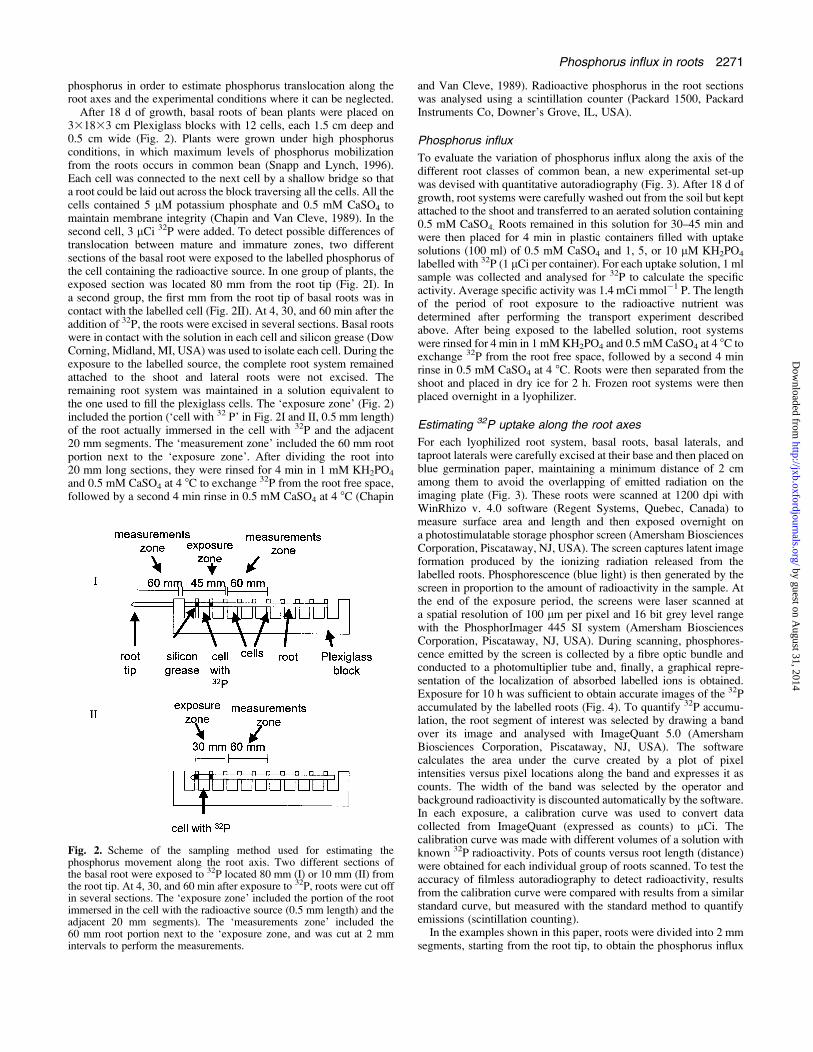
331833 cm Plexiglass blocks with 12 cells, each 1.5 cm deep and0.5 cm wide (Fig. 2). Plants were grown under high phosphorusconditions, in which maximum levels of phosphorus mobilizationfrom the roots occurs in common bean (Snapp and Lynch, 1996).Each cell was connected to the next cell by a shallow bridge so thata root could be laid out across the block traversing all the cells. All thecells contained 5 lM potassium phosphate and 0.5 mM CaSO4 tomaintain membrane integrity (Chapin and Van Cleve, 1989). In thesecond cell, 3 lCi 32P were added. To detect possible differences oftranslocation between mature and immature zones, two differentsections of the basal root were exposed to the labelled phosphorus ofthe cell containing the radioactive source. In one group of plants, theexposed section was located 80 mm from the root tip (Fig. 2I). Ina second group, the first mm from the root tip of basal roots was incontact with the labelled cell (Fig. 2II). At 4, 30, and 60 min after theaddition of 32P, the roots were excised in several sections. Basal rootswere in contact with the solution in each cell and silicon grease (DowCorning, Midland, MI, USA) was used to isolate each cell. During theexposure to the labelled source, the complete root system remainedattached to the shoot and lateral roots were not excised. Theremaining root system was maintained in a solution equivalent tothe one used to fill the plexiglass cells. The ‘exposure zone’ (Fig. 2)included the portion (‘cell with 32 P’ in Fig. 2I and II, 0.5 mm length)of the root actually immersed in the cell with 32P and the adjacent20 mm segments. The ‘measurement zone’ included the 60 mm rootportion next to the ‘exposure zone’. After dividing the root into20 mm long sections, they were rinsed for 4 min in 1 mM KH2PO4
and 0.5 mM CaSO4 at 4 8C to exchange 32P from the root free space,followed by a second 4 min rinse in 0.5 mM CaSO4 at 4 8C (Chapin
and Van Cleve, 1989). Radioactive phosphorus in the root sectionswas analysed using a scintillation counter (Packard 1500, PackardInstruments Co, Downer’s Grove, IL, USA).
Phosphorus influx
To evaluate the variation of phosphorus influx along the axis of thedifferent root classes of common bean, a new experimental set-upwas devised with quantitative autoradiography (Fig. 3). After 18 d ofgrowth, root systems were carefully washed out from the soil but keptattached to the shoot and transferred to an aerated solution containing0.5 mM CaSO4. Roots remained in this solution for 30–45 min andwere then placed for 4 min in plastic containers filled with uptakesolutions (100 ml) of 0.5 mM CaSO4 and 1, 5, or 10 lM KH2PO4
labelled with 32P (1 lCi per container). For each uptake solution, 1 mlsample was collected and analysed for 32P to calculate the specificactivity. Average specific activity was 1.4 mCi mmol�1 P. The lengthof the period of root exposure to the radioactive nutrient wasdetermined after performing the transport experiment describedabove. After being exposed to the labelled solution, root systemswere rinsed for 4 min in 1 mMKH2PO4 and 0.5 mMCaSO4 at 4 8C toexchange 32P from the root free space, followed by a second 4 minrinse in 0.5 mM CaSO4 at 4 8C. Roots were then separated from theshoot and placed in dry ice for 2 h. Frozen root systems were thenplaced overnight in a lyophilizer.
Estimating 32P uptake along the root axes
For each lyophilized root system, basal roots, basal laterals, andtaproot laterals were carefully excised at their base and then placed onblue germination paper, maintaining a minimum distance of 2 cmamong them to avoid the overlapping of emitted radiation on theimaging plate (Fig. 3). These roots were scanned at 1200 dpi withWinRhizo v. 4.0 software (Regent Systems, Quebec, Canada) tomeasure surface area and length and then exposed overnight ona photostimulatable storage phosphor screen (Amersham BiosciencesCorporation, Piscataway, NJ, USA). The screen captures latent imageformation produced by the ionizing radiation released from thelabelled roots. Phosphorescence (blue light) is then generated by thescreen in proportion to the amount of radioactivity in the sample. Atthe end of the exposure period, the screens were laser scanned ata spatial resolution of 100 lm per pixel and 16 bit grey level rangewith the PhosphorImager 445 SI system (Amersham BiosciencesCorporation, Piscataway, NJ, USA). During scanning, phosphores-cence emitted by the screen is collected by a fibre optic bundle andconducted to a photomultiplier tube and, finally, a graphical repre-sentation of the localization of absorbed labelled ions is obtained.Exposure for 10 h was sufficient to obtain accurate images of the 32Paccumulated by the labelled roots (Fig. 4). To quantify 32P accumu-lation, the root segment of interest was selected by drawing a bandover its image and analysed with ImageQuant 5.0 (AmershamBiosciences Corporation, Piscataway, NJ, USA). The softwarecalculates the area under the curve created by a plot of pixelintensities versus pixel locations along the band and expresses it ascounts. The width of the band was selected by the operator andbackground radioactivity is discounted automatically by the software.In each exposure, a calibration curve was used to convert datacollected from ImageQuant (expressed as counts) to lCi. Thecalibration curve was made with different volumes of a solution withknown 32P radioactivity. Pots of counts versus root length (distance)were obtained for each individual group of roots scanned. To test theaccuracy of filmless autoradiography to detect radioactivity, resultsfrom the calibration curve were compared with results from a similarstandard curve, but measured with the standard method to quantifyemissions (scintillation counting).In the examples shown in this paper, roots were divided into 2 mm
segments, starting from the root tip, to obtain the phosphorus influx
Fig. 2. Scheme of the sampling method used for estimating thephosphorus movement along the root axis. Two different sections ofthe basal root were exposed to 32P located 80 mm (I) or 10 mm (II) fromthe root tip. At 4, 30, and 60 min after exposure to 32P, roots were cut offin several sections. The ‘exposure zone’ included the portion of the rootimmersed in the cell with the radioactive source (0.5 mm length) and theadjacent 20 mm segments). The ‘measurements zone’ included the60 mm root portion next to the ‘exposure zone, and was cut at 2 mmintervals to perform the measurements.
Phosphorus influx in roots 2271
by guest on August 31, 2014
http://jxb.oxfordjournals.org/D
ownloaded from

rate. An example of the calculations for an individual segment of basalroots is shown in the Appendix. Results can also be expressed on anarea basis. This last case requires data on surface area from eachsegment of root. From ImageQuant the number of counts every 2 mm
were obtained and, fromWinRhizo output, the root surface area in each2 mm segment was measured. To test if the 2 mm segments wereequivalent in the two procedures, the length of the root segmentsmeasured from the tip obtained by Imagequant and WinRhizo werecompared.To obtain precise quantification and localization of radionuclides in
the root, several preliminary experiments were conducted to determinethe appropriate combination of radioactivity, length of the period ofcontact between the roots and the labelled solution, and the length ofthe period of exposure of the root to the phosphor screen. If 32Paccumulation in the root is not in the optimum range of detection, eitherunder-exposure or over-saturation of the image would be problematic.Based on these preliminary experiments, the conditions used in themain experiment were 1 lCi in 100 ml of 1–10 lM of KH2PO4, 4 mincontact with the labelled source, and 10 h of root exposure to thephosphor screen. If the whole root system is exposed to the phosphorscreen, the uptake rate of individual segments of roots cannot becalculated due to the overlap of the radiation emitted by adjacent rootsegments. That is the reason why individual root segments wereseparated from each other after being in contact with the labelledphosphorus and before being exposed to the phosphor screen. Therange of grey intensity in Fig. 4 represents different influx values.
Statistical analysis
In the influx experiment, 30 plants (two phosphorus treatments duringthe growth period by three phosphorus concentrations in the nutrient
Fig. 3. Scheme of the phosphorus influx experiment.
Fig. 4. Labelled phosphorus absorbed by individual segments of beanroots after 4 min of exposure to 1 lM phosphate labelled with 1 lCi 32Pand exposed to a phosphor screen for 10 h. The grey intensity isproportional to the phosphorus accumulation. The image was laserscanned with the filmless autoradiography system. A standard curvemade to calculate the specific activity is shown (upper left).
2272 Rubio et al.
by guest on August 31, 2014
http://jxb.oxfordjournals.org/D
ownloaded from
solution by five blocks) were arranged following a completelyrandomized block design. For each plant, results from several (2–8)units of each root class were averaged. Repeated-measures ANOVAand regression analysis were performed using SYSTAT v. 8.0 (SPSSInc., Evanston, IL, USA).
Results
Accuracy of filmless autoradiography
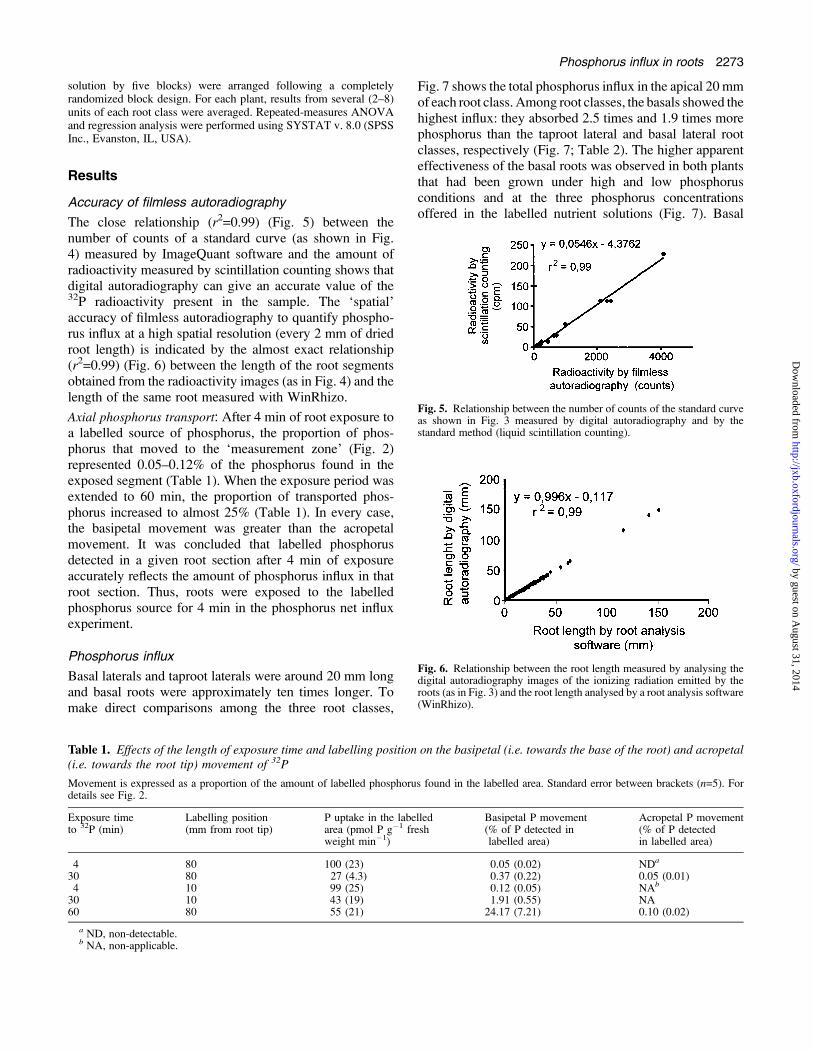
The close relationship (r2=0.99) (Fig. 5) between thenumber of counts of a standard curve (as shown in Fig.4) measured by ImageQuant software and the amount ofradioactivity measured by scintillation counting shows thatdigital autoradiography can give an accurate value of the32P radioactivity present in the sample. The ‘spatial’accuracy of filmless autoradiography to quantify phospho-rus influx at a high spatial resolution (every 2 mm of driedroot length) is indicated by the almost exact relationship(r2=0.99) (Fig. 6) between the length of the root segmentsobtained from the radioactivity images (as in Fig. 4) and thelength of the same root measured with WinRhizo.
Axial phosphorus transport: After 4 min of root exposure toa labelled source of phosphorus, the proportion of phos-phorus that moved to the ‘measurement zone’ (Fig. 2)represented 0.05–0.12% of the phosphorus found in theexposed segment (Table 1). When the exposure period wasextended to 60 min, the proportion of transported phos-phorus increased to almost 25% (Table 1). In every case,the basipetal movement was greater than the acropetalmovement. It was concluded that labelled phosphorusdetected in a given root section after 4 min of exposureaccurately reflects the amount of phosphorus influx in thatroot section. Thus, roots were exposed to the labelledphosphorus source for 4 min in the phosphorus net influxexperiment.
Phosphorus influx
Basal laterals and taproot laterals were around 20 mm longand basal roots were approximately ten times longer. Tomake direct comparisons among the three root classes,
Fig. 7 shows the total phosphorus influx in the apical 20 mmof each root class. Among root classes, the basals showed thehighest influx: they absorbed 2.5 times and 1.9 times morephosphorus than the taproot lateral and basal lateral rootclasses, respectively (Fig. 7; Table 2). The higher apparenteffectiveness of the basal roots was observed in both plantsthat had been grown under high and low phosphorusconditions and at the three phosphorus concentrationsoffered in the labelled nutrient solutions (Fig. 7). Basal
Fig. 5. Relationship between the number of counts of the standard curveas shown in Fig. 3 measured by digital autoradiography and by thestandard method (liquid scintillation counting).
Fig. 6. Relationship between the root length measured by analysing thedigital autoradiography images of the ionizing radiation emitted by theroots (as in Fig. 3) and the root length analysed by a root analysis software(WinRhizo).
Table 1. Effects of the length of exposure time and labelling position on the basipetal (i.e. towards the base of the root) and acropetal(i.e. towards the root tip) movement of 32P
Movement is expressed as a proportion of the amount of labelled phosphorus found in the labelled area. Standard error between brackets (n=5). Fordetails see Fig. 2.
Exposure timeto 32P (min)
Labelling position(mm from root tip)
P uptake in the labelledarea (pmol P g�1 freshweight min�1)
Basipetal P movement(% of P detected inlabelled area)
Acropetal P movement(% of P detectedin labelled area)
4 80 100 (23) 0.05 (0.02) NDa
30 80 27 (4.3) 0.37 (0.22) 0.05 (0.01)4 10 99 (25) 0.12 (0.05) NAb
30 10 43 (19) 1.91 (0.55) NA60 80 55 (21) 24.17 (7.21) 0.10 (0.02)
a ND, non-detectable.b NA, non-applicable.
Phosphorus influx in roots 2273
by guest on August 31, 2014
http://jxb.oxfordjournals.org/D
ownloaded from
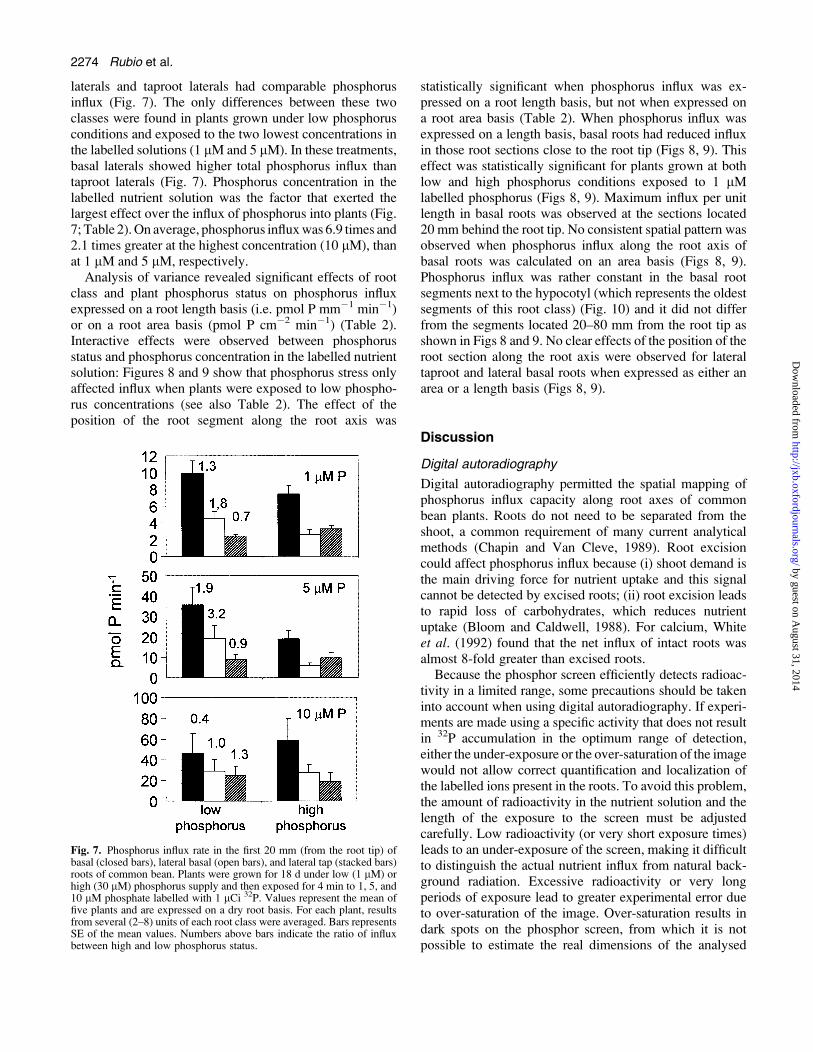
laterals and taproot laterals had comparable phosphorusinflux (Fig. 7). The only differences between these twoclasses were found in plants grown under low phosphorusconditions and exposed to the two lowest concentrations inthe labelled solutions (1 lM and 5 lM). In these treatments,basal laterals showed higher total phosphorus influx thantaproot laterals (Fig. 7). Phosphorus concentration in thelabelled nutrient solution was the factor that exerted thelargest effect over the influx of phosphorus into plants (Fig.7; Table 2).On average, phosphorus influxwas 6.9 times and2.1 times greater at the highest concentration (10 lM), thanat 1 lM and 5 lM, respectively.Analysis of variance revealed significant effects of root
class and plant phosphorus status on phosphorus influxexpressed on a root length basis (i.e. pmol P mm�1 min�1)or on a root area basis (pmol P cm�2 min�1) (Table 2).Interactive effects were observed between phosphorusstatus and phosphorus concentration in the labelled nutrientsolution: Figures 8 and 9 show that phosphorus stress onlyaffected influx when plants were exposed to low phospho-rus concentrations (see also Table 2). The effect of theposition of the root segment along the root axis was
statistically significant when phosphorus influx was ex-pressed on a root length basis, but not when expressed ona root area basis (Table 2). When phosphorus influx wasexpressed on a length basis, basal roots had reduced influxin those root sections close to the root tip (Figs 8, 9). Thiseffect was statistically significant for plants grown at bothlow and high phosphorus conditions exposed to 1 lMlabelled phosphorus (Figs 8, 9). Maximum influx per unitlength in basal roots was observed at the sections located20 mm behind the root tip. No consistent spatial pattern wasobserved when phosphorus influx along the root axis ofbasal roots was calculated on an area basis (Figs 8, 9).Phosphorus influx was rather constant in the basal rootsegments next to the hypocotyl (which represents the oldestsegments of this root class) (Fig. 10) and it did not differfrom the segments located 20–80 mm from the root tip asshown in Figs 8 and 9. No clear effects of the position of theroot section along the root axis were observed for lateraltaproot and lateral basal roots when expressed as either anarea or a length basis (Figs 8, 9).
Discussion
Digital autoradiography
Digital autoradiography permitted the spatial mapping ofphosphorus influx capacity along root axes of commonbean plants. Roots do not need to be separated from theshoot, a common requirement of many current analyticalmethods (Chapin and Van Cleve, 1989). Root excisioncould affect phosphorus influx because (i) shoot demand isthe main driving force for nutrient uptake and this signalcannot be detected by excised roots; (ii) root excision leadsto rapid loss of carbohydrates, which reduces nutrientuptake (Bloom and Caldwell, 1988). For calcium, Whiteet al. (1992) found that the net influx of intact roots wasalmost 8-fold greater than excised roots.
Because the phosphor screen efficiently detects radioac-tivity in a limited range, some precautions should be takeninto account when using digital autoradiography. If experi-ments are made using a specific activity that does not resultin 32P accumulation in the optimum range of detection,either the under-exposure or the over-saturation of the imagewould not allow correct quantification and localization ofthe labelled ions present in the roots. To avoid this problem,the amount of radioactivity in the nutrient solution and thelength of the exposure to the screen must be adjustedcarefully. Low radioactivity (or very short exposure times)leads to an under-exposure of the screen, making it difficultto distinguish the actual nutrient influx from natural back-ground radiation. Excessive radioactivity or very longperiods of exposure lead to greater experimental error dueto over-saturation of the image. Over-saturation results indark spots on the phosphor screen, from which it is notpossible to estimate the real dimensions of the analysed
Fig. 7. Phosphorus influx rate in the first 20 mm (from the root tip) ofbasal (closed bars), lateral basal (open bars), and lateral tap (stacked bars)roots of common bean. Plants were grown for 18 d under low (1 lM) orhigh (30 lM) phosphorus supply and then exposed for 4 min to 1, 5, and10 lM phosphate labelled with 1 lCi 32P. Values represent the mean offive plants and are expressed on a dry root basis. For each plant, resultsfrom several (2–8) units of each root class were averaged. Bars representsSE of the mean values. Numbers above bars indicate the ratio of influxbetween high and low phosphorus status.
2274 Rubio et al.
by guest on August 31, 2014
http://jxb.oxfordjournals.org/D
ownloaded from
segment of root. Preliminary experiments should be con-ducted before using this method in order to determine themost convenient combination of (i) the amount of radioac-tivity of the labelled solution, (ii) the length of the period ofcontact of the root with the labelled solution, and (iii) thelength of the period of exposure of the labelled root to thephosphor screen. In this case, 1 lCi in 100ml of 1–10 lMofKH2PO4, for 4 min, and 10 h, respectively, was used. Asa general rule, the time of exposure to the labelled solutionshould be long enough to allow nutrients to pass the freespace of the apoplasm and to reach the symplasm, and it
should be short enough to avoid the translocation of thenutrient to the adjacent root segment. To determine thelength of the absorption period, the length of the smallestsegment of root to be analysed must be taken into account.For example, if 2 mm of root is taken as the unit of analysis,the length of the absorption period should be short enough toavoid translocation of 32P through a distance of 2 mm. Fordetermining the velocity of translocation, simple experi-ments, like the contiguous chamber method described in thispaper, can bemade. The radioactivity of the nutrient solutionand the time of exposure to the phosphor screen should be
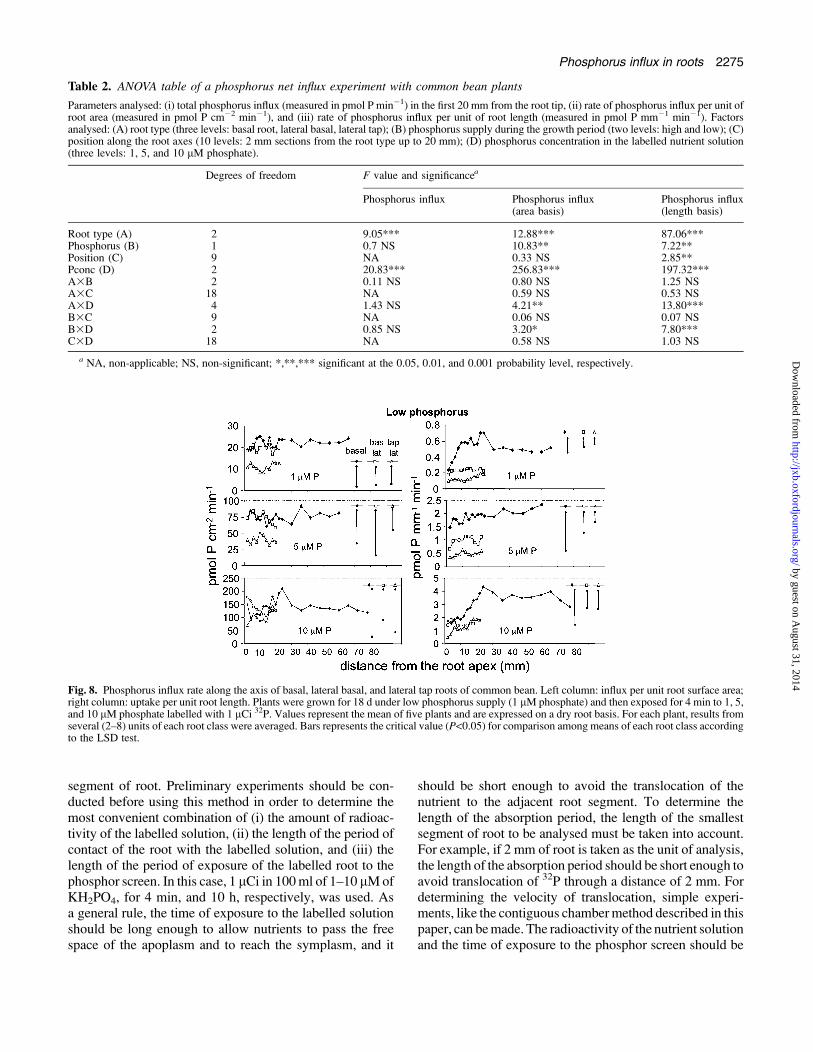
Fig. 8. Phosphorus influx rate along the axis of basal, lateral basal, and lateral tap roots of common bean. Left column: influx per unit root surface area;right column: uptake per unit root length. Plants were grown for 18 d under low phosphorus supply (1 lM phosphate) and then exposed for 4 min to 1, 5,and 10 lM phosphate labelled with 1 lCi 32P. Values represent the mean of five plants and are expressed on a dry root basis. For each plant, results fromseveral (2–8) units of each root class were averaged. Bars represents the critical value (P<0.05) for comparison among means of each root class accordingto the LSD test.
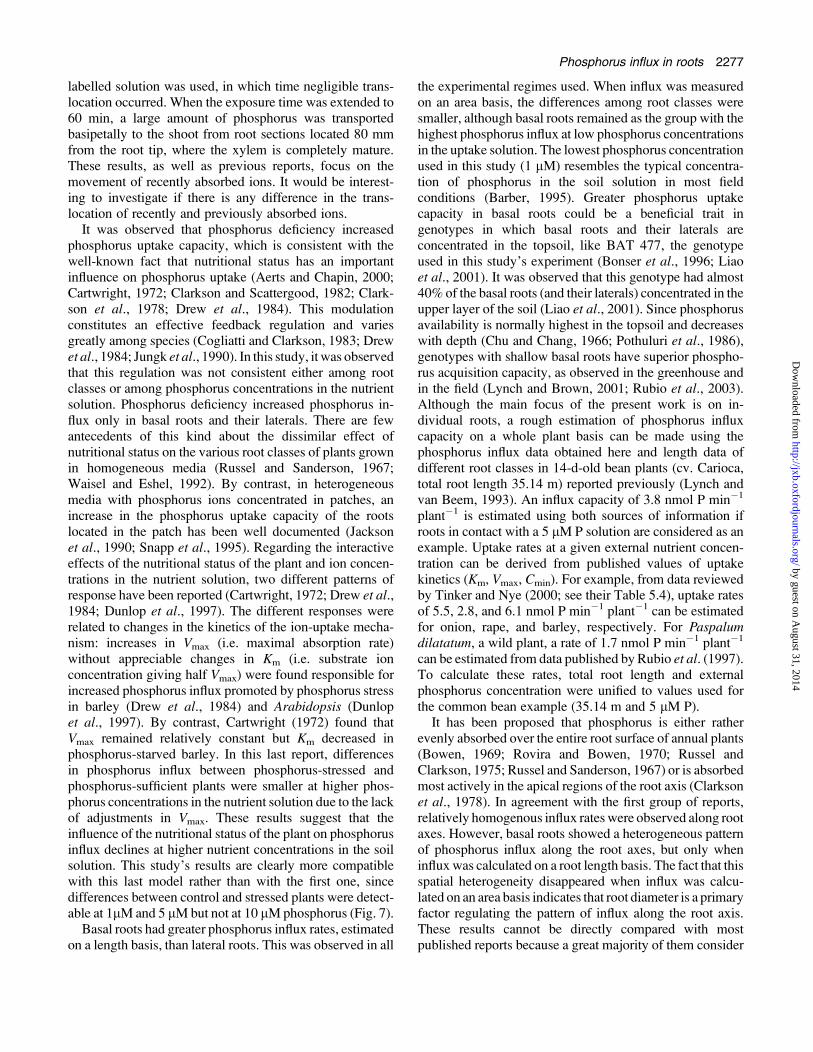
Table 2. ANOVA table of a phosphorus net influx experiment with common bean plants
Parameters analysed: (i) total phosphorus influx (measured in pmol P min�1) in the first 20 mm from the root tip, (ii) rate of phosphorus influx per unit ofroot area (measured in pmol P cm�2 min�1), and (iii) rate of phosphorus influx per unit of root length (measured in pmol P mm�1 min�1). Factorsanalysed: (A) root type (three levels: basal root, lateral basal, lateral tap); (B) phosphorus supply during the growth period (two levels: high and low); (C)position along the root axes (10 levels: 2 mm sections from the root type up to 20 mm); (D) phosphorus concentration in the labelled nutrient solution(three levels: 1, 5, and 10 lM phosphate).
Degrees of freedom F value and significancea
Phosphorus influx Phosphorus influx(area basis)
Phosphorus influx(length basis)
Root type (A) 2 9.05*** 12.88*** 87.06***Phosphorus (B) 1 0.7 NS 10.83** 7.22**Position (C) 9 NA 0.33 NS 2.85**Pconc (D) 2 20.83*** 256.83*** 197.32***A3B 2 0.11 NS 0.80 NS 1.25 NSA3C 18 NA 0.59 NS 0.53 NSA3D 4 1.43 NS 4.21** 13.80***B3C 9 NA 0.06 NS 0.07 NSB3D 2 0.85 NS 3.20* 7.80***C3D 18 NA 0.58 NS 1.03 NS
a NA, non-applicable; NS, non-significant; *,**,*** significant at the 0.05, 0.01, and 0.001 probability level, respectively.
Phosphorus influx in roots 2275
by guest on August 31, 2014
http://jxb.oxfordjournals.org/D
ownloaded from

adjusted simultaneously. The method described here couldbe useful for other radionuclides important in plant biology,including 33P, 45Ca, 35S, 14C, 3H, and 36Cl. The parametersof the method (mainly radioactivity and time of exposure)would have to be adjusted to the energetic characteristics ofeach radionuclide.
Phosphorus influx along the axis of different rootclasses of common bean
In the process of nutrient uptake, four different processesmust be distinguished: influx, storage, translocation, and
efflux. The last process is considered relevant only underconditions of low nutrient availability (Elliot et al., 1984;Jackson et al., 1976). Influx is associated with the activityof carriers, which has been characterized with classicenzyme kinetics (Epstein, 1972; see also Nissen, 1996).Storage is associated with the presence of cell vacuoles, andthus with root sections with some degree of maturation (Leeand Ratcliffe, 1993). Translocation also requires some levelof maturation, since it depends upon mature xylem andphloem elements. In this paper, to quantify influx indepen-dently of translocation, a 4-min exposure period to the
Fig. 9. Phosphorus influx rate along the axis of basal, lateral basal, and lateral tap roots of common bean. Left column: influx per unit root surface area;right column: uptake per unit root length. Plants were grown for 18 d under high phosphorus supply (30 lM phosphate) and then exposed for 4 min to 1,5, and 10 lM phosphate labelled with 1 lCi 32P. Values represent the mean of five plants and are expressed on a dry root basis. For each plant, resultsfrom several (2–8) units of each root class were averaged. Bars represents the critical value (P<0.05) for comparison among means of each root classaccording to the LSD test.
Fig. 10. Phosphorus influx rate along the axis of basal roots of common bean, starting from the base of the root (where the basal root is joined to the mainroot axis). Plants were grown for 18 d under low (1 lM, left column) or high (30 lM, right column) phosphorus supply and then exposed for 4 min to 1,5, and 10 lM phosphate labelled with 1 lCi 32P. Values represent the mean of five plants and are expressed on a dry root basis. For each plant, resultsfrom several (2–8) basal roots were averaged. Bars represents SE of the mean values.
2276 Rubio et al.
by guest on August 31, 2014
http://jxb.oxfordjournals.org/D
ownloaded from
labelled solution was used, in which time negligible trans-location occurred. When the exposure time was extended to60 min, a large amount of phosphorus was transportedbasipetally to the shoot from root sections located 80 mmfrom the root tip, where the xylem is completely mature.These results, as well as previous reports, focus on themovement of recently absorbed ions. It would be interest-ing to investigate if there is any difference in the trans-location of recently and previously absorbed ions.
It was observed that phosphorus deficiency increasedphosphorus uptake capacity, which is consistent with thewell-known fact that nutritional status has an importantinfluence on phosphorus uptake (Aerts and Chapin, 2000;Cartwright, 1972; Clarkson and Scattergood, 1982; Clark-son et al., 1978; Drew et al., 1984). This modulationconstitutes an effective feedback regulation and variesgreatly among species (Cogliatti and Clarkson, 1983; Drewet al., 1984; Jungk et al., 1990). In this study, it was observedthat this regulation was not consistent either among rootclasses or among phosphorus concentrations in the nutrientsolution. Phosphorus deficiency increased phosphorus in-flux only in basal roots and their laterals. There are fewantecedents of this kind about the dissimilar effect ofnutritional status on the various root classes of plants grownin homogeneous media (Russel and Sanderson, 1967;Waisel and Eshel, 1992). By contrast, in heterogeneousmedia with phosphorus ions concentrated in patches, anincrease in the phosphorus uptake capacity of the rootslocated in the patch has been well documented (Jacksonet al., 1990; Snapp et al., 1995). Regarding the interactiveeffects of the nutritional status of the plant and ion concen-trations in the nutrient solution, two different patterns ofresponse have been reported (Cartwright, 1972; Drew et al.,1984; Dunlop et al., 1997). The different responses wererelated to changes in the kinetics of the ion-uptake mecha-nism: increases in Vmax (i.e. maximal absorption rate)without appreciable changes in Km (i.e. substrate ionconcentration giving half Vmax) were found responsible forincreased phosphorus influx promoted by phosphorus stressin barley (Drew et al., 1984) and Arabidopsis (Dunlopet al., 1997). By contrast, Cartwright (1972) found thatVmax remained relatively constant but Km decreased inphosphorus-starved barley. In this last report, differencesin phosphorus influx between phosphorus-stressed andphosphorus-sufficient plants were smaller at higher phos-phorus concentrations in the nutrient solution due to the lackof adjustments in Vmax. These results suggest that theinfluence of the nutritional status of the plant on phosphorusinflux declines at higher nutrient concentrations in the soilsolution. This study’s results are clearly more compatiblewith this last model rather than with the first one, sincedifferences between control and stressed plants were detect-able at 1lMand 5 lMbut not at 10 lMphosphorus (Fig. 7).
Basal roots had greater phosphorus influx rates, estimatedon a length basis, than lateral roots. This was observed in all
the experimental regimes used. When influx was measuredon an area basis, the differences among root classes weresmaller, although basal roots remained as the group with thehighest phosphorus influx at low phosphorus concentrationsin the uptake solution. The lowest phosphorus concentrationused in this study (1 lM) resembles the typical concentra-tion of phosphorus in the soil solution in most fieldconditions (Barber, 1995). Greater phosphorus uptakecapacity in basal roots could be a beneficial trait ingenotypes in which basal roots and their laterals areconcentrated in the topsoil, like BAT 477, the genotypeused in this study’s experiment (Bonser et al., 1996; Liaoet al., 2001). It was observed that this genotype had almost40% of the basal roots (and their laterals) concentrated in theupper layer of the soil (Liao et al., 2001). Since phosphorusavailability is normally highest in the topsoil and decreaseswith depth (Chu and Chang, 1966; Pothuluri et al., 1986),genotypes with shallow basal roots have superior phospho-rus acquisition capacity, as observed in the greenhouse andin the field (Lynch and Brown, 2001; Rubio et al., 2003).Although the main focus of the present work is on in-dividual roots, a rough estimation of phosphorus influxcapacity on a whole plant basis can be made using thephosphorus influx data obtained here and length data ofdifferent root classes in 14-d-old bean plants (cv. Carioca,total root length 35.14 m) reported previously (Lynch andvan Beem, 1993). An influx capacity of 3.8 nmol P min�1
plant�1 is estimated using both sources of information ifroots in contact with a 5 lM P solution are considered as anexample. Uptake rates at a given external nutrient concen-tration can be derived from published values of uptakekinetics (Km, Vmax, Cmin). For example, from data reviewedby Tinker and Nye (2000; see their Table 5.4), uptake ratesof 5.5, 2.8, and 6.1 nmol P min�1 plant�1 can be estimatedfor onion, rape, and barley, respectively. For Paspalumdilatatum, a wild plant, a rate of 1.7 nmol P min�1 plant�1
can be estimated from data published by Rubio et al. (1997).To calculate these rates, total root length and externalphosphorus concentration were unified to values used forthe common bean example (35.14 m and 5 lM P).
It has been proposed that phosphorus is either ratherevenly absorbed over the entire root surface of annual plants(Bowen, 1969; Rovira and Bowen, 1970; Russel andClarkson, 1975; Russel and Sanderson, 1967) or is absorbedmost actively in the apical regions of the root axis (Clarksonet al., 1978). In agreement with the first group of reports,relatively homogenous influx rateswere observed along rootaxes. However, basal roots showed a heterogeneous patternof phosphorus influx along the root axes, but only wheninfluxwas calculated on a root length basis. The fact that thisspatial heterogeneity disappeared when influx was calcu-lated on an area basis indicates that root diameter is a primaryfactor regulating the pattern of influx along the root axis.These results cannot be directly compared with mostpublished reports because a great majority of them consider
Phosphorus influx in roots 2277
by guest on August 31, 2014
http://jxb.oxfordjournals.org/D
ownloaded from
longer periods of exposure to the labelled source, commonlymore than 20 min and up to 24 h in some cases (Clarksonet al., 1978). As noted above, in such a period of time, notonly influx but also translocation processes are responsiblefor the pattern of phosphorus localization in different rootsections. Experiments with long periods of exposure arereliable indicators of all the processes involved in nutrientacquisition acting in conjunction and of the capacity of thedifferent root sections to export phosphorus from the root tothe shoot. However, they are not appropriate for distinguish-ing the spatial pattern of phosphorus influx. In this study’sresults, root diameter variations along the root axis accoun-ted for the differences in influx per unit length, since no largedifferences were found when the results were expressed asper unit surface area. A similar tendency was observed byRussel and Sanderson (1967), who analysed phosphoruslocalization in the root axis after 24 h exposure to a labelledsource. The substantial homogeneity in the pattern ofphosphorus influx detected along the root axis expressedin this way could be related to the fact that the plants in thisstudy were all young (18 d) and all their roots were activelygrowing. It is interesting to note, however, that no substantialdifferences were found in the influx between the vicinity ofthe apex and the vicinity of the base of the basal roots.Considering that the basal roots emerge from the hypocotyl3–4 d after germination, the age difference between the tipand the base of the basal roots of the plants was approxi-mately 2 weeks. By contrast, in maize, Gao et al. (1998)observed a sharp decrease in the phosphorus uptake capacitybetween the 5th and the 10th day of root growth, while olderroots showed a more gradual decline. The results of thisstudy are consistent with recent findings showing thatphosphorus carriers are present in all parts of the rootsystem, in spite of the anatomical dissimilarities and levels ofmaturation of the different sections (Muchhal and Ragho-thama, 1999). In the field, the actual pattern of phosphorusinflux in the root system will result from the interplay ofphosphorus influx capacity with the spatial pattern of soilphosphorus availability. In this context, Figs 7, 8, and 9 areillustrative of the large dependence of phosphorus influx onthe phosphorus concentration in the soil solution. It can beexpected that the newest segments of the root system (thoseclose to the apex) in the field will face soil domains richer inphosphorus than the oldest ones, which experience a rhizo-sphere already depleted of phosphorus.
Conclusions
The method described in this paper offers a convenientprotocol to study phosphorus influx into roots. The methoduses digital autoradiography to visualize and quantifyphosphorus influx into intact root systems. It permitsaccurate quantification of the spatial pattern of phosphorusinflux. Following the protocol described here, maps ofnutrient net influx capacity and nutrient kinetic parameters
can be obtained and applied to the study of a broad range ofissues. This information may assist in the construction ofmodels of nutrient uptake by indicating that, for youngplants, it is reasonable to assume a constant phosphorusinflux along the root system but differences among rootclasses must be taken into account.
Acknowledgements
We acknowledge support from USDA/NRI grant 9900632 and NSFgrant IBN-0135872 to JPL and KM Brown. We thank Robert HSnyder for his technical assistance and Robert T Simpson forpermitting access to his laboratory facilities.
Appendix
Example of calculations of phosphorus influx for an individual
segment of root
Individual: plant no. 56Root type: basal rootRoot segment analysed: 0–2 mm (from root tip)Phosphorus treatment: HighConcentration of uptake solution: 1 lM PRadioactivity of the uptake solution: 7573 cpm ml�1 (measured byscintillation counting).Volume of the uptake solution: 180 mlTotal radioactivity: 75733180=1 363 140 cpm in 180 mlPlant no. 56 was assigned to 1 lM P, hence in a volume of 180 mlthere is 0.18 lmol PSpecific activity is the cpm of 32P lmol�1 P: 1 363 140/0.18=7 573000 cpm lmol�1 PPimager measurement of basal root no. 56 at 0–2 mm: 441.2 countsTransformation of Pimager counts to cpm by standard curvecalibration (this calibration is made for each group of roots as shownin Fig. 4):For plant no. 56: cpm=0.0233Pimager counts–0.29;since counts=441.2, then cpm=9.857Transformation from radioactivity (cpm) to lmol phosphorus byspecific activity:9.857 cpm/7 573 000 cpm lmol�1 P=1.29310�6 lmol Plmol P in the first 2 mm: 1.29310�6 lmol PTime of exposure to nutrient solution: 4 minP influx per min=1.29310�6/4P influx rate: 3.23310�7 lmol P mm�1 min �1
P influx rate: 0.323 pmol P mm�1 min �1
References
Aerts R, Chapin III FS. 2000. The mineral nutrition of wild plantsrevisited: a re-evaluation of processes and patterns. Advances inEcological Research 30, 1–67.
Aguirrezabal LAN, Pellerin S, Tardieu F. 1993. Carbon nutrition,root branching and elongation: can the present state of knowledgeallow a predictive approach at whole-plant level? Enviromentaland Experimental Botany 33, 121–130.
Barber S. 1995. Soil nutrient bioavailability: a mechanistic ap-proach. New York: J Wiley and Sons.
Bar-Yosef B, Kafkaki U, Bresler E. 1972. Uptake of phosphorusby plants growing under field conditions. I. Theoretical modeland experimental determination of parameters. Soil Science 36,783–800.
2278 Rubio et al.
by guest on August 31, 2014
http://jxb.oxfordjournals.org/D
ownloaded from
Bloom A, Caldwell RM. 1988. Root excision decreases nutrientabsorption and gas fluxes. Plant Physiology 87, 794–796.
Bonser AM, Lynch JP, Snapp S. 1996. Effect of phosphorusdeficiency on growth angle of basal roots in Phaseolus vulgaris.New Phytologist 132, 281–288.
Bowen GD. 1969. The uptake of orthophosphate and its incorpora-tion into organic phosphates along roots of Pinus radiata.Australian Journal of Biological Science 22, 1125–1135.
Burley J, Nwoke FIO, Leister G, Popham R. 1970. The relation-ship of xylem maturation to the absorption and translocation of P.American Journal of Botany 57, 504–511.
Cartwright B. 1972. The effect of phosphate deficiency on thekinetics of phosphate absorption by sterile excised barley roots,and some factors affecting the ion uptake deficiency. Soil Scienceand Plant Analysis 3, 313–322.
Chapin III FS, Van Cleve K. 1989. Approaches to studying nutrientuptake, use and loss in plants. In: Pearcy RW, Ehleringer J,Mooney HA, Rundel PW. Plant physiological ecology: fieldmethods and instrumentation. London: Chapman and Hall,185–207.
Chu WK, Chang SC. 1966. Surface activity of inorganic soilphosphorus. Soil Science 101, 459–464.
Clarkson DT. 1996. Root structure and sites of ion uptake. In: WaiselY, Eshel A, Kafkafi U, eds. Plant roots, the hidden half. NewYork: Marcel Dekker Inc, 483–510.
Clarkson DT, Sanderson J, Scattergood CB. 1978. Influence ofphosphate-stress and phosphate absorption and translocation byvarious parts of the root system of Hordeum vulgare L. (barley).Planta 139, 47–53.
Clarkson DT, Scattergood CB. 1982. Growth and phosphatetransport in barley and tomato plants during the development of,and recovery from, phosphate stress. Journal of ExperimentalBotany 33, 865–875.
Cogliatti DH, Clarkson DT. 1983. Physiological changes in, andphosphate uptake by potato plants during development of, andrecovery from phosphate deficiency. Physiologia Plantarum 58,287–294.
Colmer TD, Bloom AJ. 1998. A comparison of net NH+4 and NO�
3
fluxes along roots of rice and maize. Plant, Cell and Environment21, 240–246.
Drew MC, Saker LR, Barber SA, Jenkins W. 1984. Changes inthe kinetics of phosphate and potassium absorption in nutrient-deficient barley roots measured by a solution-depletion technique.Planta 160, 490–499.
Dunlop J, Phung HT, Meeking R, White DWR. 1997. The kineticsassociated with phosphate absorption by Arabidopsis and itsregulation by phosphorus status. Australian Journal of PlantPhysiology 24, 623–629.
Elliot G, Lynch JP, Lauchli A. 1984. Influx and efflux of P in rootsof intact maize plants. Double labeling with 32P and 33P. PlantPhysiology 76, 336–341.
Epstein E. 1972. Mineral nutrition of plants: principles andperspectives. New York: Wiley.
Epstein E, Schmid WE, Rains DW. 1963. Significance andtechnique of short-term experiments on solute absorption by planttissue. Plant and Cell Physiology 4, 79–84.
Eshel A, Waisel Y. 1996. Multiform and multifunction of variousconstituents of one root system. In: Waisel Y, Eshel A, Kafkafi U,eds. Plant roots, the hidden half. New York: Marcel Dekker Inc,175–192.
Ferguson IB, Clarkson DT. 1976. Ion uptake in relation to thedevelopment of a root hypodermis. New Phytologist 77, 11–14.
Fitter A. 1991. The ecological significance of root system architec-ture. In: Atkinson D, ed. Plant root growth. an ecologicalperspective. Oxford: Blackwell Scientific Publications, 229–246.
Gao S, Pan WL, Koenig RT. 1998. Integrated root system age inrelation to plant nutrient uptake activity. Agronomy Journal 90,505–510.
Henriksen GH, Bloom AJ, Spanswick RM. 1990. Measurement ofnet fluxes of ammonium and nitrate at the surface of barley rootsusing ion-selective microelecrodes. Plant Physiology 93,271–280.
Holobrada M. 1977. Changes in sulphate uptake and accumulationalong the primary root during tissue differentiation. BiologiaPlantarum 19, 331–337.
Jackson RB, Manwaring JH, Caldwell MM. 1990. Rapid phys-iological adjustment of roots to localized soil enrichment. Nature344, 58–60.
Jackson W, Kwik KD, Volk RJ, Butz RG. 1976. Nitrate influx andefflux by intact wheat seedlings: effects of prior nitrate nutrition.Planta 132, 149–156.
Jungk A. 1987. Soil–root interactions in the rhizosphere affectingplant availability of phosphorus. Journal of Plant Nutrition 10,1197–1204.
Jungk A, Asher CJ, Edwards DG, Meyer D. 1990. Influence ofphosphate on phosphate uptake kinetics of maize (Zea mays) andsoybean (Glycine max). Plant and Soil 124, 175–182.
Kochian LV, Shaff JE, Kuhtreiber WM, Jaffe LF, Lucas WJ.1992. Use of an extracellular, ion-selective, vibrating microelec-trode system for the quantification of K+, H+ and Ca2+ fluxes inmaize roots and maize suspension cells. Planta 188, 601–610.
Krauss M, Fusseder A, Beck E. 1987. Development and replen-ishment of the P-depletion zone around the primary root of maizeduring the vegetation period. Plant and Soil 101, 247–255.
Lee RB, Ratcliffe RG. 1993. Subcellular distribution of inorganicphosphate, and levels of nucleoside triphosphate, in mature maizeroots at low external phosphate concentration: measurement with31P-NMR. Journal of Experimental Botany 44, 587–598.
Liao H, Rubio G, Yan X, Cao A, Brown KM, Lynch JP. 2001.Effect of phosphorus availability on basal root shallowness incommon bean. Plant and Soil 232, 69–79.
Lynch JP. 1995. Root architecture and plant productivity. PlantPhysiology 95, 7–13.
Lynch JP, Brown K. 2001. Topsoil foraging—an architecturaladaptation of plants to low phosphorus availability. Plant andSoil 237, 225–237.
Lynch JP, Epstein E, Lauchli A, Weigt GI. 1990. An automatedgreenhouse sand culture system suitable for studies of P nutrition.Plant, Cell and Environment 13, 547–554.
Lynch JP, Nielsen KL. 1996. Simulation of root system architecture.In: Waisel Y, Eshel A, Kafkafi U, eds. Plant roots, the hidden half.New York: Marcel Dekker Inc, 247–257.
Lynch JP, van Beem JJ. 1993. Growth and architecture ofseedling roots of common bean genotypes. Crop Science 33,1253–1257.
McNaughton S, Chapin III FS. 1985. Effect of phosphorusnutrition and defoliaton on C4 graminoids from the Serengetiplains. Ecology 66, 1617–1629.
Moran CJ, Pierret A, Stevenson AW. 2000. X-ray absorption andphase contrast imaging to study the interplay between plant rootsand soil structure. Plant and Soil 223, 101–117.
Muchhal U, Raghothama KG. 1999. Transcriptional regulation ofplant phosphate transporter. Proceedings of the National Academyof Sciences, USA 96, 5868–5872.
Newman IA, Kochian LV, Grusak M, Lucas WJ. 1987. Fluxes ofH+ and K in corn roots: characterization and stoichiometries usingion-selective microelecrodes. Plant Physiology 84, 1177–1184.
Nielsen JS, Joner EJ, Declerck S, Olsson, S, Jakobsen I. 2002.Phospho-imaging as a tool for visualization and noninvasive
Phosphorus influx in roots 2279
by guest on August 31, 2014
http://jxb.oxfordjournals.org/D
ownloaded from
measurement of P transport dynamics in arbuscular mycorrhizas.New Phytologist 154, 809–819.
Nissen P. 1996. Uptake mechanisms In: Waisel Y, Eshel A, KafkafiU, eds. Plant roots, the hidden half. New York: Marcel DekkerInc, 511–527.
Owusu-Bennoah E, Wild A. 1979. Autoradiography of the de-pletion zone of phosphate around onion roots in the presence ofvesicular-arbuscular mycorrhiza Glomus mosseae. New Phytolo-gist 82, 133–140.
Pothuluri JV, Kissel DE, Whitney DA, Thien SJ. 1986. Phospho-rus uptake from soil layers having different soil test phosphoruslevels. Agronomy Journal 78, 991–994.
Prevot P, Steward FC. 1936. Salient features of the root systemrelative to the problem of salt absorption. Plant Physiology 11,509–534.
Rovira AD, Bowen CD. 1970. Translocation and loss of phosphatealong roots of wheat seedlings. Planta 93, 15–25.
Rubio G, Liao H, Yan X, Lynch JP. 2003. Topsoil foraging and itsrole in plant competitiveness for phosphorus in common bean.Crop Science 43, 598–607.
Rubio G, Oesterheld M, Alvarez CR, Lavado RS. 1997. Mech-anisms for the increase in phosphorus uptake of waterloggedplants: soil phosphorus availability, root morphology and uptakekinetics. Oecologia 112, 150–155.
Rubio G, Walk T, Ge Z, Yan X, Liao H, Lynch JP. 2001.Root gravitropism and belowground competition among neigh-boring plants: a modeling approach. Annals of Botany 88,929–940.
Russel RS, Clarkson DT. 1975. Ion transport in root systems. In:Sunderland N, ed. Perspectives in experimental biology, Vol. 2.Oxford: Pergamon Press, 401–411.
Russel RS, Sanderson J. 1967. Nutrient uptake by different partsof the intact roots of plants. Journal of Experimental Botany 18,491–508.
Singh SP, Gepts P, Debouck DG. 1991. Races of common bean(Phaseolus vulgaris, Fabacea). Economic Botany 45, 379–396.
Silberbush M. 1996. Simulation of ion uptake from the soil. In:Waisel Y, Eshel A, Kafkafi U, eds. Plant roots, the hidden half.New York: Marcel Dekker Inc, 643–658.
Smethurst PJ, Comerford NB. 1993. Simulating nutrient uptake bysingle or competing and contrasting root systems. Soil ScienceSociety of America Journal 57, 1361–1367.
Snapp SS, Koide R, Lynch JP. 1995. Exploitation of localizedphosphorus patches by common bean roots. Plant and Soil 177,211–218.
Snapp SS, Lynch JP. 1996. Phosphorus distribution and remobili-zation in bean plants as influenced by phosphorus nutrition. CropScience 36, 929–935.
Tinker PB, Nye PH. 2000. Solute movement in the rhizosphere.New York: Oxford University Press.
Waisel Y, Eshel A. 1992. Differences in ion uptake among roots ofvarious types. Journal of Plant Nutrition 15, 945–958.
Wanke M, Ciereszko I, Podbielkowska M, Rychter AM. 1998.Response to phosphate deficiency in bean (Phaseolus vulgaris L.)roots. Respiratory metabolism, sugar localization and changes inultrastructure of bean root cells. Annals of Botany 82, 809–819.
White P, Banfield J, Diaz M. 1992. Unidirectional Ca2+ fluxes inroots of rye (Secale cereale L.): a comparison of excised rootswith roots of intact plants Journal of Experimental Botany 43,1061–1074.
Yeung EC. 1984. Autoradiography. In: Vasil IK, ed. Cell culture andsomatic cell genetic of plants. Orlando: Academic Press, 778–784.
2280 Rubio et al.
by guest on August 31, 2014
http://jxb.oxfordjournals.org/D
ownloaded from