The value of measurement in research practice: Evaluating ICT training in education.
14
1 The value of measurement in research practice: Evaluating ICT training in education Francesca Fanni 1 Izak van Zyl 1 Isabella Rega 1 and Lorenzo Cantoni 1 1 New Media in Education Laboratory (NewMinE Lab), Università della Svizzera italiana, Lugano, Switzerland Abstract: This paper presents challenges and trends emerging from an on-going project, named MELISSA – Measuring E-Learning Impact in primary Schools in South African disadvantaged areas). MELISSA measures the impact of exposure to ICTs in teacher training and learning. The intention is here to understand and analyse changes in attitudes to and uses of ICTs. To accomplish this goal, the MELISSA team applied a mixed investigative approach, merging quantitative and qualitative methodologies. This paper intends to offer an evaluation of the respective (blended) approaches. Although the project is not yet completed, preliminary data will be extracted to demonstrate the feasibility of both quantitative and qualitative analyses. It is hoped that more light will be shed on the question of whether measurement is an effective means of gaining project insight. It may be examined if both approaches (methodologies) are necessary and mutual counterparts to one another. Ultimately, this paper will describe a critical approach to measuring e-learning impact in disadvantaged contexts; one that may advance a better understanding of qualitative versus quantitative measurements. Keywords: Education, ICT, Training, Measurement, Quantitative, Qualitative Introduction This paper presents challenges and trends emerging from an on-going project, named MELISSA – Measuring E-Learning Impact in primary Schools in South African disadvantaged areas. This is a joint research initiative funded by SER – Swiss Secretariat for Education and Research – involving the Università della Svizzera italiana in Switzerland, and the University of Cape Town and the Cape Peninsula University of Technology in South Africa. The aim of this three-year programme (2009-2011) is to measure the impact of ICT teacher training modules on primary school teachers working in disadvantaged areas in the Western Cape, South Africa. Specifically, MELISSA measures the impact of exposure to ICTs in teacher training/learning. The goal is here to understand and analyse changes in teachers‟ attitudes to and uses of ICTs. To accomplish this goal, the MELISSA team applied a mixed investigative approach, merging quantitative and qualitative methodologies using the Self-Efficacy theoretical framework. In particular, impact is investigated in terms of if and how teachers‟ perceptions as effective educators change as they become more confident in ICTs, hence studying the relationship between Computer and Teacher Self-Efficacy (CSE/TSE). A training programme, delivered twice during the three years project, was designed to introduce educators to ICT practices, exploring the incorporation of ICTs in their teaching activities. For this purpose, a semi-experimental setting was designed: among the 110 primary school teachers attending the course, 42 teachers were randomly assigned to an experimental group, and received training (referred to throughout as “Group A”); whilst 68 teachers were assigned to a control group, which initially did not receive training (referred to throughout as “Group B”). In light of the above, this paper intends to offer an evaluation of the respective (blended) methodologies. Although the project is not yet completed, preliminary data will be extracted to demonstrate the feasibility of both quantitative and qualitative analyses. It is hoped that more light will be shed on the question of whether measurement is an effective means of gaining project insight. At this stage, it may be examined if both approaches (methodologies)
Transcript of The value of measurement in research practice: Evaluating ICT training in education.

1
The value of measurement in research practice:
Evaluating ICT training in education
Francesca Fanni1 Izak van Zyl
1 Isabella Rega
1 and Lorenzo Cantoni
1
1 New Media in Education Laboratory (NewMinE Lab), Università della Svizzera italiana, Lugano, Switzerland
Abstract: This paper presents challenges and trends emerging from an on-going project, named
MELISSA – Measuring E-Learning Impact in primary Schools in South African disadvantaged
areas). MELISSA measures the impact of exposure to ICTs in teacher training and learning. The
intention is here to understand and analyse changes in attitudes to and uses of ICTs. To
accomplish this goal, the MELISSA team applied a mixed investigative approach, merging
quantitative and qualitative methodologies. This paper intends to offer an evaluation of the
respective (blended) approaches. Although the project is not yet completed, preliminary data
will be extracted to demonstrate the feasibility of both quantitative and qualitative analyses. It is
hoped that more light will be shed on the question of whether measurement is an effective
means of gaining project insight. It may be examined if both approaches (methodologies) are
necessary and mutual counterparts to one another. Ultimately, this paper will describe a critical
approach to measuring e-learning impact in disadvantaged contexts; one that may advance a
better understanding of qualitative versus quantitative measurements.
Keywords: Education, ICT, Training, Measurement, Quantitative, Qualitative
Introduction
This paper presents challenges and trends emerging from an on-going project, named
MELISSA – Measuring E-Learning Impact in primary Schools in South African
disadvantaged areas. This is a joint research initiative funded by SER – Swiss Secretariat for
Education and Research – involving the Università della Svizzera italiana in Switzerland, and
the University of Cape Town and the Cape Peninsula University of Technology in South
Africa. The aim of this three-year programme (2009-2011) is to measure the impact of ICT
teacher training modules on primary school teachers working in disadvantaged areas in the
Western Cape, South Africa.
Specifically, MELISSA measures the impact of exposure to ICTs in teacher training/learning.
The goal is here to understand and analyse changes in teachers‟ attitudes to and uses of ICTs.
To accomplish this goal, the MELISSA team applied a mixed investigative approach, merging
quantitative and qualitative methodologies using the Self-Efficacy theoretical framework. In
particular, impact is investigated in terms of if and how teachers‟ perceptions as effective
educators change as they become more confident in ICTs, hence studying the relationship
between Computer and Teacher Self-Efficacy (CSE/TSE).
A training programme, delivered twice during the three years project, was designed to
introduce educators to ICT practices, exploring the incorporation of ICTs in their teaching
activities. For this purpose, a semi-experimental setting was designed: among the 110 primary
school teachers attending the course, 42 teachers were randomly assigned to an experimental
group, and received training (referred to throughout as “Group A”); whilst 68 teachers were
assigned to a control group, which initially did not receive training (referred to throughout as
“Group B”).
In light of the above, this paper intends to offer an evaluation of the respective (blended)
methodologies. Although the project is not yet completed, preliminary data will be extracted
to demonstrate the feasibility of both quantitative and qualitative analyses. It is hoped that
more light will be shed on the question of whether measurement is an effective means of
gaining project insight. At this stage, it may be examined if both approaches (methodologies)

2
are necessary and mutual counterparts to one another. Ultimately, this paper will describe a
critical approach to measuring e-learning impact in disadvantaged contexts; one that may
advance a better understanding of combined qualitative and quantitative measurements.
Objectives
This paper has the primary objective to describe the use of a blended approach in analysing
the impact of ICTs in education. This approach integrates quantitative (based on questionnaire
data) and qualitative (based on interview data) measurements both in terms of the Self-
Efficacy construct (to be described below). Whilst it is recognised that each methodology
offers particular strengths (and weaknesses), it is the aim of this paper to show how each may
complement the other, to reach a better understanding of the phenomena at stake. This will be
achieved by first describing the data sets each has yielded. These will subsequently be
compared and, where possible, balanced in terms of their perceived usefulness. The overall
objective would then be to determine whether each approach may have a significant role in
relation to the other, in the context of impact research. In this regard, the impetus and
necessity of measurement will be more closely examined.
Methodology
Theoretical Framework
Albert Bandura (1995) defines the term „Self-Efficacy‟ as:
People’s judgment of their capabilities to organize and execute courses of action
required to attain designated types of performances.
Bandura identifies four main sources of influence on Self-Efficacy: mastery experiences,
vicarious experiences, social persuasion, and emotional states.
Mastery experiences are the most effective means of creating a sense of Self-
Efficacy. These in fact represent the memories of past successful experiences that
individuals may revert to while facing current or future situations. Positive
mastery experiences reinforce Self-Efficacy, while negative mastery experiences
weaken it.
Vicarious experiences emanate from the observation of peers or “models”: a
process of comparing oneself to other individuals. Seeing these models succeed
may increase the observer‟s Self-Efficacy, while seeing them fail may weaken
Self-Efficacy. This process is intensified if the observer regards him- or herself as
similar to the model.
Social persuasion represents positive (verbal) reinforcement. It is possible here
that one‟s Self-Efficacy may increase if encouraged or motivated by others.
Despite social persuasions being less powerful than mastery experiences, they may
yet exert a strong influence on self-belief.
Emotional states (psychological factors) represent the final source of Self-
Efficacy. Individuals often consider that their skills are (strictly) related to the way
they feel in a particular moment, where a state of stress or tension may be an
indication of failure. Individuals with a high sense of Self-Efficacy may employ
these kinds of emotional states to improve their performance. Those individuals
with a low(er) sense of Self-Efficacy consider these states as a negative influence
on the activities they are engaged in. (Bandura, 1977)

3
The Self-Efficacy construct has been applied in this project to two specific contexts: the use
of ICT (Computer Self-Efficacy – CSE) and teaching activity (Teacher Self-Efficacy – TSE).
CSE represents “an individual perception of his or her ability to use computers in the
accomplishment of a task” (Compeau & Higgins, 1995), while TSE can be defined as a
teacher‟s:
Judgment of his or her capabilities to bring about desired outcomes of student
engagement and learning, even among those students who may be difficult or
unmotivated (Bandura, 1995).
In this paper we propose an integrated approach, where we first measure CSE and TSE and
their correlation quantitatively. Secondly we will attempt to shed more light on quantitative
data by evaluating the two most powerful sources (see Bandura, 1984; Brand & Wilkins,
2007) of Self-Efficacy (mastery experience and vicarious experience) through a qualitative
approach (semi-structured interviews).
CSE and TSE: a quantitative approach
In order to measure the impact of ICT on teacher practices, a questionnaire was designed to
evaluate Computer and Teacher Self-Efficacy and their changes (if any) along the project in
both Group A and Group B. The part on Computer Self-Efficacy is based on the questionnaire
proposed by Compeau and Higgins (1995). This contains 10 sections that refer to the use of
software in a given educational context; for each item a Likert scale (1 to 10) is provided,
where 1 is “not at all confident” and 10 is “totally confident”. The 10 sections will be repeated
for all the technologies presented in the curriculum.
For Teacher Self-Efficacy, the Teacher‟s Sense of Efficacy Scale proposed by Tschannen-
Moran and Wolfolk Hoy (2001) has been adopted. In this scale, 12 sections – divided into 3
categories with 4 items each: “student engagement”, “instructional strategies” and “classroom
management” – refer to different aspects of the teaching activity; for each question a Likert
scale (1 to 9) is provided, where 1 is “nothing” and 9 is “a great deal”. Teachers were required
to answer these questions by indicating how much they would feel able to accomplish given
teaching activities.
The questionnaire was provided to respondents four times, at the beginning, in the middle, at
the end, and 6 months after the end of the course (follow-up); at the time of writing this paper
only the first three measurements were available and could be considered.
CSE and TSE: a qualitative approach
The qualitative research design incorporated semi-structured interviews and (participant)
observation components, of which only the interview data are presented in this paper. These
are some of the foundational elements to qualitative approaches (Babbie & Mouton, 2004;
Bernard, 2002; Madden, 2010; Rega & Van Zyl, 2011). Interviewees out of both group A and
B were selected, which represented a 25% sample of 110 teachers. Group B consisted of
teachers that have not yet undergone MELISSA training, opposed to Group A that was in the
final phase (third trimesters) of the training. Respondents were probed on their attitudes
toward using ICT in their professional environments. Moreover, respondents were queried
around their perceptions of ICTs, also relating to those of their colleagues, students, student
parents, and the school management body (Rega & Van Zyl, 2011). Interviews with Group A
took place between February and April 2010, whilst interviews with Group B took place
between June and August, 2010.

4
Respective data analysis was done on the standard basis of content evaluation:
On the most general level content analysis is ‘any technique for making inferences by
objectively and systematically identifying specified characteristics of messages.
(Roller, Mathes, and Eckert, 1995:167 cited in Babbie & Mouton, 2001:492)
ATLAS.ti was employed as computer-aided data analysis software. Interviews‟ transcripts
were imported in the program, and coded under four macro-categories: Positive Mastery
Experience, Negative Mastery Experience, Positive Vicarious Experience, and Negative
Vicarious Experience. Each of these categories contains a subset that specifies the type of
experience (e.g. Administration, Technical Issues, Support, etc.). Incidences of subsets were
visually standardised as percentages (which will be discussed later). Furthermore, each
occurrence has been classified as Actual or Possible. Actual experiences are those accounts
which the respondent presents from memory as seemingly current or past actual experiences.
The research team also noted many references to “possible” experiences, where respondents
reflect on „ideational scenarios‟. That is, experiences that have not actually taken place, but
referenced nonetheless as possible (negative or positive) situations or outcomes.
Relationships and ambiguities were identified and mapped. It was ultimately determined
whether there was any correspondence in respondents‟ information segments. On the back of
this analysis, several inferences were made and will be presented throughout this text (Rega &
Van Zyl, 2011).
Context
In recent years, the South African Department of Education (DoE) has outlined information
and communication technologies (ICTs) as integral to modern education, especially in terms
of computer-assisted teaching (Fanni, Cantoni, Rega, Tardini, & Van Zyl, 2010). This has
spawned a renewed interest in distance education and technological learning in the national
B.Ed. degree programme, stipulated as part of The National Policy Framework for Teacher
Education and Development. Furthermore, it has become pertinent for the DoE to introduce
technological infrastructures within under-resourced schools, though mainly informed by a
draft national policy. The motivations for this are cited as a reduction in teacher-student
dependency, the alleviation of overcrowding, the increase of learning effectiveness, and the
overall improvement of education services (DoE, 2006). The foremost of the DoE‟s intentions
was manifest in a Western Cape provincial intervention, named Khanya.
The Khanya project
The Khanya project was initiated by the Western Cape Department of Education (WCED) in
2001 as a programme to equip schools in the province with ICT infrastructure. The aim here
was to support curriculum delivery through more effective (enhanced) teaching and learning
practices. The end objective for Khanya was to empower
every educator in every school of the Province…to use appropriate and available
technology to delivery curriculum to each and every learner in the province by 2012.
(Khanya, 2008, cited in Chigona, Bytheway, Bladergroen, Dumas, Cox, & Van Zyl)
According to its website, Khanya has to date provided technical infrastructure to 1339
schools, pending implementation in 133 schools (Khanya, 2011). It is likely, therefore, that
the project will reach its targets (Chigona et al., forthcoming).
However, despite Khanya‟s unwavering presence, some evidence suggests that the integration
of provided ICTs with teaching and learning practices has not been overly successful (ibid;

5
Davids, 2009; Chigona, Chigona, & Davids, 2010). Some of the foremost challenges include
a low student-computer ratio (the supposed added value of an „improved‟ – i.e. 1:1 – ratio has
been well-problematized by Dunleavy, Dexter, and Heinecke, 2007), high financial input
(especially regarding computer maintenance), limited technical support, and inadequate ICT
skills among educators.
ICT adoption
Those elements highlighted by the Khanya intervention bespeak the challenges in ICT
provision, not only in infrastructure, but also in terms of inherent social, economic, and
political dynamics. The level of technical skills is an additional factor that may impact on the
success of ICT interventions. Lower skill levels, coupled with lacking content management
skills and a diminished understanding of pedagogical issues, may contribute to varying ICT
adoption in (under-resourced) schools (Drent & Meelissen, 2008; Chigona et al., 2010;
Davids, 2009). Furthermore, it would appear that school management bodies in the Western
Cape did not effectively support the introduction of information technologies. This is
evidenced by the general lack of incentives for teachers, inconsistent computer lab schedules,
and inadequate directives (if at all) on ICT implementation (ibid).
Davids (2009) has described the feeling amongst educators that the present curriculum does
not mandate the use of ICT for learning delivery. By implication, the integration of ICT is not
perceived as overly important by the local DoE (Chigona et al., forthcoming). These
dynamics certainly do not bode well for the intention of promoting ICTs in schools, further
hampered by low technical skills among learners. In under-resourced communities, the
opportunity for learners to engage with ICTs is minimal, and seemingly limited to the school
itself. Therefore learners are not able to practice at home what they have learned in the
classroom. Ultimately, considerable time is spent in dealing with the use of technology, rather
than in teaching/learning the subject content. In these circumstances, it would seem that
educators (perhaps extended to management bodies) would rather avoid the technology
(Chigona et al., forthcoming).
In this context, it has become pertinent to evaluate the perception of technology in teaching
and learning. It is well known that infrastructural challenges play a role in hampering ICT
development and adoption. These barriers notwithstanding, the many social meanings and
representations that are attached to ICTs may also significantly alter the adoption process. It
may be critical, therefore, to find a more comprehensive means in solving the challenge of
technological integration in schools. This may hold certain prospects for Bandura‟s theory of
efficacy; are teachers (at least in self-perception) becoming better educators through
interacting with technology? Through its blended approach, the MELISSA project has
attempted to examine these concerns more closely; let us now turn to a description of the key
findings.
The MELISSA sample group
This study is being conducted with a group of primary school teachers working in
disadvantaged areas in the Western Cape Province, South Africa. At the beginning of the
project Group A was composed of 42 teachers working in two disadvantaged primary schools
in Cape Town (Rosmead and Zimasa), 85% of which are women. The majority of teachers are
31-40 years old with a college certificate as highest educational level. In average they have
been teaching for 18 years. They use the PC daily (46%), from schools (98%), in particular
for writing purposes. 56% possess a PC at home, but the majority (76%) are without an
internet connection. Teachers access the internet 2 or 3 times per week from schools, mainly
to search for information (72%) and for writing emails (52%) (Fanni et al., 2010). A recent
snapshot of Rosmead and Zimasa is provided below (adapted from Khanya, 2011):

6
68 teachers from four schools in disadvantaged areas in Cape Town (Vukukhanye, Blossom,
Thembani and Moshesh) compose Group B. This group‟s age range is between 41 and 50
years, with 72% of the group being women. The majority indicate a college certificate as
highest educational level and have been teaching for an average of 16 years. They use PCs
daily from schools, in particular to write texts. The majority of them do not possess PCs at
home. This datum differs from that of Group A, as well as the datum of access to internet:
21% of Group B accesses the internet less than once a month. They mostly access it from
their schools (87%) to search for information (89%) (Fanni et al., 2010). A recent snapshot of
the four Group B schools is provided below (adapted from Khanya, 2011):
Tables 1 & 2: Snapshots of participating schools in Group A
Tables 3 & 4: Snapshots of participating schools in Group B

7
July 2009 January 2010 May 2010
TSE 7.2 6.7 7
CSE 5.7 6.1 6.3
0
2
4
6
8
Group A
July 2009 January 2010
TSE 7.2 6.9
CSE 5.7 5.7
012345678
Group B
Evaluating ICT training in education
Quantitative Results
Results of the first three questionnaires (at the beginning, in the middle, and end of the
training) are proposed below. The first questionnaire (July 2009), reveals a CSE rate of 5.7
out of 10, and a TSE level of 7.2 out of 10. In this first survey, the two variables are not
significantly correlated (α=0.13**, R²=0.04). During the training, in January 2010, the trend
of the two variables remains statically the same (CSE=6.1, TSE=6.7, both with positive F-
Test), with no significant correlation (α=0.30*, R²=0.20). At the end of the training, in May
2010, the CSE rate increases to 6.3 out of 10 (negative F-Test); TSE rate, instead, remains
statistically unchanged (7 out of 10, positive F-Test). Also in May 2010, the variables appear
to have no significant correlation (α=0.16*, R²=0.97). The graph below shows the CSE and
TSE trend during the training course.
Figure 1: Teacher and Computer Self-Efficacy during the course – EG (data are
normalized to a 10 grade scale)
Results from the questionnaires of Group B illustrate that there are no changes both in CSE
and TSE during the course time (positive F-Test for CSE and TSE variables). The correlation
between the variables is not significant in both the survey periods.
Considering that teachers of this group have not been exposed to the training (yet), the results
are as expected.
Group B has not been asked to fill in the questionnaire in May 2010, but at the beginning of
their training turn, in September 2011, the results of this second round of training, thou, are
not part of this paper.

8
Figure 2: Teacher and Computer Self-Efficacy during the course – CG (data are
normalized to a 10 grade scale)
To sum up, results from the quantitative analysis show that CSE increases as the training
progresses in Group A, while TSE remains stable. No correlation between the two variables
can be detected. Conversely, it may be noted that the starting values both of TSE and CSE (in
both groups) is higher than expected.
A possible explanation of this phenomenon, already discussed in Fanni et al. (2010) is the
time factor: Group A teachers had enough time to increase their ICT skills, but not enough to
be able to make sense of their new skills in relation to their teaching practice, to verify this
hypothesis, the project research protocol foresees a follow-up questionnaire, to be submitted
later in 2011.
Qualitative Results
Let us discuss results of group A and B according the aforementioned macro-categories:
Positive Mastery Experience, Negative Mastery Experience, Positive Vicarious Experience,
and Negative Vicarious Experience.
Figure 3: Positive mastery experiences in Group A and B
The graph above indicates occurrences of codes classified as mastery experiences valued
positively by the two teacher groups, both in the actual situation and in the ideational world
described by teachers themselves. Group A has a bigger number of positive mastery
occurrences in comparison to Group B.
An interesting result is the change in the balance of actual and possible between the two
groups. Group A, given the training, had the possibility to practice the use of ICT in their
professional activities, and therefore transformed hypothetical usages of ICT into real
experiences; while Group B has not received real practice in using ICT for education yet, and
therefore expresses more possible uses.
The “classroom management” category in Group B may be emphasized since the number of
possible occurrences supersedes actual experiences. This may indicate that, whilst Group B
0
5
10
15
20
25
30
inte
rnal
psy
cho
logy
(A
)
inte
rnal
psy
cho
logy
(B
)
stu
de
nt
enga
gem
ent
(A)
stu
de
nt
enga
gem
ent
(B)
clas
sro
om
man
agem
en
t (A
)
clas
sro
om
man
agem
en
t (B
)
inst
ruct
ion
al s
trat
egi
es
(A)
inst
ruct
ion
al s
trat
egi
es
(B)
pre
par
atio
n (
A)
pre
par
atio
n (
B)
adm
in (
A)
adm
in (
B)
pe
rso
nal
use
(A
)
pe
rso
nal
use
(B
)
gen
eral
(A
)
gen
eral
(B
)
sup
po
rt (
A)
sup
po
rt (
B)
Mastery Experience Positive
POSSIBLE
ACTUAL

9
possesses some knowledge around using technologies in the classroom, they do not yet
demonstrate the skills to put this into practice.
Figure 4: Negative mastery experiences in Group A and Group B
On the contrary, Group A and B appear to be similar when comparing negative mastery
experiences. In particular, technical issues seem to be the greatest challenge faced by teachers
in the 6 schools involved in the MELISSA project. A noteworthy result is the decrease in
“support” from Group B to A. A possible explanation may be that teachers who were not yet
exposed to the training are less capable of solving problems individually (without support).
Conversely, teachers who did attend the training sessions seem more able to overcome
possible difficulties, as illustrated by some of these Group B educators:
Yes there are issues because I [am] only trained to be an educator, not a computer educator.
Meaning that I need more training.
I need help in ICT use. I want to learn more.
I don’t know anything…that is challenging me. There is a teacher that helps us when we need
help.
There are challenges because I am not an expert. Sometimes if I have a problem I just ask
other teachers that are better than me [to] help me.
0
10
20
30
40
50
60
inte
rnal
psy
cho
logy
(A
)
inte
rnal
psy
cho
logy
(B
)
stu
de
nt
enga
gem
ent
(A)
stu
de
nt
enga
gem
ent
(B)
clas
sro
om
man
agem
en
t (A
)
clas
sro
om
man
agem
en
t (B
)
inst
ruct
ion
al s
trat
egi
es
(A)
inst
ruct
ion
al s
trat
egi
es
(B)
pe
rso
nal
use
(A
)
pe
rso
nal
use
(B
)
tech
nic
al is
sue
s (A
)
tech
nic
al is
sue
s (B
)
gen
eral
(A
)
gen
eral
(B
)
sup
po
rt (
A)
sup
po
rt B
)
Negative Mastery Experience
POSSIBLE
ACTUAL

10
Figure 5: Positive vicarious experiences in Group A and Group B
Through analysing the above graphs, it appears that “support” is what teachers from both
groups look for in their peers. However the importance of peer-to-peer support or
encouragement decreases when teachers receive training (as in Group A).
Another significant finding is related to the category “classroom management”: teachers in
Group A are reinforced in ICT enhanced teaching practices in class by the examples of their
colleagues. This does not seem to occur in Group B, where teachers expressed „ideal‟
circumstances of support through their peers.
Figure 6: Negative vicarious experiences in Group A and Group B
The first significant element in the above graph is that no teaching-related categories are
present in Group B: they focused on internal psychological factors, technical, and other
(general) concerns. The notable differences between the two groups are seen in the technical
0
10
20
30
40
50
60in
tern
al p
sych
olo
gy (
A)
inte
rnal
psy
cho
logy
(B
)
classroom…
classroom…
instructional…
instructional…
pre
par
atio
n (
A)
pre
par
atio
n (
B)
tech
nic
al is
sue
s (A
)
tech
nic
al is
sue
s (B
)
adm
in (
A)
adm
in (
B)
gen
eral
(A
)
gen
eral
(B
)
sup
po
rt (
A)
sup
po
rt (
B)
Vicarious Experience Positive
POSSIBLE
ACTUAL
0
10
20
30
40
50
60
Vicarious Experience Negative
POSSIBLE
ACTUAL
11
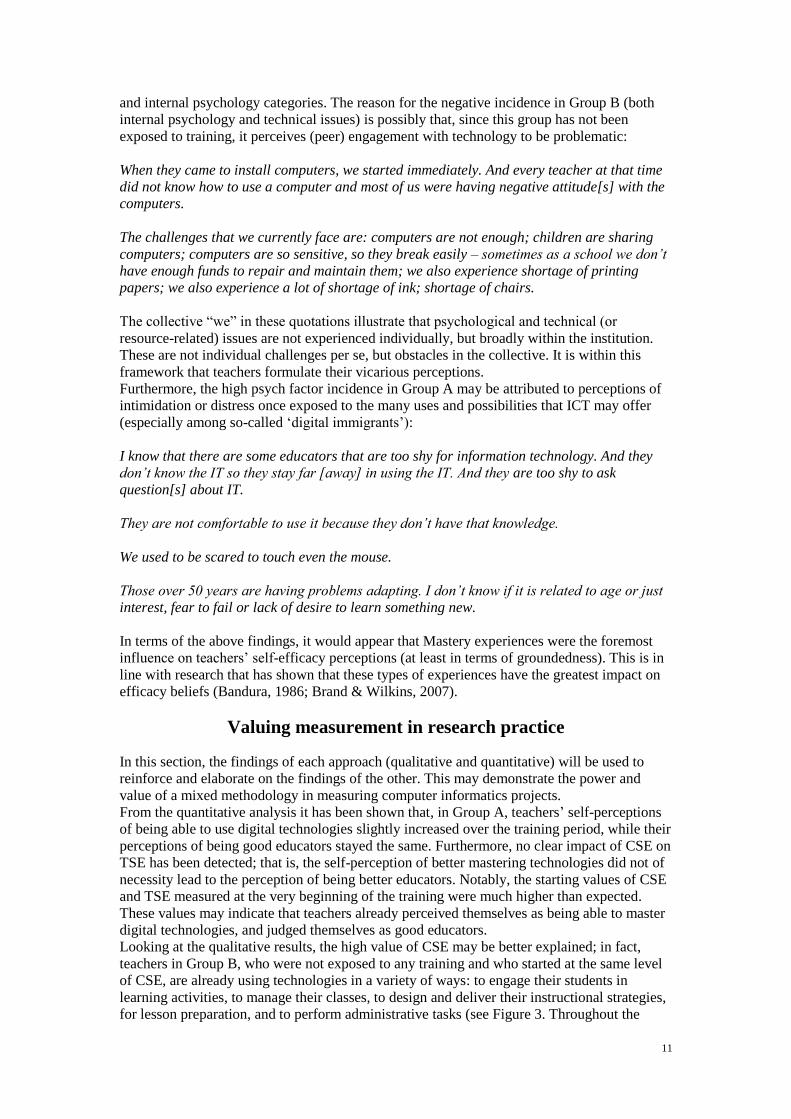
and internal psychology categories. The reason for the negative incidence in Group B (both
internal psychology and technical issues) is possibly that, since this group has not been
exposed to training, it perceives (peer) engagement with technology to be problematic:
When they came to install computers, we started immediately. And every teacher at that time
did not know how to use a computer and most of us were having negative attitude[s] with the
computers.
The challenges that we currently face are: computers are not enough; children are sharing
computers; computers are so sensitive, so they break easily – sometimes as a school we don’t
have enough funds to repair and maintain them; we also experience shortage of printing
papers; we also experience a lot of shortage of ink; shortage of chairs.
The collective “we” in these quotations illustrate that psychological and technical (or
resource-related) issues are not experienced individually, but broadly within the institution.
These are not individual challenges per se, but obstacles in the collective. It is within this
framework that teachers formulate their vicarious perceptions.
Furthermore, the high psych factor incidence in Group A may be attributed to perceptions of
intimidation or distress once exposed to the many uses and possibilities that ICT may offer
(especially among so-called „digital immigrants‟):
I know that there are some educators that are too shy for information technology. And they
don’t know the IT so they stay far [away] in using the IT. And they are too shy to ask
question[s] about IT.
They are not comfortable to use it because they don’t have that knowledge.
We used to be scared to touch even the mouse.
Those over 50 years are having problems adapting. I don’t know if it is related to age or just
interest, fear to fail or lack of desire to learn something new.
In terms of the above findings, it would appear that Mastery experiences were the foremost
influence on teachers‟ self-efficacy perceptions (at least in terms of groundedness). This is in
line with research that has shown that these types of experiences have the greatest impact on
efficacy beliefs (Bandura, 1986; Brand & Wilkins, 2007).
Valuing measurement in research practice
In this section, the findings of each approach (qualitative and quantitative) will be used to
reinforce and elaborate on the findings of the other. This may demonstrate the power and
value of a mixed methodology in measuring computer informatics projects.
From the quantitative analysis it has been shown that, in Group A, teachers‟ self-perceptions
of being able to use digital technologies slightly increased over the training period, while their
perceptions of being good educators stayed the same. Furthermore, no clear impact of CSE on
TSE has been detected; that is, the self-perception of better mastering technologies did not of
necessity lead to the perception of being better educators. Notably, the starting values of CSE
and TSE measured at the very beginning of the training were much higher than expected.
These values may indicate that teachers already perceived themselves as being able to master
digital technologies, and judged themselves as good educators.
Looking at the qualitative results, the high value of CSE may be better explained; in fact,
teachers in Group B, who were not exposed to any training and who started at the same level
of CSE, are already using technologies in a variety of ways: to engage their students in
learning activities, to manage their classes, to design and deliver their instructional strategies,
for lesson preparation, and to perform administrative tasks (see Figure 3. Throughout the

12
training modules, it seemed Group A started using more technologies within their working
activities, featuring many usages from the realm of possible to the realm of actual (see
difference in “actual” and “possible” in Figures 3) and increasing their perceptions of mastery
experiences in ICT.
Furthermore, if the research team only evaluated the quantitative results –indicating no
correlation between CSE and TSE – they may have assumed that teachers were not using any
technology in their practice, yet. Qualitative analysis, conversely, showed that ICT-enhanced
teaching practices are already in place, as mentioned above. The examination of qualitative
data allows the research team to infer more elaborate motivations: it is not a matter of whether
technological adoption occurs, but rather whether this is a „conscious‟ occurrence, especially
in terms of professional self-efficacy. Teachers are in fact using ICTs (for various purposes),
but cannot explicitly relate this to their perceptions of being better educators (evidenced by
the insignificant correlation in the quantitative measurements, as per Figures 1 and 2).
At this point it is recognised that the exact motivations behind a lower awareness among
educators are unclear, at best. Positive mastery and vicarious experiences allude to sufficient
adoption and use within pedagogical setups (supported by institutional directives). These may
be attributed to technological determinism, stemming from the Provincial Department of
Education, trickling down to institutional mandates. Although in draft policy, the government
has clearly expressed its intentions to move the Western Cape into 21st Century teaching and
learning (DoE, 2004; 2006; Khanya, 2011). This may be in line with what Bates (2000)
suggests as the „technological imperative‟: we have to use technologies because of a blind
belief that it is good for us; if we do not, we may lag behind and lose our credibility. This
construct may be neatly rooted in the overarching framework of determinism, which holds
that technology drives (or dictates?) social, cultural and economic development (Smith &
Marx, 1994).
Moreover, it appears that within the category of mastery experiences, there seemed to be
clusters of use that relate specifically to administrative duties, and lesson preparation
activities. These are not elements of Bandura‟s (1995) original TSE construct. The argument
can be made here to include them as essential components to efficacy beliefs of teachers,
since they are featured in line with other clusters (see Figures 3 and 4).
In light of these discussions, the MELISSA team now has a combination of powerful research
avenues to explore. The utilisation of a blended approach has been invaluable in the analysis
of data. The application of quantitative and qualitative approaches has demonstrated
interrelatedness and complementarity. The question as to whether or not to measure, within
the context of ICT4E, has been answered to satisfaction. It is hoped that the research may
continue in this vein, taking full consideration of the strengths, weaknesses, opportunities and
threats of both approaches.
Concluding thoughts
The foremost results of the MELISSA project have now been described. It has to be
recognised that the project is not yet completed, and may still yield varying results in the
months to come. A number of possible research avenues may be proposed in this regard: it
may be feasible to compare certain components (classroom management, student engagement,
and instructional strategies) of TSE and CSE individually, and to match these to the
qualitative data sets. This may give rise to specific correlations the team could otherwise have
missed. Furthermore, the influence of technological determinism and the technological
imperative may also be explored. It would be useful to evaluate the impact of these „meta
factors‟ on the scale of ICT adoption, or the development of efficacy beliefs. Ultimately,
whilst acknowledged that quantitative measurement is a powerful tool, this research
demonstrates the value of blended methodologies. Qualitative analysis not only assists with
the interpretation of quantitative data, but also suggests new perspectives with which to
deepen quantitative analysis, in particular opening the venue for the integration of an ICT-
related competence section within the TSE construct. Qualitative analysis has illuminated

13
previously unknown (“dark”) elements of the measured data, as for example seen in the high
incidence of administrative and preparation duties among mastery experiences. It may be
argued that quantitative data can never fully come to fruition without the necessary
counterbalance of qualitative examination. It is hoped that future research endeavours will
tackle this issue in more depth, especially the reverse condition – qualitative data augmented
by quantitative elements.
References
Babbie, E., & Mouton, J. (2004) The Practice of Social Research. Cape Town: Oxford
University Press.
Bandura, A. (1977) “Self-Efficacy: Towards a Unifying theory of behavioral change.”
Psychological Review 84(2): 191-215.
Bandura, A. (1986). Social foundations of thought and action: A social cognitive theory.
Englewood Cliffs, NJ: Prentice-Hall.
Bandura, A. (1995) Self-Efficacy in changing societies. New York: Cambridge University
Press.
Bates, A. W. (2000). Managing Technological Change: Strategies For College And
University Leaders. San Francisco: Jossey-Bass.
Bernard, H. R. (1998). Handbook of Methods in Cultural Anthropology. California: Altamira
Press.
Bernard, H. R. (2002). Research methods in anthropology: Qualitative and quantitative
methods (3rd edition). Walnut Creek:: AltaMira Press.
Brand, B.R. and Wilkins, J.L.M. (2007) “Using Self-Efficacy as a Construct for Evaluating
Science and Mathematics Methods Courses.” Journal of Science Teacher Education 18: 297-
317.
Chigona, W., Bytheway, A., Bladergroen, M., Dumas, C., Cox, S., & Van Zyl, I.
(forthcoming). "From the horse‟s mouth: educators‟ discourses on ICT in education." South
African Institute for Computer Scientists and Information Technologists (SAICSIT). Cape
Town.
Chigona, W., Chigona, A., & Davids, Z. (2010). "Motivating factors: Educators‟ use of ICT
in schools in disadvantaged areas in the Western Cape." ICIME 2010. Cape Town: University
of Cape Town.
Compeau, D.R. and Higgins, C.A. (1995) “Computer Self-Efficacy: Development of a
measure and initial test.” MIS Quarterly 192: 189-211.
Davids, Z. (2009). "The Educators‟ Perspective on the Factors that Influence the Success of
ICT School Initiatives within the Western Cape." Masters thesis: University of Cape Town.

14
Department of Education (DoE). (2004). "White Paper on e-Education. Transforming
Learning and Teaching through Information and Communication Technologies (ICTs)"
Notice 1922 of 2004. Government Gazette No. 26726.
Department of Education (DoE). (2006). "The National Policy Framework for Teacher
Education and Development in South Africa". Pretoria: South African Department of
Education.
Drent, M., & Meelissen, M. (2008). "Which factors obstruct or stimulate teacher educators to
use ICT innovatively?" Computers & Education, 51(1), 187-199.
Dunleavy, M., Dexter, S., & Heinecke , W. F. (2007). "What added value does a 1:1 student
to laptop ratio bring to technology-supported teaching and learning?" Journal of Computer
Assisted Learning, 1(1).
Fanni, F., Cantoni, L., Rega, I., Tardini, S., & Van Zyl, I. J. (2010). "Investigating Perception
Changes in Teachers Attending ICT Curricula through Self-Efficacy." International
Conference on Information and Communication Technology and Development.
Khanya. (2011). "Khanya Achievements." Retrieved July 11, 2011, from Khanya:
http://www.khanya.co.za/projectinfo/?catid=23
Madden, R. (2010). Being Ethnographic: A Guide to the Theory and Practice of Ethnography.
London: SAGE.
Rega, I., & Van Zyl, I. J. (2011). "ICT attitudes in educational practice: a qualitative
perspective." In L. Cantoni, P. Dillembourg, & D. Euler (Ed.), Proceedings of the Red-
Conference: Rethinking Education in the Knowledge Society (Ascona, Switzerland, 7-10
March 2011), Lugano (Switzerland). Ascona: Università della Svizzera italiana.
Smith, M. R., & Marx, L. (1994). Does Technology Drive History? The Dilemma of
Technological Determinism. Cambridge: MIT Press.
Tschannen-Moran, M. and Wolfolk Hoy, A. (2001) “Teacher efficacy. Capturing an elusive
construct.” Teaching and Teacher Education 17: 783-805.