The validity and responsiveness of three quality of life measures in the assessment of psoriasis...
12
BioMed Central Page 1 of 12 (page number not for citation purposes) Health and Quality of Life Outcomes Open Access Research The validity and responsiveness of three quality of life measures in the assessment of psoriasis patients: results of a phase II study Richard Shikiar 1 , Mary Kaye Willian 2 , Martin M Okun 3 , Christine S Thompson 1 and Dennis A Revicki* 1 Address: 1 Center for Health Outcomes Research, United BioSource Corporation, Bethesda, MD, USA, 2 Global Health Economics and Outcomes Research, Abbott Laboratories, Abbott Park, IL, USA and 3 Abbott Immunology, Abbott Laboratories, Abbott Park, IL, USA Email: Richard Shikiar - [email protected]; Mary Kaye Willian - [email protected]; Martin M Okun - [email protected]; Christine S Thompson - [email protected]; Dennis A Revicki* - [email protected] * Corresponding author Abstract Background: Patient-reported outcome (PROs) measures are being used more frequently in investigational studies of treatments for moderate to severe plaque psoriasis. The objective of this study was to examine the relationships among the Dermatology Life Quality Index (DLQI), the Short Form 36 (SF-36), and the EuroQOL 5D (EQ-5D) and to assess their validity, responsiveness, and estimates of minimum important differences. Methods: A Phase II, randomized, double-blind, parallel group, placebo-controlled, multi-center clinical trial assessed the clinical efficacy and safety of two doses of subcutaneously administered adalimumab vs. placebo for 12 weeks in the treatment of 147 patients with moderate to severe plaque psoriasis. This study provided the opportunity to evaluate the validity and responsiveness to change in clinical status of PROs instruments. Patients completed the DLQI, SF-36, and EQ-5D questionnaires at baseline and at 12 weeks. Blinded investigators assessed the Psoriasis Area and Severity Index (PASI) scores and the Physician's Global Assessment (PGA) scores of enrolled patients. The responsiveness of the measures to changes in the clinical endpoints from baseline to Week 12 was assessed. Estimates of minimum important differences (MID) were derived. All analyses were performed with blinded data; findings and conclusions were not biased based on treatment condition. Results: The dermatology-specific DLQI was highly correlated to clinical endpoints at baseline and at Week 12, and was the most responsive PRO to changes in endpoints. Compared with the SF- 36, the EQ-5D index score and VAS scores were generally more highly correlated with clinical endpoints, but displayed about the same degree of responsiveness. The most responsive SF-36 scales were the Bodily Pain and Social Functioning scales. Estimates of the MID for the DLQI ranged from 2.3–5.7 and for the SF-36 Physical Component Summary (PCS) score ranged from 2.5–3.9. Conclusion: This study provides support for the continued use of the DLQI and SF-36 PCS in the assessment of treatments for psoriasis. On the basis of the results from this trial, the EQ-5D should be considered as a general PRO measure in future clinical trials of patients with moderate to severe plaque psoriasis. Published: 27 September 2006 Health and Quality of Life Outcomes 2006, 4:71 doi:10.1186/1477-7525-4-71 Received: 24 August 2006 Accepted: 27 September 2006 This article is available from: http://www.hqlo.com/content/4/1/71 © 2006 Shikiar et al; licensee BioMed Central Ltd. This is an Open Access article distributed under the terms of the Creative Commons Attribution License (http://creativecommons.org/licenses/by/2.0 ), which permits unrestricted use, distribution, and reproduction in any medium, provided the original work is properly cited.
Transcript of The validity and responsiveness of three quality of life measures in the assessment of psoriasis...

BioMed Central
Health and Quality of Life Outcomes
ss
Open AcceResearchThe validity and responsiveness of three quality of life measures in the assessment of psoriasis patients: results of a phase II studyRichard Shikiar1, Mary Kaye Willian2, Martin M Okun3, Christine S Thompson1 and Dennis A Revicki*1Address: 1Center for Health Outcomes Research, United BioSource Corporation, Bethesda, MD, USA, 2Global Health Economics and Outcomes Research, Abbott Laboratories, Abbott Park, IL, USA and 3Abbott Immunology, Abbott Laboratories, Abbott Park, IL, USA
Email: Richard Shikiar - [email protected]; Mary Kaye Willian - [email protected]; Martin M Okun - [email protected]; Christine S Thompson - [email protected]; Dennis A Revicki* - [email protected]
* Corresponding author
AbstractBackground: Patient-reported outcome (PROs) measures are being used more frequently ininvestigational studies of treatments for moderate to severe plaque psoriasis. The objective of thisstudy was to examine the relationships among the Dermatology Life Quality Index (DLQI), theShort Form 36 (SF-36), and the EuroQOL 5D (EQ-5D) and to assess their validity, responsiveness,and estimates of minimum important differences.
Methods: A Phase II, randomized, double-blind, parallel group, placebo-controlled, multi-centerclinical trial assessed the clinical efficacy and safety of two doses of subcutaneously administeredadalimumab vs. placebo for 12 weeks in the treatment of 147 patients with moderate to severeplaque psoriasis. This study provided the opportunity to evaluate the validity and responsivenessto change in clinical status of PROs instruments. Patients completed the DLQI, SF-36, and EQ-5Dquestionnaires at baseline and at 12 weeks. Blinded investigators assessed the Psoriasis Area andSeverity Index (PASI) scores and the Physician's Global Assessment (PGA) scores of enrolledpatients. The responsiveness of the measures to changes in the clinical endpoints from baseline toWeek 12 was assessed. Estimates of minimum important differences (MID) were derived. Allanalyses were performed with blinded data; findings and conclusions were not biased based ontreatment condition.
Results: The dermatology-specific DLQI was highly correlated to clinical endpoints at baseline andat Week 12, and was the most responsive PRO to changes in endpoints. Compared with the SF-36, the EQ-5D index score and VAS scores were generally more highly correlated with clinicalendpoints, but displayed about the same degree of responsiveness. The most responsive SF-36scales were the Bodily Pain and Social Functioning scales. Estimates of the MID for the DLQI rangedfrom 2.3–5.7 and for the SF-36 Physical Component Summary (PCS) score ranged from 2.5–3.9.
Conclusion: This study provides support for the continued use of the DLQI and SF-36 PCS in theassessment of treatments for psoriasis. On the basis of the results from this trial, the EQ-5D shouldbe considered as a general PRO measure in future clinical trials of patients with moderate to severeplaque psoriasis.
Published: 27 September 2006
Health and Quality of Life Outcomes 2006, 4:71 doi:10.1186/1477-7525-4-71
Received: 24 August 2006Accepted: 27 September 2006
This article is available from: http://www.hqlo.com/content/4/1/71
© 2006 Shikiar et al; licensee BioMed Central Ltd.This is an Open Access article distributed under the terms of the Creative Commons Attribution License (http://creativecommons.org/licenses/by/2.0), which permits unrestricted use, distribution, and reproduction in any medium, provided the original work is properly cited.
Page 1 of 12(page number not for citation purposes)
Health and Quality of Life Outcomes 2006, 4:71 http://www.hqlo.com/content/4/1/71
BackgroundModerate to severe plaque psoriasis has been demon-strated to have substantial impact on function limitationsand psychosocial factors of patients with the disease [1-5].Moreover, successful treatment of moderate to severe pso-riasis – as assessed by improved physical functioning andreduction of signs and symptoms – has been shown tohave a positive impact on social and psychological aspectsof psoriasis [6-11].
Given the functional and psychosocial impact of the dis-ease, studies of moderate to severe psoriasis patients ofteninclude both physician-assessed clinical endpoints anddermatology-specific patient-reported outcomes (PROs)to obtain a holistic view of the disease and treatmenteffects in patients [12]. Such practices are bolstered by theassertion of the Medical Advisory Board of the NationalPsoriasis Foundation (NPF) that, even more so than phys-ical signs, such as the percentage of body surface area(BSA) affected by psoriasis, the severity of psoriasis is "firstand foremost a quality-of-life (QOL) issue" [13]. Thesame values for percentage BSA involvement can result invery different degrees of impact for different patients,depending on the location of psoriatic plaques, the painassociated with the lesions and plaques, the extent ofbleeding associated with the psoriatic lesions, and result-ing functional limitations. The NPF Advisory Board sug-gests an alternative basis for defining mild, moderate, orsevere psoriasis, predicated on QOL impacts of the dis-ease. Similarly, the guidelines recently promulgated by theBritish Association of Dermatologists [14] for the use ofbiologics in psoriasis indicate that eligible patients musthave a Psoriasis Area and Severity Index (PASI) score of atleast 10 and a score on the Dermatology Life QualityIndex (DLQI) [15] – a dermatology-specific validatedPRO measure – of greater than 10.
A Phase II clinical trial of two dosages of adalimumab andplacebo in the treatment of moderate to severe psoriasisprovided an opportunity to further explore the psycho-metric characteristics – including responsiveness and min-imum important differences – of the three PROs used inthe trial: the DLQI; the general health-related QOL meas-ure MOS Short Form 36 (SF-36) Health Survey [16]; andthe general health status measure EuroQOL 5D (EQ-5D)[17,18]. Establishing the reliability, validity, and respon-siveness of PRO measures is necessary for their use in sup-port of labeling claims, according to an FDA draft guide toindustry [19]. Reliability refers to the accuracy of a meas-ure, while validity refers to the extent the measure actuallyis measuring what it purports to measure. Responsivenessis a component of validity and represents the PRO's capa-bility to detect changes related to changes in the clinicalstatus of patients or other relevant outcomes measures.Minimum important difference (MID) is related to
responsiveness and provides guidance to those reviewingclinical trial results as to whether the statistically signifi-cant group differences or changes are clinically meaning-ful and important. Jaeschke and colleagues [20] define aminimal clinically important difference (MCID) (we useMID instead of MCID to avoid confusion) as "the smallestdifference in score ... which patients perceive as beneficialand which would mandate, in the absence of troublesomeside-effects and excessive cost, a change in the patient'smanagement." Estimation of the MID – using several dif-ferent approaches – is also emphasized in the FDA guid-ance and is consistent with recently publishedrecommendations of health outcomes researchers[21,22].
MethodsOverviewThe objectives of the Phase II, randomized, double-blind,parallel group, placebo-controlled, multi-center clinicaltrial were to assess the clinical efficacy and safety of sub-cutaneously administered adalimumab vs. placebo usingtwo dosage regimens for 12 weeks in the treatment of 147patients with moderate to severe plaque psoriasis. Thestudy included a screening period, a blinded 12-weektreatment period, and a 30-day follow-up visit for patientsnot completing 12 weeks of active treatment or not enter-ing an extension study. Time between screening and base-line visits was not to exceed 28 days. The trial achieved theobjectives of the study in terms of safety and clinical effi-cacy endpoints [23].
Patients and inclusion criteriaPatients with a diagnosis of moderate to severe plaquepsoriasis and an affected BSA of ≥ 5% for at least 1 yearwere eligible for the study. In addition to other inclusioncriteria (e.g., age ≥ 18 years, willingness to give informedconsent), patients had to be able to self-inject medicationor have a designee or nurse who could inject the rand-omized assignment. Patients signed informed consentforms, and the study complied with FDA Good ClinicalPractices, Health Protection Branch guidelines, and allother applicable ethical, legal, and regulatory require-ments [23].
Clinical measuresFor purposes of the analyses reported here, there were twoprimary clinical outcomes:
Psoriasis Area and Severity IndexFrequently used as an endpoint in psoriasis clinical trials[24], the PASI [25] was the primary efficacy outcome inthis trial. PASI is a composite index indicating the severityof the three main signs of psoriatic plaques (i.e., ery-thema, scaling, and thickness) and is weighted by theamount of coverage of these plaques in the four main
Page 2 of 12(page number not for citation purposes)

Health and Quality of Life Outcomes 2006, 4:71 http://www.hqlo.com/content/4/1/71
body areas (head, trunk, upper extremities, and lowerextremities). PASI scores range from 0–72, with higherscores indicating greater disease severity. PASI wasassessed at screening and baseline, at Weeks 1, 2, 4, 8, and12/Early Termination, and at the final follow-up visit.
Physician's Global AssessmentThe PGA is a seven-point scale used to measure the sever-ity of disease at the time of the physician's evaluation. Theseven disease categories are:
• Severe: very marked plaque elevation, scaling, and/orerythema
• Moderate to Severe: marked plaque elevation, scaling,and/or erythema
• Moderate: moderate plaque elevation, scaling, and/orerythema
• Mild to moderate: intermediate between moderate andmild
• Mild: slight plaque elevation, scaling, and/or erythema
• Almost Clear: intermediate between mild and clear
• Clear: no signs of psoriasis (post-inflammatory hypopig-mentation or hyperpigmentation could be present).
The PGA scale is scored from 1 (Clear) to 7 (Severe). ThePGA was assessed by the investigator at screening, base-line, and Weeks 1, 2, 4, 8, 12/Early Termination, and thefollow-up visit. Each study site was to make every attemptto have the same investigator perform these assessmentsthroughout the study for each patient.
Patient-Reported Outcome measuresThree PROs measures were used in the study and are thesubject of the analyses reported here. All PROs measureswere assessed at baseline and at Week 12 (or early termi-nation, if applicable).
Dermatology Life Quality IndexThe DLQI was developed as a simple, compact, and prac-tical questionnaire for use in dermatology clinical settingsto assess limitations related to the impact of skin disease[15]. The instrument contains 10 items dealing with skin(e.g., Item 1: "Over the last week, how itchy sore, painful,or stinging has your skin been?"). The DLQI score rangesfrom 0–30, with "30" corresponding to the worst qualityof life, and "0" corresponding to the best score. The DLQIhas well-established properties of reliability and validityin the dermatology setting [15,26-28].
Short Form 36 health surveyThe SF-36 is a 36-item general health status instrumentoften used in clinical trials and health services research[16]. It consists of eight domains: Physical Function, RoleLimitations-Physical, Vitality, General Health Percep-tions, Bodily Pain, Social Function, Role Limitations –Emotional, and Mental Health. Two overall summaryscores can be obtained – a Physical Component Summary(PCS) score and a Mental Component Summary (MCS)score [29]. The PCS and MCS scores range from 0–100,with higher scores indicating better health. The SF-36 hasbeen used in a wide variety of studies involving psoriasis,including descriptive studies [30] and clinical researchstudies [6,7], and has demonstrated good reliability andvalidity. Internal consistency for most SF-36 domains isgreater than 0.70. The SF-36 has been shown to discrimi-nate between known groups in a variety of diseases, isreproducible, and is responsive to longitudinal clinicalchanges.
EuroQOL 5DThe EQ-5D [17,18] is a six-item, preference-based instru-ment designed to measure general health status. The EQ-5D has two sections: The first consists of five items toassess degree of physical functioning (mobility, self-care,usual activities, pain/discomfort, and anxiety/depres-sion). Items are rated on a three-point scale ranging from"No Problem" to "Extreme Problem" or "Unable to Do."Each pattern of scores for the five items is linked to anindex score that has a value ranging from 0–1, indicatingthe health utility of that person's health status. The spe-cific linkage can differ from country to country, reflectingdifferences in cultures to the item responses. The secondsection is the sixth item on the EQ-5D, which is a visualanalog scale with endpoints of "100" or "Best ImaginableHealth," and "0" or "Worst Imaginable Health." It offers asimple method for the respondents to indicate how goodor bad their health statuses are "today." The score is takendirectly from the patients' responses.
Statistical methodsValidity of the PRO measures was assessed in several ways.First, an assessment was made of the concurrent validity ofscales and subscales (i.e., the extent to which PRO meas-ures are correlated with one another). As a disease-specificPRO measure, the DLQI was expected to correlate moder-ately to extremely well with general PRO measures.Another important aspect of validity in this study was toassess the extent to which the PRO measures correlatedwith the clinical endpoints – PASI and PGA – both at base-line and at Week 12.
Responsiveness of PRO measures was assessed via twoapproaches. First, changes in these measures from base-line to Week 12 were correlated with changes in the PASI
Page 3 of 12(page number not for citation purposes)
Health and Quality of Life Outcomes 2006, 4:71 http://www.hqlo.com/content/4/1/71
or PGA over the 12-week course of treatment within thetrial. Concurrent improvement in both clinical measuresand PRO measures was expected to result in positive cor-relations. The second approach to assessing responsive-ness involved categorizing patients into responder groupsbased on the changes in their PASI scores from baseline toWeek 12. This was done in two ways. First, a responderwas defined as a patient with >75% improvement in PASI(consistent with the definition of success with the primaryefficacy variable), and a non-responder was defined as apatient with a PASI improvement <50% (consistent withthe definition of failure for a secondary efficacy variable).Tests of mean differences in improvement on the PROmeasures were completed between the two groups. Sec-ondly, in support of the estimation of the MID, discussedbelow, patients were further categorized by degree of PASIresponse, and assessed differences among these fourgroups: PASI improvement <25%; PASI improvement 25–49%; PASI improvement 50–74%; and PASI improve-ment ≥ 75%. Analyses of variance tests were performedamong these four groups for changes in PRO measures.
In accordance with the FDA draft guidance [19] and con-sistent with recent recommendations from PRO research-ers [21,22], five methods were used to estimate MIDs ofthe PROs. The PRO change score corresponding to PASI25-PASI 49 was the first estimate of MID, called MID-1.This was based on the assumption that patients wouldperceive a PASI improvement of 25% as beneficial. Thetrial did not provide data to test this assumption (e.g.,there was no rating by patients of their overall improve-ments). A second estimate, MID-2, was based on the PROchange score corresponding to a PASI improvementbetween 50–74%. The PASI 50 is seen as clinically rele-vant, and, as such, this degree of improvement served as asecondary efficacy endpoint in this trial. A third methodfor estimating MID relied on the association of changes inthe PRO measure with changes in the PGA. A non-responder was defined as a patient with a PGA changescore of either "0" (no change) or "1" (slight increase inseverity of disease) from baseline to Week 12. A minimalresponder was defined as a patient whose PGA improvedby either 1 or 2 points from baseline to Week 12. The thirdestimate of MID, MID-3, was the difference in the PROscore between non-responders and minimal responders.
In addition, two distributional methods were used to sup-port the anchor-based MID estimates for the PROs[21,22]. Based on evidence by Wyrwich and associates[31,32], the standard error of measurement (SEM) can beused to approximate the MID. The SEM, which describesthe error associated with the measure, was estimated bythe standard deviation of the measure multiplied by thesquare root of 1 minus its reliability coefficient. Finally,there has been discussion [33] concerning a number of
studies demonstrating that one-half of the standard devi-ation of a measure represents the upper limit of the MID[22]. In estimating the SEM for the SF-36 and the EQ-5D,reliability estimates from the literature were used. TheSEM for the DLQI incorporated the reliability estimatedfrom the trial data, which was consistent with what hasbeen found in the literature for this instrument [27].
Finally, it is important to note that all analyses were per-formed with blinded data (i.e., the statuses of patientswith respect to their assigned treatment groups were notknown).
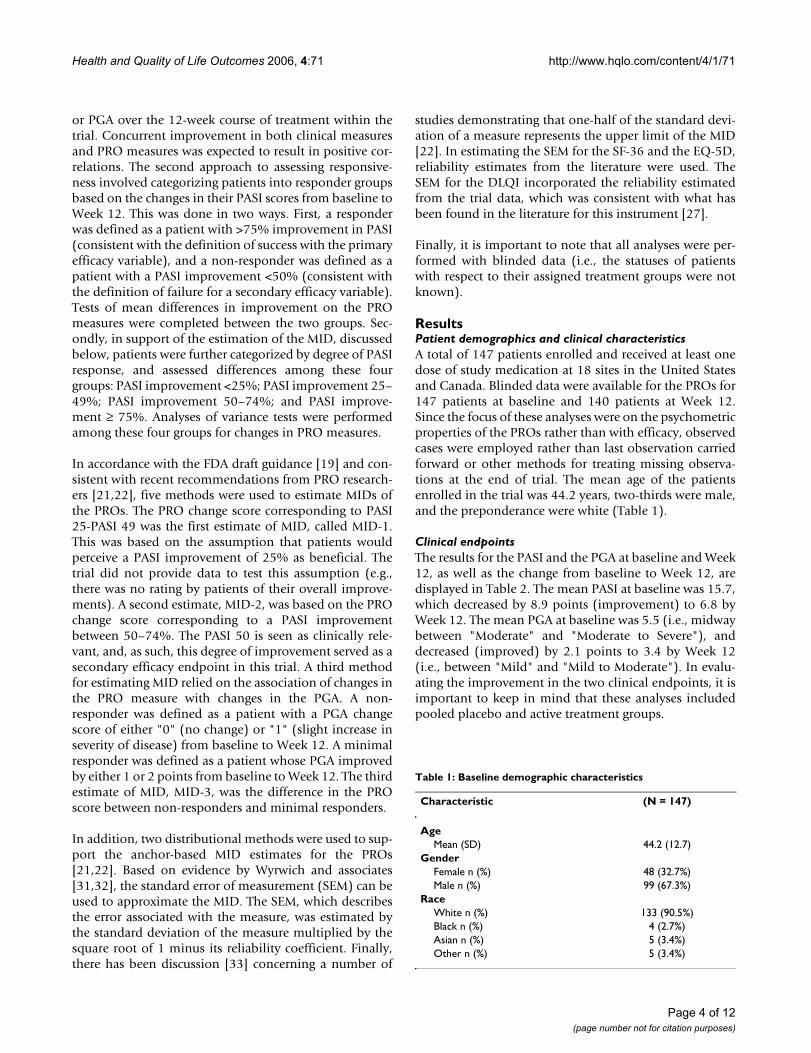
ResultsPatient demographics and clinical characteristicsA total of 147 patients enrolled and received at least onedose of study medication at 18 sites in the United Statesand Canada. Blinded data were available for the PROs for147 patients at baseline and 140 patients at Week 12.Since the focus of these analyses were on the psychometricproperties of the PROs rather than with efficacy, observedcases were employed rather than last observation carriedforward or other methods for treating missing observa-tions at the end of trial. The mean age of the patientsenrolled in the trial was 44.2 years, two-thirds were male,and the preponderance were white (Table 1).
Clinical endpointsThe results for the PASI and the PGA at baseline and Week12, as well as the change from baseline to Week 12, aredisplayed in Table 2. The mean PASI at baseline was 15.7,which decreased by 8.9 points (improvement) to 6.8 byWeek 12. The mean PGA at baseline was 5.5 (i.e., midwaybetween "Moderate" and "Moderate to Severe"), anddecreased (improved) by 2.1 points to 3.4 by Week 12(i.e., between "Mild" and "Mild to Moderate"). In evalu-ating the improvement in the two clinical endpoints, it isimportant to keep in mind that these analyses includedpooled placebo and active treatment groups.
Table 1: Baseline demographic characteristics
Characteristic (N = 147)
AgeMean (SD) 44.2 (12.7)
GenderFemale n (%) 48 (32.7%)Male n (%) 99 (67.3%)
RaceWhite n (%) 133 (90.5%)Black n (%) 4 (2.7%)Asian n (%) 5 (3.4%)Other n (%) 5 (3.4%)
Page 4 of 12(page number not for citation purposes)

Health and Quality of Life Outcomes 2006, 4:71 http://www.hqlo.com/content/4/1/71
Patient-Reported Outcome measuresThe results for the DLQI, SF-36, and EQ-5D at baselineand Week 12, and the change from baseline are shown inTable 3. Based on blinded data, mean PRO measuresimproved during the course of the trial (a decrease inDLQI scores indicates an improvement; an increase in theSF-36 and EQ-5D indicates improvement). The greatestimprovement in a DLQI item occurred for the first item,assessing how "itchy, sore, painful, or stinging" the per-son's skin felt (data not shown). Similarly, as shown inTable 3, the greatest improvement among the SF-36 scaleswas for Bodily Pain. The largest improvement among thefive EQ-5D dimensions occurred for the Pain/Discomfortdimension (data not shown). Given these findings, itappears that improvement in pain and discomfort is themost pronounced among all PRO measures assessed.
The reliability of the DLQI, as assessed by coefficientalpha, was 0.89 at baseline and 0.92 at Week 12, indicat-ing that this is a highly reliable measure, and in line withprevious findings [27,28].
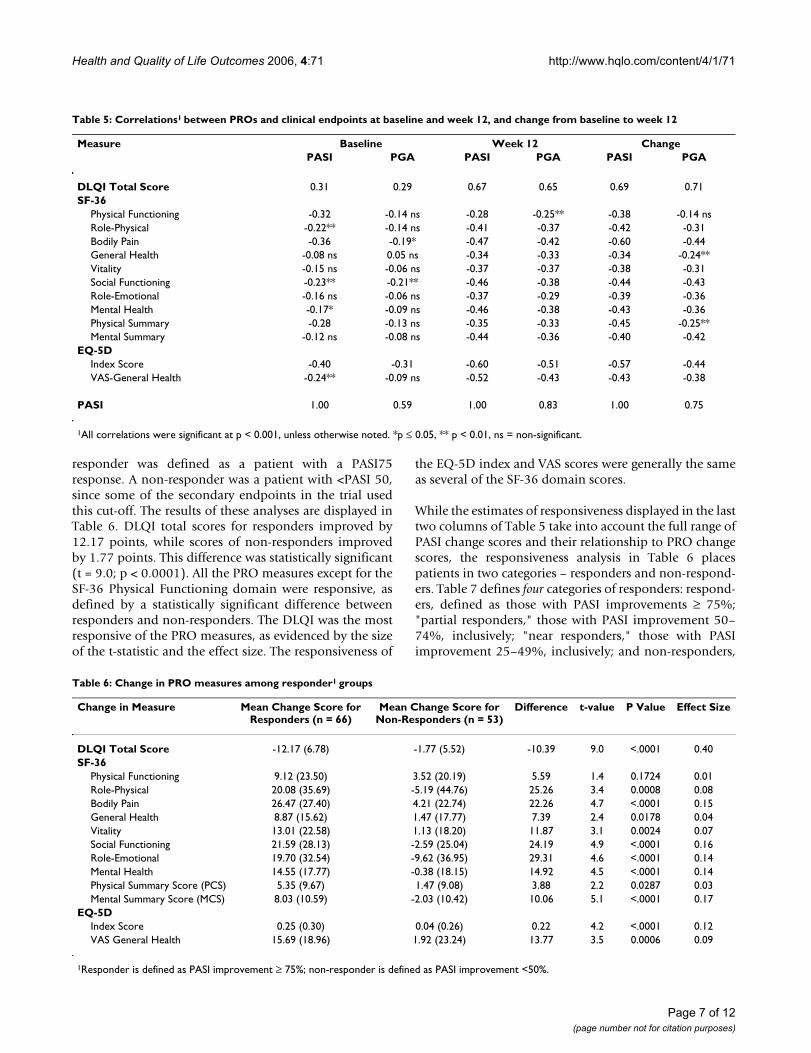
Relationships among Patient-Reported Outcome measuresTable 4 displays the correlations among PRO measures atbaseline and at Week 12, as well as the correlations among
changes in these measures from baseline to Week 12.There were a few trends evident form this data. First, allmeasures were statistically significantly inter-correlated.Second, with respect to the relationship between theDLQI and the SF-36, the DLQI correlated the greatest withthe Bodily Pain and Social Functioning domains, both atbaseline and at Week 12, and, for changes in these scoresover the course of the trial. Third, the DLQI correlatedhighly with the EQ-5D index score, and these correlationswere consistently higher than the correlations with theEQ-5D visual analog scale (VAS) scores. Fourth, the EQ-5D index score tended to correlate greatest with the BodilyPain domain of the SF-36. Finally, the scores tended to bemore highly correlated at the end of the trial than at base-line, consistent with previous findings [28].
Correlations with clinical endpointsTable 5 displays correlations of PRO measures with thetwo clinical assessments – PASI score and PGA – at base-line (first two columns of data) and at Week 12 (secondtwo columns). In addition to almost uniformly greatercorrelations at Week 12 vs. at baseline – consistent withprevious findings [28] – one can also note that both theDLQI and EQ-5D index score tended to be more highlycorrelated with the two clinical endpoints than any of theSF-36 domains. The SF-36 scales with the strongest associ-
Table 2: Mean (Standard Deviation) of PASI and PGA at baseline and week 12, and change from baseline to week 12
Measure Baseline Week 12 Change2
PASI 15.69 (7.34) 6.84 (7.77) -8.87 (8.41)PGA1 5.48 (0.81) 3.36 (1.74) -2.14 (1.87)
1 Scored such that 1 = "Clear" to 7 = "Severe."2Change scores are computed only for the 140 patients with scores at baseline and Week 12; sample size at baseline = 147.
Table 3: Mean (Standard Deviation) of PROs at baseline and week 12, and change from baseline to week 12
Measure Baseline Week 12 Change1
DLQI Total Score 12.71 (7.18) 5.28 (6.49) -7.45 (7.78)SF-36
Physical Functioning 79.26 (24.95) 84.43 (22.62) 5.63 (22.25)Role-Physical 72.45 (37.56) 82.50 (34.67) 9.64 (40.30)Bodily Pain 59.58 (25.37) 75.87 (24.89) 16.59 (26.90)General Health 66.7 (20.6) 72.69 (20.79) 6.10 (16.25)Vitality 53.89 (22.81) 61.04 (23.18) 7.60 (20.88)Social Functioning 74.49 (27.56) 85.98 (23.63) 11.16 (27.80)Role-Emotional 76.03 (35.39) 85.48 (30.77) 8.39 (37.02)Mental Health 69.39 (19.30) 77.43 (17.73) 8.14 (18.57)Physical Summary Score (PCS) 47.93 (10.23) 51.24 (9.51) 3.47 (9.30)Mental Summary Score (MCS) 47.30 (11.23) 51.36 (10.08) 3.94 (11.04)
EQ-5DIndex Score 0.66 (0.28) 0.82 (0.23) 0.16 (0.29)VAS Overall Health 72.25 (20.67) 81.22 (17.26) 9.35 (20.71)
1Change scores are computed only for patients with scores at baseline and Week 12; this number varied between 138 and 140, depending on the specific measure, as compared with the 147 patients at baseline.
Page 5 of 12(page number not for citation purposes)

Health and Quality of Life Outcomes 2006, 4:71 http://www.hqlo.com/content/4/1/71
ation with clinical endpoints are Social Functioning andBodily Pain.
Responsiveness of the Patient-Reported Outcome measuresAn important attribute for a PRO measure is responsive-ness to change in the clinical status of a patient (i.e., as apatient's disease improves, the PRO measures alsoimprove). The last two columns of Table 5 display the cor-relations between changes in PRO measures used in thetrial and changes in PASI scores and the PGA from base-line to Week 12. These data demonstrate that the DLQI isthe most responsive of the PRO measures. The correla-tions between changes over the course of the trial in theDLQI total score and changes in the PASI score (r = 0.69,p < 0.001) and PGA (r = 0.71, p < 0.001) approach thecorrelation between changes in the two clinical measures
themselves (r = 0.75, p < 0.001). In addition, the DLQI isthe only one of the PRO measures to demonstrate equalresponsiveness to PGA and PASI scores. The correlationbetween changes in the EQ-5D index score and the twoclinical assessments was r = -0.57 (p < 0.001) for changesin the PASI to r = -0.44 for changes in the PGA (p < 0.001).Similarly, the correlations between changes in all but oneof the SF-36 scores and changes in the PGA were smallerthan correlations between changes in the SF-36 and thePASI.
A second way to assess responsiveness was to contrastpatients who were defined as clinical responders withthose characterized as non-responders. Given that the pri-mary endpoint in the trial was defined as the percentageof patients achieving a PASI 75 response (i.e., ≥ 75%improvement in PASI from. baseline) by Week 12, a
Table 4: Correlations1 among PROs at baseline and week 12, and change from baseline to week 12
Measure Baseline Week 12 ChangeDLQI Total
EQ-5D Index
EQ-5D VAS
DLQI Total
EQ-5D Index
EQ-5D VAS
DLQI Total
EQ-5D Index
EQ-5D VAS
DLQI Total Score
1.00 -0.51 -0.35 1.00 -0.71 -0.58 1.00 -0.53 -0.46
SF-36Physical Functioning
-0.44 0.58 0.35 -0.41 0.61 0.49 -0.29 0.47 0.32
Role-Physical
-0.45 0.64 0.38 -0.57 0.67 0.50 -0.47 0.51 0.45
Bodily Pain
-0.55 0.73 0.45 -0.61 0.76 0.56 -0.66 0.64 0.53
General Health
-0.24** 0.39 0.47 -0.38 0.59 0.69 -0.33 0.46 0.46
Vitality -0.31 0.43 0.48 -0.43 0.62 0.60 -0.46 0.37 0.48Social Functioning
-0.69 0.52 0.46 -0.68 0.74 0.60 -0.68 0.50 0.56
Role-Emotional
-0.41 0.45 0.42 -0.56 0.67 0.53 -0.50 0.41 0.48
Mental Health
-0.44 0.46 0.50 -0.56 0.66 0.67 -0.52 0.49 0.56
Physical Summary Score (PCS)
-0.41 0.64 0.36 -0.46 0.65 0.52 -0.41 0.56 0.39
Mental Summary Score (MCS)
-0.45 0.39 0.49 -0.58 0.66 0.63 -0.59 0.42 0.57
EQ-5DIndex Score -0.51 1.00 0.39 -0.71 1.00 0.63 -0.53 1.00 0.39VAS-General Health
-0.35 0.39 1.00 -0.58 0.63 1.00 -0.46 0.39 1.00
1All correlations were significant at p < 0.001, unless otherwise noted. *p ≤ 0.05, **p ≤ 0.01, ns = non-significant.
Page 6 of 12(page number not for citation purposes)
Health and Quality of Life Outcomes 2006, 4:71 http://www.hqlo.com/content/4/1/71
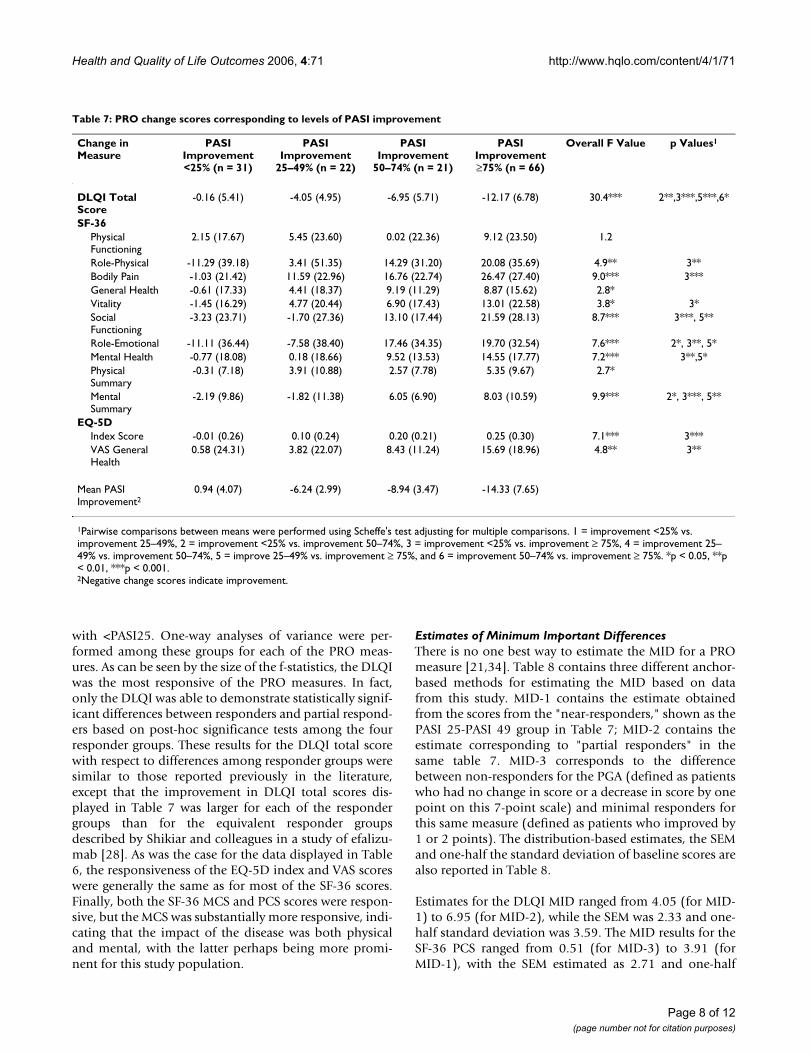
responder was defined as a patient with a PASI75response. A non-responder was a patient with <PASI 50,since some of the secondary endpoints in the trial usedthis cut-off. The results of these analyses are displayed inTable 6. DLQI total scores for responders improved by12.17 points, while scores of non-responders improvedby 1.77 points. This difference was statistically significant(t = 9.0; p < 0.0001). All the PRO measures except for theSF-36 Physical Functioning domain were responsive, asdefined by a statistically significant difference betweenresponders and non-responders. The DLQI was the mostresponsive of the PRO measures, as evidenced by the sizeof the t-statistic and the effect size. The responsiveness of
the EQ-5D index and VAS scores were generally the sameas several of the SF-36 domain scores.
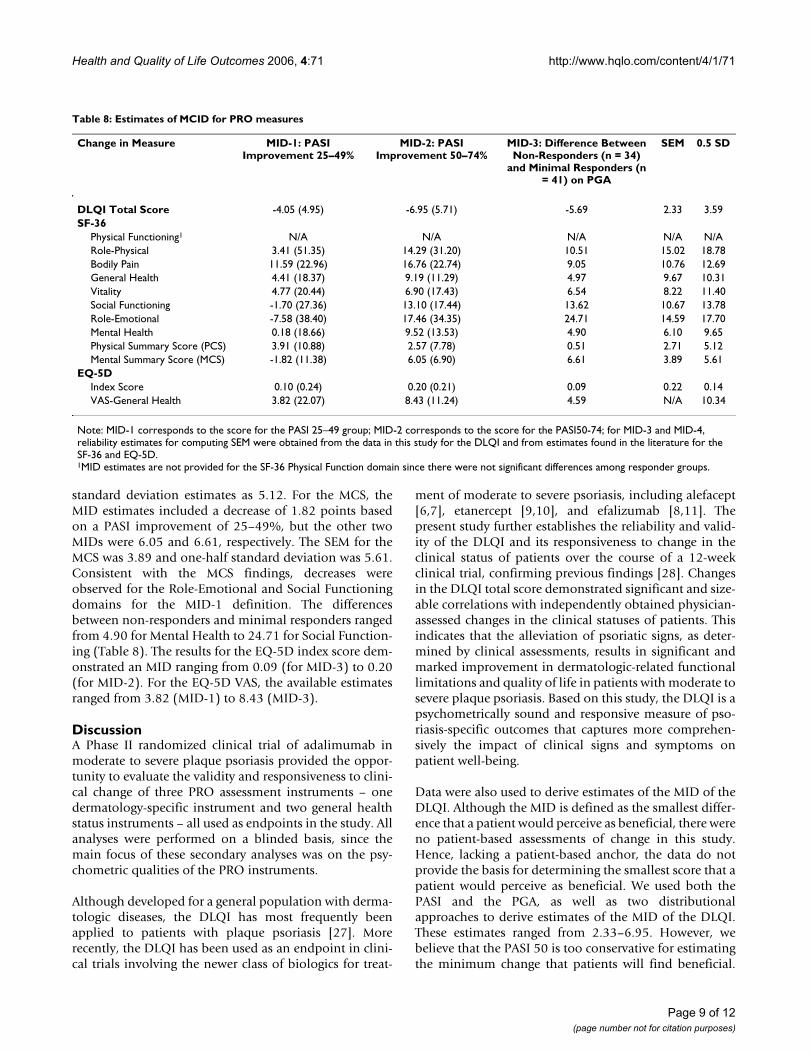
While the estimates of responsiveness displayed in the lasttwo columns of Table 5 take into account the full range ofPASI change scores and their relationship to PRO changescores, the responsiveness analysis in Table 6 placespatients in two categories – responders and non-respond-ers. Table 7 defines four categories of responders: respond-ers, defined as those with PASI improvements ≥ 75%;"partial responders," those with PASI improvement 50–74%, inclusively; "near responders," those with PASIimprovement 25–49%, inclusively; and non-responders,
Table 6: Change in PRO measures among responder1 groups
Change in Measure Mean Change Score for Responders (n = 66)
Mean Change Score for Non-Responders (n = 53)
Difference t-value P Value Effect Size
DLQI Total Score -12.17 (6.78) -1.77 (5.52) -10.39 9.0 <.0001 0.40SF-36
Physical Functioning 9.12 (23.50) 3.52 (20.19) 5.59 1.4 0.1724 0.01Role-Physical 20.08 (35.69) -5.19 (44.76) 25.26 3.4 0.0008 0.08Bodily Pain 26.47 (27.40) 4.21 (22.74) 22.26 4.7 <.0001 0.15General Health 8.87 (15.62) 1.47 (17.77) 7.39 2.4 0.0178 0.04Vitality 13.01 (22.58) 1.13 (18.20) 11.87 3.1 0.0024 0.07Social Functioning 21.59 (28.13) -2.59 (25.04) 24.19 4.9 <.0001 0.16Role-Emotional 19.70 (32.54) -9.62 (36.95) 29.31 4.6 <.0001 0.14Mental Health 14.55 (17.77) -0.38 (18.15) 14.92 4.5 <.0001 0.14Physical Summary Score (PCS) 5.35 (9.67) 1.47 (9.08) 3.88 2.2 0.0287 0.03Mental Summary Score (MCS) 8.03 (10.59) -2.03 (10.42) 10.06 5.1 <.0001 0.17
EQ-5DIndex Score 0.25 (0.30) 0.04 (0.26) 0.22 4.2 <.0001 0.12VAS General Health 15.69 (18.96) 1.92 (23.24) 13.77 3.5 0.0006 0.09
1Responder is defined as PASI improvement ≥ 75%; non-responder is defined as PASI improvement <50%.
Table 5: Correlations1 between PROs and clinical endpoints at baseline and week 12, and change from baseline to week 12
Measure Baseline Week 12 ChangePASI PGA PASI PGA PASI PGA
DLQI Total Score 0.31 0.29 0.67 0.65 0.69 0.71SF-36
Physical Functioning -0.32 -0.14 ns -0.28 -0.25** -0.38 -0.14 nsRole-Physical -0.22** -0.14 ns -0.41 -0.37 -0.42 -0.31Bodily Pain -0.36 -0.19* -0.47 -0.42 -0.60 -0.44General Health -0.08 ns 0.05 ns -0.34 -0.33 -0.34 -0.24**Vitality -0.15 ns -0.06 ns -0.37 -0.37 -0.38 -0.31Social Functioning -0.23** -0.21** -0.46 -0.38 -0.44 -0.43Role-Emotional -0.16 ns -0.06 ns -0.37 -0.29 -0.39 -0.36Mental Health -0.17* -0.09 ns -0.46 -0.38 -0.43 -0.36Physical Summary -0.28 -0.13 ns -0.35 -0.33 -0.45 -0.25**Mental Summary -0.12 ns -0.08 ns -0.44 -0.36 -0.40 -0.42
EQ-5DIndex Score -0.40 -0.31 -0.60 -0.51 -0.57 -0.44VAS-General Health -0.24** -0.09 ns -0.52 -0.43 -0.43 -0.38
PASI 1.00 0.59 1.00 0.83 1.00 0.75
1All correlations were significant at p < 0.001, unless otherwise noted. *p ≤ 0.05, ** p < 0.01, ns = non-significant.
Page 7 of 12(page number not for citation purposes)
Health and Quality of Life Outcomes 2006, 4:71 http://www.hqlo.com/content/4/1/71
with <PASI25. One-way analyses of variance were per-formed among these groups for each of the PRO meas-ures. As can be seen by the size of the f-statistics, the DLQIwas the most responsive of the PRO measures. In fact,only the DLQI was able to demonstrate statistically signif-icant differences between responders and partial respond-ers based on post-hoc significance tests among the fourresponder groups. These results for the DLQI total scorewith respect to differences among responder groups weresimilar to those reported previously in the literature,except that the improvement in DLQI total scores dis-played in Table 7 was larger for each of the respondergroups than for the equivalent responder groupsdescribed by Shikiar and colleagues in a study of efalizu-mab [28]. As was the case for the data displayed in Table6, the responsiveness of the EQ-5D index and VAS scoreswere generally the same as for most of the SF-36 scores.Finally, both the SF-36 MCS and PCS scores were respon-sive, but the MCS was substantially more responsive, indi-cating that the impact of the disease was both physicaland mental, with the latter perhaps being more promi-nent for this study population.
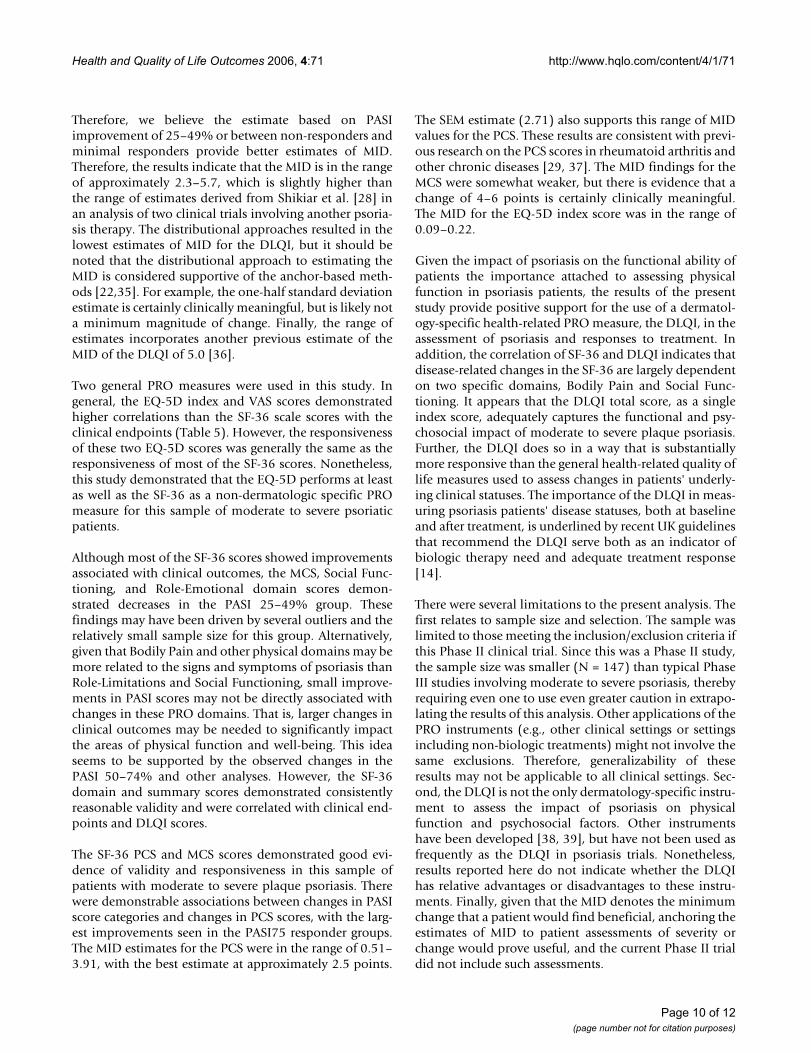
Estimates of Minimum Important DifferencesThere is no one best way to estimate the MID for a PROmeasure [21,34]. Table 8 contains three different anchor-based methods for estimating the MID based on datafrom this study. MID-1 contains the estimate obtainedfrom the scores from the "near-responders," shown as thePASI 25-PASI 49 group in Table 7; MID-2 contains theestimate corresponding to "partial responders" in thesame table 7. MID-3 corresponds to the differencebetween non-responders for the PGA (defined as patientswho had no change in score or a decrease in score by onepoint on this 7-point scale) and minimal responders forthis same measure (defined as patients who improved by1 or 2 points). The distribution-based estimates, the SEMand one-half the standard deviation of baseline scores arealso reported in Table 8.
Estimates for the DLQI MID ranged from 4.05 (for MID-1) to 6.95 (for MID-2), while the SEM was 2.33 and one-half standard deviation was 3.59. The MID results for theSF-36 PCS ranged from 0.51 (for MID-3) to 3.91 (forMID-1), with the SEM estimated as 2.71 and one-half
Table 7: PRO change scores corresponding to levels of PASI improvement
Change in Measure
PASI Improvement <25% (n = 31)
PASI Improvement
25–49% (n = 22)
PASI Improvement
50–74% (n = 21)
PASI Improvement ≥75% (n = 66)
Overall F Value p Values1
DLQI Total Score
-0.16 (5.41) -4.05 (4.95) -6.95 (5.71) -12.17 (6.78) 30.4*** 2**,3***,5***,6*
SF-36Physical Functioning
2.15 (17.67) 5.45 (23.60) 0.02 (22.36) 9.12 (23.50) 1.2
Role-Physical -11.29 (39.18) 3.41 (51.35) 14.29 (31.20) 20.08 (35.69) 4.9** 3**Bodily Pain -1.03 (21.42) 11.59 (22.96) 16.76 (22.74) 26.47 (27.40) 9.0*** 3***General Health -0.61 (17.33) 4.41 (18.37) 9.19 (11.29) 8.87 (15.62) 2.8*Vitality -1.45 (16.29) 4.77 (20.44) 6.90 (17.43) 13.01 (22.58) 3.8* 3*Social Functioning
-3.23 (23.71) -1.70 (27.36) 13.10 (17.44) 21.59 (28.13) 8.7*** 3***, 5**
Role-Emotional -11.11 (36.44) -7.58 (38.40) 17.46 (34.35) 19.70 (32.54) 7.6*** 2*, 3**, 5*Mental Health -0.77 (18.08) 0.18 (18.66) 9.52 (13.53) 14.55 (17.77) 7.2*** 3**,5*Physical Summary
-0.31 (7.18) 3.91 (10.88) 2.57 (7.78) 5.35 (9.67) 2.7*
Mental Summary
-2.19 (9.86) -1.82 (11.38) 6.05 (6.90) 8.03 (10.59) 9.9*** 2*, 3***, 5**
EQ-5DIndex Score -0.01 (0.26) 0.10 (0.24) 0.20 (0.21) 0.25 (0.30) 7.1*** 3***VAS General Health
0.58 (24.31) 3.82 (22.07) 8.43 (11.24) 15.69 (18.96) 4.8** 3**
Mean PASI Improvement2
0.94 (4.07) -6.24 (2.99) -8.94 (3.47) -14.33 (7.65)
1Pairwise comparisons between means were performed using Scheffe's test adjusting for multiple comparisons. 1 = improvement <25% vs. improvement 25–49%, 2 = improvement <25% vs. improvement 50–74%, 3 = improvement <25% vs. improvement ≥ 75%, 4 = improvement 25–49% vs. improvement 50–74%, 5 = improve 25–49% vs. improvement ≥ 75%, and 6 = improvement 50–74% vs. improvement ≥ 75%. *p < 0.05, **p < 0.01, ***p < 0.001.2Negative change scores indicate improvement.
Page 8 of 12(page number not for citation purposes)
Health and Quality of Life Outcomes 2006, 4:71 http://www.hqlo.com/content/4/1/71
standard deviation estimates as 5.12. For the MCS, theMID estimates included a decrease of 1.82 points basedon a PASI improvement of 25–49%, but the other twoMIDs were 6.05 and 6.61, respectively. The SEM for theMCS was 3.89 and one-half standard deviation was 5.61.Consistent with the MCS findings, decreases wereobserved for the Role-Emotional and Social Functioningdomains for the MID-1 definition. The differencesbetween non-responders and minimal responders rangedfrom 4.90 for Mental Health to 24.71 for Social Function-ing (Table 8). The results for the EQ-5D index score dem-onstrated an MID ranging from 0.09 (for MID-3) to 0.20(for MID-2). For the EQ-5D VAS, the available estimatesranged from 3.82 (MID-1) to 8.43 (MID-3).
DiscussionA Phase II randomized clinical trial of adalimumab inmoderate to severe plaque psoriasis provided the oppor-tunity to evaluate the validity and responsiveness to clini-cal change of three PRO assessment instruments – onedermatology-specific instrument and two general healthstatus instruments – all used as endpoints in the study. Allanalyses were performed on a blinded basis, since themain focus of these secondary analyses was on the psy-chometric qualities of the PRO instruments.
Although developed for a general population with derma-tologic diseases, the DLQI has most frequently beenapplied to patients with plaque psoriasis [27]. Morerecently, the DLQI has been used as an endpoint in clini-cal trials involving the newer class of biologics for treat-
ment of moderate to severe psoriasis, including alefacept[6,7], etanercept [9,10], and efalizumab [8,11]. Thepresent study further establishes the reliability and valid-ity of the DLQI and its responsiveness to change in theclinical status of patients over the course of a 12-weekclinical trial, confirming previous findings [28]. Changesin the DLQI total score demonstrated significant and size-able correlations with independently obtained physician-assessed changes in the clinical statuses of patients. Thisindicates that the alleviation of psoriatic signs, as deter-mined by clinical assessments, results in significant andmarked improvement in dermatologic-related functionallimitations and quality of life in patients with moderate tosevere plaque psoriasis. Based on this study, the DLQI is apsychometrically sound and responsive measure of pso-riasis-specific outcomes that captures more comprehen-sively the impact of clinical signs and symptoms onpatient well-being.
Data were also used to derive estimates of the MID of theDLQI. Although the MID is defined as the smallest differ-ence that a patient would perceive as beneficial, there wereno patient-based assessments of change in this study.Hence, lacking a patient-based anchor, the data do notprovide the basis for determining the smallest score that apatient would perceive as beneficial. We used both thePASI and the PGA, as well as two distributionalapproaches to derive estimates of the MID of the DLQI.These estimates ranged from 2.33–6.95. However, webelieve that the PASI 50 is too conservative for estimatingthe minimum change that patients will find beneficial.
Table 8: Estimates of MCID for PRO measures
Change in Measure MID-1: PASI Improvement 25–49%
MID-2: PASI Improvement 50–74%
MID-3: Difference Between Non-Responders (n = 34)
and Minimal Responders (n = 41) on PGA
SEM 0.5 SD
DLQI Total Score -4.05 (4.95) -6.95 (5.71) -5.69 2.33 3.59SF-36
Physical Functioning1 N/A N/A N/A N/A N/ARole-Physical 3.41 (51.35) 14.29 (31.20) 10.51 15.02 18.78Bodily Pain 11.59 (22.96) 16.76 (22.74) 9.05 10.76 12.69General Health 4.41 (18.37) 9.19 (11.29) 4.97 9.67 10.31Vitality 4.77 (20.44) 6.90 (17.43) 6.54 8.22 11.40Social Functioning -1.70 (27.36) 13.10 (17.44) 13.62 10.67 13.78Role-Emotional -7.58 (38.40) 17.46 (34.35) 24.71 14.59 17.70Mental Health 0.18 (18.66) 9.52 (13.53) 4.90 6.10 9.65Physical Summary Score (PCS) 3.91 (10.88) 2.57 (7.78) 0.51 2.71 5.12Mental Summary Score (MCS) -1.82 (11.38) 6.05 (6.90) 6.61 3.89 5.61
EQ-5DIndex Score 0.10 (0.24) 0.20 (0.21) 0.09 0.22 0.14VAS-General Health 3.82 (22.07) 8.43 (11.24) 4.59 N/A 10.34
Note: MID-1 corresponds to the score for the PASI 25–49 group; MID-2 corresponds to the score for the PASI50-74; for MID-3 and MID-4, reliability estimates for computing SEM were obtained from the data in this study for the DLQI and from estimates found in the literature for the SF-36 and EQ-5D.1MID estimates are not provided for the SF-36 Physical Function domain since there were not significant differences among responder groups.
Page 9 of 12(page number not for citation purposes)
Health and Quality of Life Outcomes 2006, 4:71 http://www.hqlo.com/content/4/1/71
Therefore, we believe the estimate based on PASIimprovement of 25–49% or between non-responders andminimal responders provide better estimates of MID.Therefore, the results indicate that the MID is in the rangeof approximately 2.3–5.7, which is slightly higher thanthe range of estimates derived from Shikiar et al. [28] inan analysis of two clinical trials involving another psoria-sis therapy. The distributional approaches resulted in thelowest estimates of MID for the DLQI, but it should benoted that the distributional approach to estimating theMID is considered supportive of the anchor-based meth-ods [22,35]. For example, the one-half standard deviationestimate is certainly clinically meaningful, but is likely nota minimum magnitude of change. Finally, the range ofestimates incorporates another previous estimate of theMID of the DLQI of 5.0 [36].
Two general PRO measures were used in this study. Ingeneral, the EQ-5D index and VAS scores demonstratedhigher correlations than the SF-36 scale scores with theclinical endpoints (Table 5). However, the responsivenessof these two EQ-5D scores was generally the same as theresponsiveness of most of the SF-36 scores. Nonetheless,this study demonstrated that the EQ-5D performs at leastas well as the SF-36 as a non-dermatologic specific PROmeasure for this sample of moderate to severe psoriaticpatients.
Although most of the SF-36 scores showed improvementsassociated with clinical outcomes, the MCS, Social Func-tioning, and Role-Emotional domain scores demon-strated decreases in the PASI 25–49% group. Thesefindings may have been driven by several outliers and therelatively small sample size for this group. Alternatively,given that Bodily Pain and other physical domains may bemore related to the signs and symptoms of psoriasis thanRole-Limitations and Social Functioning, small improve-ments in PASI scores may not be directly associated withchanges in these PRO domains. That is, larger changes inclinical outcomes may be needed to significantly impactthe areas of physical function and well-being. This ideaseems to be supported by the observed changes in thePASI 50–74% and other analyses. However, the SF-36domain and summary scores demonstrated consistentlyreasonable validity and were correlated with clinical end-points and DLQI scores.
The SF-36 PCS and MCS scores demonstrated good evi-dence of validity and responsiveness in this sample ofpatients with moderate to severe plaque psoriasis. Therewere demonstrable associations between changes in PASIscore categories and changes in PCS scores, with the larg-est improvements seen in the PASI75 responder groups.The MID estimates for the PCS were in the range of 0.51–3.91, with the best estimate at approximately 2.5 points.
The SEM estimate (2.71) also supports this range of MIDvalues for the PCS. These results are consistent with previ-ous research on the PCS scores in rheumatoid arthritis andother chronic diseases [29, 37]. The MID findings for theMCS were somewhat weaker, but there is evidence that achange of 4–6 points is certainly clinically meaningful.The MID for the EQ-5D index score was in the range of0.09–0.22.
Given the impact of psoriasis on the functional ability ofpatients the importance attached to assessing physicalfunction in psoriasis patients, the results of the presentstudy provide positive support for the use of a dermatol-ogy-specific health-related PRO measure, the DLQI, in theassessment of psoriasis and responses to treatment. Inaddition, the correlation of SF-36 and DLQI indicates thatdisease-related changes in the SF-36 are largely dependenton two specific domains, Bodily Pain and Social Func-tioning. It appears that the DLQI total score, as a singleindex score, adequately captures the functional and psy-chosocial impact of moderate to severe plaque psoriasis.Further, the DLQI does so in a way that is substantiallymore responsive than the general health-related quality oflife measures used to assess changes in patients' underly-ing clinical statuses. The importance of the DLQI in meas-uring psoriasis patients' disease statuses, both at baselineand after treatment, is underlined by recent UK guidelinesthat recommend the DLQI serve both as an indicator ofbiologic therapy need and adequate treatment response[14].
There were several limitations to the present analysis. Thefirst relates to sample size and selection. The sample waslimited to those meeting the inclusion/exclusion criteria ifthis Phase II clinical trial. Since this was a Phase II study,the sample size was smaller (N = 147) than typical PhaseIII studies involving moderate to severe psoriasis, therebyrequiring even one to use even greater caution in extrapo-lating the results of this analysis. Other applications of thePRO instruments (e.g., other clinical settings or settingsincluding non-biologic treatments) might not involve thesame exclusions. Therefore, generalizability of theseresults may not be applicable to all clinical settings. Sec-ond, the DLQI is not the only dermatology-specific instru-ment to assess the impact of psoriasis on physicalfunction and psychosocial factors. Other instrumentshave been developed [38, 39], but have not been used asfrequently as the DLQI in psoriasis trials. Nonetheless,results reported here do not indicate whether the DLQIhas relative advantages or disadvantages to these instru-ments. Finally, given that the MID denotes the minimumchange that a patient would find beneficial, anchoring theestimates of MID to patient assessments of severity orchange would prove useful, and the current Phase II trialdid not include such assessments.
Page 10 of 12(page number not for citation purposes)

Health and Quality of Life Outcomes 2006, 4:71 http://www.hqlo.com/content/4/1/71
ConclusionThe findings of this study highlight the importance of cap-turing PRO measures in clinical trials of moderate tosevere plaque psoriasis. This analysis provides additionalevidence supporting the psychometric qualities andresponsiveness of the DLQI as a disease-specific measureof PROs in psoriasis. The DLQI MID was determined asranging from 2.3–5.7 points. While the DLQI provides themost reliable measure of clinical change, the data fromthis study demonstrate that the SF-36 and EQ-5D per-formed well as general measures of health status out-comes. While the SF-36 has been used in previous studiescomparing psoriasis treatments [6,7,30], to date, therehave been few applications of the EQ-5D in clinical trialsof patients with moderate to severe plaque psoriasis. Theresults of this study indicate that these two instrumentsshould be considered as a general health outcome meas-ure in future clinical trials.
Competing interestsThe work reported here was performed under contract bythe United BioSource Corporation to Abbott Laborato-ries. Authors 1, 4, and 5 are employees of the United Bio-Source Corporation, which performed this work undercontract. Authors 2 and 3 are current employees of AbbottLaboratories.
Authors' contributionsRS was responsible for the planning and analysis of theresearch reported here. MKW provided key analysis andinterpretation of the data, and revised the manuscript crit-ically for important intellectual content. MMO contrib-uted important clinical insights into the research. CSTcontributed suggestions for analysis and provided analyt-ical support for the research. DAR contributed to the anal-ysis and interpretation of the research and reviews of themanuscript. All authors reviewed and approved this man-uscript prior to submission.
AcknowledgementsThe work reported here was performed under a contract to the United BioSource Corporation from Abbott Laboratories. Lisa E. Melilli, DrPH, formerly of Abbott Laboratories contributed substantial important scien-tific and analytical suggestions and insights, and reviews of the manuscript. Mary Cifaldi, PhD, RPh., MSHA, of Abbott Laboratories provided invaluable reviews and comments on previous drafts of this manuscript. The authors thank Michael Nissen, ELS, of Abbott Laboratories for his editing assistance in the development of this manuscript.
Portions of these results were presented at poster and podium sessions at the European Meeting of the International Society for Pharmacoeconomic Research in Florence, Italy, November 2005.
References1. de Arruda LH, De Moraes AP: The impact of psoriasis on quality
of life. Br J Dermatol 2001, 144:33-36.2. Finlay AY: Quality of life assessments in dermatology. Semin
Cutan Med Surg 1998, 17:291-296.
3. Rapp SR, Cottrell CA, Leary MR: Social coping strategies associ-ated with quality of life decrements among psoriasispatients. Br J Dermatol 2001, 145:610-616.
4. Wahl A: The impact of psoriasis on psychosocial life domains.A review. Scand J Caring Sci 1997, 11:243-249.
5. Weiss SC, Kimball AB, Liewehr DJ, Blauvelt A, Turner ML, EmanuelEJ: Quantifying the harmful effect of psoriasis on health-related quality of life. J Am Acad Dermatol 2002, 47:512-518.
6. Feldman SR, Menter A, Koo JY: Improved health-related qualityof life following a randomized controlled trial of alefacepttreatment in patients with chronic plaque psoriasis. Br J Der-matol 2004, 150:317-326.
7. Finlay AY, Salek MS, Haney J: Intramuscular alefacept improveshealth-related quality of life in patients with chronic plaquepsoriasis. Dermatology 2003, 206:307-315.
8. Gordon KB, Papp KA, Hamilton TK, Walicke PA, Dummer W, Li N,Bresnahan BW, Menter A: Efalizumab for patients with moder-ate to severe plaque psoriasis: a randomized controlled trial.JAMA 2003, 290:3073-3080.
9. Gottlieb AB, Matheson RT, Lowe N, Krueger GG, Kang S, Goffe BS,Gaspari AA, Ling M, Weinstein GD, Nayak A, Gordon KB, Zitnik R:A randomized trial of etanercept as monotherapy for psoria-sis. Arch Dermatol 2003, 139:1627-32; discussion 1632.
10. Leonardi CL, Powers JL, Matheson RT, Goffe BS, Zitnik R, Wang A,Gottlieb AB: Etanercept as monotherapy in patients with pso-riasis. N Engl J Med 2003, 349:2014-2022.
11. Menter A, Kosinski M, Bresnahan BW, Papp KA, Ware JEJ: Impactof efalizumab on psoriasis-specific patient-reported out-comes. Results from three randomized, placebo-controlledclinical trials of moderate to severe plaque psoriasis. J DrugsDermatol 2004, 3:27-38.
12. Kirby B, Richards HL, Woo P, Hindle E, Main CJ, Griffiths CE: Phys-ical and psychologic measures are necessary to assess overallpsoriasis severity. J Am Acad Dermatol 2001, 45:72-76.
13. Krueger GG, Feldman SR, Camisa C, Duvic M, Elder JT, Gottlieb AB,Koo J, Krueger JG, Lebwohl M, Lowe N, Menter A, Morison WL,Prystowsky JH, Shupack JL, Taylor JR, Weinstein GD, Barton TL, Rol-stad T, Day RM: Two considerations for patients with psoriasisand their clinicians: what defines mild, moderate, and severepsoriasis? What constitutes a clinically significant improve-ment when treating psoriasis? J Am Acad Dermatol 2000,43:281-285.
14. Smith CH, Anstey AV, Barker JN, Burden AD, Chalmers RJ, ChandlerD, Finlay AY, Grifitths CE, Jackson K, McHugh NJ, McKenna KE, Rey-nolds NJ, Ormerod AD: British Association of Dermatologistsguidelines for use of biological interventions in psoriasis2005. Br J Dermatol 2005, 153:486-497.
15. Finlay AY, Khan GK: Dermatology Life Quality Index (DLQI)--a simple practical measure for routine clinical use. Clin ExpDermatol 1994, 19:210-216.
16. Ware JE, Snow KK, Kosinski MK, Gandek B: SF-36 Health Survey:Manual and Interpretation Guide. Boston, The Health Institute,New England Medical Center; 1993.
17. EuroQol Group: EuroQol--a new facility for the measurementof health-related quality of life. Health Policy 1990, 16:199-208.
18. Kind P: The EuroQol Instrument: An index of health-relatedquality of life. In Quality of Life and Pharmacoeconomics in Clinical Tri-als 2nd edition. Edited by: Spilker B. Philadelphia, Lippincott-RavenPublishers; 1996:191-201.
19. Food and Drug Administration: Guidance for industry. Patient-reported outcome measures: use in medical product devel-opment to support labeling claims. Draft. .
20. Juniper EF, Guyatt GH, Willan A, Griffith LE: Determining a mini-mal important change in a disease-specific Quality of LifeQuestionnaire. J Clin Epidemiol 1994, 47:81-87.
21. Gordon KB, Langley RG, Leonardi C, Toth D, Menter MA, Kang S,Heffernan M, Miller B, Hamlin R, Lim L, Zhong J, Hoffman R, OkunMM: Clinical response to adalimumab treatment in moder-ate to severe psoriasis patients: double-blind, randomizedcontrolled trial and open-label extension study. JAAD in press.
22. Ashcroft DM, Wan Po AL, Williams HC, Griffiths CE: Clinicalmeasures of disease severity and outcome in psoriasis: a crit-ical appraisal of their quality. Br J Dermatol 1999, 141:185-191.
23. Fredriksson T, Pettersson U: Severe psoriasis--oral therapy witha new retinoid. Dermatologica 1978, 157:238-244.
Page 11 of 12(page number not for citation purposes)
http://www.ncbi.nlm.nih.gov/entrez/query.fcgi?cmd=Retrieve&db=PubMed&dopt=Abstract&list_uids=9859917
http://www.ncbi.nlm.nih.gov/entrez/query.fcgi?cmd=Retrieve&db=PubMed&dopt=Abstract&list_uids=9505733
http://www.ncbi.nlm.nih.gov/entrez/query.fcgi?cmd=Retrieve&db=PubMed&dopt=Abstract&list_uids=9505733
http://www.ncbi.nlm.nih.gov/entrez/query.fcgi?cmd=Retrieve&db=PubMed&dopt=Abstract&list_uids=8033378
http://www.ncbi.nlm.nih.gov/entrez/query.fcgi?cmd=Retrieve&db=PubMed&dopt=Abstract&list_uids=8033378
http://www.ncbi.nlm.nih.gov/entrez/query.fcgi?cmd=Retrieve&db=PubMed&dopt=Abstract&list_uids=8283197
http://www.ncbi.nlm.nih.gov/entrez/query.fcgi?cmd=Retrieve&db=PubMed&dopt=Abstract&list_uids=8283197
Health and Quality of Life Outcomes 2006, 4:71 http://www.hqlo.com/content/4/1/71
Publish with BioMed Central and every scientist can read your work free of charge
"BioMed Central will be the most significant development for disseminating the results of biomedical research in our lifetime."
Sir Paul Nurse, Cancer Research UK
Your research papers will be:
available free of charge to the entire biomedical community
peer reviewed and published immediately upon acceptance
cited in PubMed and archived on PubMed Central
yours — you keep the copyright
Submit your manuscript here:http://www.biomedcentral.com/info/publishing_adv.asp
BioMedcentral
24. Badia X, Mascaro JM, Lozano R: Measuring health-related qualityof life in patients with mild to moderate eczema and psoria-sis: clinical validity, reliability and sensitivity to change of theDLQI. The Cavide Research Group. Br J Dermatol 1999,141:698-702.
25. Lewis V, Finlay AY: 10 years experience of the DermatologyLife Quality Index (DLQI). J Investig Dermatol Symp Proc 2004,9:169-180.
26. Shikiar R, Bresnahan BW, Stone SP, Thompson C, Koo J, Revicki DA:Validity and reliability of patient reported outcomes used inPsoriasis: results from two randomized clinical trials. HealthQual Life Outcomes 2003, 1:53.
27. Ware JE, Kosinski MK, Keller SD: SF-36 Physical and MentalHealth Summary Scales: A User's Manual. Boston, The HealthInstitute, New England Medical Center; 1994.
28. Wahl A, Loge JH, Wiklund I, Hanestad BR: The burden of psoria-sis: a study concerning health-related quality of life amongNorwegian adult patients with psoriasis compared with gen-eral population norms. J Am Acad Dermatol 2000, 43:803-808.
29. Wyrwich KW, Nienaber NA, Tierney WM, Wolinsky FD: Linkingclinical relevance and statistical significance in evaluatingintra-individual changes in health-related quality of life. MedCare 1999, 37:469-478.
30. Wyrwich KW, Tierney WM, Wolinsky FD: Further evidence sup-porting an SEM-based criterion for identifying meaningfulintra-individual changes in health-related quality of life. J ClinEpidemiol 1999, 52:861-873.
31. Norman GR, Sloan JA, Wyrwich KW: Interpretation of changesin health-related quality of life: the remarkable universalityof half a standard deviation. Med Care 2003, 41:582-592.
32. Beaton DE, Boers M, Wells GA: Many faces of the minimal clin-ically important difference (MCID): a literature review anddirections for future research. Curr Opin Rheumatol 2002,14:109-114.
33. Hays RD, Farivar SS, Liu H: Approaches and recommendationsfor estimating minimally important differences for health-related quality of life measures. Journal of Chronic Obstructive Pul-monary Disease 2005, 2:63-67.
34. Khilji FA, Gonzalez M, Finlay AY: Clinical meaning of change inDermatology Life Quality Index. Br J Dermatol 2002, 147:50(abstract).
35. Chren MM, Lasek RJ, Quinn LM, Mostow EN, Zyzanski SJ: Skindex,a quality-of-life measure for patients with skin disease: relia-bility, validity, and responsiveness. J Invest Dermatol 1996,107:707-713.
36. McKenna SP, Lebwohl M, Kahler KN: Development of the USPSORIQoL: a psoriasis-specific measure of quality of life. IntJ Dermatol 2005, 44:462-469.
Page 12 of 12(page number not for citation purposes)
http://www.ncbi.nlm.nih.gov/entrez/query.fcgi?cmd=Retrieve&db=PubMed&dopt=Abstract&list_uids=8875954
http://www.ncbi.nlm.nih.gov/entrez/query.fcgi?cmd=Retrieve&db=PubMed&dopt=Abstract&list_uids=8875954