Interactions between polyphenolic antioxidants quercetin and ...
Upload
independentCategory
view
1download
0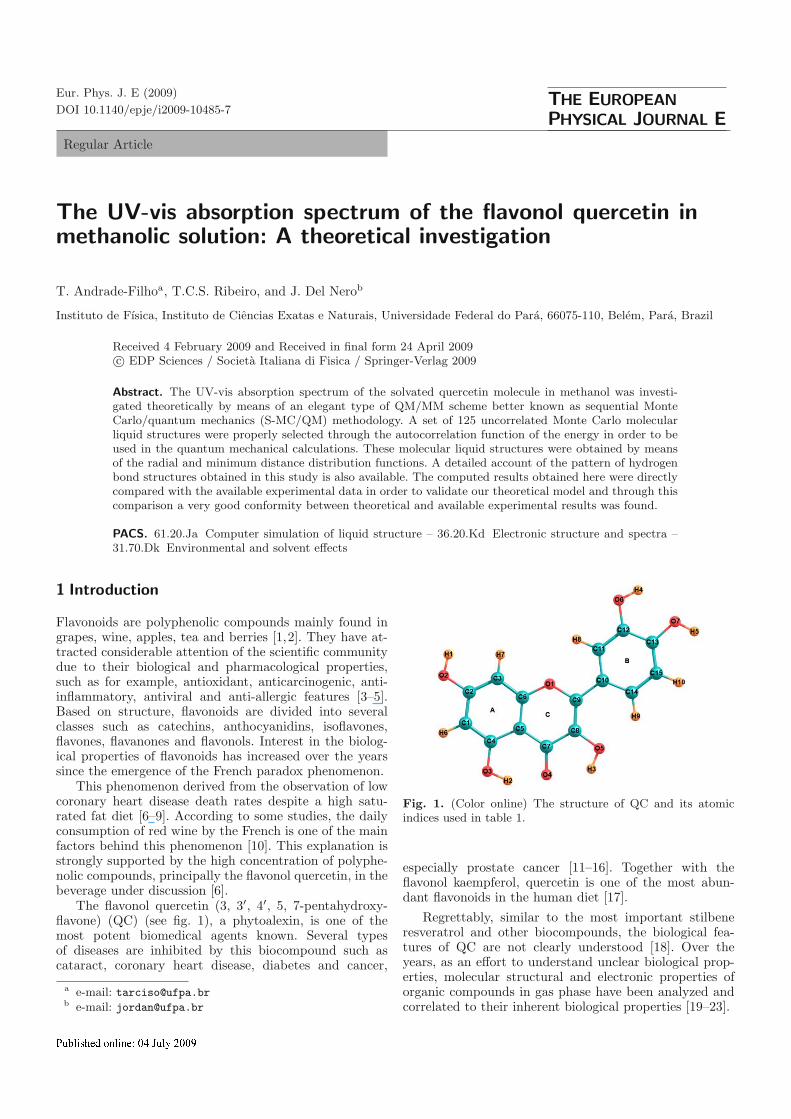
DOI 10.1140/epje/i2009-10485-7
Regular Article
Eur. Phys. J. E (2009) THE EUROPEANPHYSICAL JOURNAL E
The UV-vis absorption spectrum of the flavonol quercetin inmethanolic solution: A theoretical investigation
T. Andrade-Filhoa, T.C.S. Ribeiro, and J. Del Nerob
Instituto de Fısica, Instituto de Ciencias Exatas e Naturais, Universidade Federal do Para, 66075-110, Belem, Para, Brazil
Received 4 February 2009 and Received in final form 24 April 2009c© EDP Sciences / Societa Italiana di Fisica / Springer-Verlag 2009
Abstract. The UV-vis absorption spectrum of the solvated quercetin molecule in methanol was investi-gated theoretically by means of an elegant type of QM/MM scheme better known as sequential MonteCarlo/quantum mechanics (S-MC/QM) methodology. A set of 125 uncorrelated Monte Carlo molecularliquid structures were properly selected through the autocorrelation function of the energy in order to beused in the quantum mechanical calculations. These molecular liquid structures were obtained by meansof the radial and minimum distance distribution functions. A detailed account of the pattern of hydrogenbond structures obtained in this study is also available. The computed results obtained here were directlycompared with the available experimental data in order to validate our theoretical model and through thiscomparison a very good conformity between theoretical and available experimental results was found.
PACS. 61.20.Ja Computer simulation of liquid structure – 36.20.Kd Electronic structure and spectra –31.70.Dk Environmental and solvent effects
1 Introduction
Flavonoids are polyphenolic compounds mainly found ingrapes, wine, apples, tea and berries [1,2]. They have at-tracted considerable attention of the scientific communitydue to their biological and pharmacological properties,such as for example, antioxidant, anticarcinogenic, anti-inflammatory, antiviral and anti-allergic features [3–5].Based on structure, flavonoids are divided into severalclasses such as catechins, anthocyanidins, isoflavones,flavones, flavanones and flavonols. Interest in the biolog-ical properties of flavonoids has increased over the yearssince the emergence of the French paradox phenomenon.
This phenomenon derived from the observation of lowcoronary heart disease death rates despite a high satu-rated fat diet [6–9]. According to some studies, the dailyconsumption of red wine by the French is one of the mainfactors behind this phenomenon [10]. This explanation isstrongly supported by the high concentration of polyphe-nolic compounds, principally the flavonol quercetin, in thebeverage under discussion [6].
The flavonol quercetin (3, 3′, 4′, 5, 7-pentahydroxy-flavone) (QC) (see fig. 1), a phytoalexin, is one of themost potent biomedical agents known. Several typesof diseases are inhibited by this biocompound such ascataract, coronary heart disease, diabetes and cancer,
a e-mail: [email protected] e-mail: [email protected]
Fig. 1. (Color online) The structure of QC and its atomicindices used in table 1.
especially prostate cancer [11–16]. Together with theflavonol kaempferol, quercetin is one of the most abun-dant flavonoids in the human diet [17].
Regrettably, similar to the most important stilbeneresveratrol and other biocompounds, the biological fea-tures of QC are not clearly understood [18]. Over theyears, as an effort to understand unclear biological prop-erties, molecular structural and electronic properties oforganic compounds in gas phase have been analyzed andcorrelated to their inherent biological properties [19–23].
2 The European Physical Journal E
Nevertheless, in nature, biocompounds are found inmost liquid environments. For this reason, in the currenttheoretical investigation, in order to better understand theelectronic properties of the flavonol under investigation ina realistic environment, we thus simulate the UV-vis ab-sorption spectrum of quercetin in methanolic solution bymeans of the QM/MM scheme developed by Coutinho andCanuto better know as sequential Monte Carlo/quantummechanical (S-MC/QM) methodology [24].
The inclusion of the methanol solvent molecules [25–27] in the UV-vis absorption spectrum QM calculations ofthe quercetin molecule was properly obtained by means ofthe radial and minimum distance distribution functions.The structures connected via hydrogen bonds were alsoinvestigated.
The aim of this molecular liquid simulation is to studyhow the π → π∗ transition energy of QC is modifiedthrough the discrete process of inclusion of methanolmolecules within the hydrogen bond, micro, first and sec-ond solvation shells for use in performing QM calcula-tions [26–28].
The theoretical model proposed here was directly com-pared with the available experimental observations in or-der to be validated and through this comparison a verygood agreement between theoretical and available experi-mental results was found.
2 Computational details
Our calculations started with the geometry optimizationof quercetin in vacuum by means of the Gaussian 98 suiteof programs [29]. It was treated quantum mechanicallyby the well-established hybrid B3LYP density functionaland 6-31+G(d) basis set. Our molecular liquid simulationwas performed in a cubic cell with a total of 1000 OPLS-UA [30] methanol solvent molecules and a QC moleculeas solute.
The non-electrostatic Lennard-Jones parameters ofQC molecule were obtained from the OPLS-AA force field(see table 1) [31]. The partial charges of QC were com-puted via Breneman-Wiberg CHELPG fitting scheme [32]using the B3LYP/6-31+G(d) level of computation. TheMetropolis MC simulation was carried out by DICE pro-gram [33].
Metropolis MC algorithm and periodic boundary con-ditions under the minimum image convention tech-nique [34] were used in the canonical (NVT) en-semble. The simulation cell with dimensions 40.870 ×40.870 × 40.870 A3 was determined by the density of liq-uid methanol (0.7866 g/cm3) at room temperature [35].The intermolecular non-bonded interactions were calcu-lated through the sum of Lennard-Jones and Coulombpotential functions.
A non-bonded spherical cutoff radius of 20.435 A wasused to truncate the intermolecular non-bonded inter-actions [34]. The molecular liquid was thermalized for5.0 × 107 MC steps followed by a production stage of2.0 × 108 MC steps. The molecular geometries of the so-
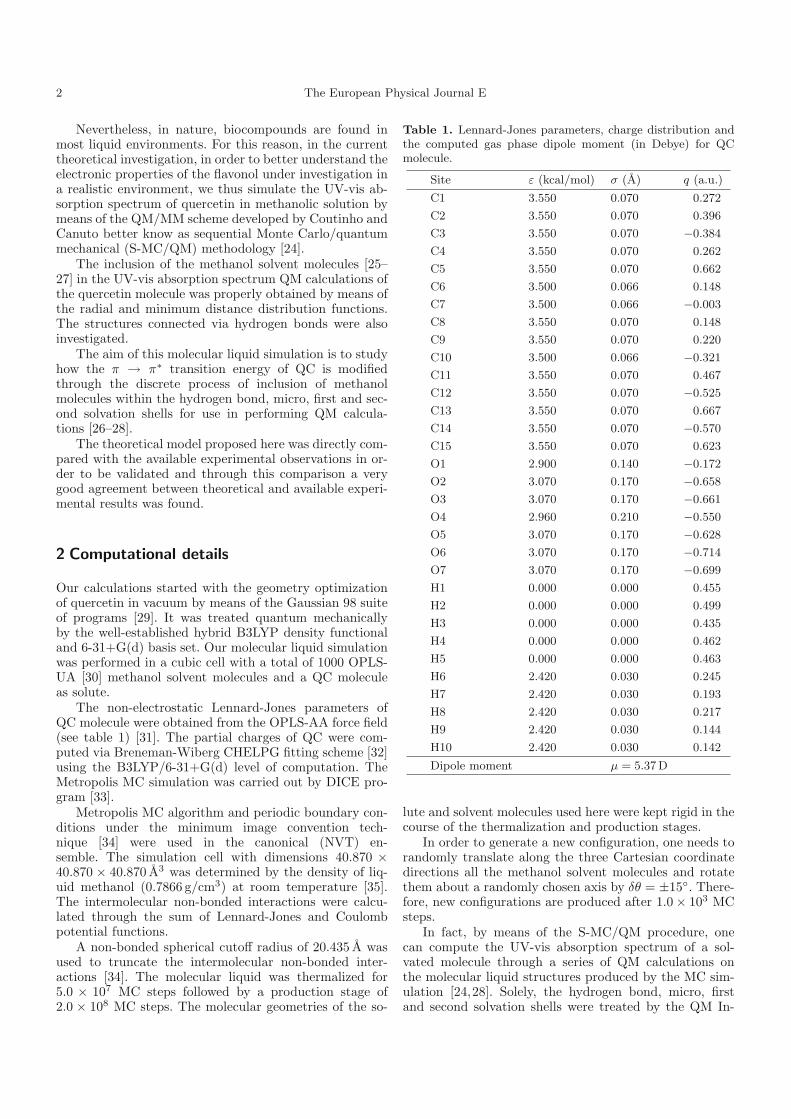
Table 1. Lennard-Jones parameters, charge distribution andthe computed gas phase dipole moment (in Debye) for QCmolecule.
Site ε (kcal/mol) σ (A) q (a.u.)
C1 3.550 0.070 0.272
C2 3.550 0.070 0.396
C3 3.550 0.070 −0.384
C4 3.550 0.070 0.262
C5 3.550 0.070 0.662
C6 3.500 0.066 0.148
C7 3.500 0.066 −0.003
C8 3.550 0.070 0.148
C9 3.550 0.070 0.220
C10 3.500 0.066 −0.321
C11 3.550 0.070 0.467
C12 3.550 0.070 −0.525
C13 3.550 0.070 0.667
C14 3.550 0.070 −0.570
C15 3.550 0.070 0.623
O1 2.900 0.140 −0.172
O2 3.070 0.170 −0.658
O3 3.070 0.170 −0.661
O4 2.960 0.210 −0.550
O5 3.070 0.170 −0.628
O6 3.070 0.170 −0.714
O7 3.070 0.170 −0.699
H1 0.000 0.000 0.455
H2 0.000 0.000 0.499
H3 0.000 0.000 0.435
H4 0.000 0.000 0.462
H5 0.000 0.000 0.463
H6 2.420 0.030 0.245
H7 2.420 0.030 0.193
H8 2.420 0.030 0.217
H9 2.420 0.030 0.144
H10 2.420 0.030 0.142
Dipole moment μ = 5.37 D
lute and solvent molecules used here were kept rigid in thecourse of the thermalization and production stages.
In order to generate a new configuration, one needs torandomly translate along the three Cartesian coordinatedirections all the methanol solvent molecules and rotatethem about a randomly chosen axis by δθ = ±15◦. There-fore, new configurations are produced after 1.0 × 10³ MCsteps.
In fact, by means of the S-MC/QM procedure, onecan compute the UV-vis absorption spectrum of a sol-vated molecule through a series of QM calculations onthe molecular liquid structures produced by the MC sim-ulation [24,28]. Solely, the hydrogen bond, micro, firstand second solvation shells were treated by the QM In-
T. Andrade-Filho et al.: The UV-vis absorption spectrum of the flavonol quercetin in methanolic solution . . . 3
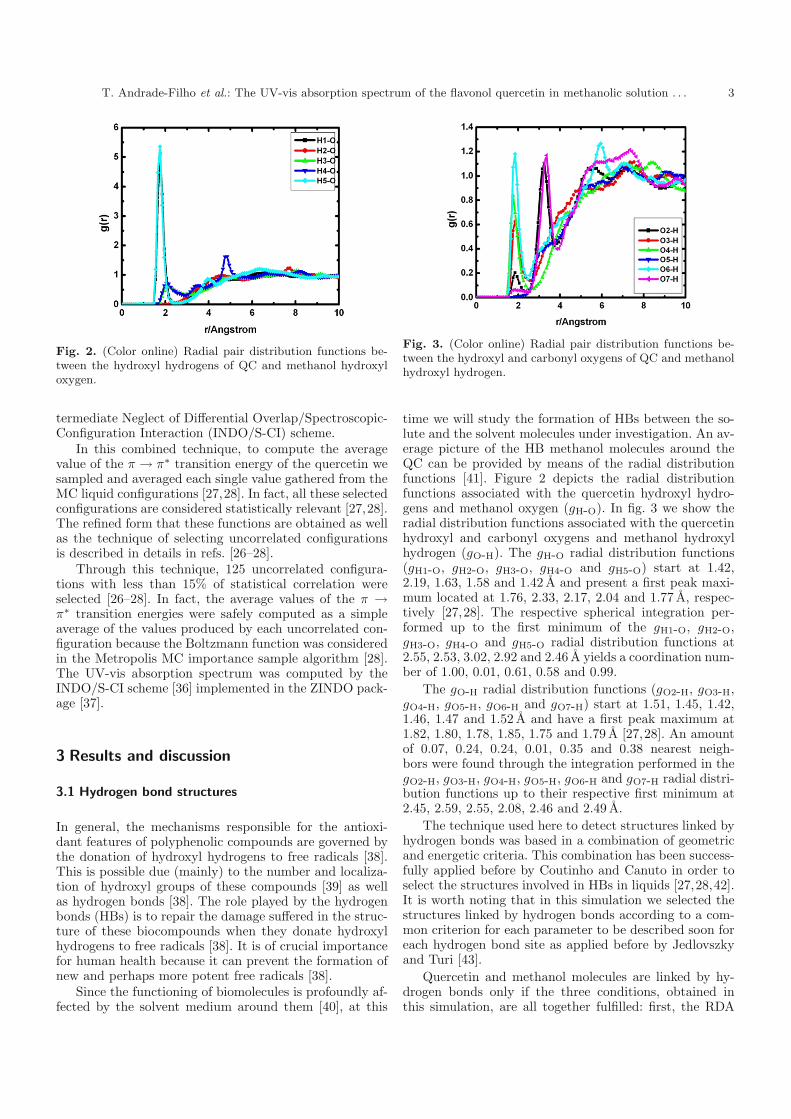
Fig. 2. (Color online) Radial pair distribution functions be-tween the hydroxyl hydrogens of QC and methanol hydroxyloxygen.
termediate Neglect of Differential Overlap/Spectroscopic-Configuration Interaction (INDO/S-CI) scheme.
In this combined technique, to compute the averagevalue of the π → π∗ transition energy of the quercetin wesampled and averaged each single value gathered from theMC liquid configurations [27,28]. In fact, all these selectedconfigurations are considered statistically relevant [27,28].The refined form that these functions are obtained as wellas the technique of selecting uncorrelated configurationsis described in details in refs. [26–28].
Through this technique, 125 uncorrelated configura-tions with less than 15% of statistical correlation wereselected [26–28]. In fact, the average values of the π →π∗ transition energies were safely computed as a simpleaverage of the values produced by each uncorrelated con-figuration because the Boltzmann function was consideredin the Metropolis MC importance sample algorithm [28].The UV-vis absorption spectrum was computed by theINDO/S-CI scheme [36] implemented in the ZINDO pack-age [37].
3 Results and discussion
3.1 Hydrogen bond structures
In general, the mechanisms responsible for the antioxi-dant features of polyphenolic compounds are governed bythe donation of hydroxyl hydrogens to free radicals [38].This is possible due (mainly) to the number and localiza-tion of hydroxyl groups of these compounds [39] as wellas hydrogen bonds [38]. The role played by the hydrogenbonds (HBs) is to repair the damage suffered in the struc-ture of these biocompounds when they donate hydroxylhydrogens to free radicals [38]. It is of crucial importancefor human health because it can prevent the formation ofnew and perhaps more potent free radicals [38].
Since the functioning of biomolecules is profoundly af-fected by the solvent medium around them [40], at this
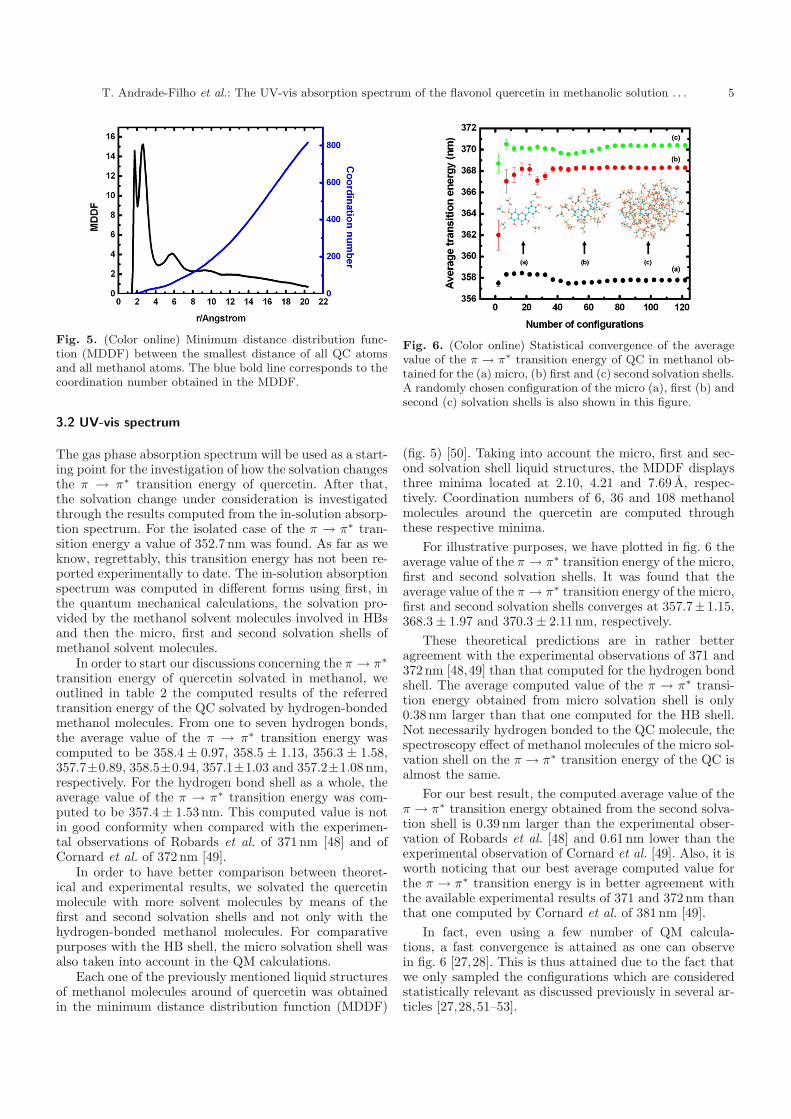
Fig. 3. (Color online) Radial pair distribution functions be-tween the hydroxyl and carbonyl oxygens of QC and methanolhydroxyl hydrogen.
time we will study the formation of HBs between the so-lute and the solvent molecules under investigation. An av-erage picture of the HB methanol molecules around theQC can be provided by means of the radial distributionfunctions [41]. Figure 2 depicts the radial distributionfunctions associated with the quercetin hydroxyl hydro-gens and methanol oxygen (gH-O). In fig. 3 we show theradial distribution functions associated with the quercetinhydroxyl and carbonyl oxygens and methanol hydroxylhydrogen (gO-H). The gH-O radial distribution functions(gH1-O, gH2-O, gH3-O, gH4-O and gH5-O) start at 1.42,2.19, 1.63, 1.58 and 1.42 A and present a first peak maxi-mum located at 1.76, 2.33, 2.17, 2.04 and 1.77 A, respec-tively [27,28]. The respective spherical integration per-formed up to the first minimum of the gH1-O, gH2-O,gH3-O, gH4-O and gH5-O radial distribution functions at2.55, 2.53, 3.02, 2.92 and 2.46 A yields a coordination num-ber of 1.00, 0.01, 0.61, 0.58 and 0.99.
The gO-H radial distribution functions (gO2-H, gO3-H,gO4-H, gO5-H, gO6-H and gO7-H) start at 1.51, 1.45, 1.42,1.46, 1.47 and 1.52 A and have a first peak maximum at1.82, 1.80, 1.78, 1.85, 1.75 and 1.79 A [27,28]. An amountof 0.07, 0.24, 0.24, 0.01, 0.35 and 0.38 nearest neigh-bors were found through the integration performed in thegO2-H, gO3-H, gO4-H, gO5-H, gO6-H and gO7-H radial distri-bution functions up to their respective first minimum at2.45, 2.59, 2.55, 2.08, 2.46 and 2.49 A.
The technique used here to detect structures linked byhydrogen bonds was based in a combination of geometricand energetic criteria. This combination has been success-fully applied before by Coutinho and Canuto in order toselect the structures involved in HBs in liquids [27,28,42].It is worth noting that in this simulation we selected thestructures linked by hydrogen bonds according to a com-mon criterion for each parameter to be described soon foreach hydrogen bond site as applied before by Jedlovszkyand Turi [43].
Quercetin and methanol molecules are linked by hy-drogen bonds only if the three conditions, obtained inthis simulation, are all together fulfilled: first, the RDA

4 The European Physical Journal E
Fig. 4. (Color online) Snapshots of the hydrogen bond interactions between QC and methanol molecules.
Table 2. Statistics of the hydrogen bonds formed between QCand methanol and their π → π∗ average transition energies.
Number of HBs Occurrence (%) π → π∗ (nm)
1 0.4 358.4 ± 0.97
2 12.5 358.5 ± 1.13
3 23.5 356.3 ± 1.58
4 26.9 356.7 ± 0.89
5 23.5 358.5 ± 0.94
6 6.7 357.1 ± 1.03
7 6.5 357.2 ± 1.08
Total (HB shell) 100 357.4 ± 1.53
distance is closer than 3.5 A. Second, the AHD angle iscloser than 40◦ and third, the binding energy is largerthan 6.0 kcal/mol [27,28,42,44,45].
In this sense, according to the set of three conditionsconsidered in this study, a total amount of 446 HBs be-tween QC and methanol solvent molecules were formedwhose pattern of formation ranges from one to seven HBs
(see fig. 4). The statistical data concerning the occurrenceof the HBs formed in this work is outlined in table 2.As can be noticed, the majority of the uncorrelated con-figurations are involved in one to four hydrogen bonds(63.3%) [46].
It is apparent that the results reported above do notprovide any information concerning the HB donor and ac-ceptor ability of QC is available. We found that in 2.2,6.2, 6.2, 0.4, 9.6 and 0.9% of the configurations, the O2,O3, O4, O5, O6 and O7 atomic sites act as acceptors ofhydrogen bonds. In 26.4, 8.5, 11.4 and 28.2% of the con-figurations O2-H1, O5-H3, O6-H4, and O7-H5 groups actas donors of hydrogen bonds, respectively.
It was found that the O3-H2 group does not act as adonor of hydrogen bonds. From these results, it can benoticed that the O6 atomic site demonstrates the great-est ability to accept HBs and the O7-H5 group to donateHBs. Taking into account the antioxidant capacity, onecan note through these results that the B-ring of quercetin(see fig. 1) is the more important site involved in donationof HBs compared to the A- and C-rings [47]. In fact, thisis in agreement with the reported literature [47].
T. Andrade-Filho et al.: The UV-vis absorption spectrum of the flavonol quercetin in methanolic solution . . . 5
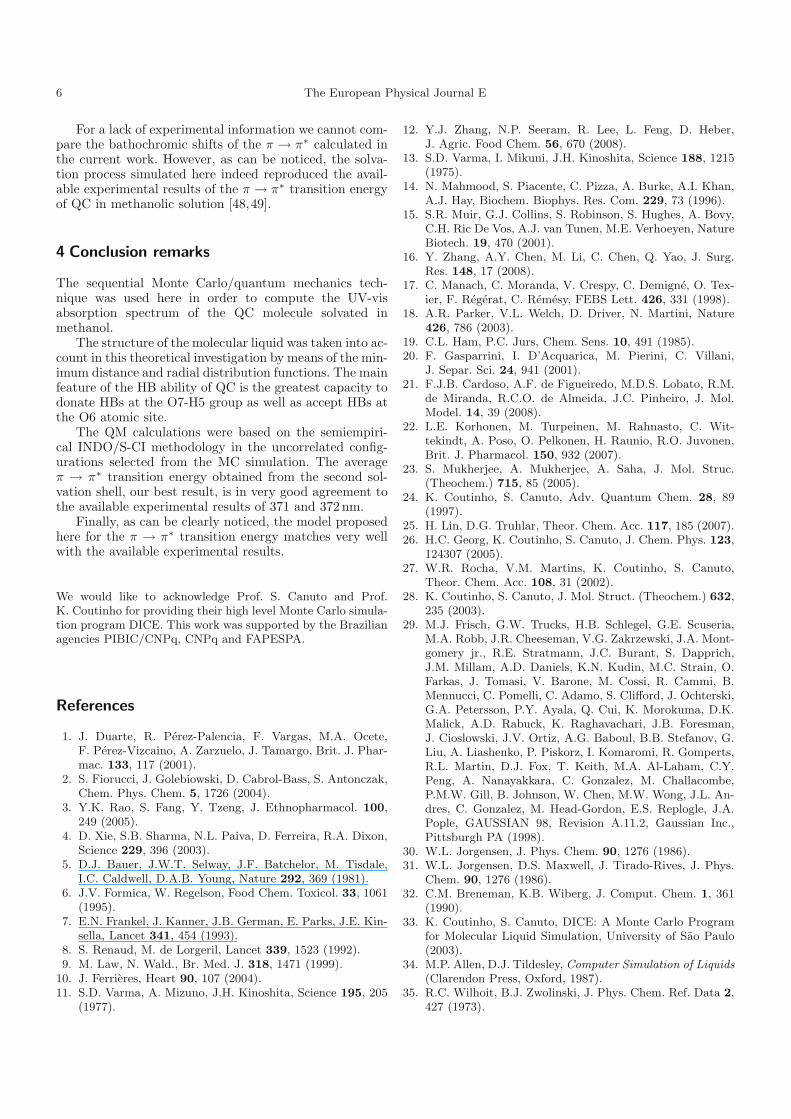
Fig. 5. (Color online) Minimum distance distribution func-tion (MDDF) between the smallest distance of all QC atomsand all methanol atoms. The blue bold line corresponds to thecoordination number obtained in the MDDF.
3.2 UV-vis spectrum
The gas phase absorption spectrum will be used as a start-ing point for the investigation of how the solvation changesthe π → π∗ transition energy of quercetin. After that,the solvation change under consideration is investigatedthrough the results computed from the in-solution absorp-tion spectrum. For the isolated case of the π → π∗ tran-sition energy a value of 352.7 nm was found. As far as weknow, regrettably, this transition energy has not been re-ported experimentally to date. The in-solution absorptionspectrum was computed in different forms using first, inthe quantum mechanical calculations, the solvation pro-vided by the methanol solvent molecules involved in HBsand then the micro, first and second solvation shells ofmethanol solvent molecules.
In order to start our discussions concerning the π → π∗
transition energy of quercetin solvated in methanol, weoutlined in table 2 the computed results of the referredtransition energy of the QC solvated by hydrogen-bondedmethanol molecules. From one to seven hydrogen bonds,the average value of the π → π∗ transition energy wascomputed to be 358.4 ± 0.97, 358.5 ± 1.13, 356.3 ± 1.58,357.7±0.89, 358.5±0.94, 357.1±1.03 and 357.2±1.08 nm,respectively. For the hydrogen bond shell as a whole, theaverage value of the π → π∗ transition energy was com-puted to be 357.4 ± 1.53 nm. This computed value is notin good conformity when compared with the experimen-tal observations of Robards et al. of 371 nm [48] and ofCornard et al. of 372 nm [49].
In order to have better comparison between theoret-ical and experimental results, we solvated the quercetinmolecule with more solvent molecules by means of thefirst and second solvation shells and not only with thehydrogen-bonded methanol molecules. For comparativepurposes with the HB shell, the micro solvation shell wasalso taken into account in the QM calculations.
Each one of the previously mentioned liquid structuresof methanol molecules around of quercetin was obtainedin the minimum distance distribution function (MDDF)
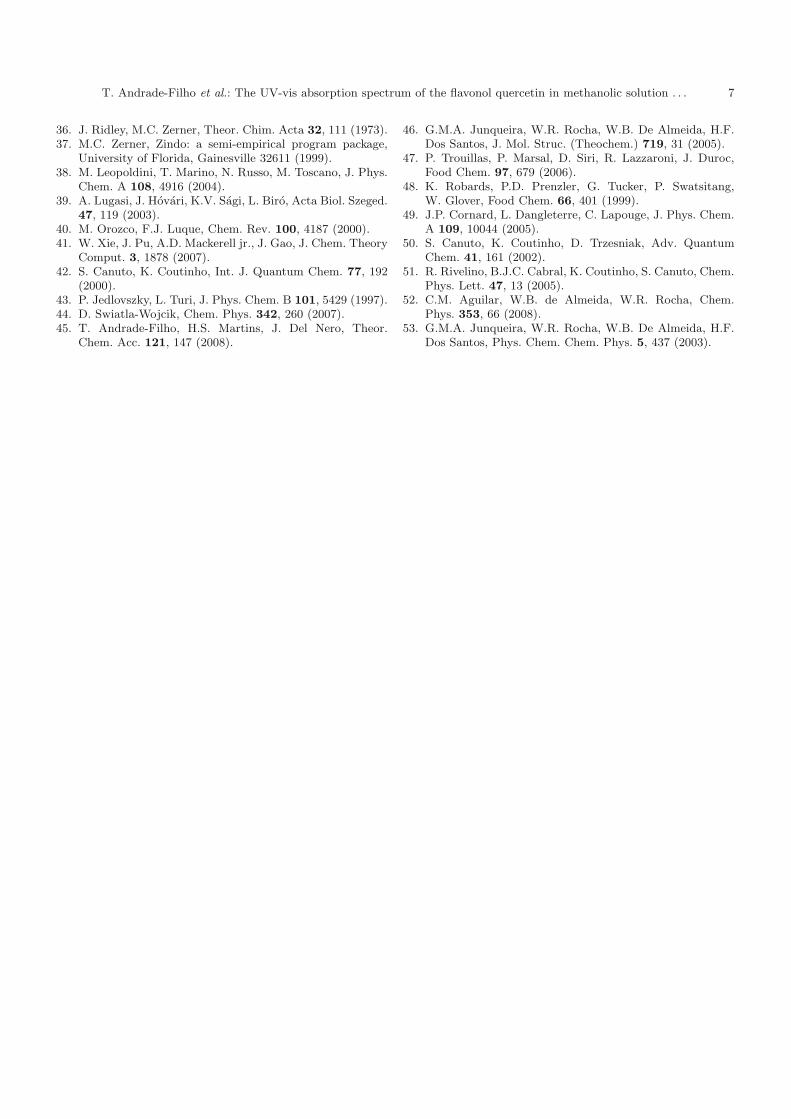
Fig. 6. (Color online) Statistical convergence of the averagevalue of the π → π∗ transition energy of QC in methanol ob-tained for the (a) micro, (b) first and (c) second solvation shells.A randomly chosen configuration of the micro (a), first (b) andsecond (c) solvation shells is also shown in this figure.
(fig. 5) [50]. Taking into account the micro, first and sec-ond solvation shell liquid structures, the MDDF displaysthree minima located at 2.10, 4.21 and 7.69 A, respec-tively. Coordination numbers of 6, 36 and 108 methanolmolecules around the quercetin are computed throughthese respective minima.
For illustrative purposes, we have plotted in fig. 6 theaverage value of the π → π∗ transition energy of the micro,first and second solvation shells. It was found that theaverage value of the π → π∗ transition energy of the micro,first and second solvation shells converges at 357.7± 1.15,368.3 ± 1.97 and 370.3 ± 2.11 nm, respectively.
These theoretical predictions are in rather betteragreement with the experimental observations of 371 and372 nm [48,49] than that computed for the hydrogen bondshell. The average computed value of the π → π∗ transi-tion energy obtained from micro solvation shell is only0.38 nm larger than that one computed for the HB shell.Not necessarily hydrogen bonded to the QC molecule, thespectroscopy effect of methanol molecules of the micro sol-vation shell on the π → π∗ transition energy of the QC isalmost the same.
For our best result, the computed average value of theπ → π∗ transition energy obtained from the second solva-tion shell is 0.39 nm larger than the experimental obser-vation of Robards et al. [48] and 0.61 nm lower than theexperimental observation of Cornard et al. [49]. Also, it isworth noticing that our best average computed value forthe π → π∗ transition energy is in better agreement withthe available experimental results of 371 and 372 nm thanthat one computed by Cornard et al. of 381 nm [49].
In fact, even using a few number of QM calcula-tions, a fast convergence is attained as one can observein fig. 6 [27,28]. This is thus attained due to the fact thatwe only sampled the configurations which are consideredstatistically relevant as discussed previously in several ar-ticles [27,28,51–53].
6 The European Physical Journal E
For a lack of experimental information we cannot com-pare the bathochromic shifts of the π → π∗ calculated inthe current work. However, as can be noticed, the solva-tion process simulated here indeed reproduced the avail-able experimental results of the π → π∗ transition energyof QC in methanolic solution [48,49].
4 Conclusion remarks
The sequential Monte Carlo/quantum mechanics tech-nique was used here in order to compute the UV-visabsorption spectrum of the QC molecule solvated inmethanol.
The structure of the molecular liquid was taken into ac-count in this theoretical investigation by means of the min-imum distance and radial distribution functions. The mainfeature of the HB ability of QC is the greatest capacity todonate HBs at the O7-H5 group as well as accept HBs atthe O6 atomic site.
The QM calculations were based on the semiempiri-cal INDO/S-CI methodology in the uncorrelated config-urations selected from the MC simulation. The averageπ → π∗ transition energy obtained from the second sol-vation shell, our best result, is in very good agreement tothe available experimental results of 371 and 372 nm.
Finally, as can be clearly noticed, the model proposedhere for the π → π∗ transition energy matches very wellwith the available experimental results.
We would like to acknowledge Prof. S. Canuto and Prof.K. Coutinho for providing their high level Monte Carlo simula-tion program DICE. This work was supported by the Brazilianagencies PIBIC/CNPq, CNPq and FAPESPA.
References
1. J. Duarte, R. Perez-Palencia, F. Vargas, M.A. Ocete,F. Perez-Vizcaino, A. Zarzuelo, J. Tamargo, Brit. J. Phar-mac. 133, 117 (2001).
2. S. Fiorucci, J. Golebiowski, D. Cabrol-Bass, S. Antonczak,Chem. Phys. Chem. 5, 1726 (2004).
3. Y.K. Rao, S. Fang, Y. Tzeng, J. Ethnopharmacol. 100,249 (2005).
4. D. Xie, S.B. Sharma, N.L. Paiva, D. Ferreira, R.A. Dixon,Science 229, 396 (2003).
5. D.J. Bauer, J.W.T. Selway, J.F. Batchelor, M. Tisdale,I.C. Caldwell, D.A.B. Young, Nature 292, 369 (1981).
6. J.V. Formica, W. Regelson, Food Chem. Toxicol. 33, 1061(1995).
7. E.N. Frankel, J. Kanner, J.B. German, E. Parks, J.E. Kin-sella, Lancet 341, 454 (1993).
8. S. Renaud, M. de Lorgeril, Lancet 339, 1523 (1992).9. M. Law, N. Wald., Br. Med. J. 318, 1471 (1999).
10. J. Ferrieres, Heart 90, 107 (2004).11. S.D. Varma, A. Mizuno, J.H. Kinoshita, Science 195, 205
(1977).
12. Y.J. Zhang, N.P. Seeram, R. Lee, L. Feng, D. Heber,J. Agric. Food Chem. 56, 670 (2008).
13. S.D. Varma, I. Mikuni, J.H. Kinoshita, Science 188, 1215(1975).
14. N. Mahmood, S. Piacente, C. Pizza, A. Burke, A.I. Khan,A.J. Hay, Biochem. Biophys. Res. Com. 229, 73 (1996).
15. S.R. Muir, G.J. Collins, S. Robinson, S. Hughes, A. Bovy,C.H. Ric De Vos, A.J. van Tunen, M.E. Verhoeyen, NatureBiotech. 19, 470 (2001).
16. Y. Zhang, A.Y. Chen, M. Li, C. Chen, Q. Yao, J. Surg.Res. 148, 17 (2008).
17. C. Manach, C. Moranda, V. Crespy, C. Demigne, O. Tex-ier, F. Regerat, C. Remesy, FEBS Lett. 426, 331 (1998).
18. A.R. Parker, V.L. Welch, D. Driver, N. Martini, Nature426, 786 (2003).
19. C.L. Ham, P.C. Jurs, Chem. Sens. 10, 491 (1985).20. F. Gasparrini, I. D’Acquarica, M. Pierini, C. Villani,
J. Separ. Sci. 24, 941 (2001).21. F.J.B. Cardoso, A.F. de Figueiredo, M.D.S. Lobato, R.M.
de Miranda, R.C.O. de Almeida, J.C. Pinheiro, J. Mol.Model. 14, 39 (2008).
22. L.E. Korhonen, M. Turpeinen, M. Rahnasto, C. Wit-tekindt, A. Poso, O. Pelkonen, H. Raunio, R.O. Juvonen,Brit. J. Pharmacol. 150, 932 (2007).
23. S. Mukherjee, A. Mukherjee, A. Saha, J. Mol. Struc.(Theochem.) 715, 85 (2005).
24. K. Coutinho, S. Canuto, Adv. Quantum Chem. 28, 89(1997).
25. H. Lin, D.G. Truhlar, Theor. Chem. Acc. 117, 185 (2007).26. H.C. Georg, K. Coutinho, S. Canuto, J. Chem. Phys. 123,
124307 (2005).27. W.R. Rocha, V.M. Martins, K. Coutinho, S. Canuto,
Theor. Chem. Acc. 108, 31 (2002).28. K. Coutinho, S. Canuto, J. Mol. Struct. (Theochem.) 632,
235 (2003).29. M.J. Frisch, G.W. Trucks, H.B. Schlegel, G.E. Scuseria,
M.A. Robb, J.R. Cheeseman, V.G. Zakrzewski, J.A. Mont-gomery jr., R.E. Stratmann, J.C. Burant, S. Dapprich,J.M. Millam, A.D. Daniels, K.N. Kudin, M.C. Strain, O.Farkas, J. Tomasi, V. Barone, M. Cossi, R. Cammi, B.Mennucci, C. Pomelli, C. Adamo, S. Clifford, J. Ochterski,G.A. Petersson, P.Y. Ayala, Q. Cui, K. Morokuma, D.K.Malick, A.D. Rabuck, K. Raghavachari, J.B. Foresman,J. Cioslowski, J.V. Ortiz, A.G. Baboul, B.B. Stefanov, G.Liu, A. Liashenko, P. Piskorz, I. Komaromi, R. Gomperts,R.L. Martin, D.J. Fox, T. Keith, M.A. Al-Laham, C.Y.Peng, A. Nanayakkara, C. Gonzalez, M. Challacombe,P.M.W. Gill, B. Johnson, W. Chen, M.W. Wong, J.L. An-dres, C. Gonzalez, M. Head-Gordon, E.S. Replogle, J.A.Pople, GAUSSIAN 98, Revision A.11.2, Gaussian Inc.,Pittsburgh PA (1998).
30. W.L. Jorgensen, J. Phys. Chem. 90, 1276 (1986).31. W.L. Jorgensen, D.S. Maxwell, J. Tirado-Rives, J. Phys.
Chem. 90, 1276 (1986).32. C.M. Breneman, K.B. Wiberg, J. Comput. Chem. 1, 361
(1990).33. K. Coutinho, S. Canuto, DICE: A Monte Carlo Program
for Molecular Liquid Simulation, University of Sao Paulo(2003).
34. M.P. Allen, D.J. Tildesley, Computer Simulation of Liquids(Clarendon Press, Oxford, 1987).
35. R.C. Wilhoit, B.J. Zwolinski, J. Phys. Chem. Ref. Data 2,427 (1973).
T. Andrade-Filho et al.: The UV-vis absorption spectrum of the flavonol quercetin in methanolic solution . . . 7
36. J. Ridley, M.C. Zerner, Theor. Chim. Acta 32, 111 (1973).37. M.C. Zerner, Zindo: a semi-empirical program package,
University of Florida, Gainesville 32611 (1999).38. M. Leopoldini, T. Marino, N. Russo, M. Toscano, J. Phys.
Chem. A 108, 4916 (2004).39. A. Lugasi, J. Hovari, K.V. Sagi, L. Biro, Acta Biol. Szeged.
47, 119 (2003).40. M. Orozco, F.J. Luque, Chem. Rev. 100, 4187 (2000).41. W. Xie, J. Pu, A.D. Mackerell jr., J. Gao, J. Chem. Theory
Comput. 3, 1878 (2007).42. S. Canuto, K. Coutinho, Int. J. Quantum Chem. 77, 192
(2000).43. P. Jedlovszky, L. Turi, J. Phys. Chem. B 101, 5429 (1997).44. D. Swiatla-Wojcik, Chem. Phys. 342, 260 (2007).45. T. Andrade-Filho, H.S. Martins, J. Del Nero, Theor.
Chem. Acc. 121, 147 (2008).
46. G.M.A. Junqueira, W.R. Rocha, W.B. De Almeida, H.F.Dos Santos, J. Mol. Struc. (Theochem.) 719, 31 (2005).
47. P. Trouillas, P. Marsal, D. Siri, R. Lazzaroni, J. Duroc,Food Chem. 97, 679 (2006).
48. K. Robards, P.D. Prenzler, G. Tucker, P. Swatsitang,W. Glover, Food Chem. 66, 401 (1999).
49. J.P. Cornard, L. Dangleterre, C. Lapouge, J. Phys. Chem.A 109, 10044 (2005).
50. S. Canuto, K. Coutinho, D. Trzesniak, Adv. QuantumChem. 41, 161 (2002).
51. R. Rivelino, B.J.C. Cabral, K. Coutinho, S. Canuto, Chem.Phys. Lett. 47, 13 (2005).
52. C.M. Aguilar, W.B. de Almeida, W.R. Rocha, Chem.Phys. 353, 66 (2008).
53. G.M.A. Junqueira, W.R. Rocha, W.B. De Almeida, H.F.Dos Santos, Phys. Chem. Chem. Phys. 5, 437 (2003).
Copyright © 2022 FDOKUMEN