The utility of a three part differential hematology analyzer with ...
31
The utility of a three part differential hematology analyzer with CRP for assessing malaria Jun Ivan Nishimura ( [email protected] ) HORIBA Medical Parag Dharap Dharap's Diagnostic Centre Sebastien Raimbault HORIBA Medical Research article Keywords: Malaria, hematology analyzer, WBC histogram, CRP Posted Date: September 21st, 2020 DOI: https://doi.org/10.21203/rs.3.rs-70918/v1 License: This work is licensed under a Creative Commons Attribution 4.0 International License. Read Full License
-
Upload
khangminh22 -
Category
Documents
-
view
3 -
download
0
Transcript of The utility of a three part differential hematology analyzer with ...

The utility of a three part differential hematologyanalyzer with CRP for assessing malariaJun Ivan Nishimura ( [email protected] )
HORIBA MedicalParag Dharap
Dharap's Diagnostic CentreSebastien Raimbault
HORIBA Medical
Research article
Keywords: Malaria, hematology analyzer, WBC histogram, CRP
Posted Date: September 21st, 2020
DOI: https://doi.org/10.21203/rs.3.rs-70918/v1
License: This work is licensed under a Creative Commons Attribution 4.0 International License. Read Full License

The utility of a three part differential hematology 1
analyzer with CRP for assessing malaria 2
Corresponding author: 3
Jun Nishimura, Horiba Medical, Kyoto, Japan ([email protected]) 4
5
Parag Dharap, MD, Dharap’s Diagnostic Center, Mumbai, India 6
Sebastien Raimbault, PhD, Horiba Medical, Montpellier, France 7
Abstract 8
Background 9
Hematology analyzers display abnormal hematology parameters during malaria 10
infection providing insightful information for suspecting and assessing malaria 11
infection. The goal of this study is to demonstrate the potential of a three part 12
differential hematology analyzer to assess malaria, provide information about the 13
parasitemia, and discuss the importance of combining CRP with hematology 14
parameters to obtain further information about the malaria infection. 15
Methods 16
The present study shows the results of a retrospective study involving comparison of 17
raw instrument data from a three part differential hematology analyzer with CRP 18
measurement and corresponding microscopic findings of samples obtained during the 19
monsoon season of years 2018 and 2019 in Mumbai, India. Mann-Whitney U and 20
Krustal-Wallis tests were applied for obtaining statistical significance of hematology 21
parameters and CRP among P. vivax, P. falciparum, dengue and negative samples. 22
Results 23

The study considers 1008 non-malaria febrile cases, 209 P. vivax, 31 P. falciparum 24
positive malaria samples, five cases of mixed species malaria infection, and three co-25
infection of malaria and dengue. Median values of WBCs, PLTs, PCT and %LYM were 26
lower in malaria and dengue samples compared to negative ones with statistical 27
difference (p < 0.05). Contrary, medians of MCHC, MPV, PDW, and %MON were 28
higher than negative samples. 29
The greatest difference in the analyzer results of malaria and dengue cases was 30
observed in between their medians of CRP levels, which is evidenced by the values of 31
the first quartiles of P. vivax and P. falciparum cases, and the third quartile of dengue 32
cases being 8.6 and 10.4 mg/L, respectively. 33
The parameters with a statistical difference for different levels of parasitemia were 34
WBC, PLT, %MON and CRP. An interfering abnormal peak was observed in the white 35
blood cell histogram, below 37 fl, in malaria infected samples, especially in P. vivax 36
cases, where the height of that peak showed a strong correlation with red blood cells 37
infected predominantly with larger parasitic forms. 38
Conclusions 39
A three differential part hematology analyzer has the potential to not only trigger 40
malaria diagnosis confirmation but also assess the severity of the infection when CRP is 41
considered. 42
Keywords 43
Malaria; hematology analyzer; WBC histogram; CRP 44
Background 45
According to the WHO an estimated 228 million cases of malaria occurred in 2018 46
worldwide and 85% of this burden was located in 19 sub-Saharan Africa countries and 47

India. For a rapid disease management and surveillance of malaria, the WHO 48
recommended two main strategies to eradicate malaria: closing the gaps of healthcare 49
access between urban and rural areas, and diagnosis before antimalarial treatment by 50
microscopy or malaria rapid diagnostic test (RDT) in all patients with malaria 51
suspicion. Fever is the main manifestation for suspicion of malaria infection. In malaria 52
endemic areas, it acts as a trigger for parasitology testing [1]. 53
RDTs are currently replacing microscopy, the golden standard for diagnosing malaria, 54
especially in endemic countries. Thus, complementary information should be 55
considered to ensure correct interpretation and correct disease management 56
particularly in surveillance programs [2]. The two main limitations of RDTs are the 57
impossibility to obtain parasitemia quantification and, particularly in antibody based 58
RDT, the persistent positivity after treatment [2]. Microscopy can overcome both 59
limitations by quantifying the parasite density, however the activity is highly time-60
consuming. 61
Complete blood count (CBC) is one of the most frequently requested laboratory tests in 62
patients with acute febrile illness symptoms to confirm infection status and/or severity 63
of disease to initiate proper treatment. For endemic and non-endemic countries, 64
abnormal hematology parameters might provide insightful information for managing 65
malaria infection. 66
Malaria detection in standard automated cell counters (ACCs) 67
The potential to diagnose clinically unsuspected cases of malaria for patients subjected 68
to CBC is one of the main benefits of flagging malaria in hematology analyzers [3]. A 69
comprehensive summary of studies for diagnosing malaria by ACCs without a specific 70
malaria-detection design is well described by Campuzano-Zuluaga [3], in which many 71
of the referred studies provide performances to detect malaria related to abnormalities 72

in the white blood cell (WBC) differentiation channel. ACCs with cytometry capable of 73
differentiating five WBC populations show a clear clustering for malaria population due 74
to specific scattering of infected red blood cells (iRBCs) that are resistant to lyse and/or 75
produce scatters due to residuals of the parasite infection. Pseudoeosinophilia resulting 76
from neutrophils containing haemozoin have been reported as an abnormality caused 77
by malaria infection [4 - 6]. Fourcade et al., demonstrated that large activated 78
monocytes are present on malaria infections by measuring the standard deviation of the 79
volume of LYM and MON calculating a malaria factor with sensitivity of 96.9% and 80
specificity of 82.5% [7]. Many studies have identified a particular cluster by inspecting 81
different angles of light after moderate lysing of RBC without using extra reagents. 82
However the majority of these studies have a lower performance to detect small or 83
immature forms of parasites due to their low lysing resistance and small size. For 84
example, a recent evaluation on a malaria parameter to evaluate the percentage of 85
iRBCs in the BC-6800 (Mindray) showed a lower sensitivity to detect P. falciparum in 86
comparison with detecting P. vivax (24.1% and 88.3%, respectively), and related to it 87
the difficulty to detect small size parasites and their low nucleic acid content [8], which 88
are prevalent in P. falciparum infection where trophozoites and schizonts are barely 89
seen in peripheral blood. 90
In spite of all promising results from ACCs to identify malaria, fewer studies have been 91
conducted for three differential ACCs. One study combined HGB, TLC, platelets and 92
RDW data in a KX-21 (Sysmex) achieving a 26.1% sensitivity and 96.3% of specificity in 93
a study mainly consisting of P. vivax infected samples [9]. The majority of small ACCs 94
utilize the Coulter-principle to classify WBCs in populations based on size and obtain an 95
RBC distribution using limited reagents. Identifying intracellular presence of malaria 96

parasite without inspecting the internal content of blood cells based only on abnormal 97
WBC histograms’ distribution caused by the infection poses a difficult challenge. 98
C-reactive protein (CRP) to distinguish malaria 99
CRP is a member of the pentraxin family of proteins, an acute-phase reactant and a 100
biomarker for inflammation. Although CRP is not a specific biomarker for detecting 101
malaria infection, several studies have identified CRP to be a potential marker to assess 102
the severity of malaria infections [10-13]. A study in the south-western part of the 103
Brazilian Amazon has shown evidence in the association of P. vivax malaria infection 104
with inflammatory activation, including CRP, and cytokine imbalance [14]. 105
Dengue and malaria infections, which frequently co-exist in endemic areas, present 106
with similar symptomatology and produce similar abnormalities in CBC parameters. 107
CRP has been observed to be a useful biomarker to discriminate malaria and dengue, 108
Epelboin et al., using CRP > 5 mg/L as cut off to differentiate between malaria from 109
dengue obtained sensitivity of 99% and specificity of 35% [15]. In addition, effective 110
management and surveillance of malaria require a screening method facilitating quick 111
transfer of patients to receive diagnostic confirmation and proper treatment. POCT 112
hematology analyzers providing information about malaria and other co-existing 113
infections such as dengue could play a major role to support this line of action. 114
The goal of this study is to demonstrate the potential of a three part differential 115
hematology analyzer to assess malaria, provide information about the parasitemia, and 116
discuss the importance of combining CRP with hematology parameters to obtain 117
further information about the malaria infection. 118
Methods 119
The present study shows the results of a retrospective study involving comparison of 120
raw instrument data from a three part differential hematology analyzer with CRP 121

measurement (LC-667G CRP, HORIBA) and corresponding microscopic findings of the 122
patients visiting at Dr. Dharap’s Diagnostic Centre, Mumbai, India from samples 123
obtained in the monsoon season of years 2018 and 2019. 124
During monsoon season, the laboratory routinely caters to patients for diagnostic 125
testing in case of acute febrile illness which comprises a CBC, peripheral examination of 126
blood smear for malarial parasite and rapid screening tests for malaria and dengue NS1 127
being an endemic area with co-existent infections. Documented historical data of 128
known malaria, dengue positive and negative cases was used for the study. Persons for 129
routine health check-up without history of any specific ailments visiting the laboratory 130
during the corresponding periods were considered for normal or control group. 131
For the current study, the historical documented data was further anonymized in coded 132
fashion in order to protect patient confidentiality in accordance with local ethical or 133
IRB guidelines, according to national and international standards for the conduct of 134
clinical studies including 21 CFR Parts 50 and 56 and International Conference on 135
Harmonization (ICH) E6-Good Clinical Practice Consolidated Guideline. Ethical 136
clearance was not obtained as study was carried as a retrospective review of the 137
available raw instrument and historical patient data, without any collection of extra 138
specimen or monetary charges to patient and did not involve any communication of 139
results of the study to the clinician so as to affect the diagnostic and therapeutic 140
management of the patients. 141
Laboratory techniques 142
Testing for ‘Acute Febrile Illness’ in the laboratory comprises of a full blood count, 143
peripheral examination of blood smear for malarial parasite and rapid screening tests 144
for malaria and dengue NS1 being an endemic area with co-existent infections. 145

Full blood count is performed using a three part differential hematology analyzer (LC-146
667G CRP, HORIBA) which additionally provides CRP level estimation. For peripheral 147
blood smear examination the following technique is used. Anticoagulated (K2-EDTA) 148
blood of patient is used to prepare thick & thin blood smear for peripheral blood smear 149
examination (PBSE). Both types of smear preparation are air dried. Thin preparation is 150
fixed with methanol whereas thick blood smear are subjected to ‘process of de-151
hemoglobinisation’ with deionized water. Both smears are then stained by ‘Field 152
staining technique’ using automated slide stainer. Thin smears are examined for 153
presence of malarial parasite and species identification, presence of platelet aggregates, 154
macroplatelets and nucleated red blood cells, if any. 155
Malaria cases are further assessed for parasite density by counting parasite life cycle 156
forms against 100 white blood cells by an experienced pathologist. The life cycle forms 157
are grouped as small forms being ring and early ameboid, and large forms including 158
late ameboid with ample parasitic material, schizonts and gametocytes. 159
For additional screening and confirmation of malaria cases, Rapid Malaria Antigen 160
detection test kits manufactured by SD Biosensor Healthcare Pvt. Ltd., Gurugram, 161
India using monoclonal anti-P. falciparum HRP-II (0.75+/- 0.15 µg) with monoclonal 162
anti-P. vivax pLDH (0.75+/- 0.15 µg) respectively to detect presence of P. falciparum & 163
P. vivax related antigen is used. 164
For screening & diagnosis of dengue, RecombiLISA NS1 Antigen test utilizing pairs of 165
specific polyclonal & monoclonal anti-dengue antibodies of all four serotypes (DEN1, 2, 166
3, 4) and analytical sensitivity of 0.3 ng/ml for type 2 NS1 antigen, manufactured by 167
CTK Biotech, Inc., United States of America is used. 168
Statistical analysis 169

To determine the significance of the differences between the hematology parameters 170
extracted from LC-667G CRP of positive & negative samples of P. vivax & P. falciparum 171
samples respectively, as well as malaria & dengue positive samples, Mann-Whitney U 172
and Krustal-Wallis tests were applied due to their non-parametric distribution. 173
All the statistical calculations were done using Minitab 19.1.1. and histogram graphs 174
were created using R software 3.5.1. 175
Results 176
From the monsoon seasons of 2018 and 2019, based on selection criteria and 177
availability of corresponding data, we selected 209 (144 males, 65 females) P. vivax 178
positive cases, 31 (22 males, 9 females) P. falciparum samples, five cases of mixed 179
species malaria infection (4 males, 1 female), and three co-infection of malaria and 180
dengue (2 males, 1 female). In addition, 1008 non-malaria febrile cases were examined 181
including 197 (124 males, 73 females) dengue positive cases. The median and range of 182
age were 35 years (5-87) and 36 years (15-77) for only P. vivax and P. falciparum cases, 183
respectively. 184
Using Krustal-Wallis test to compare the four groups (see table 1), median values of 185
WBCs, PLTs, PCT and %LYM were lower in malaria and dengue samples compared to 186
negative ones with a statistical difference (p < 0.05). Contrary, the median values of 187
MCHC, MPV, PDW, and %MON were higher than negative samples. RBC, HGB, HCT, 188
MCV, MCH and %GRA showed no significant difference in median between the four 189
groups. 190
The medians of the parameters that had a significant difference between P. vivax 191
infected and negative samples were WBCs, MCH, MCHC, RDW, PLTs, MPV, PCT, PDW 192
and CRP. Similarly P. falciparum cases had the same parameters with significant 193
difference excepting MCH, MCHC and RDW. 194

Comparing both malaria infected cases with dengue, only PLT, PCT and CRP medians 195
had a significant difference, which makes difficult to differentiate between both 196
diseases when observing solely the hematology parameters affection. The greatest 197
difference of median between malaria infected patients and dengue was observed with 198
CRP. Figure 1 shows the first quartiles of P. vivax and P. falciparum to have a difference 199
with the third quartile of dengue patients of 8.6 and 10.4 mg/L, respectively. 200
In the current set of data only %LYM (p = 0.029) showed a significant difference 201
between P. Vivax and P. Falciparum samples. 202
P. vivax (n = 209) Median (IQR)
P. falciparum (31) Median (IQR)
Dengue (n=197) Median (IQR)
Patients with fever but Non-malaria non-dengue (n=811) Median (IQR)
𝒑𝑲𝑾 𝒑𝑽𝑭 𝒑𝑽𝑫 𝒑𝑭𝑫 𝒑𝑽𝑵 𝒑𝑭𝑵
WBC (103/µL)
5.4 (4.1 - 6.6) 4.7 (3.8 - 5.5) 4.4 (3.4 - 6) 6.6 (5.1 - 8.5) < 0.00
1
0.056
< 0.00
1
0.404
< 0.00
1
< 0.00
1 RBC (106/µL)
4.67 (4.3 - 5.15) 4.5 (4.09 - 4.89)
4.74 (4.4 - 5.18)
4.73 (4.36 - 5.09)
0.19 0.255
0.437
0.199 0.509
0.119
HGB (g/dL)
13.5 (12.32 - 14.67)
12.7 (11.8 - 14.4)
13.4 (12.5 - 14.6)
13.3 (11.95 - 14.8)
0.24 0.082
0.894
0.114 0.203
0.206
HCT (%) 40.05 (36.32 - 43.4)
37.7 (35.8 - 42.4)
40.3 (37.3 - 43.5)
39.7 (35.72 - 43.87)
0.318 0.136
0.436
0.053
0.601
0.187
MCV (µm3)
86.05 (82 - 89.37)
84.2 (74.6 - 89.9)
84.8 (81.1 - 89)
85.4 (80.6 - 89.8)
0.437
0.148
0.667
0.309
0.358
0.335
MCH (pg) 29.15 (27.5 - 30.47)
28.7 (25.9 - 30.9)
28.6 (27.1 - 30.1)
28.6 (26.75 - 30.3)
0.123 0.185
0.139 0.669
0.04 0.593
MCHC (g/dL)
33.80 (33.2 - 34.75)
33.80 (33 - 34.4)
33.35 (33.1 - 33.9)
33.50 (32.9 - 33.9)
< 0.00
1
0.461
<0.001
0.115 < 0.00
1
0.238
RDW (%) 14.45 (13.8 - 15.1)
15 (13.6 - 15.6) 14.5 (14.1 - 15.2)
14.7 (14.2 - 15.4)
< 0.00
1
0.333
0.152 0.09 < 0.00
1
0.698
PLT (103/µL)
102.5 (66.25 - 149)
109 (79 - 140) 174 (136 - 219) 223 (174 - 274)
< 0.00
1
0.991
<0.001
<0.001
< 0.00
1
< 0.00
1 MPV (µm3)
8.4 (7.9 - 9) 8.6 (7.8 - 9.3) 8.2 (7.7 - 8.8) 8.1 (7.6 - 8.6) < 0.00
1
0.168
0.732
0.14 < 0.00
1
0.001
PCT (%) 0.0865 (0.056 - 0.119)
0.088 (0.063 - 0.113)
0.144 (0.118 - 0.175)
0.179 (0.143 - 0.217)
< 0.00
1
0.769
<0.001
<0.001
< 0.00
1
< 0.00
1 PDW (%) 15.35 (13.9 -
17.3) 16.9 (13.8 -
19.4) 15 (14 - 16.4) 14.6 (13.7 -
15.9) <
0.001
0.274
0.122 0.102
< 0.00
1
0.023
%LYM 25.9 (20.4 - 34.2)
22.8 (18.5 - 27) 23.4 (16.75 - 31.22)
26.1 (18 - 35.3)
0.016
0.029
0.015 0.919 0.406
0.117
%MON 5.6 (4 - 7.3) 5.8 (4.4 - 7.2) 5.5 (4.2 - 7.2) 5.2 (4 - 6.8) 0.04 0.658
0.217 0.636
0.055
0.156
%GRA 68 (59.1 - 73.8) 71.2 (66.3 - 77.2)
70.35 (61.55 - 79.25)
68.4 (58.32 - 77.6)
0.071 0.061
0.053
0.876
0.257 0.236
CRP (mg/L)
67.4 (35.7 - 111.2)
81.4 (37.5 - 122.3)
9.7 (3.3 - 27.1) 10.4 (2.9 - 27.9)
< 0.00
1
0.455
< 0.00
1
< 0.00
1
< 0.00
1
< 0.00
1
Table 1. Hematology parameters statistics of the LC-667G of data sets 2018 and 2019. 203

*p-value of less than 0.05 was considered statistically significant 204
* 𝑝𝐾𝑊, 𝑝𝑉𝐹, 𝑝𝑉𝐷, 𝑝𝐹𝐷, 𝑝𝑉𝑁, and 𝑝𝐹𝑁 corresponds to the p-value of Kruskal-Wallis test, PV 205
vs PF, PV vs dengue, PF vs dengue, PV vs negative, and PF vs negative, respectively 206
*Co-infections of malaria and dengue or PV and PF were not contemplated 207
Insert here Figure 1 208
Parasitemia association with different hematology parameters 209
To inspect the affection of the hematology parameters regarding the parasite density 210
observed in peripheral blood, only the data-set of P. vivax samples in the current study 211
has enough data variation to provide interesting results. The distribution of parasitemia 212
in P. falciparum samples of the present study is limited, more than 60% of the cases 213
have less than 0.2% of parasitemia, thus the analysis of associating parasitemia with the 214
impact on hematology parameters was performed solely for the P. vivax set of data. 215
The parasitemia percentage establishes the relation of the number of parasites found in 216
thin smear against the total count of RBCs and it was calculated with the following 217
formula: 218
%Parasitemia = #𝑃𝑎𝑟𝑎𝑠𝑖𝑡𝑒𝑠100𝑊𝐵𝐶 (#𝑊𝐵𝐶µ𝐿 )#𝑅𝐵𝐶µ𝐿 x100 … Eq. 1
*The total counts of WBCs and RBCs were retrieved from the hematology analyzer. 219
The parasitemia ranges from 0.00005% to 2.15% and no cases of high parasitemia were 220
found (>5% in low intensity transmission areas). Table 2 summarizes the medians of 221
different hematology parameters provided by the LC-667G in relation with three 222
divisions of parasitemia (< 0.5%, 0.5% < parasitemia < 1%, > 1%). The parameters with 223
a statistical difference in the median were WBC (p = 0.001), PLT (p = 0.022), %MON (p 224
< 0.001) and CRP (p < 0.001). A negative slope in the significant different medians was 225
found in WBC, PLT, PCT and %MON, whereas CRP increases with its parasite load. 226
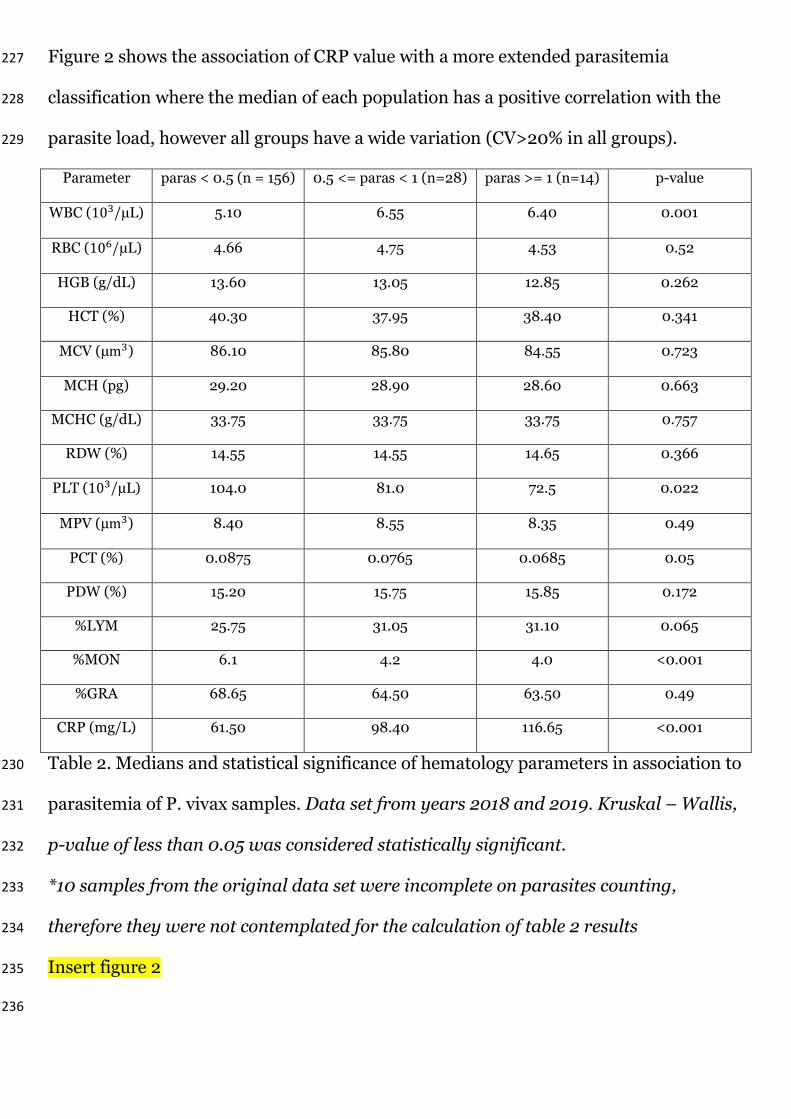
Figure 2 shows the association of CRP value with a more extended parasitemia 227
classification where the median of each population has a positive correlation with the 228
parasite load, however all groups have a wide variation (CV>20% in all groups). 229
Parameter paras < 0.5 (n = 156) 0.5 <= paras < 1 (n=28) paras >= 1 (n=14) p-value
WBC (103/µL) 5.10 6.55 6.40 0.001
RBC (106/µL) 4.66 4.75 4.53 0.52
HGB (g/dL) 13.60 13.05 12.85 0.262
HCT (%) 40.30 37.95 38.40 0.341
MCV (µm3) 86.10 85.80 84.55 0.723
MCH (pg) 29.20 28.90 28.60 0.663
MCHC (g/dL) 33.75 33.75 33.75 0.757
RDW (%) 14.55 14.55 14.65 0.366
PLT (103/µL) 104.0 81.0 72.5 0.022
MPV (µm3) 8.40 8.55 8.35 0.49
PCT (%) 0.0875 0.0765 0.0685 0.05
PDW (%) 15.20 15.75 15.85 0.172
%LYM 25.75 31.05 31.10 0.065
%MON 6.1 4.2 4.0 <0.001
%GRA 68.65 64.50 63.50 0.49
CRP (mg/L) 61.50 98.40 116.65 <0.001
Table 2. Medians and statistical significance of hematology parameters in association to 230
parasitemia of P. vivax samples. Data set from years 2018 and 2019. Kruskal – Wallis, 231
p-value of less than 0.05 was considered statistically significant. 232
*10 samples from the original data set were incomplete on parasites counting, 233
therefore they were not contemplated for the calculation of table 2 results 234
Insert figure 2 235
236

For correctly associating the CRP with the affection of malaria infection, a 237
consideration on the age dependency has to be considered. Figure 3 shows the CRP 238
association separated in different age groups of P. vivax samples with parasitemia less 239
than 0.2%. 240
Insert figure 3 241
WBC histogram interference in the RBC ghosting area 242
In the LC-667G CRP HORIBA analyzer, an abnormal peak located approximately at the 243
37fL channel in the WBC histogram appears mainly in malaria P. vivax samples with 244
high density of large forms of parasites (see figure 4). Using the parasite density 245
information from datasets 2018 and 2019 of P. vivax samples, a statistically significant 246
multiple linear regression model (p < 0.001) was calculated obtaining the following 247
equation 𝑦 = 1229 + 7.771𝑥10−3𝛼1 + 48.1𝑥10−3𝛼2 (see figure 5), where y represents the 248
events per µL from 19.3fL to 43.9fL in the WBC histogram (eq. 2), 𝛼1 the coefficient 249
related to the small forms parasite density and 𝛼2 to the parasite density of large forms. 250
The contribution of large forms is approximately 6.2 times bigger than the contribution 251
of small forms(𝛼2/𝛼1) and the percentage of variation of the model is 74.43%. 252
Additionally, the small and large forms of parasitemia showed a small multicollinearity 253
(VIF = 1.05). For the case of positive P. falciparum multiple regression model, we could 254
not conclude a statistically significant association between the large forms parasite 255
density and the events in the above mentioned range of the WBC histogram (p = 0.142). 256
Insert figure 4 257
Insert figure 5 258 𝐸𝑣𝑒𝑛𝑡𝑠 𝑝𝑒𝑟 𝜇𝑙 𝑓𝑟𝑜𝑚 19.3fL to 43.9fL = Sum events 19.3fL to 43.9fL𝑇𝑜𝑡𝑎𝑙 𝑒𝑣𝑒𝑛𝑡𝑠 𝑜𝑓 𝑊𝐵𝐶 ℎ𝑖𝑠𝑡 𝑥(#𝑊𝐵𝐶𝑥103) [𝑒𝑣𝑒𝑛𝑡𝑠𝜇𝐿 ] … Eq. 2 259
Large forms of P. falciparum samples are barely seen in peripheral blood due to 260
sequestration in the spleen, thus interference in the RBC ghosting area of the WBC 261

histogram will be smaller than in P. vivax samples were large forms of parasites 262
remains in peripheral blood, compare subplots of figure 4. In the analyzed set of data, 263
different interferences non-related to parasite inclusion located in the 37-fL area are 264
displayed in figure 4, these interferences include platelet aggregations, macro platelets, 265
and nRBCs. 266
Discussion 267
The most common reported affectations on hematology parameters observed in malaria 268
infection are thrombocytopenia, anemia and leucopenia [16, 17]. Thrombocytopenia in 269
malaria infection occurs due to complex platelet roles and abnormalities, including 270
enabling cytoadhesion of iRBCs to endothelial cells, clumping and killing iRBCs [18], 271
coagulation disturbances, bone marrow alterations, antibody-mediated platelet 272
destruction, systemic platelet activation, vascular pooling and oxidative stress [19]. 273
Moreover, in hematological analyzers, PLTs complexed with RBCs are not identified, 274
therefore complexed particles would lead to an apparent platelet loss [20]. In the 275
present study, thrombocytopenia (< 150 103/µL) was predominantly observed in 276
malaria P. falciparum cases (83.87%) than P. vivax (76.44%), which is similar to the 277
observations reported in [21, 22]. Authors in [20] have concluded that in malaria cases, 278
in addition to type of specie, the severity of thrombocytopenia is also affected by 279
parasite density. In present study, similar association with parasitemia (p = 0.022) is 280
seen in P. vivax infection with thrombocytopenia cases. While understanding 281
thrombocytopenia dependency on malaria specie, it must be analyzed considering the 282
parasite load and patient condition, as pointed out in a study where parasitemia was 283
significantly higher in individuals with thrombocytopenia only in P. vivax and not in P. 284
falciparum infections [23]. 285

Anemia caused by malaria infection has a multi-factorial and complex pathogenesis 286
that is quite pronounced in P. falciparum, contrary to P. vivax which target mainly 287
young RBCs [24]. In the present analysis, although P. falciparum medians of RBC 288
counting, HGB and HCT were lesser than the rest of the inspected groups (see table 1), 289
no statistical significant difference was found in parameters concerning anemia 290
affectation which might be related to the non-severe parasite invasion and small 291
parasitemia variability of P. falciparum current data. 292
In study performed using a five differential part ACC in Thailand, Tak Province the 293
neutrophil percentage, RBC count, MCV, MCH, MCHC and platelets count were found 294
to be significantly different between P. falciparum and P. vivax species [25]. In contrast, 295
in the current study, none of the above-mentioned parameters were significantly 296
different between malaria species excepting the leukocyte count (p = 0.029), which 297
most probably is caused by the interference of the WBC channel by the large forms of P. 298
vivax infection compared to P. falciparum samples. 299
Among the hematology parameters with significant statistical difference in medians 300
between malaria positive and negative samples, platelets related parameters, especially 301
MPV, should be further analyzed due to the strong affection with the elapsed time 302
between collection and measurement of sample. Unfortunately, due to the retrospective 303
nature of the study, the exact amount of elapsed time from collection to measurement is 304
not available. 305
Interference in the WBC channel and association with parasitemia 306
In both three and five part differential ACCs a peak around the RBC ghosting area in the 307
WBC histogram has been identified as one of the main abnormalities to predict malaria 308
infection [26 - 29]. Briggs et al., observed this peak before the 35-fL threshold at WBC 309
histograms with malaria infection and used it for improving the specificity to detect 310

malaria in false-positives results coming from other infections [26]. In the present 311
study, the number of events within this abnormal peak were correlated with the 312
parasite density of P. vivax large forms, supporting the same observation of moderate 313
correlation (r = 0.79) in [28]. We concluded the abnormal peak under malaria infection 314
is caused mainly by the lysing-resistant large forms of parasites, regardless on the 315
specie, and probably affected by the presence of PLT aggregation and/or macro PLTs. 316
The abnormal peak is less often observed in P. falciparum infections as the larger forms 317
are sequestered by the spleen. Mature trophozoites and schizonts in P. falciparum 318
infection are barely present in peripheral blood samples, consequently according to 319
[30] the presence of schizontaemia, especially in P. falciparum infections, can be used 320
as a marker for disease severity. Therefore a semi-quantitative estimation of 321
schizontaemia can be inferred from the events before the 37fL channel of the WBC 322
histogram from the LC-667G and might help to assess the severity of malaria infections. 323
The abnormal peak in WBC histogram is not exclusively due to malaria iRBCs. 324
Common interferences include RBC lysed debris, PLT aggregations, macro-PLTs, 325
nRBCs, and others. Researchers used this abnormal peak along with two other 326
parameters of the LH780 (Beckman Coulter) to identify malaria infection having an 327
83.1% specificity but failed to discriminate from samples with nRBCs [28]. We feel that 328
the distribution pattern of the abnormal peak might provide a way to differentiate the 329
exact cause of it. We observed that PLT aggregations or macro PLTs show a 330
bigger/wider distribution due to the random nature of formation, whereas gametocytes, 331
schizonts and late stages of trophozoites show a narrower size distribution having a 332
smaller dispersion close to the abnormal peak area. 333
A parameter to increase the specificity of detecting malaria and understand 334
better the parasite density: CRP 335

In low cost ACCs where the Coulter principle is the only technology responsible of 336
differentiating the WBC population into three parts based on volume, the identification 337
of malaria or dengue infected samples is rather difficult due to the impossibility of 338
differentiating granulocytes populations and to distinguishing interferences of lysing 339
resistant particles in the WBC channel. Addition of CRP increases the specificity of 340
detecting malaria due to the inflammatory response secondary to parasite infection. 341
Some studies have positively correlated the parasite density of malaria infected samples 342
with CRP levels [31-34], even in afebrile malaria patients [34]. CRP has been proposed 343
for assessing the severity of malaria infection and for following-up response to 344
treatments [35]. However in the present study, a direct correlation between the CRP 345
value and the parasitemia was not found probably due to the non-specific CRP response 346
and the debated age dependency [36, 37]. Only when grouping the parasitemia in 347
different ranges, a positive association between parasitemia in P. vivax samples and the 348
CRP median was observed (see figure 2). Similar to results of [11], in this study no 349
significant difference of CRP value was observed between P. vivax and P. falciparum. 350
Dengue and malaria in many countries are co-endemic diseases that present similar 351
clinical presentation. The importance of distinguishing them has been reported by [38], 352
who developed a tree decision model for discriminating malaria and dengue infection. 353
Dengue samples collected in the present study had a lower counting of WBCs and 354
MCHC in comparison to both malaria species supporting observations of [38], however 355
only the difference in median with P. vivax samples was statistically significant. In 356
contrast, PLT medians of both species of malaria infections were lower than dengue 357
cases (p<0.001). Discrepancy of results with [38] might be related to the severity of 358
each disease. For example, the hematology parameters affection in dengue infections is 359

greatly dependent on day of fever. Unfortunately current data has not any information 360
about the fever progression of dengue infected individuals. 361
By far, the CRP parameter showed the most significant difference between malaria and 362
dengue. Although CRP is not a specific biomarker for malaria, the response of CRP to 363
virus infections is rather small making a good parameter to understand the etiology of 364
the infection and help to differentiate malaria and dengue from similar hematology 365
parameters. Nevertheless, dengue and other non-viral infections can co-exist in a single 366
sample, thus relying only in CRP should not be an exclusive criteria to differentiate both 367
diseases. 368
Conclusions 369
The LC-667G CRP, a three differential part hematology analyzer has the potential to not 370
only trigger malaria diagnosis confirmation but also assess the severity of the infection 371
due to simultaneous CRP estimation. The current study suggests that CRP might be 372
helpful for distinguishing malaria from dengue, and for evaluating the severity of the 373
parasite load. In addition to CRP, the abnormal peak located around the 37fL channel 374
in the WBC histogram can provide a good estimation of the number of large parasites 375
present during the infection, however the calculation might be interfered by other 376
particles such as nRBCs and PLT aggregations. The combination of providing 377
hematology parameters plus CRP value in a hematology analyzer makes a preferred 378
method for screening malaria on routinely basis of any infection suspicion. 379
Current data-set is limited by the number of P. falciparum samples, the discussion and 380
observations provided were focused on P. vivax positive cases. Further research 381
following this study should be oriented to measure P. falciparum samples, evaluate the 382
potential of using hematology analyzers to provide additional information to the RDTs, 383
and monitor the anti-malaria drugs treatment. 384
Abbreviations 385
WHO: World Health Organization 386
RDT: rapid diagnostic test 387
ACC: automated cell counter 388
CBC: complete blood count 389
WBC: white blood cell 390
LYM: lymphocytes 391
MON: monocytes 392
RBC: red blood cell 393
iRBC: infected red blood cell 394
HGB: hemoglobin 395
TLC: total lymphocyte count 396
RDW: red cell distribution width 397
CRP: C-reactive protein 398
POCT: point of care testing 399
PLT: platelet 400
PCT: plateletcrit 401
MCHC: mean corpuscular hemoglobin concentration 402
MPV: mean platelet volume 403
PDW: platelet distribution width 404
HCT: hematocrit 405
MCV: mean corpuscular volume 406
MCH: mean corpuscular hemoglobin 407
GRA: granulocytes 408
CV: Coefficient of variation 409

VIF: variance inflation factor 410
nRBC: nucleic red blood cell 411
Declarations 412
Ethics approval and consent to participate 413
For the current study, the historical documented data was further anonymized in coded 414
fashion in order to protect patient confidentiality in accordance with local ethical or 415
IRB guidelines, according to national and international standards for the conduct of 416
clinical studies including 21 CFR Parts 50 and 56 and International Conference on 417
Harmonization (ICH) E6-Good Clinical Practice Consolidated Guideline. Ethical 418
clearance was not obtained as study was carried as a retrospective review of the 419
available raw instrument and historical patient data, without any collection of extra 420
specimen or monetary charges to patient and did not involve any communication of 421
results of the study to the clinician so as to affect the diagnostic and therapeutic 422
management of the patients. 423
Consent for publication 424
Not applicable 425
Availability of data and materials 426
The datasets used and/or analyzed during the current study are available from the 427
corresponding author on reasonable request. 428
Competing interests 429
JN and SR are employees of HORIBA Ltd. PD is an external consultant of HORIBA Ltd. 430
Funding 431
The study was funded by HORIBA Ltd. The funder designed the study, provided all the 432
consumables for the hematology analyzer and helped with the analysis and 433
interpretation of the hematology analyzer results. 434

Authors' contributions 435
PD, SR and JN designed the study. JN drafted the manuscript and performed the data 436
analysis. PD collected all samples, performed the smear inspections and clinical 437
observations. SR and PD reviewed and corrected the manuscript. All authors read and 438
approved the final manuscript. 439
Acknowledgements 440
We thank the laboratory team of Dr. Dharap Diagnositic Centre for their support on 441
collecting the residual samples. Akika Ohashi and Masashi Nishimori for their support 442
in the statistical and data analysis 443
Authors' information (optional) 444
445
References: 446
1. WHO. World malaria report 2018. Geneva: World Health Organization; 447
2018. http://www.who.int/malaria/publications/world-malaria-report-2018/en/. 448
Accessed 20 Jan 2020. 449
2. McMorrow ML, Aidoo M, Kachur SP. Malaria rapid diagnostic tests in elimination 450
settings – can they find the last parasite? Clin Microbiol Inf. 2011, 17: 1624–1631. 451
3. Campuzano-Zuluaga G, Hänscheid T, Grobusch MP. Automated haematology analysis 452
to diagnose malaria. Malar J. 2010, 9, 346. 453
4. Mendelow BV, Lyons C, Nhlangothi P, Tana M, Munster M, Wypkema E, Liebowitz L, 454
Marshall L, Scott S, Coetzer TL. Automated malaria detection by depolarization of laser 455
light. Br J Haematol. 1999, 104(3):499-503. 456
5. Jain M, Gupta S, Jain J, Grover RK. Usefulness of automated cell counter in detection 457
of malaria in a cancer set up-Our experience. Indian J Pathol Microbiol 2012, 55:467-73. 458

6. Huh J, Jung J, Yoon H, Chung W. Pseudoeosinophilia associated with malaria 459
infection determined in the Sysmex XE-2100 hematology analyzer. Ann Hematol. 460
2005, 84:400-402. 461
7. Fourcade C, Casbas MJ, Belaouni H, Gonzalez JJ, Garcia PJ, Pepio MA. Automated 462
detection of malaria by means of the haematology analyser CoulterR GEN.STM. Clin 463
Lab Haematol. 2004, 26. 367-72. 464
8. Sun, Y., Xiang, D., Chen, C. et al. Infected RBC flag/parameter provided by Mindray 465
BC-6800 haematology analyzer aid the diagnosis of malaria. Malar J. 2019, 18, 262. 466
9. Jairajpuri ZS, Rana S, Hassan MJ, Nabi F, Jetley S. An analysis of hematological 467
parameters as a diagnostic test for malaria in patients with acute febrile illness: an 468
institutional experience. Oman Med J. 2014, 29(1):12-17. 469
10. Mu AK, Bee PC, Lau YL, Chen Y. Identification of protein markers in patients infected 470
with Plasmodium knowlesi, Plasmodium falciparum and Plasmodium vivax. Int J Mol 471
Sci. 2014, 15(11):19952-19961. 472
11. Paul R, Sinha PK, Bhattacharya R, Banerjee AK, Raychaudhuri P, Mondal J. Study of C 473
reactive protein as a prognostic marker in malaria from Eastern India. Adv Biomed Res. 474
2012, 1:41. 475
12. Sarfo BO, Hahn A, Schwarz NG, et al. The usefulness of C-reactive protein in predicting 476
malaria parasitemia in a sub-Saharan African region. PLoS One 2018,13:e0201693. 477
13. McGuire W, D´Alessandro U, Olaleye BO, Thomson MC, Langerock P, Greenwood BM, 478
et al. C-reactive protein and haptoglobin in the evaluation of a community-based 479
malaria control programme. Trans R Soc Trop Med Hyg. 1996, 90(1):10-4. 480
14. Andrade BB, Reis-Filho A, Souza-Neto SM. et al. Severe Plasmodium vivax malaria 481
exhibits marked inflammatory imbalance. Malar J. 2010, 9, 13. 482

15. Epelboin L, Boullé C, Ouar-Epelboin S, Hanf M, Dussart P, Djossou F, Nacher M, 483
Carme B. Discriminating Malaria from Dengue Fever in Endemic Areas: Clinical and 484
Biological Criteria, Prognostic Score and Utility of the C-Reactive Protein: A 485
Retrospective Matched-Pair Study in French Guiana. PLoS neglected tropical diseases. 486
2013, 7. 487
16. Awoke N, Arota A. Profiles of hematological parameters in Plasmodium 488
falciparum and Plasmodium vivax malaria patients attending Tercha General Hospital, 489
Dawuro Zone, South Ethiopia. Infect Drug Resist. 2019, 12:521-527. 490
17. Ullah I, Ali MU, Ali S, Ahmad R. et al. Hematological Profile of Patients Having 491
Malaria-positive Peripheral Blood Smears: A Cross-sectional Study at a Diagnostic 492
Research Center in Khyber Pakhtunkhwa, Pakistan. Cureus. 2019, 10 (9). 493
18. McMorran BJ, Marshall VM, de Graaf C, et al. Platelets kill intraerythrocytic malarial 494
parasites and mediate survival to infection. Science. 2009, 323(5915): 797-800. 495
19. Lacerda MV, Mourao MP, Coelho HC, Santos JB. Thrombocytopenia in malaria: who 496
cares? Mem. Inst. Oswaldo Cruz. 2011, vol.106 supl. 1. 497
20. Kho S, Barber BE, Johar E, et al. Platelets kill circulating parasites of all major 498
Plasmodium species in human malaria. Blood. 208, 132-12: 1332-1344. 499
21. Manmeet KG, Manisha M, Sachan B. et al. Thrombocytopenia in malaria and its 500
correlation with different types of malaria. Ann Trop Med Public Health.2013, 6:197-501
200. 502
22. Kotepui, M., Phunphuech, B., Phiwklam, N. et al. Effect of malarial infection on 503
haematological parameters in population near Thailand-Myanmar border. Malar J. 504
2014, 13, 218. 505
23. Da Costa Lima-Junior J, Nunes Rodrigues-da-Silva R, Araujo Pereira V, et al. Cells and 506
mediators of inflammation (C-reactive protein, nitric oxide, platelets and neutrophils) 507

in the acute and convalescent phases of uncomplicated Plasmodium vivax and 508
Plasmodium falciparum infection. Mem. Inst. Oswaldo Cruz. 2012, vol.107 no.8. 509
24. Akinosoglou KS, Solomou EE, Gogos CA. Malaria: a haematological 510
disease. Hematology. 2012, 17:2, 106-114. 511
25. Kotepui M, Piwkham D, PhunPhuech B, Phiwklam N, Chupeerach C, Duangmano S. 512
Effects of Malaria Parasite Density on Blood Cell Parameters. PloS one. 2020, 10. 513
26. Briggs C, Costa A, Freeman L, Aucamp I, Ngubeni B, Machin S. Development of an 514
Automated Malaria Discriminant Factor Using VCS Technology. American journal of 515
clinical pathology. 2006, 126. 691-8. 516
27. Singh A, Narang V, Sood N, Garg B, Gupta VK. Malaria Diagnosis Using Automated 517
Analysers: A Boon for Hematopathologists in Endemic Areas. J Clin Diagn Res. 2015, 518
9(10):EC05-EC8. 519
28. Yoon J, Yun SG, Kim J, Jung YN, Koh YE, Nam JH, et al. Evaluation of the LH780 520
hematology analyzer for detection and therapeutic monitoring of malaria: cross-521
reactivity with nucleated RBCs. Acta Trop. 2016, 164:425-30. 522
29. Sharma S, Sethi N, Pujani M, Kushwaha S, Sehgal S. Abnormal WBC scattergram: a 523
clue to the diagnosis of malaria. Hematology. 2013, 18:2, 101-105. 524
30. van Wolfswinkel ME, de Mendonça Melo M, Vliegenthart-Jongbloed K. et al. The 525
prognostic value of schizontaemia in imported Plasmodium falciparum malaria. Malar 526
J. 2012, 11, 301. 527
31. Hien S, Yeboah OR, Adou H, N'Guessan K, Kouacou APV, Dassé SR. Study about 528
relationship between C-reactive protein (CRP) and other indicators in children with 529
malaria. Journal of Infectious Diseases and Immunity. 2016, 8(2), 10-17. 530

32. Pelkonen T, Albino A, Roine I, Bernardino L, Peltola H. C-reactive protein in children 531
with malaria in Luanda, Angola: a prospective study. Trans R Soc Trop Med Hyg. 2015, 532
109(8):535-537. 533
33. Utuk EE, Ikpeme EE, Udo JJ, Akpan MU. Predictors of C-reactive protein response in 534
children infected with Plasmodium Falciparum malaria. East Afr Med J. 2014, 91(1):1-7. 535
34. Hurt N, Smith T, Teuscher T, Tanner M. Do high levels of C-reactive protein in 536
Tanzanian children indicate malaria morbidity. Clin Diagn Lab Immunol. 1994, 537
1(4):437-444. 538
35. Gillespie SH, Dow C, Raynes JG, Behrens RH, Chiodini PL, McAdam KP. Measurement 539
of acute phase proteins for assessing severity of Plasmodium falciparum malaria. J Clin 540
Pathol. 1991, 44(3): 228-231. 541
36. Crowson CS, Rahman MU, Matteson EL. Which measure of inflammation to use? A 542
comparison of erythrocyte sedimentation rate and C-reactive protein measurements 543
from randomized clinical trials of golimumab in rheumatoid arthritis. J Rheumatol. 544
2009, 36: 1606-1610. 545
37. Osei-Bimpong A, Meek JH, Lewis SM. ESR or CRP? A comparison of their clinical 546
utility. Hematology. 2007, 12: 353-357. 547
38. Kotepui M, PhunPhuech B, Phiwklam N, Uthaisar K. Differentiating between dengue 548
fever and malaria using hematological parameters in endemic areas of Thailand. 549
Infectious Diseases of Poverty. 2017, 6. 550
Figure Legends 551
Figure 1. Box plot of CRP values on different groups. Dengue (D), malaria and dengue 552
(MD), non-malaria-dengue samples (N), P. falciparum (PF), P. vivax (PV) and the 553
combination of both malaria species (PV + PF) distributions are represented with 554
their corresponding median value and outliers. 555

Figure 2. Box plot of CRP in association with parasitemia of P. vivax samples. All 556
individual points are displayed in the box plots 557
Figure 3. Box plot of CRP in association with age of P. vivax samples with parasitemia 558
less than 0.2%. All individual points are displayed in the box plots 559
Figure 4. WBC histograms of 2019 data-set with interferences around 37-fL. Bold lines 560
represent the median of the histograms. 561
Figure 5. Multiple linear regression model between the events before 43.9fL and 562
parasite density. The vertical axis corresponds to the number of events from 19.3fL to 563
43.9fL in the WBC histogram and the horizontal axis to the parasite density of small 564
and large forms of samples infected by malaria P. vivax. The regression model shows 565
that the contribution of the linearity is mainly provided by large forms of P. vivax 566
malaria infection. 567
568

Figures
Figure 1
Box plot of CRP values on different groups. Dengue (D), malaria and dengue (MD), non-malaria-denguesamples (N), P. falciparum (PF), P. vivax (PV) and the combination of both malaria species (PV + PF)distributions are represented with their corresponding median value and outliers.

Figure 2
Box plot of CRP in association with parasitemia of P. vivax samples. All individual points are displayed inthe box plots

Figure 3
Box plot of CRP in association with age of P. vivax samples with parasitemia less than 0.2%. Allindividual points are displayed in the box plots

Figure 4
WBC histograms of 2019 data-set with interferences around 37-fL. Bold lines represent the median of thehistograms.

Figure 5
Multiple linear regression model between the events before 43.9fL and parasite density. The vertical axiscorresponds to the number of events from 19.3fL to 43.9fL in the WBC histogram and the horizontal axisto the parasite density of small and large forms of samples infected by malaria P. vivax. The regressionmodel shows that the contribution of the linearity is mainly provided by large forms of P. vivax malariainfection.