The use of the Thematic Mapper for the analysis of eutrophic lakes: a case study in the Netherlands
22
rNT. J. REMoTE sENsrNG, 1993, vol. 14, No. 5,799-821 The use of the Thematic Mapper for the analysis of eutrophic lakes: a case study in the Netherlands. A. G. DEKKER and S. W. M. PETERS Vrije Universiteit-Institute of Earth Sciences, Section Hydrology, De Boelelaan 1085, l08l HV Amsterdam, The Netherlands ( Receiued 9 March 1991; in final form 15 Nouember l99l ) Abstract. Landsat TM images were analysed to assess the scope and limitations of their use for inland water quality detection. The spectral information in the six visible to middle infrared bands is discussed. The relatively wide spectral bands, I to 4, of the TM, in the optical wavelength domain contain a mixture of spectrally opposing features of absorption and scattering. Qualitative and quantitative analysis is carried out. The limiting factors in the quantitative determination of water quality parameters are in first instance the radiometric resolution and in second instance the spectral resolution. Combina- tions of spectral bands of the TM are discouraged for analysis purposes as long as a physical explanation of the result is lacking. Under ideal circumstances the TM can be used to assess seston dry weight, sum of chlorophyll a and phaeopigments, Secchi depth transparency with limited accuracy. 1. Introduction Within the course of the National Remote Sensing Programme of the Nether- lands, the Remote Sensing Loosdrecht Lakes project (RSLL) was carried out. Initial objectives were to determine the possibilities of studying and detecting temporal and spatial variations in water quality of the Loosdrecht Lakes system (Dekker and Seyhan 1988) using remote sensing techniques. use was made of satellite data, reported here, and airborne multi-spectral (CAESAR, Dekker et al 1990a, b) and imaging spectrometry data (PMI/FLI: Dekker et al. l99l). Although airborne remote sensing using high spectral resolution can attain quantitative assessment of water quality to a high degree of accuracy (Dekker et al. 1990a, b, 1991), relatively lower spectral and spatial resolution satellite imagery is important for several reasons. Thanks to their suÍfrcient spatial resolution, the Thematic Mapper (TM) and SPOT satellites are suited for imaging medium sized or smaller inland waters, such as the Loosdrecht lakes. The data is easily available at a moderate acquisition cost. A continuation of the TM and SPOT satellite programs is foreseen to the end of this decade, assuring continuity of data acquisition. The TM images discussed here are from the Thematic Mapper instrument which is mounted on board of the Landsat 5 satellite (launcfued on I March 1984). The primary aim of the system is land observation, resulting in specifications which lead to low radiometric sensitivity at low radiance levels, i.e., a small range of digital numbers encompasses the water leaving radiances. This small digital number (DN) range leads to a low signal to noise ratio. The maximum number of DNs is 256. Scene location of the Loosdrecht lakes is: Path 198 and Row 24. The overpass time is l1:06:49 M.E.T. The TM has a 16 day overpass frequency; according to van Der 0143-1161/93 $10.00 @ 1993 Taylor & Francis Ltd
Transcript of The use of the Thematic Mapper for the analysis of eutrophic lakes: a case study in the Netherlands
rNT. J. REMoTE sENsrNG, 1993, vol. 14, No. 5,799-821
The use of the Thematic Mapper for the analysis of eutrophic lakes: acase study in the Netherlands.
A. G. DEKKER and S. W. M. PETERSVrije Universiteit-Institute of Earth Sciences, Section Hydrology, De Boelelaan1085, l08l HV Amsterdam, The Netherlands
( Receiued 9 March 1991; in final form 15 Nouember l99l )
Abstract. Landsat TM images were analysed to assess the scope and limitationsof their use for inland water quality detection. The spectral information in the sixvisible to middle infrared bands is discussed. The relatively wide spectral bands, Ito 4, of the TM, in the optical wavelength domain contain a mixture of spectrallyopposing features of absorption and scattering.
Qualitative and quantitative analysis is carried out. The limiting factors in thequantitative determination of water quality parameters are in first instance theradiometric resolution and in second instance the spectral resolution. Combina-tions of spectral bands of the TM are discouraged for analysis purposes as longas a physical explanation of the result is lacking. Under ideal circumstances theTM can be used to assess seston dry weight, sum of chlorophyll a andphaeopigments, Secchi depth transparency with limited accuracy.
1. IntroductionWithin the course of the National Remote Sensing Programme of the Nether-
lands, the Remote Sensing Loosdrecht Lakes project (RSLL) was carried out. Initialobjectives were to determine the possibilities of studying and detecting temporal andspatial variations in water quality of the Loosdrecht Lakes system (Dekker andSeyhan 1988) using remote sensing techniques. use was made of satellite data,reported here, and airborne multi-spectral (CAESAR, Dekker et al 1990a, b) andimaging spectrometry data (PMI/FLI: Dekker et al. l99l). Although airborneremote sensing using high spectral resolution can attain quantitative assessment ofwater quality to a high degree of accuracy (Dekker et al. 1990a, b, 1991), relativelylower spectral and spatial resolution satellite imagery is important for severalreasons. Thanks to their suÍfrcient spatial resolution, the Thematic Mapper (TM)and SPOT satellites are suited for imaging medium sized or smaller inland waters,such as the Loosdrecht lakes. The data is easily available at a moderate acquisitioncost. A continuation of the TM and SPOT satellite programs is foreseen to the endof this decade, assuring continuity of data acquisition.
The TM images discussed here are from the Thematic Mapper instrument whichis mounted on board of the Landsat 5 satellite (launcfued on I March 1984). Theprimary aim of the system is land observation, resulting in specifications which leadto low radiometric sensitivity at low radiance levels, i.e., a small range of digitalnumbers encompasses the water leaving radiances. This small digital number (DN)range leads to a low signal to noise ratio. The maximum number of DNs is 256.Scene location of the Loosdrecht lakes is: Path 198 and Row 24. The overpass timeis l1:06:49 M.E.T. The TM has a 16 day overpass frequency; according to van Der
0143-1161/93 $10.00 @ 1993 Taylor & Francis Ltd
800 A. G. Dekker und S' W' M' Peters
Laan, in Noordzij et at. (1989), this results in I to 3 cloud-free images of the
Netherlands per year over a 14 year period (for Landsat MSS and TM combined).
In these la yèars (1975-1988) the chance to obtain at least one suitable cloud-free
summer "oultug"
from the whole of the Netherlands is 9 in 14, or 65 per cent per
yeaÍ.
2. Spectral signature analysis of Thematic Mapper bands
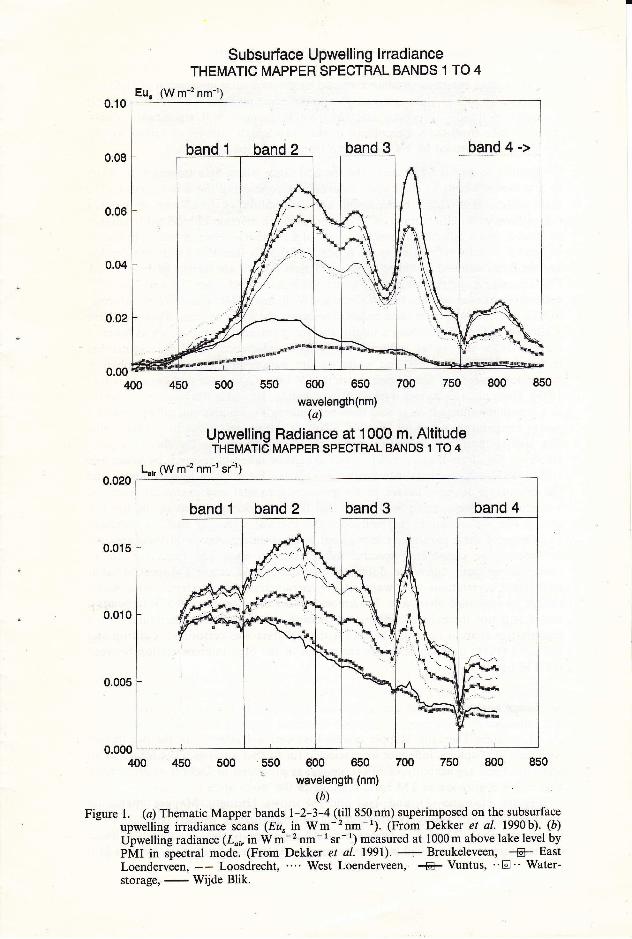
The spectrJ bands are fositioned to obtain as much information as possible over
a large variety of objects, using seven spectral bands, resulting in the specifications
shown in table 1. To evÁate the spectral information contained within each of the
TM spectral bands, spectral band boundaries were superimposed on spectral
upwelling irradiance .rr*". obtained in situ with handheld spectrometers (figure
1(a)) anà on spectral upwelling radiance obtained with the PMI imaging spectrom-
etàíingure t(i)) rromàn altiiude of 1000m. The figures do not depict the actual
spectiai sensitivíty of TM. They are intended as an illustration of the information
contents available within each band:
band I 450-520 nm. Most of the irradiance penetrating the water is absorbed by
aquatic humus and by chlorophyll 4 and accessory pigments. Towards 500 nm
tË absorption of light by theie parameters decreases. Backscattering becomes
the main spectral feature causing an increase in irradiance reflectance.
band 2 SZó-OOonm. This band shows a mixture of decreasing absorption by
aquatic humus and thus increasing irradiance reflectance caused by the backscat-
teiing by suspended particulate matter. In these eutrophic lakes there is a local
peak in reflectance at 580 nm.
Èanrl3 630-690nm. At 630nm the band cuts the absorption peak of cyanobac-
terial pigments (a biliprotein: phycocyanin) in two. The small irradiance reflec-
tance pát at 645nmls counter-acted by the strong absorption peak at 680nm
due to chlorophyll a and its byproducts (phaeopigments). Band 3 ends at 690nm
where a reflectance peak with a maximum at 706 nm starts to build up' The
reduction of upwelling radiance by the various absorbing agents is counter acted'
by the (back)sóattering. et a spectral resolution of 60 nm no discrimination into
separate features is Possible.UanA I 760-900 nm. The subsurface measurements available to us do not reach
beyond 850nm. From 850 to 900nm absorption by water increases rapidly, so
*. usrrr-e this to be of little significance. At 760 nm band 4 just includes the
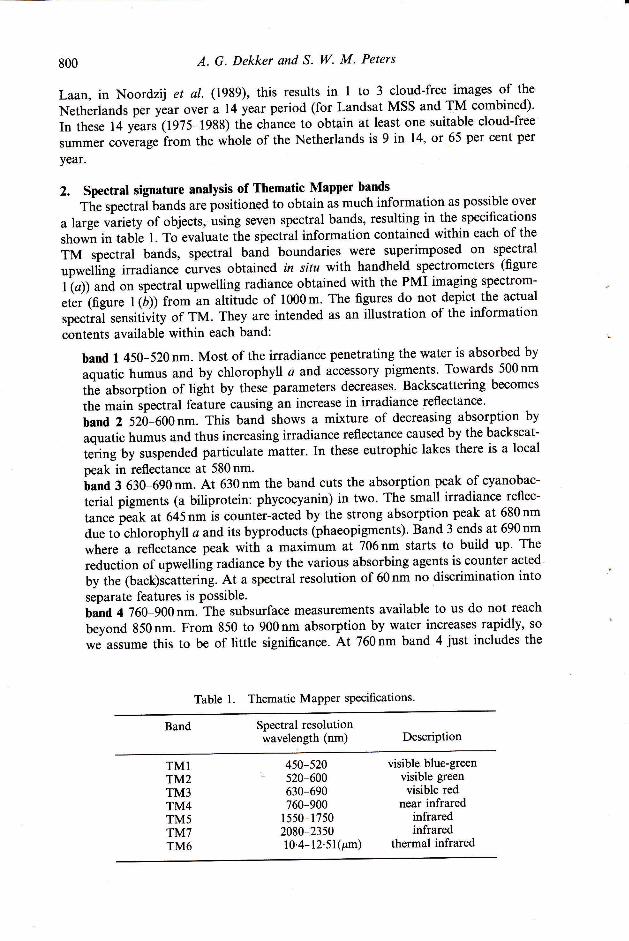
Table l. Thematic Mapper specifications.
Band Spectral resolutionwavelength (nm) Description
TMITM2TM3TM4TM5TM7TM6
450-520520-600630-690760-900
1550-17502080-235010'4-12'51(pm)
visible blue-greenvisible greenvisible red
near infraredinfraredinfrared
thermal infrared
Subsurface Upwelling lrradianceTHEMATIC MAPPER SPECTRAL BANDS 1 TO 4
(Wm-'znmr)0.10
0.08
0.06
0.04
0.02
450 750 800 850
(a)
Upwelling Radiance at 1000 m. AltitudeTHEMATIC MAPPER SPECTHAL BANDS 1 TO 4
450 600 650
wavelength (nm)
(b)
Figure l. (a) Thematic Mapper bands l-2-3-4 (till 850_nm) superimposed on the subsurface- upwelling irradiance scans (Ea" in Vy'm-2qm-1;. lFrom Dekker et al. 1990b). (b)
Upwelling radiance (L.ninWm-2nm-1sr-1) measured at 1000m above lake level byPMI in spectral mode. (From Dekker et al. l99l).7 Breukeleveen, -€- EastLoenderveen, -- Loosdrecht, "" West Loenderveen, -€l- Vuntus, "8" Water-storage,
- V/ijde Blik.
0.00 ffi400 600 650
wavelength(nm)
0.000 -400 750 800 850
\n (W m-'nm-t sr=t;

802 A. G. Dekker and S. W. M. Peters
minimum in solar/sky irradiance caused by the molecular absorption of H2O and
02 (slater 1980). Although many textbooks mention band 4 as the band where
water is totally absorbing and thus black, there is still significant upward
irradiance from the watercolumn in this wavelength interval in turbid waters,
likely to be caused by backscattering from suspended matter.
Bands 1 to 4 of the TM are in the spectral range where light traverses the water
to a suÍficient extent to elicit some information concerning the water quality. The
main effects that could be detected are attenuation of irradiance in band I(absorption by aquatic humus and by chlorophyll a), increase of reflected irradiance
in band 2, and a diÍficult to interpret result of a number of counter-acting processes
in band 3. Band 4 reflectance is the product of rapidly increasing water absorption
and probably suspended matter reflection. Bands 5 and 7 are further in the infrared.
Theàbsorption càefficients of pure water for bands 5 zndT are 700 and 2700m-1respectively (based on data from Palmer and Williams 1974). Therefore no informa-tion can be obtained from these bands concerning the water column. They may have
a purpose as far as presenting a totally absorbing surface. Features such as foam orsurface slicks may be of influence on band 5 reflectance. Band 5 is sometimes
included in algorithms relating water quality parameters such as chlorophyll a,
suspended matter and Secchi-disk depth (DHV 1988, Ortiz Casa and Pena Martinez1989). These algorithms lack a physical explanation. Probably the band 5 data serves
as a constant value (which should then be mentioned). The thermal infrared band 6
makes temperature mapping possible, albeit of the water surface microlayer only.The spatial resolution of 120m makes this band unsuitable for this lake area.
However, for larger lakes, if used, notice should be taken of research by Sódergren
(1984, 1987), who analysed this surface microlayer for lakes in Sweden and foundthe microlayer to be different in composition (physical and chemical) from the
watercolumn. Evaporation heat losses and thermal microgradients in the top few
cms of the watercolumn may influence the thermal signal as well. A thoroughknowledge of these parameters is required to allow interpretation of these results.
Due to the convoluted spectral information in each TM band the use ofcombinations (sum, difference, difference over sum, ratios, etc) of TM spectral bands
to increase correlations with water quality parameters, will produce results whichcannot be explained physically. The amount of information extracted from bands 2
and 3 will not increase by adding or ratioing the two bands. Therefore only aquantitative analysis on single bands for the TM data was performed. Lathrop and
Lillesand (1986) used single bands for reason of the high intercorrelation between
the TM bands 1-4.
3. lmage analysis3.1. Introduction
Of the eight Thematic Mapper images that were available to us, the two images
with least atmospheric influence were selected for further analysis. (The results of ananalysis of the applicability of SFOT images is presented in Dekker et al. 1990b).Figure 2 is a grey-scaled TM band 5 image of the study area.
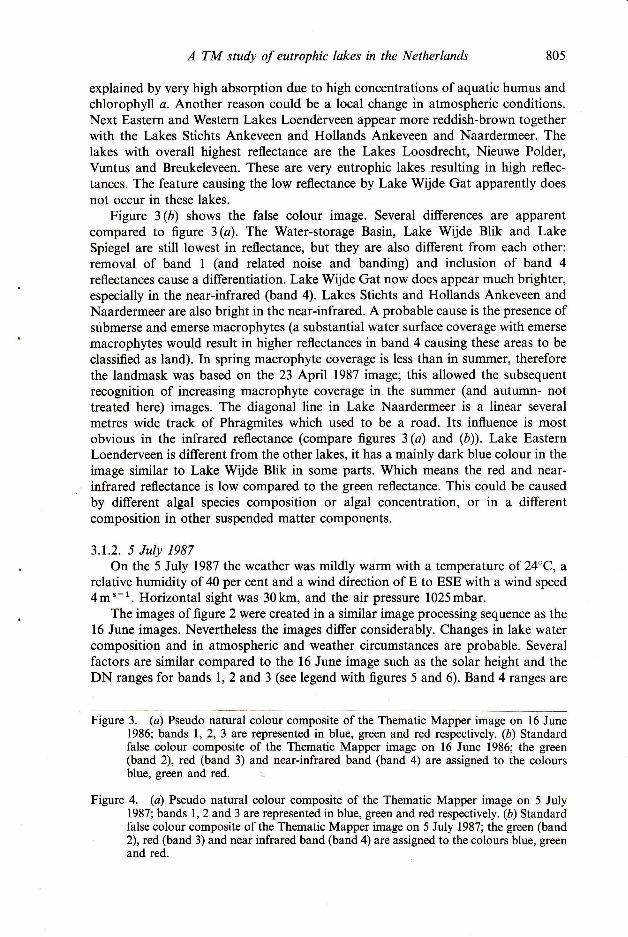
Figures 3(a) and (ó), and 4(a) and (á) shows Thematic Mapper images on16 June 1986 and 5 July 1987. Figures 3(a) and 4(a) are pseudo natural colourimages (bands l, 2 and 3 as blue, green and red respectively). A supervised linearcontrast stretch was applied in order to increase the image brightness. Figures 3 (á)

A TM study of eutrophic lakes in the Netherlands
Figure 2. The Loosdrecht lakes and northern Vecht lakes area. Based on a ThematicMapper band 5 image.
and 4(b) are standard false colour images of bands 2,3 and 4 (bands 1, 2 and 3 as
green, red and near-infrared respectively). Both types of images show qualitativeinformation such as patterns within and differences between lakes. Quantitativeinformation extraction involves statistical analysis on preprocessed images.
3.1.1. 16 June 1986
On 16 June 1986 the weather was relatively \ilarm with a temperature of 27'C, a
relative humidity of 55 per cent, the wind direction was from NE to ESE with a windspeed of 3ms-1. Horizontal sight was 12km and the air pressure was 1014mbar.
Figure 3 (a) shows the Water-storage Basin, Lake Wijde Blik and Lake Spiegel as
dark blue: these are the deeper clearest lakes in this area. Lake Wijde Gat is also thiscolour: this is contrary to the very eutrophic status of this shallow lake and may be
803

Figure 3.
Figure 4.
A TM study of eutrophic lakes in the Netherlands 805
explained by very high absorption due to high concentrations of aquatic humus andchlorophyll a. Another reason could be a local change in atmospheric conditions.Next Eastern and Western Lakes Loenderveen appear more reddish-brown togetherwith the Lakes Stichts Ankeveen and Hollands Ankeveen and Naardermeer. Thelakes with overall highest reflectance are the Lakes Loosdrecht, Nieuwe Polder,Vuntus and Breukeleveen. These are very eutrophic lakes resulting in high reflec-tances. The feature causing the low reflectance by Lake rWijde Gat apparently doesnot occur in these lakes.
Figure 3 (á) shows the false colour image. Several differences are apparentcompared to figure 3 (a). The Water-storage Basin, Lake Wijde Blik and LakeSpiegel are still lowest in reflectance, but they are also different from each other:removal of band I (and related noise and banding) and inclusion of band 4reflectances cause a differentiation. Lake Wijde Gat now does appear much brighter,especially in the near-infrared (band 4). Lakes Stichts and Hollands Ankeveen andNaardermeer are also bright in the near-infrared. A probable cause is the presence ofsubmerse and emerse macrophytes (a substantial water surface coverage with emerse
macrophytes would result in higher reflectances in band 4 causing these areas to be
classified as land). In spring macrophyte coverage is less than in summer, thereforethe landmask was based on the 23 April 1987 image; this allowed the subsequentrecognition of increasing macrophyte coverage in the summer (and autumn- nottreated here) images. The diagonal line in Lake NaardeÍneer is a linear several
metres wide track of Phragmites which used to be a road. Its influence is mostobvious in the infrared reflectance (compare figures 3 (a) and (á)). Lake EasternLoenderveen is diÍferent from the other lakes, it has a mainly dark blue colour in theimage similar to Lake Wijde Blik in some parts. Which means the red and near-infrared reflectance is low compared to the green reflectance. This could be caused
by different algal species composition or algal concentration, or in a differentcomposition in other suspended matter components.
3.1.2. 5 July 1987On the 5 July 1987 the weather was mildly warm with a temperaturc of 24"C, a
relative humidity of 40 per cent and a wind direction of E to ESE with a wind speed4m'-1. Horizontal sight was 30km, and the air pressure 1025mbar.
The images of figure 2 were created in a similar image processing sequence as the16 June images. Nevertheless the images differ considerably. Changes in lake watercomposition and in atmospheric and weather circumstances are probable. Severalfactors are similar compared to the 16 June image such as the solar height and theDN ranges for bands l,2 and 3 (see legend with figures 5 and 6). Band 4 ranges are
Figure 3. (a) Pseudo natural colour composite of the Thematic Mapper image on 16 June1986; bands 1,2,3 are represented in blue, green and red respectively. (á) Standardfalse colour composite of the Thematic Mapper image on ló June 1986; the green(band 2), red (band 3) and near-infrared band (band 4) are assigned to the coloursblue, green and red. :
Figure 4. (c) Pseudo natural colour composite of the Thematic Mapper image on 5 July1987; bands l, 2 and 3 are represented in blue, green and red respectively. (á) Standardfalse colour composite of the Thematic Mapper image on 5 July 1987; the green (band2), red (band 3) and near infrared band (band 4) are assigned to the colours blue, greenand red.
A TM study of eutrophic lakes in the Netherlands
different. The atmospheric influence on 5 July is much smaller as can be deducedfrom the lowest DN levels and the horizontal sight values (12 versus 30 km).
3.2. Preparatory image analysisTo grid-reference the images a geometrical correction was carried out, ensuring
the same location of the spectral samples of the landmask in the images. For reasonsmentioned earlier, Ihe 23 April 1987 image was chosen as a reference base. Then anearest neighbour correction was applied. The pixel size remained constant. Subse-quently using band 4 a landmask was defined and applied. Band 4 was chosenbecause it represented the band which combined low atmospheric influence withinterpretable spectral knowledge (up to the range of the fieldspectroradiometer of850nm).
TM image quality is influenced by four types of distortions:
l. Random noise due to low radiance levels. The only remedy would be toincrease the radiometric sensitivity of the TM especially at lower radiancevalues.
2. 16line striping caused by inaccurate calibrated Landsat sensor outputs. The16 line noise can be seen clearly in figure 3 (a) and 4 (a), it is most obvious inband l, the blue spectral band.
3. Banding of 16 lines, caused by an unequal response between a forward and abackward scan.
4. Blockshaped noise: Especially at low radiance levels it appears that the sensorbecomes sensitive for antecedent observations and/or calibration errors likerounding. This can result in a random amount of line striping superimposedover the 16 line striping. This type of noise was detected after applying 16 and32 band line destriping algorithms and analysing the residual noise compo-nent. This type of noise is random and on a scale which makes it impossible tocorrect it with local filters.
In the image preprocessing phase the systematic noise component (see noise nr 2)may be reduced. There are a number of ways to reduce the 16 line noise:
1. Decalibrate the image and adjust each of the 16 line sets with respect to thetotal image characteristics and calibrate again (see Grunwald, Mauser andSchneider, 1988). For this method the originally applied system calibrationfactors are necessary.
Figure 5. (a) Colour coded TM band 2 image depicting water quality concentration on the16 June 1986. Concentrations of water quality parameters can be determined bycomparing the DN values in the image with the calculated values in table 7 (a). (b)Colour coded TM band 3 image depicting water quality concentration on the 16 June1986. Concentrations of water quality parameters can be determined by comparing theDN values in the image with the calculated values in table 7 (b).
Figure 6. (a) Colour coded TM band 2 image depicting water quality concentration on the5 July 1987. Concentrations of water quality parameters can be determined bycomparing the DN values in the image with the calculated values in table 7 (c). (ó)Colour coded TM band 2 image depicting water quality concentration on the 5 July1987. Concentrations of water quality parameters can be determined by comparing theDN values in the image with the calculated values in table 7 (d).
807

808 A. G. Dekker and S. W. M. Peters
2. Apply the adjustment algorithm to the calibrated image. This has been done
in this research in order to enhance the qualitative interpretability of the rawimage.
3. Use a local averaging filter with minimal kernel width of 16pixels. Of course
the averaging can only take place over larger surface areas.
Because all these methods change the observed digital numbers it was investi-gated if sampling strategy could compensate for the most serious noise effects.
Final preprocessing products were
1. the geometrical corrected landmasked image2. the line-adjusted version of the geometrical corrected landmasked image
For purposes of quantitative analysis the first type is recommended. For pattern
analysis and qualitative analysis the second type is better suited.
3.3. Collection of input data for regression analysisBased on long term records a good assumption about local lake water quality
seemed to be that the intra-lake variability is much smaller than the inter-lakevariability. A number of factors support this assumption such as the compartment-alisation ofthe lakes, different sources ofwater, different usages and so on. Thus an
elaborate (and expensive) sampling campaign was avoided in which spectral samples
are collected exactly on the locations of the field reference data collection sites. Thiswould not have been a sensible approach due to the fact that no reference data were
available for the overpass days. So the water quality data (obtained from routinemeasurements carried out by the Water Pollution Control Authority Amstel- en
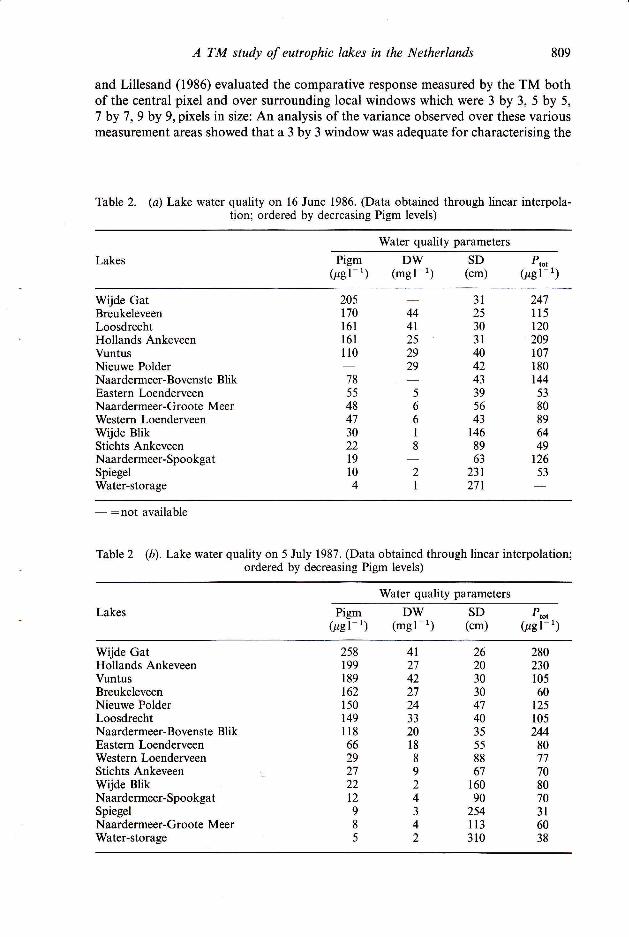
Gooiland (ZAG) for the northern Vecht lakes and by the Limnological Institute ofThe Netherlands for the Loosdrecht lakes) was estimated through linear interpola-tion. The interpolated values were subsequently checked against the annual patternsof 1983 to 1988 (Breebaart et al. 1989 for the Loosdrecht Lakes and by the WaterPollution Control Authority Amstel- en Gooiland (ZAG) for the Northern VechtLakes). Any outliers were discarded. Table 2a-b shows the interpolated values ofmain optical water quality parameters per lake on these dates. However, linearinterpolation of data may lead to wrong estimates due to non-linear behaviour ofthe parameters, smoothing of peaks and lows in values and, in general, to not beingable to accurately determine the behaviour of a dynamic ecosystem such as lakes.
Because of the above named reasons Reardon and McGarrigle (1989) declinedusing regression analysis for a research involving 100 lakes in Ireland. Instead theyused clustering algorithms to group their lakes. The method applied here, howeverdoes allow the use of nonsynchronous water quality data (Whitlock, Kuo andLeCroy 1982, specifically recommended research into the area of nonsychronousdata) under the condition that as much attention as possible is given to the reliabilityof the interpolated data. The similar results compared with the study by Lathropand Lillesand (1986) supports this view. It was decided that a reasonable approachwould be to use an interpolated value for each water quality parameter per lake andsubsequently try to relate this to one spectral sample from the lake. The next step
was finding the optimal sample size. In order to assess the potential noise in the TMdata and to assess the impact of potential errors in sample point location Lathrop
A TM study of eutrophic lakes in the Netherlands
and Lillesand (1986) evaluated the comparative response measured by the TM bothof the central pixel and over surrounding local windows which were 3 by 3, 5 by 5,
7 by 7,9 by 9,pixels in size: An analysis of the variance observed over these variousmeasurement areas showed that a 3 by 3 window was adequate for characterising the
Table 2. (a) Lake water quality on 16 June 1986. (Data obtained through linear interpola-tion; ordered by decreasing Pigm levels)
Water quality parameters
Lakes Pigm DW SD P,o,(pg l- t) (mg l- t) (cm) (pg l- t)
809
Wijde GatBreukeleveenLoosdrechtHollands AnkeveenVuntusNieuwe PolderNaardermeer-Bovenste BlikEastern LoenderveenNaardermeer-Groote MeerWestern LoenderveenWijde BlikStichts AnkeveenNaardermeer-SpookgatSpiegelWater-storage
205170l6l161
110
247ll5120209107r80144
5380896449
12653
3l25303l404243395643
1468963
23r27t
444t252929
5
66I8
2I
785548473022t9l04
- : not available
Table 2 (ó). Lake water quality on 5 July 1987. (Data obtained through linear interpolation;ordered by decreasing Pigm levels)
Water quality parameters
Lakes Pigm(pg l- t)
DW(-gl-t)
sD P,o,(cm) (pel-')
V/ijde GatHollands AnkeveenVuntusBreukeleveenNieuwe PolderLoosdrechtNaardermeer-Bovenste BlikEastern LoenderveenWestern LoenderveenStichts AnkeveenWijde BlikNaardermeer-SpookgatSpiegelNaardermeer-Groote MeerWater-storage
28023010560
t2s105244
80777080703l6038
26203030474035558867
16090
254ll3310
4t27422724JJ20l8
8
924J42
258199189162150149118662927221298
5
Mean TM2-DN
oo o o o
xx * * x ' * )<
A.
810 A. G. Dekker and S. W. M. Peters
I37
36
b\'35
34
33
320 100
Standard deviation TM2-DN
200 300Sample size
500
0.8
0.7
(ó) o.o
0.5
0.4
0.3
31
30
(c) 2s
28
27
26
25
Mean TMS-DN32-
o".xx * )1< * x
B+ -G - €r- - -6 - - -EF - - - EJ
200 300Samplê size
Figure 7.
r00

A TM study of eutrophic lakes in the Netherlands
StandaÍd dêviation TM3-DN
0.80
@) o.m
0.60
0.50
0.40
0.30
Sample size
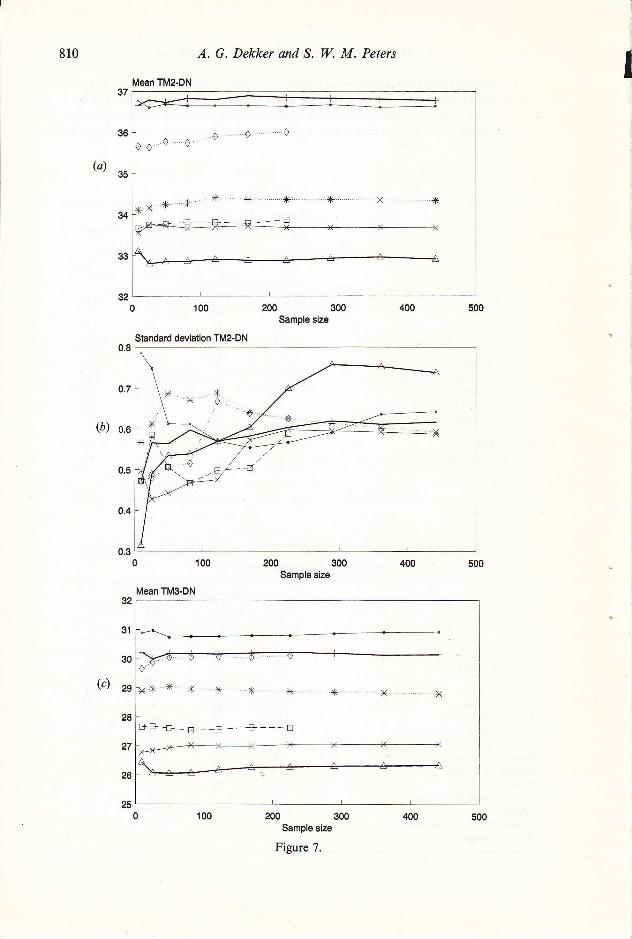
Figure 7. (a) Progression of the mean spectral sample value (in DN) with increasing samplesize for TM band 2 of 16 June 1986. (à) Progression of the standard deviation (inDN) with inoeasing sample size for TM band 2 of 16 June 1986. (c) Progression of themean spectral sample value (in DN) with increasing sample size for TM band 3 of 16
June 1986. (d) Progression of the standard deviation (in DN) with increasing samplesize for TM band 3 of 16 June 1986.
data aÍ each station for their research. This method was carried out for the TMimages in the RSLL project: the results are different (in this research we did notmake use of simultaneous ground-based measurements). For this purpose squaresamples with a cross-section size from I to 2l pixels were taken in the larger lakes.
Graphs (figures 1(a)-(d)) were made which show the change in standard deviationand average DN value with increasing sample size for TM bands 2 and 3. Thegraphs indicated that a 17 by 17 pixel sampling size equal to a 510 by 510 m area was
optimal. If the lake was not large enough for such a sample then the largest possible
sample was taken. The aforementioned 16 line striping and the banding of 16 linesoccurring in all images is probably a prime factor contributing to this value.
It appeared that an additional quality criterion was necessary in order to assure
spectral validity of the sample (exclusion of cloudy/hazy aÍeas, emerging macro-phytes, pieces of land etc). The standard deviation of a sample in band 4 proved tobe such a criterion. If this value was belovr l'0 we assumed the spectral signal to be
derived from the watercolumn and a constant water surface and atmosphericcomponent. This caused a decrease in the amount of samples from the original 16
lakes to 9 for the 16 June 1986 image and to l0 for the 5 July 1987 image. Althoughthe amount of samples is less, the spectral quality of the samples has increased. Eachof the samples of bands 2 to 7 taken in the lakes large enough for a 17 by 17 pixelssample (lakes Loosdrecht, Breukeleveen, Spiegel, Eastern Loenderveen and WijdeBlik) also showed a standard deviation smaller than I (see table 3).
The gradient in water quality within this set of lakes, ranging from the clearest tothe most turbid, indicates that sampling of these lakes combined with Landsat TMimages would be suÍficient to map all the other lakes in this area. This could be
applied to other similar water bodies, provided atmospheric circumstances are the
8ll
812 A. G. Dekker and S. W. M. Peters
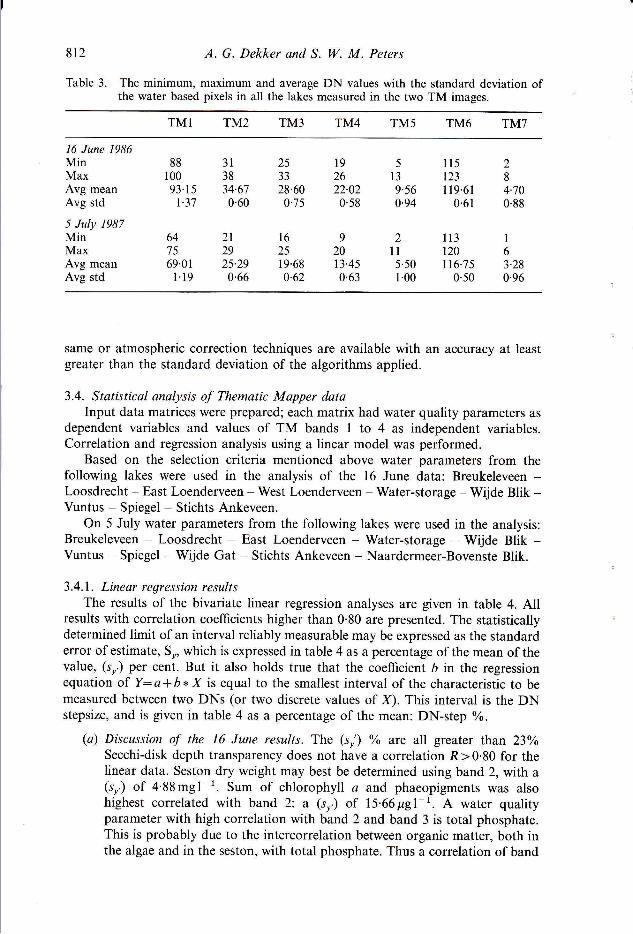
Table 3. The minimum, maximum and average DN values with the standard deviation ofthe water based pixels in all the lakes measured in the two TM images.
TMl TM2 TM3 TM4 TM5 TM6 TM7
16 June 1986MinMaxAvg meanAvg std
5 July 1987MinMaxAvg meanAvg std
ll5 2123 8
I19.61 4.700'61 0.88
ll3 I120 61t6.75 3.28
0.50 0.96
same or atmospheric correction techniques are available with an accuracy at leastgreater than the standard deviation of the algorithms applied.
3.4. Statistical analysis of Thematic Mapper dataInput data matrices were prepared; each matrix had water quality parameters as
dependent variables and values of TM bands I to 4 as independent variables.Correlation and regression analysis using a linear model was performed.
Based on the selection criteria mentioned above water parameters from thefollowing lakes were used in the analysis of the 16 June data: Breukeleveen -Loosdrecht - East Loenderveen - West Loenderveen - Water-storage - Wijde Blik -Vuntus - Spiegel - Stichts Ankeveen.
On 5 July water parameters from the following lakes were used in the analysis:Breukeleveen - Loosdrecht East Loenderveen - Water-storage - Wijde Blik -Vuntus Spiegel - Wijde Gat - Stichts Ankeveen - Naardermeer-Bovenste Blik.
3.4.1. Linear regression resultsThe results of the bivariate linear regression analyses are given in table 4. All
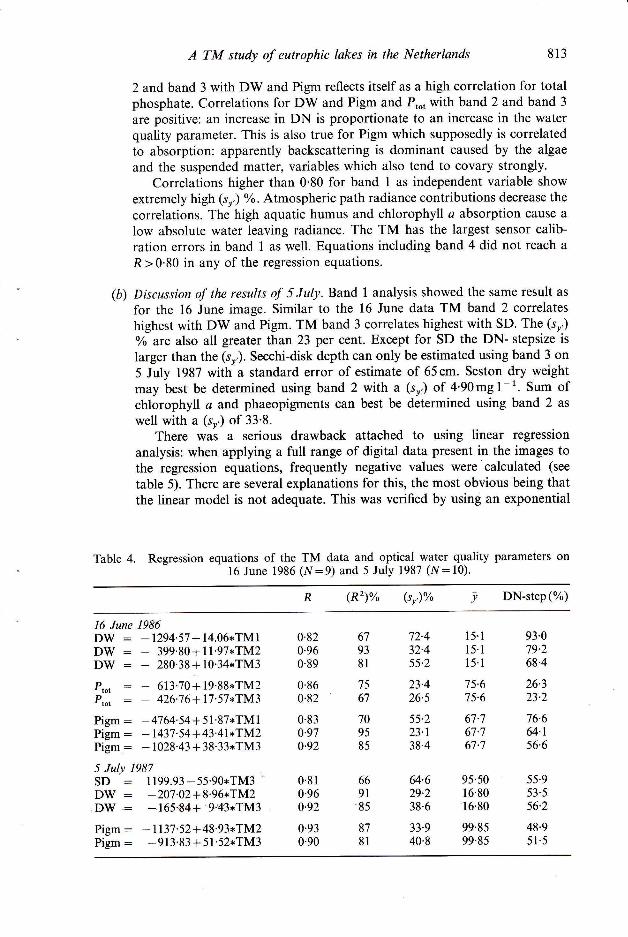
results with correlation coefficients higher than 0'80 are presented. The statisticallydetermined limit of an interval reliably measurable may be expressed as the standarderror of estimate, S, which is expressed in table 4 as a percentage of the mean of thevalue, (sr,) per cent. But it also holds true that the coeÍficient á in the regressionequation of Y:a-lbxX is equal to the smallest interval of the characteristic to bemeasured between two DNs (or two discrete values of X). This interval is the DNstepsize, and is given in Íable 4 as a percentage of the mean: DN-step %.
(a) Discussion of the 16 June results. The (sr') Yo arc all greater Íhan 23oÁSecchi-disk depth transparency does not have a correlation R>0.80 for thelinear data. Seston dry weight may best be determined using band2, with a(sr,) of 4'88mgl-1. Sum of chlorophyll a and phaeopigments was alsohighest correlated with band 2: a (sn,) of 15.66pg1-1. A water qualityparameter with high correlation with band 2 and band 3 is total phosphate.This is probably due to the intercorrelation between organic matter, both inthe algae and in the seston, with total phosphate. Thus a correlation of band
88100
93.15r.37
647569.01
r.19
3l3834.670.60
2t2925.290.66
25JJ28.600.75
t625r9.680.62
l92622.020.58
92013.450.63
5
13
9.560.94
2ll5'501.00
A TM study of eutophic lakes in the Netherlands 813
2 and band 3 with DW and Pigm reflects itself as a high correlation for totalphosphate. Correlations for DW and Pigm and P,o, with band 2 andband 3
are positive: an increase in DN is proportionate to an increase in the waterquality parameter. This is also true for Pigm which supposedly is correlatedto absorption: apparently backscattering is dominant caused by the algae
and the suspended matter, variables which also tend to covary strongly.Correlations higher than 0.80 for band I as independent variable show
extremely high (sr,) %. Atmospheric path radiance contributions decrease the
correlations. The high aquatic humus and chlorophyll a absorption cause a
low absolute water leaving radiance. The TM has the largest sensor calib-ration errors in band I as well. Equations including band 4 did not reach a
R>0'80 in any of the regression equations.
(b) Discussion of the results of 5 July. Band 1 analysis showed the same result as
for the 16 June image. Similar to the 16 June data TM band 2 correlates
highest with DW and Pigm. TM band 3 correlates highest with SD. The (sr,)oÁ are also all greater than 23 per cent. Except for sD the DN- stepsize is
larger than the (sr,). Secchi-disk depth can only be estimated using band 3 on
5 July 1987 with a standard error of estimate of 65cm. Seston dry weightmay best be determined using band 2 with a (sr) of 4'90mgl-1. Sum ofchlorophyll a and phaeopigments can best be determined using band 2 as
well with a (sr,) of 33'8.
There was a serious drawback attached to using linear regression
analysis: when applying a full range of digital data present in the images tothe regression equations, frequently negative values were calculated (see
table 5). There are several explanations for this, the most obvious being thatthe linear model is not adequate. This was verified by using an exponential
Table 4. Regression equations of the TM data and optical water quality parameters on16 June 1986 (N:9) and 5 July 1987 (N:10).
(R')% (tn')% y DN-step(%)
16 June 1986DW : -1294'57 +14.06*TM1DW : - 399.80+11.97*TM2DW : - 280'38+10'34*TM3
P,o, : - 613'70+19'88*TM2P,o, : - 426'76+17'57*TM3
Pigm : - 4764'54+ 5l'87*TM1Pigm : -1437'54+43'41*Tll2Pigm : -1028'43+38'33*TM35 July 1987SD 1199.93 - 55'90*TM3DW : -207'02+8'96*TM2EW : -165'84+ 9'43*TM3
Pigm : -1137.52 +48.93*TM2Pigm : -913'83+51'52*TM3
95.50 55.916.80 53.516.80 56.2
0.820.960.89
0'860.82
0.830.970.92
0.810.96a.92
72.432.455.2
23.426.s
55.223.138.4
7 5-675.6
67.767.767.7
26.323.2
76.664.156.6
67938l
7567
709585
15.1 93.015.1 79.215. I 68.4
66 64.69t 29.28s 38.6
0.93 87 33.90.90 8l 40.8
99.8599.85
48.951.5

814 A. G. Dekker and S. W. M. Peters
Table 5. An example of concentration intervals of water quality parameters calculatedTM band 2 on 16 June 1986 using the linear regression model.
for
DW (mgl-r) Pigm (pgl-l) P., (pg 1-')
DN32DN33DN34DN35DN36DN37
-23- -ll- I l-l
r*1313-2525-3737-49
-70--21-27-17
l7-6060 104
104-147147,190
t2-3232-52s2-7272-9292-t12
tt2-132
model. The results will be presented further on. Another (partial cause) mightbe a non-linear sensitivity of the TM system for low DNs.
As can be seen from the table the intervals measurable between two DNsis often larger than the (sr,). It is the low radiometric sensitivity of the TMwhich is the limiting factor in an accurate assessment of water qualityparameters.
3.4.2. Discussion of log-transformed data regression resultsLogarithmic transformation of the data enabled the application of an exponen-
tial curve of the form Y: a x Xb using linear regression technique (the equation used
then becomes Ln Y:Ln aIbLn X). This model fits the data much better. There is
physical basis for this as well: firstly negative values (calculated using the linearregression equation) for the parameters do not occur (this could be solved by forcingthe intercept to the lowest DN encountered over water in the entire image- resultingin lower correlations); secondly most of the correlation between radiance values and
the water quality parameters is based on the (back)scattering properties of the waterconstituents. An increase in scattering will also increase the multiple scattering, thisis likely to give the increase an exponential character. Thirdly the spread in the datafrom highly eutrophic lakes varies more in time than data from oligotrophic ormesotrophic lakes,
Lathrop and Lillesand (1986) arrived at the same best fit for their TM data ofGreen Bay and Lake Michigan, making use of in sítu sampling techniques carriedout within l'5 hours of the TM pass. This is an indication that the non-simultaneoussampling technique used in this research is appropriate (given the lack of simul-taneous data). They found highest correlations:
N:9. R:0'99 for SD and TM band 2 forN:6, R:0'95 for SD and TM band 2 forN:13, R:0'99 for chlorophyll a and TMl'04 pg l- L
.
N:7, R:0.98 for chlorophyll a and TM band.2 for Lake Michigan, with a (sr,) ofl'05 pg l-
3.4.2.1 Log-tranformed data regression results for the 16 June and 5 July images.In contrast to the result from the non-transformed data, the log-transformed
data had a higher correlation of SD, DW and Pigm with band 3 than with band 2.
The values are given in table 6.
Green Bay, with a (sn) of l05cm.Lake Michigan, with (sr.) of ll2cm.band 2 for Green Bay, with a (sn,) of

A TM study of eutrophic lakes in the Netherlands 815
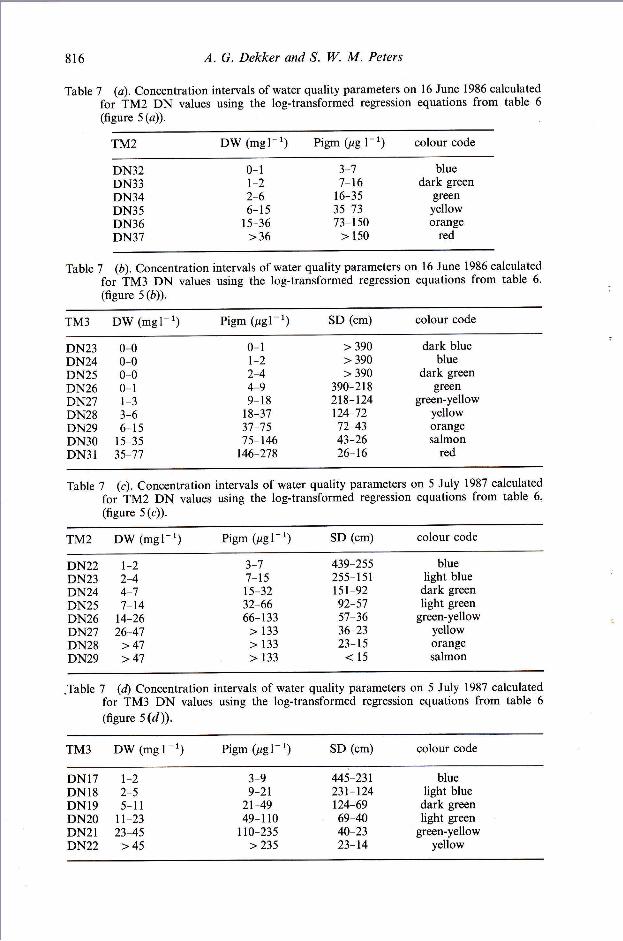
The log-transformation caused calculated dimensions of the dependent variablesbased on the bivariate linear regression results to be more realistic, especially at lowdigital numbers for the DW and Pigm concentrations and at high DNs for SDtransparencies. At the other end of the scale, however, the values become unrealisti-cally high for DW and Pigm. Therefore the lowest and highest DN values in table7 (a-d) which lead to the calculation of unrealistic values are marked with a lowerthan (<) or greater than (>) sign instead of an estimated parameter value.
A drawback of using log-transformed data is that at high DN (low DN for SD)levels the interval of water quality parameter estimation between two DNs increases
exponentially as illustrated in table 7. (Lathrop and Lillesand (1986) also calculatedexponentially increasing intervals for colour coded TM band2 images of chlorophylla and SD). The SD values calculated for TM band 3 at low DNs are unrealistic:probably from DN 25 or less SD should be given as greater than 390cm. These
regression equations are based on a small set of interpolated data. More data valueswill increase the reliability of the results. Another possibility could be to use anexponential relation for the lower DN range and a linear relation for the upper DNrange. In that case non-linear regression should be applied to see if one regressionequation can cover the entire range of water quality parameters and associationDNs. A larger and better data set is needed to actually prove if this is a goodapproach.
3.5. DiscussionExcept for the (sn,) as a limiting factor for accuracy of determination, the
absolute amount of DN levels is also limiting. The amount of concentration levelsmaximally discernible expressed as DNs, with a minimum threshold of at leastl0pixels per levels, is:
Table 6. Regression equations using the log-transformed data for 16 June, 1986 and5 July 1987. (The regression formula: Y:aXb; the coefficients are determined using theformula: ln Í:ln a+bln X).
R @\(%)
16 June 1986ln SD
ln DWln l)W
ln Pigmln Pigm
5 July 1987ln SDln SD
+ 54'97 - 15'13 ln TM3
-112'74+32'34In TM2- 82.16+25.08 ln TM3
- 88'32+25'95 ln TM2
- 63.65+20.08 ln TM3
+ 42'75- ll'95 ln TM2+ 37.36- ll'15 ln TM3
- 49'39+16'07lnTll42- 40.87+14.56ln TM3
- 55'37+18'39In TM2- 43'54+ 15.97In TM3
-0.90 81
-0.82- 0.93
0'850.93
0.870.91
0'880.90
0.830.85
7882
7072
6886
7386
7783
ln DWln DW
ln Pigmln Pigm
816 A. G. Dekker and S. W. M. Peters
Table 7 (a). Concentration intervals of water quality parameters on 16 June 1986 calculatedfor TM2 DN values using the log-transformed regression equations from table 6(figure 5(a)).
TM2 DW (mg1-r) Pigm (pg l-1) colour code
DN32DN33DN34DN35DN36DN37
0-lt-22-66- l5
I 5-36>36
3-t'l-16
l6-3535-7373-ls0
> 150
bluedark green
greenyelloworange
red
TableT (ó). Concentration intervals of water quality parameters on l6 June 1986 calculated
for TM3 DN values using the log-transformed regression equations from table 6.
(fieure 5(á)).
TM3 DW (mel-r) Pigm (pgl-1) SD (cm) colour code
DN23 0-0DN24 0-0DN25 0-0DN26 0-1DN27 1-3DN28 3-6DN29 6-15DN30 l5-35DN31 35-77
0-lt-22-44-99- l8
I 8-3737,7575-146
146-278
> 390> 390> 390
390-21 8
218-124124-7272-4343-2626-t6
dark blueblue
dark greengreen
green-yellowyelloworangesalmon
red
Table 7 (c). Concentration intervals of water quality parameters on 5 July 1987 calculatedfor TM2 DN values using the log-transformed regression equations from table 6,
(figure 5(c)).
TM2 DrW (mgl-l) Pigm (pgl-1) SD (cm) colour code
DN22 l-2DN23 2-4DN24 4-7DN25 7-14DN26 t4-26DN27 26-47DN28 > 47DN29 > 47
3-77-t5t5-3232-6666-133> 133> 133> 133
439-25525s-lsll5l-9292-s7s7-3636-2323-15<15
bluelight bluedark greenlight green
green-yellowyelloworangesalmon
.Table 7 (/) Concentration intervals of water quality parameters on 5 July 1987 calculatedfor TM3 DN values using the log-transformed regression equations from table 6(figure s(d)).
TM3 DW (mg 1- 1) Pigm (pgl-1) SD (cm) colour code
DNIT 1-2DNt8 2-5DNlg 5-l IDN20 fi-23DN2l 23-45DN22 > 45
3-99-21
2t-4949-l l0
l 10-235>235
445-231231-124t24-6969-4040-2323-14
bluelight bluedark greenlight green
green-yellowyellow

A TM study of eutophic lakes in the Netherlands 817
16 June 1986
band 2: 8 DN; band 2--{estriped and averaged: 6 DNband 3: 9 DN; band 3--destriped and averaged: 9 DN
5 July 1987
band 2: 8 DN; band 2--{estriped and averaged: 6 DNband 3: 9 DN; band 3--{estriped and averaged: 9 DN
if a threshold of l0Opixels per DN level is applied the maximum range woulddecrease to 6 levels. The two images discussed here are centred around maximumsolar elevations (approximately 58") at the overpass time at this geographical
location. The gradient in water quality parameters covered is large and is foundwithin a relatively small area. The aforementioned arguments imply that LandsatTM images are likely to be of lirnited value for surface water quality determinationpurposes.
4. Interpretation of the colour coded images of water qualityThe algorithms developed through statistical anlyses are based on the assump-
tion that a 17 by 17 pixel area is a representative sample for the average waterquality measured there. If each lake were homogeneous (i.e., well mixed) the
concentration maps on basis of these algorithms would show no variation at allwithin the lakes. In reality gradients and patterns may be observed (see flgures
3 (a b) and 4(a á)). There is enough variability between the lakes for the calculatedregression line to be valid. So the hypothesis for this method: that the optimizedspectral sample is representative for the average measured parameters is not rejected.
To recapitulate the process used to obtain the images showing the water qualityparameter estimates as colour codes:
(a) Determine the averages of the most valid lake-based sampling measurements(in this research through interpolation).
(á) Determine the most reliable spectral sampling size (: 17 xl7).(c) Perform optimal sampling.(d) Perform regression analysis; obtain regression equations.(e) Apply regression equations to the image, thus estimating concentration from
the images.(f) Ensure that the regression equations do not produce nonsense results such as
negative or extremely high concentrations or values (sensitivity and sensi-
bility analysis).
The Thematic Mapper band 2 and band 3 images are presented in figures 5 (a-b)for 16 June 1986, and in figure 6(a-b) for 5 July 1987. Each DN level coincides withone colour of the colour bar. The lowest DN value, always shown as dark blue,varies. The difference between band 2 and band 3 is caused by a decreasingatmospheric path radiance contribution. The difference between the same band DNson the two different dates is caused by differing atmospheric circumstances resultingin a much lower atmospheric path radiance contribution in the image of 5 July 1987
(DN 32 on 16 June and DN 22 on 5 July for the lowest band 2 values). Theconcentration intervals are dependent on the factors named above in the discussionon linear regression results. Table 6 presents the regression equations based on thelog-transformed data. Table 7 (a-d) presents the calculated water quality parameters.parameters.

818 A. G. Dekker and S. W. M. Peters
Although the statistical results show the estimates of SD, D'W, Ptol and Pigm notto be very exact, the concentration maps based on these regression equations appear
to be consistent with the general overall picture of the water quality status of thelakes based on prior knowledge. It must be emphasised that the imagery was trainedbut not tested.
(a) 16 June 1986. Figures 5 (a-b) are bands 2 and 3 after image corrections witha linear colour look up table applied: each colour is a DN. The results of the
statistical analysis can directly be transferred to these DNs. Thus band 2 isthe most accurate map of DW, Ptot and Pigm. Band 3 is not as accurate,
although atmospheric influence is less at longer wavelengths. This is due tothe complexity of the opposing spectral features as mentioned in the
discussion of the spectral features in the optical wavelength range. Althoughthe colours and ranges are slightly different, the overall pattern in the lakes
remains similar. Compared to the pseudo natural colour and false colourcomposites, the colour coded images show quantified information whichmakes visual interpretation more accurate. In lakes Spiegel, Water-storage
Basin, Wijde Blik and Stichts Ankeveen the two lowest DNs in band 2 arcencountered: this means their green reflectance is lowest. Lakes Eastern and
Western Loenderveen and Naardermeer show the two following DN levels,
Lakes Hollands Ankeveen and Wijde Gat are intermediate between these
levels and the levels of the very eutrophic Lakes Loosdrecht, Nieuwe Polder,
Breukeleveen and Vuntus. Gradients are visible but no consistent direction is
present. Lake Loosdrecht has increasing reflectance from south to north,whereas the
.Water-storage Basin and Lake Loenderveen show a decreasing
reflectance from south to north. Lake Wijde Blik shows an east to westgradient. The other lakes do not show any gradients. The procedures used,
remove noise without affecting large-scale patterns such as gradients. No newpatterns are introduced, so it is safe to qualitatively interpret the images.
Large scale sensor-based distortion or atmospheric path radiance differencesmay influence the image.
(ó) 5 July 1987. Figure 6(a) (TM band 2) Lake Nieuwe Polder, Wijde Gat andHollands Ankeveen are now similar. Lake Vuntus is now separate (up to twoDNs higher) from Lakes Loosdrecht and Breukeleveen. Lake Vuntus has aconcentration of blue-green algal trichomes of 210000perml with a Pigm ofl89pgl* 1, Lake Loosdrecht trichomes of 140000perml with a Pigm ofl43pgl- 1 and Lake Breukeleveen trichomes of 140000 perml with a Pigmof 1621tgl- r. In the pseudo natural colour image (figure a@) Lake Vuntusseems to be more yellowish: this is caused by higher green and slightly higherred reflectance, possibly caused by the high amount of trichomes. Otherexceptions are Lake Naardermeer and the south eastern Lake Naardermeer-Bovenste Blik, which differ now by two DNs. Lakes Stichts Ankeveen andHollands Ankeveen are almost invisible because they disappear into thelandmask.
5. Conclusions and recommendationsAs far as water quality detection is concerned the advantages of current TM and
similar satellite images are: the synoptical view combined with an acceptable

A TM study of eutrophic lakes in the Netherlands 819
resolution; the repetitive coverage of large areas reducing the cost per image and per
surface; the availability of customised digital image processing systems; the world-wide application of analysis methods, and due to repetitive coverage, the possibility
of an archive or library may be created of water quality status. The continuity indata gathering with new satellites being launched to replace existing satellites is also
important.Disadvantages are that the research, design, manufacturing and launching costs
of the systems often leads to compromises. Complexity of system design and
construction, leads to a time lag as far as technical state of the art in research is
concerned. These factors and the fact that the TM was primarily designed for land
application led to the relatively low spectral and radiometric resolution of these
systems. Once launched the systems are not versatile, they follow fixed paths. The
effective temporal resolution of Landsat is low under mid-latitude temperate climate
conditions.Spatial atmospheric distortions influence the interpretation of images: the only
way to prevent this is by a pixel by pixel calculation of the atmospheric distortionfactor, allowing correction of atmospheric gradients across the image.
At low concentrations of water constituents a log-transformed data set is better
suited for carrying out bivariate linear regression analyses. An exponential relation
aXb describes the relationships best, except at the highest digital numbers orradiance values (measured from water surfaces in this research). The exponentialrelationship may lead to unrealistically high concentrations. It is recommended thata calculation using radiative transfer theory is carried out to determine the
theoretical shape of the relationship between any optically active water qualityparameter and radiance reflectance from a water body in the spectral bands of the
remote sensing systems used. It is possible that the best fit is exponential at low tointermediate concentrations and may approach a linear relationship at higher
concentrations. It is recommended to use non-linear regression analysis in future, forthis is probably a good method for statistical analysis (it does not presume a specific
function).For the regression equations using the linear data the Digital Number step-size is
most often more limiting in the resolution of the determination of the water qualityparameter than the standard error of estimate. It is the radiometric resolution of the
Thematic Mapper which limits determination possibilities.
A predictive modelling (using a radiative transfer approach) should be carriedout in order to estimate the range of reflectance values to be expected and tounderstand the influence of size, type and concentration of the main optically active
water quality parameters (such as algae, suspended matter and aquatic humus) on
the spectral signature of the waters under consideration.It is recommended that previous research and ongoing research in the Nether-
lands using satellite remote sensing for surface water quality determination performa regression analysis on their data sets using a log-transformation of the data or anon-linear regression with a forced zero intercept. This will prevent results such as
negative values when applying the full range of digital numbers present in the image
to the regression equation.The result shown here are in accordance with the results by Lathrop and
Lillesand (1986) over Green Bay and Lake Michigan. The range of the water qualityparameters used in this research is twice as high for chlorophyll a and half the values
for SD. The TM digital number data for each band are equivalent in the two studies.

820 A. G. Dekker and S. W. M. Peters
Recommendations are to carry out the following activities, either at a regional,national, continental or global scale:
1. Construct a database for inland surface water satellite observations.2. Develop atmospheric correction procedures to make comparison of all images
possible.3. Incorporate model knowledge and field observations.4. Construct a Surface Water Expert System.
list of symbolsDN : digital numberDN-step : digital number step sizeDW : seston dry weight (mgl t)Pigm : sum of chlorophyll-a and phaeopigments (pgl-1)P,o, : total phosphate (pgl t)R : correlation coeÍficientSD : Secchi depth or Secchi disk transparency (cm)(Rt)% : coefficient of determinationEu" : subsurface upwelling irradiance (Wm-2nm 1)
Lui, : airborne measured upwelling radiance (Wm-2nm 1sr 1)
(sr,)oÁ : standard error of estimate expressed as a percentage of the mean value of thedependent variable
(sr,) : standard error of estimate, : mean value of the dependent variableln : natural logarithm (e-based)
ReferencesBnnruenr, L., Ennnr J., and vaN Lnnn, L., 1989, Water Quality Research Loosdrecht Lakes:
Basic data 1983-1988 (in Dutch), WOL-Report nrl989-5, Limnological Institute,Nieuwersluis, The Netherlands.
DnKKnn, A. G., and Snvn-nN, E., 1988, The Remote Sensing Loosdrecht Lakes Project.International Journal of Remote Sensing, l0 & 11, 176l-1773.
Dorrnn, A. G., Mer,rsus, T. J., and SevnaN, 8., 1990a, An inland water quality bandset forthe CAESAR system based on spectral signature analysis. Proceedings InternationalSymposium Remote Sensing and Water, Enschede, The Netherlands, August 1990,International Association of Hydrogeology (IAH) (Delft, The Netherlands: TheNetherlands Society for Remote Sensing), pp.597 606.
Dnrrrn, A. G., Malrsus, T., PETERS, S. W. M., and SryurN, E., 1990 b, The Remote SensingLoosdrecht Lakes Project. BCRS Report 90-28; Dutch Remote Sensing Board, Delft,The Netherlands.
Dnrrnn, A. G., M.q.rrHUS, T. J., and SovnaN, 8., 1991, Quantitative modelling of inlandwater quality for high resolution MSS-systems. I.E.E.E. Transactions on Geoscienceand Remote Sensing,29,89 95.
DHV ne.q.ocnvEND TNGENIEURSBUREAU B. V., 1988, The applicability of remote sensingsatellite images for the water quality management of the Frisian lakes, (in Dutch). TheDutch Remote Sensing Board BCRS-report: BCRS-88-17., Delft, The Netherlands.
GnuNwar,o, B., Mlusnn, W., and ScnNuonn, K., 1988, Data processing for the determina-tion of pigments and suspended solids from Thematic Mapper data. Proceedings ofIGIRS.S88 Symposium, Edinburgh, Scotland (Paris: ESA Publications) pp. 1385-1389.
L.nrnnor, R. G., and Lttlusltto, T. M., 1986, Use of Thematic Mapper data to assess waterquality in Green Bay and Central Lake Michigan. Photogrammetric Engineering andRemote Sensing, 52, 671-680.
NoonozIr, W. J., vaN oen La-4.N, F. B., and VonHonr, W., 1989, National Point of Contact,. Products and Services, detailed guide to imagery available NPOC Annex to Dutch
Remote Sensing Newsletter, no.38, pp. 124.Onrtz Clsas, J. L. and PBNI Manrmrz, R., 1989, Remote sensing of limnological parameters
in reservoirs. Proceedíng of the Workshop on Earthnet Pilot Project on Landsat TM
A TM study of eutrophic lakes in the Netherlands 821
Applícations, Frascati, Italy, December 1987, edited by T. D. Guyenne and G. CalabresiESA SP-1102 (Noordwijk, The Netherlands: ESA Publicity Division, ESTEC)'pp.49- 55.
Pa1r"rnn, K. F., and Wnrnus, D., 1974, Optical properties of water in the near infrared;Journal of Optical Society of America,64' I107-l I10.
RnmooN, B. C., and McGlnmcle, M. L., 1989, Utility of Thematic Mapper data fornational survey of Irish lakes. European Coordinated Effort for Monitoring theEarth's Environment, ESA SP-1102, ESA Publishing Division, ESTEC, Noordwijk,The Netherlands, pp. 25-31.
Srrren, P. N., 1980, Remote smsing: Optics and optical systems (Reading, Massachusetts,
U.S.A. : Addison-Wesley).SopBncnnN, A., 1984, Small-scale temporal changes in the biological and chemical composi-
tion of surface microlayers in a eutrophic lake. Verh. Intern. Verein. Limnol., 22,765-77r.
SóoBncnnN, A., 1987, Origin and composition of surface slicks in lakes of differing trophicstatlurs. Limnolog ical O ceanogr aphy, 32, 1307 -1316.
Wrlrrocr, C. H., Kuo, C. Y., and LnCnoy, S. R., 1982, Criteria for the use of regression
analysis for remote sensing of sediment and pollution. Remote Sensing of Enttironment,
12, l5l-168.