Changes in the Epilimnetic Bacterial Community Composition,Production, and Protist-Induced Mortality...
13
Changes in the Epilimnetic Bacterial Community Composition, Production, and Protist-Induced Mortality along the Longitudinal Axis of a Highly Eutrophic Reservoir K. S ˇ imek, 1,2 J. Armengol, 3 M. Comerma, 3 J.C. Garcia, 3 P. Kojecka, 2 J. Nedoma, 1 J. Hejzlar 1,2 1 Hydrobiological Institute, Academy of Sciences of the Czech Republic, Na sa ´dka ´ch 7, CZ-37005 C ˇ eske ´ Bude ˇjovice, Czech Republic 2 Faculty of Biological Sciences, University of South Bohemia, Na sa ´dka ´ch 7, CZ-37005 C ˇ eske ´ Bude ˇjovice, Czech Republic 3 Department of Ecology, University of Barcelona, Av. Diagonal 645, E-08028, Barcelona, Spain Received: 18 October 2000; Accepted: 2 March 2001; Online Publication: 9 July 2001 A B S T R A C T We studied changes in the epilimnetic bacterial community composition (BCC), bacterial biomass and production, and protistan succession and bacterivory along the longitudinal axis of the canyon- shaped, highly eutrophic Sau Reservoir (NE Spain) during two sampling campaigns, in April and July 1997. Longitudinal changes in BCC from the river inflow to the dam area of the reservoir were detected by using oligonucleotide probes targeted to the kingdom Bacteria, to the alpha, beta, and gamma subclasses (ALFA, BETA, and GAMA) of the class Proteobacteria, and to the Cytophaga/ Flavobacterium (CF) cluster. In general, the inflow of the organically loaded Ter river, with highly abundant allochthonous bacterial populations, induced a clearly distinguishable longitudinal suc- cession of the structure of the microbial food web. The most dynamic changes in microbial parameters occurred at the plunge point, the mixing area of river water and the reservoir epilim- nion. Changes within members of BETA and CF were the most important in determining changes in BCC, bacterial abundance and biomass. Much less relevant changes occurred within the less abundant ALFA and GAMA bacteria. From the plunge point downstream, we described a significant shift in BCC in the form of decreased proportions of BETA and CF. This shift spatially coincided with the highest values of heterotrophic nanoflagellate bacterivory (roughly doubled the bacterial production). CF numerically dominated throughout the reservoir without any marked longitudinal changes in their mean cell volume. In contrast, very large cells affiliated to BETA clearly dominated in the allochthonous bacterial biomass brought by the river. BETA showed a marked downstream trend of decreasing mean cell volume. We conclude that the observed BCC shift and the longitu- dinal shift in food web structure (bacteria–heterotrophic nanoflagellates–ciliates) resulted from Correspondence to: K. S ˇ imek; Fax: ++420 38 5300248; E-mail: [email protected] MICROBIAL ECOLOGY Microb Ecol (2001) 42:359–371 DOI: 10.1007/s00248-001-0014-z © 2001 Springer-Verlag New York Inc.
Transcript of Changes in the Epilimnetic Bacterial Community Composition,Production, and Protist-Induced Mortality...

Changes in the Epilimnetic Bacterial Community Composition,Production, and Protist-Induced Mortality along theLongitudinal Axis of a Highly Eutrophic Reservoir
K. Simek,1,2 J. Armengol,3 M. Comerma,3 J.C. Garcia,3 P. Kojecka,2 J. Nedoma,1 J. Hejzlar1,2
1 Hydrobiological Institute, Academy of Sciences of the Czech Republic, Na sadkach 7, CZ-37005 Ceske
Budejovice, Czech Republic2 Faculty of Biological Sciences, University of South Bohemia, Na sadkach 7, CZ-37005 Ceske Budejovice,
Czech Republic3 Department of Ecology, University of Barcelona, Av. Diagonal 645, E-08028, Barcelona, Spain
Received: 18 October 2000; Accepted: 2 March 2001; Online Publication: 9 July 2001
A B S T R A C T
We studied changes in the epilimnetic bacterial community composition (BCC), bacterial biomass
and production, and protistan succession and bacterivory along the longitudinal axis of the canyon-
shaped, highly eutrophic Sau Reservoir (NE Spain) during two sampling campaigns, in April and
July 1997. Longitudinal changes in BCC from the river inflow to the dam area of the reservoir were
detected by using oligonucleotide probes targeted to the kingdom Bacteria, to the alpha, beta, and
gamma subclasses (ALFA, BETA, and GAMA) of the class Proteobacteria, and to the Cytophaga/
Flavobacterium (CF) cluster. In general, the inflow of the organically loaded Ter river, with highly
abundant allochthonous bacterial populations, induced a clearly distinguishable longitudinal suc-
cession of the structure of the microbial food web. The most dynamic changes in microbial
parameters occurred at the plunge point, the mixing area of river water and the reservoir epilim-
nion. Changes within members of BETA and CF were the most important in determining changes
in BCC, bacterial abundance and biomass. Much less relevant changes occurred within the less
abundant ALFA and GAMA bacteria. From the plunge point downstream, we described a significant
shift in BCC in the form of decreased proportions of BETA and CF. This shift spatially coincided
with the highest values of heterotrophic nanoflagellate bacterivory (roughly doubled the bacterial
production). CF numerically dominated throughout the reservoir without any marked longitudinal
changes in their mean cell volume. In contrast, very large cells affiliated to BETA clearly dominated
in the allochthonous bacterial biomass brought by the river. BETA showed a marked downstream
trend of decreasing mean cell volume. We conclude that the observed BCC shift and the longitu-
dinal shift in food web structure (bacteria–heterotrophic nanoflagellates–ciliates) resulted from
Correspondence to: K. S imek; Fax: ++420 38 5300248; E-mail:
MICROBIALECOLOGY
Microb Ecol (2001) 42:359–371
DOI: 10.1007/s00248-001-0014-z
© 2001 Springer-Verlag New York Inc.
highly complex interactions brought about by several major factors: varying hydrology, the high
localized allochthonous input of organic matter brought by the river, downstream changing sub-
strate availability, and selective protistan bacterivory.
Introduction
During the past decade, the role and functioning of micro-
bial food webs have been intensively studied in lakes of
different trophic status and of different morphology (e.g., [7,
31, 50]). However, much less attention has been paid to the
functioning of microbial food webs in dam reservoirs. There
are significant differences between lake and reservoir ecosys-
tems, among which the canyon-shaped ones differ most con-
spicuously [41, 43] by their relatively short retention time
and longitudinal inhomogeneity. Canyon-shaped reservoirs
represent highly specific, remarkably spatially heterogeneous
systems. Selected aspects of them, i.e., hydrodynamics,
chemical processes, and zoo-, phytoplankton, and protistan
dynamics, have been already reported [10, 18, 33, 35, 37].
However, the dominating biogeochemical processes occur-
ring in the upper parts of canyon-shaped reservoirs, medi-
ated mainly by microbial activities and interactions [43], are
not yet fully understood. Reservoir morphology and con-
tinuous supply of substrates by a river on the one hand, and
the small size and high growth rates of planktonic microor-
ganisms on the other hand, result in longitudinally different
phases of microbial succession. Some of the general features
and major factors operating in the processes that induce the
longitudinally distinguishable succession of microbial popu-
lations in organically loaded reservoirs might be compared
to a natural “sequencial reactor,” such as a wastewater-
treatment lagoon that reduces the concentration of easily
degradable organic material from the inflow [44].
The upper, inflow parts are likely to show much more
pronounced gradients in microbial food web dynamics since
they represent highly productive ecotones between riverine
and lacustrine systems, whereas the downstream parts of
reservoirs behave more like lake ecosystems (with less
marked gradients in microbial food webs). Depending on
actual temperature stratification and the type of water cir-
culation, a varying proportion of the river inflow is injected
into the reservoir epilimnion, inducing the downstream tro-
phic gradient through the reservoir. Generally, more pro-
nounced gradients are likely to be expected when the river
water parameters, namely nutrient and organic material
loadings, differ from those in the lacustrine part of the res-
ervoir. This is most evident in typical canyon-shaped reser-
voirs with well-developed thermal stratification, where the
riverine and lacustrine parts are spatially separated by the
transient zone where the inflow stream plunges to deeper
strata depending on its density [41, 43].
The Sau Reservoir (NE Spain) represents a system with an
extreme amount of nutrient and organic matter loading in
its inflow part [46], which supports the establishment of
strong gradients in chemical and biological parameters. Ar-
mengol et al. [4] and Comerma et al. [10] have reported
distinguishable longitudinal gradients in concentrations of
nutrients, in dissolved and particulate organic and inorganic
material, and in bacterial and phytoplankton biomasses,
yielding marked changes in turbidity and in qualitative pa-
rameters of water from the Ter river inflow to the outflow
near the dam of the reservoir. A typical longitudinal succes-
sion of planktonic foods web structures in the Sau Reservoir,
i.e., dominated by bacteria, heterotrophic nanoflagellates,
ciliates, and rotifers, has been recently documented [10].
Moreover, detailed studies on protistan succession and bac-
terivory along the longitudinal axis of the reservoir showed
distinct peaks of heterotrophic nanoflagellates and ciliate
abundance, and consequently spatially changing roles of
these protistan groups as bacterivores [10, 37].
High input of allochthonous organic material, enhanced
bacterial activity, and low oxygen saturation of water are
typical for the inflow parts of the reservoir [4, 10], pointing
to the essential role of bacteria in carbon and nutrient cy-
cling. Given the clearly distinguishable chemical gradients
and longitudinal succession of plankton populations (see
above), it is conceivable that different phylogenetic groups of
bacteria take part in the processes of organic matter trans-
formation in the different parts of the reservoir.
In the past decade, new information on bacterial com-
munity composition (BCC) in aquatic environments has
been obtained using in situ hybridization with oligonucleo-
tide rRNA-targeted probes [2]. This approach has already
distinguished some common and specific features of BCC in
different freshwater environments covering a range from oli-
gotrophic lakes [1, 26], through oligo-mesotrophic lakes [11,
22, 49] or eutrophic reservoirs [38], to activated sludge sys-
tems [21, 47]. Although canyon-shaped reservoirs are
360 K. Simek et al.
unique, highly dynamic systems that involve a range of tro-
phic gradient within the same water body, no specific study
on changing phylogenetic bacterial composition on such
longitudinally highly heterogeneous systems has been con-
ducted.
In the present study we analyzed changes in the epilim-
netic BCC, bacterial biomass and production, and protistan
bacterivory along the longitudinal axis of the canyon-
shaped, highly eutrophic Sau Reservoir on two sampling
occasions during 1997. We addressed the following ques-
tions: (1) Which microbial phyla dominate in the reservoir?
(2) Does BCC significantly differ between the riverine and
lacustrine parts of the reservoir? (3) Can the prevalence of
particular bacterial groups be related to allo- versus autoch-
thonous sources of organic substrates? (4) Can physical,
chemical, or biological factors (i.e., changing substrate avail-
ability and protistan grazing) mediate the longitudinal BCC
shifts? (5) Is there a reproducible, longitudinal pattern of
protozoan successions related to the high allochthonous bac-
terial and organic matter loads?
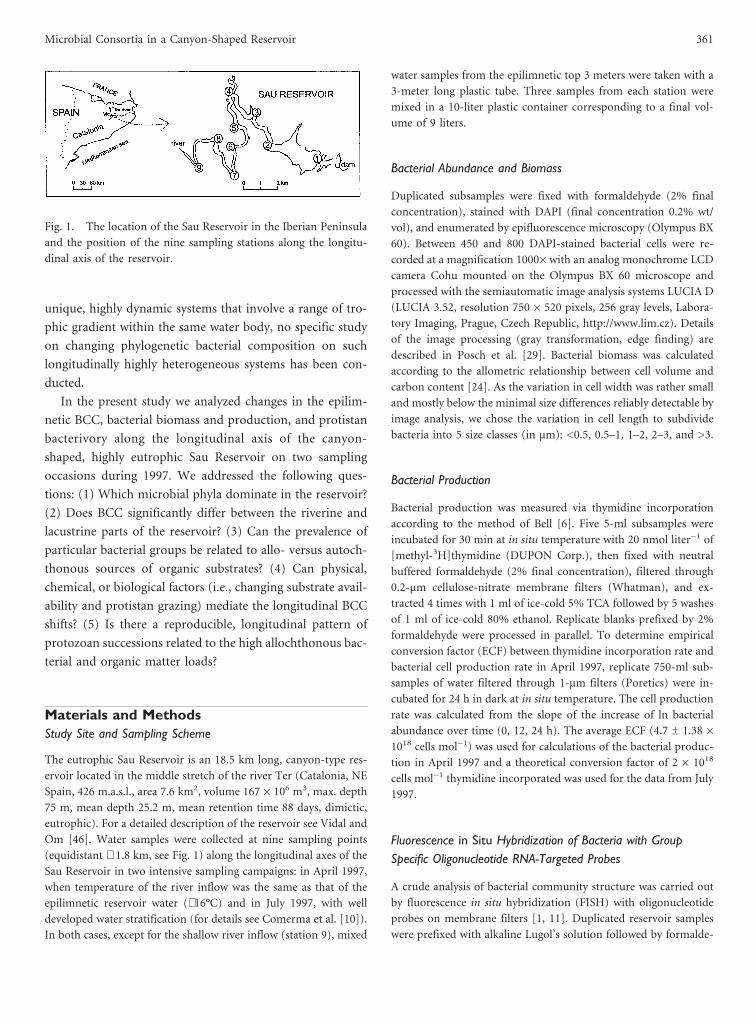
Materials and MethodsStudy Site and Sampling Scheme
The eutrophic Sau Reservoir is an 18.5 km long, canyon-type res-
ervoir located in the middle stretch of the river Ter (Catalonia, NE
Spain, 426 m.a.s.l., area 7.6 km2, volume 167 × 106 m3, max. depth
75 m, mean depth 25.2 m, mean retention time 88 days, dimictic,
eutrophic). For a detailed description of the reservoir see Vidal and
Om [46]. Water samples were collected at nine sampling points
(equidistant ∼ 1.8 km, see Fig. 1) along the longitudinal axes of the
Sau Reservoir in two intensive sampling campaigns: in April 1997,
when temperature of the river inflow was the same as that of the
epilimnetic reservoir water (∼16°C) and in July 1997, with well
developed water stratification (for details see Comerma et al. [10]).
In both cases, except for the shallow river inflow (station 9), mixed
water samples from the epilimnetic top 3 meters were taken with a
3-meter long plastic tube. Three samples from each station were
mixed in a 10-liter plastic container corresponding to a final vol-
ume of 9 liters.
Bacterial Abundance and Biomass
Duplicated subsamples were fixed with formaldehyde (2% final
concentration), stained with DAPI (final concentration 0.2% wt/
vol), and enumerated by epifluorescence microscopy (Olympus BX
60). Between 450 and 800 DAPI-stained bacterial cells were re-
corded at a magnification 1000× with an analog monochrome LCD
camera Cohu mounted on the Olympus BX 60 microscope and
processed with the semiautomatic image analysis systems LUCIA D
(LUCIA 3.52, resolution 750 × 520 pixels, 256 gray levels, Labora-
tory Imaging, Prague, Czech Republic, http://www.lim.cz). Details
of the image processing (gray transformation, edge finding) are
described in Posch et al. [29]. Bacterial biomass was calculated
according to the allometric relationship between cell volume and
carbon content [24]. As the variation in cell width was rather small
and mostly below the minimal size differences reliably detectable by
image analysis, we chose the variation in cell length to subdivide
bacteria into 5 size classes (in µm): <0.5, 0.5–1, 1–2, 2–3, and >3.
Bacterial Production
Bacterial production was measured via thymidine incorporation
according to the method of Bell [6]. Five 5-ml subsamples were
incubated for 30 min at in situ temperature with 20 nmol liter−1 of
[methyl-3H]thymidine (DUPON Corp.), then fixed with neutral
buffered formaldehyde (2% final concentration), filtered through
0.2-µm cellulose-nitrate membrane filters (Whatman), and ex-
tracted 4 times with 1 ml of ice-cold 5% TCA followed by 5 washes
of 1 ml of ice-cold 80% ethanol. Replicate blanks prefixed by 2%
formaldehyde were processed in parallel. To determine empirical
conversion factor (ECF) between thymidine incorporation rate and
bacterial cell production rate in April 1997, replicate 750-ml sub-
samples of water filtered through 1-µm filters (Poretics) were in-
cubated for 24 h in dark at in situ temperature. The cell production
rate was calculated from the slope of the increase of ln bacterial
abundance over time (0, 12, 24 h). The average ECF (4.7 ± 1.38 ×
1018 cells mol−1) was used for calculations of the bacterial produc-
tion in April 1997 and a theoretical conversion factor of 2 × 10¹⁸
cells mol−1 thymidine incorporated was used for the data from July
1997.
Fluorescence in Situ Hybridization of Bacteria with GroupSpecific Oligonucleotide RNA-Targeted Probes
A crude analysis of bacterial community structure was carried out
by fluorescence in situ hybridization (FISH) with oligonucleotide
probes on membrane filters [1, 11]. Duplicated reservoir samples
were prefixed with alkaline Lugol’s solution followed by formalde-
Fig. 1. The location of the Sau Reservoir in the Iberian Peninsula
and the position of the nine sampling stations along the longitu-
dinal axis of the reservoir.
Microbial Consortia in a Canyon-Shaped Reservoir 361
hyde (2% w/v, final concentration) for at least 1 h, and decolorized
by addition of several drops of a 3% solution of sodium thiosulfate
to prevent cell disruption of planktonic algae and of other fragile
flagellated plankters. Bacterial cells from 10–20 ml subsamples were
concentrated on white 0.2-µm-pore-size filters (Poretics Corp.; 47-
mm diameter), rinsed with distilled water, and stored frozen at
−20°C until further processing. FISH of filter sections with the five
different oligonucleotide probes targeted to the kingdom Bacteria
(EUB), the alpha, beta, and gamma subclasses of Proteobacteria
(ALFA, BETA, GAMA), and to the Cytophaga/Flavobacterium
group (CF) [3] was carried out as described in Alfreider et al. [1].
The probes were fluorescently labeled with the indocarbocyanine
dye Cy3 (Interactiva, Ulm, Germany). After hybridization, the filter
section were stained with 48,6-diamino-2-phenylindole (DAPI),
and the percentage of hybridized bacterial cells enumerated by
epifluorescence microscopy. At least 500 DAPI-stained cells per
sample were inspected. The mounting medium Citifluor (Citifluor
Ldt., Kent UK) was amended with ca. 20% of VectaShield (Vector
Lab., Burlingame, CA, USA). This modification resulted in signifi-
cantly reduced fading of the probe signal (Pernthaler, pers.
comm.), which allowed a more reliable measurement of hybridized
cells (see below).
Cell Dimensions of Hybridized Cells
Cell dimensions of the two most important subgroups affiliated to
BETA and CF were inferred from their DAPI-stained images to
facilitate comparison with the size structure of the total bacterial
community. Pairs of images of the Cy3 and DAPI fluorescence of
individual cells in microscopic preparations were captured using
the PC-based image analysis system LUCIA G/F 4.0 by means of a
digitized monochrome LCD camera DVC 1300 mounted on an
Olympus AX 70 PROVIS epifluorescence microscope. Between 400
and 800 hybridized cells were analyzed per sample (corresponding
to 6 to 20 image pairs). For details of the procedure used and the
statistical evaluation see Pernthaler et al. [25]. To depict longitu-
dinal shifts in biomass size distribution of BETA and CF along the
reservoir, we subdivided hybridized cells into five size categories
based on cell length as described above for biomass size distribution
of total DAPI-stained bacterial cells.
Protozoan Grazing and Abundance
To measure protozoan grazing upon bacterioplankton, we used
fluorescently labeled bacterioplankton (FLB; for more details see
Simek et al. [37]). For grazing experiments, 250–500 ml of repli-
cated samples were dispensed into acid soaked and rinsed 1-liter
flasks and incubated at in situ temperature. Flagellate and ciliate
uptake rates were determined in the same treatment where FLB
added constituted 5–18% of bacterial natural abundances. Thirty-
milliliter subsamples for protozoan enumeration and tracer inges-
tion determinations were taken at 0, 5, 10, 15, 20, and 30 min after
tracer addition and fixed by adding 0.5% of alkaline Lugol’s solu-
tion, immediately followed by 2% borate-buffered formaldehyde
(final concentration) and several drops of 3% sodium thiosulfate to
clear the Lugol’s color [34]. We determined ciliate grazing rates in
time series from 5–15 min subsamples and flagellate grazing rates
in subsamples from 10–30 min, respectively (for details see Simek
et al. [37] and Comerma et al. [10]). Samples from zero time were
also inspected to avoid a potential bias of our data due to attach-
ment of noningested tracers on protozoan surfaces. Five-milliliter
(flagellates) or 20–30 ml (ciliates) subsamples were stained with
DAPI, filtered through 1-µm black Poretics filters, and inspected
via epifluorescence microscopy. Nonpigmented, heterotrophic
nanoflagellates (HNF) and plastidic flagellates were always differ-
entiated. At least 50 ciliates and 100 flagellates were inspected for
FLB ingestion in each sample. Uptake rates of the tracers were
calculated from the changes of average number of tracers per pro-
tozoan cell with time using linear regression. To estimate total
protozoan grazing, we multiplied average uptake rates of ciliates
and flagellates by their in situ abundances.
Results
Samples were collected at nine sampling points along the
longitudinal axis of the Sau Reservoir in April and July 1997,
i.e., at different parts of the season and under different tem-
peratures. Nevertheless, a high input of allochtonous organic
material, which entered the canyon-shaped reservoir with
the organically loaded Ter river [4], induced generally simi-
lar longitudinal trends in the selected microbial parameters
and bacterial community composition (BCC) (see Figs.
2–6).
Bacterial abundance, biomass, and mean cell volume de-
creased remarkably and bacterial cell size class distributions
significantly shifted, from the organically polluted river (sta-
tion 9) downstream to the dam area (station 1). For in-
stance, bacterial abundance dropped by a factor of 3.42 and
2.94, bacterial biomass by a factor of 10.3 and 5.57, and
bacterial cell volume by a factor of 5.08 and 2.21 in April and
July, respectively (Figs. 2 and 3). These changes were also
paralleled by a strong shift from the numerical dominance of
bacterial cells with length >1 µm (65–70% of total bacteria)
in the river inflow to the dominance of the smaller cell size
categories <1 µm (84–88 % of total bacteria) near the dam
(Fig. 4). However, the contributions of the two largest bac-
terial size categories, i.e., 2–3 µm long and >3 µm, differed
remarkably in April and July as they accounted for 32 and
13% of total bacterial abundance, but they comprised as
much as 73 and 29% of total bacterial biomass, respectively.
Thus, while the general trends in the above bacterial param-
eters were very similar (Figs. 2–4) in both seasons, their
absolute values in the river inflow in April, i.e., 16.1 × 10⁶
bact ml−1, mean cell volume of 0.6 µm3, bacterial biomass of
362 K. Simek et al.

1166 µg L−1 of organic carbon, and >20% of large filamen-
tous bacteria (>3 µm), were much higher than in July.
Clearly a pronounced input of allochthonous bacterial
populations to the upper, riverine part of the reservoir (sta-
tions 8 and 9) occurred in April, corresponding also to a
higher flow rate of the river inflow.
The most dramatic changes in bacterial parameters oc-
curred between stations 9 to 7 (Figs. 2–5), being spatially
associated with the position of the plunge point, i.e., the
transient zone between riverine and lacustrine part of the
reservoir. Based on water temperature, stratification and
other water quality parameters (for details see Armengol et
al. [4] and references therein) we determined that the plunge
point was just above station 7 in April and slightly upstream,
closer to station 8, in July. In both cases, between these two
stations the surface river water flow began to mix with the
reservoir water masses.
Fluorecence in situ hybridization with the five oligo-
Fig. 2. Longitudinal changes in microbial
parameters along the Sau Reservoir in April
(left panels) and July 1997 (right panels):
Total numbers of DAPI-stained bacteria
and of bacteria targeted with the probes for
ALFA-, BETA-, GAMA-Proteobacteria, and
Cytophaga/Flavobacterium (CF) group, the
proportion of Eubacteria (EUB) in total
DAPI-stained bacteria, and relative propor-
tions of the groups ALFA, BETA, GAMA,
and CF within the cells hybridized with the
EUB probe. Note that there are different
scales for the data from April and July. All
the values represent mean of duplicate
treatments.
Fig. 3. Longitudinal changes in microbial
parameters along the Sau Reservoir in April
(left panels) and July 1997 (right panels):
Bacterial mean cell volume based on all
DAPI-stained bacteria and separately on
only those cells, which hybridized with the
probe for BETA-Proteobacteria (BETA) and
Cytophaga/Flavobacterium group (CF); to-
tal bacterial biomass and contributions of
the BETA and CF biomasses into total bac-
terial biomass. Note that there are different
scales for the data from April and July. All
the values represent mean of duplicate
treatments.
Microbial Consortia in a Canyon-Shaped Reservoir 363

nucleotide probes revealed the conspicuous changes in bac-
terial community composition between stations 8 and 7, or
between stations 7 and 6 (e.g., BETA in April; Fig. 2). These
changes were reflected namely by (i) a significant drop
(Tukey HSD test, P < 0.05) in absolute numbers as well as in
the relative contributions of CF to EUB (i.e., in total bacte-
rial numbers hybridized with the probe for Eubacteria),
from ∼66 to 37% and from 42 to 16%, and (ii) a less marked
decrease for total numbers and portions of bacteria affiliated
to the BETA lineage, from 35 to ∼16% (significant between
stations 6 and 7) and from 32 to 19%, in April and July,
respectively. CF increased to 48% of EUB-detectable cells at
the dam area in April. In July, CF increased between stations
5 and 4 to ∼30% of EUB and then slightly decreased down-
stream. No marked longitudinal changes occurred in the
proportions of BETA in the lacustrine part of the reservoir,
i.e., from station 6 downstream (Fig. 2).
The members of the ALFA and GAMA lineages ac-
counted generally for ∼3–10% of EUB and showed little
longitudinal variability (Fig. 2). We recorded only two ex-
ceptions from this pattern: (i) increased proportions of
ALFA were found at stations 4 and 5 (15 and 27% of EUB,
respectively) in the April transect, with a significant increase
between stations 6 and 5 (Tukey HSD test, P < 0.05), and (ii)
Fig. 4. Longitudinal changes in microbial
parameters along the Sau Reservoir in April
(left panels) and July 1997 (right panels):
Contributions of different size classes of
bacteria to total bacterial abundance and
biomass.
Fig. 5. Longitudinal changes in microbial
parameters along the Sau Reservoir in
April (left panels) and July 1997 (right pan-
els): Contributions of different size classes
of bacteria hybridized with the probes for
BETA-Proteobacteria (BETA) and Cy-
tophaga/Flavobacterium (CF) to total bio-
mass of bacteria affiliated to the BETA and
CF phylogenetic lineages.
364 K. Simek et al.
in July, these two groups showed enhanced proportions only
in the river inflow in parallel with the highest portion of total
DAPI-stained bacteria hybridized with the EUB probe. The
sharp drop in the ALFA proportions between stations 9 and
8 was significant (Tukey HSD test, P < 0.05). In April, the
percentage of EUB over total bacteria ranged between 70 to
87% with no marked longitudinal trend, as opposed to the
July transect when the proportion of EUB (60–95%) showed
a trend similar to that found for BETA and CF. The decrease
in the proportions of EUB between stations 8 and 6 was
significant (Tukey HSD test, P < 0.05).
Processing of double images (i.e., of the Cy3 and DAPI
fluorescence) of individual cells enabled us (i) to determine
longitudinal changes in mean cell volume of the most abun-
dant members of the BETA and CF groups (Fig. 3), (ii) to
evaluate the contributions of different size classes within
BETA and CF to their respective total biomass (Fig. 5), and
(iii) to estimate their contributions to the total bacterial
biomass derived from DAPI-stained images (Fig. 3). Cell
volume of DAPI-stained bacteria decreased from the river to
dam areas, and these changes coincided with the decreasing
cell volume of bacteria hybridized with the BETA probe (Fig.
3), yielding highly significant correlations (r2 = 0.909 and
0.888, n = 9, P < 0.001) in April and July. While cell volume
of DAPI-stained bacteria was strongly influenced by the
changing cell volume of BETA, no similar correlation was
found between the former parameter and the CF size (r2 =
0.209 and 0.047, n = 9, P = 0.216 and 0.576) in April and
July, respectively. Thus, as opposed to BETA, no clear lon-
gitudinal patterns in average cell size and the size class dis-
tributions of CF (Figs. 3 and 5), with a generally low mor-
phological diversity dominated by short rods, were recorded.
Although CF belonged into smallest hybridized cells in the
river inflow, their average size was larger than that of all the
DAPI-stained bacteria in the lower part of the reservoir.
Correspondingly, it resulted in the most marked contribu-
tion (30–42%) of BETA to total bacterial biomass in the
upper, inflow part of the reservoir and of the members of CF
in the lower part of the reservoir (25–65%, Fig. 3).
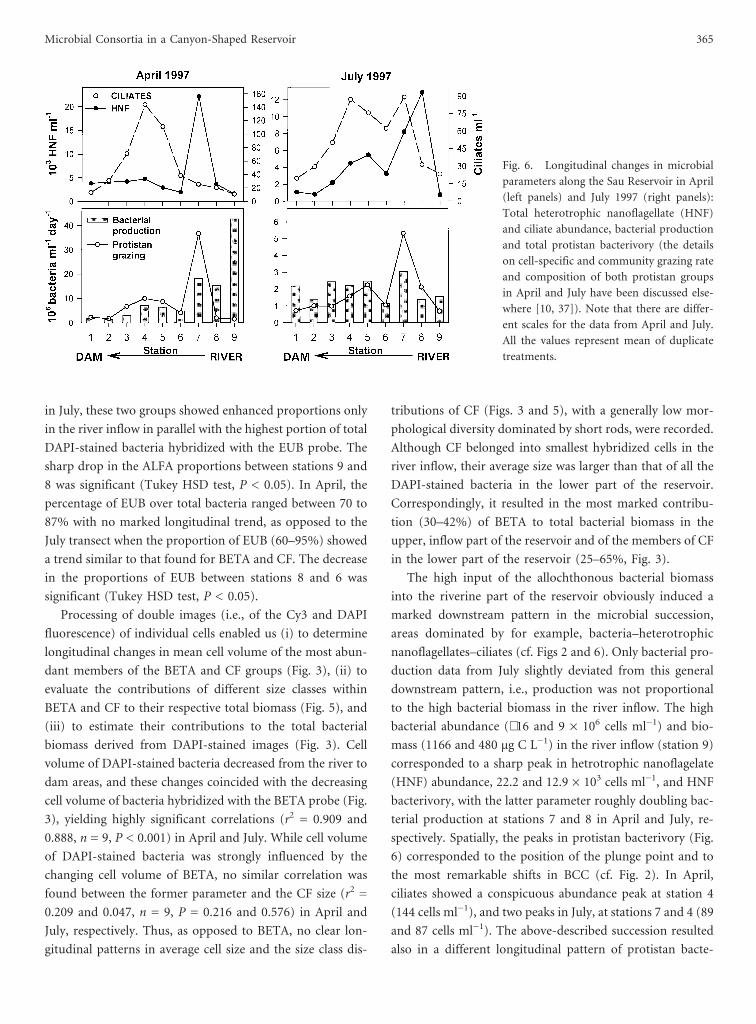
The high input of the allochthonous bacterial biomass
into the riverine part of the reservoir obviously induced a
marked downstream pattern in the microbial succession,
areas dominated by for example, bacteria–heterotrophic
nanoflagellates–ciliates (cf. Figs 2 and 6). Only bacterial pro-
duction data from July slightly deviated from this general
downstream pattern, i.e., production was not proportional
to the high bacterial biomass in the river inflow. The high
bacterial abundance (∼16 and 9 × 10⁶ cells ml−1) and bio-
mass (1166 and 480 µg C L−1) in the river inflow (station 9)
corresponded to a sharp peak in hetrotrophic nanoflagelate
(HNF) abundance, 22.2 and 12.9 × 10³ cells ml−1, and HNF
bacterivory, with the latter parameter roughly doubling bac-
terial production at stations 7 and 8 in April and July, re-
spectively. Spatially, the peaks in protistan bacterivory (Fig.
6) corresponded to the position of the plunge point and to
the most remarkable shifts in BCC (cf. Fig. 2). In April,
ciliates showed a conspicuous abundance peak at station 4
(144 cells ml−1), and two peaks in July, at stations 7 and 4 (89
and 87 cells ml−1). The above-described succession resulted
also in a different longitudinal pattern of protistan bacte-
Fig. 6. Longitudinal changes in microbial
parameters along the Sau Reservoir in April
(left panels) and July 1997 (right panels):
Total heterotrophic nanoflagellate (HNF)
and ciliate abundance, bacterial production
and total protistan bacterivory (the details
on cell-specific and community grazing rate
and composition of both protistan groups
in April and July have been discussed else-
where [10, 37]). Note that there are differ-
ent scales for the data from April and July.
All the values represent mean of duplicate
treatments.
Microbial Consortia in a Canyon-Shaped Reservoir 365

rivory: while HNF prevailed mainly at the upstream stations
9 - 7 (data not shown), ciliates largely balanced or exceeded
HNF bacterivory at stations 6 - 2 [10, 37].
Discussion
To our knowledge, this study is likely the first one describing
changing phylogenetic bacterial composition in such a lon-
gitudinally dynamic system. Though we used only five dif-
ferent probes, the results clearly showed a shift in BCC and
bacterial size structure, and morphology from the riverine
towards the lacustrine part of the reservoir (Figs. 2–5) likely
reflecting the change from the allochthonous, riverborne to
the autochthonous reservoir bacteria. The BCC shifts we
detected in the proportions of BETA and CF were remark-
ably strong, considering the rather crude splitting of the
community into a few subgroups, each of them consisting of
an unknown number of bacterial strains [3]. With the rather
limited taxonomic resolution level of the probes we might
have missed shifts within, e.g., the BETA group. Fortunately,
the group-specific rRNA-targeted oligonucleotide probes
have proved to be a sufficient tool for characterizing the
shifts in BCC in this organically loaded reservoir. The mean
cell volume of the reservoir bacterioplankton (between ∼0.1–
0.2 and >0.2 µm3 in the lacustrine and riverine parts of the
reservoir, respectively; Fig. 3) and the values of bacterial
production (Fig. 6) indicated a high degree of cell-specific
physiological activity, and the EUB probe detected 58–96%
of total DAPI-stained bacterial cells. A similar range of val-
ues has been reported from oligo- to eutrophic lakes [1, 11,
26, 38, 49]. Except for a few samples from the middle part of
the reservoir in the July transect, the EUB probe always
targeted >65% of total DAPI-stained bacterial cells (Fig. 2).
Sizing of hybridized cells was based on DAPI-stained
cells, a procedure that could underestimate size [42], but
that facilitates the direct comparison of, e.g., mean cell vol-
umes of the BETA or CF subpopulations with the cell vol-
ume or size distribution of the total assemblage (for details
see Pernthaler et al. [25]). The average volume of bacteria in
this highly eutrophic reservoir was rather large compared to
those reported from the epilimnion of other freshwater sys-
tems [9, 15, 28, 48] and the cells stained with the Cy3 fluo-
rochrome produced a bright fluorescent signal.
In general, the large bacterial cells in the river inflow
(stations 9 and 8) produced the strongest FISH fluorescent
signal out of all samples inspected. This implies a high per
cell RNA content of the bacteria [30], which was related to
their enhanced growth rate in the substrate rich river water.
Typically, the sum of cells hybridized with group-specific
probes matched well with the total number of the EUB-
targeted bacteria in the upper, organically loaded part of the
reservoir (Fig. 2). Thus, almost 100% of FISH-detectable
bacteria in the river inflow could be easily affiliated to one of
the phylogenetic lineages targeted with the oligonucleotide
probes we used. However, in the April transect this was not
the case for the lacustrine part of the reservoir (stations 1–6)
where between ∼5 and 25% of EUB-detectable bacterial cells
in the lacustrine part of the reservoir likely belonged to other
phylogenetic lineages.
The longitudinal changes in the contribution of BETA
and CF bacteria to total numbers were the main responsible
of the detected shifts in BCC at the transient zone between
the riverine and lacustrine parts of the reservoir (Fig. 2).
Nold and Zwart [23] analyzed the occurrence of microbial
phyla in freshwater and marine habitats, and they found the
following patterns: Gram positive bacteria, ALFA- and
GAMA-Proteobacteria were distributed throughout the
range of aquatic habitats with ALFA frequently dominating
numerically in coastal waters [13], whereas other phyloge-
netic groups appeared to be more common in narrowly
defined aquatic niches, such as anoxic water or sediments
(d-Proteobacteria), or floating aggregates (CF; see also Weiss
et al. [49]). The BETA lineage has been detected in a broad
variety of limnetic systems, but sequences related to BETA
were largely absent from clone libraries from open ocean
environments. BETA often comprised large proportions or
even dominate within freshwater bacterial communities in-
volving bacterioplankton [1, 11, 26, 38], lake snow aggre-
gates [49], and activated sludge [21, 47].
In the major features, our data seem to fit the above
suggested phylogenetic distribution patterns with a few ex-
ceptions. In the Sau Reservoir, not BETA but CF (except for
three data points in the July transect, Fig. 2) numerically
dominated the community, which contradicts to the usual
pattern of BCC in freshwaters (cf. [12, 23]). The dominance
of the CF group not only held for the riverine, nutrient-, and
floc-rich part of the reservoir, but was also typically found in
the lacustrine part. Moreover, a sharp decrease was apparent
in the proportions of CF at the river-lake transition zone
followed by an increase of CF at stations 1–2 and 1–4 in both
transects. Thus, it is conceivable that the different compo-
sition of the community at the inflow was largely associated
with organic substrates of allochthonous origin, whereas the
community in the lacustrine areas was largely associated
with autochthonous organic substrates produced in the pro-
366 K. Simek et al.

cesses of primary production. This documents a broad range
of physiological capabilities and substrate flexibility of the
phylotypes affiliated to the CF cluster. From pure culture
studies, it has been reported that members of the CF group
are able to aerobically degrade large spectrum of substrates
ranging from various proteins, carbohydrates, pesticides,
and insecticides to complex macromolecules [8].
A recent study comparing the BCC of lakes and oceans
[12] reports that the proportions of CF in freshwaters range
from 2 to 12 %, averaging 6% of total bacterial cell count.
However, the later values might be biased by a rather limited
number of limnetic study sites, covering only four oligo- to
mesotrophic lakes. The proportions of CF in bacterioplank-
ton seem to be much more significant within the range of
trophic status from meso- (e.g., [49]) through eu- [38] to
hypertrophy (the upper, heavily loaded part of the Sau res-
ervoir; see Fig. 2). Moreover, the CF phylotypes have been
reported as numerically dominating in the domain Bacteria
found on limnetic aggregates [49]. A possible explanation
for the very high proportions of CF in the reservoir could be
a general trend of an increasing proportion of particle-
bound or floc-forming bacteria toward eu- to hypertrophy.
The later hypothesis could be supported by our finding that
30–50% of bacteria in the river inflow were particle bound
or floc-forming (data not shown), and correspondingly ∼40–
60% of total bacteria from this area hybridized with the CF
probe. This is the highest percent contribution of CF to total
bacterial community that has ever been reported for natural
freshwater systems. However, we cannot conclude that the
enhanced proportions of CF in eutrophic freshwaters clearly
indicate an allochthonous source of water pollution.
For instance, in our size fractionation treatments of
plankton samples exposed in dialysis bags in the mesoeutro-
phic Rımov Reservoir, we found that when the samples were
taken during the clear water phase with a very low propor-
tion of bacterial flocs, intensive protistan grazing induced a
BCC shift toward increased proportions of CF and ALFA,
along with enhanced proportions of grazing-resistant fila-
ment- or floc-forming bacteria [38]. In a similar experimen-
tal study (Simek and Hornak, unpub. data), a strong re-
sponse of bacterioplankton induced by heavy flagellate graz-
ing in the 5 µm treatments was observed; BCC shifted
towards the dominance of floc-forming (70% of total bac-
teria) BETA and CF with a typical floc structure of BETA in
the outer and CF in the inner part of such flocs.
Surprisingly, no marked differences in mean cell volumes
of the cells targeted with the CF probe (Fig. 3) were found in
both longitudinal transects, though there were large differ-
ences between the inflow versus lacustrine part of the reser-
voir in terms of the amount and nature of available organic
substrates and the proportion of floc-forming CF. Com-
pared to the conspicuous trend in the mean cell volume of
all DAPI-stained bacteria, the mean cell volume of CF was
almost constant, thus placing CF within the smallest bacte-
rial cells in the inflow zone but within the largest ones at the
dam area of the reservoir (Fig. 3).
On the other hand, the decrease in the proportions of
BETA and their reduced cell volumes and biomass from the
river downstream might be related to the disappearence of
the allochthonous pollution. In the inflow part, we observed
a high morphological diversity of the cells that hybridized
with the BETA probe, being mostly dominated by floc-
forming 1–3 µm long rods, robust 3–4 µm long rod-shaped
single cells, or by 5–25 µm long filaments. The abundant
bacterial flocs and morphology of these predominantly large
bacterial cells in the river inflow resembled the bacterial
community typical of sewage sludge (cf. microphotographs
in Manz et al. [21]). This likely reflects the extreme organic
matter load, originating from a large population, intensive
use of fertilizers, and extensive pig farming in the watershed
of the reservoir (for details see Vidal and Om [46]).
Manz et al. [21] and Snaider et al. [40] reported BETA as
the dominant group of bacteria in a municipal treatment
plant, while rather small cells, affiliated to the CF cluster,
clearly prevailed within bacteria from a dairy wastewater
plant [21]. The prevalence of BETA and CF in organically
highly loaded waters might be a general phenomenon. In
our study, the cell size of BETA significantly influenced bac-
terial mean cell volume, and resulted in the dominance of
BETA in the total bacterial biomass from the river inflow
downstream to station 7, whereas members of CF numeri-
cally dominated throughout the reservoir (Figs. 2 and 3).
No clear conclusion could be drawn from the longitudi-
nal changes in the proportions of ALFA and GAMA sub-
classes of the class Proteobacteria. Only in the case of the
April transect did the enhanced proportions of ALF in the
middle part of the reservoir spatially coincide with increased
grazing activity of protists, especially of ciliates (for details
see Simek et al. [37]).
Although we clearly detected significant shifts in the bac-
terial community composition at the transient zone between
the riverine and lacustrine parts of the reservoir (Fig. 2),
it is rather difficult to unambiguously explain this finding
from our data set. Three major factors apparently oper-
ated in parallel: complicated hydrology (related to the river
flow rate, water temperature, and chemistry), downstream
Microbial Consortia in a Canyon-Shaped Reservoir 367

changes in substrate availability (allo- versus autochthonous
carbon), and protistan bacterivory. Water stratification and
the position of the plunge point were probably the most
important parameters in determining the position of the
marked changes observed in BCC. At the plunge point, situ-
ated between stations 7 and 8, the countercurrents from the
river and the reservoir meet, resulting in a partial mixing of
water masses. Using conductivity and chloride concentra-
tions as tracers of different water masses, it is has been
estimated by a mass balance model (for details see Armengol
at al. [4]) that 72–78% and ∼14% of the river inflow was
injected into the reservoir epilimnion in the April and July
transects, respectively. The strongest influence of the river
water injection into the epilimnetic water masses could be
detected at the plunge point or close to it. River flow also
contributed to the establishment of the downstream trophic
gradient through the reservoir (revealed by chemistry,
phyto- and zooplankton, and microbial parameters; [4, 10],
and see Figs. 2–6 in this paper).
In both transects, the river water mixed with the reservoir
epilimnion induced a succession in the microbial food web
structure, i.e. bacteria-HNF-ciliates (cf. Figs. 2 and 6). How-
ever, the position of peaks of the respective microbial popu-
lations and its amplitude seem to be tightly related to the
position of the plunge point and to the amount and organic
loading of the river water mixed to the epilimnion. Thus, the
influence of allochthonous bacterial production was pro-
nounced in April, whereas in July, the peaks in HNF and
ciliates abundance had smaller amplitude and they were
shifted upstream, closer to the plunge point. In April, pro-
tistan bacterivory at the transient zone (around station 7)
was almost entirely due to HNF grazing [37], whereas in
July, there was also a significant contribution of ciliate graz-
ing, mainly due to the greater ciliate abundances upstream
and dominated by typical picoplankton-feeding halteriids
[10]. The location of the ciliate peak in July (at station 7)
seemed to be related to the position of the plunge point
(close to station 8) and by generally higher summer growth
rates of protists allowing them to build up large populations
quite close to the river inflow.
Protistan grazing is size selective, usually more intense on
larger bacterial cells (e.g., [14, 36]). However, depending on
which are the dominant protistan bacterivores in a given
freshwater system, bacteria in a certain size range are
thought to be protected against HNF grazing (usually be-
tween 3 and 5 µm long when small bacterivorous HNF
dominate [16, 19]). Large filaments, other large complex
growth forms, bacterial aggregates, and particle-bound bac-
teria are thus largely resistant to HNF predation [16]. How-
ever, these bacterial forms were not likely resistant to the
predation by the dominating groups of ciliates (mainly hal-
teriids and vorticellids) and rotifers (400–600 individuals
L−1, bdelloids and Brachionus spp.) observed in the upper
part of the reservoir [10, 37]. They can efficiently consume
larger prey sizes and also medium-sized bacterial aggregates
or detritus particles [5, 37], thus specifically contributing to
the predation-induced bacterial mortality. Additionally,
when the river water masses reach the lacustrine part and are
mixed into the reservoir epilimnion, decreased water turbu-
lence facilitates an increased sedimentation rate of larger
bacterial aggregates or particle-bound bacteria. Since a large
proportion of bacterial flocs was composed of CF and of
large cells affiliated to the BETA lineage, these two processes
could also selectively contribute to the observed bacterio-
plankton community composition shift toward the de-
creased proportions of CF and BETA at the transient zone of
the reservoir (Fig. 2).
It has been reported from both laboratory [17, 27, 39, 45]
and field studies [20, 38] that intensive flagellate grazing on
bacteria can induce a significant shift in BCC. Generally, we
found the lowest protistan numbers and bacterivory rates in
the river inflow (Fig. 6). In both April and July the high
allochthonous bacterial input to the reservoir epilimnion
induced a huge HNF development dominated by large bac-
terivorous chrysomonads just at the plunge point. Protistan
bacterivory roughly doubled the bacterial production, spa-
tially corresponding to the most marked changes in bacterial
community composition (cf. Figs. 2 and 6). Though we are
aware of possible sources of under- or overestimates of the
production and grazing data (for the specific discussion re-
lated to the Sau Reservoir see Simek et al. [37]), we suggest
that the most important biological factor that could signifi-
cantly contribute to the BCC shifts was flagellate bacterivory.
Longitudinally changing substrate availability and the na-
ture of substrates could also specifically affect the BCC in the
reservoir. The riverborne, large, fast-growing bacteria
adapted to high substrate concentrations, when reaching the
lacutrine part of the reservoir with less substrate and en-
hanced grazing pressure [36], became less competitive and
suffered increased mortality. In contrast, the lacustrine bac-
terioplankton, composed of smaller bacterial cells (Figs. 3
and 4), likely experienced lower grazing losses and was better
adapted to the largely autochthonously produced substrates
originating from primary production.
In summary, we found a conspicuous longitudinal gra-
dient in bacterial cell size and community composition, with
368 K. Simek et al.

the CF group numerically dominating and BETA accounting
for the largest proportion of bacterial biomass in the inflow
part of the reservoir. The majority of the large cells affiliated
to the BETA lineage disappeared around the plunge point,
which spatially coincided with the highest values of protistan
bacterivory. Thus, biological processes, i.e., protistan bacte-
rivory and bacterial growth under changing substrate avail-
ability, and interplay of the factors related to water chemis-
try, stratification processes, and increased sedimentation rate
of particles at the transient river–reservoir zone were the
major forces longitudinally shaping the epilimnetic bacterial
community composition. The decreased oxygen saturation
of water masses in the upper part of the reservoir did not
allowed the development of large filter-feeding cladocerans
[4, 10] with the ability to crop a broad spectrum of organ-
isms within microbial food webs, including protists [32].
This specific trophic structure contributed to the develop-
ment of pronounced, longitudinally distinguishable peaks of
flagellates and ciliates.
Acknowledgments
This study was supported by the GA CR research grants
206/99/0028 and 206/98/0727, by a project of the Spanish
Inter-ministerial Commission of Science and Technology
(CICYT, no. HID99-599-CO2-O1), and by the Aigues Ter-
Llobregat Company. Additional supports were also provided
by an instrument grant AS CR “Microanalysis of microbial
communities”—program 1036, P 1011802, and by a grant of
University of South Bohemia CEZ:J06/98:123100004. We
thank Thomas Chrzanowski for the English correction of the
manuscript, and Jakob Pernthaler, Martin Hahn, Josep Ga-
sol, and Jaroslav Vrba for the valuable comments on the
earlier versions of the manuscript.
References
1. Alfreider A, Pernthaler J, Amann RI, Sattler B, Glockner F-O,
Ville A, Psenner R (1996) Community analysis of the bacterial
assemblages in the winter cover and pelagic layers of a high
mountain lake using in situ hybridization. Appl Environ Mi-
crobiol 62:2138–2144
2. Amann RI, Krumholz L, Stahl DA (1990) Fluorescent-
oligonucleotide probing of whole cells for determinative, phy-
logenetic, and environmental studies in microbiology. J Bac-
teriol 172:762–770
3. Amman RI, Ludwig W, Schleifer KH (1995) Phylogenetic
identification and in situ detection of individual microbial
cells without cultivation. Microbiol Rev 59:143–169
4. Armengol J, Garcia J-C, Comerma M, Romero M, Dolz J,
Roura M, Han B-P, Vidal A, Simek K (1999) Longitudinal
processes in canyon type reservoirs: The case of Sau (N.E.
Spain). In: Tundisi JG, Straskraba M (eds) Theoretical Reser-
voir Ecology and Its Applications. Brazilian Academy of Sci-
ences and Backhuys Publishers, Leiden, pp 313–345
5. Arndt H (1993) Rotifers as predators on components of the
microbial food web (bacteria, heterotrophic flagellates, cili-
ates)—a review. Hydrobiologia 255/256:231–246
6. Bell RT (1993) Estimating production of heterotrophic bacte-
rioplankton via incorporation of tritiated thymidine. In:
Kemp PF, Sherr BF, Sherr EB, Cole JJ (eds) Handbook of
Methods in Aquatic Microbial Ecology. Lewis Publishers, Boca
Raton, FL, pp 495–503
7. Berman T (1990) Microbial food-webs and nutrient cycling in
lakes: changing perspectives. In: Tilzer MM, Serruya C C (eds)
Large Lakes. Ecological Structure and Function. Springer-
Verlag, New York, pp 511–525
8. Bernadet JF, Segers P, Vancanneyt M, Berthe F, Kersters K,
Vandamme P (1996) Cutting a gordian knot: emended clas-
sification and description of the genus Flavobacterium,
emended description of the family Flavobacteriacea, and pro-
posal of Flavobacterium hydatis nom. now (basonym, Cy-
tophaga aquatilis strohl and Tait 1978). Int J Syst Bacteriol
46:128–148
9. Chrzanowski TH, Hubbard JG (1988) Primary and secondary
production in a Southwestern reservoir. Appl Environ Micro-
biol 54:661–669
10. Comerma M, Garcia J-C, Armengol J, Romero M, Simek K
(2001) Planktonic food web structure along the Sau Reservoir
(Spain) in summer 1997. Internat Rev Hydrobiol 86:195–209
11. Glockner F-O, Amann R, Alfreider A, Pernthaler J, Psenner R,
Trebesius KH, Schleifer KH (1996) An in situ hybridization
protocol for detection and identification of planktonic bacte-
ria. Syst Appl Microbiol 19:403–406
12. Glockner F-O, Fuchs BM, Amann R (1999) Bacterioplankton
compositions of lakes and oceans: a first comparison based on
fluorescence in situ hybridization. Appl Environ Microbiol
65:3721–3726
13. Gonzalez JM, Moran MA (1997) Numerical dominance of a
group of marine bacteria in the a-subclass of the class Pro-
teobacteria in coastal waters. Appl Environ Microbiol
63:4237–4242
14. Gonzalez JM, Sherr EB, Sherr BF (1990) Size-selective grazing
on bacteria by natural assemblages of estuarine flagellates and
ciliates. Appl Environ Microbiol 56:583–589
15. Gude H, Haibel B, Muller H (1985) Development of plank-
tonic bacterial populations in a water column of Lake Con-
stance (Bodensee–Obersee). Arch Hydrobiol 105:59–77
16. Hahn MW, Hofle MG (2001) Grazing of protozoa and its
effect on populations of aquatic bacteria. FEMS Microb Ecol
35:113–121
Microbial Consortia in a Canyon-Shaped Reservoir 369
17. Hahn MW, Hofle MG (1999) Flagellate predation on a bac-
terial model community: Interplay of size-selective grazing,
specific bacterial cell size, and bacterial community composi-
tion. Appl Environ Microbiol 65:4863–4872
18. Hejzlar J, Vyhnalek V (1998) Longitudinal heterogeneity of
phosphorus and phytoplankton concentrations in deep-valley
reservoirs. Int Revue Hydrobiol (Spec Issue) 83:139–146
19. Jurgens K, Gude H (1994) The potential importance of graz-
ing-resistant bacteria in planktonic systems. Mar Ecol Prog Ser
112:169–188
20. Jurgens K, Pernthaler J, Schalla S, Amann R (1999) Morpho-
logical and compositional changes in a planktonic bacterial
community in response to enhanced protozoan grazing. Appl
Environ Microbiol 65:1241–1250
21. Manz W, Wagner M, Amann R, Schleifer K-H (1994) In situ
characterization of the microbial consortia active in two
wastewater treatment plants. Wat Res 28:1715–1723
22. Methe BA, Hiorns WD, Zehr JP (1998) Contrasts between
marine and freshwater bacterial community composition:
Analyses of communities in Lake George and six other Ad-
irondack lakes. Limnol Oceanogr 43:368–374
23. Nold SC, Zwart G (1998) Patterns and governing forces in
aquatic microbial communities. Aquat Ecol 32:17–35
24. Norland S (1993) The relationship between biomass and vol-
ume of bacteria. In: Kemp PF, Sherr BF, Sherr EB, Cole JJ
(eds) Handbook of Methods in Aquatic Microbial Ecology.
Lewis Publishers, Boca Raton FL, pp 303–308
25. Pernthaler J, Alfreider A, Posch T, Andreatta S, Psenner R
(1997) In situ classification and image cytometry of pelagic
bacteria from a high mountain lake (Gossenkollesee, Austria).
Appl Environ Microbiol 63:4778–4783
26. Pernthaler J, Glockner F-O, Unterholzner S, Alfreider A, Psen-
ner R, Amann R (1998) Seasonal community and population
dynamics of pelagic Bacteria and Archaea in a high mountain
lake. Appl Environ Microbiol 64:4299–4306
27. Pernthaler J, Posch T, Simek K, Vrba J, Amann R, Psenner R
(1997) Morphological and genotypic shifts in an experimental
bacterial community reflecting different bacterial strategies to
coexist with a protistan predator. Appl Environ Microbiol
63:596–601
28. Pernthaler J, Sattler B, Simek K, Schwarzenbacher A, Psenner
R (1996) Top-down effects on the size-biomass distribution of
a freshwater bacterioplankton community. Aquat Microb Ecol
10:255–263
29. Posch T, Pernthaler J, Alfreider A, Psenner R (1997) Cell-
specific respiratory activity of aquatic bacteria studied with the
tetrazolium reduction method, cyto-clear slides, and image
analysis. Appl Environ Microbiol 63:867–873
30. Poulsen LK, Ballard G, Stahl DA (1993) Use of rRNA fluo-
rescence in situ hybridization for measuring the activity of
single cells in young and established biofilms. Appl Environ
Microbiol 59:1354–1360
31. Riemann B, Christoffersen K (1993) Microbial trophodynam-
ics in temperate lakes. Mar Microb Food Webs 7:69–100
32. Sanders RW, Wickham SA (1993) Planktonic protozoa and
metazoa: predation, food quality and population control. Mar
Microb Food Webs 7:197–223
33. Sed’a J, Machacek J (1998) The effect of flow-through regimes
on zooplankton densities a canyon-shape reservoir. Internat
Rev Hydrobiol (Spec Issue) 83:477–484
34. Sherr EB, Sherr BF (1993) Protistan grazing rates via uptake of
fluorescently labeled prey. In: Kemp PF, Sherr BF, Sherr EB,
Cole JJ (eds) Handbook of Methods in Aquatic Microbial
Ecology. Lewis Publishers, Boca Raton, FL, pp 695–701
35. Simek K, Armengol J, Comerma M, Garcia J-C, Chrzanowski
TH, Macek M, Nedoma J, Straskrabova V (1998) Character-
istics of protistan control of bacterial production in three res-
ervoirs of different trophy. Internat Rev Hydrobiol (Spec Is-
sue) 83:485–494
36. Simek K, Chrzanowski TH (1992) Direct and indirect evi-
dence of size-selective grazing on pelagic bacteria by freshwa-
ter nanoflagellates. Appl Environ Microbiol 58:3715–3720
37. Simek K, Jurgens K, Nedoma J, Comerma M, Armengol J
(2000) Ecological role and bacterial grazing of Halteria spp.:
small oligotrichs as dominant pelagic ciliate bacterivores.
Aquat Microb Ecol 22:43–56
38. Simek K, Kojecka P, Nedoma J, Hartman P, Vrba J, Dolan JD
(1999) Shifts in bacterial community composition associated
with different microzooplankton size fractions in a eutrophic
reservoir. Limnol Oceanogr 44:1634–1644
39. Simek K, Vrba J, Pernthaler J, Posch T, Hartman P, Nedoma
J, Psenner R (1997) Morphological and genotypic shifts in an
experimental bacterial community influenced by protists of
contrasting feeding modes. Appl Environ Microbiol 63:587–
595
40. Snaider J, Amman R, Huber I, Ludwig W, Schleifer K-H
(1997) Phylogenetic analysis and in situ identification of bac-
teria in activated sludge. Appl Environ Microbiol 63:2884–
2896
41. Straskraba M (1998) Limnological differences between deep
valley reservoirs and deep lakes. Int Revue Hydrobiol (Spec
Issue) 83:1–12
42. Suzuki MT, Sherr EB, Sherr BF (1993) DAPI direct counting
underestimates bacterial abundances and average cell size to
AO direct counting. Limnol Oceanogr 38:1566–1570
43. Thornton KW, Kimmel BL, Payne FF (1990) Reservoir Lim-
nology: Ecological Perspectives. Wiley and Sons, New York, pp
246
44. Uhlmann D (1991) Anthropogenic perturbation of ecological
systems: a need for transfer from principles to applications. In:
Ravera O (ed) Terrestrial and Aquatic Ecosystems: Perturba-
tion and Recovery. Ellis Horwood, Chichester, pp 47–61
45. van Hannen EJ, Veninga M, Bloem J, Gons HJ, Laanbroek HJ
(1999) Genetic changes in the bacterial community structure
associated with protistan grazers. Arch Hydrobiol 145:25–38
370 K. Simek et al.

46. Vidal A, Om J (1993) The eutrophication process in Sau Res-
ervoir (NE Spain): A long term study. Verh Internat verein
Limnol 25:1247–1256
47. Wagner M, Amann R, Lemmer H, Schleifer K-H (1993) Prob-
ing activated sludge with oligonucleotides specific for Proteo-
bacteria: inadequacy of culture-dependent methods for de-
scribing community structure. Appl Environ Microbiol
59:1520–1525
48. Weinbauer M, Hofle MG (1998) Size-specific mortality of lake
bacterioplankton by natural virus communities. Aquat Microb
Ecol 15:103–113
49. Weiss P, Schweitzer B, Amann R, Simon M (1996) Identifi-
cation in situ and dynamics of bacteria on limnetic organic
aggregates. Appl Environ Microbiol 62:1998–2005
50. Weisse T, Stockner JG (1993) Eutrophication: the role of mi-
crobial food webs. Mem Ist Itl Idrobiol 52:133–150
Microbial Consortia in a Canyon-Shaped Reservoir 371