The use of ceramic water filters under pressure in an in-line ...
82
Scholars' Mine Scholars' Mine Masters Theses Student Theses and Dissertations Spring 2017 The use of ceramic water filters under pressure in an in-line water The use of ceramic water filters under pressure in an in-line water pumping system pumping system Travis Dean Gardner Follow this and additional works at: https://scholarsmine.mst.edu/masters_theses Part of the Environmental Engineering Commons, and the Geological Engineering Commons Department: Department: Recommended Citation Recommended Citation Gardner, Travis Dean, "The use of ceramic water filters under pressure in an in-line water pumping system" (2017). Masters Theses. 7642. https://scholarsmine.mst.edu/masters_theses/7642 This thesis is brought to you by Scholars' Mine, a service of the Missouri S&T Library and Learning Resources. This work is protected by U. S. Copyright Law. Unauthorized use including reproduction for redistribution requires the permission of the copyright holder. For more information, please contact [email protected].
-
Upload
khangminh22 -
Category
Documents
-
view
3 -
download
0
Transcript of The use of ceramic water filters under pressure in an in-line ...
Scholars' Mine Scholars' Mine
Masters Theses Student Theses and Dissertations
Spring 2017
The use of ceramic water filters under pressure in an in-line water The use of ceramic water filters under pressure in an in-line water
pumping system pumping system
Travis Dean Gardner
Follow this and additional works at: https://scholarsmine.mst.edu/masters_theses
Part of the Environmental Engineering Commons, and the Geological Engineering Commons
Department: Department:
Recommended Citation Recommended Citation Gardner, Travis Dean, "The use of ceramic water filters under pressure in an in-line water pumping system" (2017). Masters Theses. 7642. https://scholarsmine.mst.edu/masters_theses/7642
This thesis is brought to you by Scholars' Mine, a service of the Missouri S&T Library and Learning Resources. This work is protected by U. S. Copyright Law. Unauthorized use including reproduction for redistribution requires the permission of the copyright holder. For more information, please contact [email protected].
THE USE OF CERAMIC WATER FILTERS
UNDER PRESSURE IN AN IN-LINE WATER
PUMPING SYSTEM
by
TRAVIS DEAN GARDNER
A THESIS
Presented to the Faculty of the Graduate School of the
MISSOURI UNIVERSITY OF SCIENCE AND TECHNOLOGY
In Partial Fulfillment of the Requirements for the Degree
MASTER OF SCIENCE IN GEOLOGICAL ENGINEERING
2017
Approved by
Joe D. Guggenberger, Advisor A. Curt Elmore
Mary Reidmeyer

2017
Travis Gardner
All Rights Reserved
iii
PUBLICATION THESIS OPTION
This thesis includes an article prepared for submission to the journal Water
Science and Technology: Water Supply. The content of pages 19-37 will be submitted for
publication in the journal mentioned above. Note that sections of this document contain
additional information supplemental to that journal paper.
iv
ABSTRACT
Ceramic pot filters (CPFs) have proven an effective point of use (POU) filter due
to their relative low cost, ease to manufacture, and effectiveness at treating contaminated
water. These filters are used by individual homes, and sometimes multiple filters are
needed for each home in order to produce enough water for the family’s household. If
these filters could be used in-line with a pumping system or elevated storage tank, water
could be filtered and used on demand for a community in an economically feasible way.
However, CPFs are too fragile to use under pressure due to the weak points where the
side wall and the bottom of the filter meet and the difficulty of keeping CPFs tightly
sealed to an apparatus
To use ceramic filters in a system under pressure, ceramic disks were
manufactured and housed in a special apparatus designed from polyvinyl chloride (PVC),
a rubber coupling, and hose clamps. Ceramic disks were made with varying thicknesses
and clay to sawdust ratios. Filters were tested under pressures of 5 and 10 psi to
determine flowrate and microbiological efficacy, based on total and fecal coliforms, at
these pressures. Filters with log reduction values (LRV) of 2 or greater were considered
effective, based on standards presented by the World Health Organization (WHO).
Initial results show that ceramic disk filters could be an effective way of filtering
water in a closed system under pressures of 10 psi. From testing, it was determined that
filters with thicknesses of 1.25 inches were the most effective at meeting the WHO
removal requirements with the highest flowrate. Porosity of the filters did not contribute
to the removal effectiveness. Filters with clay to sawdust ratios of 6 to 1 by mass proved
the most effective during testing.
v
ACKNOWLEDGEMENTS
I would like to thank my advisor, Dr. Joe Guggenberger, for sharing his extensive
experiences and abounding knowledge to assist my research endeavors. His guidance has
been imperative throughout my experience at Missouri S&T.
I would also like to thank my committee members, Dr. Mary Reidmeyer and Dr.
Curt Elmore, for their interest in this project and for their assistance. I would like to
especially thank Dr. Reidmeyer for her extensive help and guidance in the production of
appropriate experimental filters and disk for the study, and Dr. Elmore for sharing his
knowledge of ceramic water filters and for his help in apparatus design.
I would also like to thank the CPF factory near Antigua, Guatemala for the
opportunity to observe their process and learn about the filters, and for the inspiration to
investigate the possibility of putting CWFs under pressure.
I would also like to thank my office mate and a previous instructor, Carlo
Salvinelli, for his extensive knowledge on ceramic water filters and the process of
making them as well. I appreciate the constant support I received and constant help in the
lab whenever he was busy himself. I would like to thank my other office mates Zane
Helwig and Rachel Utrecht for their encouragement and help in my research.
I also want to thank my family for their continued support throughout my
education and Erica Wellen for her assistance in research and continued support and
encouragement during all stressful times.
vi
TABLE OF CONTENTS
Page
PUBLICATION THESIS OPTION ............................................................................... iii
ABSTRACT ................................................................................................................... iv
ACKNOWLEDGEMENTS ............................................................................................. v
LIST OF ILLUSTRATIONS ....................................................................................... viii
LIST OF TABLES ......................................................................................................... ix
NOMENCLATURE ........................................................................................................ x
SECTION
1. INTRODUCTION .................................................................................................. 1
1.1 DRINKING WATER FILTRATION IN DEVELOPING COUNTRIES ........ 1
1.2 CPFS EFFECTIVENESS AND LIMITATIONS ........................................... 1
1.2.1 Microbiological Removal ..................................................................... 1
1.2.2 Flowrate as a Limitation ....................................................................... 2
1.2.3 Filter Limitation for use in the Field ..................................................... 3
1.3 MOTIVATION ............................................................................................. 3
2. OBJECTIVES ........................................................................................................ 5
2.1 PROBLEM STATEMENT ............................................................................ 5
2.2 STUDY OBJECTIVES .................................................................................. 5
3. METHODS ............................................................................................................ 7
3.1 USE OF CERAMIC POT FILTERS UNDER PRESSURE ............................ 7
3.1.1 CPF Manufactured in Bucket Stacked with Ceramic Disks ..................... 7
3.1.2 CPF Manufactured in Plaster Mold with Ceramic Disks ......................... 7
3.2 USE OF CERAMIC DISK FILTERS UNDER PRESSURE ........................ 11
3.3 FLOWRATE AND MICROBIOLOGICAL TESTING ................................ 17
3.4 PORE ANALYSIS AND INCOMPLETE BURNOUT ANALYSIS ............ 18
vii
PAPER
Use of Ceramic Pot Filter (CPF) Technology Under Pressure in an In-Line Pumping System................................................................................................... 19
ABSTRACT ......................................................................................................... 19
INTRODUCTION ................................................................................................ 20
METHODS .......................................................................................................... 22
RESULTS AND DISCUSSION ........................................................................... 26
LRV as a Function of Porosity .................................................................... 27
LRV as a Function of Thickness ................................................................. 29
LRV as a Function of Flowrate ................................................................... 30
Testing Conducted at 10 PSI ....................................................................... 33
CONCLUSIONS .................................................................................................. 34
REFERENCES..................................................................................................... 36
SECTION
4. DISCUSSION ...................................................................................................... 38
4.1 LABORATORY FINDINGS ....................................................................... 38
4.2 EFFECT OF INCOMPLETE BURNOUT ON FILTER EFFECTIVENESS 39
5. CONCLUSIONS .................................................................................................. 42
5.1 CONCLUSIONS OF LABORATORY TESTING ....................................... 42
5.2 FUTURE WORK ........................................................................................ 42
APPENDICIES
A. IMAGES OF FILTERS USED WITH RESULTS OF TESTING .................. 44
B. LRV VS. POROSITY OF FILTERS BASED ON THICKNESS ................... 54
C. LRV VS. THICKNESS RAW DATA ........................................................... 56
D. LRV VS. FLOWRATE RAW DATA BASED ON THICKNESS ................. 58
E. STATISTICAL ANALYSIS USING MINITAB RESULTS ......................... 60
F. FILTERS WITH COMPLETE AND INCOMPLETE BURNOUT MEASUREMENTS ....................................................................................... 64
BIBLIOGRAPHY ......................................................................................................... 69
VITA ............................................................................................................................. 71
viii
LIST OF ILLUSTRATIONS
Figure Page
1.1 Typical CPF setup ....................................................................................................2
3.1 Plaster mold used to make CPFs................................................................................8
3.2 Fired CPF used for testing .........................................................................................9
3.3 Apparatus used to test CPFs without clamps............................................................ 10
3.4 Apparatus used for testing ....................................................................................... 12
3.5 Filter in apparatus ................................................................................................... 12
3.6. Hydraulic press used to make filter disk .................................................................. 14
3.7 Pressed filter block before firing ............................................................................. 15
3.8 Water jetting filter block ......................................................................................... 16
3.9 Finished filter disk .................................................................................................. 16
PAPER
1 Laboratory setup ..................................................................................................... 25
2 LRV vs. measured porosity for each thickness group............................................... 28
3 Boxplot of LRV vs. thickness based on clay to sawdust ratio by mass ..................... 30
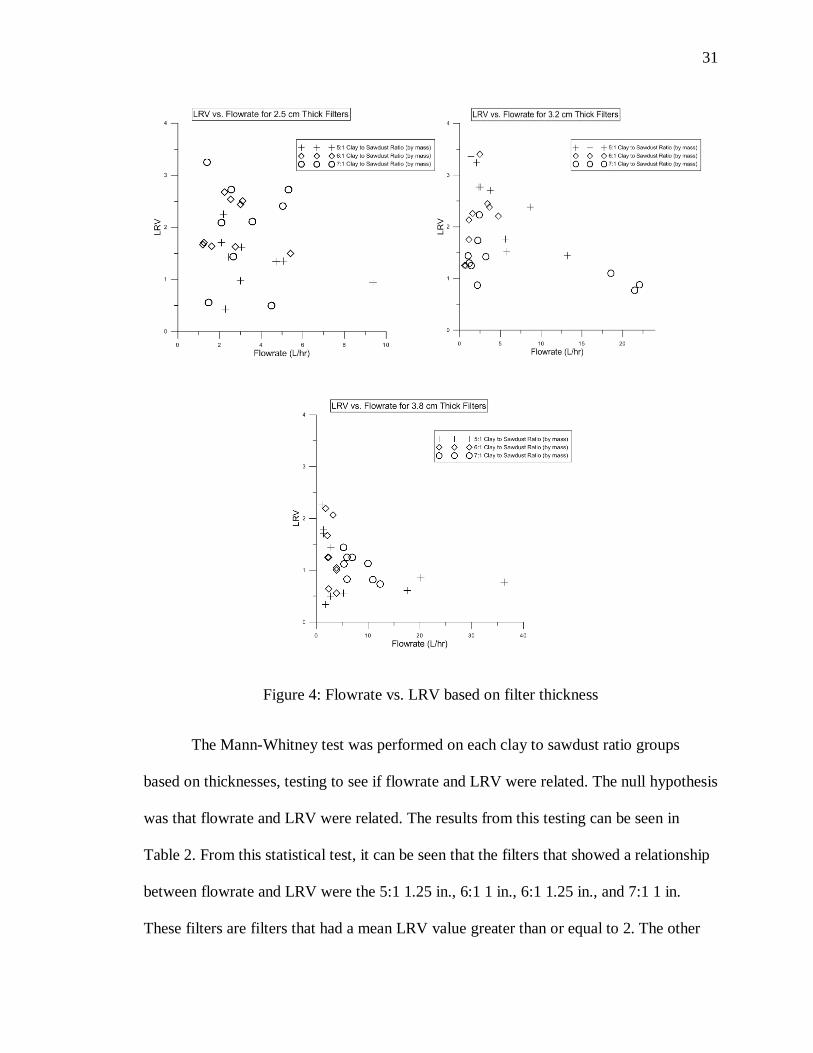
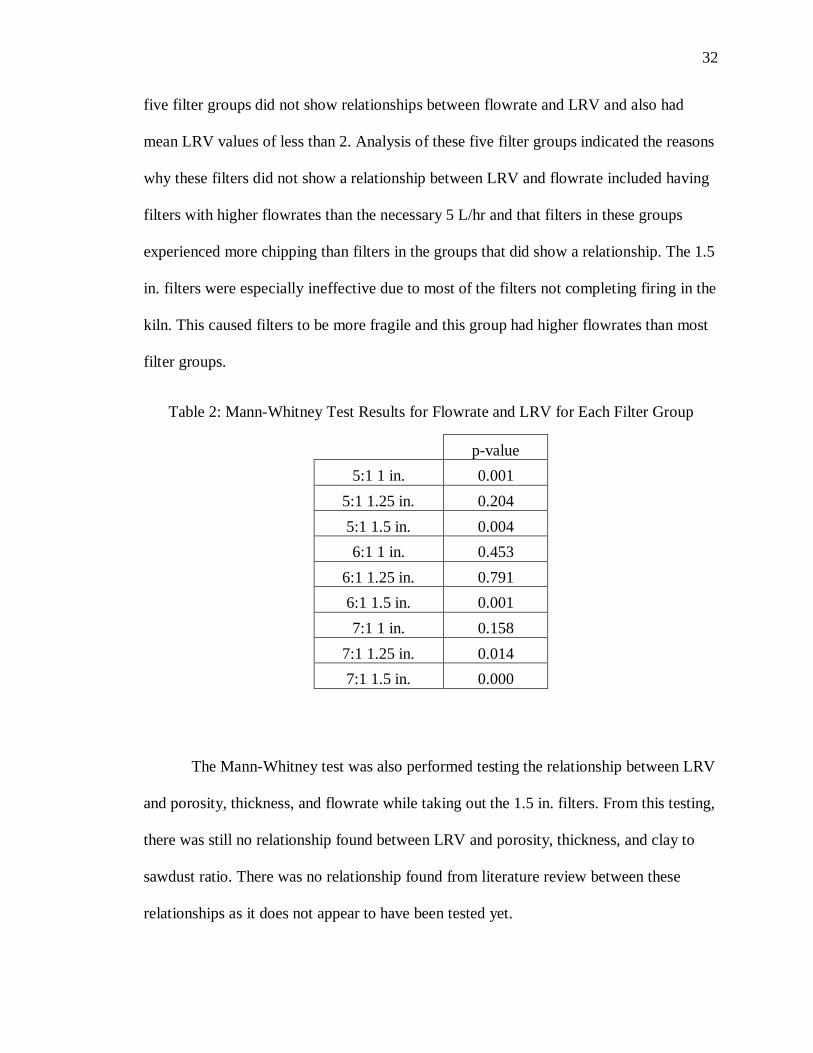
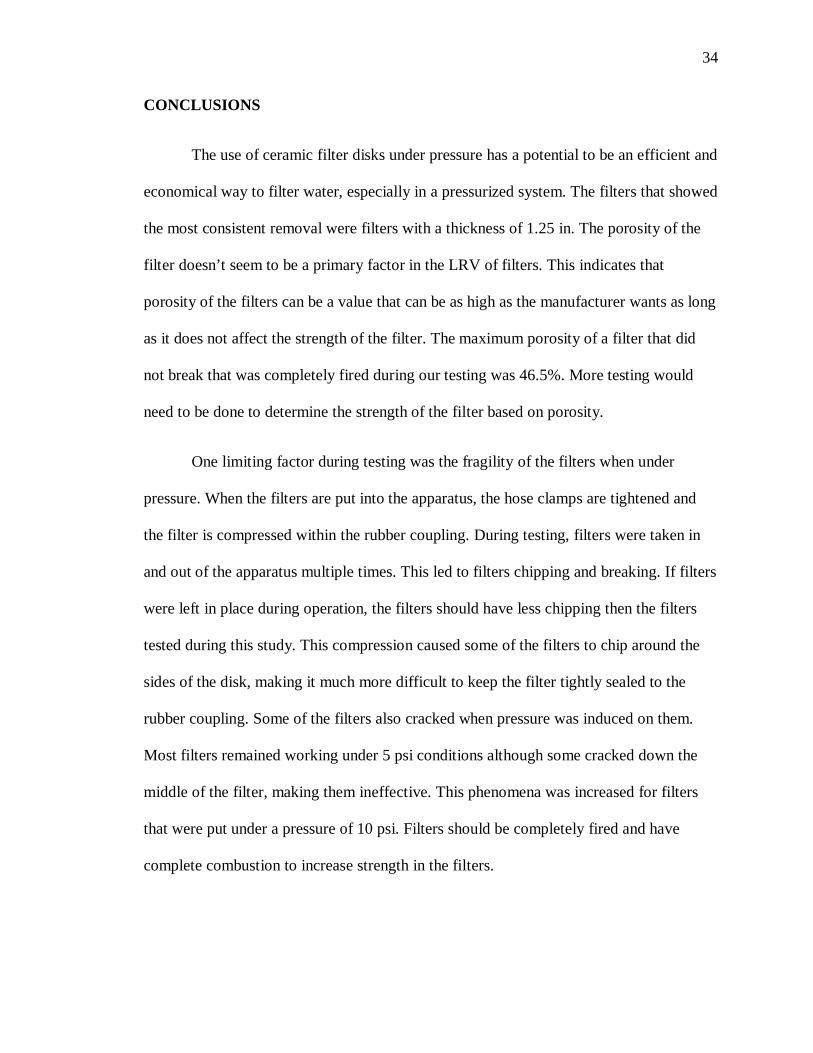
4 Flowrate vs. LRV based on filter thickness.............................................................. 31
SECTION
4.1 Complete fired section compared to incomplete fired section .................................. 40
ix
LIST OF TABLES
Table Page
PAPER
1 Statistics of Filters Grouped by Thickness and Clay to Sawdust Ratio by Mass ....... 27
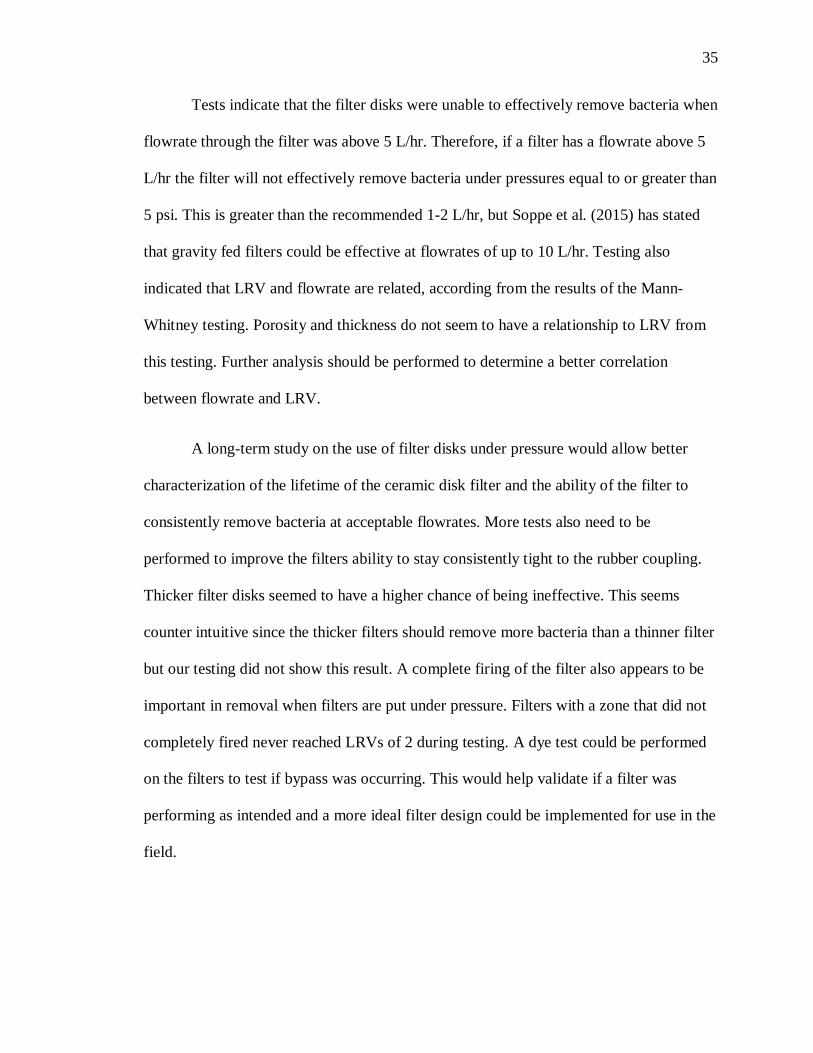
2 Mann-Whitney Test Results for Flowrate and LRV for Each Filter Group ............... 32
3 Results of Tests Conducted at 10 psi ....................................................................... 33
SECTION
4.1 Comparison of Filters with Complete and Incomplete Firing.................................... 40
x
NOMENCLATURE
CPF Ceramic Pot Filter
CV Coefficient of Variation
°C Degrees Celsius
ft Feet
hp Horsepower
in. Inches
in-lb Inch-pounds
kg Kilogram
L Liters
L/hr Liters/hour
LRV Logarithmic Reduction Value
mm Millimeter
MPN Most Probable Number
psi Pounds per Square Inch
POU Point Of Use
WHO World Health Organization
1. INTRODUCTION
1.1 DRINKING WATER FILTRATION IN DEVELOPING COUNTRIES
Access to clean drinking water in developing nations continues to be an important
concern for human health. An estimated 748 million people (about 11% of the world’s
population) lack access to improved water supplies (WHO/UNICEF, 2014). Clasen and
Bastable (2003) estimate that hundreds of millions more of that population drink water
contaminated during collection, transport, and storage. Diarrhea, a health consequence of
drinking contaminated water, accounts for approximately 1.87 million, or 19%, of
childhood deaths each year (Boschi-Pinto et al., 2008). It can therefore be seen that a
water filtration system that is cost-effective and easy to make in-country would greatly
improve the overall health of a developing nation’s community. Ceramic pot filters
(CPFs) have shown to be effective at producing potable water and a good alternative for
household water treatment (Hunter, 2009). CPFs are porous ceramic filters with a flower
pot shape design. Colloidal silver is added to the outside of the pot and acts as a
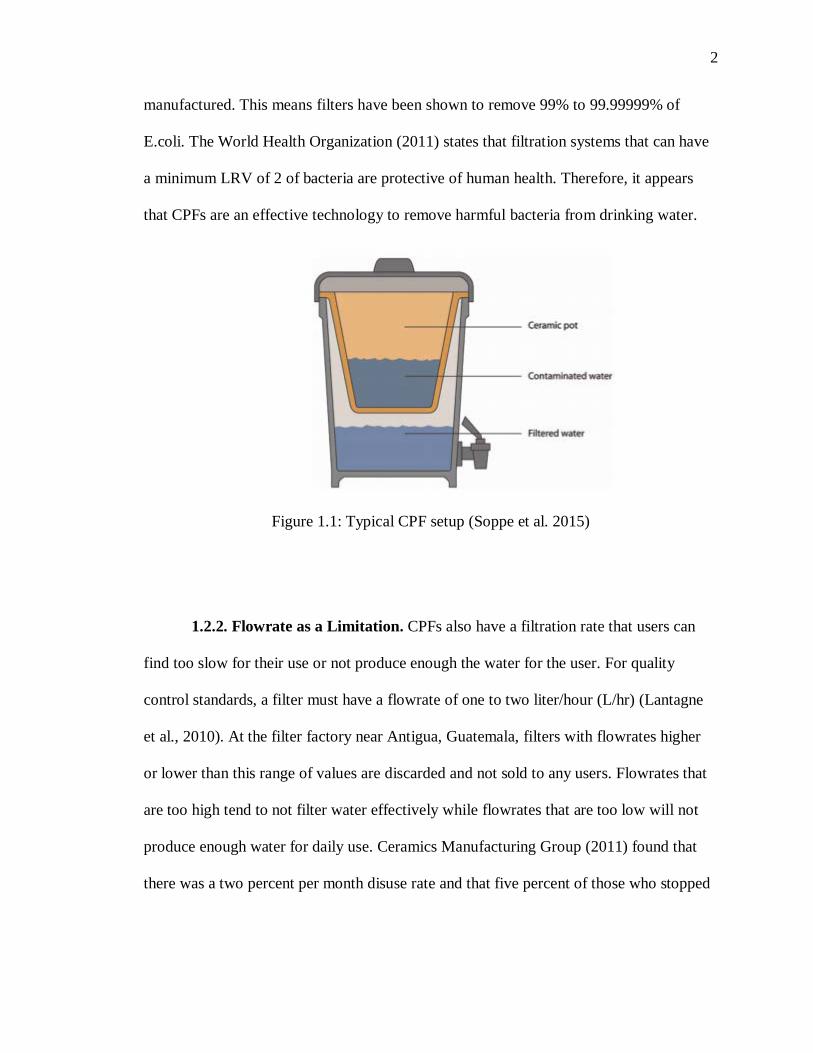
disinfectant. Figure 1.1 shows a typical in-home setup of the filter system. Water is
poured into the pot-shaped filter reservoir and flows by gravity through the CPF and into
a plastic bucket to be dispensed from a spigot for drinking.
1.2 CPFS EFFECTIVENESS AND LIMITATIONS
1.2.1. Microbiological Removal. Ceramic pot filters have proven to effectively
remove microbiological contamination by multiple sources, including van Halem et al.
(2007), Brown and Sobsey (2010), Kallman et al. (2011), Soppe et al. (2015), and others.
Van Halem et al. (2007) showed that filters that are gravity fed are capable of at least a
logarithmic reduction value (LRV) of 2 and up to 7 depending on where the CPF was
2
manufactured. This means filters have been shown to remove 99% to 99.99999% of
E.coli. The World Health Organization (2011) states that filtration systems that can have
a minimum LRV of 2 of bacteria are protective of human health. Therefore, it appears
that CPFs are an effective technology to remove harmful bacteria from drinking water.
Figure 1.1: Typical CPF setup (Soppe et al. 2015)
1.2.2. Flowrate as a Limitation. CPFs also have a filtration rate that users can
find too slow for their use or not produce enough the water for the user. For quality
control standards, a filter must have a flowrate of one to two liter/hour (L/hr) (Lantagne
et al., 2010). At the filter factory near Antigua, Guatemala, filters with flowrates higher
or lower than this range of values are discarded and not sold to any users. Flowrates that
are too high tend to not filter water effectively while flowrates that are too low will not
produce enough water for daily use. Ceramics Manufacturing Group (2011) found that
there was a two percent per month disuse rate and that five percent of those who stopped
3
using the filter did so because the filtration rate was too slow. In larger households,
multiple filters may be needed which would be more expensive to families.
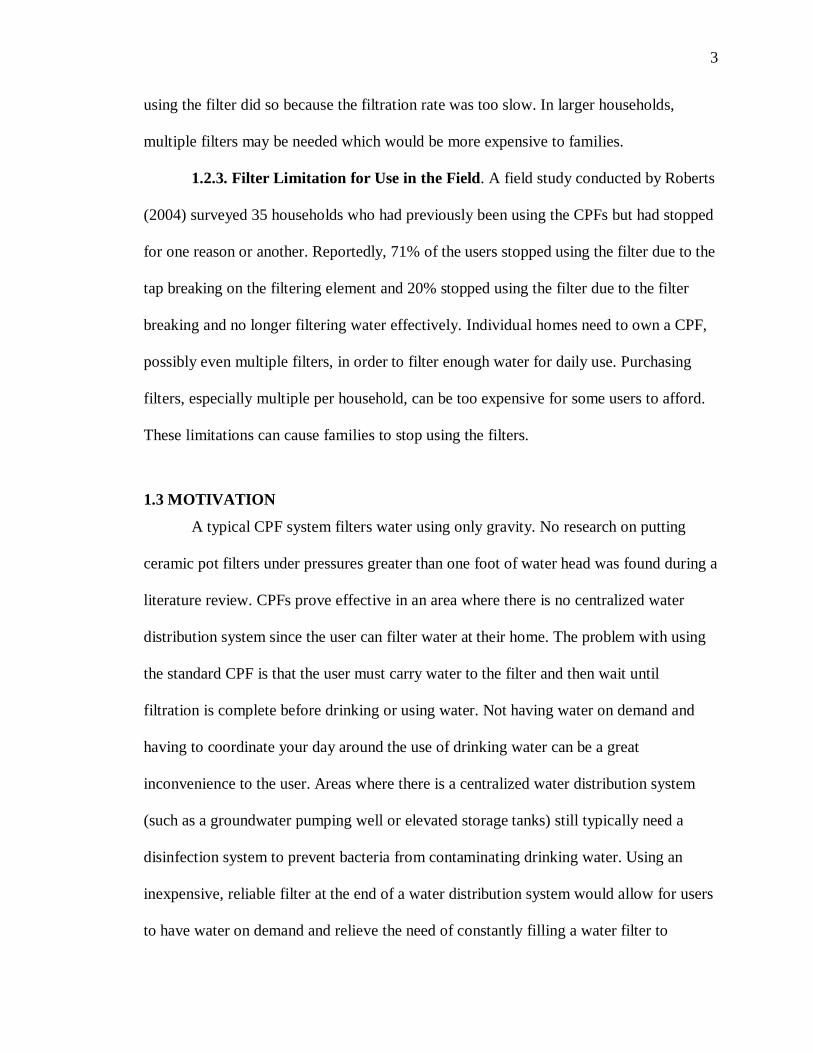
1.2.3. Filter Limitation for Use in the Field. A field study conducted by Roberts
(2004) surveyed 35 households who had previously been using the CPFs but had stopped
for one reason or another. Reportedly, 71% of the users stopped using the filter due to the
tap breaking on the filtering element and 20% stopped using the filter due to the filter
breaking and no longer filtering water effectively. Individual homes need to own a CPF,
possibly even multiple filters, in order to filter enough water for daily use. Purchasing
filters, especially multiple per household, can be too expensive for some users to afford.
These limitations can cause families to stop using the filters.
1.3 MOTIVATION
A typical CPF system filters water using only gravity. No research on putting
ceramic pot filters under pressures greater than one foot of water head was found during a
literature review. CPFs prove effective in an area where there is no centralized water
distribution system since the user can filter water at their home. The problem with using
the standard CPF is that the user must carry water to the filter and then wait until
filtration is complete before drinking or using water. Not having water on demand and
having to coordinate your day around the use of drinking water can be a great
inconvenience to the user. Areas where there is a centralized water distribution system
(such as a groundwater pumping well or elevated storage tanks) still typically need a
disinfection system to prevent bacteria from contaminating drinking water. Using an
inexpensive, reliable filter at the end of a water distribution system would allow for users
to have water on demand and relieve the need of constantly filling a water filter to
4
produce clean water. Cleaned water could also be pumped into storage units and users
could access the water whenever they would need throughout the day. Using a centralized
filter would also be less expensive for communities. Instead of every household
purchasing a filter for their home, a community would only need one filter to produce
clean water for the community on demand. Using a filter in an in-line system could also
help to prevent typical complaints users have of the filter being too fragile. Once the filter
is in place in the system, there would be no added risk of breaking the filter from refilling
or cleaning as with the standard CPF.
5
2. OBJECTIVES
2.1 PROBLEM STATEMENT
Ceramic pot filters can be problematic in terms of water production and
practicality. The use of ceramic pot filters could be greatly improved by being used in-
line with a pumping system to have an on demand, clean water system for developing
communities rather than separate filters for induvial families
2.2 STUDY OBJECTIVES
The objectives of this research were to:
• Produce filters to withstand pressure of a typical pumping system
• Develop an apparatus to house the filter and keep the filter under pressure
under typical pumping conditions
• Determine if disk filters are suitable to treat contaminated water by
measuring log reduction value (LRV)
• Analyze the relationship between flowrate and sawdust to clay ratio with
filter under pressure
• Analyze relationship between flowrate and thickness with filter under
pressure
• Analyze relationship between LRV and sawdust to clay ratio with filter
under pressure

6
• Analyze relationship between LRV and thickness with filter under
pressure
• Determine the optimum thickness and clay to sawdust ratio to effectively
treat contaminated water at the best flowrate

7
3. METHODS
3.1 USE OF CERAMIC POT FILTERS UNDER PRESSURE
All filters used in this study were manufactured on campus at the Missouri
University of Science and Technology using a synthetic clay body that was made to as
closely mimic the clay used at the filter factory near Antigua, Guatemala. The clay body
used in this study was developed in an earlier process by Hubbel et al. (2015). The
sawdust used in this study was collected from a local sawmill and was sieved through a
U.S. No. 10 sieve (2 millimeter [2mm]). The sawdust was combined with the clay in a
5:1, 6:1, and 7:1 clay to sawdust ratio by mass. Deionized water was mixed with the clay
mixture to achieve a desired consistency for spinning the clay in a mold.
3.1.1. CPF Manufactured in Bucket Stacked with Ceramic Disks. Ceramic pot
filters with disks stacked in them were first used as the filter element in this study. The
pot filters were made in plastic buckets that would eventually house the filters. The
buckets were lined in a thick paper to help absorb moisture. The clay mixture was placed
in the bucket and the bucket was put on the pottery wheel and spun. A jolly was used to
mold the clay into the shape of the ceramic pot filter. This method proved unsuccessful as
there was no easy way to separate the filter from the plastic bucket, the filters tended to
have cracks or creases from where the paper in the bucket came into contact with the
filter causing the filter to be fragile, and the clay dried unevenly causing cracking in the
filter.
3.1.2. CPFs Manufactured in Plaster Mold with Ceramic Disks. Following the
above method, a plaster mold was made of the bucket in order for the filter to dry evenly
and so that the clay would release from the mold. Figure 3.1 shows the plaster mold used
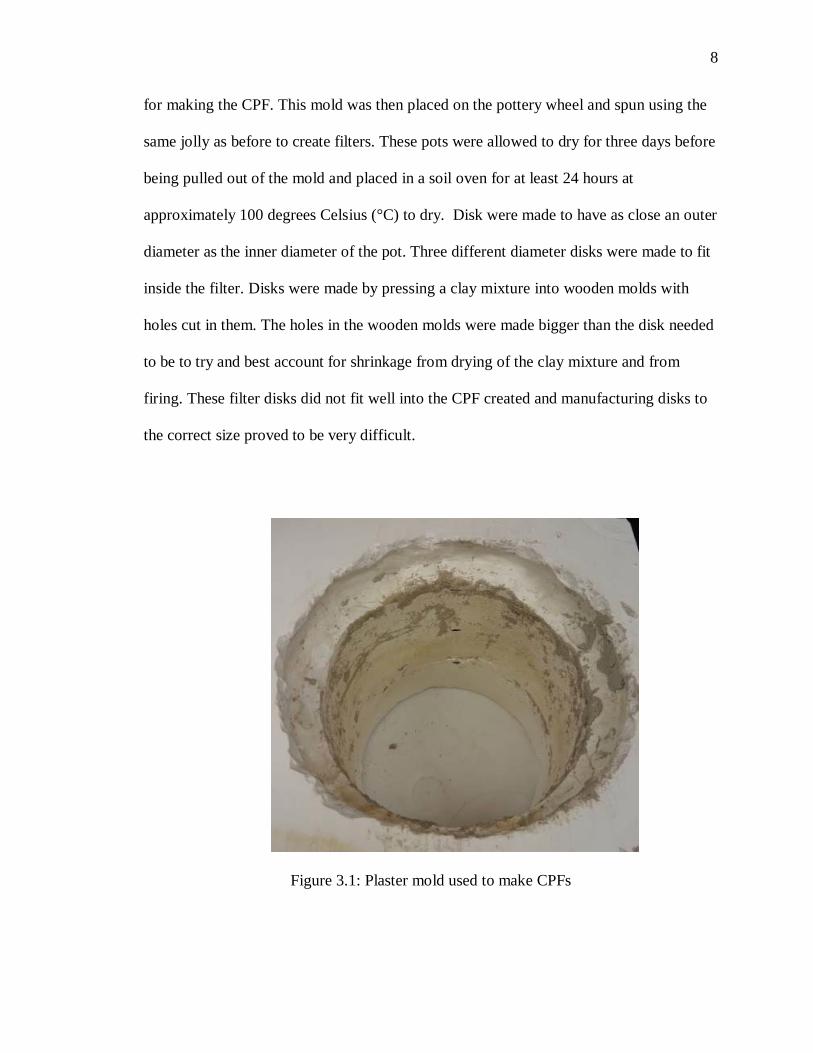
8
for making the CPF. This mold was then placed on the pottery wheel and spun using the
same jolly as before to create filters. These pots were allowed to dry for three days before
being pulled out of the mold and placed in a soil oven for at least 24 hours at
approximately 100 degrees Celsius (°C) to dry. Disk were made to have as close an outer
diameter as the inner diameter of the pot. Three different diameter disks were made to fit
inside the filter. Disks were made by pressing a clay mixture into wooden molds with
holes cut in them. The holes in the wooden molds were made bigger than the disk needed
to be to try and best account for shrinkage from drying of the clay mixture and from
firing. These filter disks did not fit well into the CPF created and manufacturing disks to
the correct size proved to be very difficult.
Figure 3.1: Plaster mold used to make CPFs
9
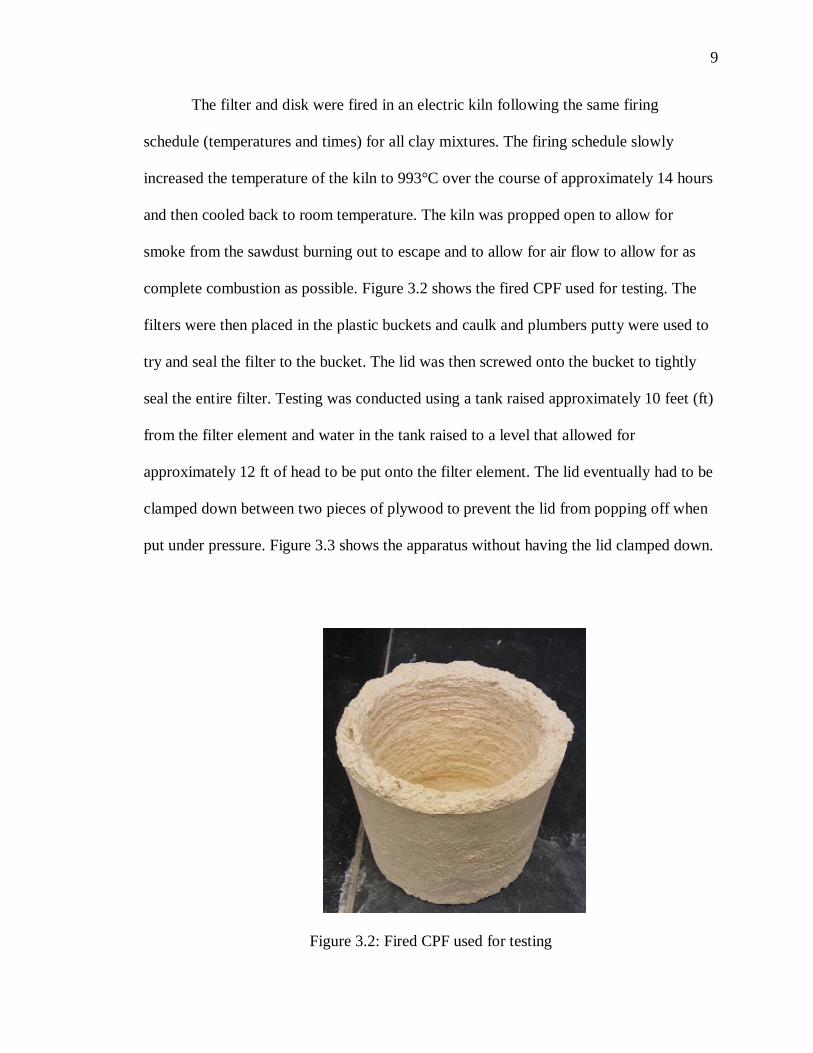
The filter and disk were fired in an electric kiln following the same firing
schedule (temperatures and times) for all clay mixtures. The firing schedule slowly
increased the temperature of the kiln to 993°C over the course of approximately 14 hours
and then cooled back to room temperature. The kiln was propped open to allow for
smoke from the sawdust burning out to escape and to allow for air flow to allow for as
complete combustion as possible. Figure 3.2 shows the fired CPF used for testing. The
filters were then placed in the plastic buckets and caulk and plumbers putty were used to
try and seal the filter to the bucket. The lid was then screwed onto the bucket to tightly
seal the entire filter. Testing was conducted using a tank raised approximately 10 feet (ft)
from the filter element and water in the tank raised to a level that allowed for
approximately 12 ft of head to be put onto the filter element. The lid eventually had to be
clamped down between two pieces of plywood to prevent the lid from popping off when
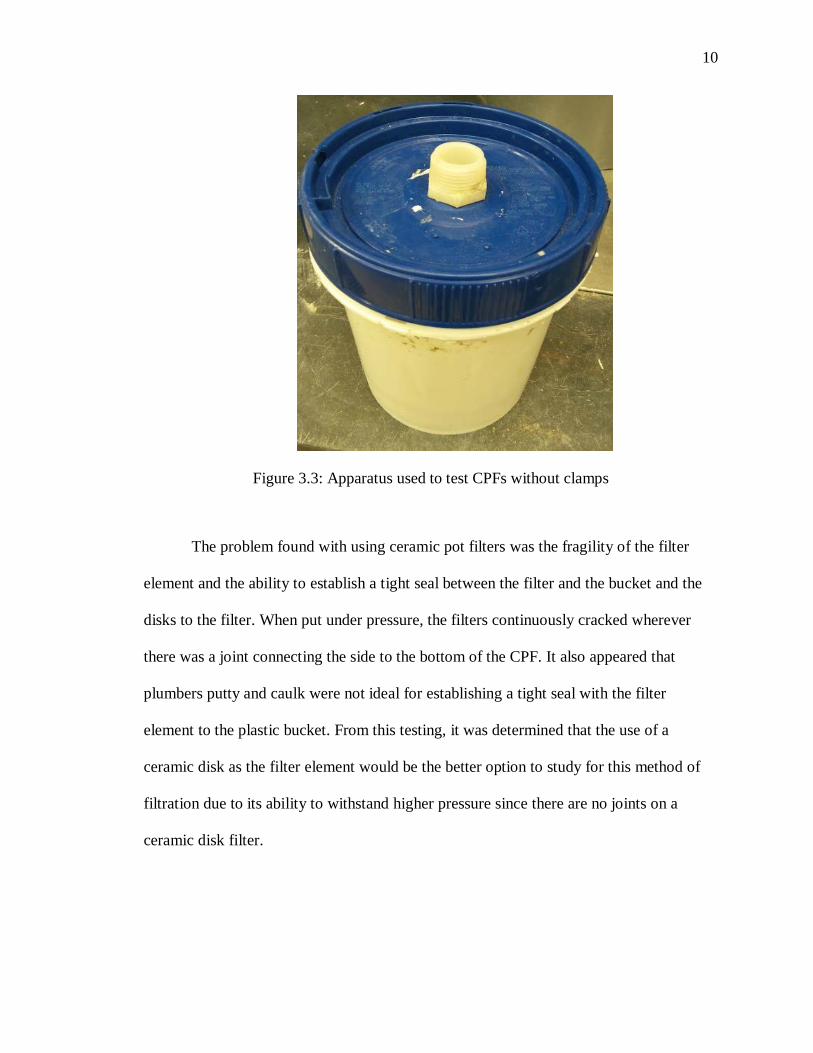
put under pressure. Figure 3.3 shows the apparatus without having the lid clamped down.
Figure 3.2: Fired CPF used for testing
10
Figure 3.3: Apparatus used to test CPFs without clamps
The problem found with using ceramic pot filters was the fragility of the filter
element and the ability to establish a tight seal between the filter and the bucket and the
disks to the filter. When put under pressure, the filters continuously cracked wherever
there was a joint connecting the side to the bottom of the CPF. It also appeared that
plumbers putty and caulk were not ideal for establishing a tight seal with the filter
element to the plastic bucket. From this testing, it was determined that the use of a
ceramic disk as the filter element would be the better option to study for this method of
filtration due to its ability to withstand higher pressure since there are no joints on a
ceramic disk filter.
11
3.2 USE OF CERAMIC DISK FILTERS UNDER PRESSURE
Ceramic disks were manufactured using the same clay mixture and sawdust ratios
as the ceramic pot filters were. The mixture was made to be drier than the mixture used to
make the ceramic pot filters to allow for better compaction. The authors felt that
compaction was very important to allow for the filters to be strong enough to withstand
the pressure that a pump would put on them. Originally, the filters were pressed in a 9
inch (in). by 9 in. wooden box. The clay mixture was compacted by placing the clay
mixture in a 9 in. by 9 in. piece of plywood on top and pressing down by hand with
approximately 200 pounds of force (lb) for one minute. The wooden mold was removed
after approximately an hour. These mixtures were dried and placed in the electric kiln
using the same times and firing schedule as the previously fired ceramic pot filters. The
fired filter square was then placed in the drill press and a 6.63 in hole saw with the pilot
bit removed was used to drill a circular disk filter.
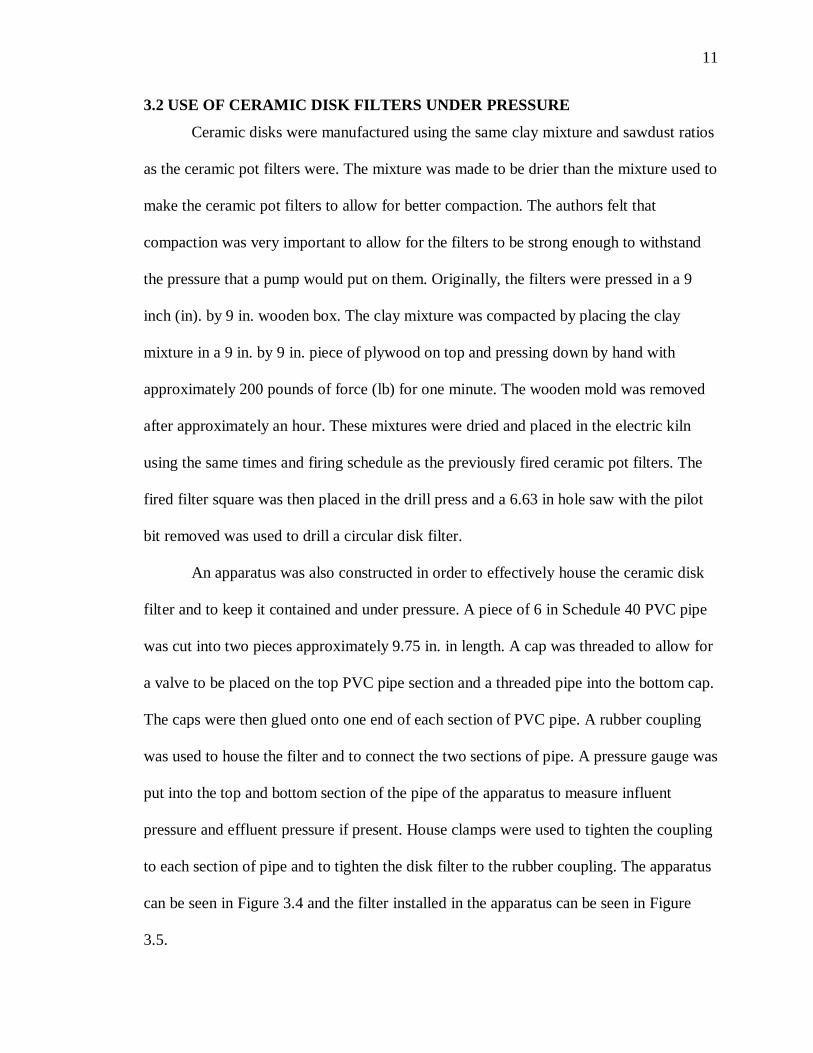
An apparatus was also constructed in order to effectively house the ceramic disk
filter and to keep it contained and under pressure. A piece of 6 in Schedule 40 PVC pipe
was cut into two pieces approximately 9.75 in. in length. A cap was threaded to allow for
a valve to be placed on the top PVC pipe section and a threaded pipe into the bottom cap.
The caps were then glued onto one end of each section of PVC pipe. A rubber coupling
was used to house the filter and to connect the two sections of pipe. A pressure gauge was
put into the top and bottom section of the pipe of the apparatus to measure influent
pressure and effluent pressure if present. House clamps were used to tighten the coupling
to each section of pipe and to tighten the disk filter to the rubber coupling. The apparatus
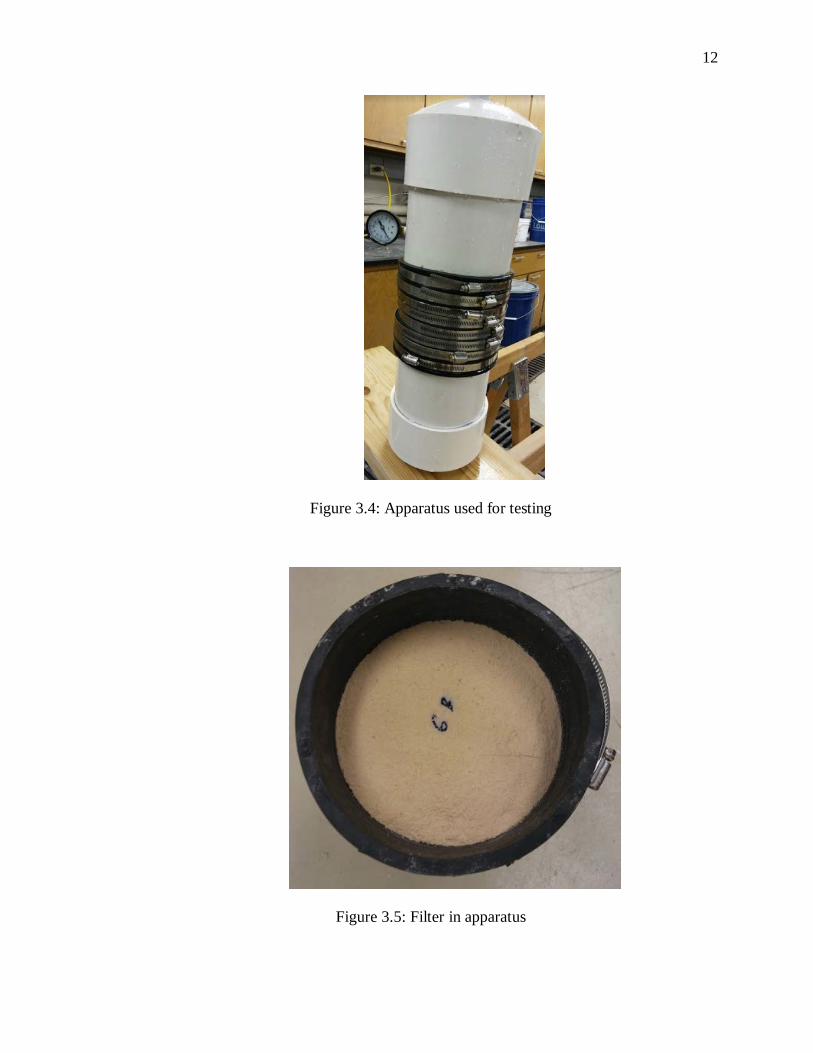
can be seen in Figure 3.4 and the filter installed in the apparatus can be seen in Figure
3.5.
12
Figure 3.4: Apparatus used for testing
Figure 3.5: Filter in apparatus
13
The filters were put under relatively low pressure (approximately 5 pounds per
square inch [psi]) to determine if the apparatus was suitable for keeping a tight seal to the
filter and to determine if the filters were able to remove microbiological contamination
under low pressure conditions. The apparatus was connected to the same tank elevated
approximately 10 ft to provide approximately 10 ft of hydraulic head to the filter in the
Subsurface Hydrology Lab at Missouri S&T. The findings showed that these filters were
able to remove microbes and produce a higher flowrate than the typical 1-2 L/hr of a
ceramic pot filter. During testing though, filters seemed to be more fragile than expected.
When tightening the filter to the rubber coupling, the disk would tend to chip around the
sides. Testing moved forward to testing filters under a higher pressure. A large tank
supplied water to a 1 horsepower (hp) pump and was connected to the apparatus.
Flowrate testing continued on the disk filters manufactured. After a few tests, two
problems arose with the filters and apparatus. First, the top section of pipe would pop out
of the rubber coupling under around 10 psi. To combat this problem, more hose clamps
were added to the apparatus as well as the top section of the apparatus being glued to the
rubber coupling. This approach appears to be a good solution to the problem. The second
and bigger problem was the disk filters continuously breaking under pressures varying
between 10-15 psi, while some disks failed at pressures as low as 5 psi. It was concluded
that this problem was due to the filters not being pressed enough during manufacturing.
To press the filters in a more effective and consistent way and to allow for more
pressure to be put on the mixture during manufacturing, a 12-ton press was purchased for
use. The press was retrofitted to be able to press an 8 in. by 8 in. square clay mixture at
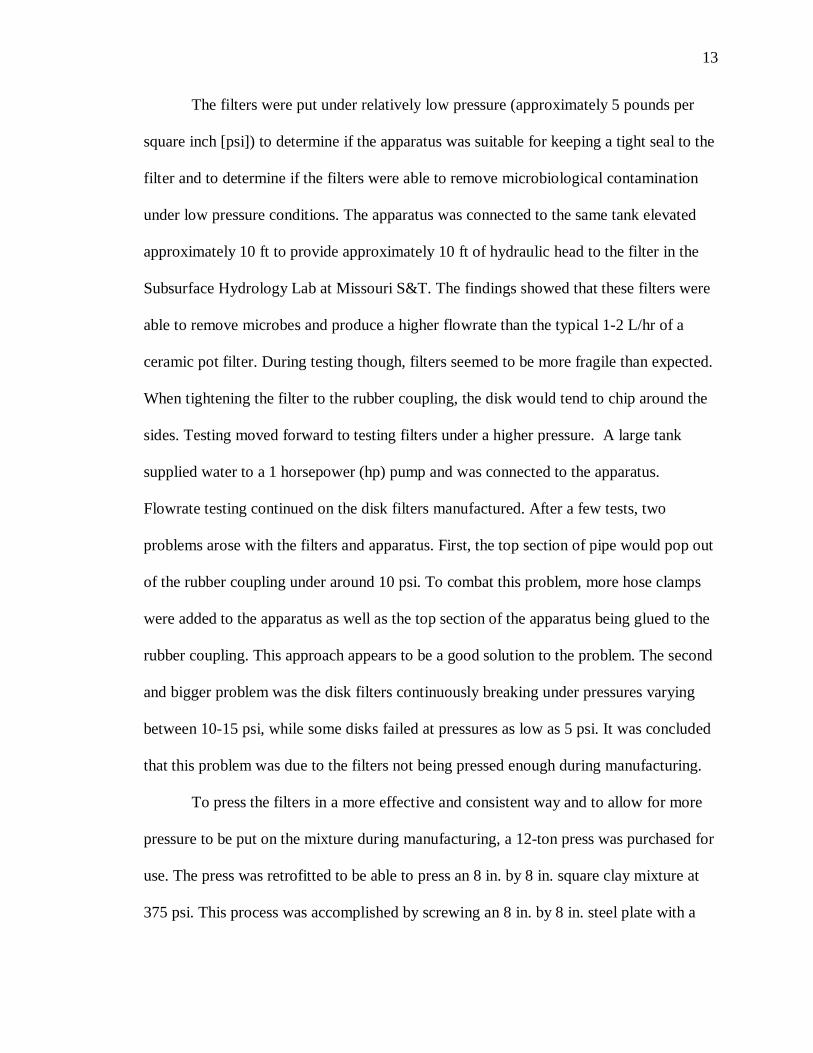
375 psi. This process was accomplished by screwing an 8 in. by 8 in. steel plate with a
14
thickness of 0.5 in. into the press and by making a steel table to press the filter mixture on
to. The press setup can be seen in Figure 3.6. Hollow steel tubes were also welded
together to make a square mold slightly larger than the steel pressing plate to effectively
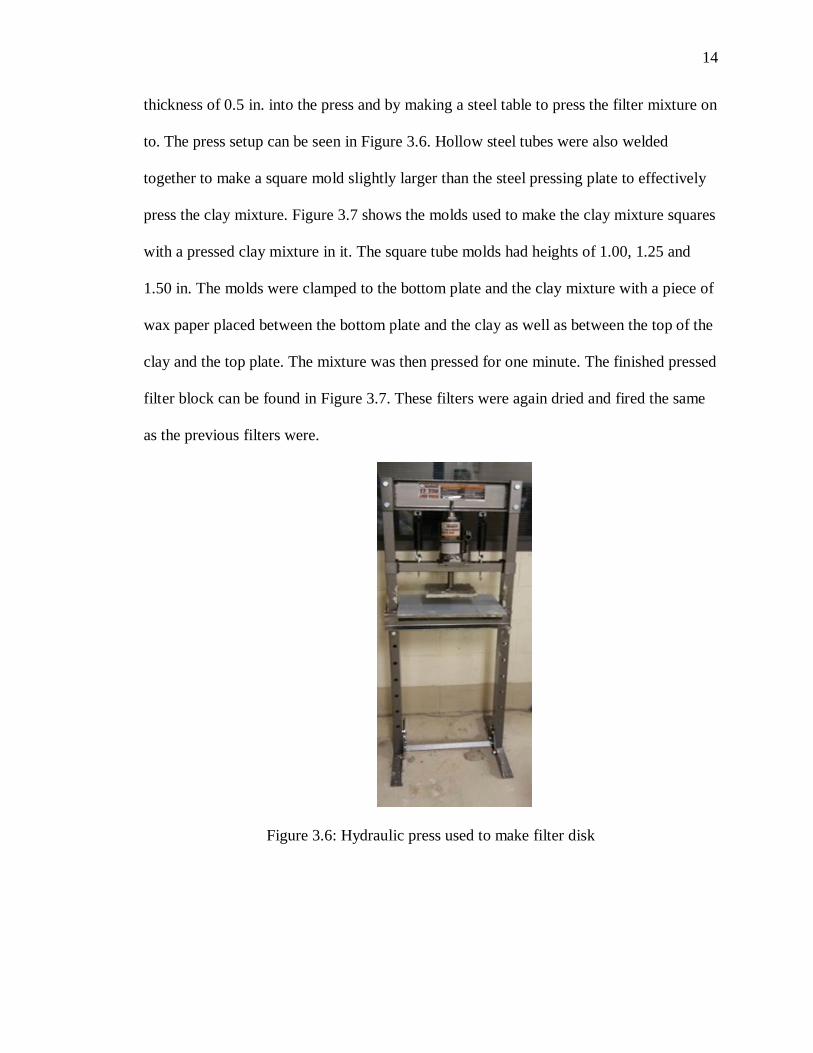
press the clay mixture. Figure 3.7 shows the molds used to make the clay mixture squares
with a pressed clay mixture in it. The square tube molds had heights of 1.00, 1.25 and
1.50 in. The molds were clamped to the bottom plate and the clay mixture with a piece of
wax paper placed between the bottom plate and the clay as well as between the top of the
clay and the top plate. The mixture was then pressed for one minute. The finished pressed
filter block can be found in Figure 3.7. These filters were again dried and fired the same
as the previous filters were.
Figure 3.6: Hydraulic press used to make filter disk
15
Figure 3.7: Pressed filter block before firing
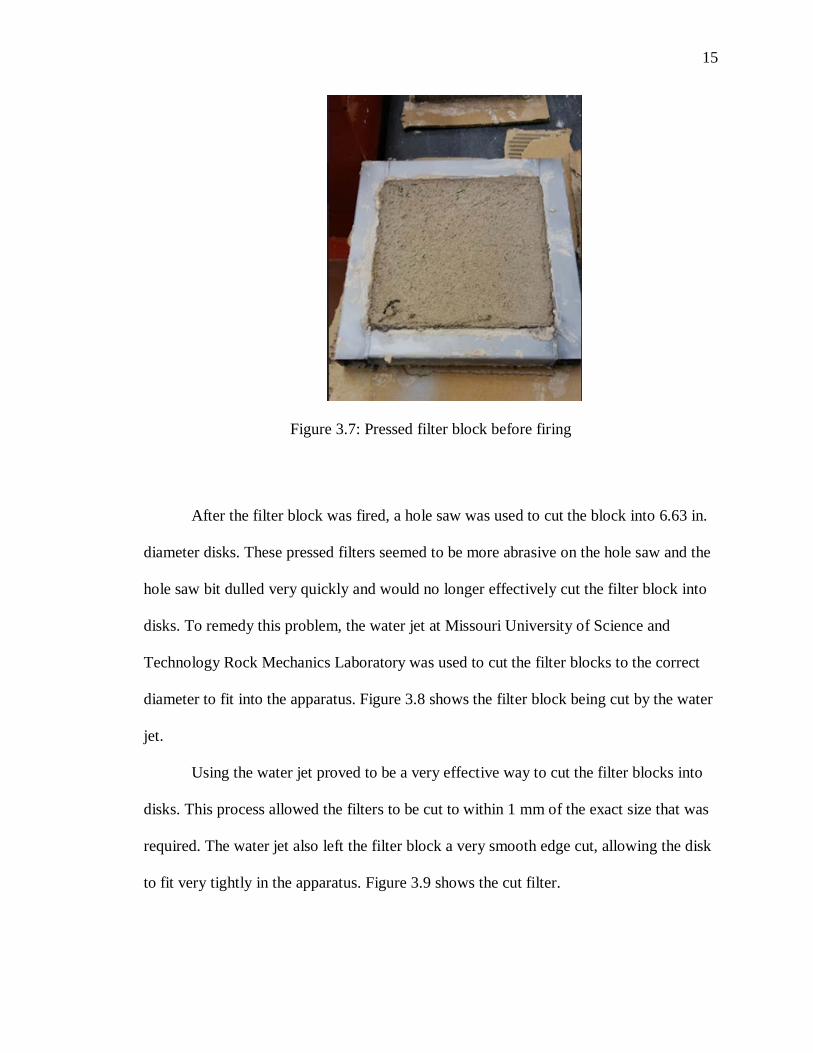
After the filter block was fired, a hole saw was used to cut the block into 6.63 in.
diameter disks. These pressed filters seemed to be more abrasive on the hole saw and the
hole saw bit dulled very quickly and would no longer effectively cut the filter block into
disks. To remedy this problem, the water jet at Missouri University of Science and
Technology Rock Mechanics Laboratory was used to cut the filter blocks to the correct
diameter to fit into the apparatus. Figure 3.8 shows the filter block being cut by the water
jet.
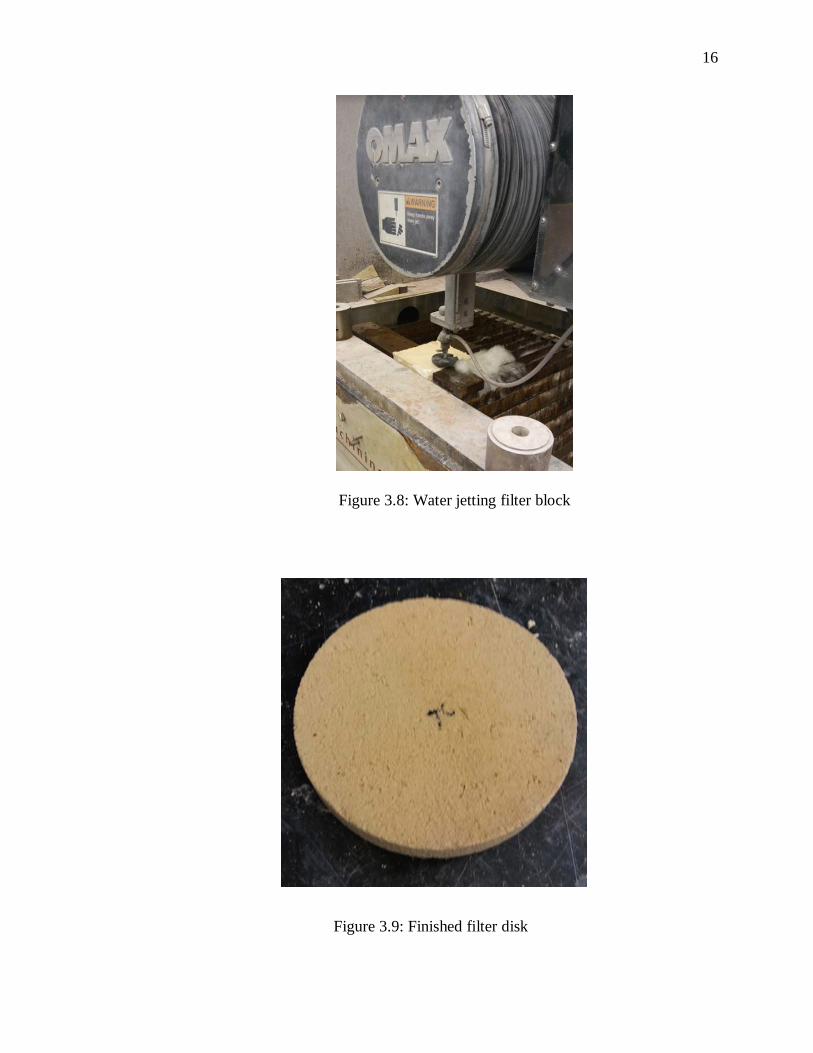
Using the water jet proved to be a very effective way to cut the filter blocks into
disks. This process allowed the filters to be cut to within 1 mm of the exact size that was
required. The water jet also left the filter block a very smooth edge cut, allowing the disk
to fit very tightly in the apparatus. Figure 3.9 shows the cut filter.
16
Figure 3.8: Water jetting filter block
Figure 3.9: Finished filter disk
17
3.3 FLOWRATE AND MICROBIOLOGICAL TESTING
Filters were placed in the apparatus constructed and tightened using hose clamps.
A torque wrench was used first to tighten a solid wooden disk to determine the amount of
torque needed to create a tight seal between the rubber coupling and the filter disk. The
amount of torque needed was determined to be 25 inch-pounds (in-lbs). This amount of
torque was applied to all the filter disks during testing. Before testing, filters were
dechlorinated and water filtered through was tested with a Hach Total Chlorine field kit
(CN-66T) to make sure no chlorine was left in the filters. If residual chlorine was present
in the filters, filters were again dechlorinated with sodium thiosulfate capsules until there
was no residual chlorine detected by the Hach Chlorine Test. A presence/absence test was
performed using Colilert before microbiological testing was performed to ensure no
contaminants were present before testing.
Flowrate and microbiological tests were performed in hour long tests. Colilert and
Quani-Tray 2000 was used for testing microbiological effectiveness. Log reduction
values (LRV) were determined for each filter for each test. LRV was calculated by taking
the difference in the log10 of the influent bacteria concentration (most probable number
[MPN]/100mL) and the log10 of the effluent bacteria concentration from the filter
(MPN/100mL). To determine flowrate, water was allowed to filter through the filter in
one hour test increments and was collected in a 5-gallon bucket. Water was measured in a
graduated cylinder to determine flowrate in L/hr. Tests were conducted at pressures of 5
psi first. Filters that showed a good log reduction value (greater than 2) were tested at 10
psi using the same procedure as the filters tested at 5 psi.
18
3.4 PORE ANALYSIS AND INCOMPLETE BURNOUT ANALYSIS
Incomplete burnout was observed in some disks, especially those with thickness
of 1.5 inches. It was speculated that this layer of incomplete burnout could be
contributing to inconsistencies seen in the data, specifically low LRV in filters with the
greatest thickness. To get a better picture of this in the filter element, the Leica S8APO
digital stereoscope was used. Filter elements were cut into thin strips to better analyze the
different layers observed. Analysis was performed to determine the amount of pores per
area of a section that was completely fired compared to a section that showed incomplete
combustion of a filter with the same clay to sawdust ratio.
19
PAPER
Use of Ceramic Pot Filter (CPF) Technology Under Pressure in an In-Line Pumping
System
Travis D. Gardner, E.I.1 and Joe D. Guggenberger, Ph.D., P.E.2
1Graduate Student of Geological Engineering: Missouri University of Science and
Technology; 129 McNutt Hall, 1400 N Bishop Ave, Rolla, MO 65409; email:
2Assistant Professor of Geological Engineering; Missouri University of Science and
Technology; 129 McNutt Hall, 1400 N Bishop Ave, Rolla, MO 65409
ABSTRACT
Ceramic pot filters (CPFs) have been proven to be an effective point of use water
treatment device in developing nations due to its relatively low cost and effectiveness.
CPFs are gravity fed and used in homes to filter water in batches. Water production is a
major limiting factor to a CPF’s lifetime and acceptability. Directly connecting a CPF to
an in-line pumping system or a system with an elevated storage tank would allow filters
to be used for constant water treatment at increased pressures, significantly increasing the
quantity of treated water. Due to the fragility of typical ceramic filters, ceramic disks
were manufactured for testing in a specially designed housing apparatus, and filters of
varying thicknesses and porosities were manufactured to an appropriate diameter to fit
tightly. Flowrate and microbiological removal efficacy were determined for each filter
over the testing period at various pressures. These filters proved effective at removing
total and fecal coliforms at pressures less than 10 pounds per square inch. The optimum
20
filter disk design proved to have a thickness of 1.25 inches and clay to sawdust ratio of
6:1 by mass. Filters proved to not be effective if flowrates were above 5 liters/hour.
Keywords: ceramic disk filter, ceramic filter under pressure, water filtration
INTRODUCTION
Access to clean drinking water in developing nations continues to be an important
concern for human health. An estimated 748 million people lack access to improved
water supplies (WHO and UNICEF 2014). It is estimated that hundreds of millions of
that population drinks water contaminated during collection, transport, and storage
(Clasen and Bastable 2003). The United Nations Children Fund (UNICEF) (2008) states
that many improved water sources in developing nations do not provide safe water due to
microbiological contamination from water sources with inadequate fecal contamination
protection. A drinking water source can be improved by the use of a centralized
community system or by a point of use (POU) system. POU systems are designed to
provide adequate water for one household and can be effective for rural communities
with no centralized improved water source. A very effective household water treatment
device is the ceramic pot filter (CPF) (Hunter 2009). CPFs are a flower-pot shaped filter
made from mixing clay, water, and sawdust and pressed to shape typically using a
hydraulic press and mold. The pots are typically coated in colloidal silver that acts as a
disinfectant. These pots are fired in a kiln, removing most of the sawdust and leaving
pores through which water can flow. The filter is housed in a 3.8 liter (L) bucket with a
lid and filtered water collects in the bottom of the bucket. It can then be poured out using
a spigot at the bottom of the bucket when needed. The main bacterial removal
21
mechanisms for CPFs, as identified by Van Halem et al. (2007), are exclusion by pore
size, exclusion by effective pore size (tortuosity), and deactivation of bacteria by contact
with silver.
For communities with a centralized water source, this may be an inconvenient
way to filter water and some households may not be able to afford a CPF. CPFs typically
have a flowrate of 1-2 liters per hour (L/hr) for quality control standards when
manufactured (Lantagne et al. 2010). CPFs in households also filter water in batches and
must be filled multiple times per day, depending on the number of people in a household,
to produce enough water for the household. A more effective method of producing
enough clean water for a household would be to put the filter in-line with a pumping
system or elevated storage tank so that the user would have access to safe drinking water
on demand and allow an entire community to have clean drinking water. This would help
communities to afford using ceramic filters and help prevent filters from being broken
during filling and cleaning since the filter will stay contained in an apparatus. CPFs are a
good candidate for this type of process in developing countries due to their low cost,
material availability, and relatively simple manufacturing requirements. CPFs also have
been proven to effectively remove harmful bacteria in water, such as total and fecal
coliforms, as documented by van Halem et al. (2007), Brown and Sobsey (2010),
Kallman et al. (2011), and others.
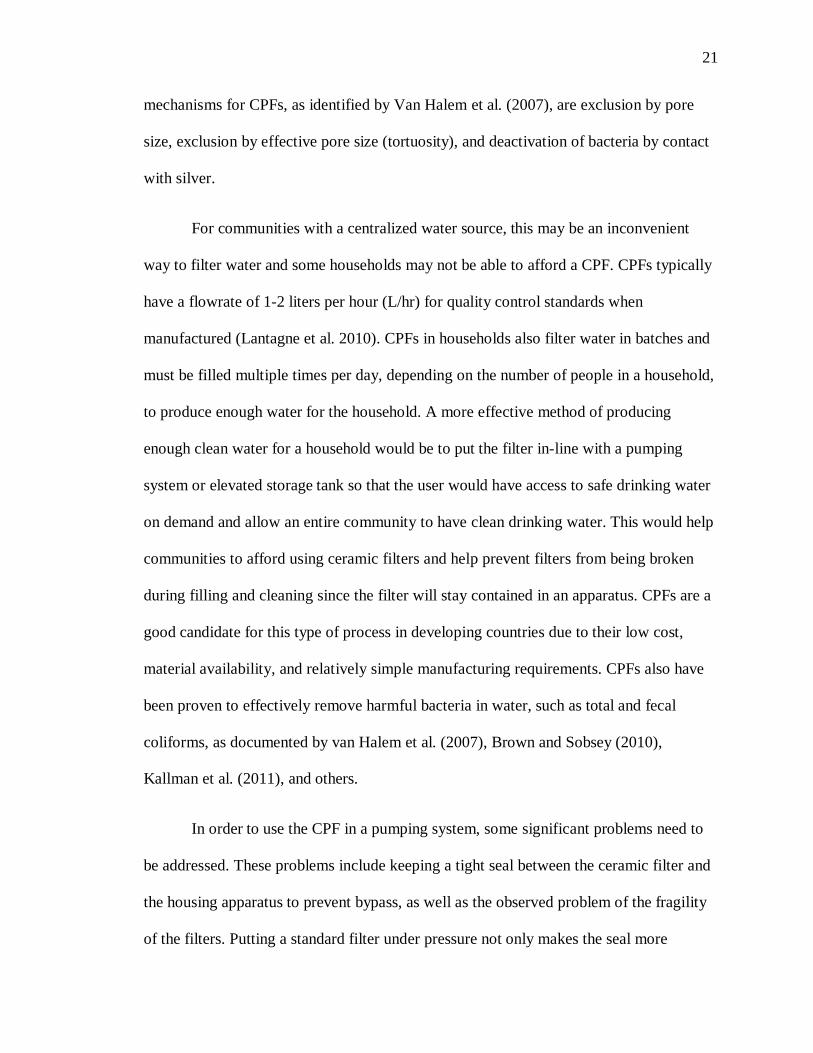
In order to use the CPF in a pumping system, some significant problems need to
be addressed. These problems include keeping a tight seal between the ceramic filter and
the housing apparatus to prevent bypass, as well as the observed problem of the fragility
of the filters. Putting a standard filter under pressure not only makes the seal more
22
difficult to maintain, it also makes the filter element easier to break since the edges of the
filter are weak points and therefore more prone to failure. Due to this, a ceramic disk was
developed as the filter element for this testing.
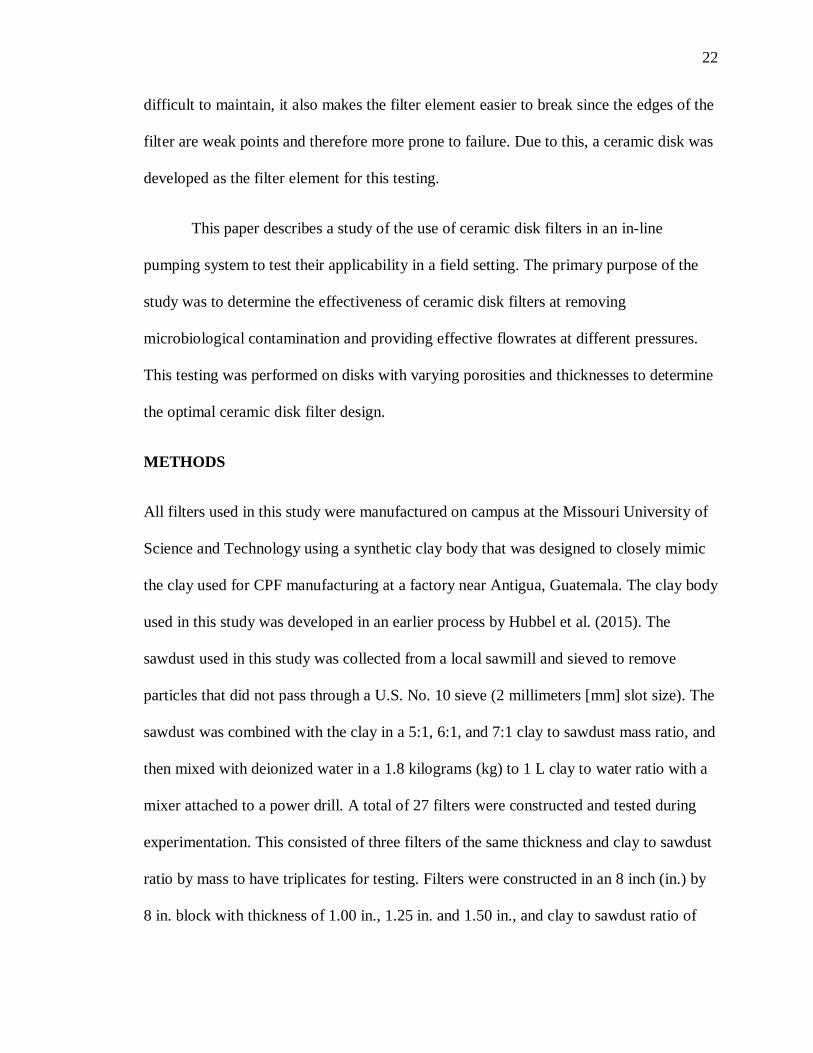
This paper describes a study of the use of ceramic disk filters in an in-line
pumping system to test their applicability in a field setting. The primary purpose of the
study was to determine the effectiveness of ceramic disk filters at removing
microbiological contamination and providing effective flowrates at different pressures.
This testing was performed on disks with varying porosities and thicknesses to determine
the optimal ceramic disk filter design.
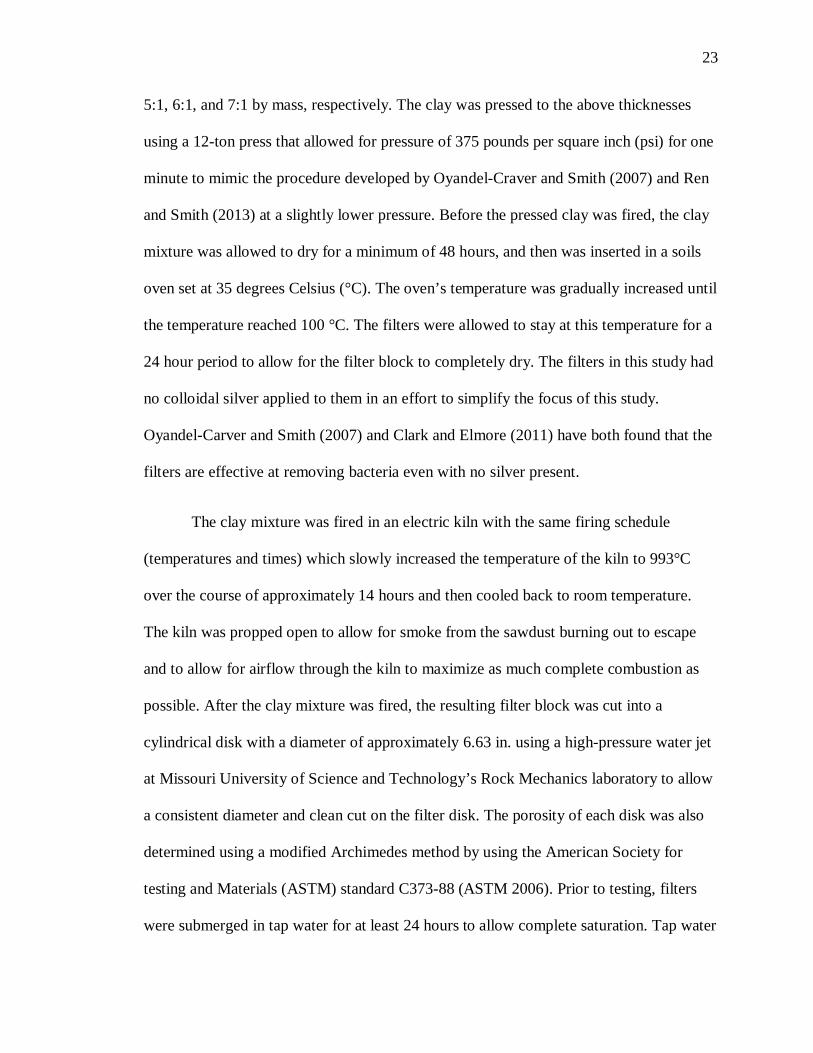
METHODS
All filters used in this study were manufactured on campus at the Missouri University of
Science and Technology using a synthetic clay body that was designed to closely mimic
the clay used for CPF manufacturing at a factory near Antigua, Guatemala. The clay body
used in this study was developed in an earlier process by Hubbel et al. (2015). The
sawdust used in this study was collected from a local sawmill and sieved to remove
particles that did not pass through a U.S. No. 10 sieve (2 millimeters [mm] slot size). The
sawdust was combined with the clay in a 5:1, 6:1, and 7:1 clay to sawdust mass ratio, and
then mixed with deionized water in a 1.8 kilograms (kg) to 1 L clay to water ratio with a
mixer attached to a power drill. A total of 27 filters were constructed and tested during
experimentation. This consisted of three filters of the same thickness and clay to sawdust
ratio by mass to have triplicates for testing. Filters were constructed in an 8 inch (in.) by
8 in. block with thickness of 1.00 in., 1.25 in. and 1.50 in., and clay to sawdust ratio of
23
5:1, 6:1, and 7:1 by mass, respectively. The clay was pressed to the above thicknesses
using a 12-ton press that allowed for pressure of 375 pounds per square inch (psi) for one
minute to mimic the procedure developed by Oyandel-Craver and Smith (2007) and Ren
and Smith (2013) at a slightly lower pressure. Before the pressed clay was fired, the clay
mixture was allowed to dry for a minimum of 48 hours, and then was inserted in a soils
oven set at 35 degrees Celsius (°C). The oven’s temperature was gradually increased until
the temperature reached 100 °C. The filters were allowed to stay at this temperature for a
24 hour period to allow for the filter block to completely dry. The filters in this study had
no colloidal silver applied to them in an effort to simplify the focus of this study.
Oyandel-Carver and Smith (2007) and Clark and Elmore (2011) have both found that the
filters are effective at removing bacteria even with no silver present.
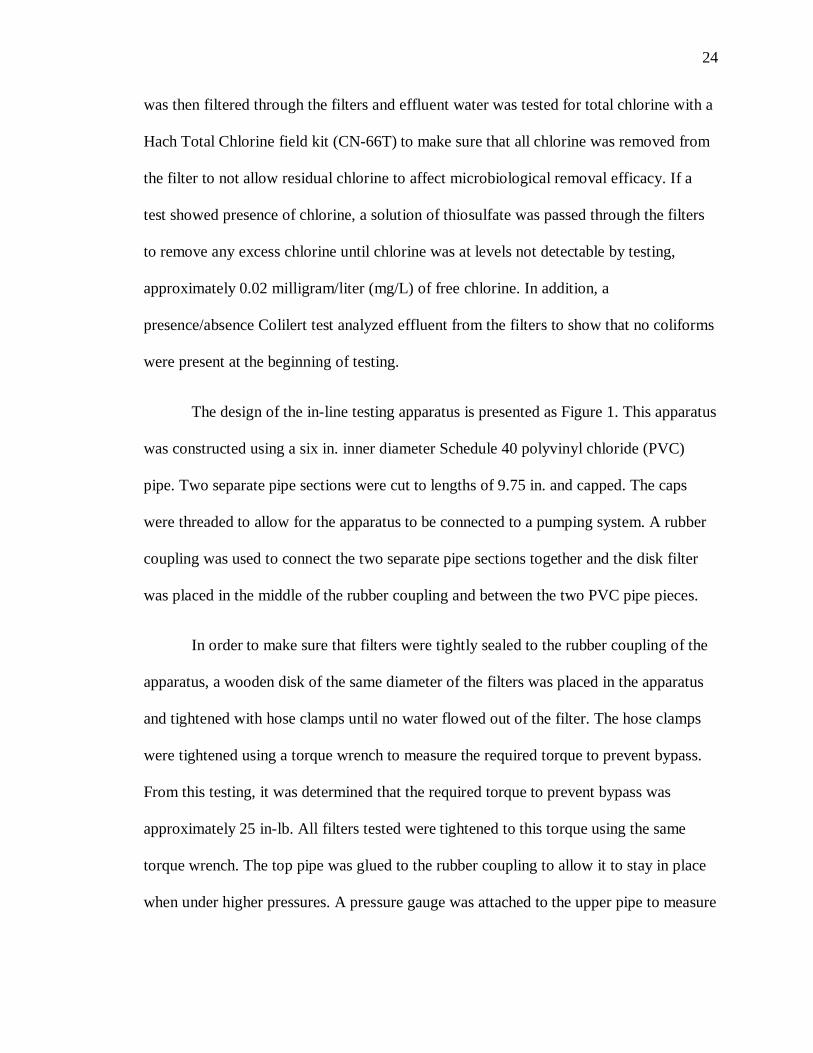
The clay mixture was fired in an electric kiln with the same firing schedule
(temperatures and times) which slowly increased the temperature of the kiln to 993°C
over the course of approximately 14 hours and then cooled back to room temperature.
The kiln was propped open to allow for smoke from the sawdust burning out to escape
and to allow for airflow through the kiln to maximize as much complete combustion as
possible. After the clay mixture was fired, the resulting filter block was cut into a
cylindrical disk with a diameter of approximately 6.63 in. using a high-pressure water jet
at Missouri University of Science and Technology’s Rock Mechanics laboratory to allow
a consistent diameter and clean cut on the filter disk. The porosity of each disk was also
determined using a modified Archimedes method by using the American Society for
testing and Materials (ASTM) standard C373-88 (ASTM 2006). Prior to testing, filters
were submerged in tap water for at least 24 hours to allow complete saturation. Tap water
24
was then filtered through the filters and effluent water was tested for total chlorine with a
Hach Total Chlorine field kit (CN-66T) to make sure that all chlorine was removed from
the filter to not allow residual chlorine to affect microbiological removal efficacy. If a
test showed presence of chlorine, a solution of thiosulfate was passed through the filters
to remove any excess chlorine until chlorine was at levels not detectable by testing,
approximately 0.02 milligram/liter (mg/L) of free chlorine. In addition, a
presence/absence Colilert test analyzed effluent from the filters to show that no coliforms
were present at the beginning of testing.
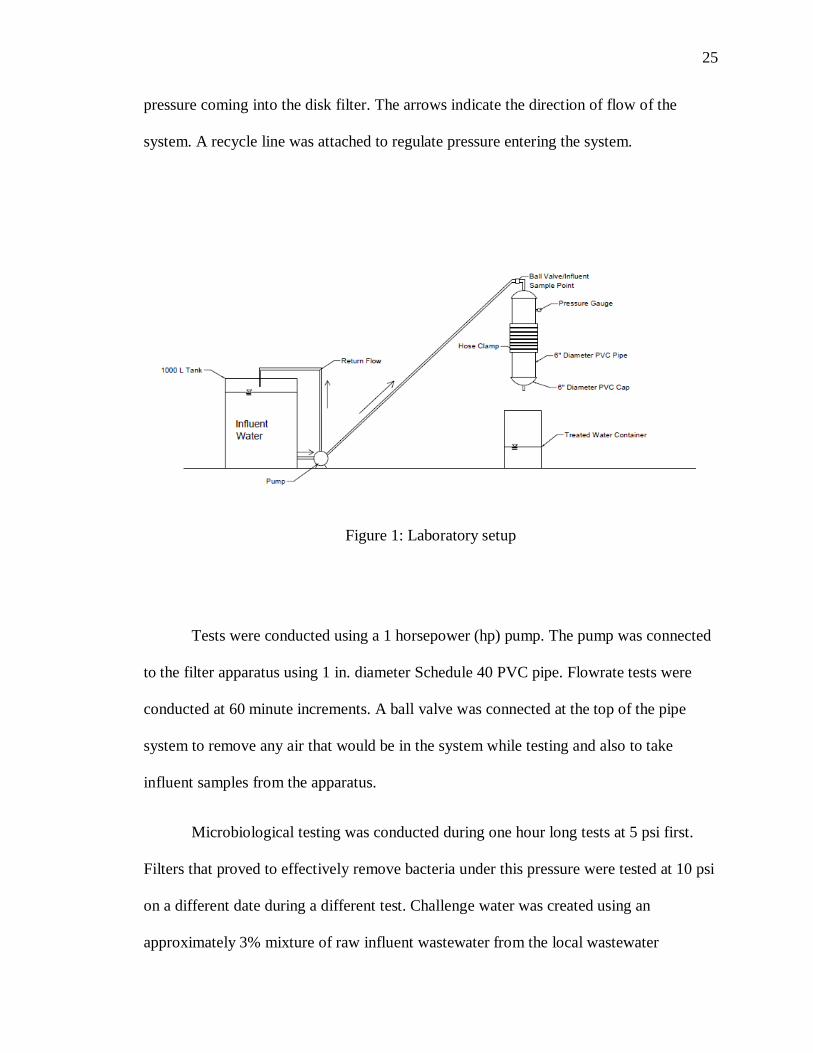
The design of the in-line testing apparatus is presented as Figure 1. This apparatus
was constructed using a six in. inner diameter Schedule 40 polyvinyl chloride (PVC)
pipe. Two separate pipe sections were cut to lengths of 9.75 in. and capped. The caps
were threaded to allow for the apparatus to be connected to a pumping system. A rubber
coupling was used to connect the two separate pipe sections together and the disk filter
was placed in the middle of the rubber coupling and between the two PVC pipe pieces.
In order to make sure that filters were tightly sealed to the rubber coupling of the
apparatus, a wooden disk of the same diameter of the filters was placed in the apparatus
and tightened with hose clamps until no water flowed out of the filter. The hose clamps
were tightened using a torque wrench to measure the required torque to prevent bypass.
From this testing, it was determined that the required torque to prevent bypass was
approximately 25 in-lb. All filters tested were tightened to this torque using the same
torque wrench. The top pipe was glued to the rubber coupling to allow it to stay in place
when under higher pressures. A pressure gauge was attached to the upper pipe to measure
25
pressure coming into the disk filter. The arrows indicate the direction of flow of the
system. A recycle line was attached to regulate pressure entering the system.
Figure 1: Laboratory setup
Tests were conducted using a 1 horsepower (hp) pump. The pump was connected
to the filter apparatus using 1 in. diameter Schedule 40 PVC pipe. Flowrate tests were
conducted at 60 minute increments. A ball valve was connected at the top of the pipe
system to remove any air that would be in the system while testing and also to take
influent samples from the apparatus.
Microbiological testing was conducted during one hour long tests at 5 psi first.
Filters that proved to effectively remove bacteria under this pressure were tested at 10 psi
on a different date during a different test. Challenge water was created using an
approximately 3% mixture of raw influent wastewater from the local wastewater

26
treatment plant and tap water to try and cause failure in the filters. By causing failure in
the filters, a logarithmic reduction value (LRV) can be calculated for each filter. LRV is a
typically used value to measure bacterial removal efficacy in point of use (POU) water
treatment systems (Van Halem et al. 2007; Clark and Elmore 2011). Filters were allowed
to filter water for an hour prior to testing. Microbiological testing was conducted using
Colilert and the Colilert Quani-Tray 2000 to determine the presence of total coliforms
and fecal coliforms in the filter effluent.
The non-parametric two-sample Wilcoxon rank sum test, also known as the
Mann-Whitney test, was used to evaluate the relationships between flowrate, porosity,
thickness, and clay to sawdust ratio to LRV. The Mann-Whitney test was performed
since none of the data fit a normal distribution based on using Minitab’s distribution
analysis. A p-value that is less than one minus the confidence interval results in rejecting
the null hypothesis. The confidence interval used for this testing was 95%, meaning a p-
value of greater than 0.05 indicates a relationship between the two variables tested.
RESULTS AND DISCUSSION
The flowrate and LRV from each test for each individual filter were determined and a
summary of these values for each filter based on thickness and clay to sawdust ratio by
mass can be found in Table 1. LRV was calculated by taking the log10 of the influent
bacteria concentration (most probable number [MPN]/100mL) divided by the log10 of the
effluent bacteria concentration from the filter (MPN/100mL). According to WHO (2011),
the performance target for a household water treatment system for bacteria must be an
LRV of at least 2. Therefore, filters with LRV of 2 or greater were considered effective at
27
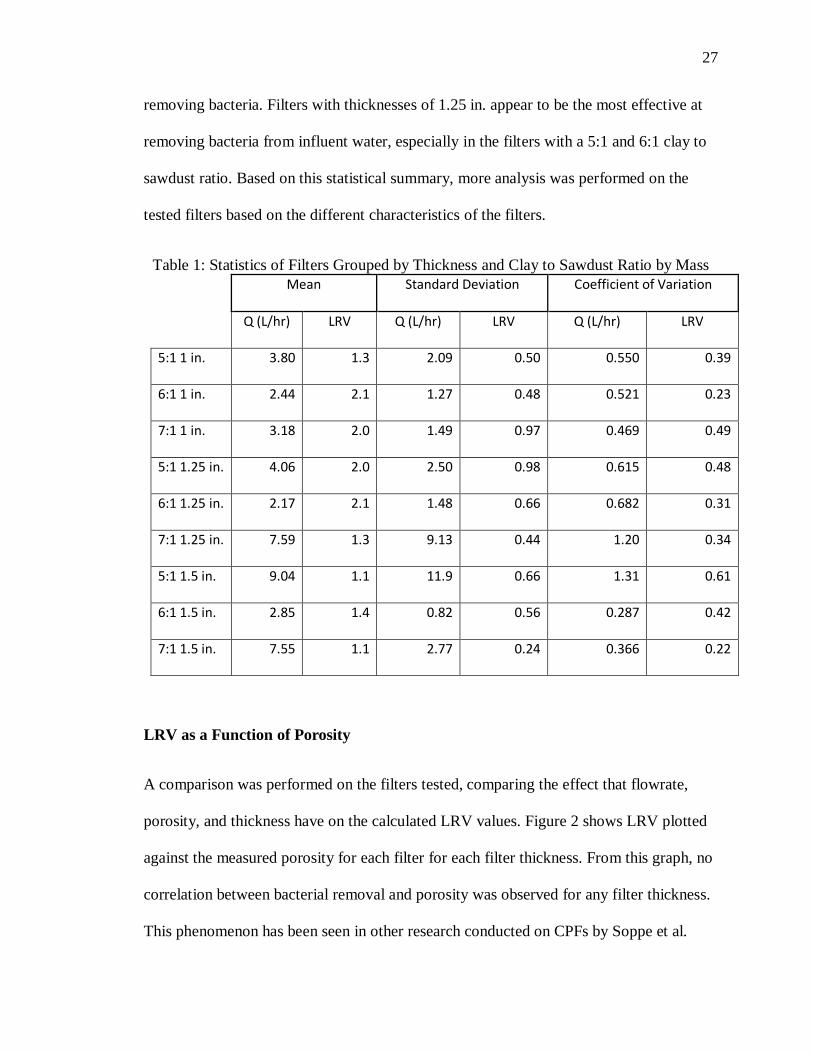
removing bacteria. Filters with thicknesses of 1.25 in. appear to be the most effective at
removing bacteria from influent water, especially in the filters with a 5:1 and 6:1 clay to
sawdust ratio. Based on this statistical summary, more analysis was performed on the
tested filters based on the different characteristics of the filters.
Table 1: Statistics of Filters Grouped by Thickness and Clay to Sawdust Ratio by Mass
Mean Standard Deviation Coefficient of Variation
Q (L/hr) LRV Q (L/hr) LRV Q (L/hr) LRV
5:1 1 in. 3.80 1.3 2.09 0.50 0.550 0.39
6:1 1 in. 2.44 2.1 1.27 0.48 0.521 0.23
7:1 1 in. 3.18 2.0 1.49 0.97 0.469 0.49
5:1 1.25 in. 4.06 2.0 2.50 0.98 0.615 0.48
6:1 1.25 in. 2.17 2.1 1.48 0.66 0.682 0.31
7:1 1.25 in. 7.59 1.3 9.13 0.44 1.20 0.34
5:1 1.5 in. 9.04 1.1 11.9 0.66 1.31 0.61
6:1 1.5 in. 2.85 1.4 0.82 0.56 0.287 0.42
7:1 1.5 in. 7.55 1.1 2.77 0.24 0.366 0.22
LRV as a Function of Porosity
A comparison was performed on the filters tested, comparing the effect that flowrate,
porosity, and thickness have on the calculated LRV values. Figure 2 shows LRV plotted
against the measured porosity for each filter for each filter thickness. From this graph, no
correlation between bacterial removal and porosity was observed for any filter thickness.
This phenomenon has been seen in other research conducted on CPFs by Soppe et al.
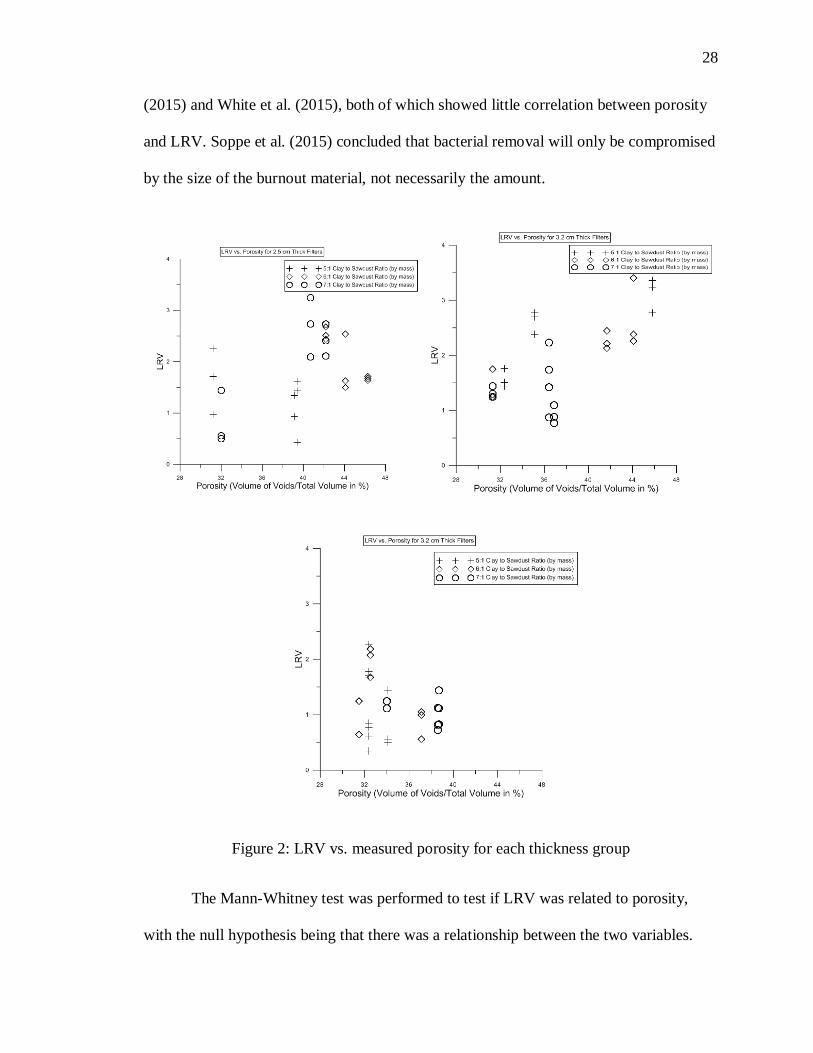
28
(2015) and White et al. (2015), both of which showed little correlation between porosity
and LRV. Soppe et al. (2015) concluded that bacterial removal will only be compromised
by the size of the burnout material, not necessarily the amount.
Figure 2: LRV vs. measured porosity for each thickness group
The Mann-Whitney test was performed to test if LRV was related to porosity,
with the null hypothesis being that there was a relationship between the two variables.

29
The results from these tests showed a p-value of 0.000, meaning the null hypothesis is
rejected and that there is no relationship between LRV and porosity for this testing.
LRV as a Function of Thickness
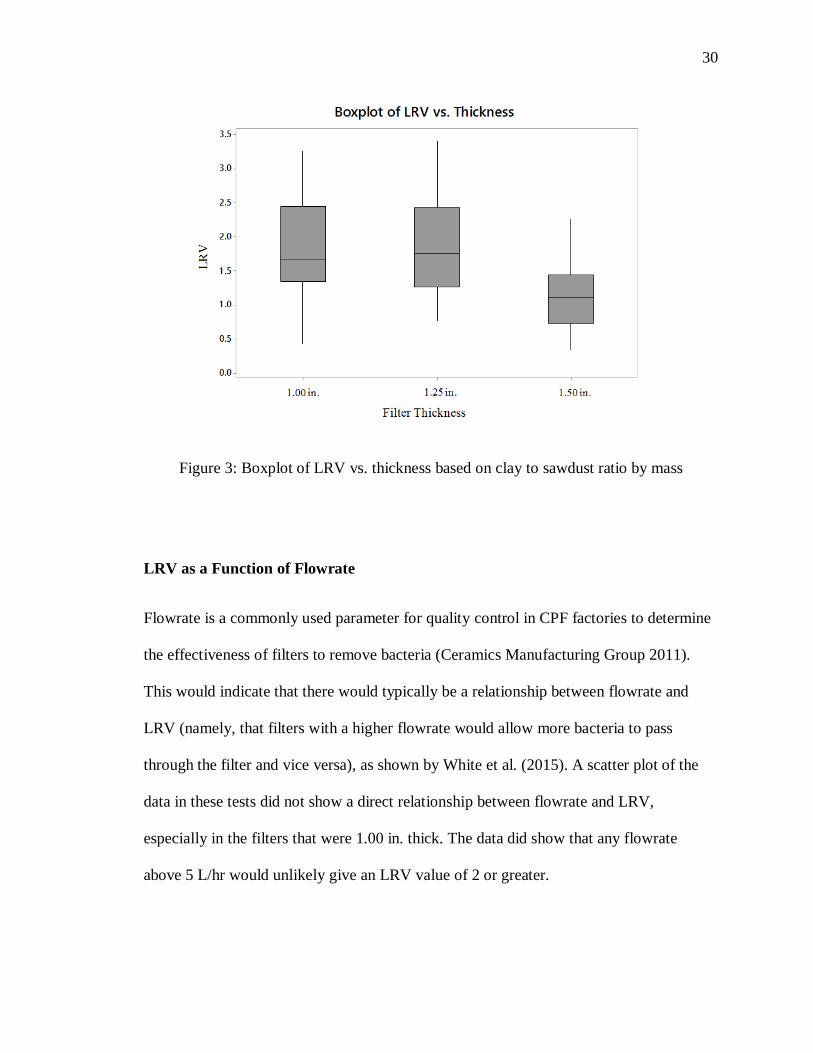
Figure 3 shows the relationship between LRV and thickness of the filter. From this graph
it can be observed that the 1.25 in. thick filters performed the best in regards to LRV. The
mean LRV of the filters with 1.25. thickness was the greatest of all filters tested, followed
closely by the 1in. thick filters. From this figure, it can be seen that the range of
logarithmic reduction values is quite large, with most ranges being 2 LRV or greater. It
also shows that the 1.5 in. thick filters were the most ineffective filters used. This does
not follow the hypothesis that the thicker the filters, the more effective the filters will be
when put under pressure. This could be due to the higher flowrates that were seen in the
filters with thicknesses of 1.5 in. Filters with 1.5 in. thicknesses also appeared to not fire
completely through the filter. This caused filters to be more fragile and chip around the
edges of the filter, reducing the effective thickness of the filters.
The Mann-Whitney test was performed on all filters used during testing, with the
null hypothesis being that LRV were related to thickness. The p-value for the LRV to
thickness test was 0.0031, rejecting the null hypothesis. This suggests that thickness of
the filter is not related to LRV. This analysis may have been affected by the 1.50 in.
filters since these filters showed higher flowrate and consistently low LRV.
30
Figure 3: Boxplot of LRV vs. thickness based on clay to sawdust ratio by mass
LRV as a Function of Flowrate
Flowrate is a commonly used parameter for quality control in CPF factories to determine
the effectiveness of filters to remove bacteria (Ceramics Manufacturing Group 2011).
This would indicate that there would typically be a relationship between flowrate and
LRV (namely, that filters with a higher flowrate would allow more bacteria to pass
through the filter and vice versa), as shown by White et al. (2015). A scatter plot of the
data in these tests did not show a direct relationship between flowrate and LRV,
especially in the filters that were 1.00 in. thick. The data did show that any flowrate
above 5 L/hr would unlikely give an LRV value of 2 or greater.
31
Figure 4: Flowrate vs. LRV based on filter thickness
The Mann-Whitney test was performed on each clay to sawdust ratio groups
based on thicknesses, testing to see if flowrate and LRV were related. The null hypothesis
was that flowrate and LRV were related. The results from this testing can be seen in
Table 2. From this statistical test, it can be seen that the filters that showed a relationship
between flowrate and LRV were the 5:1 1.25 in., 6:1 1 in., 6:1 1.25 in., and 7:1 1 in.
These filters are filters that had a mean LRV value greater than or equal to 2. The other
32
five filter groups did not show relationships between flowrate and LRV and also had
mean LRV values of less than 2. Analysis of these five filter groups indicated the reasons
why these filters did not show a relationship between LRV and flowrate included having
filters with higher flowrates than the necessary 5 L/hr and that filters in these groups
experienced more chipping than filters in the groups that did show a relationship. The 1.5
in. filters were especially ineffective due to most of the filters not completing firing in the
kiln. This caused filters to be more fragile and this group had higher flowrates than most
filter groups.
Table 2: Mann-Whitney Test Results for Flowrate and LRV for Each Filter Group
p-value 5:1 1 in. 0.001
5:1 1.25 in. 0.204 5:1 1.5 in. 0.004 6:1 1 in. 0.453
6:1 1.25 in. 0.791 6:1 1.5 in. 0.001 7:1 1 in. 0.158
7:1 1.25 in. 0.014 7:1 1.5 in. 0.000
The Mann-Whitney test was also performed testing the relationship between LRV
and porosity, thickness, and flowrate while taking out the 1.5 in. filters. From this testing,
there was still no relationship found between LRV and porosity, thickness, and clay to
sawdust ratio. There was no relationship found from literature review between these
relationships as it does not appear to have been tested yet.

33
Testing Conducted at 10 psi
Table 2 shows data collected during testing at 10 psi. The letter designates the filter
name used during testing. Not all filters that did not have a 2 LRV at 5 psi were tested at
10 psi since it was shown that if filters were not effective at 5 psi they would not be
effective at 10 psi, as evident by filters 5:1 1 in. C, 6:1 1 in. C, and 7:1 1.25 in. B. Results
indicate that the LRV is typically lower than at lower pressures, but acceptable LRVs can
be obtained.
Table 3: Results of Tests Conducted at 70 kPa
LRV 1 Q 1 (L/hr) LRV 2 Q 2 (L/hr)
5:1 1 in. C 0.78 20.2
5:1 1.25 in. B 1.9 6.74 2.7 4.98
5:1 1.25 in. C 1.9 4.25 2.6 3.61
6:1 1 in. A 1.9 8.98 1.4 7.63
6:1 1 in. C 1.01 7.88
6:1 1.25 in. A 1.7 3.76 1.0 4.75
6:1 1.25 in. C 1.9 3.32 1.4 5.57
7:1 1 in. B 2.1 2.12 1.7 3.56
7:1 1 in. C 2.2 4.55 1.7 5.94
7:1 1.25 in. B 0.761 18.2
34
CONCLUSIONS
The use of ceramic filter disks under pressure has a potential to be an efficient and
economical way to filter water, especially in a pressurized system. The filters that showed
the most consistent removal were filters with a thickness of 1.25 in. The porosity of the
filter doesn’t seem to be a primary factor in the LRV of filters. This indicates that
porosity of the filters can be a value that can be as high as the manufacturer wants as long
as it does not affect the strength of the filter. The maximum porosity of a filter that did
not break that was completely fired during our testing was 46.5%. More testing would
need to be done to determine the strength of the filter based on porosity.
One limiting factor during testing was the fragility of the filters when under
pressure. When the filters are put into the apparatus, the hose clamps are tightened and
the filter is compressed within the rubber coupling. During testing, filters were taken in
and out of the apparatus multiple times. This led to filters chipping and breaking. If filters
were left in place during operation, the filters should have less chipping then the filters
tested during this study. This compression caused some of the filters to chip around the
sides of the disk, making it much more difficult to keep the filter tightly sealed to the
rubber coupling. Some of the filters also cracked when pressure was induced on them.
Most filters remained working under 5 psi conditions although some cracked down the
middle of the filter, making them ineffective. This phenomena was increased for filters
that were put under a pressure of 10 psi. Filters should be completely fired and have
complete combustion to increase strength in the filters.
35
Tests indicate that the filter disks were unable to effectively remove bacteria when
flowrate through the filter was above 5 L/hr. Therefore, if a filter has a flowrate above 5
L/hr the filter will not effectively remove bacteria under pressures equal to or greater than
5 psi. This is greater than the recommended 1-2 L/hr, but Soppe et al. (2015) has stated
that gravity fed filters could be effective at flowrates of up to 10 L/hr. Testing also
indicated that LRV and flowrate are related, according from the results of the Mann-
Whitney testing. Porosity and thickness do not seem to have a relationship to LRV from
this testing. Further analysis should be performed to determine a better correlation
between flowrate and LRV.
A long-term study on the use of filter disks under pressure would allow better
characterization of the lifetime of the ceramic disk filter and the ability of the filter to
consistently remove bacteria at acceptable flowrates. More tests also need to be
performed to improve the filters ability to stay consistently tight to the rubber coupling.
Thicker filter disks seemed to have a higher chance of being ineffective. This seems
counter intuitive since the thicker filters should remove more bacteria than a thinner filter
but our testing did not show this result. A complete firing of the filter also appears to be
important in removal when filters are put under pressure. Filters with a zone that did not
completely fired never reached LRVs of 2 during testing. A dye test could be performed
on the filters to test if bypass was occurring. This would help validate if a filter was
performing as intended and a more ideal filter design could be implemented for use in the
field.
36
REFERENCES
Brown, J., Sobsey, M.D. (2010). “Microbiological effectiveness of locally produced ceramic filters for drinking water treatment in Cambodia.” J. Water Health, 8(1), 1-10.
Ceramics Manufacturing Working Group (2011). Best Practice Recommendations for Local Manufacturing of Ceramic Pot Filters for Household Water Treatment 1st edn, Center for Disease Control and Prevention, Atlanta, GA, USA.
Clark, K.N. and Elmore, A.C. (2011). “Bacteria removal effectiveness of ceramic pot filters not applied with colloidal silver.” Water Science and Technology: Water Supply, 11(6), 765- 772.
Clasen, T.F., Bastable, A. (2003). “Fecal contamination of drinking water during collection and household storage; the need to extend protection to the point of use.” J. Water Health, 1(3), 109-115.
Hunter, P.R. (2009). “Household water treatment in developing countries: comparing different intervention types using meta-regression.” Environmental Science and Technology, 43(23), 8991-8997.
Kalman, E.N., Oyanedel-Craver, V.A., and Smith, J.A. (2011). “Ceramic filters impregnated with silver nanoparticles for point-of-use water treatment in rural Guatemala.” Journal of Environmental Engineering, 137(6), 407-415.
Lantagne, D., Klarman, M., Mayer, A., Preston, K., Napotnik, J., and Jellison, K. (2010). “Effect of production variables on microbiological removal in locally-produced ceramic filters for household water treatment.” International Journal of Environmental Health Research, 20(3), 171-187.
Oyandel-Craver, V.A. and Smith, J.A. (2007). “Sustainable colloidal-silver-impregnated ceramic filter for point-of-use water treatment.” Environmental Science and Technology, 42, 927-9330
Ren, D. and Smith, J.A. (2013). “Retention and transport of silver nanoparticles in a ceramic porous medium used for point-of-use water treatment.” Environmental Science and Technology, 47, 3825-3832.
Soppe, A.I.A., Heijman, S.G.J., Gensburger, I., Shantz, A., van Halem, D., Kroesbergen, J., Wubbles, G.H., and Smeets, P.W.M.H. (2015). “Critical parameters in the production of ceramic pot filters for household water treatment in developing nations.” Journal of Water and Health, 13(2), 587-599.
American Society for Testing and Materials (ASTM). Standard Test Method for Water Adsorption, Bulk Density, Apparent Porosity, and Apparent Specific Gravity of Fired Whiteware Products 2006, C373-88,, West Conshohocken, PA, USA.
37
United Nations Children’s Fund. (2008). UNICEF Handbook on Water Quality, UNICEF, New York, NY, USA
van Halem, D., Heijman, S.G.J., Soppe, A.I.A., van Dijk, J.C. and Amy, G.L. (2007) Ceramic silver-impregnated pot filters for household drinking water treatment in developing countries: material characterization and performance study. Water Science and Technology: Water Supply, 7(5-6), 9-17.
White, E. P., Langenfeld, J. K., Bradford, E. L., Haywood, H. G., Salvinelli, C., and Elmore, A. C. (2015). “Assessment of Flow Rate as a Quality Control Test for Ceramic Pot Filters.” World Environmental and Water Resources Congress 2015, 1378–1387.
World Health Organization. (2011). “Evaluating household water treatment options: health-based targets and microbiological performance specifications.” World Health Organization Water Sanitation Health.
World Health Organization and United Nations Children’s Fund. (2014). Progress on sanitation and drinking-water – 2014 update. Joint Monitoring Programme for Water Supply and Sanitation, WHO, Geneva, Switzerland.
38
SECTION
4. DISCUSSION
4.1 LABORATORY FINDINGS
Appendix A shows pictures of all filters used in this testing and the associated
flowrate and LRV with each test performed and shows why a filter failed if it did break
during testing. Plots comparing flowrates, LRV, thicknesses, and porosity were
constructed to perform an analysis on the filter disks produced. Raw data used in these
plots collected during testing can be found in Appendices at the end of this document.
Appendix B shows LRV vs. porosity grouped by thicknesses of 1, 1.25, and 1.5 in.
Appendix C shows LRV vs. thickness grouped by clay to sawdust ratio by mass and
Appendix D shows LRV vs. flowrate grouped by filter thickness. Using all of these plots,
there appeared to be very little correlation between porosity and LRV based on the
thicknesses of the filters and very little correlation between clay to sawdust ratio and
LRV based on thickness. The best correlation appeared to be between flowrate and LRV,
particularly in filters with thicknesses of 1.25 in. and 1.5 in. There appears to be a general
trend of the lower the flowrate, the more effective at removing bacteria the filter is. This
was not true for all filters though and could be caused by ineffective sealing in the filter.
Filters with a flowrate higher than 5 L/hr will be ineffective at removing bacteria under
conditions were the filter is put under pressure.
Filters that were effective at 5 psi were tested at 10 psi. Three filters (5:1 1 in. C,
6:1 1 in. C, and 7:1 1.25 in. B) were ineffective at 5 psi and also at 10 psi. Some of the
filters tested did break when subjected to 10 psi of pressure. Filters seemed to be
inconsistent when tested at this pressure as well. More testing would need to be
39
conducted at both 5 and 10 psi to develop a better relationship between the variables,
although filters with a 1.25 in. thickness and sawdust to clay ratio of 6:1 appears to be the
most effective for removing bacteria under pressure in an in-line pumping system.
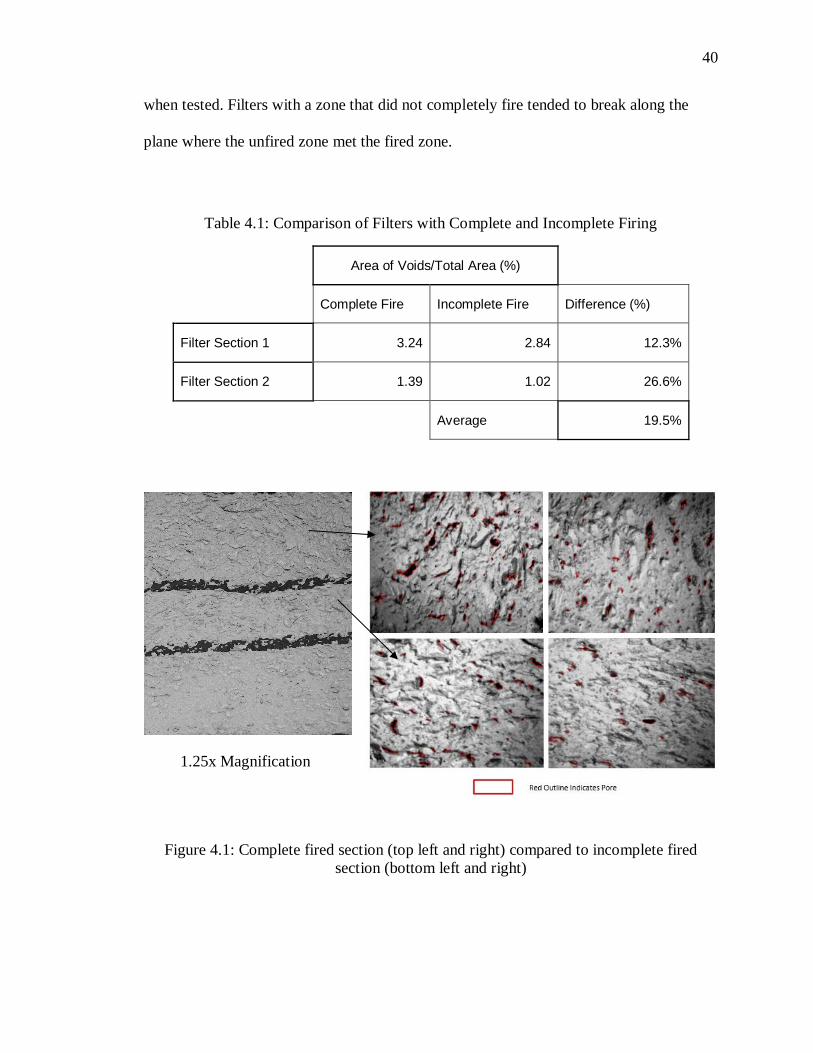
4.2 EFFECT OF INCOMPLETE BURNOUT ON FILTER EFFECTIVENESS
Thicker filters, especially those with a thickness of 1.5 in., had a noticeable layer
of material near the middle of the disk that did not appear to effectively fire in the kiln do
to incomplete oxidation. To better understand the effect this layer could have on bacterial
effectiveness, disks with this layer were cut using a wet diamond saws into thin slices.
These thin slices were then placed under a Leica S8APO digital stereoscope. Images were
taken of the zone that was completely fired and the zone that did not completely fire.
These pictures can be seen in Figure 4.1. Due to the way the filters were cut, it could be
hard to differentiate between pores and grain pull out from the saw used to cut. The
section in between the two black lines is the unfired zone and the sections above the top
black line and below the black bottom line are completely fired zones. Black zones were
considered pores in the filter. It is noticeable that filters that completely fired (top
images) have more void areas than those that did not fire completely (bottom image)The
images were processed and the area of the voids in each zone where measured and
compared to the total area of the zone. Table 4.1 shows results of the processed images.
These results showed that the zone that completely fired had an average of 19.5% more
area of voids compared to total area than the zone that did not completely fire. This
change in porosity could contribute to some flow bypassing the filter and water not going
through the entire filter. This zone also seemed to cause the filters to be more fragile
40
when tested. Filters with a zone that did not completely fire tended to break along the
plane where the unfired zone met the fired zone.
Table 4.1: Comparison of Filters with Complete and Incomplete Firing
Area of Voids/Total Area (%)
Complete Fire Incomplete Fire Difference (%)
Filter Section 1 3.24 2.84 12.3%
Filter Section 2 1.39 1.02 26.6%
Average 19.5%
Figure 4.1: Complete fired section (top left and right) compared to incomplete fired section (bottom left and right)
1.25x Magnification
41
For filters to be most effective in a pressurized system, the disk need to be
completely fired. For this to occur, especially in thicker filters, the firing schedule of the
kiln would need to be adjusted. The filters with thicknesses of 3.8 cm seem to not be
reaching a high enough temperature to completely fire and burnout all material.
Therefore, the firing schedule should be adjusted to hold temperatures longer between
300-600 °C to give the filter disk a better opportunity to completely fire in the middle.
42
5 CONCLUSIONS
5.1 CONSLUSIONS OF LABORATORY TESTING
The use of filter disk in a pumping or elevated tank system could be an effective
and economical way to treat microbiological contamination in a water supply. Our results
have shown that ceramic disk filters can treat water to the WHO recommended level for
water treatment at 5 psi and possibly 10 psi. The system studied here would be more
representative of a system that uses an elevated tank and a gravity fed water distribution
system as the pressure put on the filter was a constant. Filters with a thickness of 1.25 in.
appear to be the most effective. Porosity in the filter does not seem to affect the removal
efficiency but can greatly affect the strength of the filter. This study showed that filters
with a 6:1 clay to sawdust ratio by mass were the most effective when put under pressure
as well. One of the greatest limiting factors of using these filters under pressure continues
to be the strength of the filter and keeping a tight seal between the filter and the housing
apparatus. This study also showed the importance of completely firing a filter for it to be
effective when testing under pressure. Any filters that showed incomplete firing were not
effective at removing total and fecal coliform.
5.2 FUTURE WORK
More laboratory studies need to be implemented before field test could be
performed on these filters. One study to help determine if bypass is occurring in the
filters would be the use of a dye test. Dye testing on these filter disks would help to
determine if there is any bypass in the filter. Another study could be conducted to try and
improve the strength of the filter. One of the biggest limitations in this study was the
43
chipping or breaking of the filter during testing under pressure. These filters when
compressed with the hose clamps caused the filters to chip or break, especially when
filters were taken in and out of the apparatus. Filters that were allowed to stay in the
apparatus to filter water should not chip or break as easily. Also, if something could be
added to the filter mixture to improve the strength of the filter, it would be very helpful
when putting filters under pressure. Lastly, filters need to be tested under conditions that
are conductive of a hand pump. Hand pumps are typically found in developing countries
to pump water out of wells. These hand pumps will send pulses of water through the
filter, instead of a constant pressure the filters were subjected to during this testing. A
study into determining how this changes the filters effectiveness and flowrate should be
conducted since hand pumps are very prevalent

44
APPENDIX A.
IMAGES OF FILTERS USED WITH RESULTS OF TESTING
45
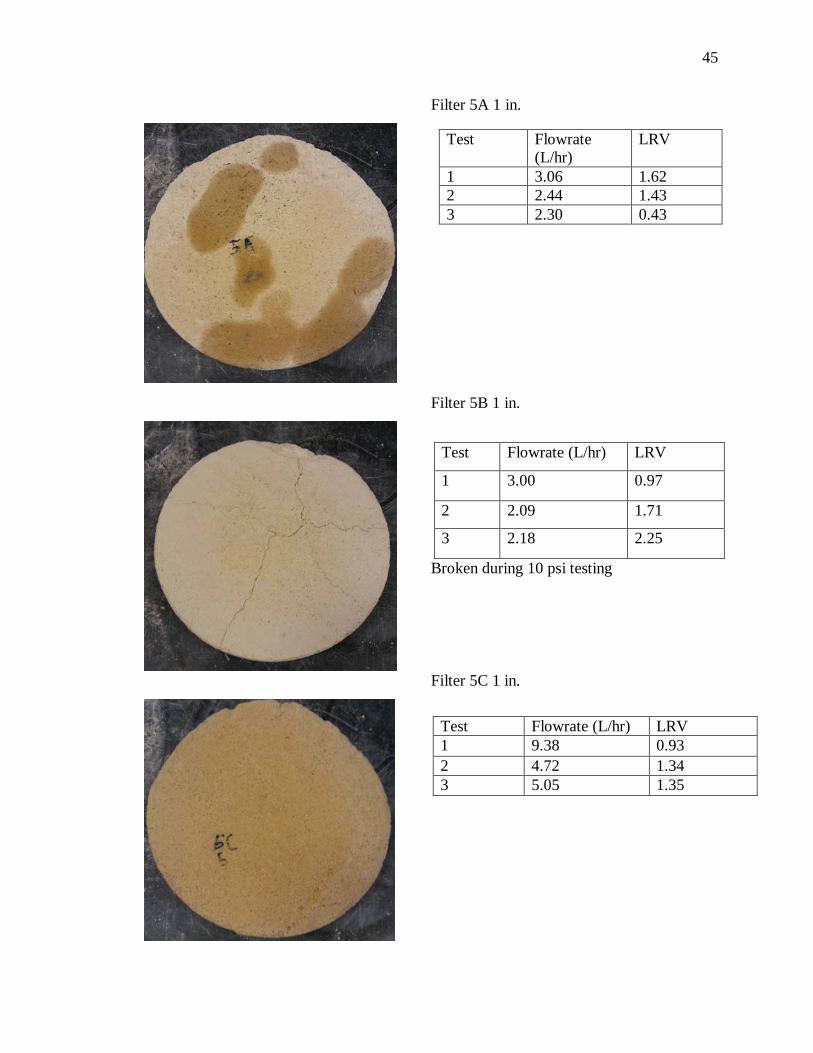
Filter 5A 1 in.
Filter 5B 1 in.
Broken during 10 psi testing
Filter 5C 1 in.
Test Flowrate (L/hr)
LRV
1 3.06 1.62 2 2.44 1.43 3 2.30 0.43
Test Flowrate (L/hr) LRV
1 3.00 0.97
2 2.09 1.71
3 2.18 2.25
Test Flowrate (L/hr) LRV 1 9.38 0.93 2 4.72 1.34 3 5.05 1.35
46
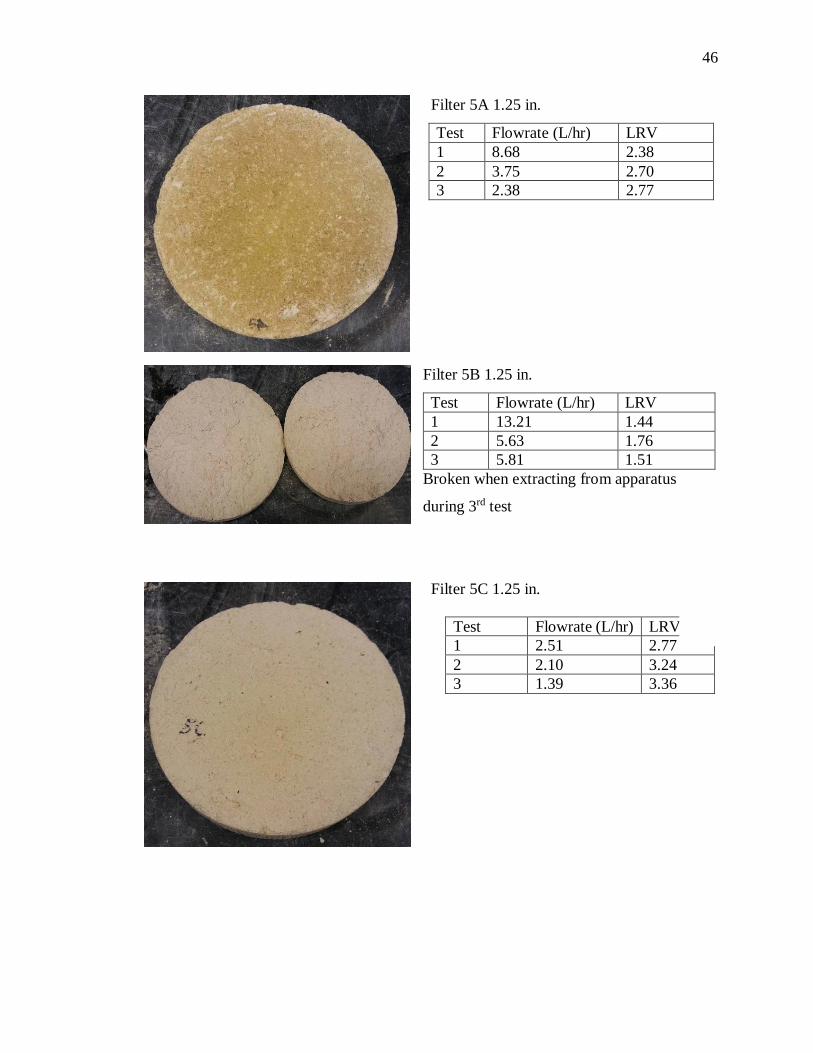
Filter 5A 1.25 in.
Test Flowrate (L/hr) LRV 1 8.68 2.38 2 3.75 2.70 3 2.38 2.77
Filter 5B 1.25 in.
Test Flowrate (L/hr) LRV 1 13.21 1.44 2 5.63 1.76 3 5.81 1.51
Broken when extracting from apparatus
during 3rd test
Filter 5C 1.25 in.
Test Flowrate (L/hr) LRV 1 2.51 2.77 2 2.10 3.24 3 1.39 3.36
47
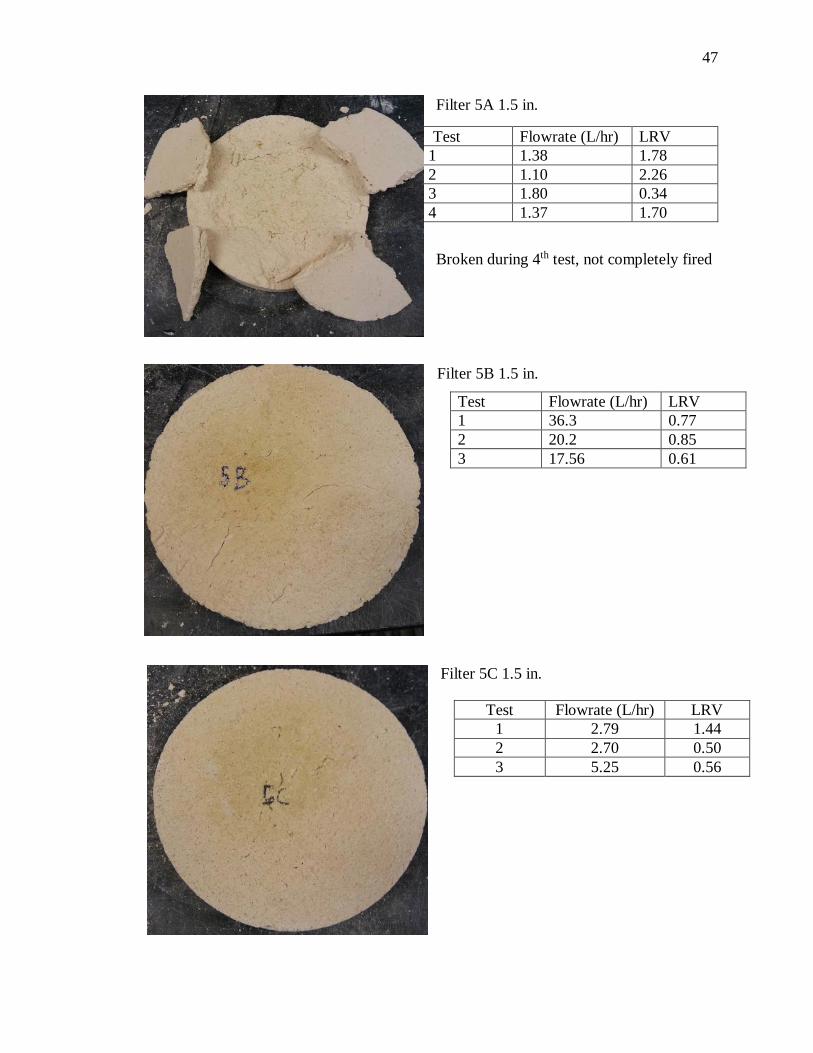
Filter 5A 1.5 in.
Broken during 4th test, not completely fired
Filter 5B 1.5 in.
Filter 5C 1.5 in.
Test Flowrate (L/hr) LRV 1 1.38 1.78 2 1.10 2.26 3 1.80 0.34 4 1.37 1.70
Test Flowrate (L/hr) LRV 1 36.3 0.77 2 20.2 0.85 3 17.56 0.61
Test Flowrate (L/hr) LRV 1 2.79 1.44 2 2.70 0.50 3 5.25 0.56
48
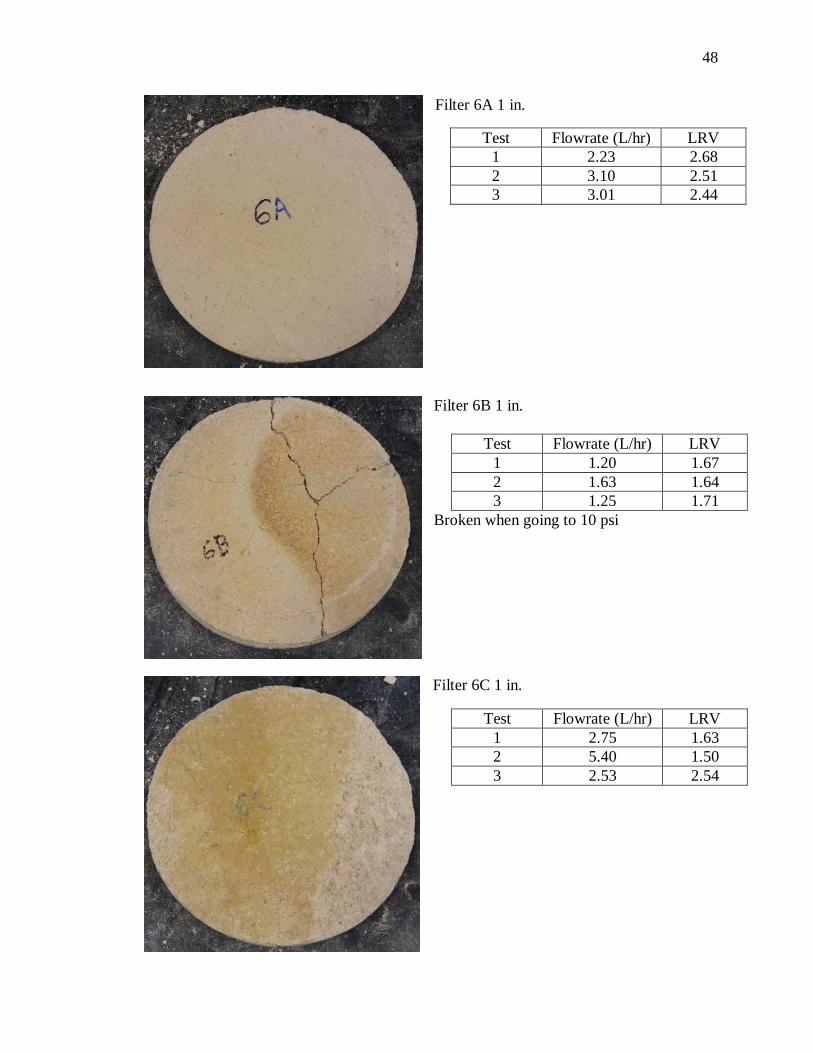
Filter 6A 1 in.
Filter 6B 1 in.
Broken when going to 10 psi
Filter 6C 1 in.
Test Flowrate (L/hr) LRV 1 2.23 2.68 2 3.10 2.51 3 3.01 2.44
Test Flowrate (L/hr) LRV 1 1.20 1.67 2 1.63 1.64 3 1.25 1.71
Test Flowrate (L/hr) LRV 1 2.75 1.63 2 5.40 1.50 3 2.53 2.54
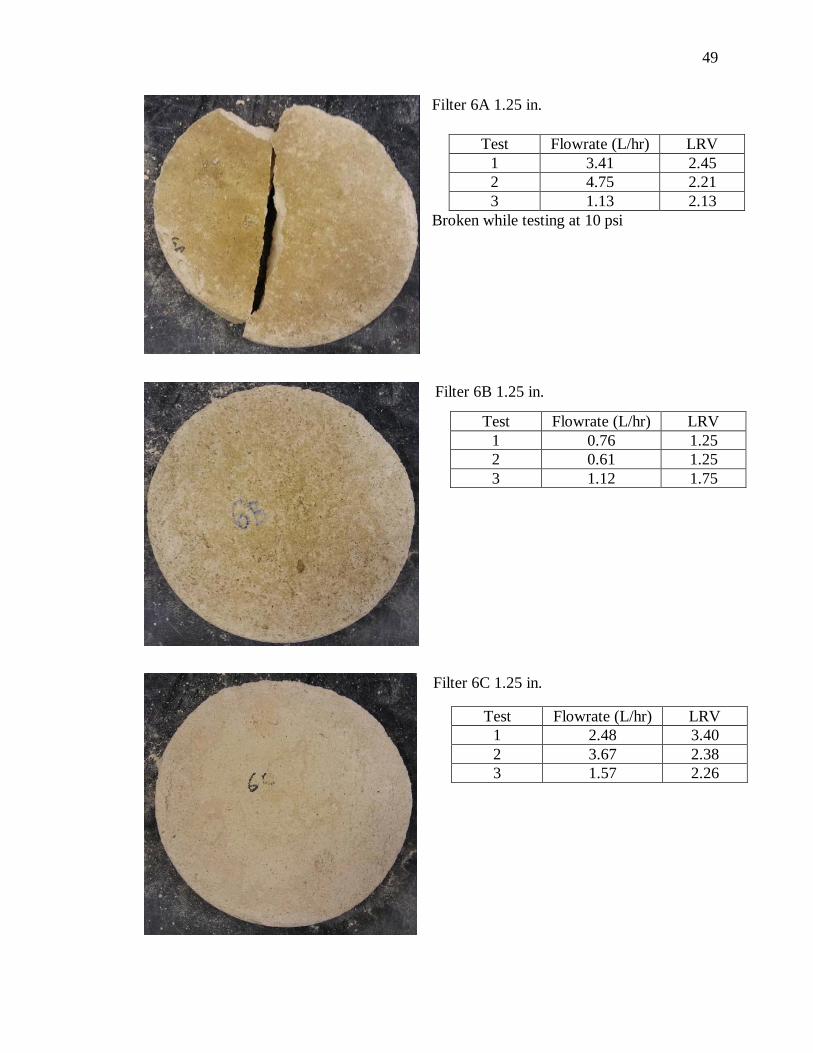
49
Filter 6A 1.25 in.
Broken while testing at 10 psi
Filter 6B 1.25 in.
Filter 6C 1.25 in.
Test Flowrate (L/hr) LRV 1 3.41 2.45 2 4.75 2.21 3 1.13 2.13
Test Flowrate (L/hr) LRV 1 0.76 1.25 2 0.61 1.25 3 1.12 1.75
Test Flowrate (L/hr) LRV 1 2.48 3.40 2 3.67 2.38 3 1.57 2.26
50
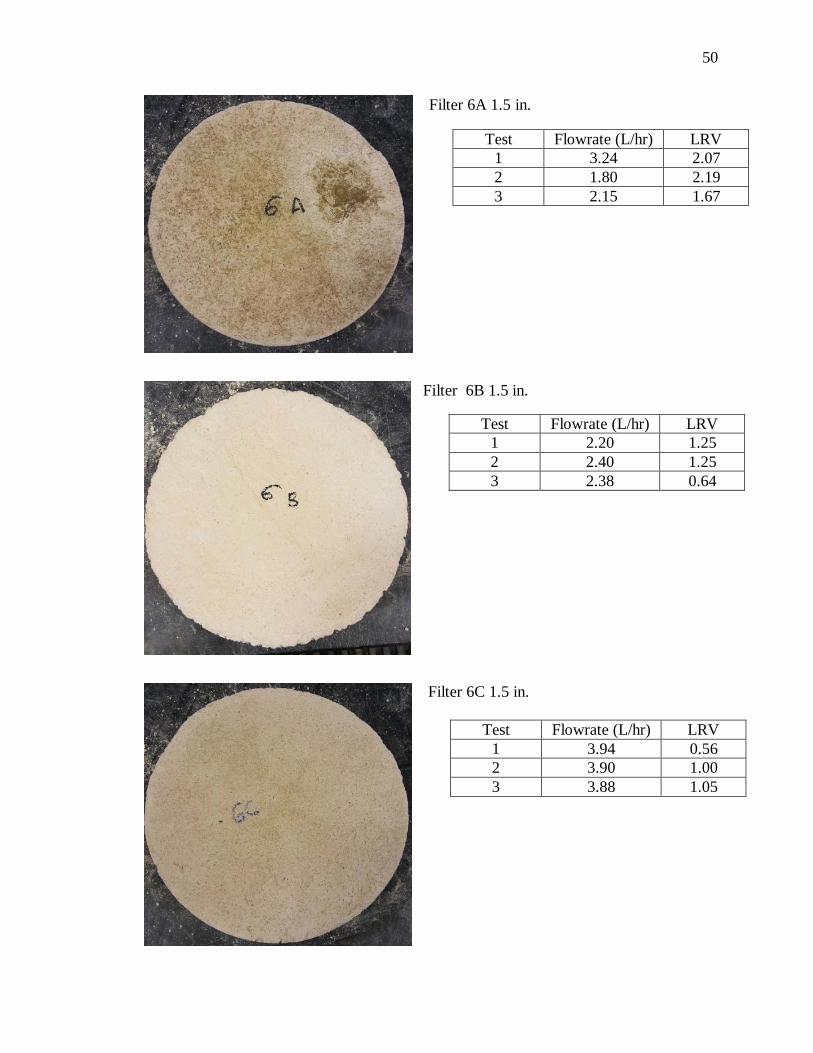
Filter 6A 1.5 in.
Filter 6B 1.5 in.
Filter 6C 1.5 in.
Test Flowrate (L/hr) LRV 1 3.24 2.07 2 1.80 2.19 3 2.15 1.67
Test Flowrate (L/hr) LRV 1 2.20 1.25 2 2.40 1.25 3 2.38 0.64
Test Flowrate (L/hr) LRV 1 3.94 0.56 2 3.90 1.00 3 3.88 1.05
51
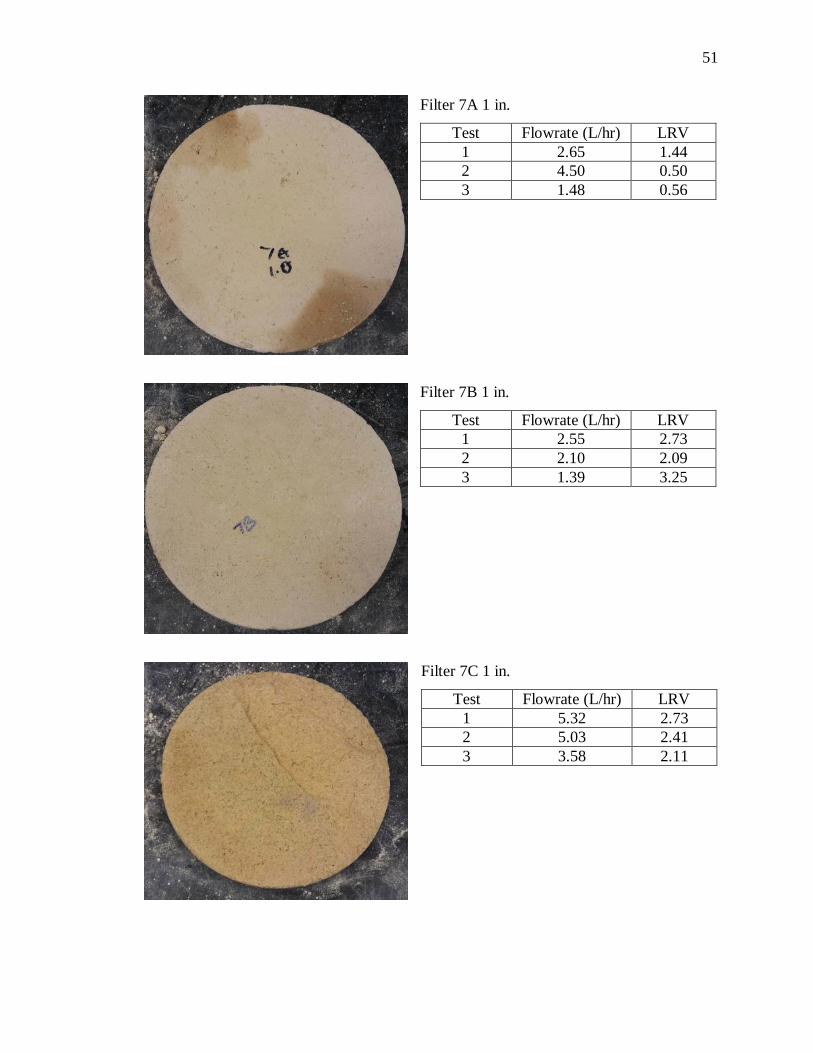
Filter 7A 1 in.
Test Flowrate (L/hr) LRV 1 2.65 1.44 2 4.50 0.50 3 1.48 0.56
Filter 7B 1 in.
Test Flowrate (L/hr) LRV 1 2.55 2.73 2 2.10 2.09 3 1.39 3.25
Filter 7C 1 in.
Test Flowrate (L/hr) LRV 1 5.32 2.73 2 5.03 2.41 3 3.58 2.11
52
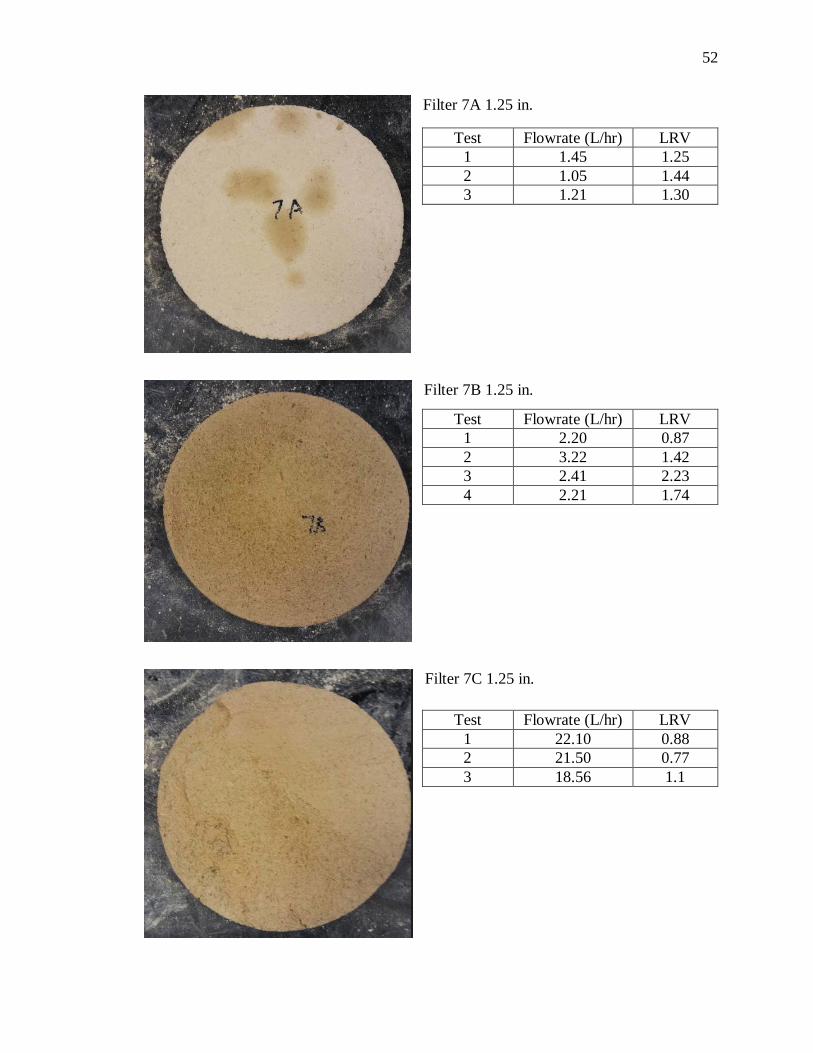
Filter 7A 1.25 in.
Filter 7B 1.25 in.
Filter 7C 1.25 in.
Test Flowrate (L/hr) LRV 1 1.45 1.25 2 1.05 1.44 3 1.21 1.30
Test Flowrate (L/hr) LRV 1 2.20 0.87 2 3.22 1.42 3 2.41 2.23 4 2.21 1.74
Test Flowrate (L/hr) LRV 1 22.10 0.88 2 21.50 0.77 3 18.56 1.1
53
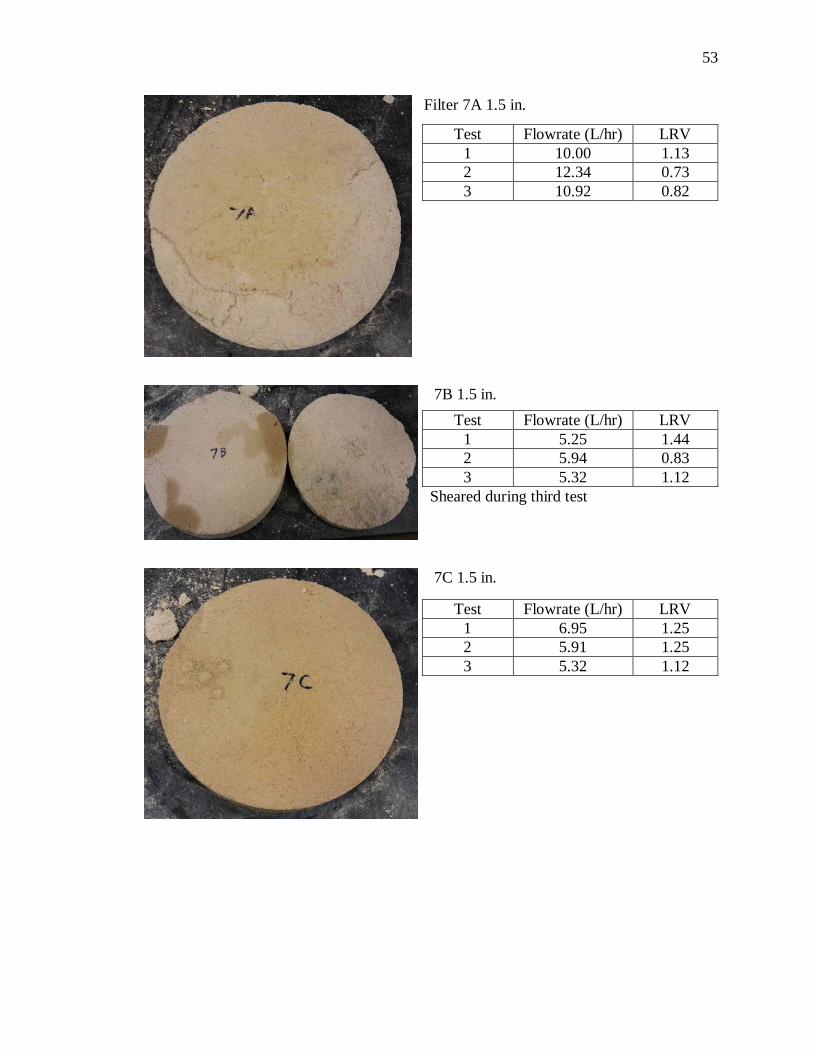
Filter 7A 1.5 in.
7B 1.5 in.
Sheared during third test
7C 1.5 in.
Test Flowrate (L/hr) LRV 1 10.00 1.13 2 12.34 0.73 3 10.92 0.82
Test Flowrate (L/hr) LRV 1 5.25 1.44 2 5.94 0.83 3 5.32 1.12
Test Flowrate (L/hr) LRV 1 6.95 1.25 2 5.91 1.25 3 5.32 1.12

54
APPENDIX B.
LRV VS. POROSITY OF FILTERS BASED ON THICKNESS

55
LRV vs. Porosity of Filters Based Grouped by Thicknesses (in inches) LRV 1.0 Porosity 1.0 LRV 1.25 Porosity 1.25 LRV 1.5 Porosity 1.5 1.15 39.4% 1.15 42.0% 1.78 32.4% 0.97 31.2% 0.97 45.8% 1.44 34.1% 0.93 39.1% 0.93 36.3% 2.07 32.5% 2.68 42.2% 2.45 41.7% 1.25 31.5% 1.67 46.3% 1.25 31.3% 0.56 37.1% 1.63 44.1% 3.40 35.1% 1.13 38.6% 1.44 32.0% 1.25 32.4% 1.44 38.7% 2.73 40.7% 0.87 36.4% 1.25 34.0% 2.73 42.2% 0.88 36.9% 2.26 32.4% 1.43 39.4% 1.76 42.0% 0.85 46.5% 1.71 31.2% 2.70 45.8% 0.50 34.1% 1.34 39.1% 3.24 36.3% 2.19 32.5% 2.51 42.2% 2.21 41.7% 1.25 31.5% 1.64 46.3% 1.25 31.3% 1.00 37.1% 1.50 44.1% 2.38 35.1% 0.73 38.6% 0.50 32.0% 1.44 32.4% 0.83 38.7% 2.09 40.7% 1.42 36.4% 1.25 34.0% 2.41 42.2% 0.77 36.9% 0.34 32.4% 0.49 39.4% 1.51 42.0% 0.61 46.5% 2.25 31.2% 2.77 45.8% 0.56 34.1% 1.35 39.1% 3.36 36.3% 1.67 32.5% 2.44 42.2% 2.13 41.7% 0.64 31.5% 1.71 46.3% 1.75 31.3% 1.05 37.1% 2.54 44.1% 2.26 35.1% 0.82 38.6% 0.56 32.0% 1.30 32.4% 1.12 38.7% 3.25 40.7% 2.23 36.4% 1.12 34.0% 2.11 42.2% 1.1 36.9% 1.7 32.4% 2.5 46.3% 1.74 36.4% 1.77 31.5%

56
APPENDIX C.
LRV VS. THICKNESS RAW DATA

57
LRV vs. Thickness (in inches) Raw Data
LRV 1 5
:1T1
5:1LRV
1 6:1
T1 6:1
LRV 1 7
:1T1
7:1LRV
1.25 5
:1T1.
25 5:1
LRV 1.2
5 6:1
T1.25
6:1LRV
1.25 7
:1T1.
25 7:1
LRV 1.5
5:1T1.
5 5:1
LRV 1.5
6:1T1.
5 6:1
LRV 1.5
7:1T1.
5 7:1
1.15
1.00
2.68
1.00
1.44
1.00
1.15
1.25
2.45
1.25
1.25
1.25
1.78
1.50
2.07
1.50
1.13
1.50
0.97
1.00
1.67
1.00
2.73
1.00
0.97
1.25
1.25
1.25
0.87
1.25
0.77
1.50
1.25
1.50
1.44
1.50
0.93
1.00
1.63
1.00
2.73
1.00
0.93
1.25
3.40
1.25
0.88
1.25
1.44
1.50
0.56
1.50
1.25
1.50
1.43
1.00
2.51
1.00
0.50
1.00
1.76
1.25
2.21
1.25
1.44
1.25
2.26
1.50
2.19
1.50
0.73
1.50
1.71
1.00
1.64
1.00
2.09
1.00
2.70
1.25
1.25
1.25
1.42
1.25
0.85
1.50
1.25
1.50
0.83
1.50
1.34
1.00
1.50
1.00
2.41
1.00
3.24
1.25
2.38
1.25
0.77
1.25
0.50
1.50
1.00
1.50
1.25
1.50
0.49
1.00
2.44
1.00
0.56
1.00
1.51
1.25
2.13
1.25
1.30
1.25
0.34
1.50
1.67
1.50
0.82
1.50
2.25
1.00
1.71
1.00
3.25
1.00
2.77
1.25
1.75
1.25
2.23
1.25
0.61
1.50
0.64
1.50
1.12
1.50
1.35
1.00
2.54
1.00
2.11
1.00
3.36
1.25
2.26
1.25
1.11.2
50.5
61.5
01.0
51.5
01.1
21.5
02.5
1.00
1.74
1.25
1.71.5
01.7
71.5
0
Avera
ge1.2
91.0
02.0
31.0
01.9
81.0
02.0
41.2
52.1
21.2
51.2
51.2
51.0
11.5
01.3
01.5
01.0
81.5
0
58
APPENDIX D.
LRV VS. FLOWRATE RAW DATA BASED ON THICKNESS
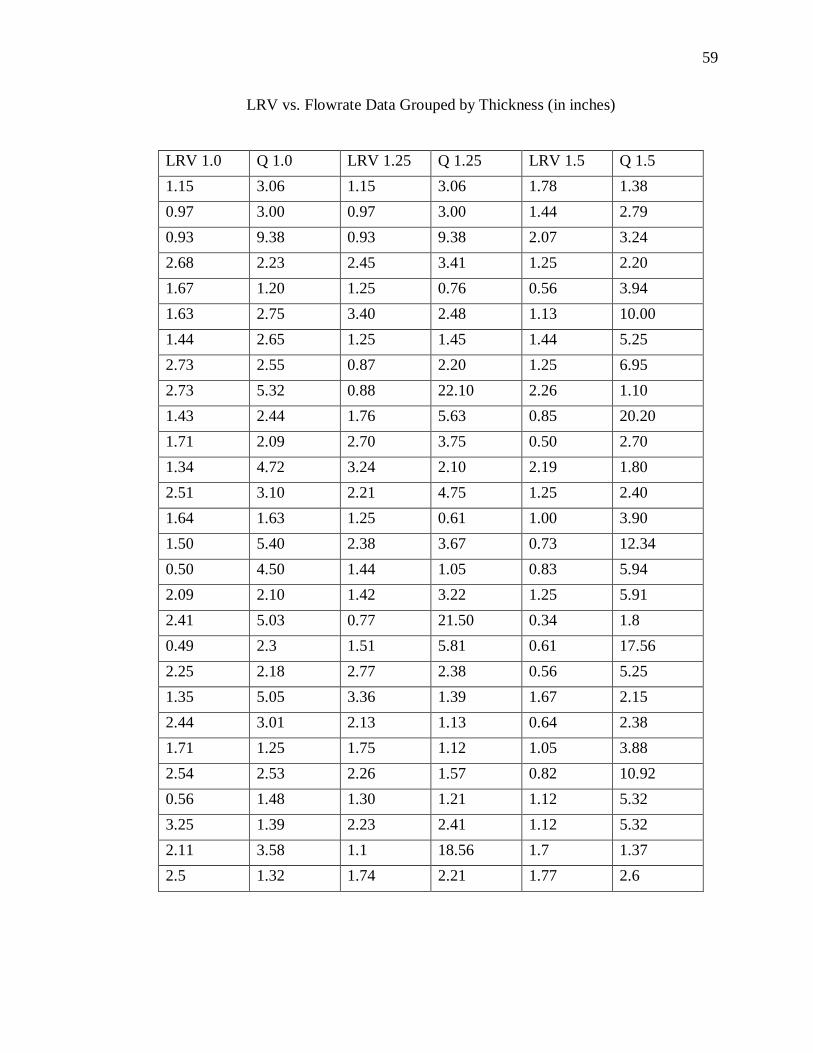
59
LRV vs. Flowrate Data Grouped by Thickness (in inches)
LRV 1.0 Q 1.0 LRV 1.25 Q 1.25 LRV 1.5 Q 1.5 1.15 3.06 1.15 3.06 1.78 1.38 0.97 3.00 0.97 3.00 1.44 2.79 0.93 9.38 0.93 9.38 2.07 3.24 2.68 2.23 2.45 3.41 1.25 2.20 1.67 1.20 1.25 0.76 0.56 3.94 1.63 2.75 3.40 2.48 1.13 10.00 1.44 2.65 1.25 1.45 1.44 5.25 2.73 2.55 0.87 2.20 1.25 6.95 2.73 5.32 0.88 22.10 2.26 1.10 1.43 2.44 1.76 5.63 0.85 20.20 1.71 2.09 2.70 3.75 0.50 2.70 1.34 4.72 3.24 2.10 2.19 1.80 2.51 3.10 2.21 4.75 1.25 2.40 1.64 1.63 1.25 0.61 1.00 3.90 1.50 5.40 2.38 3.67 0.73 12.34 0.50 4.50 1.44 1.05 0.83 5.94 2.09 2.10 1.42 3.22 1.25 5.91 2.41 5.03 0.77 21.50 0.34 1.8 0.49 2.3 1.51 5.81 0.61 17.56 2.25 2.18 2.77 2.38 0.56 5.25 1.35 5.05 3.36 1.39 1.67 2.15 2.44 3.01 2.13 1.13 0.64 2.38 1.71 1.25 1.75 1.12 1.05 3.88 2.54 2.53 2.26 1.57 0.82 10.92 0.56 1.48 1.30 1.21 1.12 5.32 3.25 1.39 2.23 2.41 1.12 5.32 2.11 3.58 1.1 18.56 1.7 1.37 2.5 1.32 1.74 2.21 1.77 2.6
60
APPENDIX E.
STATISTICAL ANALYSIS USING MINITAB RESULTS
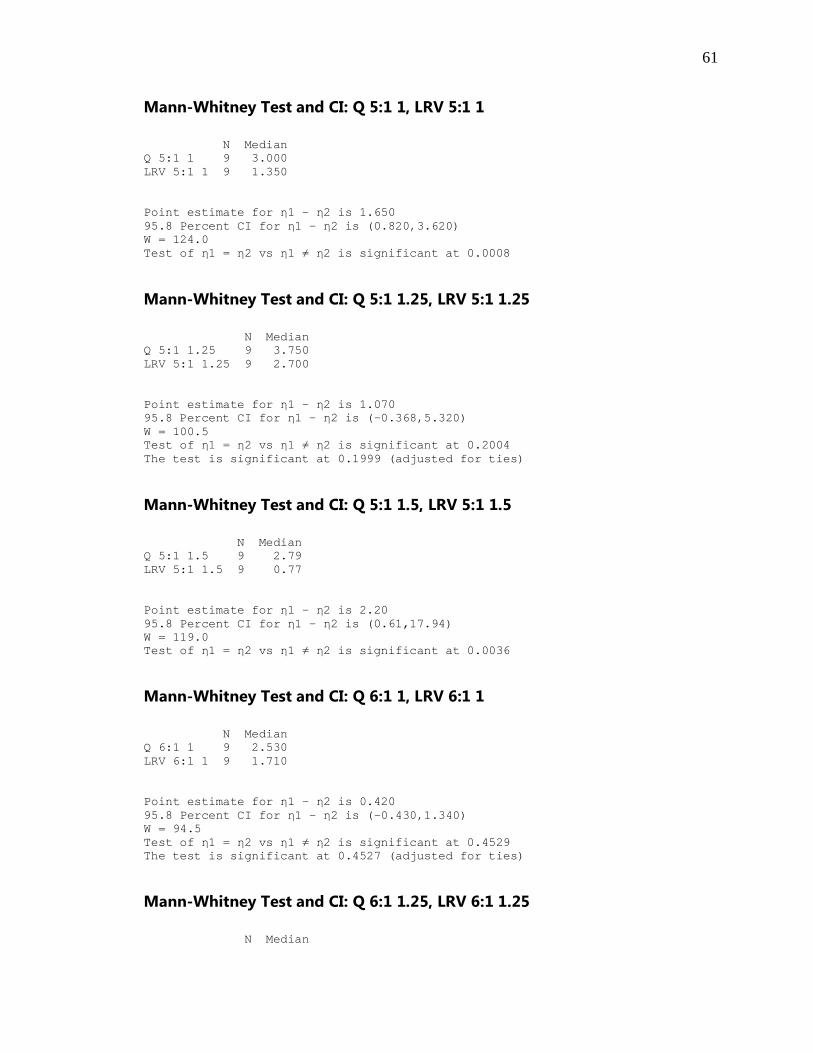
61
Mann-Whitney Test and CI: Q 5:1 1, LRV 5:1 1 N Median Q 5:1 1 9 3.000 LRV 5:1 1 9 1.350 Point estimate for η1 - η2 is 1.650 95.8 Percent CI for η1 - η2 is (0.820,3.620) W = 124.0 Test of η1 = η2 vs η1 ≠ η2 is significant at 0.0008
Mann-Whitney Test and CI: Q 5:1 1.25, LRV 5:1 1.25 N Median Q 5:1 1.25 9 3.750 LRV 5:1 1.25 9 2.700 Point estimate for η1 - η2 is 1.070 95.8 Percent CI for η1 - η2 is (-0.368,5.320) W = 100.5 Test of η1 = η2 vs η1 ≠ η2 is significant at 0.2004 The test is significant at 0.1999 (adjusted for ties)
Mann-Whitney Test and CI: Q 5:1 1.5, LRV 5:1 1.5 N Median Q 5:1 1.5 9 2.79 LRV 5:1 1.5 9 0.77 Point estimate for η1 - η2 is 2.20 95.8 Percent CI for η1 - η2 is (0.61,17.94) W = 119.0 Test of η1 = η2 vs η1 ≠ η2 is significant at 0.0036
Mann-Whitney Test and CI: Q 6:1 1, LRV 6:1 1 N Median Q 6:1 1 9 2.530 LRV 6:1 1 9 1.710 Point estimate for η1 - η2 is 0.420 95.8 Percent CI for η1 - η2 is (-0.430,1.340) W = 94.5 Test of η1 = η2 vs η1 ≠ η2 is significant at 0.4529 The test is significant at 0.4527 (adjusted for ties)
Mann-Whitney Test and CI: Q 6:1 1.25, LRV 6:1 1.25 N Median
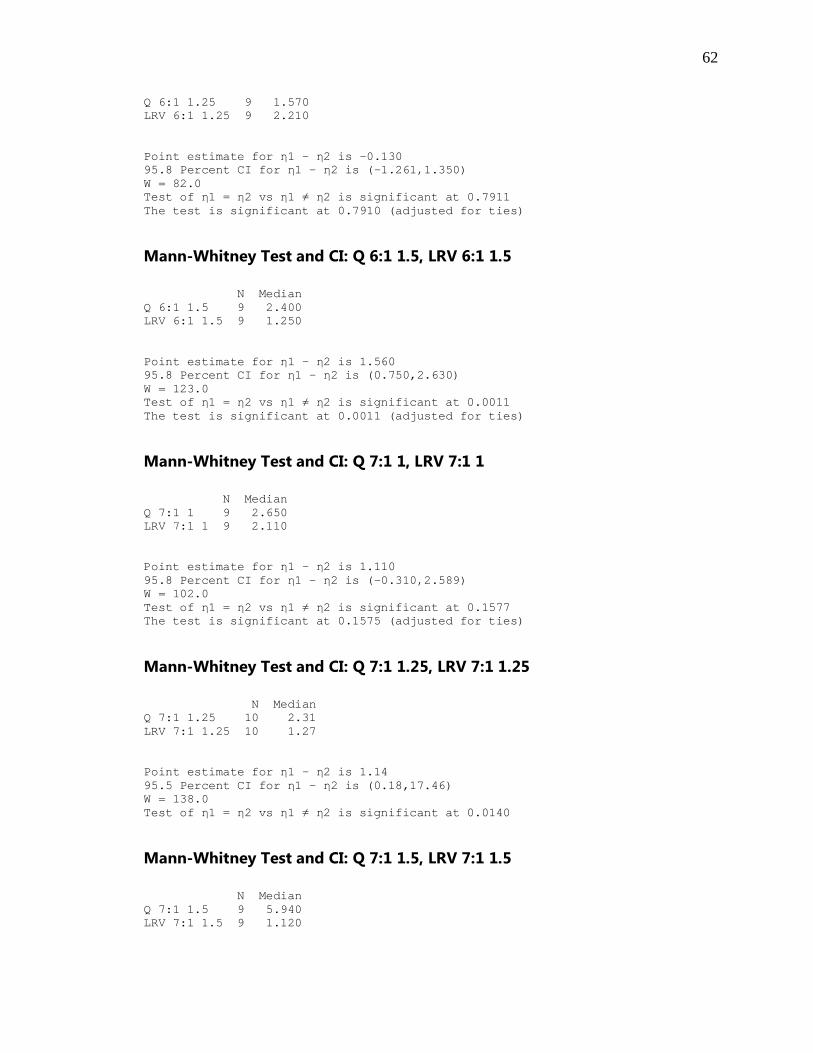
62
Q 6:1 1.25 9 1.570 LRV 6:1 1.25 9 2.210 Point estimate for η1 - η2 is -0.130 95.8 Percent CI for η1 - η2 is (-1.261,1.350) W = 82.0 Test of η1 = η2 vs η1 ≠ η2 is significant at 0.7911 The test is significant at 0.7910 (adjusted for ties)
Mann-Whitney Test and CI: Q 6:1 1.5, LRV 6:1 1.5 N Median Q 6:1 1.5 9 2.400 LRV 6:1 1.5 9 1.250 Point estimate for η1 - η2 is 1.560 95.8 Percent CI for η1 - η2 is (0.750,2.630) W = 123.0 Test of η1 = η2 vs η1 ≠ η2 is significant at 0.0011 The test is significant at 0.0011 (adjusted for ties)
Mann-Whitney Test and CI: Q 7:1 1, LRV 7:1 1 N Median Q 7:1 1 9 2.650 LRV 7:1 1 9 2.110 Point estimate for η1 - η2 is 1.110 95.8 Percent CI for η1 - η2 is (-0.310,2.589) W = 102.0 Test of η1 = η2 vs η1 ≠ η2 is significant at 0.1577 The test is significant at 0.1575 (adjusted for ties)
Mann-Whitney Test and CI: Q 7:1 1.25, LRV 7:1 1.25 N Median Q 7:1 1.25 10 2.31 LRV 7:1 1.25 10 1.27 Point estimate for η1 - η2 is 1.14 95.5 Percent CI for η1 - η2 is (0.18,17.46) W = 138.0 Test of η1 = η2 vs η1 ≠ η2 is significant at 0.0140
Mann-Whitney Test and CI: Q 7:1 1.5, LRV 7:1 1.5 N Median Q 7:1 1.5 9 5.940 LRV 7:1 1.5 9 1.120
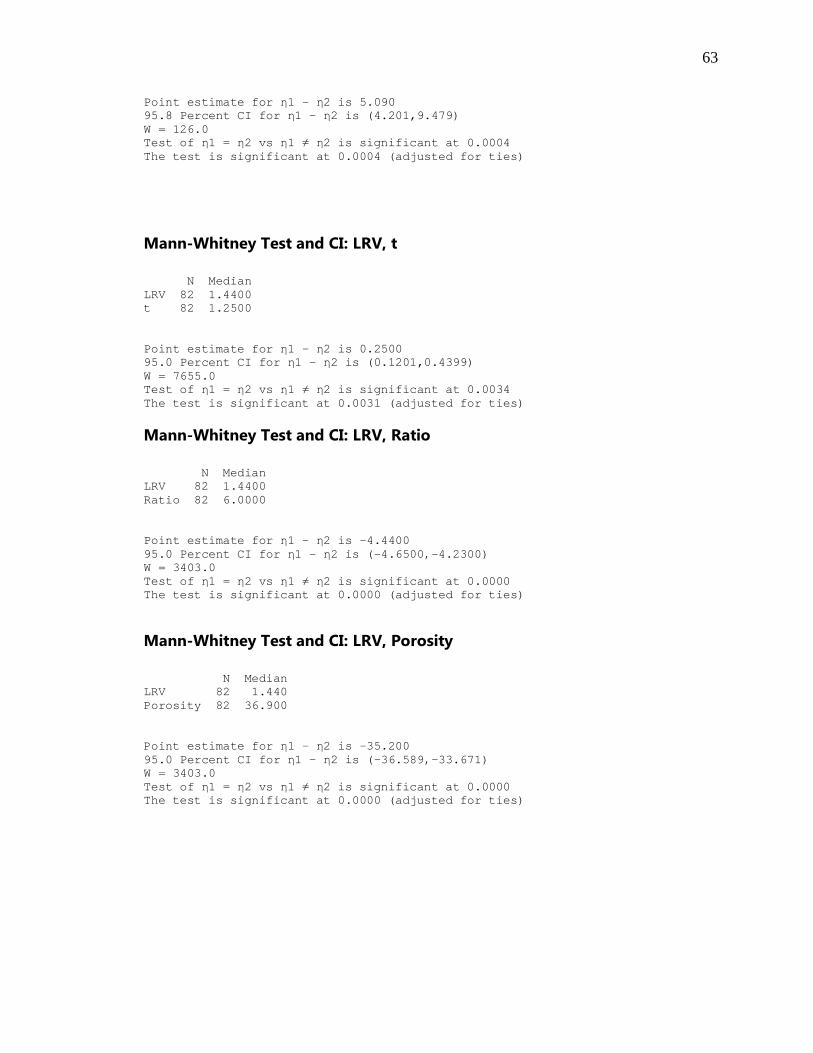
63
Point estimate for η1 - η2 is 5.090 95.8 Percent CI for η1 - η2 is (4.201,9.479) W = 126.0 Test of η1 = η2 vs η1 ≠ η2 is significant at 0.0004 The test is significant at 0.0004 (adjusted for ties)
Mann-Whitney Test and CI: LRV, t N Median LRV 82 1.4400 t 82 1.2500 Point estimate for η1 - η2 is 0.2500 95.0 Percent CI for η1 - η2 is (0.1201,0.4399) W = 7655.0 Test of η1 = η2 vs η1 ≠ η2 is significant at 0.0034 The test is significant at 0.0031 (adjusted for ties)
Mann-Whitney Test and CI: LRV, Ratio N Median LRV 82 1.4400 Ratio 82 6.0000 Point estimate for η1 - η2 is -4.4400 95.0 Percent CI for η1 - η2 is (-4.6500,-4.2300) W = 3403.0 Test of η1 = η2 vs η1 ≠ η2 is significant at 0.0000 The test is significant at 0.0000 (adjusted for ties)
Mann-Whitney Test and CI: LRV, Porosity N Median LRV 82 1.440 Porosity 82 36.900 Point estimate for η1 - η2 is -35.200 95.0 Percent CI for η1 - η2 is (-36.589,-33.671) W = 3403.0 Test of η1 = η2 vs η1 ≠ η2 is significant at 0.0000 The test is significant at 0.0000 (adjusted for ties)

64
APPENDIX F.
FILTERS WITH COMPLETE AND INCOMPLETE BURNOUT
MEASUREMENTS
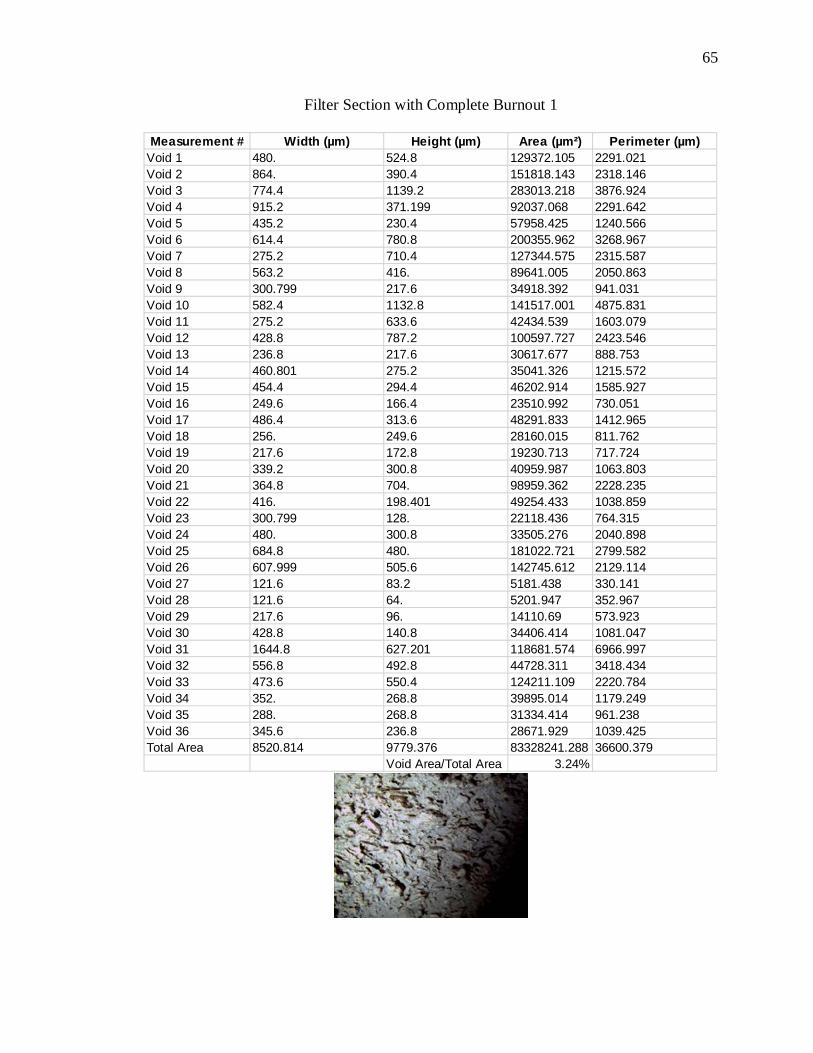
65
Filter Section with Complete Burnout 1
Measurement # Width (µm) Height (µm) Area (µm²) Perimeter (µm)Void 1 480. 524.8 129372.105 2291.021Void 2 864. 390.4 151818.143 2318.146Void 3 774.4 1139.2 283013.218 3876.924Void 4 915.2 371.199 92037.068 2291.642Void 5 435.2 230.4 57958.425 1240.566Void 6 614.4 780.8 200355.962 3268.967Void 7 275.2 710.4 127344.575 2315.587Void 8 563.2 416. 89641.005 2050.863Void 9 300.799 217.6 34918.392 941.031Void 10 582.4 1132.8 141517.001 4875.831Void 11 275.2 633.6 42434.539 1603.079Void 12 428.8 787.2 100597.727 2423.546Void 13 236.8 217.6 30617.677 888.753Void 14 460.801 275.2 35041.326 1215.572Void 15 454.4 294.4 46202.914 1585.927Void 16 249.6 166.4 23510.992 730.051Void 17 486.4 313.6 48291.833 1412.965Void 18 256. 249.6 28160.015 811.762Void 19 217.6 172.8 19230.713 717.724Void 20 339.2 300.8 40959.987 1063.803Void 21 364.8 704. 98959.362 2228.235Void 22 416. 198.401 49254.433 1038.859Void 23 300.799 128. 22118.436 764.315Void 24 480. 300.8 33505.276 2040.898Void 25 684.8 480. 181022.721 2799.582Void 26 607.999 505.6 142745.612 2129.114Void 27 121.6 83.2 5181.438 330.141Void 28 121.6 64. 5201.947 352.967Void 29 217.6 96. 14110.69 573.923Void 30 428.8 140.8 34406.414 1081.047Void 31 1644.8 627.201 118681.574 6966.997Void 32 556.8 492.8 44728.311 3418.434Void 33 473.6 550.4 124211.109 2220.784Void 34 352. 268.8 39895.014 1179.249Void 35 288. 268.8 31334.414 961.238Void 36 345.6 236.8 28671.929 1039.425Total Area 8520.814 9779.376 83328241.288 36600.379
Void Area/Total Area 3.24%
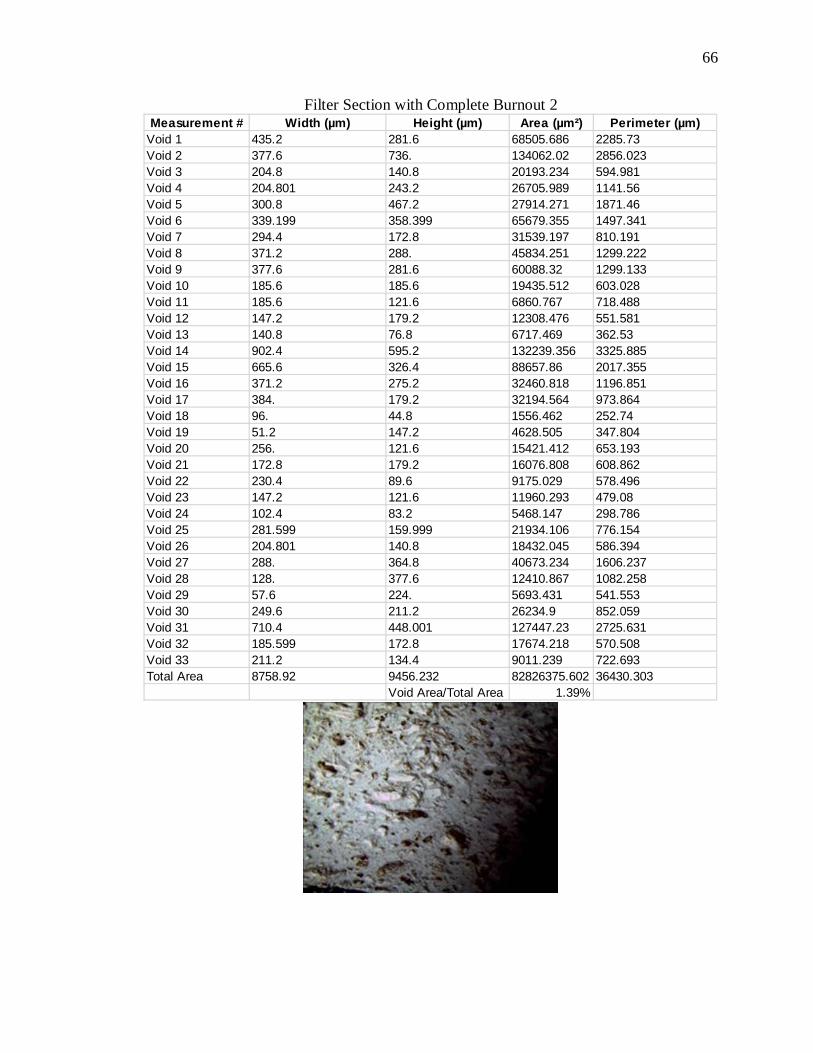
66
Filter Section with Complete Burnout 2
Measurement # Width (µm) Height (µm) Area (µm²) Perimeter (µm)Void 1 435.2 281.6 68505.686 2285.73Void 2 377.6 736. 134062.02 2856.023Void 3 204.8 140.8 20193.234 594.981Void 4 204.801 243.2 26705.989 1141.56Void 5 300.8 467.2 27914.271 1871.46Void 6 339.199 358.399 65679.355 1497.341Void 7 294.4 172.8 31539.197 810.191Void 8 371.2 288. 45834.251 1299.222Void 9 377.6 281.6 60088.32 1299.133Void 10 185.6 185.6 19435.512 603.028Void 11 185.6 121.6 6860.767 718.488Void 12 147.2 179.2 12308.476 551.581Void 13 140.8 76.8 6717.469 362.53Void 14 902.4 595.2 132239.356 3325.885Void 15 665.6 326.4 88657.86 2017.355Void 16 371.2 275.2 32460.818 1196.851Void 17 384. 179.2 32194.564 973.864Void 18 96. 44.8 1556.462 252.74Void 19 51.2 147.2 4628.505 347.804Void 20 256. 121.6 15421.412 653.193Void 21 172.8 179.2 16076.808 608.862Void 22 230.4 89.6 9175.029 578.496Void 23 147.2 121.6 11960.293 479.08Void 24 102.4 83.2 5468.147 298.786Void 25 281.599 159.999 21934.106 776.154Void 26 204.801 140.8 18432.045 586.394Void 27 288. 364.8 40673.234 1606.237Void 28 128. 377.6 12410.867 1082.258Void 29 57.6 224. 5693.431 541.553Void 30 249.6 211.2 26234.9 852.059Void 31 710.4 448.001 127447.23 2725.631Void 32 185.599 172.8 17674.218 570.508Void 33 211.2 134.4 9011.239 722.693Total Area 8758.92 9456.232 82826375.602 36430.303
Void Area/Total Area 1.39%
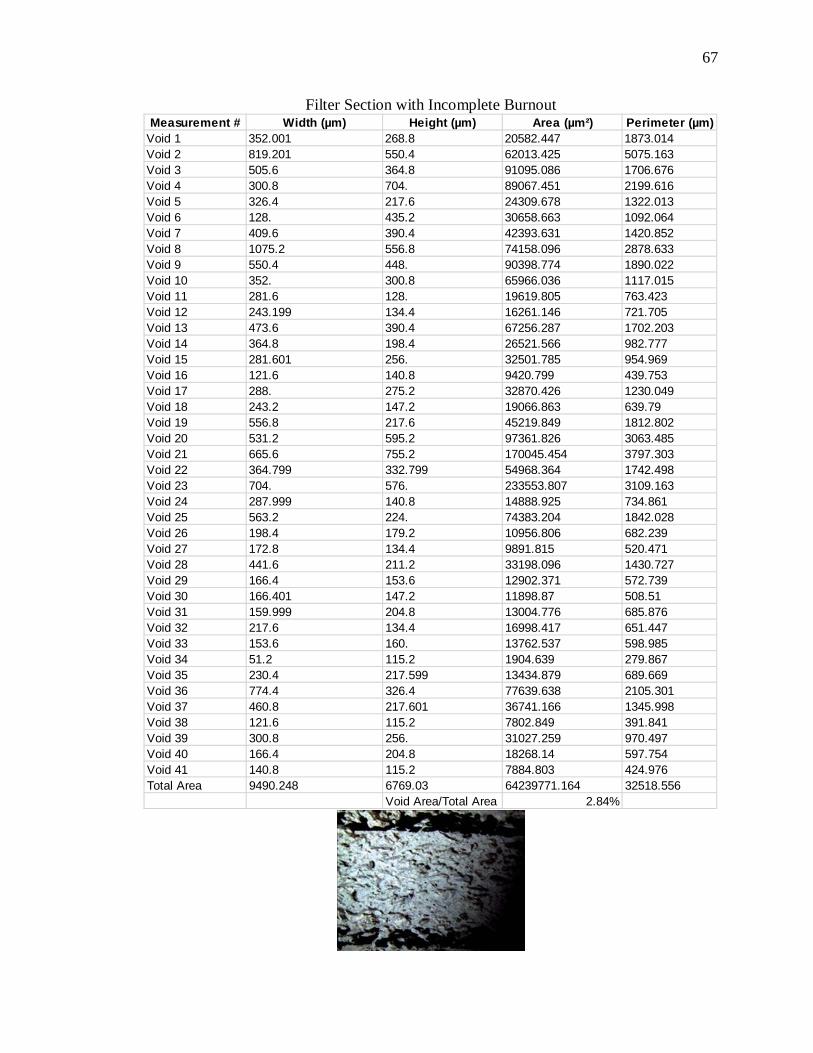
67
Filter Section with Incomplete Burnout
Measurement # Width (µm) Height (µm) Area (µm²) Perimeter (µm)Void 1 352.001 268.8 20582.447 1873.014Void 2 819.201 550.4 62013.425 5075.163Void 3 505.6 364.8 91095.086 1706.676Void 4 300.8 704. 89067.451 2199.616Void 5 326.4 217.6 24309.678 1322.013Void 6 128. 435.2 30658.663 1092.064Void 7 409.6 390.4 42393.631 1420.852Void 8 1075.2 556.8 74158.096 2878.633Void 9 550.4 448. 90398.774 1890.022Void 10 352. 300.8 65966.036 1117.015Void 11 281.6 128. 19619.805 763.423Void 12 243.199 134.4 16261.146 721.705Void 13 473.6 390.4 67256.287 1702.203Void 14 364.8 198.4 26521.566 982.777Void 15 281.601 256. 32501.785 954.969Void 16 121.6 140.8 9420.799 439.753Void 17 288. 275.2 32870.426 1230.049Void 18 243.2 147.2 19066.863 639.79Void 19 556.8 217.6 45219.849 1812.802Void 20 531.2 595.2 97361.826 3063.485Void 21 665.6 755.2 170045.454 3797.303Void 22 364.799 332.799 54968.364 1742.498Void 23 704. 576. 233553.807 3109.163Void 24 287.999 140.8 14888.925 734.861Void 25 563.2 224. 74383.204 1842.028Void 26 198.4 179.2 10956.806 682.239Void 27 172.8 134.4 9891.815 520.471Void 28 441.6 211.2 33198.096 1430.727Void 29 166.4 153.6 12902.371 572.739Void 30 166.401 147.2 11898.87 508.51Void 31 159.999 204.8 13004.776 685.876Void 32 217.6 134.4 16998.417 651.447Void 33 153.6 160. 13762.537 598.985Void 34 51.2 115.2 1904.639 279.867Void 35 230.4 217.599 13434.879 689.669Void 36 774.4 326.4 77639.638 2105.301Void 37 460.8 217.601 36741.166 1345.998Void 38 121.6 115.2 7802.849 391.841Void 39 300.8 256. 31027.259 970.497Void 40 166.4 204.8 18268.14 597.754Void 41 140.8 115.2 7884.803 424.976Total Area 9490.248 6769.03 64239771.164 32518.556
Void Area/Total Area 2.84%
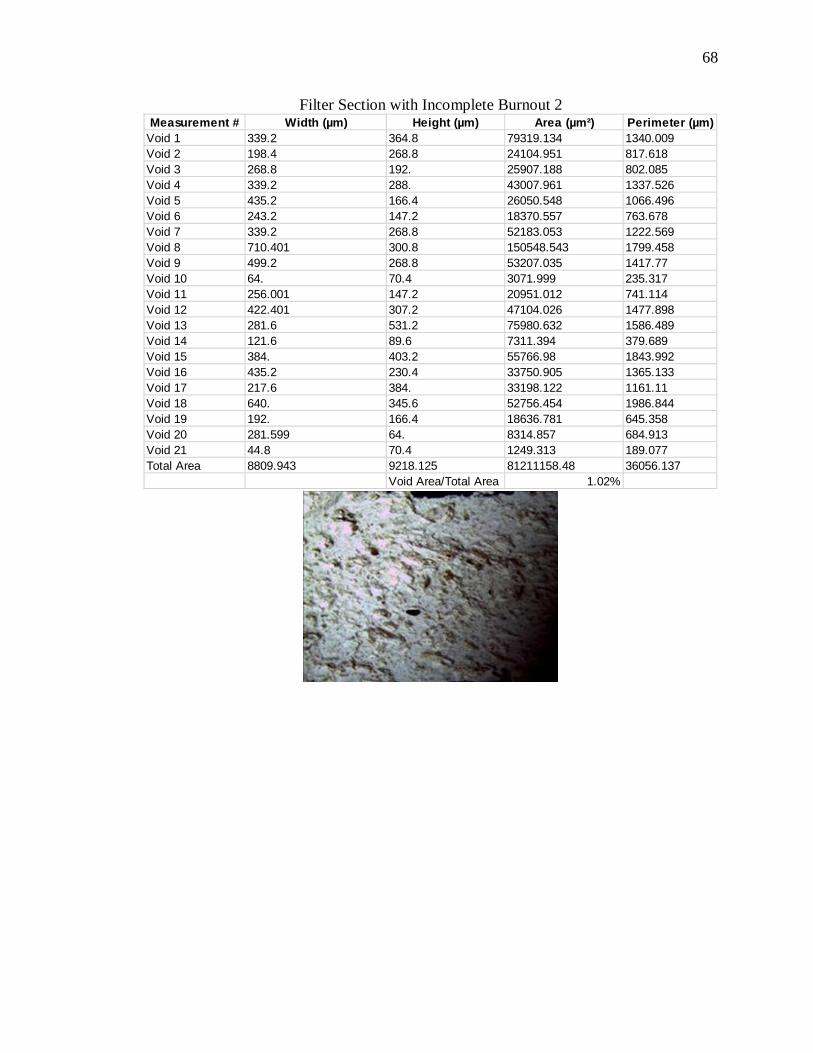
68
Filter Section with Incomplete Burnout 2
Measurement # Width (µm) Height (µm) Area (µm²) Perimeter (µm)Void 1 339.2 364.8 79319.134 1340.009Void 2 198.4 268.8 24104.951 817.618Void 3 268.8 192. 25907.188 802.085Void 4 339.2 288. 43007.961 1337.526Void 5 435.2 166.4 26050.548 1066.496Void 6 243.2 147.2 18370.557 763.678Void 7 339.2 268.8 52183.053 1222.569Void 8 710.401 300.8 150548.543 1799.458Void 9 499.2 268.8 53207.035 1417.77Void 10 64. 70.4 3071.999 235.317Void 11 256.001 147.2 20951.012 741.114Void 12 422.401 307.2 47104.026 1477.898Void 13 281.6 531.2 75980.632 1586.489Void 14 121.6 89.6 7311.394 379.689Void 15 384. 403.2 55766.98 1843.992Void 16 435.2 230.4 33750.905 1365.133Void 17 217.6 384. 33198.122 1161.11Void 18 640. 345.6 52756.454 1986.844Void 19 192. 166.4 18636.781 645.358Void 20 281.599 64. 8314.857 684.913Void 21 44.8 70.4 1249.313 189.077Total Area 8809.943 9218.125 81211158.48 36056.137
Void Area/Total Area 1.02%
69
BIBLIOGRAPHY
Brown, J., Sobsey, M.D. (2010). “Microbiological effectiveness of locally produced ceramic filters for drinking water treatment in Cambodia.” J. Water Health, 8(1), 1-10.
Boschi-Pinto, C., Velebit, L., and Shibuya, K. (2008). “Estimating child mortality due to
diarrhea in developing countries.” Bull World Health Organization 86(9), 710-717. Ceramics Manufacturing Working Group (2011). Best practice recommendations for local
manufacturing of ceramic pot filters for household water treatment. 1st edn, Center for Disease Control and Prevention, Atlanta, GA, USA.
Clasen, T.F., Bastable, A. (2003). “Fecal contamination of drinking water during
collection and household storage; the need to extend protection to the point of use.” J. Water Health, 1(3), 109-115.
Hubbel, L., Elmore, A.C., and Reidmeyer, M. (2015). “Comparison of a native clay soil and an engineered clay used in experimental ceramic pot filter fabrication.” Water Science and Technology: Water Supply, 15(3), 569- 577.
Hunter, P.R. (2009). “Household water treatment in developing countries: comparing
different intervention types using meta-regression.” Environmental Science and Technology, 43(23), 8991-8997.
Kalman, E.N., Oyanedel-Craver, V.A., and Smith, J.A. (2011). “Ceramic filters
impregnated with silver nanoparticles for point-of-use water treatment in rural Guatemala.” Journal of Environmental Engineering, 137(6), 407-415.
Lantagne, D., Klarman, M., Mayer, A., Preston, K., Napotnik, J., and Jellison, K. (2010).
“Effect of production variables on microbiological removal in locally-produced ceramic filters for household water treatment.” International Journal of Environmental Health Research, 20(3), 171-187.
Roberts, M. (2004). Field test of silver-impregnated ceramic water filters. People-Centered Approaches to Water and Environmental Sanitation, 30th WEDC International Conference, Vientiane, Lao PDR.
Soppe, A.I.A., Heijman, S.G.J., Gensburger, I., Shantz, A., van Halem, D., Kroesbergen,
J., Wubbles, G.H., and Smeets, P.W.M.H. (2015). “Critical parameters in the production of ceramic pot filters for household water treatment in developing nations.” Journal of Water and Health, 13(2), 587-599.
van Halem, D., Heijman, S.G.J., Soppe, A.I.A., van Dijk, J.C. and Amy, G.L. (2007)
Ceramic silver-impregnated pot filters for household drinking water treatment in developing countries: material characterization and performance study. Water Science and Technology: Water Supply, 7(5-6), 9-17.

70
World Health Organization (2011). Evaluating household water treatment options: health-based targets and microbiological performance specifications. WHO Press, Geneva, Switzerland.
World Health Organization and United Nations Children’s Fund. (2014). Progress on
sanitation and drinking-water – 2014 update. Joint Monitoring Programme for Water Supply and Sanitation, WHO, Geneva, Switzerland.
71
VITA
Travis Dean Gardner was born in Washington, Missouri, USA. In May 2015, he
received his B.S. in Environmental Engineering from the Missouri University of Science
and Technology, Rolla, Missouri, USA. As an undergraduate student, Travis dedicated
time to the Water Environment Federation, serving as president for one semester among
other positions held. He was also involved in Engineers Without Borders, Chi Epsilon
Civil Engineering Honor Society, and the Association of Environmental and Engineering
Geologists. Travis interned for Freeport McMoRan Inc. in the summer of 2014 and for
CDM Smith in the summer of 2016. He has served as a graduate teaching assistant for
Field Methods and International Engineering and Design in the Geological Engineering
Department. In May 2017 he received his Master’s Degree in Geological Engineering
from Missouri University of Science and Technology.