From Water Source to Tap of Ceramic Filters—Factors That ...
14
International Journal of Environmental Research and Public Health Article From Water Source to Tap of Ceramic Filters—Factors That Influence Water Quality Between Collection and Consumption in Rural Households in Nepal Regula Meierhofer 1, *, Carola Bänziger 1 , Sandro Deppeler 1 , Bal Mukund Kunwar 2 and Madan Bhatta 2 1 Department of Sanitation, Water and Solid Waste for Development (Sandec), Swiss Federal Institute of Aquatic Science and Technology (Eawag), Ueberlandstrasse 133, 8600 Dübendorf, Switzerland; [email protected] (C.B.); [email protected] (S.D.) 2 Helvetas Swiss Intercooperation Nepal, Dhobighat, Lalitpur G.P.O. Box 688, Nepal; [email protected] (B.M.K.); [email protected] (M.B.) * Correspondence: [email protected]; Tel.: +41-58-765-50-73 Received: 5 October 2018; Accepted: 30 October 2018; Published: 1 November 2018 Abstract: The study assessed changes in water quality between the water source and the tap of locally produced low cost ceramic water filters used by a community living in hygienically critical conditions in a remote mountainous area in Western Nepal. Data was collected from 42 rural households during two visits. The effectiveness of filter handling on its performance was assessed through microbiological analysis, structured household interviews and structured observations. Water quality decreased significantly when source water was filled into transport containers, while the use of the filters improved drinking water quality for about 40% of the households. Highly inadequate filter cleaning practices involving the use of contaminated raw water, hands (geo mean = 110 E. coli CFU/100 mL) and cleaning tools (geo mean = 80 E. coli CFU/100 mL) stained hygienic parts of the filter. The use of boiling water to disinfect the filters was significantly correlated with improved filter performance and should be further promoted. However, even disinfected filters achieved a very low average LRV for E. coli of 0.4 in the field and performed worse than during laboratory tests (LRV for E. coli of 1.5–2). Comprehensive training on adequate filter handling, as well as better filter products, are required to improve the impact of filter use. Keywords: drinking water quality; ceramic water filtration; household water treatment; recontamination; hygiene 1. Introduction More than 700 million people worldwide do not have access to an improved source for drinking water and an estimated 1.8 billion people do not consume safe drinking water [1]. In 2010 nearly 1.7 billion cases of diarrhea were caused by the lack of access to safe water, inadequate sanitation and hygiene [2] and 502,000 diarrheal deaths were estimated to be caused by inadequate drinking water [3]. Diarrhea is one of the most common illnesses among children in Nepal and continues to be a major cause of childhood morbidity and mortality. In 2016, diarrhea prevalence among children under the age of 5 was 8% [4]. Precise data on childhood mortality associated with diarrheal diseases in Nepal is not available; however, it has been estimated that approximately 25% of all child deaths are associated with acute diarrhea [5]. Unsafe water and lack of adequate sanitation facilities are important contributing factors to diarrheal diseases in Nepal [6]. The joint monitoring program (JMP) of the World Health Organization (WHO) and United Nations Children’s Fund (UNICEF) reported in 2015 that 92% of the Nepalese population had access Int. J. Environ. Res. Public Health 2018, 15, 2439; doi:10.3390/ijerph15112439 www.mdpi.com/journal/ijerph
-
Upload
khangminh22 -
Category
Documents
-
view
5 -
download
0
Transcript of From Water Source to Tap of Ceramic Filters—Factors That ...
International Journal of
Environmental Research
and Public Health
Article
From Water Source to Tap of Ceramic Filters—FactorsThat Influence Water Quality Between Collection andConsumption in Rural Households in Nepal
Regula Meierhofer 1,*, Carola Bänziger 1, Sandro Deppeler 1, Bal Mukund Kunwar 2 andMadan Bhatta 2
1 Department of Sanitation, Water and Solid Waste for Development (Sandec),Swiss Federal Institute of Aquatic Science and Technology (Eawag), Ueberlandstrasse 133,8600 Dübendorf, Switzerland; [email protected] (C.B.); [email protected] (S.D.)
2 Helvetas Swiss Intercooperation Nepal, Dhobighat, Lalitpur G.P.O. Box 688, Nepal;[email protected] (B.M.K.); [email protected] (M.B.)
* Correspondence: [email protected]; Tel.: +41-58-765-50-73
Received: 5 October 2018; Accepted: 30 October 2018; Published: 1 November 2018�����������������
Abstract: The study assessed changes in water quality between the water source and the tap of locallyproduced low cost ceramic water filters used by a community living in hygienically critical conditionsin a remote mountainous area in Western Nepal. Data was collected from 42 rural householdsduring two visits. The effectiveness of filter handling on its performance was assessed throughmicrobiological analysis, structured household interviews and structured observations. Water qualitydecreased significantly when source water was filled into transport containers, while the use ofthe filters improved drinking water quality for about 40% of the households. Highly inadequatefilter cleaning practices involving the use of contaminated raw water, hands (geo mean = 110 E. coliCFU/100 mL) and cleaning tools (geo mean = 80 E. coli CFU/100 mL) stained hygienic parts of thefilter. The use of boiling water to disinfect the filters was significantly correlated with improved filterperformance and should be further promoted. However, even disinfected filters achieved a very lowaverage LRV for E. coli of 0.4 in the field and performed worse than during laboratory tests (LRV forE. coli of 1.5–2). Comprehensive training on adequate filter handling, as well as better filter products,are required to improve the impact of filter use.
Keywords: drinking water quality; ceramic water filtration; household water treatment;recontamination; hygiene
1. Introduction
More than 700 million people worldwide do not have access to an improved source for drinkingwater and an estimated 1.8 billion people do not consume safe drinking water [1]. In 2010 nearly 1.7billion cases of diarrhea were caused by the lack of access to safe water, inadequate sanitation andhygiene [2] and 502,000 diarrheal deaths were estimated to be caused by inadequate drinking water [3].
Diarrhea is one of the most common illnesses among children in Nepal and continues to bea major cause of childhood morbidity and mortality. In 2016, diarrhea prevalence among childrenunder the age of 5 was 8% [4]. Precise data on childhood mortality associated with diarrheal diseasesin Nepal is not available; however, it has been estimated that approximately 25% of all child deaths areassociated with acute diarrhea [5]. Unsafe water and lack of adequate sanitation facilities are importantcontributing factors to diarrheal diseases in Nepal [6].
The joint monitoring program (JMP) of the World Health Organization (WHO) and UnitedNations Children’s Fund (UNICEF) reported in 2015 that 92% of the Nepalese population had access
Int. J. Environ. Res. Public Health 2018, 15, 2439; doi:10.3390/ijerph15112439 www.mdpi.com/journal/ijerph
Int. J. Environ. Res. Public Health 2018, 15, 2439 2 of 14
to improved water, and hence, met the specific MDG target [7]. However, water has been found to befecally contaminated in 82% of the households with access to an improved source. Only 14% of thehouseholds without improved drinking water use appropriate treatment methods [8].
Household water treatment, if applied correctly and consistently, is a strategy to reduce thehealth risks related to the consumption of unsafe drinking water [9–12]. Among different methodsfor household water treatment, such as solar water disinfection, chlorination and boiling, householdwater filtration is particularly promising due to its ease of application and high acceptance rate amongusers [13]. Also, in Nepal, households preferred the application of ceramic water filters when givena choice between different methods [14].
Several studies have documented the successful impact of ceramic water filters on improvingdrinking water quality at the point of consumption in the field context [15], including a reduction ofdiarrhea in communities using ceramic water filters for drinking water treatment [16–19]. A studyconducted in Kenya found that during six months of use, 71% of filtrate samples collected fromlocally produced ceramic pot filters contained less than 1 E. coli per 100 mL, and although interventionhouseholds reported less diarrhea, the difference was not significant [20]. Also, a recently conductedmeta-analysis on the impact of drinking water, sanitation and handwashing with soap on childhooddiarrhea found that interventions with filters to treat water at the point of consumption together withsafe storage reduced diarrhea risk by 61% [12].
Other studies assessed the performance of ceramic water filters on the treatment of water atthe point of use in low-income areas and revealed that their use in these settings might not alwayssufficiently improve drinking water quality. In their household evaluation of ceramic pot filters inTanzania, Lemons at al. found a moderate filter effectiveness with 42% of the filters reducing E. coli toless than 10 CFU/100 mL. The authors related this moderate filter performance to poor manufacturingquality [21]. Lange at al. evaluated the long-term performance of filters with silver-coated ceramiccandles that demonstrated more than 4 log removal of coliform bacteria in the lab. After 8 monthsof use by 51 households in a rural area in South Africa, they found that none of the filtrate sampleswas free of coliform bacteria and that 35% had higher contamination levels in the filtrate than in thetop bucket. Water temperature in the filter above 21 ◦C negatively influenced the filter’s efficiency, asdid the number of children in the household and the frequency that the filter was cleaned [22]. Also,Brown et al. and Mellor et al. have pointed out that improper maintenance of ceramic water filtersleads to declining effectiveness in microbiological removal [23,24]
The lack of supply chains for household water treatment products in remote areas of Nepal isone of the challenges hindering people living in these areas from applying water treatment practices.In the context of the total sanitation campaign launched by the government of Nepal, developmentorganizations working in this field have started to combine behavior change interventions, promotingimproved practices for drinking water treatment, sanitation and hygiene with activities to triggerthe private sector to make ceramic filters available in more remote areas. As a consequence, locallyproduced low-cost ceramic candle filters, affordable to local communities, are increasingly sold in ruralareas of Nepal. This study was conceived after a water quality and hygiene intervention that promotedthese filters in remote areas in Western Nepal did not result in significant water quality improvementat the point of consumption. The goal was to gain a better understanding of water quality changesbetween the water source, the water transport containers and the tap of ceramic water filters and toassess the influence of critical water and filter handling factors on filter performance and water quality
2. Materials and Methods
2.1. Context of the Study
Between 2014 and 2016, Helvetas Swiss Intercooperation implemented a water, sanitation andhygiene intervention in remote hilly areas in Acham, Dailekh, Jajarkot and Kalikot Districts in WesternNepal where the organization previously had installed piped water supply schemes. The intervention
Int. J. Environ. Res. Public Health 2018, 15, 2439 3 of 14
consisted of trainings on household water treatment, safe storage, sanitation, handwashing and wastemanagement that took place during three household visits and four group sessions. The projecttriggered the establishment of supply chains for locally produced low cost ceramic candle water filtersand buckets with taps for handwashing in the project areas. The ceramic filters available in the localmarket consist of two steel bucket containers with one or two ceramic candles in the upper bucket.Different brands of ceramic candles are available that were produced either in India or Nepal: Aqua Fill,Milton, Surya Vinayak and Surya Nepal. These filters are available for 10 to 14 USD, while replacementcandles cost 1 to 1.50 USD). None of the candles promoted and sold in the field contained colloidalsilver coatings.
The project evaluation, involving 311 randomly selected households, revealed that as a result ofthe intervention, drinking water treatment increased from 18% at baseline to 86% after the intervention.77% of the households had purchased a ceramic water filter, 8% used chlorine and 6% boiled water.Water quality analysis revealed that 74% of households had less than 10 E. coli CFU/100 mL in theirsource water, while 5.5% had more than 100 CFU/100 mL. However, at the point of consumption,after collection, transport, treatment and storage (the water was mostly stored in the lower bucket ofthe ceramic water filter), the water contained less than 10 E. coli CFU/100 mL in 47% of the householdsand more than 100 CFU/100 mL in 22%. In 65% of the households using a ceramic water filter,contamination was higher after filtration than at the source. No deterioration of source water wasobserved in households using chlorine to treat the water. 91% of the households that tested positivefor residual chlorine had an improved water quality [25]. This follow-up study was designed andimplemented to better understand the low performance rate of ceramic water filters in the project areaand to assess the influence of household hygiene and filter handling practices on water quality changes.
In the project area in Dailekh District, the literacy rate among the main caretakers of children is44%. 36% have completed informal education, 14.5% primary school, 11.7% secondary school and 9.4%have completed higher education. 89.1% of the households generate their income through agricultureand 40% are female headed households. 31% of these have a husband with foreign employment.22% of the households produce sufficient food for nine months, 31% for six to nine months and 47%for less than six months. The households in the area do not have access to an electrical grid and usewood for cooking [25].
2.2. Laboratory Evaluation of the Ceramic Water Filters
Helvetas evaluated the microbiological removal efficiency and effective life span of all four filterbrands promoted in the project area over a period of nine months in a laboratory setting. The removalefficiency of all tested brands declined over time, with a significant drop after the first six months of use.The average Log removal value (LRV) for all brands over a period of nine months was 1.5 (SD = 0.47).Detailed results are presented elsewhere [26]. During another laboratory evaluation, ENPHO foundthe following LRV’s for E. coli: Milton 1.9 (SD = 1.2), Surya Vinayak 2.2 (SD = 1.2) and Surya Nepal 1.8(SD = 1) [27].
2.3. Study Design
Data for the field evaluation was collected during March and April 2017 from 42 rural householdsusing ceramic water filters in Dullu Municipality-3 in Dailekh District through structured observationof water transport and of the cleaning of ceramic water filters, quantitative structured householdinterviews and water quality and bacteriological analysis. Sample size calculations with G-Powerrevealed a sample size of 42 households to detect a medium effect of 0.15 at a one-tailed alpha of0.05 and a statistical power of 80% with multiple linear regression and five predictor variables [28].The study was conducted in accordance with the Declaration of Helsinki, and the Ethical ReviewCommittee of the Swiss Federal Institute of Aquatic Science and Technology approved the studyprotocol on 31 December 2016. Households were informed about the goal of the study and the
Int. J. Environ. Res. Public Health 2018, 15, 2439 4 of 14
procedure of data collection, and only those households that provided informed consent were involvedin the study.
A team of a local and an international researcher accompanied the main person responsible forwater management in the household to the main drinking water source (public tap stand for 66.7%,protected source for 21.5% and piped access in the house for 11.8% of households) and conducteda structured observation on how the water users handled the transport container before it was filled atthe water source. Water sample WQT1 was taken from the source by letting the water run for someseconds from the tap stand at the water source and then filling 100 mL of water into a sterile NascoWhirl-Pak. Back at the household, water sample WQT2 was taken from the transport container bypouring 100 mL of water from the container into a sterile Whirl-Pak. Both buckets of the ceramicwater filter were emptied, and the upper bucket was filled with water from the transport container.Water sample WQT4 was taken from the tap of the ceramic water filter after filtration. Afterwards,the filter was emptied again and several bacteriological samples were taken from the empty filter.Swab test 1a was taken from the outflow of the ceramic candle by making five circles with the swabfrom the top to the bottom of the outflow and Swab test 2a was taken from the tap of the ceramic waterfilter by making five circles with the Nissui Compact Dry cotton swabs from the top to the bottomof the tap of the filter. The swabs were inserted into the test flask containing 1 mL of sterile watersolution with 9.0 mg sodium chloride, 12.7 µg potassium dihydrogen phosphate and 78.5 µg disodiumphosphate. The flask was shaken for 20 s and the 1 mL solution was poured on Nissui Compact DryColi-scan plates and incubated for 24 h at 35 ± 2 ◦C.
For the bacteriological test BQT1, the filter was taken apart. The lower, now empty bucket of thefilter, was directly filled with 500 mL of sterile water. From this volume, 100 mL of water was extractedwith a sterile syringe and filled into a sterile Whirl-Pak.
The interviewee was then requested to clean the filter as she normally would do it, and theinterviewers followed this process with a structured observation. After cleaning the ceramic filter,the process of taking bacteriological samples from the filter described above was repeated by takingSwab test 1b from the outflow of the ceramic candle, Swab test 2b from the tap of the ceramic waterfilter and BQT2 from the reservoir of the treated water. After this, the interviewees filled the upperbucket of the filter with water they had previously collected (WQT1). Water sample WQT5 was takenfrom the tap of the ceramic water filter after filtration.
Next, a bacteriological test (BQT3) was done on the interviewees’ hands. They were requested tofirst put the right hand into a 2 L Whirl-Pak which was filled with 1 L of sterile water, swirl it for 10 s,and then put the left hand into the same Whirl-Pak and also swirl it for 10 s. For analysis, a 100 mLwater sample was extracted from the 2 L Whirl-Pak. If the interviewee used a tool to clean the ceramicwater filter, she was requested to put this cloth or sponge into another 2 L Whirl-Pak, which was alsofilled with 1 L of sterile water. The bag was shaken for 10 s and a 100 mL water sample was extractedto conduct water quality analysis (BQT4).
To assess the contamination of clean water through the filtration process, the interviewers emptiedthe filter again and filled sterile water into the upper bucket of the ceramic water filter. Water sampleWQT6 was taken from the tap of the ceramic water filter after filtration. To assess the performanceof clean, not contaminated filters, the filter was emptied and disinfected by filling the upper andlower receptacles with boiling water. The use of chlorinated water was considered as an alternativedisinfection option to using boiling water. However, chlorine is not available in the project area andtherefore could not be used. Old candles were removed and replaced by new candles. After this,interviewees again filled the upper bucket of the filter with water they had previously collected(WQT1). Water sample WQT7 was collected from the tap of the filter after filtration.
All water samples were kept in Whirl-Paks inside cooler bags and were analyzed at the field site,using membrane filtration techniques. 100 mL water samples were passed through 0.45 µm Milliporecellulose membrane filters, using sterilized filtration equipment. Filter pads were plated on Nissui
Int. J. Environ. Res. Public Health 2018, 15, 2439 5 of 14
Compact Dry Coli-scan plates and incubated for 24 h at 35 ± 2 ◦C. Colonies of total coliforms andE. coli were counted.
Quantitative, structured household interviews were conducted after the observed filter cleaningprocess. The questionnaire contained closed ended, multiple choice questions mostly in categoricalvariables, but also Likert-scale answer categories and some scale variables. The interviews werecomplemented by structured observations. The questionnaire was coded in ODK on tablets andcontained questions on demographics, the handling of containers used for the transport and storageof water, the operation and maintenance practices of ceramic water filters. Also questions andobservations on sanitation and hygiene infrastructure and practices were included as proxy indicatorsfor the hygienic conditions and possible bacterial loads in the household environment which can haveimpact on water quality during filter handling.
At the end of the household visit, households were trained on adequate operation andmaintenance procedures for a ceramic water filter and were given a flyer with instructions. In particular,they were informed that the following parts of the filter should not get into contact with contaminatedmaterials or surfaces: the bottom of the upper bucket, the inside of the lower bucket, the outflow of thecandle and the tap of the filter. They were instructed that the candle screws should always be tight.In the case of filter clogging, the candles should be cleaned with a soft brush. Once a week, boilingwater should be poured into the upper and the lower buckets of the filter and left for at least 10 min.
About one week after the first visit, the interviewers visited the households again and requestedthat the buckets of the filter be emptied and that the upper buckets be refilled with fresh water.The interviewers took the first water sample before filtration and the second sample from the tap of thefilter after filtration. How people in the households handled the filter during emptying and refillingwas observed and a short quantitative structured interview was conducted on filter operation andmaintenance. Households were also asked an open question on how they had cleaned their filterssince the first visit. The question was transcribed and coded, and household were grouped into threecategories. The category of best practice was attributed if people said that they only used boiled waterto clean the inside of the bucket for filtered water, and if they poured boiling water into both bucketsand let them stand for at least 10 min. The category of good practice was attributed if people saidthat they used boiled water to clean the bucket for filtered water. The category of bad practice wasattributed if people said that they used untreated water to clean both filter buckets. Five householdscould not be categorized because the information they provided on their filter cleaning practiceswas insufficient.
2.4. Data Analysis
Data was imported into IBM SPSS Statistics 24 (IBM Corp., Armonk, NY, USA) for statisticalanalysis. General demographics, container and filter handling factors, as well as sanitation and hygieneinfrastructure and practices, were analyzed using descriptive statistics. A two-tailed t-test was used toassess the significance of the differences between Log10 transformed water quality variables. Counts ofzero E. coli or zero total coliforms were replaced by 0.5 to be able to do logarithmic transformationsand calculate geometric means.
The influence of filter handling on its performance was assessed by correlating filter handlingpractices and hygiene conditions as stated in the interviews and data on the filter’s contamination levelsbefore the observed cleaning process with the filter’s LRV for E. coli. Variables that were significantlycorrelated with the outcome variable during bivariate analysis were further analyzed by multivariatelinear regression. Factors with the lowest significance levels were excluded from the presented model.
Int. J. Environ. Res. Public Health 2018, 15, 2439 6 of 14
3. Results
3.1. From Source to Transport Container, First Visit
In the study area, the households contain an average of 6.4 (SD = 1.9) people, including 0.8(SD = 0.9) children that are going to school. A household spends an average of 3 min (SD = 3.2) tocollect water from a piped source in the community (67%) or from a protected source (17%). 12% ofthe households have a piped water connection in their compound. The buckets used to collect water atthe source and to transport it home were: narrow necked aluminum (21%), copper (14%) or plasticcontainers (26%), plastic buckets (31%) and aluminum buckets (5%). 41% of the households coveredthe water containers with a lid during transport.
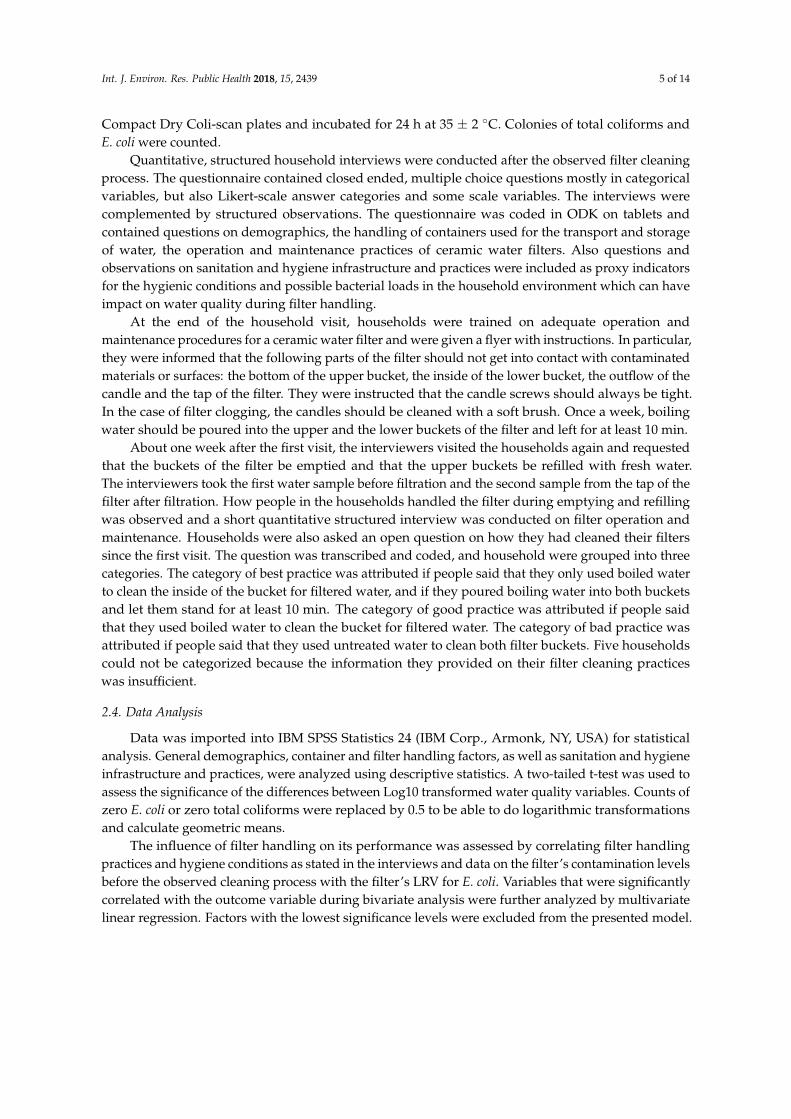
The filling of water from the source into containers and transporting them led to a statisticallysignificant deterioration of water quality (t = −3.09, p = 0.004, r = 0.43 for Log10 transformed counts ofE. coli). Counts of E. coli increased from a geometric mean of 22 CFU/100 mL (10–90 Percentile:1–282 CFU/100 mL) at the source to a geometric mean of 41 CFU/100 mL (10–90 Percentile:3–456 CFU/100 mL) in the transport container (see Figure 1).
Int. J. Environ. Res. Public Health 2018, 15, x 6 of 13
plastic buckets (31%) and aluminum buckets (5%). 41% of the households covered the water containers with a lid during transport.
The filling of water from the source into containers and transporting them led to a statistically significant deterioration of water quality (t = −3.09, p = 0.004, r = 0.43 for Log10 transformed counts of E. coli). Counts of E. coli increased from a geometric mean of 22 CFU/100 mL (10–90 Percentile: 1–282 CFU/100 mL) at the source to a geometric mean of 41 CFU/100 mL (10–90 Percentile: 3–456 CFU/100 mL) in the transport container (see Figure 1).
Figure 1. Counts of E. coli at the source, in the transport container and at the tap of the ceramic water filter during the first and second household visits.
98% of the interviewees said that they clean the container used to transport water every day. Observations revealed that people in all households used raw water to clean the inner side of the transport containers, mainly using their hands (95.2%). Other materials used were soap (16.7%), a soft cloth (16.7%), ash (5%) and a rough cloth (5%). The mean time required to clean the containers was 1.8 min (SD = 1.7). Neither the type of container used, nor any of the observed transport container cleaning factors, was significantly correlated with changes in water quality between water source and the transport container. The counts of E. coli after transportation were significantly correlated with the water quality at the source (Pearson’s r = 0.7, p < 0.001), indicating that higher contamination levels at the source led to higher contamination levels in the transport container.
3.2. From Transport Container to Tap of Ceramic Water Filter, First Visit
3.2.1. Water Quality
Water quality measured at the tap of the ceramic filters varied highly among different households. The geometric mean of E. coli was 64 CFU/100 mL (10–90 Percentile: 8–954 CFU/100 mL) before the observed cleaning process and 44 CFU/100 mL (10–90 Percentile: 1–945 CFU/100 mL) after it. This difference was not significant (t = 1.3, p = 0.2).
The quality of water taken from the tap of the ceramic water filter was statistically not different from the water poured into the filter, neither before (t = −1.1, p = 0.3), nor after the observed filter cleaning process (t = −0.2, p = 0.8), with mean LRV’s for E. coli of −0.2 CFU/100 mL respectively −0.04 CFU/100 mL. The use of the filter before the observed cleaning process improved water quality for 17 households (40%), while the use of the filter after the observed cleaning process improved water quality for 21 households (50%). Figure 1 presents counts of E. coli at the source, in the transport
Figure 1. Counts of E. coli at the source, in the transport container and at the tap of the ceramic waterfilter during the first and second household visits.
98% of the interviewees said that they clean the container used to transport water every day.Observations revealed that people in all households used raw water to clean the inner side of thetransport containers, mainly using their hands (95.2%). Other materials used were soap (16.7%), a softcloth (16.7%), ash (5%) and a rough cloth (5%). The mean time required to clean the containers was1.8 min (SD = 1.7). Neither the type of container used, nor any of the observed transport containercleaning factors, was significantly correlated with changes in water quality between water source andthe transport container. The counts of E. coli after transportation were significantly correlated with thewater quality at the source (Pearson’s r = 0.7, p < 0.001), indicating that higher contamination levels atthe source led to higher contamination levels in the transport container.
Int. J. Environ. Res. Public Health 2018, 15, 2439 7 of 14
3.2. From Transport Container to Tap of Ceramic Water Filter, First Visit
3.2.1. Water Quality
Water quality measured at the tap of the ceramic filters varied highly among different households.The geometric mean of E. coli was 64 CFU/100 mL (10–90 Percentile: 8–954 CFU/100 mL) beforethe observed cleaning process and 44 CFU/100 mL (10–90 Percentile: 1–945 CFU/100 mL) after it.This difference was not significant (t = 1.3, p = 0.2).
The quality of water taken from the tap of the ceramic water filter was statistically not differentfrom the water poured into the filter, neither before (t = −1.1, p = 0.3), nor after the observed filtercleaning process (t = −0.2, p = 0.8), with mean LRV’s for E. coli of −0.2 CFU/100 mL respectively−0.04 CFU/100 mL. The use of the filter before the observed cleaning process improved water qualityfor 17 households (40%), while the use of the filter after the observed cleaning process improved waterquality for 21 households (50%). Figure 1 presents counts of E. coli at the source, in the transportcontainer, at the tap of the ceramic water filter before and after the observed cleaning process, and atthe tap of the ceramic water filter during the second household visit.
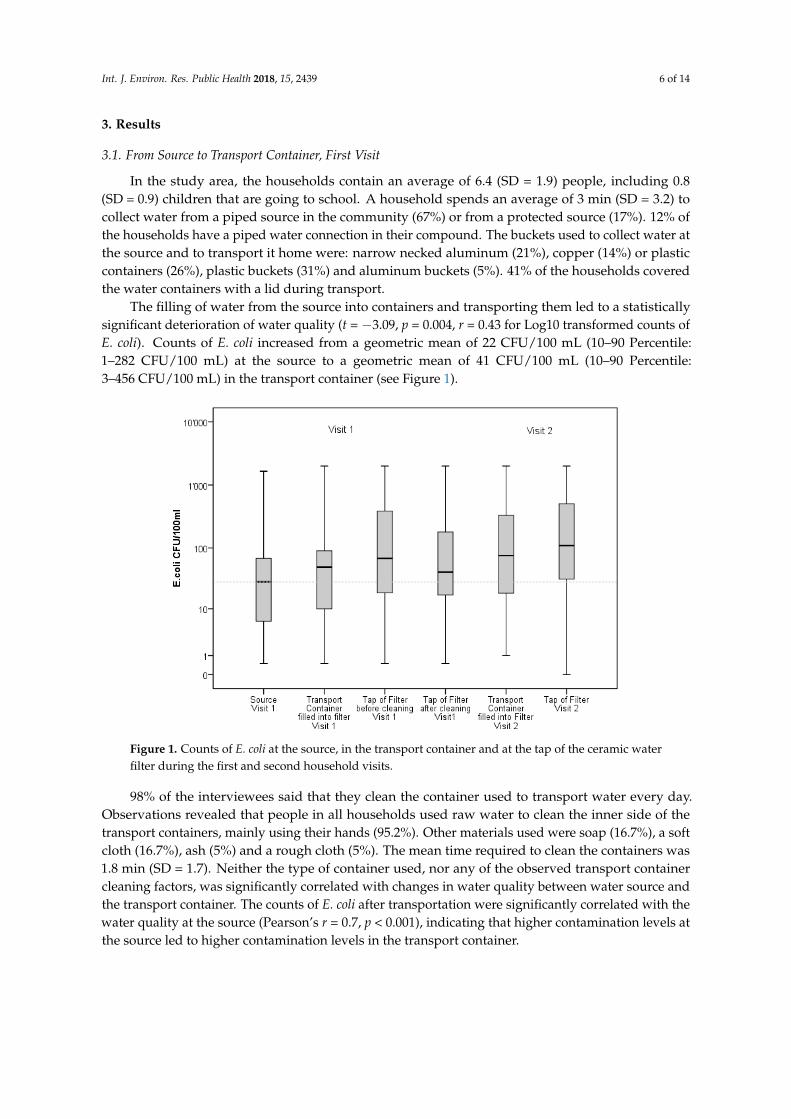
Sterile water passed through the filter after the observed cleaning process contained a geometricmean of E. coli of 18 CFU/100 mL (10–90 Percentile: 2–187 CFU/100 mL) after filtration. Figure 2 showsthat the filters contaminated the sterile water with a mean LRV for E. coli of −1.6 (SD = 0.8). When waterfrom the transport container was filled into the filters that had been disinfected by the researchers andequipped with new candles, the household filters achieved a mean LRV for E. coli of 0.42 (SD = 1.2).Water passed through such filters contained a geometric mean of E. coli of 8 CFU/100 mL.
Int. J. Environ. Res. Public Health 2018, 15, x 7 of 13
container, at the tap of the ceramic water filter before and after the observed cleaning process, and at the tap of the ceramic water filter during the second household visit.
Sterile water passed through the filter after the observed cleaning process contained a geometric mean of E. coli of 18 CFU/100 mL (10–90 Percentile: 2–187 CFU/100 mL) after filtration. Figure 2 shows that the filters contaminated the sterile water with a mean LRV for E. coli of −1.6 (SD = 0.8). When water from the transport container was filled into the filters that had been disinfected by the researchers and equipped with new candles, the household filters achieved a mean LRV for E. coli of 0.42 (SD = 1.2). Water passed through such filters contained a geometric mean of E. coli of 8 CFU/100 mL.
Figure 2. Log removal values of contaminated and disinfected household filters: (A) water from the transport container passed through a contaminated filter; (B) sterile water passed through a contaminated filter and (C) water from the transport container passed through a disinfected filter.
Figure 2 shows that, although the use of disinfected filters slightly improved water quality, the use of non-disinfected filters did not improve the quality of water for more than half of the households. In all households, sterile water was contaminated by passing it through the filter.
3.2.2. Filter Handling
During the interview, 64% of the households stated that they had not received any instructions on filter operation and maintenance from the seller of the filter and the filter cleaning practices of the households were observed to be highly inadequate. People in all households used raw water and their hands to clean the filters, while a majority used a cloth to wash the hygienic parts of the filter. 5% of the households said that they use boiled water to wash the lower bucket of the filter. Peoples’ hands and the cloths used for cleaning were both highly contaminated, with a geometric mean of E. coli of 110 CFU/100 mL (10–90 Percentile: 6–2000 CFU/100 mL) on hands and 80 CFU/100 mL (10–90 Percentile: <1–2000 CFU/100 mL) on the cloths. Details on filter handling and hygiene practices are presented in Table S1 in the supporting materials.
Bacteriological tests on sterile water poured into the lower bucket of the filters found a geometric mean of 30 E. coli CFU/100 mL (10–90 Percentile: 1–1940 CFU/100 mL) before the observed cleaning process. The geometric mean was 70 E. coli CFU/100 mL 10–90 Percentile: 2–2000 CFU/100 mL) after the observed cleaning process. Swab tests on the outflow of the ceramic candle and the tap of the filter did not detect any E. coli.
Observation of the filter cleaning process during the first visit revealed that all households took the two buckets of the filter apart for cleaning. During the cleaning process, 83% of the households
Figure 2. Log removal values of contaminated and disinfected household filters: (A) water fromthe transport container passed through a contaminated filter; (B) sterile water passed througha contaminated filter and (C) water from the transport container passed through a disinfected filter.
Figure 2 shows that, although the use of disinfected filters slightly improved water quality, the useof non-disinfected filters did not improve the quality of water for more than half of the households.In all households, sterile water was contaminated by passing it through the filter.
Int. J. Environ. Res. Public Health 2018, 15, 2439 8 of 14
3.2.2. Filter Handling
During the interview, 64% of the households stated that they had not received any instructionson filter operation and maintenance from the seller of the filter and the filter cleaning practices of thehouseholds were observed to be highly inadequate. People in all households used raw water andtheir hands to clean the filters, while a majority used a cloth to wash the hygienic parts of the filter.5% of the households said that they use boiled water to wash the lower bucket of the filter. Peoples’hands and the cloths used for cleaning were both highly contaminated, with a geometric mean ofE. coli of 110 CFU/100 mL (10–90 Percentile: 6–2000 CFU/100 mL) on hands and 80 CFU/100 mL(10–90 Percentile: <1–2000 CFU/100 mL) on the cloths. Details on filter handling and hygiene practicesare presented in Table S1 in the supporting materials.
Bacteriological tests on sterile water poured into the lower bucket of the filters found a geometricmean of 30 E. coli CFU/100 mL (10–90 Percentile: 1–1940 CFU/100 mL) before the observed cleaningprocess. The geometric mean was 70 E. coli CFU/100 mL 10–90 Percentile: 2–2000 CFU/100 mL) afterthe observed cleaning process. Swab tests on the outflow of the ceramic candle and the tap of the filterdid not detect any E. coli.
Observation of the filter cleaning process during the first visit revealed that all households tookthe two buckets of the filter apart for cleaning. During the cleaning process, 83% of the householdsplaced critical parts of the filter, such as the outflow of the ceramic candle (65%), the bottom of theraw water reservoir (48%), the inner side of the clean water reservoir (35%) and the tap of the cleanwater reservoir (45%), on contaminated surfaces or touched it with contaminated materials. 80% of thehouseholds used soap to clean the outside of the filters, while 31% used soap to clean the inner sideof the lower filter buckets. 5% of the households used boiled water to clean the lower filter buckets.The actual process of filter cleaning was predicted well during the interview, but we assume thata slightly more rigorous approach was applied under observation such as the use of more water forcleaning and longer as well as more thorough rubbing of the different parts.
The following factors were significantly correlated with the filter’s LRV before the observedcleaning process in bivariate analysis:
• Candles had been replaced (Pearson’s r = 0.73, p = 0.021)• Slippers (shoes) are available in the toilet (Pearson’s r = 0.4, p = 0.011)• Boiled water is used to clean the filter (Pearson’s r = 0.396, p = 0.009)• Amount of water collected daily by the household (Pearson’s r = 0.347, p = 0.025• The frequency of filter cleaning (Pearson’s r = 0.312, p = 0.044)• Contamination level in the lower bucket of the filter (Pearson’s r = −0.564, p < 0.001)• A soft cloth is used for the daily cleaning of the filter (Pearson’s r = −0.457, p = 0.002)• A soft cloth is used for the daily cleaning of the transport container (Pearson’s r = −0.436, p = 0.004)
Except for the availability of slippers (shoes) in the toilet, none of the factors used as proxyindicators for household cleanliness was significantly correlated with the filters’s LRV (type of toiletin the household, cleanliness of the toilet, availability of a brush in the toilet, availability of waterto flush the toilet, availability and type of handwashing facilities in the household, condition of thehandwashing facilities, availability of soap and water at the handwashing facilities, frequency ofhand washing per day). The availability of slippers (shoes) in the toilet indicates that the householdgenerally had a higher awareness on the importance of hygienic practices. Also, the variable waspositively correlated with the availability of piped water in the household (χ2(1) = 5.09, p = 0.024),a factor which again supports hygiene. Households with slippers (shoes) in the toilet were more likelyto report that they had not received instructions on filter handling (χ2(1) = 8.5, p = 0.004) and they wereless likely to use soap for the cleaning of filters (χ2(1) = 5.5, p = 0.019).
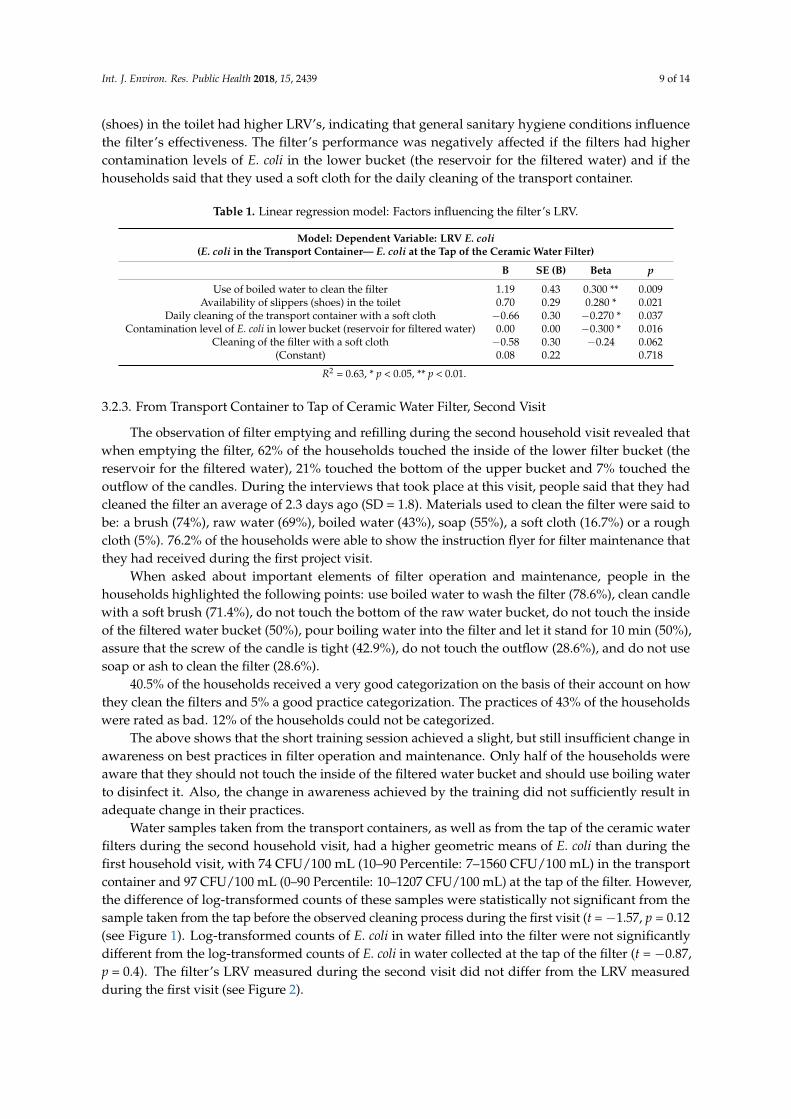
As presented in Table 1, a multivariate linear regression model with the filter’s LRV before theobserved cleaning process as outcome variable revealed that the performance of the filter could besignificantly improved by the use of boiled water during filter cleaning. Households with slippers
Int. J. Environ. Res. Public Health 2018, 15, 2439 9 of 14
(shoes) in the toilet had higher LRV’s, indicating that general sanitary hygiene conditions influencethe filter’s effectiveness. The filter’s performance was negatively affected if the filters had highercontamination levels of E. coli in the lower bucket (the reservoir for the filtered water) and if thehouseholds said that they used a soft cloth for the daily cleaning of the transport container.
Table 1. Linear regression model: Factors influencing the filter’s LRV.
Model: Dependent Variable: LRV E. coli(E. coli in the Transport Container— E. coli at the Tap of the Ceramic Water Filter)
B SE (B) Beta p
Use of boiled water to clean the filter 1.19 0.43 0.300 ** 0.009Availability of slippers (shoes) in the toilet 0.70 0.29 0.280 * 0.021
Daily cleaning of the transport container with a soft cloth −0.66 0.30 −0.270 * 0.037Contamination level of E. coli in lower bucket (reservoir for filtered water) 0.00 0.00 −0.300 * 0.016
Cleaning of the filter with a soft cloth −0.58 0.30 −0.24 0.062(Constant) 0.08 0.22 0.718
R2 = 0.63, * p < 0.05, ** p < 0.01.
3.2.3. From Transport Container to Tap of Ceramic Water Filter, Second Visit
The observation of filter emptying and refilling during the second household visit revealed thatwhen emptying the filter, 62% of the households touched the inside of the lower filter bucket (thereservoir for the filtered water), 21% touched the bottom of the upper bucket and 7% touched theoutflow of the candles. During the interviews that took place at this visit, people said that they hadcleaned the filter an average of 2.3 days ago (SD = 1.8). Materials used to clean the filter were said tobe: a brush (74%), raw water (69%), boiled water (43%), soap (55%), a soft cloth (16.7%) or a roughcloth (5%). 76.2% of the households were able to show the instruction flyer for filter maintenance thatthey had received during the first project visit.
When asked about important elements of filter operation and maintenance, people in thehouseholds highlighted the following points: use boiled water to wash the filter (78.6%), clean candlewith a soft brush (71.4%), do not touch the bottom of the raw water bucket, do not touch the insideof the filtered water bucket (50%), pour boiling water into the filter and let it stand for 10 min (50%),assure that the screw of the candle is tight (42.9%), do not touch the outflow (28.6%), and do not usesoap or ash to clean the filter (28.6%).
40.5% of the households received a very good categorization on the basis of their account on howthey clean the filters and 5% a good practice categorization. The practices of 43% of the householdswere rated as bad. 12% of the households could not be categorized.
The above shows that the short training session achieved a slight, but still insufficient change inawareness on best practices in filter operation and maintenance. Only half of the households wereaware that they should not touch the inside of the filtered water bucket and should use boiling waterto disinfect it. Also, the change in awareness achieved by the training did not sufficiently result inadequate change in their practices.
Water samples taken from the transport containers, as well as from the tap of the ceramic waterfilters during the second household visit, had a higher geometric means of E. coli than during thefirst household visit, with 74 CFU/100 mL (10–90 Percentile: 7–1560 CFU/100 mL) in the transportcontainer and 97 CFU/100 mL (0–90 Percentile: 10–1207 CFU/100 mL) at the tap of the filter. However,the difference of log-transformed counts of these samples were statistically not significant from thesample taken from the tap before the observed cleaning process during the first visit (t = −1.57, p = 0.12(see Figure 1). Log-transformed counts of E. coli in water filled into the filter were not significantlydifferent from the log-transformed counts of E. coli in water collected at the tap of the filter (t = −0.87,p = 0.4). The filter’s LRV measured during the second visit did not differ from the LRV measuredduring the first visit (see Figure 2).
Int. J. Environ. Res. Public Health 2018, 15, 2439 10 of 14
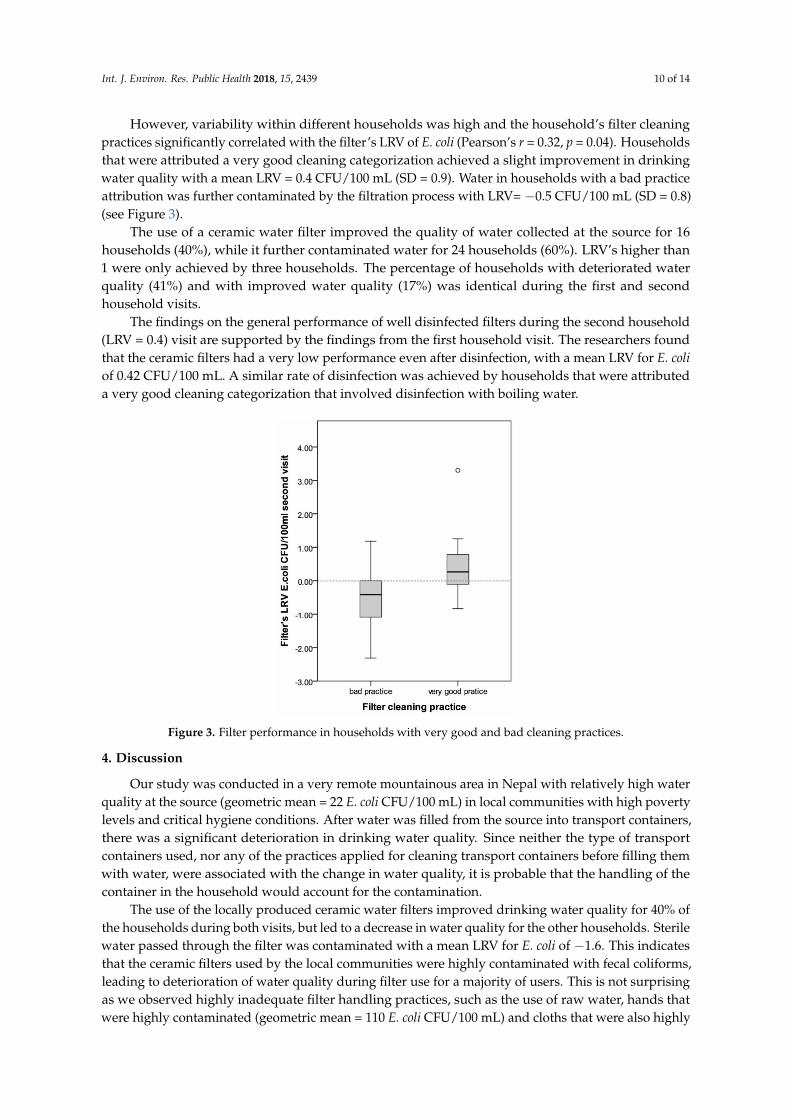
However, variability within different households was high and the household’s filter cleaningpractices significantly correlated with the filter’s LRV of E. coli (Pearson’s r = 0.32, p = 0.04). Householdsthat were attributed a very good cleaning categorization achieved a slight improvement in drinkingwater quality with a mean LRV = 0.4 CFU/100 mL (SD = 0.9). Water in households with a bad practiceattribution was further contaminated by the filtration process with LRV= −0.5 CFU/100 mL (SD = 0.8)(see Figure 3).
The use of a ceramic water filter improved the quality of water collected at the source for 16households (40%), while it further contaminated water for 24 households (60%). LRV’s higher than1 were only achieved by three households. The percentage of households with deteriorated waterquality (41%) and with improved water quality (17%) was identical during the first and secondhousehold visits.
The findings on the general performance of well disinfected filters during the second household(LRV = 0.4) visit are supported by the findings from the first household visit. The researchers foundthat the ceramic filters had a very low performance even after disinfection, with a mean LRV for E. coliof 0.42 CFU/100 mL. A similar rate of disinfection was achieved by households that were attributeda very good cleaning categorization that involved disinfection with boiling water.Int. J. Environ. Res. Public Health 2018, 15, x 10 of 13
Figure 3. Filter performance in households with very good and bad cleaning practices.
4. Discussion
Our study was conducted in a very remote mountainous area in Nepal with relatively high water quality at the source (geometric mean = 22 E. coli CFU/100 mL) in local communities with high poverty levels and critical hygiene conditions. After water was filled from the source into transport containers, there was a significant deterioration in drinking water quality. Since neither the type of transport containers used, nor any of the practices applied for cleaning transport containers before filling them with water, were associated with the change in water quality, it is probable that the handling of the container in the household would account for the contamination.
The use of the locally produced ceramic water filters improved drinking water quality for 40% of the households during both visits, but led to a decrease in water quality for the other households. Sterile water passed through the filter was contaminated with a mean LRV for E. coli of −1.6. This indicates that the ceramic filters used by the local communities were highly contaminated with fecal coliforms, leading to deterioration of water quality during filter use for a majority of users. This is not surprising as we observed highly inadequate filter handling practices, such as the use of raw water, hands that were highly contaminated (geometric mean = 110 E. coli CFU/100 mL) and cloths that were also highly contaminated (80 E. coli CFU/100 mL), to clean hygienic parts of the filter. The regression analysis revealed that regular cleaning of the filter with a soft cloth was significantly associated with water contamination during filter use.
Previous studies have documented the significant impact ceramic water filter interventions had on improving drinking water quality and, subsequently, reducing health risks [15–17,19,20,29]. However, contrary to our expectations, this intervention did not achieve a satisfactory improvement in drinking water quality at the point of consumption. This is partly due to poor filter handling practices and use in an environment with low hygiene and high loads of fecal bacteria in the households. Yet, households had access to source water of quite high quality and, therefore, maximally obtainable LRV’s were low. 40.5% of the households were attributed a very good cleaning categorization which included the use of boiling water to regularly disinfect the filter. These households achieved a LRV for E. coli of 0.4.
The use of filters of low quality contributed to their low performance in the field. Filters previously used by households that were disinfected by researchers before collecting the water sample at the filter’s tap achieved a LRV of only 0.42–identical to households that were attributed a good cleaning categorization. This is significantly lower than the disinfection efficiency of the same filter brands obtained during laboratory analysis, which was LRV of 1.5–2 [26,27], and indicates that the extended use of these filters by local households in the field reduced the quality of the filter
Figure 3. Filter performance in households with very good and bad cleaning practices.
4. Discussion
Our study was conducted in a very remote mountainous area in Nepal with relatively high waterquality at the source (geometric mean = 22 E. coli CFU/100 mL) in local communities with high povertylevels and critical hygiene conditions. After water was filled from the source into transport containers,there was a significant deterioration in drinking water quality. Since neither the type of transportcontainers used, nor any of the practices applied for cleaning transport containers before filling themwith water, were associated with the change in water quality, it is probable that the handling of thecontainer in the household would account for the contamination.
The use of the locally produced ceramic water filters improved drinking water quality for 40% ofthe households during both visits, but led to a decrease in water quality for the other households. Sterilewater passed through the filter was contaminated with a mean LRV for E. coli of −1.6. This indicatesthat the ceramic filters used by the local communities were highly contaminated with fecal coliforms,leading to deterioration of water quality during filter use for a majority of users. This is not surprisingas we observed highly inadequate filter handling practices, such as the use of raw water, hands thatwere highly contaminated (geometric mean = 110 E. coli CFU/100 mL) and cloths that were also highly
Int. J. Environ. Res. Public Health 2018, 15, 2439 11 of 14
contaminated (80 E. coli CFU/100 mL), to clean hygienic parts of the filter. The regression analysisrevealed that regular cleaning of the filter with a soft cloth was significantly associated with watercontamination during filter use.
Previous studies have documented the significant impact ceramic water filter interventions had onimproving drinking water quality and, subsequently, reducing health risks [15–17,19,20,29]. However,contrary to our expectations, this intervention did not achieve a satisfactory improvement in drinkingwater quality at the point of consumption. This is partly due to poor filter handling practices and use inan environment with low hygiene and high loads of fecal bacteria in the households. Yet, householdshad access to source water of quite high quality and, therefore, maximally obtainable LRV’s were low.40.5% of the households were attributed a very good cleaning categorization which included the useof boiling water to regularly disinfect the filter. These households achieved a LRV for E. coli of 0.4.
The use of filters of low quality contributed to their low performance in the field. Filters previouslyused by households that were disinfected by researchers before collecting the water sample at thefilter’s tap achieved a LRV of only 0.42–identical to households that were attributed a good cleaningcategorization. This is significantly lower than the disinfection efficiency of the same filter brandsobtained during laboratory analysis, which was LRV of 1.5–2 [26,27], and indicates that the extendeduse of these filters by local households in the field reduced the quality of the filter candles. It wasalso observed that users regularly brushed candles, sometimes extensively, to obtain higher flow rates,which can lead to the removal of ceramic layers from the candle to an extent that even a few holeswere found in some of the candles.
To achieve a stronger impact and to better improve drinking water quality at the point ofconsumption, future interventions should place more emphasis on adequate handling of ceramic waterfilters. Improved practice should consist of the regular use of boiling water to disinfect the filters.Raw water, and hands or cloths should not be used to clean hygienic parts of the filter. Using a brushto clean the filter candle should only happen when the candle is blocked. Another finding was thatdoing a short training event was not sufficient to achieve significant changes in awareness and betterpractices in filter operation and maintenance. Comprehensive behavior change strategies should beimplemented to properly establish adequate practices [30].
In addition to training proper filter handling, providing users access to filters of higher qualitycan significantly improve the impact of water quality interventions. This has been documented inseveral studies that evaluated the effectiveness of household membrane filters in field settings [31–33].The introduction of higher priced ceramic water filters into the markets of poor and remotemountainous areas, such as the region where our intervention took place, however, faces challenges.People in the local communities mostly lack the resources to pay for higher priced filters. Filtersadequate for use in such settings should fulfill quality as well as pricing criteria [34].
Limitations
The swab tests used to identify bacterial contamination on the outflow of the ceramic candle andthe tap of the filter did not detect coliforms. However, it could be that our methodological approach ofmaking five circles with the cottons swabs was not sufficient to detect sufficient coliforms attached tothe inner surface of the filter’s outflow and the filter’s tap.
5. Conclusions
Water quality significantly deteriorated after the source water was filled into transport containers.This indicates that the first steps to reduce the contamination of drinking water should target thecontainers used for drinking water transport to assure that they are hygienic. The use of ceramic waterfilters improved drinking water quality in 40% of the households. Yet, due to contamination issuestheir use lead to further deterioration of water quality in the other households.
A short training led to a slight, yet insufficient, increase in awareness on improved filter handling,but was not sufficiently translated into practice. More than half of the households still practiced
Int. J. Environ. Res. Public Health 2018, 15, 2439 12 of 14
inadequate filter cleaning practices after the training, i.e., the use of peoples’ hands and untreatedwater to clean the lower bucket of the filter where the filtered water is stored. The use of boiling waterto regularly clean and disinfect the filters was identified as an important factor that enhanced filterperformance. The practice of regularly using boiling water for filter disinfection should, therefore,be established in communities using ceramic water filters for water disinfection. Comprehensivetraining and education would be necessary to strengthen the required behavior change.
The locally produced ceramic water filters used in the project area achieved a very lowperformance in the field. Even when boiling water was used for disinfection, the average LRV for E. coliwas 0.4. Filters performed worse in the field than during laboratory tests (LRV for E. coli of 1.5–2). It isprobable that the practice of extensively brushing filter candles to achieve a higher flow rate could havedamaged filter candles to such an extent that some had holes in them. Households, therefore, shouldbe trained to not regularly use soft brushes to clean filter candles. These should be used only whenthe candles are getting clogged. In addition, better performing, but still low-cost, household filtersare needed in the field to achieve higher disinfection rates in a scenario where households have goodfilter operation and maintenance practices. Our study indicates that promotion campaigns for ceramicwater filters in remote areas with critical hygienic conditions require filter products of sufficient qualityas well as adequate training on operation and maintenance to assure that water quality at the tap ofthe filters is safe for consumption.
Supplementary Materials: The following are available online at http://www.mdpi.com/1660-4601/15/11/2439/s1,Table S1: Frequencies-Interview & Observation: Water use, handling transport container, handling ceramic waterfilter, Use and condition of hygiene infrastructure.
Author Contributions: R.M., M.B. and B.M.K. designed the study and developed the methodology. R.M. and M.B.supervised the fieldwork. C.B., S.D. and B.M.K. collected data and supervised research assistants. R.M., C.B. andS.D. performed the statistical analysis. R.M. drafted the manuscript. C.B., S.D., B.M.K. and M.B. contributed to theinterpretation of the data, manuscript writing, and revisions. All authors read and approved the final manuscript.
Funding: This research received no external funding.
Acknowledgments: We would like to thank the households in the project area and the local interviewers for theirparticipation in the study.
Conflicts of Interest: The authors declare no conflict of interest.
References
1. WHO. Investigating in water and sanitation: Increasing access, reducing inequalities. Un-water globalanalysis and assessment of sanitation and drinking water. In Glaas Report; World Health Organization:Geneva, Switzerland, 2014.
2. Fischer Walker, C.L.; Perin, J.; Aryee, M.J.; Boschi-Pinto, C.; Black, R.E. Diarrhea incidence in low- andmiddle-income countries in 1990 and 2010: A systematic review. BMC Public Health 2012, 12, 220. [CrossRef][PubMed]
3. Prüss-Ustün, A.; Bartram, J.; Clasen, T.; Colford, J.M.; Cumming, O.; Curtis, V.; Bonjour, S.; Dangour, A.D.;De France, J.; Fewtrell, L.; et al. Burden of disease from inadequate water, sanitation and hygiene in low-and middle-income settings: A retrospective analysis of data from 145 countries. Trop. Med. Int. Health 2014,19, 894–905. [CrossRef] [PubMed]
4. GON. Nepal—Demographic and Health Survey (DHS) 2016; Ministry of Health: Kathmandu, Nepal, 2017.5. Ansari, S.; Sherchand, J.B.; Parajuli, K.; Mishra, S.K.; Dahal, R.K.; Shrestha, S.; Tandukar, S.; Pokhrel, B.M.
Bacterial etiology of acute diarrhea in children under five years of age. J. Nepal Health Res. Counc. 2012, 10,218–223. [PubMed]
6. Aryal, K.K.; Joshi, H.D.; Dhimal, M.; Singh, S.P.; Dhimal, B.; Dhakal, P.; Bhusal, C.L. Environmental burdenof diarrhoeal diseases due to unsafe water supply and poor sanitation coverage in Nepal. J. Nepal Health Res.Counc. 2012, 10, 125–129. [PubMed]
7. WHO/Unicef. Progress on Sanitation and Drinking Water: JMP 2015 Update and MDG Assessment; WHO:Geneva, Switzerland, 2015.
Int. J. Environ. Res. Public Health 2018, 15, 2439 13 of 14
8. GON; UNICEF. Nepal Multiple Indicator Cluster Survey 2014; Central Bureau of Statistics—National PlanningCommission Secretariat, Government of Nepal: Kathmandu, Nepal, 2015.
9. Brown, J.; Clasen, T. High adherence is necessary to realize health gains from water quality interventions.PLoS ONE 2012, 7. [CrossRef] [PubMed]
10. Fewtrell, L.; Kaufmann, R.B.; Kay, D.; Enanoria, W.; Haller, L.; Colford, J.M., Jr. Water, sanitation, and hygieneinterventions to reduce diarrhoea in less developed countries: A systematic review and meta-analysis. LancetInfect. Dis. 2005, 5, 42–52. [CrossRef]
11. Clasen, T.; Schmidt, W.P.; Rabie, T.; Roberts, I.; Cairncross, S. Interventions to improve water quality forpreventing diarrhoea: Systematic review and meta-analysis. Br. Med. J. 2007, 334, 782–785. [CrossRef][PubMed]
12. Wolf, J.; Hunter, P.R.; Freeman, M.C.; Cumming, O.; Clasen, T.; Bartram, J.; Higgins, J.P.T.; Johnston, R.;Medlicott, K.; Boisson, S.; et al. Impact of drinking water, sanitation and handwashing with soap onchildhood diarrhoeal disease: Updated meta-analysis and meta-regression. Trop. Med. Int. Health 2018, 23,508–525. [CrossRef] [PubMed]
13. Sobsey, M.D.; Stauber, C.E.; Casanova, L.M.; Brown, J.M.; Elliott, M.A. Point of use household drinkingwater filtration: A practical, effective solution for providing sustained access to safe drinking water in thedeveloping world. Environ. Sci. Technol. 2008, 42, 4261–4267. [CrossRef] [PubMed]
14. USAID. Bringing the consumer to the table. In Perceptions and Practice of Household Water Treatment Methodsin Nepal; HIP, Academy for Educational Development: Washington, DC, USA, 2006.
15. Clasen, T.; Boisson, S. Household-based ceramic water filters for the treatment of drinking water in disasterresponse: An assessment of a pilot programme in the dominican republic. Water Pract. Tech. 2006, 1.[CrossRef]
16. Clasen, T.; Parra, G.G.; Boisson, S.; Collin, S. Household-based ceramic water filters for the prevention ofdiarrhea: A randomized, controlled trial of a pilot program in Colombia. Am. J. Trop. Med. Hyg. 2005, 73,790–795. [CrossRef] [PubMed]
17. Du Preez, M.; Conroy, R.M.; Wright, J.A.; Moyo, S.; Potgieter, N.; Gundry, S.W. Use of ceramic water filtrationin the prevention of diarrheal disease: A randomized controlled trial in rural South Africa and Zimbabwe.Am. J. Trop. Med. Hyg. 2008, 79, 696–701. [CrossRef] [PubMed]
18. Clasen, T.F.; Brown, J.; Collin, S.M. Preventing diarrhoea with household ceramic water filters: Assessmentof a pilot project in Bolivia. Int. J. Environ. Health Res. 2006, 16, 231–239. [CrossRef] [PubMed]
19. Brown, J.; Sobsey, M.D.; Loomis, D. Local drinking water filters reduce diarrheal disease in cambodia:A randomized, controlled trial of the ceramic water purifier. Am. J. Trop. Med. Hyg. 2008, 79, 394–400.[CrossRef] [PubMed]
20. Morris, J.F.; Murphy, J.; Fagerli, K.; Schneeberger, C.; Jaron, P.; Moke, F.; Juma, J.; Ochieng, J.B.; Omore, R.;Roellig, D.; et al. A randomized controlled trial to assess the impact of ceramic water filters on prevention ofdiarrhea and cryptosporidiosis in infants and young children—Western Kenya, 2013. Am. J. Trop. Med. Hyg.2018, 98, 1260–1268. [CrossRef] [PubMed]
21. Lemons, A.; Branz, A.; Kimirei, M.; Hawkins, T.; Lantagne, D. Assessment of the quality, effectiveness, andacceptability of ceramic water filters in Tanzania. J. Water Sanit. Hyg. Dev. 2016, 6, 195. [CrossRef]
22. Lange, J.; Materne, T.; Grüner, J. Do low-cost ceramic water filters improve water security in rural SouthAfrica? Drink Water Eng. Sci. 2016, 9, 47–55. [CrossRef]
23. Brown, J.; Sobsey, M.; Proum, S. Use of Ceramic Water Filters in Cambodia; Worldbank. WSP—Field Note.Available online: http://www.wsp.org (accessed on 30 October 2018).
24. Mellor, J.; Abebe, L.; Ehdaie, B.; Dillingham, R.; Smith, J. Modeling the sustainability of a ceramic water filterintervention. Water Res. 2014, 49, 286–299. [CrossRef] [PubMed]
25. Schärer, N. Evaluation of the Impact of Presence/Absence Tests on Safe Water Consumption; Swiss Federal Instituteof Technology: Zurich, Switzerland, 2016.
26. Kunwar, B.M.; Bhatta, M.; Shrestha, R.; Saladin, M. Life Span and Performance Test of Ceramic Filters.In Proceedings of the 2018 Society of Public Health Engineers, Nepal (SOPHEN) Conference, Kathmandu,Nepal, 10–12 April 2018.
27. ENPHO. Study on Efficiency of Ceramic Candle Filters; Environment and Public Health Organization (ENPHO):Kathmandu, Nepal, 2016.
Int. J. Environ. Res. Public Health 2018, 15, 2439 14 of 14
28. Faul, F.; Erdfelder, E.; Buchner, A.; Lang, A.-G. Statistical power analyses using g*power 3.1: Tests forcorrelation and regression analyses. Behav. Res. Methods 2009, 41, 1149–1160. [CrossRef] [PubMed]
29. Brown, J. Effectiveness of Ceramic Filtration for Drinking Water Treatment in Cambodia. PhD. Thesis,University of North Carolina, Chapel Hill, NC, USA, 2007.
30. Mosler, H.-J. A systematic approach to behavior change interventions for the water and sanitation sector indeveloping countries: A conceptual model, a review, and a guideline. Int. J. Environ. Health Res. 2012, 22,431–449. [CrossRef] [PubMed]
31. Boisson, S.; Kiyombo, M.; Sthreshley, L.; Tumba, S.; Makambo, J.; Clasen, T. Field assessment of a novelhousehold-based water filtration device: A randomised, placebo-controlled trial in the democratic republicof Congo. PLoS ONE 2010, 5, e12613. [CrossRef] [PubMed]
32. Peletz, R.; Simuyandi, M.; Simunyama, M.; Sarenje, K.; Kelly, P.; Clasen, T. Follow-up study to assess theuse and performance of household filters in Zambia. Am. J. Trop. Med. Hyg. 2013, 89, 1190–1194. [CrossRef][PubMed]
33. Murray, A.L.; Stewart, B.; Hopper, C.; Tobin, E.; Rivera, J.; Mut-Tracy, H.; Stewart, P.; Stewart, C.; Tobin, C.;Goeb, M.; et al. Laboratory efficacy and field effectiveness of hollow fiber membrane microfilters used forhousehold water treatment in honduras. J. Water Sanit. Hyg. Dev. 2017, 7, 74–84. [CrossRef]
34. Meierhofer, R.; Flückiger, A.C.; Gebauer, H. Do sales models influence the purchase and use of ceramic filtersin rural areas of Kenya and Bolivia? J. Water Supply Res. Technol. 2015, 65, 87–102. [CrossRef]
© 2018 by the authors. Licensee MDPI, Basel, Switzerland. This article is an open accessarticle distributed under the terms and conditions of the Creative Commons Attribution(CC BY) license (http://creativecommons.org/licenses/by/4.0/).