The use of a non-invasive tool for capture–recapture studies on a seahorse Hippocampus guttulatus...
13
Journal of Fish Biology (2014) 84, 872–884 doi:10.1111/jfb.12304, available online at wileyonlinelibrary.com The use of a non-invasive tool for capture–recapture studies on a seahorse Hippocampus guttulatus population M. Correia*†, J. Palma*, H. Koldewey‡ and J. P. Andrade* *CCMar, Universidade do Algarve, F.C.T., Edificio 7, Campus de Gambelas, 8005-139 Faro, Portugal and ‡Project Seahorse, Zoological Society of London, Regent’s Park, London NW1 4RY, U.K. (Received 16 April 2013, Accepted 14 November 2013) In this study, the spot pattern in Hippocampus guttulatus was analysed using a computer programme algorithm that allowed individual comparison. This methodology was first tested in a controlled environment using 51 adult and 55 juvenile H. guttulatus . Positive matches were obtained in 86·3 and 83·6% of the adults and juveniles, respectively. In a second experiment, monthly surveys were carried out in five selected locations in the Ria Formosa Lagoon, south Portugal, over the course of a year and a total of 980 photographs were analysed. Photographed H. guttulatus were re-sighted one to nine times during the course of the survey period with an overall re-sight record of over 30%. Photo-identification was therefore shown to be a useful tool for non-invasive mark – recapture studies that can be successfully used to survey the population abundance of H. guttulatus aged 6 months or older in consecutive years. This could be of great value when considering the assessment of H. guttulatus populations and understanding changes over time. © 2014 The Fisheries Society of the British Isles Key words: long-snouted seahorse; mark–recapture; photo-identification; population abundance. INTRODUCTION Estimates of population size, survival, reproduction and movement rates using capture–recapture models require the ability to identify previously marked or sighted individuals (Nichols, 1992). Individual identification is important in conservation studies when considering species distribution, habitat use and population status (Williams et al., 2002) and will allow tracking of individual movements and model population estimates. Tags have been used as a tool for studies in fish ecology with a wide variety of applications (Winner et al., 1999; Baras et al., 2000; Pine et al., 2003; Holm et al., 2007; Hutson et al., 2007; Jiang et al., 2007). The use of artificial tags, either internal or external, is widely recognized as an effective method of marking animals but has been associated with physical and behavioural disruptions (Mellas & Haynes, 1985; Marty & Summerfelt, 1986; Moore et al., 1990; Murray & Fuller, 2000; Welch et al., 2007). Ideally, tags should have minimal effects on mortality, growth and reproduction of the target species so that the results †Author to whom correspondence should be addressed. Tel.: +351 289 800900 ext. 7376; email: [email protected] 872 © 2014 The Fisheries Society of the British Isles
Transcript of The use of a non-invasive tool for capture–recapture studies on a seahorse Hippocampus guttulatus...

Journal of Fish Biology (2014) 84, 872–884
doi:10.1111/jfb.12304, available online at wileyonlinelibrary.com
The use of a non-invasive tool for capture–recapturestudies on a seahorse Hippocampus guttulatus population
M. Correia*†, J. Palma*, H. Koldewey‡ and J. P. Andrade*
*CCMar, Universidade do Algarve, F.C.T., Edificio 7, Campus de Gambelas, 8005-139 Faro,Portugal and ‡Project Seahorse, Zoological Society of London, Regent’s Park, London NW1
4RY, U.K.
(Received 16 April 2013, Accepted 14 November 2013)
In this study, the spot pattern in Hippocampus guttulatus was analysed using a computer programmealgorithm that allowed individual comparison. This methodology was first tested in a controlledenvironment using 51 adult and 55 juvenile H. guttulatus . Positive matches were obtained in 86·3and 83·6% of the adults and juveniles, respectively. In a second experiment, monthly surveys werecarried out in five selected locations in the Ria Formosa Lagoon, south Portugal, over the course ofa year and a total of 980 photographs were analysed. Photographed H. guttulatus were re-sightedone to nine times during the course of the survey period with an overall re-sight record of over 30%.Photo-identification was therefore shown to be a useful tool for non-invasive mark–recapture studiesthat can be successfully used to survey the population abundance of H. guttulatus aged 6 monthsor older in consecutive years. This could be of great value when considering the assessment ofH. guttulatus populations and understanding changes over time.
© 2014 The Fisheries Society of the British Isles
Key words: long-snouted seahorse; mark–recapture; photo-identification; population abundance.
INTRODUCTION
Estimates of population size, survival, reproduction and movement rates usingcapture–recapture models require the ability to identify previously marked or sightedindividuals (Nichols, 1992). Individual identification is important in conservationstudies when considering species distribution, habitat use and population status(Williams et al., 2002) and will allow tracking of individual movements and modelpopulation estimates. Tags have been used as a tool for studies in fish ecologywith a wide variety of applications (Winner et al., 1999; Baras et al., 2000; Pineet al., 2003; Holm et al., 2007; Hutson et al., 2007; Jiang et al., 2007). The useof artificial tags, either internal or external, is widely recognized as an effectivemethod of marking animals but has been associated with physical and behaviouraldisruptions (Mellas & Haynes, 1985; Marty & Summerfelt, 1986; Moore et al.,1990; Murray & Fuller, 2000; Welch et al., 2007). Ideally, tags should have minimaleffects on mortality, growth and reproduction of the target species so that the results
†Author to whom correspondence should be addressed. Tel.: +351 289 800900 ext. 7376;email: [email protected]
872
© 2014 The Fisheries Society of the British Isles
C A P T U R E – R E C A P T U R E S T U D I E S O N H . G U T T U L AT U S 873
from tagging studies may accurately reflect the variables of the study population(Willis & Babcock, 1998). Nevertheless, methods for identifying individual animalsthat rely on artificial markings such as neck collars, transponders, tissue removal,dyes and chemical markers can be categorized as invasive (Silvy et al., 2005).The most commonly used artificial tags in the Syngnathidae (seahorses, pipefishand seadragons) are external tags (necklaces) and internal tags (visible implantfluorescent elastomer, VIFE) (Monteiro et al., 2005; Curtis, 2006; Sogabe et al.,2007; Palma et al., 2008; Caldwell et al., 2011; Harasti et al., 2012). VIFE tagshave been used as a valuable tool in fisheries research and management (FitzGeraldet al., 2004) because they are cost-effective, have low rates of tag loss and havenegligible effects on survival, growth and behaviour (Willis & Babcock, 1998;Willis et al., 2001; Goldsmith et al., 2003; Woods & Martin-Smith, 2004; Curtis,2006). Lately, the use of electronic tags has been proven as an effective methodof collecting data on individual long-snouted seahorses Hippocampus guttulatusCuvier 1829, although over a shorter time period (Caldwell et al., 2011).
Natural marks or patterns can provide an alternative method of individual iden-tification provided that there is enough polymorphism and information content inthe characteristic in question (Anderson et al., 2007). The use of natural marksusing photo-identification is a non-invasive technique and has been successfullyused to study different marine species (Meekan et al., 2006; Van Tienhoven et al.,2007; Barker & Williamson, 2010; Kitchen-Wheeler, 2010) including syngnathids(Martin-Smith, 2011). In addition to enabling individual identification, the use ofnatural marks in capture–recapture studies must comply with several requirements.Markings must remain consistent over time and identifiable in order to be use-fully used as an estimate tool for studying population variables (Anderson et al.,2007; Martin-Smith, 2011). In fact, several studies have reported that markingsmay persist well over 10 years after their initial recording in species such as Car-charias taurus Rafinesque 1810 (Bansemer & Bennett, 2008), Stegostoma fasciatum(Hermann 1783) (Dudgeon et al., 2008) and Phyllopteryx taeniolatus (Lacepede1804) (Martin-Smith, 2011).
Hippocampus guttulatus is a European species that occurs in the Ria FormosaLagoon, south Portugal. The greatest population size recorded for this speciesthroughout its range was recorded in the early 2000s (Curtis & Vincent, 2005);recent field data, however, showed a significant decrease of 94% in the H .guttulatus populations within this lagoon (Caldwell & Vincent, 2012). The use ofnon-invasive techniques for seahorse monitoring is of paramount importance forstudying these dwindling populations. Hippocampus guttulatus has a distinct markpattern composed of white spots scattered throughout the entire body surface. Theaim of this study was to evaluate the potential of using photo-identification as amonitoring tool when surveying H . guttulatus populations.
MATERIALS AND METHODS
P R E L I M I NA RY E X P E R I M E N T I N A C O N T RO L L E DE N V I RO N M E N T
A total of 51 adult H . guttulatus (24 females and 27 males; F2 captive-bred generation)and 55 juveniles (30 females and 25 males; F3 generation) were used in this preliminary trial.
© 2014 The Fisheries Society of the British Isles, Journal of Fish Biology 2014, 84, 872–884
874 M . C O R R E I A E T A L .
4
5
N
2
3
1
1 km
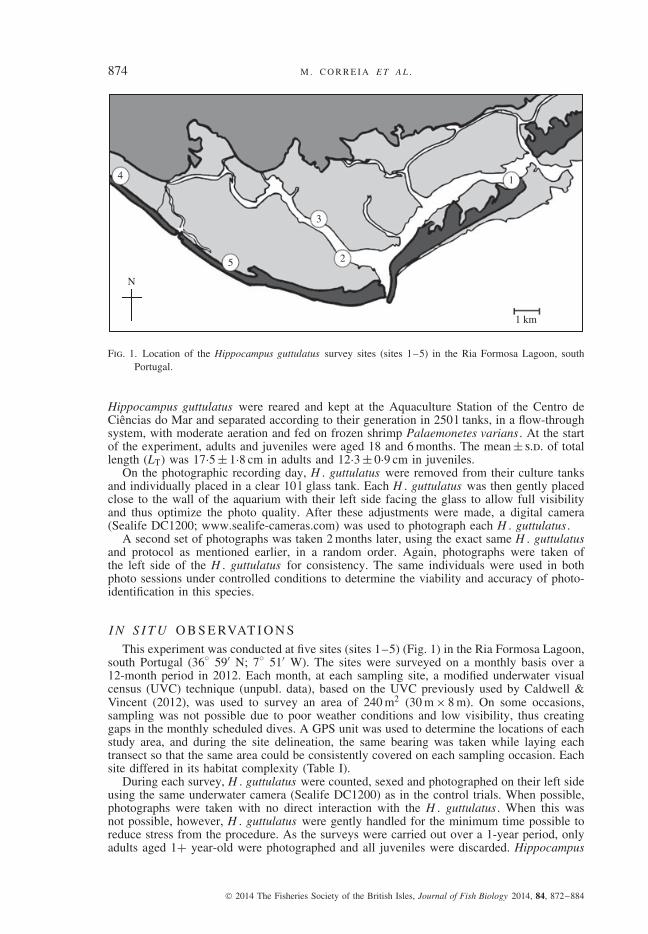
Fig. 1. Location of the Hippocampus guttulatus survey sites (sites 1–5) in the Ria Formosa Lagoon, southPortugal.
Hippocampus guttulatus were reared and kept at the Aquaculture Station of the Centro deCiencias do Mar and separated according to their generation in 250 l tanks, in a flow-throughsystem, with moderate aeration and fed on frozen shrimp Palaemonetes varians . At the startof the experiment, adults and juveniles were aged 18 and 6 months. The mean ± s.d. of totallength (LT) was 17·5 ± 1·8 cm in adults and 12·3 ± 0·9 cm in juveniles.
On the photographic recording day, H . guttulatus were removed from their culture tanksand individually placed in a clear 10 l glass tank. Each H . guttulatus was then gently placedclose to the wall of the aquarium with their left side facing the glass to allow full visibilityand thus optimize the photo quality. After these adjustments were made, a digital camera(Sealife DC1200; www.sealife-cameras.com) was used to photograph each H . guttulatus .
A second set of photographs was taken 2 months later, using the exact same H . guttulatusand protocol as mentioned earlier, in a random order. Again, photographs were taken ofthe left side of the H . guttulatus for consistency. The same individuals were used in bothphoto sessions under controlled conditions to determine the viability and accuracy of photo-identification in this species.
I N S I T U O B S E RVAT I O N S
This experiment was conducted at five sites (sites 1–5) (Fig. 1) in the Ria Formosa Lagoon,south Portugal (36◦ 59′ N; 7◦ 51′ W). The sites were surveyed on a monthly basis over a12-month period in 2012. Each month, at each sampling site, a modified underwater visualcensus (UVC) technique (unpubl. data), based on the UVC previously used by Caldwell &Vincent (2012), was used to survey an area of 240 m2 (30 m × 8 m). On some occasions,sampling was not possible due to poor weather conditions and low visibility, thus creatinggaps in the monthly scheduled dives. A GPS unit was used to determine the locations of eachstudy area, and during the site delineation, the same bearing was taken while laying eachtransect so that the same area could be consistently covered on each sampling occasion. Eachsite differed in its habitat complexity (Table I).
During each survey, H . guttulatus were counted, sexed and photographed on their left sideusing the same underwater camera (Sealife DC1200) as in the control trials. When possible,photographs were taken with no direct interaction with the H . guttulatus . When this wasnot possible, however, H . guttulatus were gently handled for the minimum time possible toreduce stress from the procedure. As the surveys were carried out over a 1-year period, onlyadults aged 1+ year-old were photographed and all juveniles were discarded. Hippocampus
© 2014 The Fisheries Society of the British Isles, Journal of Fish Biology 2014, 84, 872–884

C A P T U R E – R E C A P T U R E S T U D I E S O N H . G U T T U L AT U S 875
Table I. Site description considering substratum type, depth and habitat complexity for Hip-pocampus guttulatus . Sites were located in the Ria Formosa Lagoon, south Portugal
Substratum Depth (m) Habitat complexity
Site 1 Sandy 5–6 High: mostly shells and sessile invertebrates (Ascidiasp., Sabella sp. and sea urchins)
Site 2 Sandy 6–9 Low: scattered rocks, mostly barrenSite 3 Muddy 3–5 High: Ascidia sp. and shellsSite 4 Muddy 2–3 High: seagrass bed, shells and Sabella sp. tubesSite 5 Sandy 2–3 Low: scattered Codium sp. and small seagrass patches
guttulatus were measured according to Lourie et al. (2004) and those that were at least 15 cmLT were considered as 1+ year-old adults, as suggested by Curtis & Vincent (2006). Althoughlaboratory results indicated that photo-identification methodology could potentially be usedon juveniles older than 6 months, this study only focused on the breeding population. Asageing juvenile H . guttulatus can be very subjective, this bias was removed by only workingon larger H . guttulatus considered to be fully mature.
I M AG E A NA LY S I S
Photographs were downloaded and computer labelled to include the individual fish andphotograph number, sex, date and site (in situ) information. In this study, it was decidedto focus on analysing the spot pattern on the head of each H . guttulatus for individualidentification (Fig. 2). As the spots were clearly distinguishable, no further photo adjustmentswere necessary. Each spot pattern was recorded using the computer software algorithm, I3SManta 2.1 (www.reijns.com/i3s) and analysed to determine eventual matches.
The identification procedure assumed that the spot pattern of each individual was a uniquedistinguishing feature. The user points out the most distinguishing spots of each image anddraws an ellipse around each spot after choosing three landmark points on each image, i .e.the centre of the eye ball and the upper and lower limit of the pectoral fin. This information
1 cm
A
B
C
Fig. 2. Selected area in Hippocampus guttulatus body for spot marking in I3S Manta software with threereference points (A, eye ball; B, upper origin of the pectoral fin; C, lower origin of the pectoral fin).
© 2014 The Fisheries Society of the British Isles, Journal of Fish Biology 2014, 84, 872–884

876 M . C O R R E I A E T A L .
provides relative position and size of each spot. This spot pattern is then stored in a finger-print file. The programme’s algorithm (Van Tienhoven et al., 2007) then processes each fileproviding the user with a ranked list of possible matches. The final decision on a true match isleft to the observer through image visual comparison. Each comparison batch was done usingall photographs recorded in captivity (preliminary experiment) or the same sampling site (insitu). Considering that each site was at least 1 km apart from any other and that low mobilityand sedentary nature of H . guttulatus were previously recorded at this location (Curtis &Vincent, 2006), the probability of matches between different sampling sites was consideredto be very limited. Also, the photographs were divided by sex prior to comparison as thisallowed a smaller batch of photographs to be compared and therefore increased the possibilityof finding matches. The list of possible matches was then analysed and a visual comparisonwas made to confirm each match.
W I L D P O P U L AT I O N PA R A M E T E R S
To estimate population abundance at each site, and considering the annual recruitmentperiod of this species reported by Curtis & Vincent (2006), a Cormack–Jolly–Seber (CJS)open model population was used (Cormack, 1964; Jolly, 1965; Seber, 1965). This modelassumes that animals retain their tags throughout the experiment and the tags are read prop-erly; catchability is constant for all animals (marked and unmarked) for all sampling periods;sampling periods are instantaneous and recaptured animals are released immediately. Abun-dance (N), capture probability (p) and apparent survival (ϕ) parameters were determinedusing a CJS open population model in the MARK software (White & Burnham, 1999).Finally, a CAPTURE goodness-of-fit test was run inside the MARK software to test whetherthe model was an adequate fit to the data. In cases of low recapture data, a cumulative non-linear model [y = ax (b + x )−1] was used to fit the data and estimate abundance according toKohn et al. (1999).
RESULTS
P R E L I M I NA RY E X P E R I M E N T I N A C O N T RO L L E DE N V I RO N M E N T
Using the I3S Manta software, there was a high matching accuracy when com-paring the two sets of photographs. From the 212 photographs analysed, positivematches were classified as first rank in 86·3% for adults (84·0% males and 83·3%females) and 83·6% for juveniles (92·6% males and 79·2% females) in the overalloutput rank list. Inconclusive matches that were classified as second rank or belowwere caused by poor photograph quality, incorrect positioning of H . guttulatus oralgorithm errors. These inconclusive matches were then analysed by direct visualcomparison and a corresponding positive match was found.
There were no statistical differences related to sex either in adult or juvenileH . guttulatus (Fisher’s exact test, d.f. = 1, P > 0·05). The number of spots var-ied between each individual from 37 to 71 with a mean ± s.d. of 53·7 ± 9·8 and48·1 ± 5·9 for males and females, respectively. No statistical difference was foundin number of spots between males and females (χ2 = 25·2, d.f. = 22, P > 0·05).
I N S I T U O B S E RVAT I O N S
A total of 980 photographs were recorded at all sites, which was the pooled valuefor first-sighted and re-sighted H . guttulatus (217 in site 1, 363 in site 2, 181 insite 3, 134 in site 4 and 85 in site 5). Recapture percentage, i .e. percentage of
© 2014 The Fisheries Society of the British Isles, Journal of Fish Biology 2014, 84, 872–884

C A P T U R E – R E C A P T U R E S T U D I E S O N H . G U T T U L AT U S 877
0
10
20
30
40
50
60Fe
brua
ry
Febr
uary
Mar
ch
Apr
il
May
June
July
Aug
ust
Sept
embe
r
Oct
ober
Nov
embe
r
Dec
embe
r
Mar
ch
Apr
il
May
June
July
Aug
ust
Sept
embe
r
Nov
embe
r
Dec
embe
r
(a) (b)
(c) (d)
0
10
20
30
40
50
60
70
0
5
10
15
20
25
30
Sigh
ted
H. g
uttu
latu
s (%
)
0
10
20
30
40
Mar
ch
Apr
il
May
June
July
Aug
ust
Sept
embe
r
Month
Nov
embe
r
Dec
embe
r
(e)
0
5
10
15
20
25
30
Fig. 3. Re-sight history of Hippocampus guttulatus ( , first sighted; , re-sighted) for sites (a) 1, (b) 2, (c),3, (d) 4 and (e) 5 surveyed on a monthly basis throughout the experiment.
H . guttulatus re-sighted at least once in a sampling period, varied from a minimumof 13·6% in site 4 to a maximum of 44% in site 3, with an overall mean ± s.d. of31·3 ± 13·1% of the total sighted H . guttulatus at all the five sites (Fig. 3). The totalnumber of unique individuals found during the sampling period was 131 for site 1,209 for site 2, 91 for site 3, 110 for site 4 and 65 for site 5.
The overall mean ± s.d. H. guttulatus densities (n m−2; considering the fullsampling period) was 0·091 ± 0·051, 0·140 ± 0·051, 0·069 ± 0·026, 0·056 ± 0·029and 0·039 ± 0·024 individuals m−2 for sites 1–5, respectively, with maximumdensities varying between 0·004 (site 5) and 0·263 individuals m−2 (site 2). Mostre-sighted H . guttulatus were only found in one subsequent sampling occasion(mean ± s.d. of 69·1 ± 11·2%), while the remaining were re-sighted in two tonine surveying events. Overall relative number of re-sights per site is presentedin Fig. 4.
© 2014 The Fisheries Society of the British Isles, Journal of Fish Biology 2014, 84, 872–884

878 M . C O R R E I A E T A L .
0
10
20
30
40
50
60
70
80
90
100
1 2 3 4 5 6 7 8 9
Res
ight
s (%
)
Times resighted
Fig. 4. Overall relative resight history for each site surveyed ( , site 1; , site 2; , site 3; , site 4; , site5) considering all photographed Hippocampus guttulatus .
W I L D P O P U L AT I O N PA R A M E T E R S
Due to the low recapture data at site 4, abundance was estimated using the cumu-lative non-linear model. Abundance estimates varied from 108 (site 3) to 257 (site2) (Table II).
DISCUSSION
The results obtained in the preliminary control experiment fully supported photo-identification as an individual non-invasive marking technique that is applicable toH . guttulatus . Photo-identification has been successfully used as a mark–recapture
Table II. Abundance estimate(N
)obtained by population analysis (POPAN) model, appar-
ent survival (ϕ) and re-sight probability (p) for each site were obtained using theCormack–Jolly–Seber (CJS) open population model and cumulative curve model [y = ax (b
+ x )−1]
CJS open population model
N ϕ c.i. (95%) p c.i. (95%)
Site 1 131 0·92 0·83 0·97 0·19 0·10 0·33Site 2 209 0·82 0·52 0·91 0·40 0·25 0·57Site 3 91 0·71 0·51 0·87 0·46 0·37 0·55Site 5 65 0·89 0·43 0·99 0·19 0·05 0·48
Cumulative curve
c.i. (95%) r2
Site 4 217 166 267 0·9866
© 2014 The Fisheries Society of the British Isles, Journal of Fish Biology 2014, 84, 872–884

C A P T U R E – R E C A P T U R E S T U D I E S O N H . G U T T U L AT U S 879
technique in many studies and has proven to be an effective non-invasive techniquefor larger marine species such as the bowhead whale Balaena mysticetus (Rughet al., 1992), polar bear Ursus maritimus (Anderson et al., 2007), long-finned pilotwhale Globicephala melas (Auger-Methe & Whitehead, 2007), C . taurus (Bansemer& Bennett, 2008) and whale shark Rhincodon typus Smith 1828 (Holmberg et al.,2009). In addition, photo-identification has been used to obtain accurate data inmark–recapture studies in syngnathid species such as Phycodurus eques (Gunther1865) (Connolly et al., 2002), Nerophis lumbriciformis (Jenyns 1835) (Monteiroet al., 2005), P . taeniolatus (Martin-Smith, 2011) and Hippocampus reidi Ginsburg1933 (Freret-Meurer et al., 2013). This technique uses very little or no handling,thus causing reduced stress in wild populations studied when compared to othermethods. From previous seahorse tagging techniques, VIFE appears to be the mostwidely used and is effective for individually identifying wild seahorses (Sanchez-Camara & Booth, 2004; Woods & Martin-Smith, 2004; J. M. Le Cheminant, unpubl.data). This methodology, however, has some implications for animal welfare as itinvolves lengthy handling and elastomer injection on individuals (Curtis, 2006). Inaddition, the VIFE must be purchased and takes time to apply, therefore requiringmore resources.
The I3SM Manta 2.1 software used in this study has already proven to be effectivein mark–recapture studies for other species, including sharks (Meekan et al., 2006;Wilson et al., 2006; Bradshaw et al., 2007), manta rays (Marshall et al., 2008), U .maritimus (Anderson et al., 2007) and seadragons (Martin-Smith, 2011) with highaccuracy results. The correct contour of the spots is crucial for optimal identificationaccuracy. Also, in some cases, the shape of the spots is neither perfectly ellipticalnor circular, thus creating the potential for some variation due to each user crite-ria while selecting the spots within the programme I3SM Manta. Therefore, as inother sampling methods, data should be processed by as few researchers as possibleto minimize bias. In this study, this process was performed by only one user, thecriteria for the selection of each spot remained consistent and was confirmed bythe high match percentages obtained when processing the photographs of H . gut-tulatus in controlled conditions, similar to those obtained by Martin-Smith (2011)with P . taeniolatus . Another equally important detail to consider for the successof this methodology is the photo quality of the target animal. Underwater photog-raphy in the Ria Formosa can be difficult due to low visibility. Visibility in mostdives varied from 0·5 to 5 m, but in most cases, it was <2 m which had an effecton the final quality of the resulting photographs, making it hard to identify eachspot on some occasions. Also, as observed in the preliminary control experiments,the H . guttulatus should be ideally positioned parallel to the camera in order toget a straight profile photograph. Even though it was necessary to handle most ofthe fish to take the photograph, the handling was carried out using gloves. EachH . guttulatus was gently gripped to avoid skin injuries and handling time waskept to only a few seconds per H . guttulatus . If the photographs were blurred, thesoftware I3SM Manta was ineffective and each photograph was then needed to bevalidated by visual comparison. Visual comparison was a good means to check indi-vidual identifications, not only when photograph quality was poor, as it allowed theresearcher to search for other distinctive marks or spots that could identify possiblematches.
© 2014 The Fisheries Society of the British Isles, Journal of Fish Biology 2014, 84, 872–884

880 M . C O R R E I A E T A L .
This study also proved that photo-identification is valid when used for juvenilesaged 6 to 8 months, suggesting that the spot pattern and shape have low or negli-gible modifications with age. This is in agreement with Martin-Smith (2011) whofound that P . taeniolatus had a unique spot pattern that did not undergo significantchanges over a period of at least 18 months. When considering tagging methods formark–recapture studies, researchers must verify whether the tags in use comply withthe assumptions of their mark–recapture models. For open population models, thoseassumptions include that tagged fishes are a random sample of the population ofinterest, numbers of releases are known, tagging is accurate with no tag loss or mis-read tags, animals are released within a brief time period and the fate of individualfish and the fates of fish in differing cohorts are independent (Jolly, 1965; Seber,1965). The body area chosen for identification purposes seemed to be adequate asit allowed the correct identification of each individual with no sex variation andno significant changes were observed in spot shape and pattern in all H . guttula-tus photographed, during the entire survey period. Considering that the spot patternis present throughout the H . guttulatus body, however, the area of focus could beexpanded in order to increase the matching accuracy.
Overall, roughly one third (mean ± s.d. = 31·3 ± 13·1%) of all photographedH . guttulatus were re-sighted. This result suggests a sedentary behaviour of thisspecies, when compared with other fish species that are migrant (Templeman, 1984;McGovern et al., 2005), and agrees with their well-documented small home range(Curtis & Vincent, 2005, 2006; Caldwell et al., 2011). Although working with smallersample sizes, Connolly et al. (2002) and Martin-Smith (2011) have reported re-sighting rates over 90%. Other species of seahorse such as Hippocampus comesCantor 1849 or Hippocampus whitei Bleeker 1855 may also have high re-sightingrates (Vincent, 1995; Perante et al., 2002; Harasti et al., 2012).
Several H . guttulatus were re-sighted on multiple occasions throughout the year,up to nine times of the 11 surveys performed for each site. Although Curtis &Vincent (2006) reported that the home range for this species after settlement was c.20 m, H . guttulatus have a patchy distribution that may be conditioned by the levelof habitat complexity and population density (M. Correia, I. R. Caldwell, J. Palma,H. Koldewey & J. P. Andrade, unpubl. data). Caldwell & Vincent (2013) reportedthat H . guttulatus can move >100 m from its original location during a relativelyshort period of time and display an individual habitat preference. This behaviourcould explain the absence in the survey area of some re-sighted H . guttulatus inspecific months, as they might adjust their location depending on holdfast and foodavailability, density, fishing activities and weather conditions. Nevertheless, the areacovered in each survey (240 m2) seems to be adequate as it overlaps the equivalentof several home ranges reported for this species (Curtis & Vincent, 2006; Garrick-Maidment et al., 2011; Caldwell & Vincent, 2013). After completion of the monthlysurveys, the individual re-sight occasions were c. 20 and 10% for H . guttulatusre-sighted two and three times. This could suggest that even though H . guttulatushave small home ranges, they can move over larger areas, returning to the originalarea. This behaviour was observed during the tidal peaks when the current was weakand H . guttulatus undertake hunting and feeding behaviour. The highest re-sightnumber in this study was registered in site 2, which could be due to the habitatcharacteristics. This area is very hydrodynamic, has low habitat complexity andthe available holdfast is only provided by an abandoned metal chain from an old
© 2014 The Fisheries Society of the British Isles, Journal of Fish Biology 2014, 84, 872–884

C A P T U R E – R E C A P T U R E S T U D I E S O N H . G U T T U L AT U S 881
signalling buoy that is laid straight on the bottom, in an otherwise barren area ofsandy substratum. This structure is necessary for H . guttulatus to cope with the highwater currents that occur during the high-tide to low-tide transition period. This lowcomplexity might cause a sedentary behaviour in the local H . guttulatus populationand increase re-sighting.
The highest H . guttulatus density was seen at site 5 (0·263 H . guttulatus m−2) andwas well above that reported by Caldwell & Vincent (2012), which was of 0·004individuals m−2 on average, considering the 33 sites surveyed, and these authorsfound a maximum density of 0·035 fish m−2. This high density could be responsiblefor some migration amongst the adult population to cope with competition for foodand holdfasts. Apart from mortality, this could explain why some H . guttulatus weresighted only once throughout the entire survey period.
In this study, the preliminary experiment proved that photo-identification is anefficient methodology to successfully identify juvenile H . guttulatus aged from6 months. In younger individuals kept in captivity, spot patterns are already presentand start to manifest at 3 months of age (J. Palma, pers. obs.). Nevertheless, thespots are still too small and difficult to distinguish. In order to accurately assess thespot pattern at this age, a longer period of handling would have been necessary, thusincreasing handling stress at a very sensitive life period. In addition, the reportedmigration of juveniles before settlement can bias the assumptions for abundance esti-mates that require that catchability is constant for all fish (marked and unmarked)and for all sampling periods. Hence, the abundance for each site was estimatedconsidering only the adult population.
M.C. was supported by a PhD grant (FCT, Portugal) (BD/41020/2007). The study wassupported by the scientific projects INAQUA and HIPPOSAFE (Fundacao para a Cienciae Tecnologia, ref. PTDC/MAR/122616/2010). The authors thank Project Seahorse (http://seahorse.fisheries.ubc.ca/) for providing logistic support for underwater surveys and to all thevolunteers who have participated in the data collection. The manuscript benefited from thecomments of two anonymous referees.
References
Anderson, C. J. R., Roth, J. D. & Waterman, J. M. (2007). Can whisker spot patterns be usedto identify individual polar bears? Journal of Zoology 273, 333–339.
Auger-Methe, M. & Whitehead, H. (2007). The use of natural markings in studies of long-finned pilot whales (Globicephala melas). Marine Mammal Science 23, 77–93.
Bansemer, C. S. & Bennett, M. B. (2008). Multi-year validation of photographic identificationof grey nurse sharks, Carcharias taurus , and applications for non-invasive conservationresearch. Marine and Freshwater Research 59, 322–331.
Baras, E., Malbrouck, C., Houbart, M., Kestemont, P. & Melard, C. (2000). The effect ofPIT tags on growth and physiology of age-0 cultured Eurasian perch Perca fluviatilisof variable size. Aquaculture 185, 159–173.
Barker, S. M. & Williamson, J. E. (2010). Collaborative photo-identification and monitoringof grey nurse sharks (Carcharias taurus) at key aggregation sites along the easterncoast of Australia. Marine and Freshwater Research 61, 971–979.
Bradshaw, C. J. A., Mollet, H. F. & Meekan, M. G. (2007). Inferring population trends forthe world’s largest fish from mark–recapture estimates of survival. Journal of AnimalEcology 76, 480–489.
Caldwell, I. R. & Vincent, A. C. J. (2012). Revisiting two sympatric European seahorsespecies: apparent decline in the absence of exploitation. Aquatic Conservation: Marineand Freshwater Ecosystems 22, 427–435.
© 2014 The Fisheries Society of the British Isles, Journal of Fish Biology 2014, 84, 872–884

882 M . C O R R E I A E T A L .
Caldwell, I. R. & Vincent, A. C. J. (2013). A sedentary fish on the move: effects of dis-placement on long-snouted seahorse (Hippocampus guttulatus Cuvier) movement andhabitat use. Environmental Biology of Fishes 96, 67–75.
Caldwell, I. R., Correia, M., Palma, J. & Vincent, A. C. J. (2011). Advances in taggingsyngnathids, with the effects of dummy tags on behaviour of Hippocampus guttulatus .Journal of Fish Biology 78, 1769–1785.
Connolly, R. M., Melville, A. J. & Keesing, J. K. (2002). Abundance, movement and indi-vidual identification of leafy seadragons, Phycodurus eques (Pisces : Syngnathidae).Marine and Freshwater Research 53, 777–780.
Cormack, R. M. (1964). Estimates of survival from the sighting of marked animals. Biometrics51, 429–438.
Curtis, J. M. R. (2006). Visible implant elastomer color determination, tag visibility, and tagloss: potential sources of error for mark–recapture studies. North American Journal ofFisheries Management 26, 327–337.
Curtis, J. M. R. & Vincent, A. C. J. (2005). Distribution of sympatric seahorse species alonga gradient of habitat complexity in a seagrass-dominated community. Marine EcologyProgress Series 291, 81–91.
Curtis, J. M. R. & Vincent, A. C. J. (2006). Life history of an unusual marine fish: survival,growth and movement patterns of Hippocampus guttulatus Cuvier 1829. Journal ofFish Biology 68, 707–733.
Dudgeon, C. L., Noad, M. J. & Lanyon, J. M. (2008). Abundance and demography of aseasonal aggregation of zebra sharks Stegostoma fasciatum . Marine Ecology ProgressSeries 368, 269–281.
FitzGerald, J. L., Sheehan, T. F. & Kocik, J. F. (2004). Visibility of visual implant elastomertags in Atlantic salmon reared for two years in marine net-pens. North AmericanJournal of Fisheries Management 24, 222–227.
Freret-Meurer, N., Andreata, J. & Alves, M. (2013). Seahorse fingerprints: a new individ-ual identification technique. Environmental Biology of Fishes 96, 1399–1405. doi:10.1007/s10641-10013-10118-10646
Garrick-Maidment, N., Trewhella, S., Hatcher, J., Collins, K. J. & Mallinson, J. J. (2011).Seahorse Tagging Project, Studland Bay, Dorset, UK. Marine Biodiversity Records 3,1–4.
Goldsmith, R. J., Closs, G. P. & Steen, H. (2003). Evaluation of visible implant elastomerfor individual marking of small perch and common bully. Journal of Fish Biology 63,631–636.
Harasti, D., Martin-Smith, K. & Gladstone, W. (2012). Population dynamics and life historyof a geographically restricted seahorse, Hippocampus whitei . Journal of Fish Biology81, 1297–1314.
Holm, S., Brungot, J., Ronnekleiv, A., Hoff, L., Jahr, V. & Kjolerbakken, K. M. (2007).Acoustic passive integrated transponders for fish tagging and identification. Aquacul-tural Engineering 36, 122–126.
Holmberg, J., Norman, B. & Arzoumanian, Z. (2009). Estimating population size, structure,and residency time for whale sharks Rhincodon typus through collaborative photo-identification. Endangered Species Research 7, 39–53.
Hutson, K. S., Smith, B. P., Godfrey, R. T., Whittington, I. D., Chambers, C. B., Ernst, I. &Gillanders, B. M. (2007). A tagging study on yellowtail kingfish (Seriola lalandi ) andSamson fish (S . hippos) in south Australian waters. Transactions of the Royal Societyof South Australia 131, 128–134.
Jiang, H., Brownie, C., Hightower, J. E. & Pollock, K. H. (2007). Estimating fishing mortal-ity, natural mortality, and selectivity using recoveries from tagging young fish. NorthAmerican Journal of Fisheries Management 27, 773–781.
Jolly, G. M. (1965). Explicit estimates from capture-recapture data with both death andimmigration-stochastic model. Biometrika 52, 225–247.
Kitchen-Wheeler, A.-M. (2010). Visual identification of individual manta ray (Manta alfredi )in the Maldives Islands, Western Indian Ocean. Marine Biology Research 6, 351–363.
Kohn, M. H., York, E. C., Kamradt, D. A., Haught, G., Sauvajot, R. M. & Wayne, R. K.(1999). Estimating population size by genotyping faeces. Proceedings of the RoyalSociety B 266, 657–663.
© 2014 The Fisheries Society of the British Isles, Journal of Fish Biology 2014, 84, 872–884

C A P T U R E – R E C A P T U R E S T U D I E S O N H . G U T T U L AT U S 883
Lourie, S. A., Foster, S. J., Cooper, E. W. & Vincent, A. C. (2004). A Guide to the Identifi-cation of Seahorses. Project Seahorse and TRAFFIC North America . Washington, DC:University of British Columbia and World Wildlife Fund.
Marshall, A. D., Pierce, S. J. & Bennett, M. B. (2008). Morphological measurements of mantarays (Manta birostris) with a description of a foetus from the east coast of SouthernAfrica. Zootaxa 1717, 24–30.
Martin-Smith, K. M. (2011). Photo-identification of individual weedy seadragons Phyllopteryxtaeniolatus and its application in estimating population dynamics. Journal of FishBiology 78, 1757–1768.
Marty, G. D. & Summerfelt, R. C. (1986). Pathways and mechanisms for expulsion of surgi-cally implanted dummy transmitters from channel catfish. Transactions of the AmericanFisheries Society 115, 577–589.
McGovern, J. C., Sedberry, G. R., Meister, H. S., Westendorff, T. M., Wyanski, D. M. &Harris, P. J. (2005). A tag and recapture study of gag, Mycteroperca microlepis , offthe Southeastern U.S. Bulletin of Marine Science 76, 47–59.
Meekan, M. G., Bradshaw, C. J. A., Press, M., McLean, C., Richards, A., Quasnichka, S. &Taylor, J. G. (2006). Population size and structure of whale sharks Rhincodon typus atNingaloo Reef, Western Australia. Marine Ecology Progress Series 319, 275–285.
Mellas, E. J. & Haynes, J. M. (1985). Swimming performance and behavior of rainbow trout(Salmo gairdneri ) and white perch (Morone americana): effects of attaching telemetrytransmitters. Canadian Journal of Fisheries and Aquatic Sciences 42, 488–493.
Monteiro, N. M., Vieira, M. d. N. & Almada, V. (2005). Homing behaviour and individualidentification of the pipefish Nerophis lumbriciformis (Pisces; Syngnathidae): a trueintertidal resident? Estuarine, Coastal and Shelf Science 63, 93–99.
Moore, A., Russell, I. C. & Potter, E. C. E. (1990). The effects of intraperitoneally implanteddummy acoustic transmitters on the behaviour and physiology of juvenile Atlanticsalmon, Salmo salar L. Journal of Fish Biology 37, 713–721.
Murray, D. L. & Fuller, M. R. (2000). A critical review of the effects of marking on thebiology of vertebrates. In Research Techniques in Animal Ecology: Controversies andConsequences (Boitani, L. & Fuller, T. K., eds), pp. 15–64. New York, NY: ColumbiaUniversity Press.
Nichols, J. D. (1992). Capture-recapture models. Bioscience 42, 94–102.Palma, J., Stockdale, J., Correia, M. & Andrade, J. P. (2008). Growth and survival of adult
long snout seahorse (Hippocampus guttulatus) using frozen diets. Aquaculture 278,55–59.
Perante, N. C., Pajaro, M. G., Meeuwig, J. J. & Vincent, A. C. J. (2002). Biology of a seahorsespecies, Hippocampus comes in the central Philippines. Journal of Fish Biology 60,821–837.
Pine, W. E., Pollock, K. H., Hightower, J. E., Kwak, T. J. & Rice, J. A. (2003). A reviewof tagging methods for estimating fish population size and components of mortality.Fisheries 28, 10–23.
Rugh, D. J., Braham, H. W. & Miller, G. W. (1992). Methods for photographic identificationof bowhead whales, Balaena mysticetus . Canadian Journal of Zoology 70, 617–624.
Sanchez-Camara, J. & Booth, D. J. (2004). Movement, home range and site fidelity of theweedy seadragon Phyllopteryx taeniolatus (Teleostei: Syngnathidae). EnvironmentalBiology of Fishes 70, 31–41.
Seber, G. A. F. (1965). A note on the multiple recapture census. Biometrika 52, 249–259.Silvy, N. J., Lopez, R. R. & Peterson, M. J. (2005). Wildlife marking techniques. In Techniques
for Wildlife Investigations and Management (Braun, C. E., ed), pp. 339–363. Bethesda,MD: The Wildlife Society.
Sogabe, A., Matsumoto, K. & Yanagisawa, Y. (2007). Mate change reduces the reproductiverate of males in a monogamous pipefish Corythoichthys haematopterus: the benefit oflong-term pair bonding. Ethology 113, 764–771.
Templeman, W. (1984). Migrations of spiny dogfish, Squalus acanthias , and recapture suc-cess from tagging in the Newfoundland area, 1963-65. Journal of Northwest AtlanticFisheries Science 5, 47–53.
© 2014 The Fisheries Society of the British Isles, Journal of Fish Biology 2014, 84, 872–884

884 M . C O R R E I A E T A L .
Van Tienhoven, A. M., Den Hartog, J. E., Reijns, R. A. & Peddemors, V. M. (2007). Acomputer-aided program for pattern-matching of natural marks on the spotted ragged-tooth shark Carcharias taurus . Journal of Applied Ecology 44, 273–280.
Vincent, A. C. J. (1995). A role for daily greetings in maintaining seahorse pair bonds. AnimalBehaviour 49, 258–260.
Welch, D. W., Batten, S. D. & Ward, B. R. (2007). Growth, survival, and tag retentionof steelhead trout (O . mykiss) surgically implanted with dummy acoustic tags. InDevelopments in Fish Telemetry (Almeida, P., Quintella, B., Costa, M. & Moore, A.,eds), pp. 289–299. Dordrecht: Springer.
White, G. C. & Burnham, K. P. (1999). Program MARK: survival estimation from populationsof marked animals. Bird Study 46, S120–S139.
Williams, B. K., Nichols, J. D. & Conroy, M. J. (2002). Analysis and Management of AnimalPopulations: Modeling, Estimation and Decision Making . San Diego, CA: AcademicPress.
Willis, T. J. & Babcock, R. C. (1998). Retention and in situ detectability of visible implantfluorescent elastomer (VIFE) tags in Pagrus auratus (Sparidae). New Zealand Journalof Marine and Freshwater Research 32, 247–254.
Willis, T. J., Parsons, D. M. & Babcock, R. C. (2001). Evidence for long-term site fidelityof snapper (Pagrus auratus) within a marine reserve. New Zealand Journal of Marineand Freshwater Research 35, 581–590.
Wilson, S. G., Polovina, J. J., Stewart, B. S. & Meekan, M. G. (2006). Movements of whalesharks (Rhincodon typus) tagged at Ningaloo Reef, Western Australia. Marine Biology148, 1157–1166.
Winner, B. L., McMichael, R. H. & Brant, L. L. (1999). Evaluation of small T-anchor anddart tags for use in marking hatchery-reared juvenile red drum, Sciaenops ocellatus .Fishery Bulletin 97, 730–735.
Woods, C. M. C. & Martin-Smith, K. M. (2004). Visible implant fluorescent elastomer tag-ging of the big-bellied seahorse, Hippocampus abdominalis . Fisheries Research 66,363–371.
© 2014 The Fisheries Society of the British Isles, Journal of Fish Biology 2014, 84, 872–884