The use and effect of hazard warning signs - DOC
39
The use and effect of hazard warning signs Managing visitor safety at Franz Josef and Fox Glaciers SCIENCE FOR CONSERVATION: 108 Stephen R. Espiner Published by Department of Conservation P.O. Box 10-420 Wellington, New Zealand
-
Upload
khangminh22 -
Category
Documents
-
view
1 -
download
0
Transcript of The use and effect of hazard warning signs - DOC

The use and effect of hazardwarning signs
Managing visitor safety at Franz Josef and Fox Glaciers
SCIENCE FOR CONSERVATION: 108
Stephen R. Espiner
Published by
Department of Conservation
P.O. Box 10-420
Wellington, New Zealand

Science for Conservation presents the results of investigations by DOC staff, and by contracted
science providers outside the Department of Conservation. Publications in this series are internally
and externally peer reviewed.
© April 1999, Department of Conservation
ISSN 1173�2946
ISBN 0�478�21808�7
This publication originated from work carried out by Stephen R. Espiner ([email protected]) for
Westland Conservancy, Department of Conservation. It was approved for publication by the
Director, Science & Research Unit, Science Technology and Information Services, Department of
Conservation, Wellington.
Cataloguing in Publication
Espiner, Stephen.
The use and effect of hazard warning signs : managing visitor
safety at Franz Josef and Fox Glaciers / Stephen R. Espiner.
Wellington,
N.Z. : Dept. of Conservation, 1999.
1 v. ; 30 cm. (Science for conservation, 1173-2946 ; 108.)
Includes bibliographical references.
ISBN 0478218087
1. Safety signs�New Zealand�Fox Glacier. 2. Safety signs�
NewZealand�Franz Josef Glacier. I. Title. II. Series: Science for
conservation (Wellington, N.Z.) ; 108.
302.23099371 20
zbn99-023123

CONTENTS
Abstract 5
1. Introduction 5
1.1 The study sites 6
1.2 Aims and structure of the report 6
2. Literature review 7
2.1 Introduction 7
2.2 A brief definition of terms 7
2.3 Risk 8
2.4 Risk perception 9
2.5 Communicating risk and hazard 9
2.6 Risk and responsibility 10
2.7 Tourist behaviour and the relevance of risk 12
2.8 Fox and Franz Josef Glaciers 13
2.9 Summary of the literature review 14
3. Methods 15
3.1 The survey 15
3.1.1 Aim and implementation 15
3.1.2 Response rate 15
3.1.3 Introduction of hazard signs 16
3.2 Behavioural observations 16
3.3 Ethical considerations 17
3.4 Data analysis 17
4. Limitations of the research 17
5. Results and discussion 18
5.1.1 Visitor origin 19
5.1.2 Age 20
5.1.3 Gender 20
5.1.4 Visitor group 20
5.1.5 Level of experience 21
5.1.6 Time spent at the sites 21
5.1.7 Visits to one or both glaciers and the information centre 22
5.1.8 Discussion of visitor characteristics 22
5.2 Hazard awareness 23
5.2.1 Hazard identification 23
5.2.2 Hazard awareness scores 24
5.2.3 Total hazards identified 24
5.3 Awareness and effect of hazard signs 25
5.4 Perceptions of safety 26
5.5 Attitude to individual responsibility 29
5.6 Visitor behaviour 30
5.6.1 Reported behaviour 30
5.6.2 Observed behaviour 31

5.7 Summary of visitor perceptions and behaviour 32
5.7.1 Hazard perceptions 32
5.7.2 Safety perceptions 32
5.7.3 Individual responsibility for safety 32
5.7.4 Visitor behaviour 33
6. Recommendations 33
6.1 The Fox and Franz Josef Glaciers 33
6.1.1 Site management 33
6.1.2 The use of hazard warning signs 34
6.1.3 Visitors� centre 34
6.1.4 Community relations 35
6.2 Visitor management in general 35
6.2.4 Site management 35
6.2.3 The use of hazard warning signs 36
6.2.4 Visitors� centres 36
6.2.5 Community relations 36
7. Conclusions 37
8. Acknowledgements 37
9. References 38

5
Abstract
The management of visitors to New Zealand�s protected natural areas is increasingly
complex, with continued diversification in activity style, visitor type and origin, and
heightened expectations of quality from both the tourism industry and the visitors
themselves. Central to the visitor management challenge is maximising the safety of
visitors, while preserving the unique and individual significance of the outdoor
experience.
As the majority of New Zealand�s visitor attractions are located in largely unmodified
natural environments, visitors potentially face a number of natural hazards. While the
inherent risks may be evident to managers and more experienced visitors, the extent
to which casual visitors perceive natural hazards has important influence over (and
implications for) both individual visitor behaviour, and the hazard management style
adopted at specific visitor sites.
This study examines the extent to which visitors to Fox and Franz Josef Glaciers
demonstrate an awareness of hazards, and the effectiveness of both existing and
introduced hazard warning signs on visitor awareness and behaviour. Results suggest
that hazard awareness among visitors is only modest, and a consequence of a variety
of factors. These include: ambiguous hazard warning signs; unrealistic visitor goals
and expectations; moderately high visitor perceptions of safety; a low level of visitor
centre use prior to glacier access; and the phenomenon of social facilitation.
Awareness of hazards, and behaviour compliant with management restrictions, was
observed to increase in the presence of pictorial (introduced) signs. This finding
implies that management can play a further role in advancing visitor awareness and
perception of hazards in the Glacier valleys.
1. Introduction
Natural attractions form the basis of New Zealand�s promotion as a tourist
destination. Hundreds of thousands of people visit this country�s protected natural
areas each year, many of whom are likely to lack knowledge of, or experience in, such
environments. Visitor safety is, therefore, a critical aspect of protected natural area
management, and one which is likely to grow in significance as greater proportions of
visitors originate from countries outside New Zealand.
Despite increasing numbers of international visitors, little is known about how these
people perceive risks, or the extent to which they assume responsibility for their own
safety. These factors, in combination with what is a loosely co-ordinated tourism
industry, and the possible idiosyncrasies of tourists, represent the potential for
accidents, dissatisfaction, and legal or moral dilemmas for visitor management
agencies.
Visitor management in natural areas is increasingly complex in New Zealand, with
continued diversification in activity style, visitor type and origin, and heightened
expectations of quality from both the tourist industry and the visitors themselves.

6
Mandated with the guardianship of nearly one third of New Zealand�s total landmass,
encapsulating the nation�s premier visitor attractions, the Department of
Conservation has become something of a reluctant provider of tourism experiences.
Furthermore, the New Zealand economy in general, and (more pertinently) the
economic and social fate of many small �tourist towns�, is highly dependent on the
vagaries of the tourist market. This reliance creates considerable pressure for the
Department of Conservation to accommodate and facilitate visitor access and
enjoyment in natural resource areas.
Compounding this situation is the current focus on accountability in health and safety.
This is experienced by all institutions, agencies and employers in New Zealand, but
still under scrutiny for its role in the tragic incident at Cave Creek in 1995, the
Department of Conservation is more aware than many of the saliency of safety issues.
The Department is, therefore, naturally interested in the best available visitor
management practices and, to this extent, is currently involved in an investigation into
the level of visitor hazard awareness at Fox and Franz Josef Glaciers.
1 . 1 T H E S T U D Y S I T E S
The Fox and Franz Josef Glaciers are among the most popular of New Zealand�s
natural attractions. These neighbouring tourism icons on the South Island�s West
were largely responsible for both the initial developments in tourism, and the
continuation of a strong, rapidly expanding tourism industry in the region. An
estimated combined total of 400 000 visits to the Glaciers per annum (the
consequence of increased national and international promotion, and the maintenance
of relatively easy foot access to within close proximity the ice) has created within the
nearby townships an increasingly significant economic dependency on tourism.
1 . 2 A I M S A N D S T R U C T U R E O F T H E R E P O R T
This report has been commissioned by the West Coast Conservancy of the
Department of Conservation (DOC). The study concept emerged from an on-going
research project undertaken by the report�s author, and management concerns about
visitor perception of hazards, and associated behaviour, at both Fox and Franz Josef
Glaciers.
The specific terms of reference for this project were to determine:
1. The general level of hazard perception among visitors to the Glaciers.
2. The specific hazards to which visitors believe they were exposed.
3. Any differences in hazard perception between visitors to the Fox Valley and the
Franz Valley, or among visitors from different countries.
4. The effectiveness of the current hazard sign system in communicating the actual
hazards to visitors.
5. The types and numbers of signs most effective in communicating the hazards to
which visitors are exposed (to be assessed using an alternative sign type to that
currently employed by DOC).
6. Basic visitor characteristics and use patterns for the two glacial valleys.

7
This report begins by briefly reviewing some of the important themes in
contemporary literature relating to the subject of hazard management. This review
locates the current study in the broader context, and has instructional value through
informing visitor management practices. Following this, the research methods are
described, including ethical considerations and limitations of the study. The section
on results is the most expansive section, and for this reason it has been divided into
five smaller components, each of which addresses a specific aspect of the study. The
results section also includes a brief summary and discussion that integrates the
various aspects. The report concludes following recommendations based on the
outcomes of the study.
2. Literature review
To non-risk-seeking visitors, hazards are impediments to an optimal
experience. Managers often cannot control hazards, but by managing visitor
behaviour, they can reduce risks (McCool & Braithwaite, 1992: 294�295).
2 . 1 I N T R O D U C T I O N
In addition to primary research, it is also highly valuable to review previous research
relating to hazard awareness and perception, and the experiences of other visitor
management agencies. To this extent, this component of the report addresses a
variety of key concepts and issues including: risk (real and perceived);
communicating risks and hazards; individual and agency responsibility for risk and
safety; and behavioural factors affecting risk management. As the nature of this
review may be too detailed for some readers� purposes, a summary of key points has
been provided at the end of this section.
2 . 2 A B R I E F D E F I N I T I O N O F T E R M S
Hazards and hazard perception are best understood within the broader context of
risk management. A considerable body of literature now exists in the field of risk
studies, some of which is useful in informing hazard management practice.
Notwithstanding the complexities of defining risk (some of which are discussed
below), for the purposes of this report the term will refer to the potential to lose
something of value. Hazards are considered to be conditions which increase the
possibility of loss occurring. Finally, the report often refers to tourists and visitors.
These terms will often be used synonymously, owing to the fact that the majority of
people who visit areas such as the Fox and Franz Josef Glaciers are tourists of one sort
or another (domestic and international).

8
2 . 3 R I S K
Risk and risk-taking are inescapable aspects of all human existence and involve
choices or trade-offs between positive and negative consequences. Risk is variously
defined, and has therefore been difficult to operationalise. For instance, a traditional
understanding of risk is articulated by Priest & Baillie (1987), when they define it as
the potential to lose something of value. Conversely, Roehl & Fesenmaier (1992:17)
state that �[a] situation where the only possible outcome is a sure loss... is not risk. [...]
A choice involves risk when the consequences associated with the decision are
uncertain and some outcomes are more desirable than others�.
As suggested, the theories which seek to explain risk and risk-taking are many and
varied. For instance, Douglas & Wildavsky (1982) imply that risk taking is best
understood within a cultural paradigm of social acceptability. At the other end of the
spectrum, Trimpop (1994: xiv) states that risk is an essential behaviour in human
evolution, possessing �...a physiological and genetic predisposition...�. Although these
two approaches to risk are different, they are not mutually exclusive. For instance,
while there may be a genetic predisposition to risk-seeking behaviour, the risk itself
can be viewed as socially or culturally constructed. What is risky in one culture or at
one particular time in history may not be risky in another. Trimpop (1994: xiv) goes
part of the way towards this multidisciplinary definition of risk taking when he
describes it as �...a concept combining individual, situational, physiological, emotional
and cognitive factors..., each of which in itself is insufficient to describe the complete
concept of risk taking accurately�.
Risk is commonly considered as a compound measure of the probability of an event
occurring and the magnitude of its consequence. Consistent with this approach to
risk, Yates (1990; 1992, cited in Trimpop, 1994: 6) identified three major
components in the risk construct:
1. loss
2. the significance of loss
3. the uncertainty associated with loss.
Despite disagreement on the nature of risk and how it can be assessed, it is more or
less accepted that risk can be differentiated into a number of different forms.
Drawing on research in consumer behaviour, for instance, Cheron & Ritchie (1982,
cited in Roehl & Fesenmaier, 1992; Brannan, et al., 1992) have identified seven
components of risk, all of which can be applied to the visitor experience. These
include: financial, functional, physical, psychological, social, time and satisfaction.
The significance of any particular �type� of risk is likely to vary depending on the
context. For instance, in their population-based study evaluating the risk perceptions
of recreation activities, Brannan et al. (1992: 151) found that, overwhelmingly, �...the
most commonly predictive components of perceived risk were physical and
psychological, indicating that respondents considered these two components to most
commonly contribute to their overall risk perceptions�. It is note-worthy that most
definitions of risk are stated in negative terms only (see Johnston, 1989).

9
2 . 4 R I S K P E R C E P T I O N
Irrespective of the actual presence of risk (or its definition for that matter), it is the
perception of risk that will govern the behaviour of individuals. This individual
awareness is likely to be affected and influenced by a range of factors including
previous experience (either personal or learnt/reported), cultural conditioning (and
social acceptability), and personality traits (general disposition).
According to Priest & Baillie (1987: 18), perceived risk refers to �...an individual�s
subjective assessment of the actual amount of danger involved in an adventurous
setting�. Conversely, Douglas & Wildavsky (1982:80) appear to down play the
individual nature of risk perception, by stating that, in risk perception �... humans
act less as individuals and more as social beings who have internalised social pressures
and delegated their decision-making processes to institutions�. Developing another
angle after their review of a number of studies, Roehl & Fesenmaier (1992: 17�18)
suggest that �risk perceptions are situation specific�, and that in any given
circumstance the individual will pay more attention to some risk factors than others
because these factors are perceived to be the most important by the decision maker.
The measurement of risk perception has taken various forms. For instance, in the
outdoor recreation literature, many studies have assessed changes in the risk
perceptions of participants in adventure leisure experiences (Morgan et al., 1997b);
Priest & Carpenter, 1993; Carpenter & Priest, 1989; Priest & Bunting, 1993). These
authors have been interested in the pre and post activity perceptions of risk, and have
generally concluded that perceived risk is reduced as competence in the activity
(experience) increases.
In another recreation study, Levine & Gorman (1994) assessed skiers� perceptions of
danger as a function of their knowledge of danger. The researchers found that
knowledge of fatalities in skiing was an important factor in increasing skiers� ratings
of the dangerousness of the sport. The authors also noticed a decrease in self-reported
risky behaviour when knowledge of previous accidents was high. The results of this
study add credence to the postulate that an individual�s risk perception is likely to be
informed by his or her awareness of the history of an activity (or, we can assume, the
history of a place).
2 . 5 C O M M U N I C A T I N G R I S K A N D H A Z A R D
�...serious repercussions are likely to result from situations in which risk is
present but not perceived� (Bean, 1989).
The issue of risk and hazard communication is a widely debated and controversial
topic. Opinions on how best to inform visitors of risks, and manage risk taking
behaviour in natural settings are part of a broader debate about direct and indirect
management techniques (see Manning, 1986). With a growing emphasis on safety
and agency accountability (see Spengler & Hronek, 1995; Gold 1994), some authors
have urged caution in becoming too involved in what is essentially the visitor�s
experience (Devlin, et al., 1996; Griswold, 1989; McAvoy & Dustin, 1990). Far from
insulating the visitor from the potential consequences of their experiences, other
authors advocate almost complete individual responsibility (Hardin, 1969).

10
Despite the range of views, McCool & Braithwaite (1992) contend that very little is
known about the effectiveness of messages presented to visitors in protected natural
areas. For instance, these authors (1992: 320) ask: �What are we telling visitors about
hazards? [...] Are these messages correct? Are messages from different agencies and
personnel consistent with each other?�. What influences perceptions of messages on
site? The way in which risk is presented or communicated to visitors to protected
natural environments is of interest in this study. For instance, do visitors pay attention
to or avoid warning messages (e.g. signs) in natural settings? What influence do safety
messages have over visitor perceptions and behaviours?
Adherence to, or awareness of messages in tourism and recreation settings has wider
implications than risk management. Studies in North America (e.g. Vander Stoep &
Gramann, 1987) have looked at reducing inappropriate visitor behaviour (such as
vandalism) via a range of indirect management techniques. Another more recent
study looked at the effects of personality and situation on intentions to obey rules in
outdoor recreation areas. This laboratory study found that �...subjects were more
willing to comply with regulations when they were told of the reasons for the rule, as
well as the negative consequences ... of not obeying them� (Gramann, Bonifield, and
Yong-geun, 1995: 340). In other words, specific examples detailing the consequences
of risks are often more effective than vague suggestions that certain activities are
dangerous.
Another important factor in successful hazard communication appears to be visitor
perception of source credibility. The source of the message is thought to exert a
powerful influence over message acceptance, and on resulting behaviour.
Attractiveness and expertise are key features of increasing credibility (McCool &
Braithwaite, 1992).
Finally, research in behavioural science has found that the presence of uniformed
authority figures increased subjects� compliance with regulations in a variety of set-
tings. For instance, a recent North American study found the presence of uniformed
park employees to be a significant deterrent to off-trail hiking in a major national park
(Swearingen & Johnson, 1995). Importantly, these researchers also found that
visitors accepted the presence of park staff where there was a perceived need for
management action related to information dissemination, visitor safety, and resource
damage. The authors emphasise that the park staff need not assume a con-
frontational, authoritarian stance, since �...the mere presence of the uniformed em-
ployee may dramatically reduce non-compliance� (Swearingen & Johnson, 1995: 80).
2 . 6 R I S K A N D R E S P O N S I B I L I T Y
Whether visitors to protected natural areas �are actively seeking out risk through
adventure activities, or simply wishing to see or experience a spectacular natural
environment in which risk inheres, the managers of recreation lands carry legal and
moral responsibilities for public safety� (Haddock, 1995: 7). For instance, under the
provisions of the Occupiers Liability Act (1962) and the Health and Safety in
Employment Act, (1992), those responsible for the management of protected natural
areas are required to take all possible steps to ensure the safety of visitors to their
sites. Furthermore, while the legislation emphasises the need for safety compliance,
the Accident Rehabilitation and Compensation Act (1992) denies injured persons the
right to seek damages against those responsible.

11
A legal framework exists with the intention of protecting citizens and institutions
against harm. While this legal context may reflect the general morality of the society,
many of the contracts held are more or less tacit arrangements based in expectation
and assumption. In this sense, Social Contract Theory may provide a useful
framework through which to gain an understanding of the relationships between
producers and consumers in tourism.
It is interesting to explore the changing nature of social contracts during a time of
significant social restructuring. In New Zealand, for instance, the changing political
orientation of the 80s and 90s has engendered an attitude of individual respons-
ibility�a key ideological feature of modern post-industrial western nations.
Individuals are now encouraged to take more responsibility for themselves (as
illustrated by increases in private health insurance, retirement savings schemes, edu-
cational funds for children, etc.). At the same time, we expect greater agency
accountability than has been the case in the past. Referring to North Americans,
Rogers (1980, cited in Hanna, 1991: 4) notes: �The public of today is less and less likely
to accept misfortune as a fact of life and is more inclined to look to the courts for com-
pensation�. In other words, this new individualism is juxtaposed with a reduced indi-
vidual responsibility�or greater agency responsibility for risk and safety. This might
be more accurately described as a lower tolerance of exposure to risk (of any sort).
Acknowledgement of this lack of tolerance in Canada has led Parks Canada to initiate
a Public Safety Communication Plan, one of the goals of which is to �...increase
awareness that safety is a shared responsibility when visiting heritage areas� (Parks
Canada, 1997: 3). The document also states that the long term goal of Parks Canada
is to �...encourage visitors to be more self reliant, so that they take responsibility for
their safety...� (ibid).
Experience suggests that in New Zealand domestic visitors currently (and certainly in
the past) assume a greater responsibility for their safety in natural settings than their
Canadian counterparts. This may be attributed to several things, including a cultural
identity supporting �do it yourself� lifestyles, and low-key, �she�ll be right� attitudes
(e.g. down-playing danger). In addition, New Zealand�s ACC legislation has protected
agencies from court action, and compensated individuals for accidents and injuries.
Griswold (1989), writing about his visit to New Zealand�s natural attractions,
summarised the risk management approach using a sign he�d encountered which
read: �fall in�no come back�, implying that visitors were more or less on their own in
that particular setting.
The degree to which visitors accept responsibility for their own safety in protected
natural areas is crucial to how these lands are managed. International visitors present
an especially interesting and important case as many may well arrive in tourism
settings with assumptions and expectations about risk and safety that are very
different from those of their hosts and local counterparts.

12
2 . 7 T O U R I S T B E H A V I O U R A N D T H E R E L E V A N C E O F
R I S K
The visitor to the glacier valleys can encounter hazards that may never have
been encountered before. Often he or she is going from a well managed
environment to a difficult, and at times hazardous natural environment
(Tourism Resource Consultants, 1995: 5)
New Zealand�s tourism industry is built upon its natural attractions, yet little is known
of the risks (perceived or real) faced by visitors to these areas.
Tourists today, unlike their predecessors�the travellers, have a solid sense of security
based on the controlled, predictable and urban communities in which most people
now live, and manifest in the relative comfort in which they travel (e.g. coaches and
rental cars provide warm, controlled, and stable modes of travel). In contrast, the
natural attractions to which tourists to New Zealand are invited are often not entirely
controlled or predictable�or, at least, they have the potential to become inhospitable
or dangerous. This has implications for safety, risk and liability in New Zealand�s
tourism �product�.
From a tourist motivation perspective, it is evident that tourists change their
behaviour while travelling, doing things they would not do while in their home
environments. This may include undertaking risks which they would not normally
consider. One possible explanation for this is that there is a perception of safety in
being a tourist; some feeling of invincibility may be present in the minds of those who
travel for pleasure. Furthermore, because some activities and events undertaken as
tourists (or visitors) are more organised or planned than at home, the responsibility
for safety may be displaced onto the agency or industry thought to be responsible for
providing the experience.
Despite a lack of documented evidence, it does seem plausible that as tourists people
behave differently from how they might behave when not tourists. Kruhse-
MountBurton (1995), and Ryan & Kinder (1996), both reporting on the deviant
tourist, suggest that some tourists justify their indulgence in the sanctioned margins
of behaviour because they are not at home. In addition, Ryan et al. (1996) suggest
from their study of New Zealand and British university students on holiday, that some
tourists are more likely to engage in risky behaviours while away.
People on holiday may have a perception that what they are taken (or led) to is
�presented� to them in some organised, coherent, co-ordinated form. In tourism,
examples of this include the information centre and brochures about places; travel
maps; signposts; bus trips; uniformed guides; operators and managers; viewing
platforms, roadside lookouts, etc. In reality, the industry is loosely co-ordinated and,
in particular, the link between the promotion and marketing information on
protected natural areas, and its management and delivery (DOC) is tenuous to say the
least. There is an incongruity between the image of the insulated touristic experience
presented and promoted, and the reality of what that experience can become.
In their review of the theoretical aspects of crime and its relationship with tourism,
Tarlow & Muehsam (1996: 20) emphasise the �make-believe� character of the tourist�s
trip. As a result of the tourist state, the authors here suggest that a number of social
phenomena can occur.
� Tourists often let down their guard making them easy prey for criminals.

13
� Tourists will often de-differentiate neighborhoods, thus entering into areas in
which locals might dare not go.
� Tourists may often confuse good luck with caution or proper planning. thus,
when tourists pass on their travel tales to their relatives and friends, unrealized
risks that do not result in dire consequences by pure chance, may influence others
to try the same. Others who repeat these risks may not be fortunate enough to
escape unscathed.
These characteristics of the tourist�s nature can also be applied to other aspects of
human exposure to risk, such as risk in protected natural areas.
Whether or not perceived risk is high among all tourists, recent research indicates
that tourists are very aware of safety when making destination choices. For instance
Sirakaya, Sheppard and McLellan (1997) used a scenario method to study how people
are affected by information regarding a destination�s safety. These researchers found
that perceptions of low safety had a detrimental effect of much greater magnitude
than a perceived perception of high safety. According to the authors, the implication
of this finding is �...if safety is not being discussed with respect to a given destination�
be quiet!� (Sheppard, 1997 pers. comm.). This result contradicts previous studies
which have suggested that visitors do not necessarily alter travel plans because of
safety concerns (Crystal, 1993, cited in Pinhey & Iverson, 1994).
Finally, an on-site study of tourists� perceptions of safety was undertaken by Pinhey
and Iverson (1994). In their examination of the safety concerns of Japanese visitors to
Guam, the researchers asked respondents to describe how safe they felt in a variety of
situations (e.g. sightseeing, water sports, night spots, driving, crossing the road). The
findings suggested that respondents felt �...less safe when participating in activities
that required movement away from their hotel...� (Pihney & Iverson, 1994: 89). Those
visitors who were older, and those who felt they were easily able to communicate with
local people reported feeling the safest while visiting Guam.
2 . 8 F O X A N D F R A N Z J O S E F G L A C I E R S
While there is a growing body of information about the real risk and hazards to which
visitors are exposed at the glaciers in South Westland (see Tourism Resource
Consultants, 1995; Davis, 1998), very little is known about how visitors to these
attractions perceive risk and safety. Information relating to visitor awareness and
perception will ultimately assist management in targeting appropriate levels of risk
management and hazard communication. Both will be complemented by an
improved understanding of the extent to which visitors accept responsibility for their
own safety.
Fox and Franz Josef Glaciers provide excellent study sites to examine concepts of risk,
hazard and safety perception. As key components of the South Island tourism trail,
the Glaciers attract a broad cross section of the visitor market, but the predominant
user groups are Short Stop Travellers (SST) and Day Visitors (DV) (DOC, 1995;
1998). To this extent, visitors can be described as inexperienced, and therefore have
�...a greater reliance on the Department to provide dependable and timely risk
management services� (DOC 1998: 12).
14
As the majority of visitors are short term, and often from outside of New Zealand, it is
valuable for management to appreciate more clearly the extent to which such visitors
are aware of risks and hazards. Furthermore, in the interests of delivering quality
experiences in a safe and dependable manner, it is helpful to understand the
effectiveness of signs in communicating the risks and hazards to visitors.
2 . 9 S U M M A R Y O F T H E L I T E R A T U R E R E V I E W
1. Definitions of risk and hazard are similar, but it is important to distinguish
between them. A hazard is a set of circumstances which may cause harmful
consequences. Risk is the likelihood of becoming harmed by a hazard.
2. Risks and hazards are accepted at different levels by different societies and
cultures.
3. Real risk is calculated as a compound measure of the probability of an event
occurring and the magnitude of its consequence. Perceived risk is an individual�s
subjective assessment of the level of danger in a setting.
4. Visitor risk perception will be influenced by previous experience, cultural
conditioning, and personality traits. The level of perceived risk is known to
decrease as activity competence increases.
5. Research suggests that visitors are less likely to engage in risky behaviours when
knowledge of previous accidents is high.
6. How best to communicate hazard and risk is an on-going management debate.
Research suggests that visitors are more likely to adhere to regulations when they
are told of the reasons for the rule, and the negative consequences of disobeying it.
7. According to recent research, visitor compliance with management regulations is
likely to be increased through the on-site presence of uniformed park staff.
8. There are legal and moral responsibilities for public safety, some of which may
need debate and reinterpretation.
9. The public of today has a lower tolerance of exposure to risk and hazard than in
the past.
10.The degree to which visitors accept responsibility for their own safety in protected
natural areas is crucial to how these lands are managed.
11.Owing to the highly contrived and predictable nature of modern living (travel
included), many visitors to natural attractions will be mentally and physically
unprepared for potentially hazardous situations.
12.There is some evidence to suggest that people behave differently when away from
their home environments. Tourists are known to engage in risky behaviours.
13.As major visitor attractions in which very real physical risks inhere, Fox and Franz
Josef Glaciers represent excellent study sites to examine risk and hazard
perceptions.
15
3. Methods
This study combined two main methods to obtain data. These were (1) an
interviewer-applied survey; and (2) direct behavioural observations.
3 . 1 T H E S U R V E Y
3.1.1 Aim and implementation
A questionnaire was designed for specific use at the Glacier valley sites. The main aim
of the survey was to determine, using semantic differential scales, three aspects of
visitor attitude: 1) the extent to which visitors were aware of hazards in the area
visited; 2) the extent to which visitors felt safe in the area visited; and 3) the extent to
which visitors felt responsible for their own safety while at the site. Randomly selected
respondents used a seven-point scale to show extent of agreement or attitude.
The survey also assessed awareness of existing and introduced hazard signage, and
self reported behaviour on-site. Other aspects included typical demographic and
visitation information.
All questionnaires were administered by interviewers, with the exception of those
completed by visitors whose preferred language was Japanese or German. These
respondents self-completed questionnaires provided in their own language on-site
and returned them to the researcher or his assistant. Questionnaire completion times
varied between five and ten minutes. Interviewing took place at fixed placements at
each of the glacier sites. At Fox Glacier, the interviews took place at the top of the
small incline above the current carpark (adjacent to the 1960s moraine). At Franz
Josef, interviewing was undertaken on the riverbed immediately following the point
at which the current track leaves the bush. All interviews were carried out as visitors
returned from their walks.
The survey was implemented in two phases over a total of 14 days which spanned late
January, February and March. The initial and preferred method had been to survey
visitors at the two glacier valleys concurrently. Owing to the closure of the Franz
Valley access track in mid January, this method had to be revised, and a consecutive
implementation plan adopted. A comparison was made possible with the reopening
of the access track in March.
3.1.2 Response rate
Over the sampling period, a total of 428 visitors were approached for interviews. Of
these, 88.3 % complied. When responses at the two visitor sites were compared,
Franz Josef had the higher rate of compliance (92.6%). The majority of those visitors
who declined to take part in the study cited reasons relating to time (64%), weather
(16%), or language (12%). The overall response rate of nearly 90% is considered very
good (Babbie, 1989; Singleton et al., 1992) and is an important component in the
representative nature of the results.

16
3.1.3 Introduction of hazard signs
One aspect of the study involved an assessment of the current, and any alternative
signage, in terms of its effectiveness in conveying hazards to visitors to the Glaciers. In
order to do this, surveys and behavioural observations were undertaken during times
when different numbers and types of signs were in place. At all times, the current
Department of Conservation signage remained in place (see limitations). The
maximum number of introduced signs at either site was five, and the minimum was
zero.
There are three categories of hazard which have been used in designing and selecting
signs:
1. hazards which were currently both present and identified in DOC signage;
2. hazards which were currently present but unidentified in DOC signage; and
3. hazards which were currently neither present nor identified in DOC signage.
The third category (the spurious signs) were an important methodological inclusion.
Without such signs, it would be difficult to determine if visitors were reporting
hazards which were evident to them, or hazards about which they had been warned
via the signage. Examples of the signs, including brief details of their dimensions are
on page 27.
The choice of hazard signs was made following various pre-visits by the researcher,
and in consultation with the Department of Conservation management. During
implementation, signs were erected along sections of access tracks in both the Fox
and Franz valleys as per the limitations of weather and terrain. A schedule was
constructed detailing the employment of particular signs, behavioural observation
times and questionnaire distribution.
3 . 2 B E H A V I O U R A L O B S E R V A T I O N S
An important component of this study was attempting to observe how visitors
behaved while at the glacier sites. This component evolved out of concern about the
way visitors were thought to ignore safety or hazard warnings issued by the
Department of Conservation, thus exposing themselves to danger. During the
fieldwork phase of this study, many observations were made, both formal and
informal. In order to quantify these impressions, a structured set of observations was
made at the terminal face at each of the sites. The glaciers� terminal faces were chosen
as appropriate places from which observation data could be collected for the
following reasons:
1. these are natural end points for many visitors, and logical and convenient places at
which to locate observers;
2. the terminal face is identified in both valleys as a hazard of significant magnitude;
3. there is a history of behavioural problems at the terminal face on both access
tracks; and
4. the presence of such features at both sites allows strong comparisons to be made.

17
Behavioural observations were planned for each day of the study period. While
weather or access conditions did not always allow this, a consistent procedure was
used throughout. The observer located him or herself in a pre-determined place, from
which a good view of the glacier�s terminal face and approaching visitors could be
gained. At both sites, this position was approximately ten metres back from the rope
closure erected by the Department of Conservation aimed at restricting access to the
unstable terminal face. As the observations were covert, the observer was required to
sit, or act in such a way that it would appear to others that he or she was simply
another visitor admiring the view or eating lunch. Discrete recordings were made of
the total number of visitors who reached the terminal face, and of those visitors who
entered the restricted areas (i.e. those who proceeded beyond the rope closure, and
ignored warning signs). Observations were usually for a period of between one and
two hours.
3 . 3 E T H I C A L C O N S I D E R A T I O N S
Ethics are an important consideration in modern social science research, and this
study is not excepted from this. Efforts were made to stay within the commonly
accepted practices of current social research, and respondents were given
opportunities to withdraw their participation at any stage of the survey (including up
to two weeks after). The use of mild deception (as employed in the introduction of
�bogus� signs) was carefully considered and designed to minimise the negative effects
on visitors� experiences. Covert observations involved the collection of no personal
details, and while currently out of favour in some social science circles, the technique
was believed to be unharmful, and crucial to the collection of accurate data.
The entire project was reviewed by the Department of Conservation, and a formal
application to Lincoln University�s Human Subjects Ethics Committee was approved.
3 . 4 D A T A A N A L Y S I S
The survey data were entered onto a spreadsheet (Lotus 123 �97), and analysed using
the Statistical Package for Social Scientists (SPSS) for windows. Three scales have
been used in the analysis, each having been subjected to separate reliability analysis.
4. Limitations of the research
Every attempt has been made to ensure that the data collected are as robust as
possible. However, it is an inevitability of all research that limitations exist. It is sound
methodological practice to at least allude to these.
1. The results of this study are limited to summertime users of the specific sites
surveyed. While some generalisation to other seasons and sites is possible, this can
only be tentative. The data collection was originally divided in order to more

18
accurately represent the summertime visitation pattern. Data collection was
scheduled to occur concurrently at the two sites on two separate occasions.
However, following the closure of the Franz Josef access track between January
and March 1998, a consecutive approach was adopted. While not affecting the
total data set, the result of this non-concurrent data collection method is that the
comparison between sites is less precise.
2. Because of the need to ensure visitor safety, manipulation of the existing hazard
signage was not possible. Manipulation was limited to the introduction and
removal of alternative signs only. It is, therefore, not possible to attribute
modification in perception or behaviour to the introduced signs alone. Effects
could be the cumulative consequence of additional signs, rather than the effects of
the sign content or form.
3. Observers, while covert, may have influenced the behaviour of visitors under
observation. This is described as social facilitation, a process whereby people
respond to the behavioural cues of others. For instance, by remaining seated
outside of the restricted access area, the observer may have influenced others to do
the same, thereby affecting the results. The only way to avoid this is to hide the
observer from view, or use video surveillance. Neither strategy was considered to
be practical nor appropriate.
4. While the sample size generated is considered sufficient for this initial, exploratory
study, it is important that the work is replicated at either the Glaciers or at other
natural attractions.
5. Undertaking research in field settings is naturally distinct from the laboratory
environment in which the majority of intervening variables can be controlled.
Natural attractions make complex settings for quasi-experimental research
methods as utilised in the current study. Several unpredictable variables remain
outside of the researcher�s control, including the weather, access conditions, and
urgent hazard management decisions. While efforts have been made to minimise
the effects of these factors, it is impossible to completely remove their influence on
the results.
5. Results and discussion
This section presents the results of the Glacier Visitor Survey, implemented in two
phases between January and March 1998. The data are drawn from the responses of
378 visitors to Fox and Franz Josef Glaciers, and observations of on-site visitor
behaviour. The survey responses represent a compliance rate of nearly 90%.
The Results section is divided into five broad sections for ease of interpretation. The
first of these describes the sample in terms of visitor characteristics, and general
visitor information, including age, gender, origin, group composition and so on.
Sections 5.2 through 5.4 examine the three main attitude dimensions under
consideration in this study. Respectively, these are: 1) hazard awareness; 2)
perception of safety; and 3) individual responsibility. The fifth and final section of the
results concentrates on aspects of visitor behaviour (both self-reported and
observed) with special regard to hazards in the two glacier valleys.
19
5 . 1 C H A R A C T E R I S T I C S O F T H E S A M P L E
5.1.1 Visitor origin
Consistent with the general trend evident in other recent visitor studies of New
Zealand�s natural attractions (Espiner, 1995; Horn, 1998; New Zealand Tourism
Board and Department of Conservation, 1993), the majority (80.4%) of visitors to the
Glaciers were from overseas (Figure 1). The most common visitor origin was
Australia (21.8%), followed closely by New Zealand (19.6%), and the United Kingdom
(17.2%). Visitors from Asia were conspicuous by their absence from the glacier sites,
comprising only 5.3% of the overseas visitors. On a nation-wide scale, Asians make up
nearly 20% of the New Zealand international visitor market (New Zealand Tourism
Board, 1998). The poor representation of Asian visitors may be explained by recent
economic turbulence experienced in several Asian countries (notably Korea, Taiwan,
and Japan), and the more difficult foot access to the Glaciers during this period.
When the two visitor sites were compared, the most striking difference was the
proportion of Australian visitors recorded at the Glaciers. At Fox Glacier, Australian
visitors comprised 13.6% of all respondents, compared with 29% of respondents at
Franz Josef. While this may reflect a genuine preference for Franz Josef among
Australian visitors, it is more likely that the difference is the consequence of the
slightly different data collection periods (see limitations).
Of New Zealand visitors (19.6%), the majority (44.6%) originated from the North
Island, although nearly one third (31.1%) were from Canterbury (Figure 2). When
Fox and Franz Josef Glaciers are compared (Fig. 2), a slightly different trend is
evident. For instance, while over half (55.3%) of all visitors to Franz Josef originated
from the North Island, these visitors represented only a third (33.3%) of visitors to
Fox Glacier. Visitors from Canterbury (41.7%) clearly dominate at Fox, but account
for only one in every five (21.0%) visitors to Franz Josef.
Figure 1. Visitor origin.
Figure 2. Visitor age groups.
20
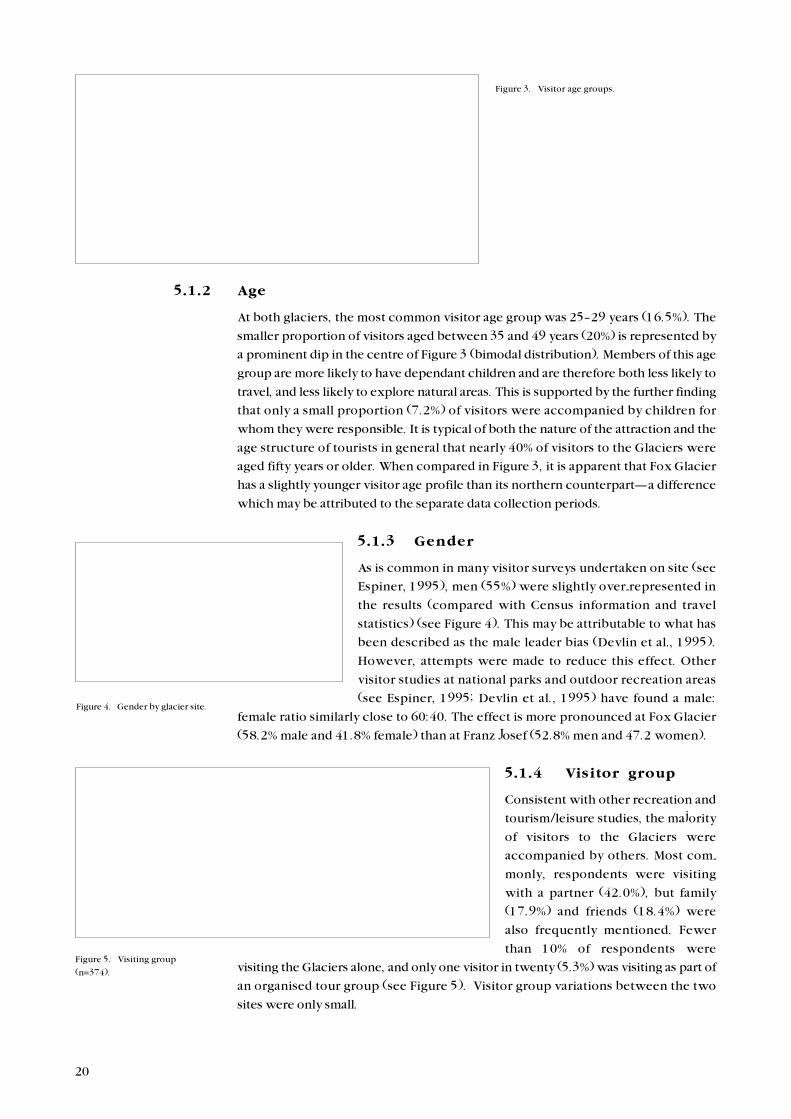
5.1.2 Age
At both glaciers, the most common visitor age group was 25�29 years (16.5%). The
smaller proportion of visitors aged between 35 and 49 years (20%) is represented by
a prominent dip in the centre of Figure 3 (bimodal distribution). Members of this age
group are more likely to have dependant children and are therefore both less likely to
travel, and less likely to explore natural areas. This is supported by the further finding
that only a small proportion (7.2%) of visitors were accompanied by children for
whom they were responsible. It is typical of both the nature of the attraction and the
age structure of tourists in general that nearly 40% of visitors to the Glaciers were
aged fifty years or older. When compared in Figure 3, it is apparent that Fox Glacier
has a slightly younger visitor age profile than its northern counterpart�a difference
which may be attributed to the separate data collection periods.
5.1.3 Gender
As is common in many visitor surveys undertaken on site (see
Espiner, 1995), men (55%) were slightly over-represented in
the results (compared with Census information and travel
statistics) (see Figure 4). This may be attributable to what has
been described as the male leader bias (Devlin et al., 1995).
However, attempts were made to reduce this effect. Other
visitor studies at national parks and outdoor recreation areas
(see Espiner, 1995; Devlin et al., 1995) have found a male:
female ratio similarly close to 60:40. The effect is more pronounced at Fox Glacier
(58.2% male and 41.8% female) than at Franz Josef (52.8% men and 47.2 women).
5.1.4 Visitor group
Consistent with other recreation and
tourism/leisure studies, the majority
of visitors to the Glaciers were
accompanied by others. Most com-
monly, respondents were visiting
with a partner (42.0%), but family
(17.9%) and friends (18.4%) were
also frequently mentioned. Fewer
than 10% of respondents were
visiting the Glaciers alone, and only one visitor in twenty (5.3%) was visiting as part of
an organised tour group (see Figure 5). Visitor group variations between the two
sites were only small.
Figure 3. Visitor age groups.
Figure 4. Gender by glacier site.
Figure 5. Visiting group
(n=374).

21
5.1.5 Level of experience
In order to get an understanding of visitors� familiarity with relatively natural
environments, respondents were asked to approximate the frequency with which
they visited largely unmodified natural areas when resident in their home
countries. This question produced an interesting result (see Figure 6), in that while
36.5% of respondents reported visits to such areas two or fewer times per year, as
many as 31.2% claimed to visit more than ten times per year, thus placing
themselves in the most experienced visitor bracket. Taken at face value, this result
implies that an important proportion of visitors to both glaciers were quite familiar
with natural and unmodified environments. It could be inferred that these visitors had
a reasonable awareness of hazards and were prepared to accept greater
responsibility for their own safety in such areas. However, this result should be
interpreted cautiously. It is possible that the nature of the question was
misunderstood by some respondents, particularly the interpretation of what
constitutes largely unmodified. The researcher�s own observations of visitors and
discussions with them suggested that people were far less familiar with largely
unmodified environments than is indicated in the result above.
5.1.6 Time spent at the sites
Visitors were asked to approximate the time spent on the glacier access tracks.
Overall, more than three quarters (76.1%) of the sample spent between one and two
hours at the site. The most commonly reported visit time was 1.5 hours. When the
glacier sites are compared (Figure 7), it is clear that visitors spent longer at Franz
Josef (mode = 90 minutes) than at Fox (mode = 60 minutes). Over one quarter
(26.9%) of visitors to Franz Josef stayed in the valley for two hours, compared with
16.4% at Fox.
Figure 6. Frequency of visits to
natural areas (n=372).
Figure 7. Approximate length of visit.

22
5.1.7 Visits to one or both glaciers and the information centre
Most (71.8%) respondents visited both Glacier attractions. The remaining 28.2% stated
that they would only visit one glacier. When the sites are compared (Figure 8), it is clear
that a higher proportion of respondents at Fox Glacier intended to also visit Franz Josef
(79.4%)1, than was the case for those visitors to Franz Josef who intended to visit Fox
Glacier (65%). Conversely, only 20.6% of those visiting Fox Glacier claimed that Fox
would be the only glacier they visit, compared to Franz Josef visitors, of whom 35%
claimed that Franz would be the only glacier they visit. This may be explained by the
directional flow of tourist traffic, or the fact that Franz Josef is the more well-known of
the two sites, and as such has a higher profile in the minds of visitors to region, and the
tour operators who influence which attractions are visited. That most visitors intended
to visit both glaciers is contrary to the claim made by TRC (1995: 5) that the �...visitor to
South Westland is principally interested in visiting one glacier...�.
Visitors were also asked if they had visited the Department of
Conservation Information Centre before their trip to the glacier
access track. In the combined sample, the majority of
respondents (63.7%) had not visited the Centre prior to arriving
at the glacier (see Figure 9). While the proportions differ slightly
between the two sites, the overall trend remains clear. This
finding has important implications for the situation of
information about the area, and in particular the dissemination
of information relating to hazards at the two sites.
5.1.8 Discussion of visitor characteristics
Visitors to the Glaciers of Westland National Park are broadly typical of Short Stop
Travellers (SST) in other national parks and natural attractions in New Zealand. For
instance, the results show that visitor age distribution was bimodal, reflecting the life
stages of the majority of long-haul travellers, and a broad cross-section of visitor
nationality was evident. Other New Zealand studies have also revealed high
proportions of overseas visitors, although few as high as 80% (see Espiner, 1995;
NZTB, 1993). Compared with visitors to national parks in general, however, it is likely
that Glacier visitors are slightly atypical. The most obvious difference is the greater
proportion of domestic visitors recorded in most studies of national park visitation.
These visitors stay for longer periods of time overall, and have higher levels of
experience in unmodified environments. Furthermore, male and female visitor
representations are more disparate than reported in the current study, although
visitor group ratios appear similar.
Figure 8. Visits to one or both glaciers.
Figure 9. DOC Information
Centre visited prior to arrival at
glacier.
1 This is despite the fact that at the time of sampling at Fox, the access track to the Franz Josef glacier
was closed to visitors.

23
The Glacier visitor characteristics reported here, present management with a number
of challenges and concerns, some of which are unique to the region. For instance,
while short walks are extremely popular SST attractions throughout New Zealand,
many access tracks are not of the duration found at Fox and Franz Josef. Site visits
here average about 90 minutes�sufficient time for visitors to be exposed to a range
of natural hazards. Furthermore, with the majority of visitors to the Glaciers
originating from overseas, it is clear that the management focus cannot afford to be
on New Zealanders alone. With significant proportions of visitors likely to be from
countries where English is not the first language, consideration will need to be given
to the most appropriate strategies for conveying hazard warnings. In this regard it is
salient to note that visitors generally did not visit the Department of Conservation
information centres prior to their arrival at the glacier access tracks. Attempts to
increase the hazard awareness of visitors should be cogniscent of this fact. In addition,
the results show that most people intend to visit both glaciers while in South
Westland. This finding stresses the value of continuous and consistent hazard
management strategies between the two sites. Management at one site has the
potential to affect awareness and behaviour at the other site.
The next section of the results examines visitor awareness of hazards, and the effects
of hazard signs on visitors� perceptions and behaviours.
5 . 2 H A Z A R D A W A R E N E S S
Visitors� awareness of hazards in the Fox and Franz Josef Valleys was determined in
several ways. These included the development of a hazard awareness scale, recording
the specific hazards identified by respondents, and calculating the total number of
hazards identified. This section of the results reviews the central findings of this
component of the study, and is followed by an analysis of the awareness and effects of
introduced hazard signs.
5.2.1 Hazard identification
Visitors were asked to recall any hazards noticed during their visit to the glacier.
Overall, one in five (19.3%) respondents claimed that there were no hazards at the
sites. Some hazards are more easily identified than others. In Figure 10, rock fall
(58%), tripping or slipping on loose stones (33.2%), icefall (31.6%), and falling in the
river (26.5%) were the most frequently reported2 among total visitors.
2 Visitors were not prompted with any information about hazards (or possible hazards) at the sites.
Responses reflect the range of visitor beliefs and understandings.
Figure 10. Hazards reported by
visitors to glaciers.

24
and the maximum score possible was 63. A
high score represents a high level of hazard
awareness.
Figure 11 represents a summary of the key
comparative findings relating to hazard
awareness scores. Those with higher hazard
awareness include: visitors to Fox Glacier;
visitors from New Zealand; women; and visitors
aged under 40 years. Statistically significant
differences were found for age (t= 2.48, df= 348, 2-
tailed p<0.01), and for visitor origin (t= 3.03,
df=119.5, 2 tailed p<0.01).
Further analysis (one-way ANOVA) of visitor origin
also showed statistically significant differences (F5, 22
=
7.51, p=0.000). For instance, visitors from the UK and
Ireland had a higher hazard awareness (43.6) than
European (32.7) or Asian (35.1) visitors. Figure 12
illustrates the mean hazard awareness scores for
visitors from Australasia, Europe, Asia, the USA and
Canada, the UK and Ireland, and Other. A post-hoc
comparison (Scheffe, 1953) reveals that, in terms of
hazard awareness, Europeans differ significantly from visitors from Australasia, the
USA and Canada, and the UK and Ireland.
5.2.3 Total hazards identified
A final measure of hazard awareness used was the total number of hazards identified
by respondents (Figure 13). While one in five (19.3%) visitors could not identify a
single hazard, slightly over a quarter (27%) identified three or more hazards. The
results at the two sites differ dramatically when examined. For instance, at Fox, 14.1%
of visitors were unable to identify any
hazards in the valley. At Franz Josef, nearly
one in four (23.9%) reported zero hazards.
Further, 38.5% of visitors to Fox identified
three or more hazards, while only 16.8% of
those at Franz reported this number.
Figure 11. Mean hazard scores.
When the sites are examined independently (also Fig. 10), there are some clear
differences between them. For instance, visitors to Fox Glacier appeared to be more
aware of rock fall (67.8%) and falling in the river (24.9%), than their Franz Josef
counterparts of whom 49.2% and 8.6% identified the respective hazards. Of the other
hazards (6.4%) reported by visitors the most common included: other tourists; strong
winds; bees; and eight visitors who, believing that the track marker posts were, in fact,
hazard markers, went to great lengths to avoid them!
5.2.2 Hazard awareness scores
Following a reliability analysis, a final hazard
awareness scale comprised nine items. On this
scale, the minimum score possible was nine,
Figure 12. Mean hazard score
by region.
Figure 13. Total number of
hazards reported.

25
As illustrated in Figure 14, the mean number of hazards reported for the sample is
1.75. There are, however, statistically significant differences between sites (t=4.78,
df=372, 2-tailed p<0.001), and origin (t=3.7, df=372, 2-tailed p<0.001). For instance,
visitors to Fox Glacier had a higher mean number of reported hazards (2.1) than their
Franz Josef counterparts (1.4). Visitors from New Zealand also identified a greater
number of hazards than those visitors from overseas, with means of 2.24 and 1.62
respectively. Interestingly, those visitors who had visited the Department of
Conservation information centre prior to their arrival at the glacier also reported a
higher number of hazards than those who had not visited the information centre. This
result was also found to be statistically significant (t=2.97, df=247.5, 2-tailed p<0.01).
5 . 3 A W A R E N E S S A N D E F F E C T O F H A Z A R D S I G N S
One aspect of this study endeavoured to ascertain the effectiveness of hazard warning
signs in alerting visitors to the presence of danger. This section of the results
documents the findings pertaining to this.The limitations section in this report also
provides some important notes about this part of the study design.
In addition to reporting actual hazards identified, visitors were asked if they were
aware of any hazard signs on the access track. The vast majority (91.4%) reported
Figure 14. Comparison of total reported
hazards.
Figure 15. Reported hazard
signs.
that they were aware of hazard signage at the site. The signs reported were recorded
and are presented here (Figure 15). It is interesting to note that, in general, greater
proportions of visitors reported seeing the signs than identified the hazards
themselves. The awareness of hazard signs followed a similar pattern to the
awareness of hazards (Fig.10), with rock fall signs (64.1%) and icefall (39.9%) most
commonly reported. Signs or structures restricting access (38.3%) and the �no
stopping� sign (13.9%) were also noted by visitors, especially those visiting Fox
Glacier. Despite this, the fact still remains that, with the exception of rock fall, more

26
than 6 in 10 visitors were unaware of important hazard messages, such as those
warning of icefall, restricted access, and falling in the river.
In order to gain some impression of the effectiveness of the hazard signage, it is
important to compare visitor responses both at times when the introduced signs were
present and when they were absent. Figure 16 reviews the effectiveness of five signs
used at both glacier sites. In all cases, the differences in visitor awareness of the signs
are statistically significant3. For instance, signage relating to rock fall was reported by
33.9% of visitors when only the existing signage was present. With the introduced
signage also in place, the proportion of visitors reporting rock fall increased to 66.1%.
Although less dramatic, the effect is similar for the icefall hazard warning. The other
three hazard signs examined all returned results as expected. For instance, the strong
winds sign was not reported prior to its introduction simply because there is no
existing sign (or anything similar to it). What these signs do show is that at least some
visitors were aware of the signage on site; they were not simply using their own
intuition or experience to determine what hazards were present. Figure 17 shows
existing and introduced warning signs4.
5 . 4 P E R C E P T I O N S O F S A F E T Y
One of the aims of this study was to determine the extent to which visitors to the
Glaciers felt safe in their surroundings. The focus of interest is primarily any
differences between visitor groups; these will be highlighted here.
Visitors� perceptions of safety were tested using a semantic differential scale, the
items of which contributed to an overall safety score. The maximum score on the
safety scale was 56, and the minimum was 7. On the scale, a high score represents a
high perception of safety.
Overall, visitors appeared to have a moderately high perception of safety at both
glacier sites, with the mean safety score of 44.0. This pattern appeared to be
consistent across virtually all visitor groups, with only small variations across site,
gender, and origin. The only statistically significant difference appeared when visitors
were compared on the basis of age (t= 4.26, df=349.2, 2-tailed p= 0.000). Those aged
40 years and over perceived themselves to be considerably safer at the glacier (mean
= 46.6) than those under the age of 40 years (mean = 41.7). This is a surprising
finding considering that younger people are often portrayed as fearless and carefree.
This is, however, consistent with the earlier finding that this same younger age group
Figure 16. Comparison of
hazard sign awareness.
3 Bees (c2= 89.7, df=1, p<.001); Rockfall (c2= 4.32, df=1, p<.05); Icefall (c2= 7.67, df=1, p<.01); Fall
in river (c2=55.8, df=1, p<.001); Strong winds (c2=32.01, df=1, p<.001);
4 Introduced signs were black figures on neon yellow background. The triangular signs were secured
to DOC green posts. When erected the signs were 1500 mm in height.

27
A. Existing DOC sign alerting visitors to rockfall. B. Existing DOC sign alerting visitors to instability.
C. Introduced sign alerting visitors to rockfall. Height 1500 mm. D. Introduced sign alerting visitors to strong winds. Height 1500 mm.
Figure 17. Comparison of existing and introduced hazard warning signs.

29
had a greater awareness of hazards in the area. The result also concurs with the
findings of Pinhey and Iverson, (1994) who found that older visitors to Guam
reported feeling safer than did the younger visitors.
In another part of the interview, respondents were asked to score three places on a
safety scale (see Figure 18). Visitors rated New Zealand, their own country (if other
than NZ), and the glacier site. The results5 of this question are presented in Figure 18.
Consistent with other measures of visitor safety perception, the results show that
respondents generally rated all three places high in terms of safety. The only statistical
difference between groups was found in visitor origin (t=4.91, df=93.16, 2-tailed
p<.001). Overseas visitors scored New Zealand as a tourist destination considerably
higher in safety terms than did New Zealanders. Similarly, visitors from overseas rated
their own countries as less safe than either New Zealand, or the specific glacier site.
Finally, compared to New Zealanders, overseas visitors scored the glacier site as
slightly safer.
5 . 5 A T T I T U D E T O I N D I V I D U A L R E S P O N S I B I L I T Y
Visitors to the Glaciers were also assessed on the extent to which they held attitudes
linked to feelings of individual responsibility for safety. Having some understanding of
this is important in terms of understanding the expectations of visitors, and will
influence the style and extent of signage and other hazard communication tools
employed.
Respondents� attitudes were assessed using a semantic differential scale. The
individual responsibility for safety scale (IRS) used eleven items. The maximum score
on this scale was 77, and the minimum was 11. A high score on the scale represents a
strong feeling of individual responsibility for safety. The mean score on the IRS scale
was 50.7 representing a moderately high feeling of individual responsibility.
When visitor groups were compared on the basis of IRS, there was generally a high
level of consistency between them. The exception to this general trend was visitor
origin. As predicted, visitors from different parts of the world had varying attitudes to
the extent of responsibility they would accept for their own safety. Figure 19
illustrates the mean scores by geographical region, between which there are
statistically significant differences (F5,327
= 4.8, p=0.0003). A Scheffe (1953) Test
revealed that the greatest difference was between visitors from Asia, and those from
Figure 18. Safety ratings
for tourist destinations
by origin.
5 The results of this scale have been recoded so that a high score represents a high level of perceived
safety.

30
Europe, USA and Canada. It is interesting
to note that, despite the reported
�liability crisis� in the USA (Hanna, 1991),
visitors from this region scored highest
on the IRS scale (mean = 54.1).
Insignificant differences were identified
for age, gender, and site. A higher degree
of difference was also found when
comparing the scores of those visitors
who had visited the Department of
Conservation Information Centre prior
to their glacier visit (49.5) with those
who had not (51.5). Somewhat
surprisingly, visitors who had not been to the Information Centre had higher scores
on the IRS scale (t=1.7, df=327, one-tailed p<0.05).
5 . 6 V I S I T O R B E H A V I O U R
This final section of the results examines the behavioural dimension of the Glacier
Visitor Survey. This component was used in addition to the questionnaire because
there are potential differences between what respondents say, and what they do.
While it is not possible to validate one method against another (and determine
precisely any differences), it is useful to present the additional data to complement
the other findings. The behavioural data have been divided into that which is reported
(i.e. obtained via the questionnaire), and observed (i.e. obtained via a series of
scheduled observations made by the researcher).
5.6.1 Reported behaviour
Visitors were asked about their actions while at the glacier site. For instance, one
question sought to determine what proportion of visitors had walked as far as the
track terminus. Of the total sample, 69.5% reported walking at least to the present
closure immediately before the terminal face6. Of these visitors, nearly one in four
(23.8%)7 claimed to get close enough to touch the ice face. To touch the ice at the
time of the study visitors needed to go beyond the roped closure.
It is clear that touching or getting close to the glacier is very important to many
visitors. The vast majority (69.6%) of all visitors expressed a desire to get closer (than
they had) to the glacier. This was especially true for visitors to Fox Glacier, where
nearly three in every four visitors wanted to get closer.
It is possible that the above figures under-represented the real extent of
transgressions. It is likely, for example, that respondents avoided admitting to
something that they perceived as rule breaking or socially undesirable. It is for this
reason that an observation component was included the study design.
6 It needs to be emphasised that this figure refers to visitors who ventured beyond the carparks and
immediate surrounds. No visitors were interviewed in the carpark or its close proximity. Refer to the
section on Methods for a description of the interviewing locations.
7 This represents 16.6% of the total visitor sample.
Figure 19. Mean scores for
individual responsibility by
region.

31
5.6.2 Observed behaviour
Attempts were made to observe visitor behaviour at the terminal face on each day of the
study. These observations were undertaken in a covert fashion, and notes carefully made
detailing the number of visitors arriving at the track terminus, and the number and
actions of those who elected to proceed beyond the ropes and signs which were
designed to restrict access. In order to approximate the effect of introduced hazard
signs, this procedure was carried out in both existing and introduced signage conditions.
Figure 20 provides a comparative illustration of the visitor actions at the terminal faces
of Fox and Franz Josef Glaciers. For the total sample, it appears that approximately 60%
of the visitors who walked as far as the track terminus complied with the existing hazard
signage. Conversely, four in every ten visitors chose to ignore the access restrictions, and
ventured beyond the rope closure. The compliance rate was lowest at Fox Glacier
(50.8%). Interestingly, compliance appeared to rise dramatically when the introduced
signage was employed8. Total compliance increased from 59.1% to 78.9%, while at Fox
Glacier the leap was from 50.8% to 81.8%.
These dramatic results suggest that the introduced hazard signs were influential on
visitor behaviour at the terminal face. It is possible that the existing signage is of
insufficient impact and/or ambiguous meaning, resulting in a high level of non-
compliance. The introduced signs may convey a clearer message regarding
appropriate visitor behaviours, providing an explanation for restricted access via the
pictorial nature of the messages. Unfortunately, it is not possible to state categorically
that the reduction in non-compliance was directly attributable to the effect of the
introduced signage. It is conceivable that the reduction was caused by the cumulative
effect of increased signage itself. The sensitive nature of hazard and safety
management on public lands does not allow for extensive manipulation of signage,
and therefore remains one of the significant limiting features of the study.
It is important to emphasise that the results presented in Figure 20 represent the
average compliance rates, determined from six observation sessions covering a
period of eight days (for each site). Predictably, there is considerable variation
between observations, demonstrating the situational effects related to the weather,
general conditions, and the presence of other visitors. For instance, during some
observation periods, very few visitors were recorded as non-compliers. At other
times, virtually all visitors who arrived at the track terminus continued beyond the
rope closure. This phenomenon is described in the social psychology literature as
social facilitation, and is a valuable concept in understanding visitor behaviour at
the Glaciers.
Figure 20. Compliance of visitors at
terminal face by signage condition.
8 A maximum of two introduced signs were used at any one time. Introduced signs at the terminal face
included those warning of icefall, rockfall, and river hazard (near the ice cave).

32
In essence, social facilitation is a type of social modelling behaviour, and occurs when
the behaviour of one (or more) person(s) facilitates a second person�s doing the same
thing (Baldwin and Baldwin, 1986). Popular examples of social facilitation include
joining a crowd of on-lookers, and mass donations to publicised causes. People are
drawn to things that they observe other people doing. This aspect of human nature
has obvious implications for visitor behaviour at the Glaciers.
The effect of social facilitation, in some ways, plays down the role of hazard signage in
the battle against modifying visitor behaviour, and shifts the emphasis to the effects of
visitors on other visitors. Clearly, the high rate of non-compliance is a complex
phenomenon, and is unlikely to be the result of a single variable such as insufficient
visitor signage. Contributing factors appear to include: the importance to visitors of
getting close to the glaciers; unrealistic expectations of proximity (linked to tourism
promotion materials); ambiguous hazard warning messages (and some mixed
messages); and the phenomenon of social facilitation. While the Department of
Conservation may have limited control over several of these variables, some
suggestions are put forward in recommendations section of this report.
5 . 7 S U M M A R Y O F V I S I T O R P E R C E P T I O N S A N DB E H A V I O U R
5.7.1 Hazard perceptions
Visitors� perceptions of hazards can at best be described as modest, and among some
visitors it is poor. In particular, visitors to Franz Josef, and overseas visitors to both
sites, appeared to have the weakest hazard perceptions. With the exception of rock
fall, fewer than one third of all visitors identified any other hazard at either site.
Furthermore, while over ninety per cent reported an awareness of hazard signs, six
visitors in every ten were unaware of any specific hazard sign, other than rock fall.
Visitor awareness did, however, increase significantly when the introduced signs were
erected. This latter finding suggests that either the introduced signs were less am-
biguous than the existing Department of Conservation signs, and/or that the increas-
ed hazard awareness was a function of the cumulative effect of the two sign forms.
5.7.2 Safety perceptions
Visitor perception of safety was reasonably high at both Glacier sites. Visitors did not
perceive either glacier to be an especially dangerous place to visit, relative to New
Zealand in general, or their home localities as tourist destinations or attractions.
While it is gratifying for management that the sites were not seen as unsafe, the
concern remains that feelings of safety and security among visitors can lead to over-
confidence and inappropriate actions.
5.7.3 Individual responsibility for safety
Managing natural attractions for visitors means pitching the level of manager
intervention at an appropriate level. Part of determining this appropriateness is under-
standing the extent to which visitors are prepared to assume responsibility for their own
experiences (including safety). At Fox and Franz Josef Glaciers, there appeared to be a
moderately high level of individual responsibility for safety among visitors. The
exception to this finding were certain overseas visitors, who clearly assumed lower

33
levels of responsibility for individual safety compared with New Zealand visitors. In
general, visitors seem prepared to assume responsibility for their own safety within
certain limits. Visitors expressed a reliance on managers to inform them of potential
dangers, and to provide modest facilities to allow their access to the attractions. Beyond
this, there was strong reaction against over-management of the areas. The prevailing
attitude was: �if you ignore the warnings and advice of managers, then you have only
yourself to blame�. Given that individual responsibility for safety was lowest among
particular visitor groups, a targeted promotion about responsibility may be beneficial.
5.7.4 Visitor behaviour
The majority of those interviewed reported walking at least as far as the existing
closures. Of these, nearly one quarter reported getting close enough to touch the ice.
Proximity to the ice was very important to visitors. In terms of visitor compliance with
the hazard signage, observations suggested that six in every ten visitors complied with
the current recommendations. When the introduced signs were employed, the rate of
compliance increased to eight in every ten visitors, although there were differences
between sites. This finding suggests that the current Department of Conservation
signage is inadequate in expressing the message to visitors. It is important to
acknowledge, however, that hazard signs are not the sole influence on rates of non-
compliant visitor behaviour. On the contrary, other factors are likely to be involved,
including the effects of social facilitation and the goals and expectations of visitors.
6. Recommendations
This section includes site-specific and generic recommendations for the management
of visitors to highly accessible natural attractions on lands managed by the
Department of Conservation.
6 . 1 T H E F O X A N D F R A N Z J O S E F G L A C I E R S
On the evidence of the survey results, observations and personal discussion with
visitors, the following recommendations are made for visitor management in the
Glacier region.
6.1.1 Site management
� Increase the presence of Department of Conservation personnel in both glacial
valleys, especially at the terminal faces. There is good evidence both from this
study and others conducted overseas to suggest that behaviour can be modified by
the mere presence of park staff. For this to be effective, additional information
about the hazards at the glacier face would need to be available to visitors. If it is
not feasible to station staff at all sites where non-compliance is an issue, roving
employees, frequently visible to the visiting public may be sufficient to prompt
more compliant behavior. Volunteers may be considered for this role.

34
� Increase the on-site availability of graphic information relating to the dynamic
nature of the environment. Visitors seem to have a poor understanding of the rate
of change in the valleys, and assume, for instance, that the glacier face is a
permanent and stable geological form. One visitor�s remark helps illustrate this
view: �why [would the ice collapse] today, when it�s been like that for hundreds of
years?�. The location of such information is crucial, and is naturally governed by
the constraints of the environment. However, consideration should be given to the
possibility of locating information about the glacier at points closer to the terminal
faces. It is apparent that many people do not stop to read the information panels
in the carparks, presumably because they are very focused on getting to the
glacier. Onsite information is further justified by the survey results which indicate
that as few as one visitor in three visits the information centre prior to arriving at
the glacier access track.
� Reconsider the possibility of allowing controlled access to the terminal face of the
glaciers. As discussed, getting close to (and preferably touching) the ice face
appears to be very important to many visitors. Can visitors be directed (via rope
closures) to the least hazardous parts of the face? Clearly this would involve
increased monitoring of conditions, and additional staff resources.
� Guided groups should not be exempt from closed areas. Owing in part to the
effects of social facilitation (see p. 32), guided groups clearly influence the
behaviour of other non-guided visitors to the Glaciers. Discussions with visitors at
the terminal face revealed a confusion best illustrated by the remarks such as: �if
it�s safe for those guys to stand around under the ice, then surely it�s okay for me
too?�. The guides� use of the roped-off areas to store gear and brief clients makes
a mockery of the Department of Conservation�s closure and is a management issue
in need of review.
6.1.2 The use of hazard warning signs
� Increase impact and reduce ambiguity of hazard signs at both glacier sites. The
current hazard signs are unspecific and appeal largely to the English literate
visitor. Furthermore, the style of the signs is such that too often their content
appears to be information rather than warning of danger. In order to appeal to the
wide cross section of visitors to Fox and Franz Josef Glacier, a differentiation
between hazard signage and general information signage is needed. Moreover,
people are far more likely to comply with signage if they understand the
consequences of non-compliance. To this extent, the pictorial sign has a major
advantage over the text only signs. Colour and shape of hazard sign is another
important feature. In this study, a bright yellow triangular shape was used. This
was intended to relate to people�s existing awareness of international road signs�
helping them differentiate between hazard signs and other information signs.
6.1.3 Visitors� centre
� Reconsider the use of �classic� images of people standing in the ice cave as part of
the Visitor Centre display. These photographs send contradictory messages to
visitors about appropriate behaviour, and what to expect at the sites. Getting close
to the ice cave and terminal face is clearly important to visitors. This value has
many contributing factors, including images in tourist brochures, other people�s
photographs and anecdotes, and the information obtained in visitor centres. The

35
Department of Conservation can realistically control the last of these factors, and
should consider doing all it can to make visitor expectations accurate. Many
visitors expressed surprise and disappointment that access to the ice face was
restricted�something they had been unaware of prior to reaching that point.
Photographic displays of the rope closures need to be evident in the Visitors�
Centre.
� The Department of Conservation visitor centres need to be more clearly identified.
For instance, those visitors approaching from the South will arrive at both Fox and
Franz Josef Glaciers before encountering their respective visitors� centres. Road
signs could be erected at the turn-off to each glacier access road stating the
location of and distance to the visitors� centre (e.g. Information about this glacier,
conditions, and access�500 m).
6.1.4 Community relations
� Increase alternative sources of information about (and awareness of) rough
terrain and access conditions. Visitors noted the lack of information about
appropriate footwear and clothing prior to their arrival at the sites. Alternative
visitor education strategies, such as supplying accommodation providers with a
clear and simple, current information sheet about the nature of each access track
could contribute to visitors being more prepared and help prevent minor injuries
and general dissatisfaction. While perhaps not currently viewed as part of the
Department of Conservation�s role, this should be interpreted as simply another
means of communicating information. In light of the fact that many visitors do not
visit the information centre before going to the glacier, alternative methods of
information dissemination need to be considered.
� Increased awareness and dissemination of the Department of Conservation
philosophy on safety and its legal position is required. This information should be
more widely appreciated by staff and visitors alike. The incorporation of the
Department of Conservation�s safety philosophy and its understanding that
visitors need to accept some level of responsibility for their own safety into
information sheets and signage may help alert visitors to hazards in the region.
The Department of Conservation cannot possibly sustain what is sometimes seen
as a paternalistic position on visitor safety.
6 . 2 V I S I T O R M A N A G E M E N T I N G E N E R A L
Both the results from this study and those reviewed in other works, allow some more
general recommendations to be made regarding the communication of information
to visitors, and the indirect management styles which may help modify their
behaviour.
6.2.4 Site management
� Where visitor behaviour is felt to be inappropriate (e.g. vandalism, track-
widening, visitor safety), consider the employment of seasonal or volunteer staff
to increase the presence of DOC personnel at the site. The simple presence of a

36
staff member has been shown to reduce undesirable behaviour in national parks in
other parts of the world.
� Whenever possible, locate important visitor information (e.g. safety) as close to
the visitor attraction as practicable. SST in particular may have little desire to
spend time looking for information in visitor centres, preferring instead to get to
the focus of their visit as quickly as possible. It is more likely that visitor centre use
will occur in time remaining after the attraction has been visited. Prioritise visitor
information on this basis.
6.2.3 The use of hazard warning signs
� Hazard warning signs will be most effective when they are differentiated from
other information signs (e.g. track times and interpretation).
� Messages will be clearer to the widest possible audience if good illustrations are
used. Communication will be more effective than text-based signs, which appeal
largely to the English-literate visitor. Illustrations should include a clear
consequence, should the visitor choose to ignore the warning.
� Ideally, sign style and colour will differ from those used in other information signs.
The author recommends the use of triangular or diamond shape signs, using black
(or dark green) figures on a bright yellow background.
� Source credibility (the credibility of the person or agency giving the message) will
be enhanced through well-maintained signs and closures, and on-site consistency.
� Avoid using signs where they are not needed. Too many warning signs (or
closures) may desensitise visitors, resulting in greater ignorance of warnings or
non-compliance with requests.
6.2.4 Visitors� centres
� In the interests of promoting appropriate visitor behaviour, ensure that displays
are consistent with other messages you are attempting to communicate. This will
help reduce undesirable behaviours and increase the accuracy of visitor
expectations�ultimately leading to safer, more environmentally appropriate and
satisfying visitor experiences.
6.2.5 Community relations
� Increased awareness and dissemination of the Department of Conservation�s
philosophy on safety and its legal position is required. This information should be
more widely appreciated by staff and visitors alike. The incorporation of the
Department of Conservation�s safety philosophy and its understanding that
visitors need to accept some level of responsibility for their own safety into
information sheets and signage may help alert visitors to the saliency of hazards in
the region. The Department of Conservation cannot possibly sustain what is
sometimes seen as a paternalistic position on visitor safety.

37
7. Conclusions
Despite considerable efforts by the Department of Conservation to provide
appropriate hazard signage, and two informative, up-to-date visitors� centres, people
visiting Fox and Franz Josef Glaciers appear to have only a rudimentary appreciation of
the hazards to which they may be exposed in these valleys. Moreover, significant
proportions of visitors ignore access restrictions, placing themselves and others at risk.
Results from this study suggest that this modest level of hazard awareness, and the
associated risk-taking behaviour, is a consequence of a variety of factors. These
include: ambiguous hazard signage; unrealistic visitor goals and expectations;
moderately high visitor perceptions of safety; a low level of visitor centre use prior to
glacier access; and the phenomenon of social facilitation. Perception of hazards, and
behaviour compliant with management restrictions, was observed to increase in the
presence of pictorial (introduced) signs. While not necessarily comprehensive
evidence, this finding does imply that management can play a further role in
advancing visitor awareness and perception of hazards in the Glacier valleys.
Visitor management in South Westland is caught in an unenviable position.
Compelled by both statutory requirement, and the social and economic dependency
of many local residents, the Glaciers must remain as accessible to visitors as possible.
Access, however, must also involve the minimum risk to visitors, in an area in which
natural hazards are inherent. The challenge of creating an appropriate balance
between the legal, social, economic and visitor safety considerations should be
assisted by the information contained in this report.
8. Acknowledgements
The implementation of this study has involved important contributions from many
people, the majority of whom I would like to acknowledge here.
Firstly, I extend my thanks to Tony Preston of the Department of Conservation at Fox
Glacier, without whose foresight and support, this research may never have been
conducted. Furthermore, the teams led by Kingsley Timpson at Fox and Rob
McCallum at Franz Josef deserve thanks for providing me with a working
environment which was always co-operative and professional. The graphics work of
Greg Flaws, also of the Department of Conservation (Hokitika) helped allow the pre-
implementation stages to pass smoothly. I am also grateful for the encouragement
and advice offered by Craig Miller, Paul Dingwall and Gordon Cessford.
I also wish to acknowledge my university mentors Drs Kevin Moore and Pat Devlin for
their guidance and enthusiasm for the project; and Sara Gordon and Sarah Toxward
for their commitment to the role of research assistants (and not always in favourable
conditions). Thanks also to Beth Rooke and Dave for helping me learn about the
social and physical history of the magnificent Glacier region, and for their general
warmth and hospitality; and to Trisa and my girls who tolerated my various absences
and readily accompanied me when possible.

38
9. References
Accident Rehabilitation and Compensation Act, 1992.
Babbie, E. 1989. The Practice of Social Research. Wadsworth Publishing, California.
Baldwin, J.D.; Baldwin, J. I. 1986. Behavior Principles in Everyday Life. Prentice- Hall, NJ.
Bean, M.E. 1989. Speaking of Risk. Trends 26(4): 15�19.
Brannon, L.; Condello, C.; Stuckum, N.; Vissers, N.; Priest, S. 1992. Public perceptions of risk in
recreational activities. Journal of Applied Recreation Research 17(2): 144�157
Brayshaw, D. 1995. Negative publicity about tourism destinations: a Florida case study. Travel and
Tourism Analyst 5: 62�71.
Carpenter, G.; Priest, S. 1989. Leisure Studies 8(1): 65�75.
Cloke, P.; Perkins, H.C. 1998. Cracking the canyon with the awesome foursome: Representations of
adventure tourism in New Zealand. Environment and Planning d: Society and Space.
Collier, A. 1997. Principles of tourism: A New Zealand perspective (4th Ed.). Longman, Auckland, New
Zealand.
Davies, T. 1998. Franz Josef Glacier Access Road�security of road-end facilities. Conservation
Advisory Science Notes 183.
Demos, E. 1992. Concern for safety: A potential problem in the tourist industry. Journal of Travel and
Tourism Marketing 1 (1): 81�86.
Department of Conservation, 1995. Visitor Strategy. Department of Conservation and New Zealand
Conservation Authority, Wellington.
Department of Conservation, 1998. Guiding Principles for the Management of Hazards in the Franz
Josef and Fox Glacier Valleys.
Devlin, P.J.; Corbett, R.; Peebles, C. (eds.) 1995. Outdoor Recreation in New Zealand Volume One: A
review and synthesis of the research literature. Lincoln University and Department of
Conservation, Wellington.
Devlin, P.; Dingwall, P.; Lucas, P. 1990. New Zealand. In Allin, C. (ed.) International handbook of
national parks and reserves. Pp. 273�293. Greenwood Press, NY.
Devlin, P.; Espiner, S.; Hutchings, R.; Parkin, E. 1996. Department of Conservation visitor management
information needs: Scoping the state of knowledge. A report prepared for the Department of
Conservation by the Department of Human and Leisure Sciences, Lincoln University, New Zealand.
Dilley, R.S. 1986. Tourist brochures and tourist images. The Canadian Geographer 30: 59�65.
Dingwall, P. 1981. Evolving a national system of protected natural areas in New Zealand. Discussion
paper presented at a meeting of the IUCN Commission on national parks and protected natural
areas, October, 1981, Christchurch, New Zealand.
Douglas, M.; Wildavsky, A. 1982. Risk and culture: An essay on the selection of technical and
environmental dangers. University of California Press, Los Angeles.
Espiner, S.R. 1995. (Unpublished) Social Dimensions of National Park Use. MPR&TM thesis, Lincoln
University, New Zealand.
Gold, S.M. 1994. Behavioural approach to risk management. Parks and Recreation 29 (November):
34�36.
Gough, J. 1990. A review of the literature pertaining to �perceived� risk and �acceptable� risk and the
methods used to estimate them. (Information Paper No. 14). Centre of Resource Management,
Lincoln University, New Zealand.
Gough, J. 1991a. Measuring perceived and acceptable risk: an application of survey approaches.
(Information Paper No. 24). Centre of Resource Management, Lincoln University, New Zealand.
Gough, J. 1991b. Risk communication: the implications for risk management. (Information Paper No.
33). Centre of Resource Management, Lincoln University, New Zealand.

39
Gramann, J.H.; Bonifield, R.L.; Yong-geun, K. 1995. Effect of personality and situational factors on
intentions to obey rules in outdoor recreation areas. Journal of Leisure Research 27 (4): 326�
343.
Griswold, S. 1989. Fall in - no come back: Liability from a backcountry perspective. Trends 26(4): 11�14.
Haddock, C. 1995. The negative consequences of risk: Implications for resource based recreation land
managers. Unpublished paper, Department of Parks, Recreation and Tourism, Lincoln
University, New Zealand.
Hanna, G. 1991. Outdoor pursuits programming: Legal liability and risk management. The University of
Alberta Press, Canada.
Hardin, G. 1969. The economics of wilderness. Natural History, June/July 1969.
Hartenian, L.S.; Bobko, P.; Berger, P. 1993. An empirical validation of bipolar risk perception scaling
methods. Journal of Applied Social Psychology 23(5): 335�351.
Health and Safety in Employment Act, 1992.
Horn, C.M.; Simmons, D.G.; Fairweather, J.R. 1998. Evolution and Change in Kaikoura: Responses to
Tourism Development. Report No.6, Tourism Research and Education Centre (TREC), Lincoln
University, New Zealand.
Johnston, M.E. 1989. Peak experiences: Challenge and danger in mountain recreation in New Zealand.
Unpublished Doctoral Thesis, Lincoln University, New Zealand.
Johnston, M.E. 1992. Facing the challenges: Adventure in the mountains of New Zealand. In B. Weiler
& M. Hall (Eds.), Special interest tourism (pp. 159�169). Belhaven Press, London.
Krimsky, S.; Golding, D. (eds.) 1992. Social theories of risk. Praeger Publishers, Westport, USA.
Kruhse-MountBurton, S. 1995. Sex tourism and traditional male identity. In Lanfant, M. et al. (eds.)
International tourism: Identity and change.
Le Heron, R.; Pawson, E. (eds.) 1996. Changing places: New Zealand in the nineties. Longman Paul,
Auckland, New Zealand
Leiper, N. 1990. Partial industrialisation of tourism systems. Annals of Tourism Research 17(4): 600�605.
Levine, R.; Gorman, B. 1994. Skiers� perceptions of danger. Journal of Sport Behaviour 17 (1): 17�23.
Loewenthal, K.M. 1996. An Introduction to Psychological Tests and Scales. UCL Press, London.
Manning, R. 1986. Studies in outdoor recreation: Search and research for satisfaction. Oregon State
University Press, Oregon.
Martin, B.; Mason, S. 1987. Current trends in leisure. Leisure Studies 6: 93�97.
McAvoy, L.H.; Dustin, D.L. 1990. The danger in safe recreation. Journal of Physical Education,
Recreation and Dance 61(4):57�60.
McCool, S.F.; Braithwaite, A.M. 1992. Persuasive messages and safety hazards in dispersed and natural
recreation settings. In M.J. Manfredo (ed.), Influencing human behavior: Theory and
applications in recreation, tourism, and natural resources management (pp 293�326).
Sagamore Publishing Inc., Champaign, Illinois.
Morgan, D.; Moore, K.; Mansell, R. 1997a. Adventure tourist experience on water: perceptions of risk
and competence, and the role of the operator (p. 558). Proceedings from the Australian
Tourism and Hospitality Research Conference, Sydney. Bureau of Tourism Research, Canberra.
Morgan, D.; Moore, K.; Mansell, R. 1997b. The Adventure Experience Paradigm: Where do adventure
tourists fit in? Proceedings from 3rd ANZALS conference, New castle, Australia.
Mullet, E.; Duquesnoy, C.; Raiff, P.; Fahrasmane, R.; Namur, E. 1993. The evaluative factor of risk
perception. Journal of Applied Social Psychology 23 (19): 1594�1605.
New Zealand Tourism Board Act, 1991.
New Zealand Tourism Board, 1993. New Zealand international visitor survey 1992/93. NZTB,
Wellington.
New Zealand Tourism Board and Department of Conservation, 1993. New Zealand conservation
managed lands and international visitors. NZTB and DOC, Wellington.New Zealand Tourism
Board, 1996. New Zealand international visitor survey 1995/96. NZTB, Wellington.
New Zealand Tourism Board, 1998. New Zealand Tourism News (March). NZTB, Wellington.

40
New Zealand Walkways Act, 1994.
Occupiers Liability Act, 1962.
Parks Canada, 1997. Public Safety Communication Plan. Department of Canadian Heritage, Canada.
Pinhey, T.K.; Iverson, T.J. 1994. Safety concerns of Japanese visitors to Guam. Journal of Travel and
Tourism Marketing 3(2): 87�94.
Priest, S.; Baillie, R. 1987. Justifying the risk to other: the real razor�s edge. Journal of Experiential
Education 10(1): 16�22.
Priest, S.; Bunting, C. 1993. Changes in perceived risk and competence during whitewater canoeing.
Journal of Applied Recreation Research 18(4): 265�280.
Priest, S.; Carpenter, G. 1993. Changes in perceived risk and competence during adventurous leisure
experiences. Journal of Applied Recreation Research 18(1): 51�71.
Roehl, W.S.; Fesenmaier, D.R. 1992. Risk perception and pleasure travel: An exploratory analysis.
Journal of Travel Research (Spring): 17�26.
Ryan, C.; Kinder, R. 1996. The deviant tourist and the crimogenic place�the case of the tourist and the
New Zealand prostitute. In Pizam, A. ; Manfeld, Y. (eds.), Tourism, crime and international
security issues (pp.23�36). John Wiley & Sons, England.
Ryan, C.; Robertson, E.; Page, S. 1996. New Zealand students: Risk behaviours while on holiday.
Tourism Management 17(1): 64�69.
Sandiford, M.; Kelly, L. 1996. Changing the face of interpretative signs. Australian Parks and
Recreation 32(2): 27�31.
Shultis, J. 1989. Images of use of New Zealand�s protected natural areas by domestic and international
visitors. Geojournal 19(3): 321�335.
Simmons, D.; Leiper, N. 1993. Tourism: A social scientific perspective (pp. 204�220). In Perkins, H.C.;
Cushman, D. (eds.), Leisure, Recreation and Tourism. Longman Paul, Auckland.
Singleton, R.; Straits, B.; Straits, M. 1993. Approaches to Social Research. Oxford University Press, NY.
Sirakaya, E.; Sheppard, A.G.; McLellan, R.W. 1997. Sleeping with both eyes closed: Perceived safety and
destination choice. A paper presented at the Travel and Tourism Research Association Annual
Conference, Norfolk VA June 15-18, 1997.
Sjöberg, L. (ed.). 1987. Risk and society: Studies of risk generation and reactions to risk. Allen and
Unwin, London.
Spengler, J.O.; Hronek, B. 1995. Trends in outdoor recreation legal liability. In Thompson, J.L.; Lime,
D.W.; Gartner. B.; Sames, W.M. (comps). Proceedings of the Fourth International Outdoor
Recreation and Tourism Trends Symposium and the 1995 National Recreation Resource
Planning Conference, May 14�17, 1995. University of Minnesota, College of Natural Resources
and Minnesota Extension Service.
Swearingen, T.C.; Johnson, D.R. 1995. Visitors� responses to uniformed park employees. Journal of
Park and Recreation Administration 13(10): 73�85.
Tarlow, P.; Muehsam, M. 1996. Theoretical aspects of crime as they impact the tourism industry. In
Pizam, A.; Manfeld, Y. (eds.), Tourism, crime and international security issues (pp.11�22). John
Wiley & Sons, England.
Trimpop, R.M. 1994. The psychology of risk taking behavior. Netherlands, North-Holland.
Tourism Resource Consultants, 1995. Westland National Park: Review of Visitor Access to the Glaciers.
Vander Stoep, G.A.; Gramann, J.H. 1987. The effect of verbal appeals and incentives on depreciative
behavior among youthful park visitors. Journal of Leisure Research 19(2): 69�83.
Wilks, J.; Atherton, T. 1994. Health and safety in Australian marine tourism: A social, medical and legal
appraisal. The Journal of Tourism Studies 5(2): 2�16.
World Tourism Organisation, 1996. Compendium of Tourism Statistics 1990�1994 (16th edition).
WTO, Madrid.