The Usage of Geographical Information Systems (GIS) in the Marketing Decision Making Process: A Case...
9
Procedia - Social and Behavioral Sciences 148 (2014) 227 – 235 Available online at www.sciencedirect.com ScienceDirect 1877-0428 © 2014 Elsevier Ltd. This is an open access article under the CC BY-NC-ND license (http://creativecommons.org/licenses/by-nc-nd/3.0/). Selection and peer-review under responsibility of the 2nd International Conference on Strategic Innovative Marketing. doi:10.1016/j.sbspro.2014.07.038 *Corresponding author. Tel.: +90 346 219 10 10 Ext: 24 38; Fax: + 90 346 219 11 65 E-mail address: [email protected] ICSIM The Usage of Geographical Information Systems (GIS) in the Marketing Decision Making Process: A Case Study for Determining Supermarket Locations Tarik Turk a , Olgun Kitapci b , I. Taylan Dortyol b a Department of Geomatics Engineering, Engineering Faculty, Cumhuriyet University, Sivas, 58140, Turkey b Akdeniz University, The School of Applied Science, Antalya, 07192, Turkey Abstract The marketing decision support system is designed to help marketing managers in the analysis and decision making processes. The magnitude of a consumer market is measured by its economic, demographic and geographic dimensions. From this point of view, we focused on demographic and economic factors, which exist within macro environment factors in this study. The purpose of this paper is to point out the importance of consumption maps such as food, education, health expenses etc. which provide significant cues for investors and marketers especially in determining optimum locations. In this context, all data was integrated on Geographical Information Systems (GIS) environment. In addition, user interface programs were developed to perform easily several queries and analyses in ArcGIS 9.3 GIS Software. Afterwards, the data was queried, analyzed and documented by GIS. Finally, related consumption and optimum location maps for the marketing were produced. This study shows that GIS can play significant roles in both marketing planning and the decision making process. Consequently, new marketing strategies can be determined by means of recommendations resulted from this study in the city of Sivas and other cities. Keywords: Decision Making Process; Decision Support System; Geographical Information Systems; Marketing Strategy 1. Introduction The information systems concept has been around for many years. The importance of information technology in marketing was presented with a marketing information systems model by P. Kotler. According to this model, there are four major sub-systems (Sääksjärvi, M. V.T. and Talvinen, J. M. 1993) an internal records system, a marketing research system, a marketing intelligence system and a marketing decision support system. The © 2014 Elsevier Ltd. This is an open access article under the CC BY-NC-ND license (http://creativecommons.org/licenses/by-nc-nd/3.0/). Selection and peer-review under responsibility of the 2nd International Conference on Strategic Innovative Marketing.
-
Upload
cumhuriyetuniversitesi -
Category
Documents
-
view
2 -
download
0
Transcript of The Usage of Geographical Information Systems (GIS) in the Marketing Decision Making Process: A Case...

Procedia - Social and Behavioral Sciences 148 ( 2014 ) 227 – 235
Available online at www.sciencedirect.com
ScienceDirect
1877-0428 © 2014 Elsevier Ltd. This is an open access article under the CC BY-NC-ND license (http://creativecommons.org/licenses/by-nc-nd/3.0/).Selection and peer-review under responsibility of the 2nd International Conference on Strategic Innovative Marketing.doi: 10.1016/j.sbspro.2014.07.038
*Corresponding author. Tel.: +90 346 219 10 10 Ext: 24 38; Fax: + 90 346 219 11 65 E-mail address: [email protected]
ICSIM
The Usage of Geographical Information Systems (GIS) in the Marketing Decision Making Process: A Case Study for
Determining Supermarket Locations
Tarik Turka, Olgun Kitapcib, I. Taylan Dortyolb aDepartment of Geomatics Engineering, Engineering Faculty, Cumhuriyet University, Sivas, 58140, Turkey
bAkdeniz University, The School of Applied Science, Antalya, 07192, Turkey
Abstract
The marketing decision support system is designed to help marketing managers in the analysis and decision making processes. The magnitude of a consumer market is measured by its economic, demographic and geographic dimensions. From this point of view, we focused on demographic and economic factors, which exist within macro environment factors in this study. The purpose of this paper is to point out the importance of consumption maps such as food, education, health expenses etc. which provide significant cues for investors and marketers especially in determining optimum locations. In this context, all data was integrated on Geographical Information Systems (GIS) environment. In addition, user interface programs were developed to perform easily several queries and analyses in ArcGIS 9.3 GIS Software. Afterwards, the data was queried, analyzed and documented by GIS. Finally, related consumption and optimum location maps for the marketing were produced. This study shows that GIS can play significant roles in both marketing planning and the decision making process. Consequently, new marketing strategies can be determined by means of recommendations resulted from this study in the city of Sivas and other cities. © 2014 The Authors. Published by Elsevier Ltd. Selection and/or peer-review under responsibility of The 2nd International Conference on Integrated Information. Keywords: Decision Making Process; Decision Support System; Geographical Information Systems; Marketing Strategy
1. Introduction
The information systems concept has been around for many years. The importance of information technology in marketing was presented with a marketing information systems model by P. Kotler. According to this model, there are four major sub-systems (Sääksjärvi, M. V.T. and Talvinen, J. M. 1993) an internal records system, a marketing research system, a marketing intelligence system and a marketing decision support system. The
© 2014 Elsevier Ltd. This is an open access article under the CC BY-NC-ND license (http://creativecommons.org/licenses/by-nc-nd/3.0/).Selection and peer-review under responsibility of the 2nd International Conference on Strategic Innovative Marketing.

228 Tarik Turk et al. / Procedia - Social and Behavioral Sciences 148 ( 2014 ) 227 – 235
internal records system provides information about internal factors such as sales, costs and cash flow. The research system is relevant to the marketing research process, which is realized by the company. With the marketing intelligence system, a company gathers daily data and information related to the external marketing environment, which can be counted as macro and microenvironment factors. All of this data and information is stored in a database. The marketing decision support system is designed to help marketing managers in the analysis and decision making processes. In this system, statistical techniques and decision models are used together. With all of these four sub-systems, the company may be more effective and efficient in both the internal and external marketing environments tracking process and in addition the company may also utilize the information acquired through the marketing decision support system on marketing strategy development and marketing planning processes. This study is interested in GIS, which can be used as a tool in the Marketing Information System, especially in marketing intelligence and marketing decision support systems’ sub-systems to analyze data and information related to the external marketing environment. The magnitude of a consumer market is measured by its economic, demographic and geographic dimensions (Islamoglu, A. H. 2008). From this point of view, we focused on demographic and economic factors, which exist within macro environment factors in this study.
Nowadays, especially in the marketing environment, the importance of information management is obvious. Being aware of the activities of competitors and customers is the main step to gain directive information. In this context, information systems are widely used tools to collect and to interpret data. One of these information systems is called GIS. At present, GIS is used in Marketing Information Systems as a tool for the decision making process. GIS’s present popularity is based on its powerful visual presentation capabilities and spatial relationship analysis. Xia has listed these advantages as follows (Xia, J. 2004):
• GIS has the ability to perform spatial analysis, • GIS can categorize and place objects into individual themes and thus has the ability to treat these objects
differently, • GIS has the ability to store data related to the visual presentation over the spatial database, • GIS can be implemented online, thus control of the system can be easy and remotely conducted, • The cost of the implementation of a GIS is considerably low.
The utility of conventional management information systems, which are now evolving into decision support
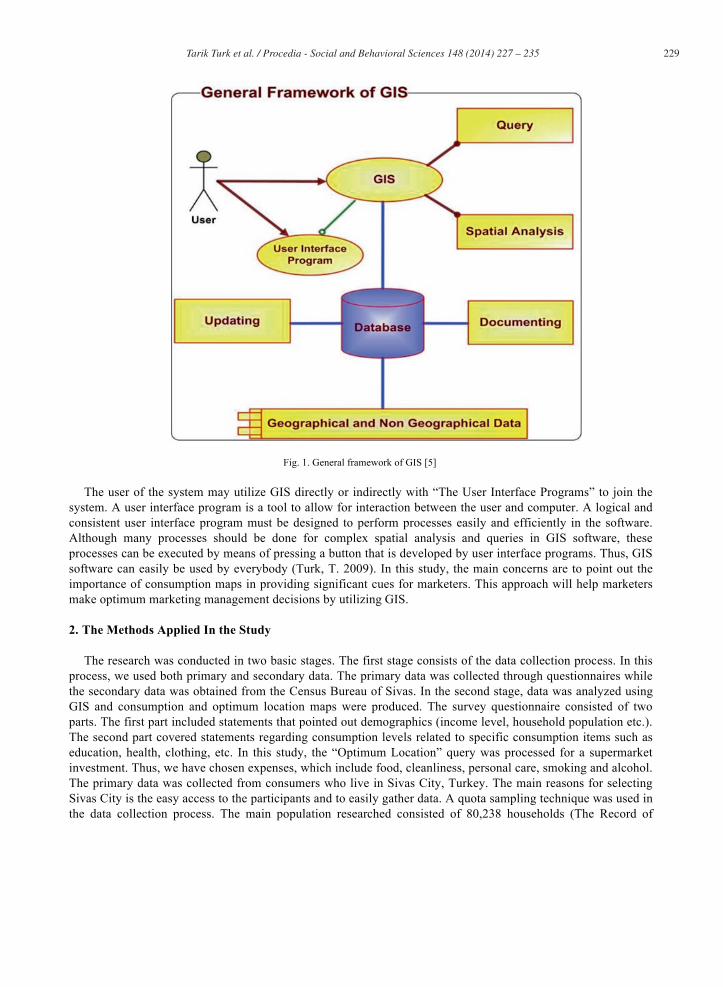
systems, can be improved by incorporating the analytical and visualization capabilities of geographic information systems. The aim is to enhance communication texts and tables by the visual presentation of data and information, thereby ensuring that accurate results are obtained quickly, which in turn leads to better and more informed decisions. It is for this reason, among others, that the usage of geographic information systems in business is growing rapidly (Musyoka, S.M, S.M. Mutyauvyu, J.B.K., Kiema, F.N. karanja and D.N. Siriba 2007). Fig. 1 shows the general framework of processes executed on GIS.
229 Tarik Turk et al. / Procedia - Social and Behavioral Sciences 148 ( 2014 ) 227 – 235
Fig. 1. General framework of GIS [5]
The user of the system may utilize GIS directly or indirectly with “The User Interface Programs” to join the system. A user interface program is a tool to allow for interaction between the user and computer. A logical and consistent user interface program must be designed to perform processes easily and efficiently in the software. Although many processes should be done for complex spatial analysis and queries in GIS software, these processes can be executed by means of pressing a button that is developed by user interface programs. Thus, GIS software can easily be used by everybody (Turk, T. 2009). In this study, the main concerns are to point out the importance of consumption maps in providing significant cues for marketers. This approach will help marketers make optimum marketing management decisions by utilizing GIS.
2. The Methods Applied In the Study
The research was conducted in two basic stages. The first stage consists of the data collection process. In this process, we used both primary and secondary data. The primary data was collected through questionnaires while the secondary data was obtained from the Census Bureau of Sivas. In the second stage, data was analyzed using GIS and consumption and optimum location maps were produced. The survey questionnaire consisted of two parts. The first part included statements that pointed out demographics (income level, household population etc.). The second part covered statements regarding consumption levels related to specific consumption items such as education, health, clothing, etc. In this study, the “Optimum Location” query was processed for a supermarket investment. Thus, we have chosen expenses, which include food, cleanliness, personal care, smoking and alcohol. The primary data was collected from consumers who live in Sivas City, Turkey. The main reasons for selecting Sivas City is the easy access to the participants and to easily gather data. A quota sampling technique was used in the data collection process. The main population researched consisted of 80,238 households (The Record of
230 Tarik Turk et al. / Procedia - Social and Behavioral Sciences 148 ( 2014 ) 227 – 235
Water Service Subscriber, Sivas City Hall, 2008). As it is understood, the main population researched consists of families. The reasons behind this choice are the following: (1) the income concept used to provide a basis for consumption is household income, and not individual income, (2) the basic attitudes and behaviors of an individual are improved in a family environment and (3) one of the biggest consumption entities for societies is family. In light of these factors, the basis for the establishment of this main population is the thought process of the efficient role of family members on product choice and consumption process. The questionnaire was tested with 20 academicians from Cumhuriyet University, in the pilot study area in Sivas. After the pilot test was conducted, certain minor wording changes were performed on the questionnaire. Following the pilot test process, questionnaires were presented to 1,186 households, of which 1,122 usable questionnaires were collected. Over all, the questionnaires were found to be useful, as determined by the 94.6 percent response rate. We performed face-to-face interviews in order to ensure a high response rate as well as to reduce the possibility of missing data in the questionnaires. Processes such as the query, analysis, documentation and producing of the thematic maps were performed by means of GIS software used.
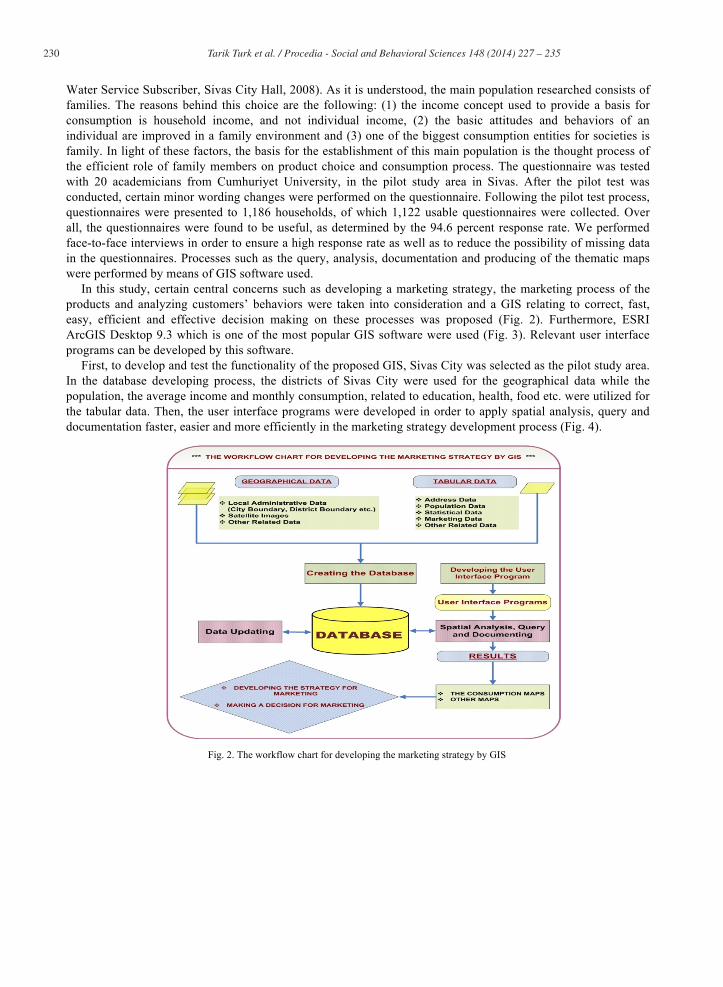
In this study, certain central concerns such as developing a marketing strategy, the marketing process of the products and analyzing customers’ behaviors were taken into consideration and a GIS relating to correct, fast, easy, efficient and effective decision making on these processes was proposed (Fig. 2). Furthermore, ESRI ArcGIS Desktop 9.3 which is one of the most popular GIS software were used (Fig. 3). Relevant user interface programs can be developed by this software.
First, to develop and test the functionality of the proposed GIS, Sivas City was selected as the pilot study area. In the database developing process, the districts of Sivas City were used for the geographical data while the population, the average income and monthly consumption, related to education, health, food etc. were utilized for the tabular data. Then, the user interface programs were developed in order to apply spatial analysis, query and documentation faster, easier and more efficiently in the marketing strategy development process (Fig. 4).
Fig. 2. The workflow chart for developing the marketing strategy by GIS

231 Tarik Turk et al. / Procedia - Social and Behavioral Sciences 148 ( 2014 ) 227 – 235
Tarik Turk, Olgun Kitapci, I. Taylan Dortyol / Procedia - Social and Behavioral Sciences 00 (2014) 000–000 TarTarTarikikik TurTurTurkkk, OlgOlgOlgununun KitKitKittapcapcapciii, III. TayTayTaylanlanlan DoDoDortyrtyrtyololol / P/ P/ Procrocrocediediediaaa --- SocSocSocialialial ananand Bd Bd Behehehaviaviavioraoraoral Sl Sl Sciecieciencencences 0s 0s 00 (0 (0 (201201201444(((( ) 0) 0) 0000000444 ––000000000
Fig. 3. General view of ArcGIS Desktop 9.3 Software with user interface programs developed.
232 Tarik Turk et al. / Procedia - Social and Behavioral Sciences 148 ( 2014 ) 227 – 235
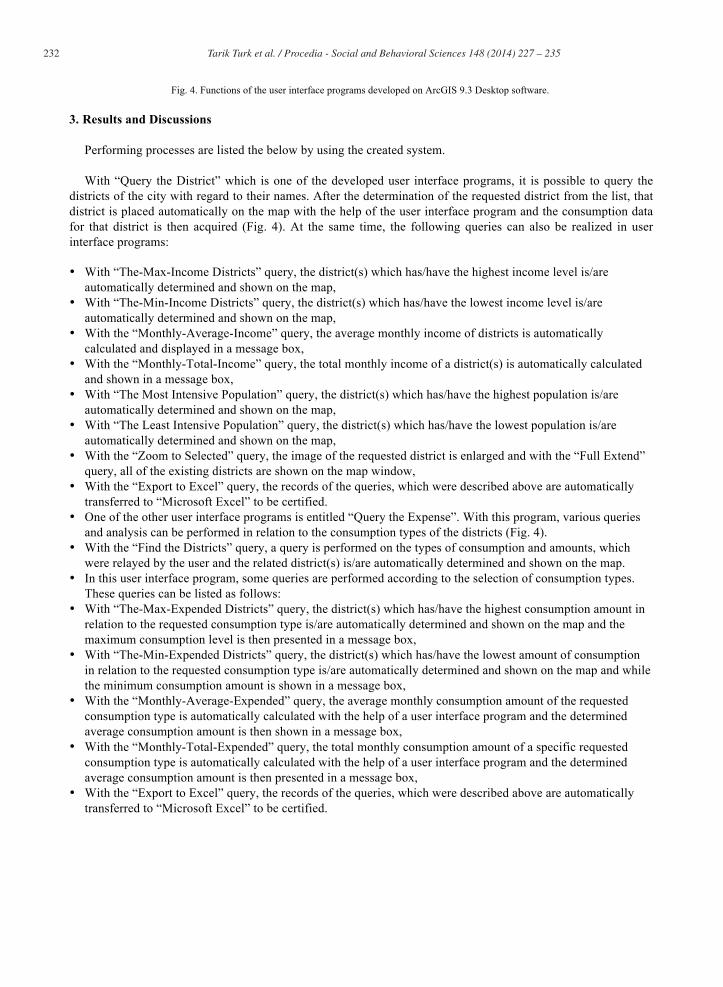
Fig. 4. Functions of the user interface programs developed on ArcGIS 9.3 Desktop software.
3. Results and Discussions
Performing processes are listed the below by using the created system. With “Query the District” which is one of the developed user interface programs, it is possible to query the
districts of the city with regard to their names. After the determination of the requested district from the list, that district is placed automatically on the map with the help of the user interface program and the consumption data for that district is then acquired (Fig. 4). At the same time, the following queries can also be realized in user interface programs: • With “The-Max-Income Districts” query, the district(s) which has/have the highest income level is/are
automatically determined and shown on the map, • With “The-Min-Income Districts” query, the district(s) which has/have the lowest income level is/are
automatically determined and shown on the map, • With the “Monthly-Average-Income” query, the average monthly income of districts is automatically
calculated and displayed in a message box, • With the “Monthly-Total-Income” query, the total monthly income of a district(s) is automatically calculated
and shown in a message box, • With “The Most Intensive Population” query, the district(s) which has/have the highest population is/are
automatically determined and shown on the map, • With “The Least Intensive Population” query, the district(s) which has/have the lowest population is/are
automatically determined and shown on the map, • With the “Zoom to Selected” query, the image of the requested district is enlarged and with the “Full Extend”
query, all of the existing districts are shown on the map window, • With the “Export to Excel” query, the records of the queries, which were described above are automatically
transferred to “Microsoft Excel” to be certified. • One of the other user interface programs is entitled “Query the Expense”. With this program, various queries
and analysis can be performed in relation to the consumption types of the districts (Fig. 4). • With the “Find the Districts” query, a query is performed on the types of consumption and amounts, which
were relayed by the user and the related district(s) is/are automatically determined and shown on the map. • In this user interface program, some queries are performed according to the selection of consumption types.
These queries can be listed as follows: • With “The-Max-Expended Districts” query, the district(s) which has/have the highest consumption amount in
relation to the requested consumption type is/are automatically determined and shown on the map and the maximum consumption level is then presented in a message box,
• With “The-Min-Expended Districts” query, the district(s) which has/have the lowest amount of consumption in relation to the requested consumption type is/are automatically determined and shown on the map and while the minimum consumption amount is shown in a message box,
• With the “Monthly-Average-Expended” query, the average monthly consumption amount of the requested consumption type is automatically calculated with the help of a user interface program and the determined average consumption amount is then shown in a message box,
• With the “Monthly-Total-Expended” query, the total monthly consumption amount of a specific requested consumption type is automatically calculated with the help of a user interface program and the determined average consumption amount is then presented in a message box,
• With the “Export to Excel” query, the records of the queries, which were described above are automatically transferred to “Microsoft Excel” to be certified.

233 Tarik Turk et al. / Procedia - Social and Behavioral Sciences 148 ( 2014 ) 227 – 235
The user interface program called “The Optimum Location” is developed to determine the optimum
geographical location of marketing organizations, such as shopping centers, supermarkets and clothing stores (Fig. 4). To determine an optimum geographical location; population, average income and the level of monthly average consumption (in relation to food, hygiene, clothes, personal care, alcohol, smoking etc.) in the districts are all considered. The program automatically calculates the means of the related consumption types in all of the districts primarily and then point outs the specific district(s) that has/have the highest average level of consumption taking into consideration the population and the district(s) which is/are shown on the map, while the number of related districts is displayed in a message box. In this user interface program, the “Determining the Optimum Location” query is performed after the selection of investment type (Shopping center, supermarket etc.) and relays the circumstances related with population. In this manner, the related district(s) is/are automatically determined and shown on the map and the number of related districts is then displayed in a message box. As in the other user interface programs, with the “Export to Excel” query, the records of the previous queries, which are described above, are automatically transferred to “Microsoft Excel” to be documented.
4. Conclusions
The follow results can be presented by the created system. • The district that has the highest average income is Ulanak, while the district with the lowest income is
Seyrantepe. The average monthly income in the Ulanak and Seyrantepe districts varies from 1,750 TL (Turkish Liras) and 583 TL respectively.
• The average monthly income level in Sivas City (60 districts) is 1,179 TL. • The district that has the highest population is Yenişehir, while the district with the lowest population is
Uzuntepe. • The district that has the highest food consumption level is İnönü with average spending at 251 TL per month.
The Mısmılırmak district has the lowest food consumption level, at 91 TL spent on food on average in a month.
• The average monthly food consumption level of Sivas City (60 districts) is at 183 TL. According to observations, the results gained with the GIS paralleled that of personal observations. This study provided significant information regarding Sivas City with the help of user interface programs,
which were developed to realize certain given operations such as spatial analysis, queries and documentation full-automatically. All of these processes are structured on the basis of Kotler’s marketing information system model. The final two sub-systems (the marketing research system and the marketing decision support system) of this system were thoroughly handled in this study. The ability to receive accurate and useful information may help a company process their marketing decision system more efficiently and effectively. Thus, a company can both easily and quickly make further objective decisions without prejudice. In this sense, it is determined that GIS may play a significant role on the optimum decision making process.
Fig. 5a displays the optimum locations for a supermarket investment amongst the various districts of Sivas city. As a result of the query and analysis that were realized to point out the optimum location of a new supermarket, the İnönü, Kadı Burhanettin, Kaleardı, Kümbet, Ulanak and Çiçekli districts were determined as being the most advisable territories. From the map below (Fig. 5a), a supermarket investor will be obviously able to determine the territory where the investment should be made. Accordingly, the Kadı Burhanettin, Kaleardı, Kümbet, Ulanak and Çiçekli districts compose the optimum supermarket location in Sivas. As can be seen from the map above, the distribution of the districts is not scattered. This may in turn be interpreted as a positive signal for the reliability of the system.

234 Tarik Turk et al. / Procedia - Social and Behavioral Sciences 148 ( 2014 ) 227 – 235
This developed study will be a reference for both further studies and applications on other territories. Thus, it may help all marketers who will use the GIS software, to make certain decisions regarding planning their marketing strategy.
Maps are visual communications tools. Location-based concepts, data and information can be evidently and efficiently presented with maps. For this purpose, monthly consumption distribution maps were created on education, health and food expenses (Fig. 5b, 5c, 5d) as examples. With the help of these maps, evidence can be gained to understand which districts have school, stationary, hospital, pharmacy, mall and supermarket needs.
Fig. 5. The Selected Districts in the Optimum Location for a Supermarket and Expense-distribution-maps produced by the created system.
References
Islamoglu, A. H. (2008). Pazarlama Yonetimi, Beta Publisher, Istanbul. Mitchell, V. W. (1991). “Local authorities’ use of geographical ınformation systems”, Logistics Information Management, Vol.4, No.4, pp.
12-18. Musyoka, S.M, S.M. Mutyauvyu, J.B.K., Kiema, F.N. karanja and D.N. Siriba (2007). “Marketing segmentation using geographic
information systems (GIS): A case study of the soft drink industry in Kenya”, Marketing Intelligence and Planning, 25, 6, 632-642. Sääksjärvi, M. V.T. and Talvinen, J. M. (1993). “Integration and effectiveness of marketing information systems”, European Jounal of
Marketing, 27, 1, 64-79. Talvinen, J. M. (1995). “Information systems in marketing”, European Journal of Marketing, 29, 1, 8-26. Tombarge, J. (1999). “Using management software for geographic information systems (GIS)”, The Bottom Line: Managing Library
Finances, 12, 4, 146-149. Tonks D. G. and Farr, M. (1995). “Market segments for higher education using geodemographics”, Marketing Intelligence & Planning,
Vol.13, No.4, pp.24-33.

235 Tarik Turk et al. / Procedia - Social and Behavioral Sciences 148 ( 2014 ) 227 – 235
Turk, T. (2009). Creating a Sustainable Disaster Information System and its Application on the North Anatolian Fault Zone (NAFZ). PhD. Degree Thesis, Yildiz Technical University, Istanbul.
Xia, J. (2004). “Library sapce management: A GIS proposal”, Library Hi Tech, 22, 4, 375-382.