The Under-Registration of Births in Latin America
25
Inter-American Development Bank Banco Interamericano de Desarrollo (BID) Research Department Departamento de Investigación Working Paper #551 The Under-Registration of Births in Latin America by Suzanne Duryea Analia Olgiati Leslie Stone Inter-American Development Bank January 2006
Transcript of The Under-Registration of Births in Latin America

Inter-American Development Bank Banco Interamericano de Desarrollo (BID)
Research Department Departamento de Investigación
Working Paper #551
The Under-Registration of Births in Latin America
by
Suzanne Duryea Analia Olgiati Leslie Stone
Inter-American Development Bank
January 2006
2
Cataloging-in-Publication data provided by the Inter-American Development Bank Felipe Herrera Library Duryea, Suzanne.
The under-registration of births in Latin America / by Suzanne Duryea, Analia Olgiati, Leslie Stone.
p. cm. (Research Department Working papers ; 551) Includes bibliographical references. 1. Registers of births, etc.—Latin America. 2. Birth certificates—Latin America. 3.
Recording and registration—Latin America. I. Olgiati, Analia. II. Stone, Leslie. III. Inter-American Development Bank. Research Dept. IV. Title. V. Series.
353.59 D388--------dc22 ©2006 Inter-American Development Bank 1300 New York Avenue, N.W. Washington, DC 20577 The views and interpretations in this document are those of the authors and should not be attributed to the Inter-American Development Bank, or to any individual acting on its behalf. This paper may be freely reproduced provided credit is given to the Research Department, Inter-American Development Bank. The Research Department (RES) produces a quarterly newsletter, IDEA (Ideas for Development in the Americas), as well as working papers and books on diverse economic issues. To obtain a complete list of RES publications, and read or download them please visit our web site at: http://www.iadb.org/res

3
Abstract*
Approximately 14 percent of births are unregistered in Latin America according to estimates by UNICEF (2001). Children who lack an official birth certificate can be denied access to social services, including enrolling in school and accessing health services. This paper examines the under-registration of births in six Latin American countries—Bolivia, Brazil, Colombia, the Dominican Republic, Peru, and Nicaragua—using Demographic and Health Surveys (DHS). Under-registration of children younger than 5 is found to range from 8.4 percent in Peru to 25.8 percent in the Dominican Republic. Striking regional differences are found in all six countries. The econometric analysis considers a simple set of covariates representing child’s characteristics, parents’ characteristics, household characteristics and community-level characteristics for Bolivia, Brazil, Colombia, Peru, and Nicaragua. Children from low socioeconomic backgrounds face the greatest risks of being unregistered from birth to age 5. The probability of a birth being registered is also shown to vary by area of residence, as well as certain characteristics of the pregnancy and delivery. Mothers who received no prenatal care are at higher risk of having unregistered births in all five countries included in the econometric analysis. The age of the mother is an important explanatory factor, with children born to teen mothers significantly more likely to be unregistered in Bolivia, Colombia, and Peru. Births that were not attended by a health specialist are significantly more likely to be unregistered in Colombia and Nicaragua. The results suggest a potential for program interventions to be effectively combined in ways such as promoting birth registration in programs designed to increase prenatal care and attended births among women with low socieconomic status.
* This document reflects the opinions of the authors and does not represent the opinions of the Inter-American Development Bank or its Board of Directors. The authors thank participants at the 2005 Population Association of America meetings for comments.

4

5
1. Introduction
Approximately 14 percent of births are unregistered in Latin America according to United Nations
estimates (UNICEF, 2001). The lack of a birth certificate is often the first step of a lifelong
struggle with a lack of documentation. Without proper documents children can be denied access to
social services including enrolling in school and accessing health services. Undocumented
children are also at a higher risk for illegal adoption and trafficking. Without written proof of
one’s birth it is extremely difficult to attain national identity documents at later ages. For adults in
Latin America basic identity documents are vital for opening bank accounts, voting, holding a
formal sector job, owning property and receiving social services. The lack of proper
documentation has a direct bearing on an individual’s ability to fully participate in society.
The under-registration of births also poses significant problems for the accurate
estimation of indicators such as infant mortality rates. Governments and donors continue to
focus a great deal of attention and resources on monitoring progress achieved toward the UN
Millennium Development Goals. However, if vulnerable populations are more likely to be
excluded from birth or death registration, then aggregate indicators will be biased. Palloni and
Arias (2004) demonstrate the bias induced in US mortality rates by the “disappearance” of
Mexican immigrants from US death registries. The under-registration of deaths, explained by
return migration to Mexico, explains a large share of the differential mortality rates between
Mexicans and non-Hispanics in the US. Along with the importance for monitoring progress and
assessing an overall picture, accurate vital statistics are critical for providing disaggregated
information that can be used to target interventions. Given inaccurate vital statistics, social
programs may also be biased and hence inefficient.
UNICEF has long recognized the importance of birth registration and has supported
campaigns and programs to increase birth registration globally.1 In Latin America, governments
such as those of Brazil and Bolivia have initiated recent reforms that include removing the
registration fees for children under specific ages.2 However, surprisingly little research exists on
this important topic, and publications commonly lament the lack of available and reliable data.
For example, a 2002 report by the Inter-American Children’s Institute notes “the difficulties in
1 For example, UNICEF aired the following radio spots in Brazil in 2003: certidao_ago_1.mp3, available at: http://www.unicef.org/brazil/radio.htm. 2 Brazil undertook reforms in 1997, and Bolivia in 2004.

6
obtaining information on birth registration and, even when information was obtained, of its
suspicious validity and precision.” The topic of “citizenship,” commonly explored in terms of
the rights and responsibilities of individuals with respect to the state, often ignores the link to
under-registration, although it has diret implications on the probability of voting and other
commonly measured forms of political participation (Lloyd, 2005). However, some available
data appear to have been underutilized. For example, although questions on birth certificate
registration are frequently included in the Demographic and Health Survey questionnaires for
Latin America, a literature review reveals no published papers examining this outcome. The
exception is a recent paper by UNICEF (2005) that analyzes data from 69 countries using both
the DHS and MICS data.3 While the UNICEF paper gives a global overview of the issue and
summary statistics for individual countries, it largely focuses on Africa; our paper presents
detailed country-specific multivariate results for five Latin American countries, which can
better inform policy interventions at the national and sub-national level.
This paper examines the under-registration of births in six Latin American countries:
Bolivia, Brazil, Colombia, the Dominican Republic, Peru, and Nicaragua. One standard measure
for the lack of registration is the lack of a registered birth certificate for the child.43 Section 2
describes the data, which are drawn for each country’s Demographic and Health Surveys (DHS).
Section 3 presents the magnitude of under-registration across the six countries and across
categories such as region, sex of child and socioeconomic characteristics of the household.
Section 4 examines the variables associated with under-registration using probit regressions, and
Section 5 considers how recent policy interventions are related to the results from the
econometric analysis.
2. Description of Data Our analyses for all six countries are based on the most recent data from the publicly available
Demographic and Health Surveys (DHS), nationally representative household surveys conducted
in 70 countries worldwide and in 13 Latin American and Caribbean countries
3 The recommended indicator is described inhttp://unstats.un.org/unsd/indicatorfoc/indsearchpage.asp?cid=54. 4 A few months after presenting a previous version of this paper at an academic conference, we became aware of independent work on birth registration by UNICEF (2005).
7
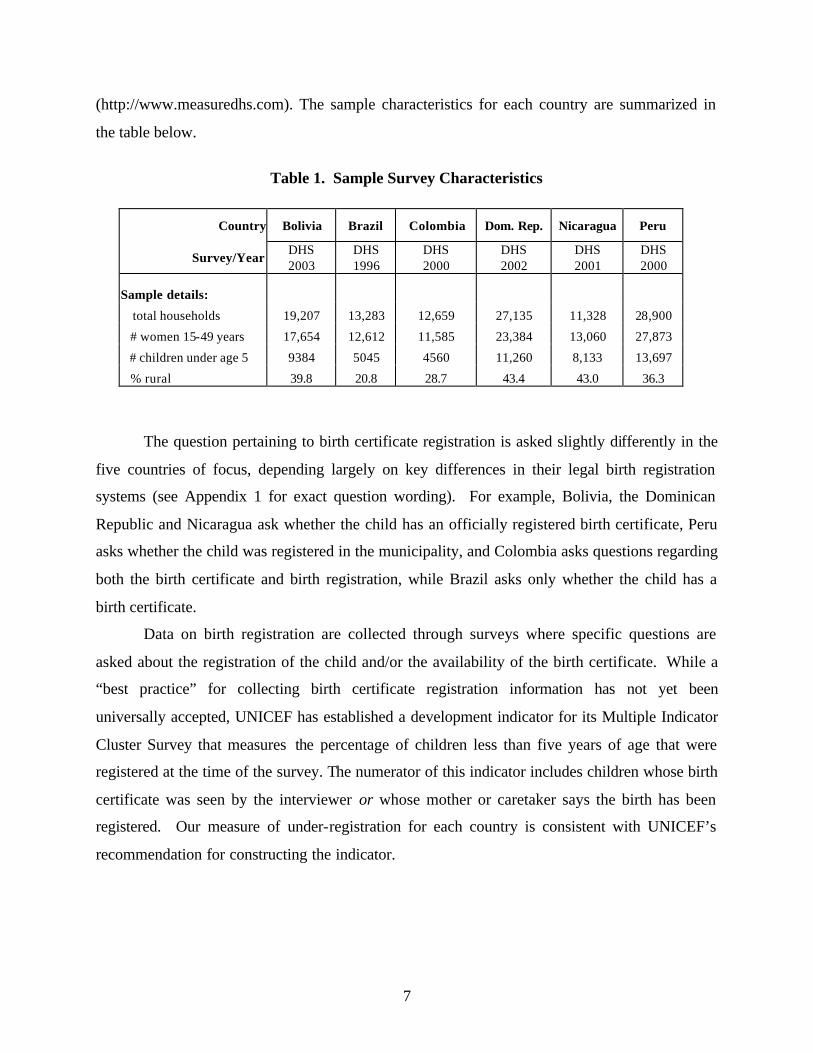
(http://www.measuredhs.com). The sample characteristics for each country are summarized in
the table below.
Table 1. Sample Survey Characteristics
Country Bolivia Brazil Colombia Dom. Rep. Nicaragua Peru
Survey/Year DHS 2003
DHS 1996
DHS 2000
DHS 2002
DHS 2001
DHS 2000
Sample details:
total households 19,207 13,283 12,659 27,135 11,328 28,900
# women 15-49 years 17,654 12,612 11,585 23,384 13,060 27,873
# children under age 5 9384 5045 4560 11,260 8,133 13,697
% rural 39.8 20.8 28.7 43.4 43.0 36.3
The question pertaining to birth certificate registration is asked slightly differently in the
five countries of focus, depending largely on key differences in their legal birth registration
systems (see Appendix 1 for exact question wording). For example, Bolivia, the Dominican
Republic and Nicaragua ask whether the child has an officially registered birth certificate, Peru
asks whether the child was registered in the municipality, and Colombia asks questions regarding
both the birth certificate and birth registration, while Brazil asks only whether the child has a
birth certificate.
Data on birth registration are collected through surveys where specific questions are
asked about the registration of the child and/or the availability of the birth certificate. While a
“best practice” for collecting birth certificate registration information has not yet been
universally accepted, UNICEF has established a development indicator for its Multiple Indicator
Cluster Survey that measures the percentage of children less than five years of age that were
registered at the time of the survey. The numerator of this indicator includes children whose birth
certificate was seen by the interviewer or whose mother or caretaker says the birth has been
registered. Our measure of under-registration for each country is consistent with UNICEF’s
recommendation for constructing the indicator.
8
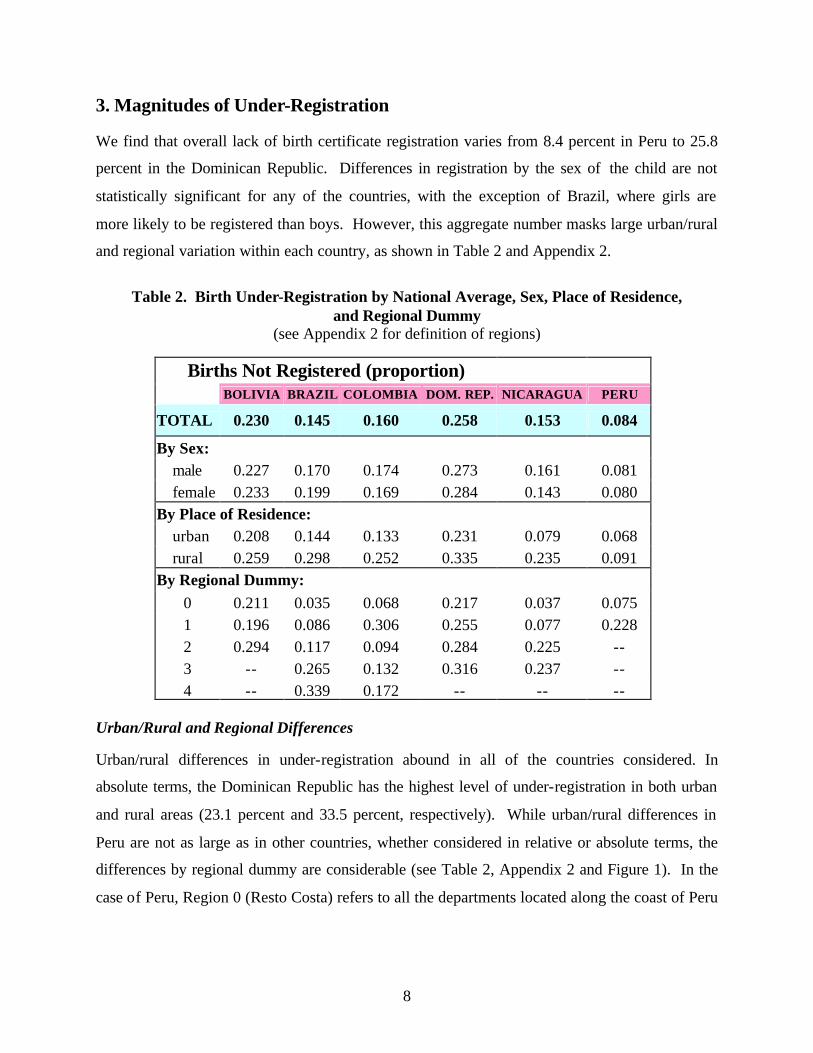
3. Magnitudes of Under-Registration We find that overall lack of birth certificate registration varies from 8.4 percent in Peru to 25.8
percent in the Dominican Republic. Differences in registration by the sex of the child are not
statistically significant for any of the countries, with the exception of Brazil, where girls are
more likely to be registered than boys. However, this aggregate number masks large urban/rural
and regional variation within each country, as shown in Table 2 and Appendix 2.
Table 2. Birth Under-Registration by National Average, Sex, Place of Residence,
and Regional Dummy (see Appendix 2 for definition of regions)
Births Not Registered (proportion) BOLIVIA BRAZIL COLOMBIA DOM. REP. NICARAGUA PERU
TOTAL 0.230 0.145 0.160 0.258 0.153 0.084
By Sex: male 0.227 0.170 0.174 0.273 0.161 0.081 female 0.233 0.199 0.169 0.284 0.143 0.080 By Place of Residence:
urban 0.208 0.144 0.133 0.231 0.079 0.068 rural 0.259 0.298 0.252 0.335 0.235 0.091 By Regional Dummy:
0 0.211 0.035 0.068 0.217 0.037 0.075 1 0.196 0.086 0.306 0.255 0.077 0.228 2 0.294 0.117 0.094 0.284 0.225 -- 3 -- 0.265 0.132 0.316 0.237 -- 4 -- 0.339 0.172 -- -- --
Urban/Rural and Regional Differences Urban/rural differences in under-registration abound in all of the countries considered. In
absolute terms, the Dominican Republic has the highest level of under-registration in both urban
and rural areas (23.1 percent and 33.5 percent, respectively). While urban/rural differences in
Peru are not as large as in other countries, whether considered in relative or absolute terms, the
differences by regional dummy are considerable (see Table 2, Appendix 2 and Figure 1). In the
case of Peru, Region 0 (Resto Costa) refers to all the departments located along the coast of Peru

9
excluding Lima, while Region 1 (Selva) mostly refers to the two departments located in the
Amazonian rainforest that border Colombia and Brazil.
Striking regional differences are also found in Brazil. In the Northeast region of Brazil
(Region 3 in Table 2), which is characterized by lower education, lower income levels and a high
concentration of Afro-Brazilians, birth under- registration is 26.5 percent, while in the wealthier
South (Region 0 in Table 2), only 3.5 percent of births go unregistered.
Likewise in Colombia, under-registration in the capital of Bogota (Region 0) is 6.8
percent, while in the Atlantic region (Region 1) it reaches an average of 30.6 percent. The
Atlantic region of Colombia encompasses several indigenous communities (in Guajira and
Magdalena-Sierra Nevada) and includes a large share of the Afro-Colombian population (in
Atlantico and Bolivar).
In Nicaragua, the highest levels of under-registration also coincide with those areas with
the highest levels of poverty, in the autonomous English-speaking populations of RAAN (39.4
percent) and RAAS (54.9 percent), as shown in Figure 1 and Appendix 2. On the other hand,
under-registration in the capital of Managua (Region 0) is only 3.7 percent. The indigenous
populations of Nicaragua are spread throughout the country and are not concentrated in any one
geographic area.
While under-registration is high in all regions of the Dominican Republic, it is especially
so in the western part of the country which borders Haiti. For example, in the Elisa Piña
province, which directly borders Haiti, birth under-registration is almost 50 percent. While we
cannot distinguish between children of native-born versus foreign-born, we recognize that the
large presence and low status of Haitian migrants in the Dominican Republic may be driving this
result.

10
Figure 1. Maps of Under-Registration for Peru and Nicaragua
Mother’s Age at Child’s Birth
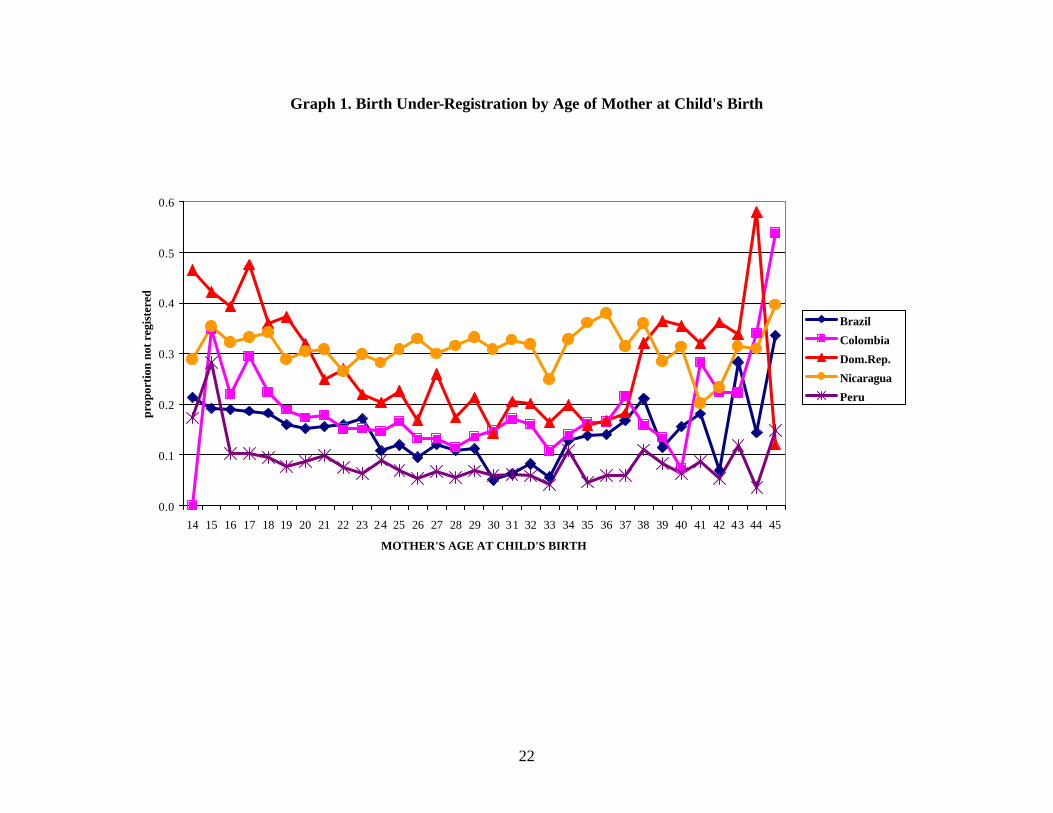
Birth registration also varies by age of mother at the time of the child’s birth. Although the
frequency of births to very young and old mothers is lower, they are much less likely to register
their child’s birth. Graph 1 shows the U-shaped relationship between under-registration and
mother’s age at child’s birth.
Child’s Age
As a child ages, s/he is more likely to have her/his birth registered. Graph 2 shows the different
levels of under-registration between age 0 and 5 for all the countries. The probability of
registration greatly increases at age 1. In Colombia, for example, overall under-registration
between age 0-1 is about 49 percent but drops to 23 percent between ages 1-2.
Barriers to Registration Barriers to registration can be categorized as economic, legal, administrative, geographic and
cultural. Although registration often requires no fee, parents may have to incur indirect costs
such as transportation expenses and travel time. Legal quagmires can be frustrating and costly as
well, since procedures for late registration (typically for children over one month of age) often
require the services of a lawyer. Cultural factors can additionally play important roles, as some
groups may not perceive a benefit to including their child in the civil regis try. For example, if
expectations of holding a future job are poor, and the regard for voting low, parents will be less

11
likely to incur the costs of registering their child. Moreover, mothers may fear stigmatizing a
child by officially declaring that he or she is fatherless (Ordóñez and Bracamonte, 2005).
While there is some availability of information regarding the magnitudes of birth
registration, there is far less survey information available regarding the reasons given for not
registering. The exception is the DHS survey for Colombia, which inquires about why children
were not registered (see Table 3). The results from the Colombian survey reveal concerns about
time and costs, with 20 percent of urban mothers listing time concerns as the reason for not
registering their child and 17 percent of rural mothers listing the cost. The strong
intergenerational component to the registration process observed throughout Latin America is
also revealed in the responses by Colombian mothers. (Even when children are born in hospitals
in Latin America parental documentation is generally necessary to register the child.) In urban
areas 27 percent of mothers reported their children were not registered because they themselves
lacked identification documents. In rural areas this accounted for 18 percent of the responses. In
some instances the barriers to registration some barriers were surprisingly basic. For instance,
approximately 10 percent of mothers in both urban and rural areas reported that their child was
not registered because the registry lacked the proper stationery.
Table 3. Colombia: Reason Why Child Not Registered
URBAN RURAL
Reason child not registered Freq. % Reason child not registered Freq. %parent lacks identification 11427.42 lack of time 69 17.86lack of time 8520.27 too costly 66 17.14lack of proper stationary at registry 4811.52 parent lacks identification 64 16.70other 31 7.53 registry place far away 52 13.44child too young 24 5.68 lack of proper stationary at registry 37 9.55father absent temporarily 22 5.19 child too young 20 5.25father has not wanted yet 20 4.81 father has not wanted yet 15 3.93too costly 19 4.50 problems at register place 14 3.57problems at register place 15 3.48 other 13 3.47registry place far away 11 2.59 father absent temporarily 7 1.71wait until father recognizes child 8 1.84 wait until father recognizes child 6 1.69illness/hospitalization of child 5 1.22 wait until after baptisim 5 1.36father died 5 1.14 do not know where to register 5 1.36father left them 4 0.99 did not want to pay late penalty 5 1.36wait until after baptisim 0 0.80 father left them 4 0.93did not want to pay late penalty 2 0.57 illness/hospitalization of child 2 0.62do not know where to register 2 0.44 father died 0 0.00
TOTAL 417 100 TOTAL 384 100

12
In Colombia and Brazil, birth registration must be done outside of the hospital at a
separate official place of civil registry such as a public notary. On the other hand, in the
Dominican Republic and Peru, government health centers, hospitals and clinics have public
notary offices on the premises. Since 1997 Nicaragua has opened some registration offices in
hospitals in Nicaragua (Gobierno de Nicaragua, 2003). However, in all cases, births occurring in
very rural areas require an exceptional effort to register due to extreme geographic remoteness,
in addition to the other barriers previously mentioned. Many of the countries studied have
recently conducted mobile “registration campaigns” as a way to increase birth registration,
especially in isolated areas.
Countries have been initiating reforms to reduce costs associated with on-time birth
registration. Peru has recently removed monetary fees for on-time birth registration in rural
areas. While at the time of the DHS surveys Bolivia was the only country of the six that imposed
no monetary fee for birth registration, since 2000 Brazil and Colombia have abolished monetary
fees for registration.
Implications of Lack of Birth Registration Survey data containing information on short-term and long-term implications of the lack of birth
registration are scarce. Although it is common for household and demographic surveys to
inquire as to the reasons why children are not enrolled in or attending school, almost no surveys
include as a response that children were turned away from enrolling in school because they
lacked a birth certificate. One exception is the 2001 household survey for Brazil, the PNAD,
which contains a question that asks why children have not enrolled in school. It does not directly
ask about the lack of a birth certificate, but it does include as a response “the lack of
documentation,” which most likely refers to the birth certificate. Table 4 displays the results for
children ages 7-9. We use a young sample because recall error may be an issue if older children
were turned away from school. The official age of enrollment in first grade is age 7 according to
UNESCO. Of the children not matriculating, 7.7 percent reported that the lack of documentation
was the main factor for not enrolling in school.5 While this is only the sixth-ranked reason
provided, the lack of documentation represents a total of 22,571 children given the population
weights provided in the survey.
5 Typically it is an adult who is the respondent to the questionnaire.

13
Table 4. Main Reason for Not Enrolling in School, Children Ages 7-9, 2001 Brazil
Main Reason for Not Enrolling Frequency Percent Sickness or disability 48,130 16.45 Lack of vacancy at school 43,495 14.87 No interest 28,531 9.75 School doesn’t exist close to home 26,926 9.21 Lack of money for school related expenses 25,276 8.64 Lack of documentation 22,571 7.72 Parents do not want 19,381 6.63 Lack of transportation to school 6,327 2.16 No one to accompany/transport 3,210 1.1 Help with domestic affairs 1,541 0.53 Work or look for work 819 0.28 non-response 360 0.12 Finished desired studies 0 0 Parents prefer child to work 0 0 Other reason 65,928 22.54 Total 292,495 100 Source: 2001 PNAD, calculations by authors.
The lack of documentation has important implications for the delivery of social
programs. Birth certificates for children and national identification documents for adults are
often prerequisites in targeting systems such as FICHA CAS in Chile, SISBEN in Colombia, or
SELBEN in Ecuador. These information systems are used to minimize type II targeting errors,
i.e., errors of inclusion of the non-targeted. For example, the FICHA CAS in Chile collects
objective measures of poverty that are used to determine eligibility for an array of social
programs. The national identification card is one piece of information that is included in the
targeting system to avoid fraud and duplication.
Conditional cash transfer programs (CCTs), a rapidly proliferating type of anti-poverty
program in Latin America, stress the co-responsibility of participating families. The CCTs have
all addressed problems of under-registration in their program design. Although overall levels of
civil registration coverage are high in Chile, the Chile Solidario program has recognized that
undocumented Chileans are excluded from programs and has thus undertaken measures to
address this problem. As part of its Programa Puente project, Chile Solidario has issued over

14
26,000 national ID cards to poor families who were undocumented and therefore previously
ineligible for the program (Provoste, 2004). Chile Solidario has made the acquisition of national
identity documents by all family members a main objective of the program. Identity is a major
pillar of the program, along with health, education, family dynamics, housing, work and income.
In Colombia, the Familias en Acción program is a CCT program that also relies on a
national information system (SISBEN) to target the program. Targeted beneficiaries must
present valid national identification cards before they receive the subsidy. To reduce the
potential for exclusion from their program, Familias en Acción promotes civil registration
campaigns before entering targeted communities.
Other CCTs have not included civil registration documents as prerequisites for
participation. For example, the Red de Protección Social in Nicaragua issues its own internal
family registration code rather than restrict coverage only to families with civil registration
documents. While this makes compiling information on beneficiaries across programs very
difficult, it reduces the potential for type I errors of exclusion (i.e., excluding targeted persons).
On the other hand, this type of design may also open the door for program leakage or fraud. A
similarly designed program in Honduras decided to require civil registration documents after
receiving reports of families exaggerating their household size (Ordóñez and Bracamonte,
2005). In addition, the means through which transfers are delivered often have critical
implications for program design, since financial intermediaries typically require official
documentation. Colombia’s Familias en Acción program, for instance, relies on formal banking
institutions to distribute subsidies, an increasingly observed trend in the region.
4. Econometric Analysis In our econometric analysis we are not aiming to model causality, but rather to capture
relationships between variables that may help in designing targeted interventions. We consider a
simple set of covariates that are available in the five datasets.6 The variables represent child’s
characteristics, parents’ characteristics, household characteristics and community- level
characteristics. The sex of the child is the only characteristic of the child included. Parental
characteristics include mother’s education and age when birth occurred, presence of
6 Immigration from Haiti is an important factor in the high rates of under-registration in the Dominican Republic and should ideally be addressed in the econometric analysis. However, since the DHS does not include a question on migration we omit the Dominican Republic from this part of the analysis.

15
father/partner and father’s education. Two variables describing the pregnancy reflect the
mother’s means of accessing care as well as the community’s supply of health services. We
indicate whether each birth was attended by a health specialist and whether the mother received
prenatal care. At the household level, the lack of a refrigerator is a proxy for low socio-
economic status.7 Since the summary statistics indicated important differences across geographic
areas, regional dummies are included in the second model.
Model I Since our outcome is dichotomous we use a probit model to estimate whether the child is
unregistered. Table 5 shows the results in which the more limited set of comparable variables
are included. The variable indicating whether the household is located in a rural or urban zone is
not included because the definitions differ across the countries. Most importantly, the definition
of “urban” in Colombia is linked to the locality containing the administrative seat.8 The marginal
effects are presented in Table 6. This simple set of variables explains approximately 10 percent
of the variation in all of the countries except Peru. In Nicaragua the simple specification
explains approximately 18 percent of the variation. With the exception of Brazil, the sex of the
child is not significantly related to the probability of the child’s birth being registered. In the
case of Brazil, girls younger than age 5 are 1.3 percentage points more likely to be registered
than boys. Brazil is also the exception when the effect of parents’ education is considered. In
four of the five countries (Bolivia, Colombia, Peru and Nicaragua), mother’s education has a
larger effect than father’s education on the likelihood that a birth is registered. In Brazil,
however, the education of the father is more important.9
7 Although the DHS do not include income variables, parents’ education is highly correlated with the permanent income status of the household. 8 For example, each municipality is divided into both urban and rural zones, regardless of its total population size or density. “Urban” is defined as the zone closest to the town hall, while “rural” encompasses the rest of the municipality. The registry offices are generally located near the municipal seat, and access will be linked to this definition. 9 It is possible that the results regarding gender are reflecting the older vintage of the data in the case of Brazil, and not a different pattern from the other countries. The authors are seeking updated information for Brazil to examine this hypothesis further.

16
Table 5. Model I (probit) Prob. Child’s Birth NOT Registered BOLIVIA BRAZIL COLOMBIA NICARAGUA PERU
Sex of child (1= female) -0.008 0.094* -0.018 0.061 0.021 Mother’s education -0.038*** -0.021* -0.075*** -0.053*** -0.018** No refrigerator 0.252*** 0.655*** 0.198** 0.247* 0.151* Delivery not attended by health spec. 0.009 0.262 0.370** 0.301** -0.067 Teenage mother 0.216*** 0.103 0.229** 0.085 0.562*** No Prenatal 0.161*** 0.470*** 0.629*** 0.429*** 0.298*** Male spouse/partner absent 0.243*** 0.093 0.015 0.025 0.453*** Father’s education -0.015*** -0.058*** -0.014 -0.018 -0.014* Child’s age -0.390*** -0.328*** -0.279*** -0.155*** -0.242*** _constant -0.096 -0.745*** -0.214* -0.751*** -1.082***
R2 0.1513 0.2202 0.1771 0.088 0.0879 Obs 6716 4678 3462 4584 12962
*p<0.10, **p<0.05, ***p<0.01
Table 6. Model I Marginal Effects
BOLIVIA BRAZIL COLOMBIA NICARAGUA PERU
Sex of child (1= female) -0.003 0.013* -0.004 0.01 0.002 Mother’s education -0.011*** -0.003* -0.016*** -0.009*** -0.002** No refrigerator 0.065*** 0.109*** 0.042*** 0.038** 0.017** Delivery not attended by health spec. 0.001 0.044 0.092*** 0.06* -0.007 Teenage mother 0.07** 0.015 0.052*** 0.015 0.098** No Prenatal 0.049* 0.085*** 0.170*** 0.091*** 0.037*** Male spouse/partner absent 0.075** 0.014 0.003 -0.003 0.068*** Father’s education -0.004* -0.008*** -0.003 0.004 -0.002* Child’s age -0.112*** -0.046*** -0.058*** -0.026*** -0.028***
Lacking a refrigerator significantly predicts that the child’s birth will be unregistered in
all five of the countries. The largest effect is in Brazil, where the probability of being
unregistered increases by 10 percentage points. Along with the results for parental education,
this finding indicates that children of lower socioeconomic status have a higher risk of being
undocumented.
Some of characteristics of the pregnancy may suggest promising areas for targeting
interventions. The age of the mother is an important explanatory factor, with children born to
teen mothers significantly more likely to be unregistered in Bolivia, Colombia, and Peru. The
probability of the birth being unregistered increases by 7 percentage points in Bolivia, 5 in
Colombia and 10 in Peru. Mothers who received no prenatal care are at higher risk of having
17
unregistered births in all five countries (Bolivia, Brazil, Colombia, Peru and Nicaragua). In
addition, births that were not attended by a health specialist are significantly more likely to be
unregistered in Colombia and Nicaragua, with the probabilities of non-registration rising by 9
and 6 percentage points, respectively.
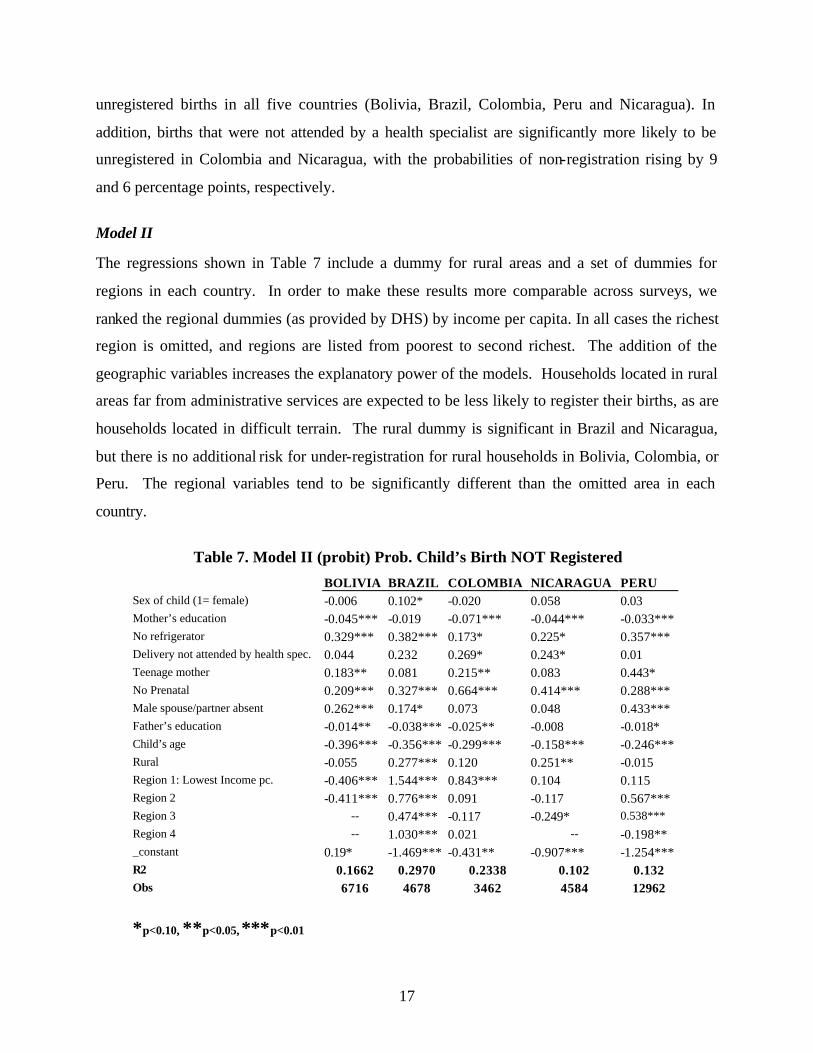
Model II The regressions shown in Table 7 include a dummy for rural areas and a set of dummies for
regions in each country. In order to make these results more comparable across surveys, we
ranked the regional dummies (as provided by DHS) by income per capita. In all cases the richest
region is omitted, and regions are listed from poorest to second richest. The addition of the
geographic variables increases the explanatory power of the models. Households located in rural
areas far from administrative services are expected to be less likely to register their births, as are
households located in difficult terrain. The rural dummy is significant in Brazil and Nicaragua,
but there is no additional risk for under-registration for rural households in Bolivia, Colombia, or
Peru. The regional variables tend to be significantly different than the omitted area in each
country.
Table 7. Model II (probit) Prob. Child’s Birth NOT Registered
BOLIVIA BRAZIL COLOMBIA NICARAGUA PERU Sex of child (1= female) -0.006 0.102* -0.020 0.058 0.03 Mother’s education -0.045*** -0.019 -0.071*** -0.044*** -0.033*** No refrigerator 0.329*** 0.382*** 0.173* 0.225* 0.357*** Delivery not attended by health spec. 0.044 0.232 0.269* 0.243* 0.01 Teenage mother 0.183** 0.081 0.215** 0.083 0.443* No Prenatal 0.209*** 0.327*** 0.664*** 0.414*** 0.288*** Male spouse/partner absent 0.262*** 0.174* 0.073 0.048 0.433*** Father’s education -0.014** -0.038*** -0.025** -0.008 -0.018* Child’s age -0.396*** -0.356*** -0.299*** -0.158*** -0.246*** Rural -0.055 0.277*** 0.120 0.251** -0.015 Region 1: Lowest Income pc. -0.406*** 1.544*** 0.843*** 0.104 0.115 Region 2 -0.411*** 0.776*** 0.091 -0.117 0.567*** Region 3 -- 0.474*** -0.117 -0.249* 0.538*** Region 4 -- 1.030*** 0.021 -- -0.198** _constant 0.19* -1.469*** -0.431** -0.907*** -1.254*** R2 0.1662 0.2970 0.2338 0.102 0.132 Obs 6716 4678 3462 4584 12962
*p<0.10, **p<0.05, ***p<0.01
18
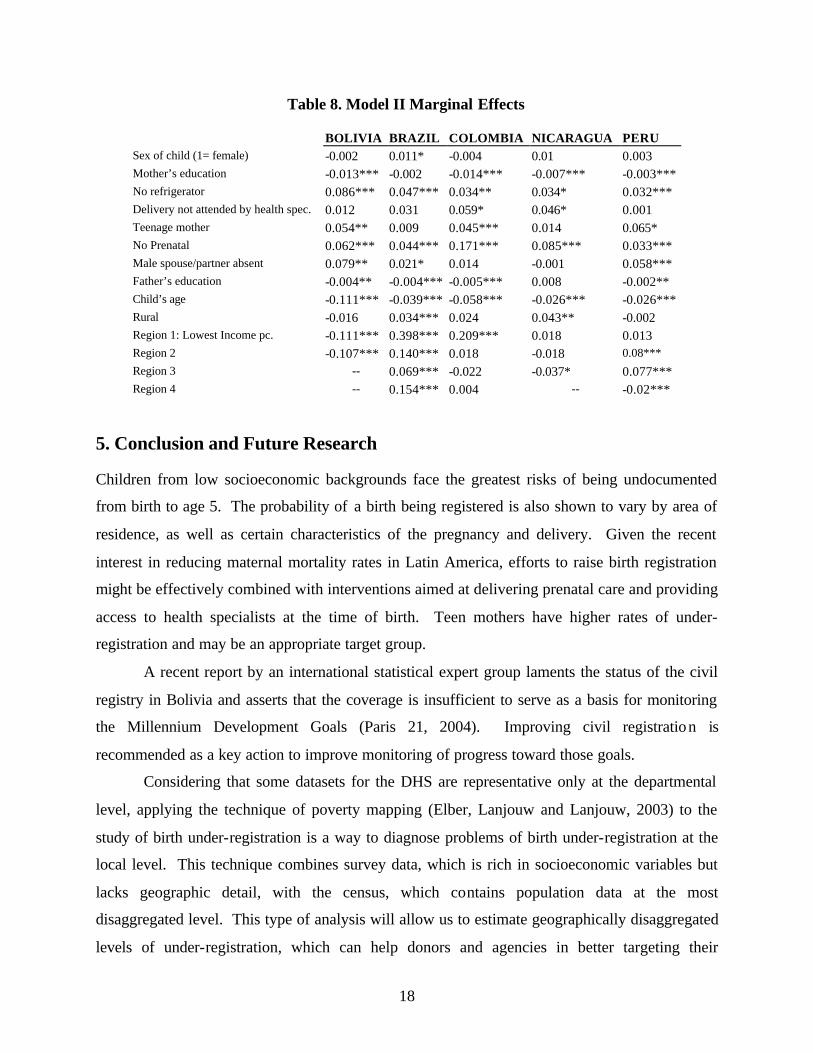
Table 8. Model II Marginal Effects
BOLIVIA BRAZIL COLOMBIA NICARAGUA PERU Sex of child (1= female) -0.002 0.011* -0.004 0.01 0.003 Mother’s education -0.013*** -0.002 -0.014*** -0.007*** -0.003*** No refrigerator 0.086*** 0.047*** 0.034** 0.034* 0.032*** Delivery not attended by health spec. 0.012 0.031 0.059* 0.046* 0.001 Teenage mother 0.054** 0.009 0.045*** 0.014 0.065* No Prenatal 0.062*** 0.044*** 0.171*** 0.085*** 0.033*** Male spouse/partner absent 0.079** 0.021* 0.014 -0.001 0.058*** Father’s education -0.004** -0.004*** -0.005*** 0.008 -0.002** Child’s age -0.111*** -0.039*** -0.058*** -0.026*** -0.026*** Rural -0.016 0.034*** 0.024 0.043** -0.002 Region 1: Lowest Income pc. -0.111*** 0.398*** 0.209*** 0.018 0.013 Region 2 -0.107*** 0.140*** 0.018 -0.018 0.08*** Region 3 -- 0.069*** -0.022 -0.037* 0.077*** Region 4 -- 0.154*** 0.004 -- -0.02***
5. Conclusion and Future Research Children from low socioeconomic backgrounds face the greatest risks of being undocumented
from birth to age 5. The probability of a birth being registered is also shown to vary by area of
residence, as well as certain characteristics of the pregnancy and delivery. Given the recent
interest in reducing maternal mortality rates in Latin America, efforts to raise birth registration
might be effectively combined with interventions aimed at delivering prenatal care and providing
access to health specialists at the time of birth. Teen mothers have higher rates of under-
registration and may be an appropriate target group.
A recent report by an international statistical expert group laments the status of the civil
registry in Bolivia and asserts that the coverage is insufficient to serve as a basis for monitoring
the Millennium Development Goals (Paris 21, 2004). Improving civil registration is
recommended as a key action to improve monitoring of progress toward those goals.
Considering that some datasets for the DHS are representative only at the departmental
level, applying the technique of poverty mapping (Elber, Lanjouw and Lanjouw, 2003) to the
study of birth under-registration is a way to diagnose problems of birth under-registration at the
local level. This technique combines survey data, which is rich in socioeconomic variables but
lacks geographic detail, with the census, which contains population data at the most
disaggregated level. This type of analysis will allow us to estimate geographically disaggregated
levels of under-registration, which can help donors and agencies in better targeting their

19
programs. We plan to apply this technique to Bolivia, Brazil, and Nicaragua in order to better
understand the regional variation in birth registration at a much lower level of aggregation.

20
References Elbers, C., J. Lanjouw and P. Lanjouw. 2003. “Micro-Level Estimation of Poverty and
Inequality.” Econometrica 71(1): 355-386.
Gobierno de Nicaragua. 2003. “Tercer Informe Sobre la Situación de Derechos de los Niños,
Niñas y Adolescentes de Nicaragua 1998-2002.” Managua, Nicaragua: Gobierno de
Nicaragua. http://www.unhchr.ch/html/menu2/6/crc/doc/report/srf-nicaragua-3.pdf
Inter-American Children’s Institute. 2002. “Executive Report: The Diagnosis of Birth Registries
in El Salvador, Guatemala, Haiti, Honduras, Nicaragua, and the Dominican Republic.”
Washington, DC, United States: Inter-American Children’s Institute.
Lloyd, C.B., editor. 2005. Growing Up Global: The Changing Transitions to Adulthood in
Developing Countries. Washington, DC, National Academies Press.
Ordóñez, D., and P. Bracamonte. 2005. “El Registro de Nacimientos: Consecuencias en
Relación al Acceso a Derechos y Servicios Sociales y ala Implementación de programas
de Reducción de Pobreza en 5 países de Latinoamérica.” Report to Technical
Cooperation RG-T1082. Washington, DC, United States: Inter-American Development
Bank.
Palloni, A., and E. Arias. 2004. “Paradox Lost: Explaining the Hispanic Adult Mortality
Advantage.” Demography 41(3): 385-415.
Paris 21 (PARtnerships In Statistics for the 21st Century). 2004. “Improved Statistical Support for
Monitoring Milennium Development Goals: Country Case Study: Bolivia.” Paris,
France: Paris 21.
Provoste, Y. 2004. “Chile Solidario: Sistema de Protección Social a las Familias Mas Pobres del
País.” Paper presented at the Third Meeting of the IDB Social Policy Monitoring
Network, Buenos Aires, Argentina, November 2004.
http://www.iadb.org/res/index.cfm?fuseaction=Publications.View&pub_id=P-265
United Nations Childrens’ Fund (UNICEF). 2001. “Progress Since the World Summit for
Children: A Statistical Review.” New York, United States: UNICEF.
UNICEF. 2005. “The ‘Rights’ Start to Life- A Statistical Analysis of Birth Registration 2005.”
New York, United States: UNICEF.

21
Appendix 1. Variation in Survey QUESTIONS ON BIRTH CERTIFICATE REGISTRATION: COLOMBIA: The Colombia DHS includes five related questions: one on receipt of the birth certificate, one on birth registration, and three follow-up questions pertaining to the act of registration. Regarding the birth certificate, mothers of children less than 5 years old are first asked: “¿A usted le dieron el certificado de nacimiento de NOMBRE?” (Did you receive a birth certificate for NAME?) The questionnaire then asks about registration: “¿El nacimiento de NOMBRE fue registrado?” (Was the birth of NAME registered?) It follows with the next three conditional questions: “¿Dónde fue registrado?” (Where was the birth registered?), “¿Por qué no ha registrado el nacimiento de NOMBRE?” (Why was the birth of NAME not registered?), and “¿Sabe usted cómo registrar el nacimiento de NOMBRE?” (Do you know how to register the birth of NAME?).
BOLIVIA: The Bolivia DHS asks: “¿Tiene NOMBRE certificado (acta) de nacimiento?” (Does NAME have an official birth certificate?) If the mother answers YES, she is then asked to show it to the interviewer. DOMINICAN REPUBLIC: The DHS in the Dominican Republic asks: “¿Tiene NOMBRE certificado (acta) de nacimiento?” (Does NAME have an official birth certificate?) If the mother answers YES, she is then asked to show it to the interviewer.
PERU: The Peru DHS asks: “NOMBRE fue inscrito en la Municipalidad?” (Was NAME registered in the Municipality?). NICARAGUA: The Nicaragua DHS survey asks: “Fue registrado el nacimiento de (NOMBRE)?” Si contesta SI: Puede usted mostrarme el certificado o partida que usted tiene para (NOMBRE): CERTIFICADO MINSA, COLILLA DEL REGISTRO CIVIL, PARTIDA DE NACIMIENTO, NO LO TIENE ELLA, NO LO MUESTRA. Si contesta NO: ¿Por que no fue registrado el nacimiento de (NOMBRE)? NO SABE COMO O DONDE HACERLO, NO ES IMPORTANTE/NO LO NECESITA, LO HARA MAS TARDE, ES MUY CARO, NO SABE. BRAZIL: The DHS Brazil survey asks: “¿Tem certidão de nascimento de (NOME)?” (Do you have the birth certificate of NAME?).
22
Graph 1. Birth Under-Registration by Age of Mother at Child's Birth
0.0
0.1
0.2
0.3
0.4
0.5
0.6
14 15 16 17 18 19 20 21 22 23 24 25 26 27 28 29 30 31 32 33 34 35 36 37 38 39 40 41 42 43 44 45
MOTHER'S AGE AT CHILD'S BIRTH
prop
ortio
n no
t reg
iste
red
Brazil
Colombia
Dom.Rep.
Nicaragua
Peru

23
Graph 2. Birth Under-Registration by Child's Age
0.0%
10.0%
20.0%
30.0%
40.0%
50.0%
0 1 2 3 4 5
AGE
BRAZIL
COLOMBIA
DOM. REP.
NICARAGUA
PERU

24
Appendix 2. Birth Under-Registration, Regional Dummies Note: The omitted category in the regressions corresponds to region 0 (richest).
PERU DOMINICAN REPUBLIC COLOMBIA
Selva alta 0.104 Region 1 Distrito Nacional
0.207 Guajira, Cesar, Magdalena 0.294
Selva baja 0.177 Region 2 Santo Domingo 0.257 Region 1
Atlantico, Bolivar Norte 0.247 Atlantico (1) Lima Metropolitana 0.104 Region 3 Azua 0.400 Bolivar, Sucre, Cordoba 0.398 Sierra 0.065 Region 4 Peravia 0.302 Santanderes 0.096Resto Costa 0.056 Region 0 San Cristobal 0.305 Boyaca, C'marca, Meta 0.093
Oriental (2)
Monte Plata 0.351 Antioquia 0.157 Hato Mayor 0.301 South (2) Medellin 0.047BRAZIL El seybo 0.489 Caldas, Risaralda, Quindio 0.106
Central (3)
Nordeste 0.278 Region 1 La Romana 0.200 Tolima, Huila, Caqueta 0.195 Norte 0.340 Region 2 San Pedro de Macoris 0.207 Cauca, Nariño 0.110 Centro Leste 0.083 Region 3 La Altagracia 0.316 Valle del Cauca 0.120
Centro Oeste 0.124 Region 4 Barahona 0.340 Litoral Pacifico 0.416
Pacifica (4)
Rio de Janeiro 0.050 Pedernales 0.429 Cali 0.164 Sao Paulo 0.011 Region 0 Independencia 0.326 Bogota D.C. 0.068 Region 0 Sul 0.044 Monte Cristi 0.328 Bahoruco 0.488
Elias Piña 0.494 West (3)
NICARAGUA
San Juan 0.419 Nueva Segovia 0.051 BOLIVIA Stgo Rodriguez 0.252 Jinotega 0.303 La Paz, Oruro, Potosi 0.211 Altiplano (1) Dajabon 0.200 RAAN 0.394 Northeast (1) Chuquisaca, Cochabamba, Tarija 0.196 Valle (2) Valverde 0.162 Matagalpa 0.132 Santa Cruz, Beni, Pando 0.294 Llano (0) Samana 0.272 Masaya 0.152 note: Valle => Quechua, Llano => Guarani, Sanchez Ramirez 0.270 Chontales 0.287 Altiplano => Aymara. Puerto Plata 0.289 Rivas 0.096 San Jose de Ocoa 0.314 Carazo 0.093 Duarte 0.370 Granada 0.098 South (2) Ma. T. Sanchez 0.352 North (0) Boaco 0.239 Espaillat 0.190 Rio San Juan 0.239 Santiago 0.200 RAAS 0.549 Salcedo 0.140 Esteli 0.082 La Vega 0.180 Chinandega 0.046 Monseñol Nouel 0.173 Leon 0.072 Northwest (3) Madriz 0.158 Managua 0.037 Region (0)

25
Appendix 3. Socioeconomic Characteristics by Country, Based on Census
Latest Census Year 2001 2000 1993 2002 2001 2002
BOLIVIA BRAZIL COLOMBIA DOM. REP. NICARAGUA PERU
Population 8,300,000 183,002,149 33,109,840 8,562,541 5,205,022 26,749,000 % Urban 62.0% 81.2% 71.0% 63.7% 57.5% 72.2% Gini 57.8 55.9 52.4 60.4 47.8 Employment Rate 64.3% 56.9% 57.3% 59.2% 68.2% Child Labor Rate 13.5% 5.7% 3.9% 4.2% 28.0% School Enrollment 89.5% 81.6% 85.8% 74.8% 90.0% % Female-headed households 29.8% 24.6% 28.2% 28.3% 16.7% Total Fertility Rate 2.5 2.9 2.5 3.2 3.0 Infant Mortality 4.4% 2.6% 4.0% 7.6% 5.4%