The Study of Aircraft Accidents Causes by Computer Simulations
10
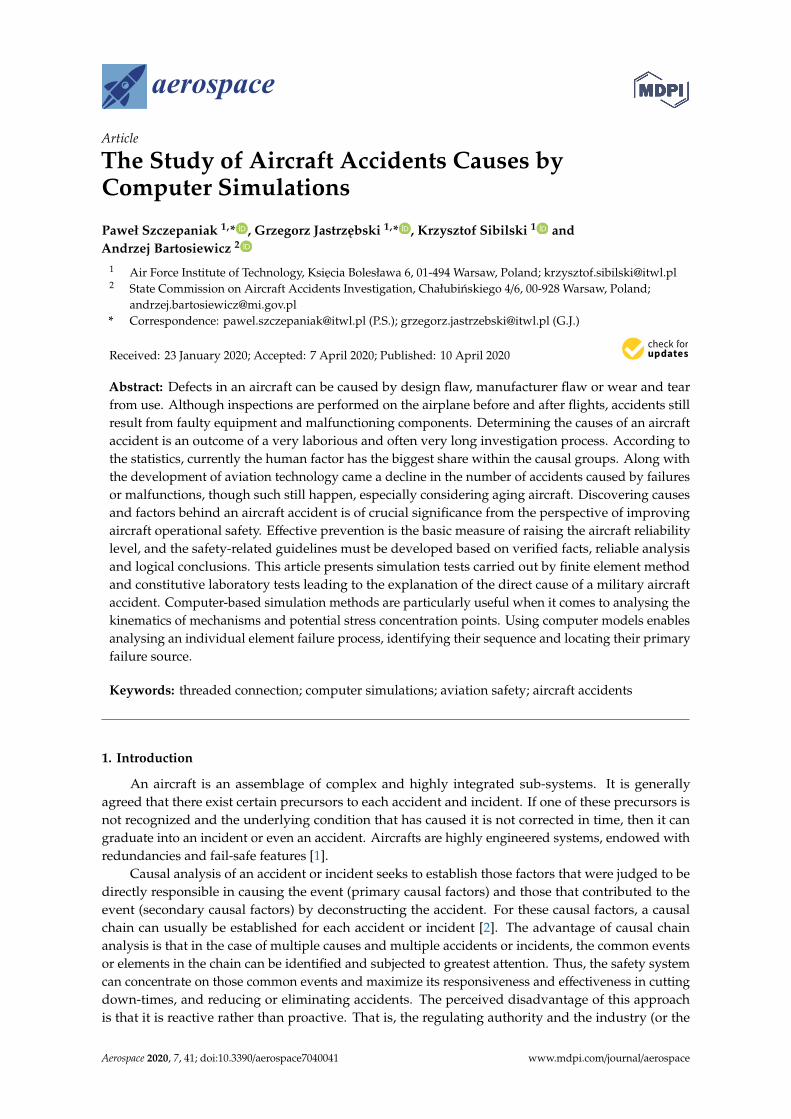
aerospace Article The Study of Aircraft Accidents Causes by Computer Simulations Pawel Szczepaniak 1, * , Grzegorz Jastrz ˛ ebski 1, * , Krzysztof Sibilski 1 and Andrzej Bartosiewicz 2 1 Air Force Institute of Technology, Ksi˛ ecia Boleslawa 6, 01-494 Warsaw, Poland; [email protected] 2 State Commission on Aircraft Accidents Investigation, Chalubi ´ nskiego 4/6, 00-928 Warsaw, Poland; [email protected] * Correspondence: [email protected] (P.S.); [email protected] (G.J.) Received: 23 January 2020; Accepted: 7 April 2020; Published: 10 April 2020 Abstract: Defects in an aircraft can be caused by design flaw, manufacturer flaw or wear and tear from use. Although inspections are performed on the airplane before and after flights, accidents still result from faulty equipment and malfunctioning components. Determining the causes of an aircraft accident is an outcome of a very laborious and often very long investigation process. According to the statistics, currently the human factor has the biggest share within the causal groups. Along with the development of aviation technology came a decline in the number of accidents caused by failures or malfunctions, though such still happen, especially considering aging aircraft. Discovering causes and factors behind an aircraft accident is of crucial significance from the perspective of improving aircraft operational safety. Effective prevention is the basic measure of raising the aircraft reliability level, and the safety-related guidelines must be developed based on verified facts, reliable analysis and logical conclusions. This article presents simulation tests carried out by finite element method and constitutive laboratory tests leading to the explanation of the direct cause of a military aircraft accident. Computer-based simulation methods are particularly useful when it comes to analysing the kinematics of mechanisms and potential stress concentration points. Using computer models enables analysing an individual element failure process, identifying their sequence and locating their primary failure source. Keywords: threaded connection; computer simulations; aviation safety; aircraft accidents 1. Introduction An aircraft is an assemblage of complex and highly integrated sub-systems. It is generally agreed that there exist certain precursors to each accident and incident. If one of these precursors is not recognized and the underlying condition that has caused it is not corrected in time, then it can graduate into an incident or even an accident. Aircrafts are highly engineered systems, endowed with redundancies and fail-safe features [1]. Causal analysis of an accident or incident seeks to establish those factors that were judged to be directly responsible in causing the event (primary causal factors) and those that contributed to the event (secondary causal factors) by deconstructing the accident. For these causal factors, a causal chain can usually be established for each accident or incident [2]. The advantage of causal chain analysis is that in the case of multiple causes and multiple accidents or incidents, the common events or elements in the chain can be identified and subjected to greatest attention. Thus, the safety system can concentrate on those common events and maximize its responsiveness and effectiveness in cutting down-times, and reducing or eliminating accidents. The perceived disadvantage of this approach is that it is reactive rather than proactive. That is, the regulating authority and the industry (or the Aerospace 2020, 7, 41; doi:10.3390/aerospace7040041 www.mdpi.com/journal/aerospace
-
Upload
khangminh22 -
Category
Documents
-
view
0 -
download
0
Transcript of The Study of Aircraft Accidents Causes by Computer Simulations
aerospace
Article
The Study of Aircraft Accidents Causes byComputer Simulations
Paweł Szczepaniak 1,* , Grzegorz Jastrzebski 1,* , Krzysztof Sibilski 1 andAndrzej Bartosiewicz 2
1 Air Force Institute of Technology, Ksiecia Bolesława 6, 01-494 Warsaw, Poland; [email protected] State Commission on Aircraft Accidents Investigation, Chałubinskiego 4/6, 00-928 Warsaw, Poland;
[email protected]* Correspondence: [email protected] (P.S.); [email protected] (G.J.)
Received: 23 January 2020; Accepted: 7 April 2020; Published: 10 April 2020�����������������
Abstract: Defects in an aircraft can be caused by design flaw, manufacturer flaw or wear and tearfrom use. Although inspections are performed on the airplane before and after flights, accidents stillresult from faulty equipment and malfunctioning components. Determining the causes of an aircraftaccident is an outcome of a very laborious and often very long investigation process. According tothe statistics, currently the human factor has the biggest share within the causal groups. Along withthe development of aviation technology came a decline in the number of accidents caused by failuresor malfunctions, though such still happen, especially considering aging aircraft. Discovering causesand factors behind an aircraft accident is of crucial significance from the perspective of improvingaircraft operational safety. Effective prevention is the basic measure of raising the aircraft reliabilitylevel, and the safety-related guidelines must be developed based on verified facts, reliable analysisand logical conclusions. This article presents simulation tests carried out by finite element methodand constitutive laboratory tests leading to the explanation of the direct cause of a military aircraftaccident. Computer-based simulation methods are particularly useful when it comes to analysing thekinematics of mechanisms and potential stress concentration points. Using computer models enablesanalysing an individual element failure process, identifying their sequence and locating their primaryfailure source.
Keywords: threaded connection; computer simulations; aviation safety; aircraft accidents
1. Introduction
An aircraft is an assemblage of complex and highly integrated sub-systems. It is generallyagreed that there exist certain precursors to each accident and incident. If one of these precursors isnot recognized and the underlying condition that has caused it is not corrected in time, then it cangraduate into an incident or even an accident. Aircrafts are highly engineered systems, endowed withredundancies and fail-safe features [1].
Causal analysis of an accident or incident seeks to establish those factors that were judged to bedirectly responsible in causing the event (primary causal factors) and those that contributed to theevent (secondary causal factors) by deconstructing the accident. For these causal factors, a causalchain can usually be established for each accident or incident [2]. The advantage of causal chainanalysis is that in the case of multiple causes and multiple accidents or incidents, the common eventsor elements in the chain can be identified and subjected to greatest attention. Thus, the safety systemcan concentrate on those common events and maximize its responsiveness and effectiveness in cuttingdown-times, and reducing or eliminating accidents. The perceived disadvantage of this approachis that it is reactive rather than proactive. That is, the regulating authority and the industry (or the
Aerospace 2020, 7, 41; doi:10.3390/aerospace7040041 www.mdpi.com/journal/aerospace
Aerospace 2020, 7, 41 2 of 10
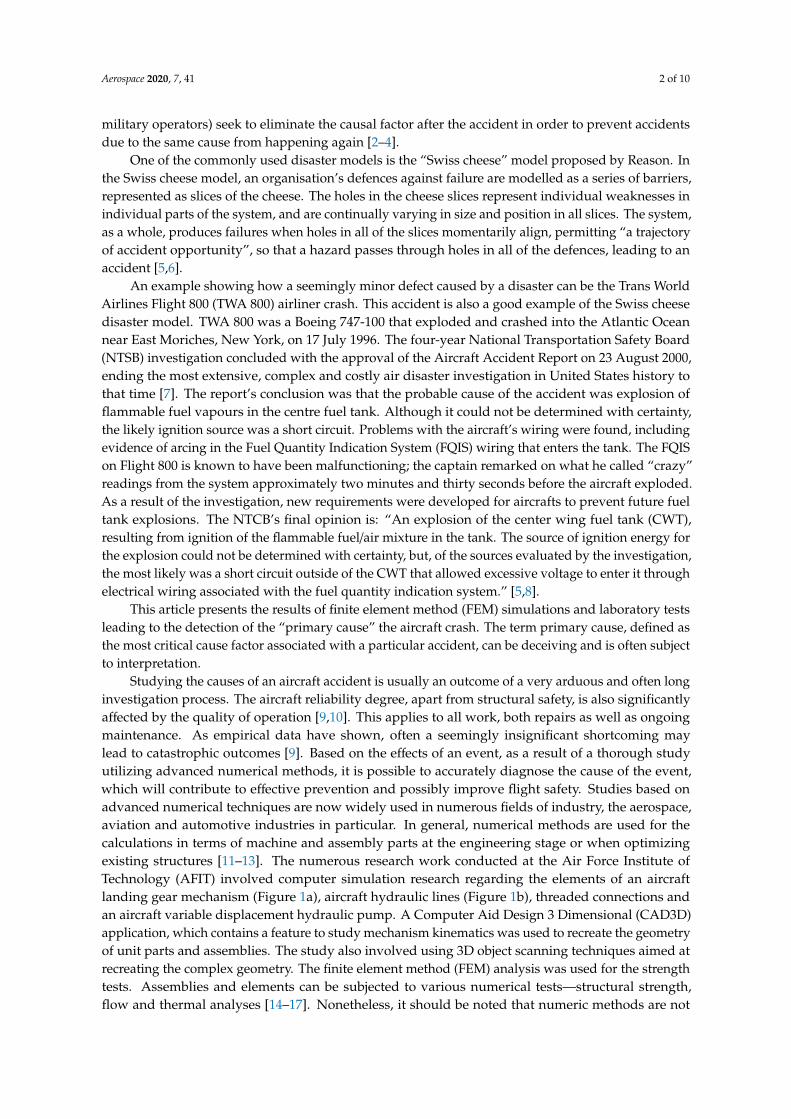
military operators) seek to eliminate the causal factor after the accident in order to prevent accidentsdue to the same cause from happening again [2–4].
One of the commonly used disaster models is the “Swiss cheese” model proposed by Reason. Inthe Swiss cheese model, an organisation’s defences against failure are modelled as a series of barriers,represented as slices of the cheese. The holes in the cheese slices represent individual weaknesses inindividual parts of the system, and are continually varying in size and position in all slices. The system,as a whole, produces failures when holes in all of the slices momentarily align, permitting “a trajectoryof accident opportunity”, so that a hazard passes through holes in all of the defences, leading to anaccident [5,6].
An example showing how a seemingly minor defect caused by a disaster can be the Trans WorldAirlines Flight 800 (TWA 800) airliner crash. This accident is also a good example of the Swiss cheesedisaster model. TWA 800 was a Boeing 747-100 that exploded and crashed into the Atlantic Oceannear East Moriches, New York, on 17 July 1996. The four-year National Transportation Safety Board(NTSB) investigation concluded with the approval of the Aircraft Accident Report on 23 August 2000,ending the most extensive, complex and costly air disaster investigation in United States history tothat time [7]. The report’s conclusion was that the probable cause of the accident was explosion offlammable fuel vapours in the centre fuel tank. Although it could not be determined with certainty,the likely ignition source was a short circuit. Problems with the aircraft’s wiring were found, includingevidence of arcing in the Fuel Quantity Indication System (FQIS) wiring that enters the tank. The FQISon Flight 800 is known to have been malfunctioning; the captain remarked on what he called “crazy”readings from the system approximately two minutes and thirty seconds before the aircraft exploded.As a result of the investigation, new requirements were developed for aircrafts to prevent future fueltank explosions. The NTCB’s final opinion is: “An explosion of the center wing fuel tank (CWT),resulting from ignition of the flammable fuel/air mixture in the tank. The source of ignition energy forthe explosion could not be determined with certainty, but, of the sources evaluated by the investigation,the most likely was a short circuit outside of the CWT that allowed excessive voltage to enter it throughelectrical wiring associated with the fuel quantity indication system.” [5,8].
This article presents the results of finite element method (FEM) simulations and laboratory testsleading to the detection of the “primary cause” the aircraft crash. The term primary cause, defined asthe most critical cause factor associated with a particular accident, can be deceiving and is often subjectto interpretation.
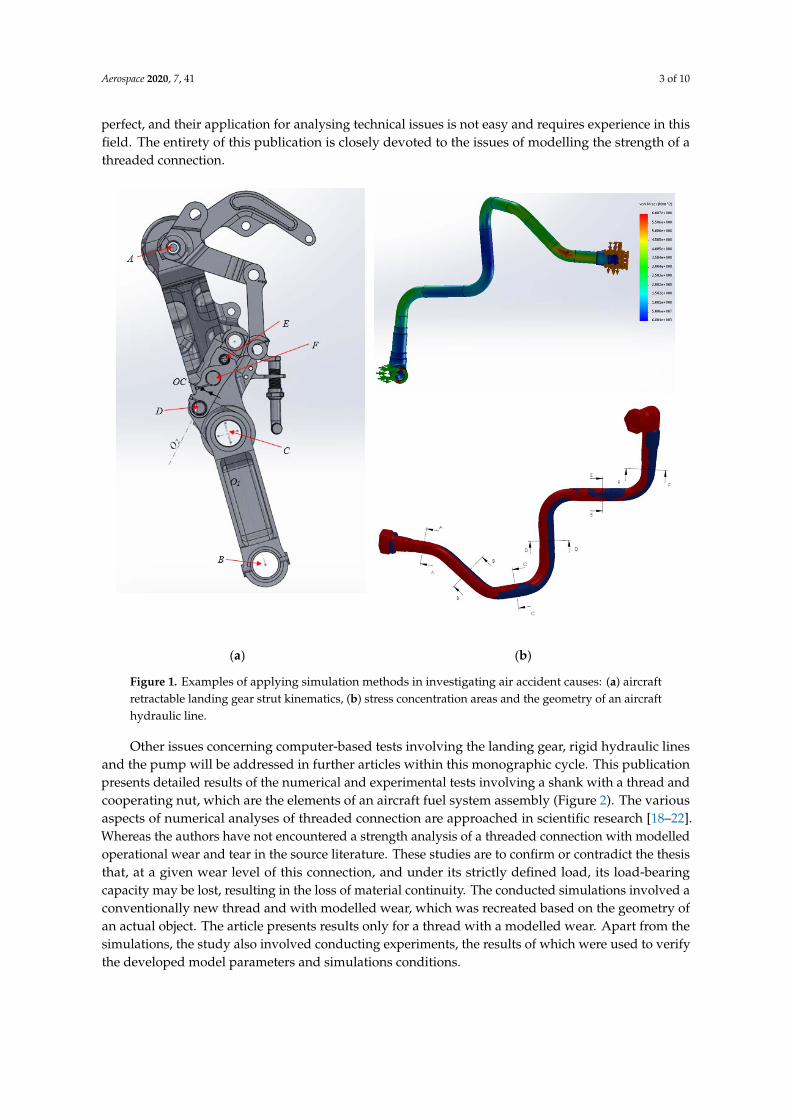
Studying the causes of an aircraft accident is usually an outcome of a very arduous and often longinvestigation process. The aircraft reliability degree, apart from structural safety, is also significantlyaffected by the quality of operation [9,10]. This applies to all work, both repairs as well as ongoingmaintenance. As empirical data have shown, often a seemingly insignificant shortcoming maylead to catastrophic outcomes [9]. Based on the effects of an event, as a result of a thorough studyutilizing advanced numerical methods, it is possible to accurately diagnose the cause of the event,which will contribute to effective prevention and possibly improve flight safety. Studies based onadvanced numerical techniques are now widely used in numerous fields of industry, the aerospace,aviation and automotive industries in particular. In general, numerical methods are used for thecalculations in terms of machine and assembly parts at the engineering stage or when optimizingexisting structures [11–13]. The numerous research work conducted at the Air Force Institute ofTechnology (AFIT) involved computer simulation research regarding the elements of an aircraftlanding gear mechanism (Figure 1a), aircraft hydraulic lines (Figure 1b), threaded connections andan aircraft variable displacement hydraulic pump. A Computer Aid Design 3 Dimensional (CAD3D)application, which contains a feature to study mechanism kinematics was used to recreate the geometryof unit parts and assemblies. The study also involved using 3D object scanning techniques aimed atrecreating the complex geometry. The finite element method (FEM) analysis was used for the strengthtests. Assemblies and elements can be subjected to various numerical tests—structural strength,flow and thermal analyses [14–17]. Nonetheless, it should be noted that numeric methods are not
Aerospace 2020, 7, 41 3 of 10
perfect, and their application for analysing technical issues is not easy and requires experience in thisfield. The entirety of this publication is closely devoted to the issues of modelling the strength of athreaded connection.
Aerospace 2020, 7, x FOR PEER REVIEW 3 of 10
in this field. The entirety of this publication is closely devoted to the issues of modelling the strength of a threaded connection.
(a) (b)
Figure 1. Examples of applying simulation methods in investigating air accident causes: (a) aircraft retractable landing gear strut kinematics, (b) stress concentration areas and the geometry of an aircraft hydraulic line.
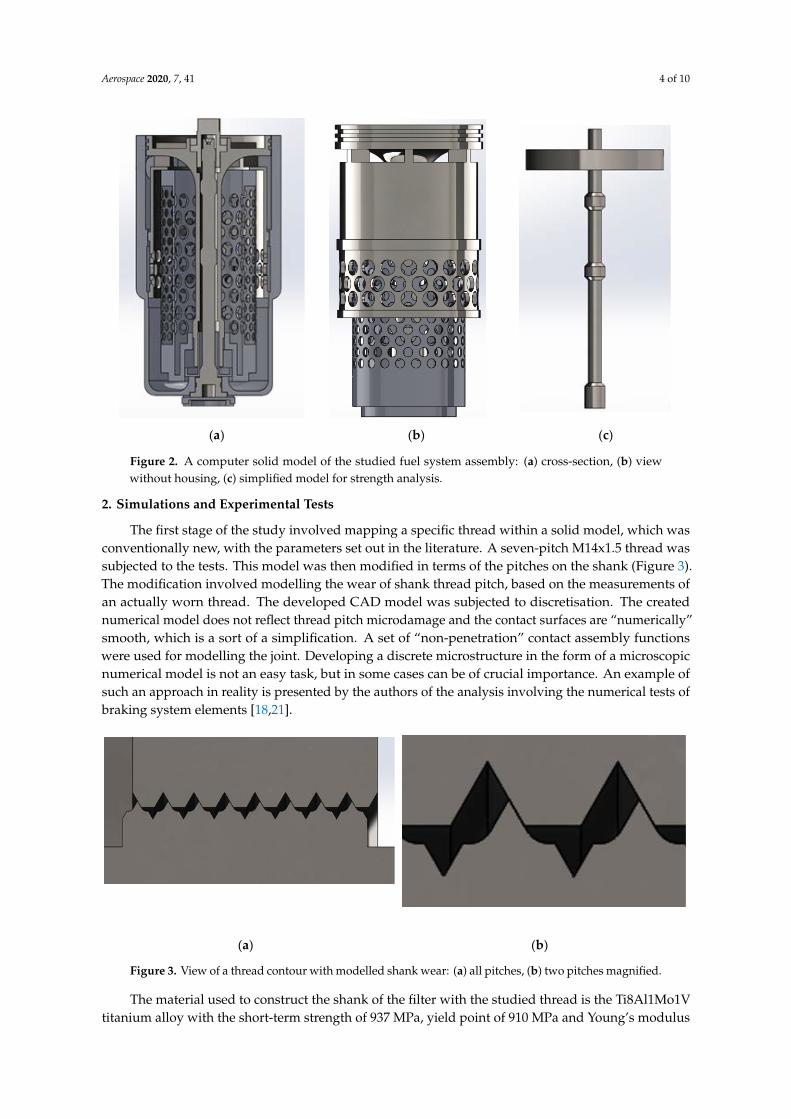
Other issues concerning computer-based tests involving the landing gear, rigid hydraulic lines and the pump will be addressed in further articles within this monographic cycle. This publication presents detailed results of the numerical and experimental tests involving a shank with a thread and cooperating nut, which are the elements of an aircraft fuel system assembly (Figure 2). The various aspects of numerical analyses of threaded connection are approached in scientific research [18–22]. Whereas the authors have not encountered a strength analysis of a threaded connection with modelled operational wear and tear in the source literature. These studies are to confirm or contradict the thesis that, at a given wear level of this connection, and under its strictly defined load, its load-bearing capacity may be lost, resulting in the loss of material continuity. The conducted simulations involved a conventionally new thread and with modelled wear, which was recreated based on the geometry of an actual object. The article presents results only for a thread with a modelled wear. Apart from the simulations, the study also involved conducting experiments, the results of which were used to verify the developed model parameters and simulations conditions.
Figure 1. Examples of applying simulation methods in investigating air accident causes: (a) aircraftretractable landing gear strut kinematics, (b) stress concentration areas and the geometry of an aircrafthydraulic line.
Other issues concerning computer-based tests involving the landing gear, rigid hydraulic linesand the pump will be addressed in further articles within this monographic cycle. This publicationpresents detailed results of the numerical and experimental tests involving a shank with a thread andcooperating nut, which are the elements of an aircraft fuel system assembly (Figure 2). The variousaspects of numerical analyses of threaded connection are approached in scientific research [18–22].Whereas the authors have not encountered a strength analysis of a threaded connection with modelledoperational wear and tear in the source literature. These studies are to confirm or contradict the thesisthat, at a given wear level of this connection, and under its strictly defined load, its load-bearingcapacity may be lost, resulting in the loss of material continuity. The conducted simulations involved aconventionally new thread and with modelled wear, which was recreated based on the geometry ofan actual object. The article presents results only for a thread with a modelled wear. Apart from thesimulations, the study also involved conducting experiments, the results of which were used to verifythe developed model parameters and simulations conditions.
Aerospace 2020, 7, 41 4 of 10Aerospace 2020, 7, x FOR PEER REVIEW 4 of 10
(a) (b) (c)
Figure 2. A computer solid model of the studied fuel system assembly: (a) cross-section, (b) view without housing, (c) simplified model for strength analysis.
2. Simulations and Experimental Tests
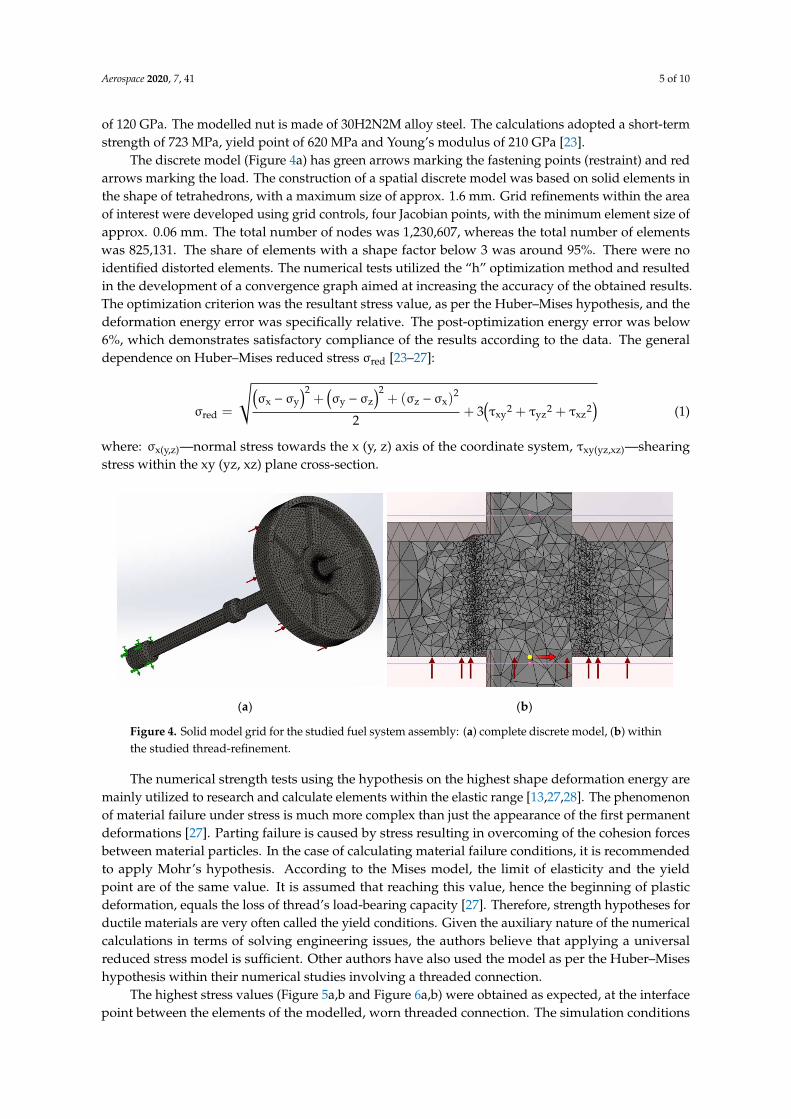
The first stage of the study involved mapping a specific thread within a solid model, which was conventionally new, with the parameters set out in the literature. A seven-pitch M14x1.5 thread was subjected to the tests. This model was then modified in terms of the pitches on the shank (Figure 3). The modification involved modelling the wear of shank thread pitch, based on the measurements of an actually worn thread. The developed CAD model was subjected to discretisation. The created numerical model does not reflect thread pitch microdamage and the contact surfaces are “numerically” smooth, which is a sort of a simplification. A set of “non-penetration” contact assembly functions were used for modelling the joint. Developing a discrete microstructure in the form of a microscopic numerical model is not an easy task, but in some cases can be of crucial importance. An example of such an approach in reality is presented by the authors of the analysis involving the numerical tests of braking system elements [18,21].
(a) (b)
Figure 3. View of a thread contour with modelled shank wear: (a) all pitches, (b) two pitches magnified.
The material used to construct the shank of the filter with the studied thread is the Ti8Al1Mo1V titanium alloy with the short-term strength of 937 MPa, yield point of 910 MPa and Young’s modulus
Figure 2. A computer solid model of the studied fuel system assembly: (a) cross-section, (b) viewwithout housing, (c) simplified model for strength analysis.
2. Simulations and Experimental Tests
The first stage of the study involved mapping a specific thread within a solid model, which wasconventionally new, with the parameters set out in the literature. A seven-pitch M14x1.5 thread wassubjected to the tests. This model was then modified in terms of the pitches on the shank (Figure 3).The modification involved modelling the wear of shank thread pitch, based on the measurements ofan actually worn thread. The developed CAD model was subjected to discretisation. The creatednumerical model does not reflect thread pitch microdamage and the contact surfaces are “numerically”smooth, which is a sort of a simplification. A set of “non-penetration” contact assembly functionswere used for modelling the joint. Developing a discrete microstructure in the form of a microscopicnumerical model is not an easy task, but in some cases can be of crucial importance. An example ofsuch an approach in reality is presented by the authors of the analysis involving the numerical tests ofbraking system elements [18,21].
Aerospace 2020, 7, x FOR PEER REVIEW 4 of 10
(a) (b) (c)
Figure 2. A computer solid model of the studied fuel system assembly: (a) cross-section, (b) view without housing, (c) simplified model for strength analysis.
2. Simulations and Experimental Tests
The first stage of the study involved mapping a specific thread within a solid model, which was conventionally new, with the parameters set out in the literature. A seven-pitch M14x1.5 thread was subjected to the tests. This model was then modified in terms of the pitches on the shank (Figure 3). The modification involved modelling the wear of shank thread pitch, based on the measurements of an actually worn thread. The developed CAD model was subjected to discretisation. The created numerical model does not reflect thread pitch microdamage and the contact surfaces are “numerically” smooth, which is a sort of a simplification. A set of “non-penetration” contact assembly functions were used for modelling the joint. Developing a discrete microstructure in the form of a microscopic numerical model is not an easy task, but in some cases can be of crucial importance. An example of such an approach in reality is presented by the authors of the analysis involving the numerical tests of braking system elements [18,21].
(a) (b)
Figure 3. View of a thread contour with modelled shank wear: (a) all pitches, (b) two pitches magnified.
The material used to construct the shank of the filter with the studied thread is the Ti8Al1Mo1V titanium alloy with the short-term strength of 937 MPa, yield point of 910 MPa and Young’s modulus
Figure 3. View of a thread contour with modelled shank wear: (a) all pitches, (b) two pitches magnified.
The material used to construct the shank of the filter with the studied thread is the Ti8Al1Mo1Vtitanium alloy with the short-term strength of 937 MPa, yield point of 910 MPa and Young’s modulus
Aerospace 2020, 7, 41 5 of 10
of 120 GPa. The modelled nut is made of 30H2N2M alloy steel. The calculations adopted a short-termstrength of 723 MPa, yield point of 620 MPa and Young’s modulus of 210 GPa [23].
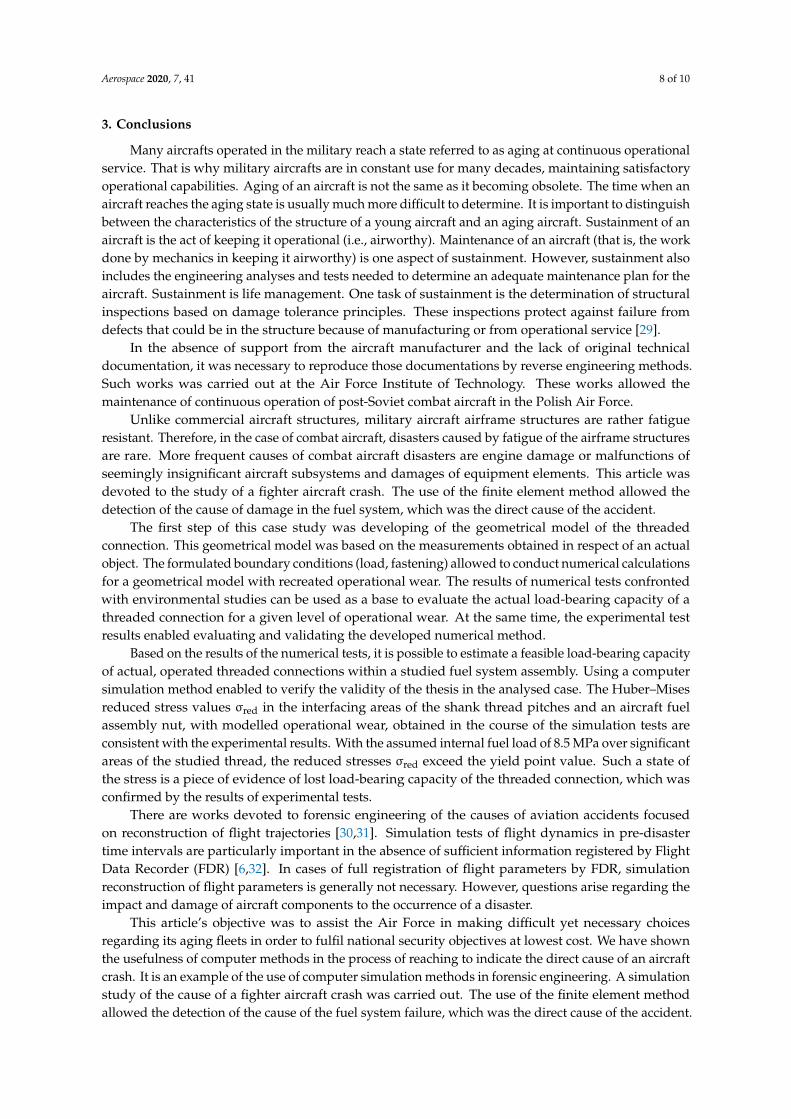
The discrete model (Figure 4a) has green arrows marking the fastening points (restraint) and redarrows marking the load. The construction of a spatial discrete model was based on solid elements inthe shape of tetrahedrons, with a maximum size of approx. 1.6 mm. Grid refinements within the areaof interest were developed using grid controls, four Jacobian points, with the minimum element size ofapprox. 0.06 mm. The total number of nodes was 1,230,607, whereas the total number of elementswas 825,131. The share of elements with a shape factor below 3 was around 95%. There were noidentified distorted elements. The numerical tests utilized the “h” optimization method and resultedin the development of a convergence graph aimed at increasing the accuracy of the obtained results.The optimization criterion was the resultant stress value, as per the Huber–Mises hypothesis, and thedeformation energy error was specifically relative. The post-optimization energy error was below6%, which demonstrates satisfactory compliance of the results according to the data. The generaldependence on Huber–Mises reduced stress σred [23–27]:
σred =
√(σx − σy
)2+
(σy − σz
)2+ (σz − σx)
2
2+ 3
(τxy2 + τyz2 + τxz2
)(1)
where: σx(y,z)—normal stress towards the x (y, z) axis of the coordinate system, τxy(yz,xz)—shearingstress within the xy (yz, xz) plane cross-section.
Aerospace 2020, 7, x FOR PEER REVIEW 5 of 10
of 120 GPa. The modelled nut is made of 30H2N2M alloy steel. The calculations adopted a short-term strength of 723 MPa, yield point of 620 MPa and Young’s modulus of 210 GPa [23].
The discrete model (Figure 4a) has green arrows marking the fastening points (restraint) and red arrows marking the load. The construction of a spatial discrete model was based on solid elements in the shape of tetrahedrons, with a maximum size of approx. 1.6 mm. Grid refinements within the area of interest were developed using grid controls, four Jacobian points, with the minimum element size of approx. 0.06 mm. The total number of nodes was 1,230,607, whereas the total number of elements was 825,131. The share of elements with a shape factor below 3 was around 95%. There were no identified distorted elements. The numerical tests utilized the “h” optimization method and resulted in the development of a convergence graph aimed at increasing the accuracy of the obtained results. The optimization criterion was the resultant stress value, as per the Huber–Mises hypothesis, and the deformation energy error was specifically relative. The post-optimization energy error was below 6%, which demonstrates satisfactory compliance of the results according to the data. The general dependence on Huber–Mises reduced stress σred [23–27]:
σred = ��σx − σy�2
+ �σy − σz�2
+ (σz − σx)2
2+ 3�τxy2 + τyz2 + τxz2�
(1)
where: σx(y,z)—normal stress towards the x (y, z) axis of the coordinate system, τxy(yz,xz)—shearing stress within the xy (yz, xz) plane cross-section.
(a) (b)
Figure 4. Solid model grid for the studied fuel system assembly: (a) complete discrete model, (b) within the studied thread-refinement.
The numerical strength tests using the hypothesis on the highest shape deformation energy are mainly utilized to research and calculate elements within the elastic range [13,27,28]. The phenomenon of material failure under stress is much more complex than just the appearance of the first permanent deformations [27]. Parting failure is caused by stress resulting in overcoming of the cohesion forces between material particles. In the case of calculating material failure conditions, it is recommended to apply Mohr’s hypothesis. According to the Mises model, the limit of elasticity and the yield point are of the same value. It is assumed that reaching this value, hence the beginning of plastic deformation, equals the loss of thread’s load-bearing capacity [27]. Therefore, strength hypotheses for ductile materials are very often called the yield conditions. Given the auxiliary nature of the numerical calculations in terms of solving engineering issues, the authors believe that applying a universal reduced stress model is sufficient. Other authors have also used the model as per the Huber–Mises hypothesis within their numerical studies involving a threaded connection.
The highest stress values (Figures 5a,b and 6a,b) were obtained as expected, at the interface point between the elements of the modelled, worn threaded connection. The simulation conditions
Figure 4. Solid model grid for the studied fuel system assembly: (a) complete discrete model, (b) withinthe studied thread-refinement.
The numerical strength tests using the hypothesis on the highest shape deformation energy aremainly utilized to research and calculate elements within the elastic range [13,27,28]. The phenomenonof material failure under stress is much more complex than just the appearance of the first permanentdeformations [27]. Parting failure is caused by stress resulting in overcoming of the cohesion forcesbetween material particles. In the case of calculating material failure conditions, it is recommendedto apply Mohr’s hypothesis. According to the Mises model, the limit of elasticity and the yieldpoint are of the same value. It is assumed that reaching this value, hence the beginning of plasticdeformation, equals the loss of thread’s load-bearing capacity [27]. Therefore, strength hypotheses forductile materials are very often called the yield conditions. Given the auxiliary nature of the numericalcalculations in terms of solving engineering issues, the authors believe that applying a universalreduced stress model is sufficient. Other authors have also used the model as per the Huber–Miseshypothesis within their numerical studies involving a threaded connection.
The highest stress values (Figure 5a,b and Figure 6a,b) were obtained as expected, at the interfacepoint between the elements of the modelled, worn threaded connection. The simulation conditions

Aerospace 2020, 7, 41 6 of 10
assumed loading the filter cover element with a static pressure of 8.5 MPa. Under such load, very largeareas of the modelled thread, the first three pitches experience significantly exceeded yield point value.
Aerospace 2020, 7, x FOR PEER REVIEW 6 of 10
assumed loading the filter cover element with a static pressure of 8.5 MPa. Under such load, very large areas of the modelled thread, the first three pitches experience significantly exceeded yield point value.
(a) (b)
Figure 5. The stress charts for the studied shank thread with simulated wear and experimental failure load: (a) graph cross-section with a grid (first 2 are the most loaded pitches), (b) separated area with a clearly exceeded material yield point.
(a) (b)
Figure 6. The outcomes of the optimization algorithm as per method h: (a) convergence graph, (b) reduced stress distribution, cross-section, magnification, with a grid for the first thread pitch.
Such a situation may confirm the load capacity loss of a thread with such material properties, geometry, diagram and load value. The results of numerical tests enabled also to determine the features of the experimental test bench. The experimental tests were conducted for two threaded connections with a similar operational wear level. It has been developed test methodology, using a specially designed and constructed test bench (diagram—Figure 7). The test liquid, with a similar pressure value, resulted in the loss of the threaded connection’s load capacity and, ultimately, in the “shearing” of thread pitches and the loss of tightness within the studied assembly. The experimental test results are shown in Figure 8.
Figure 5. The stress charts for the studied shank thread with simulated wear and experimental failureload: (a) graph cross-section with a grid (first 2 are the most loaded pitches), (b) separated area with aclearly exceeded material yield point.
Aerospace 2020, 7, x FOR PEER REVIEW 6 of 10
assumed loading the filter cover element with a static pressure of 8.5 MPa. Under such load, very large areas of the modelled thread, the first three pitches experience significantly exceeded yield point value.
(a) (b)
Figure 5. The stress charts for the studied shank thread with simulated wear and experimental failure load: (a) graph cross-section with a grid (first 2 are the most loaded pitches), (b) separated area with a clearly exceeded material yield point.
(a) (b)
Figure 6. The outcomes of the optimization algorithm as per method h: (a) convergence graph, (b) reduced stress distribution, cross-section, magnification, with a grid for the first thread pitch.
Such a situation may confirm the load capacity loss of a thread with such material properties, geometry, diagram and load value. The results of numerical tests enabled also to determine the features of the experimental test bench. The experimental tests were conducted for two threaded connections with a similar operational wear level. It has been developed test methodology, using a specially designed and constructed test bench (diagram—Figure 7). The test liquid, with a similar pressure value, resulted in the loss of the threaded connection’s load capacity and, ultimately, in the “shearing” of thread pitches and the loss of tightness within the studied assembly. The experimental test results are shown in Figure 8.
Figure 6. The outcomes of the optimization algorithm as per method h: (a) convergence graph,(b) reduced stress distribution, cross-section, magnification, with a grid for the first thread pitch.
Such a situation may confirm the load capacity loss of a thread with such material properties,geometry, diagram and load value. The results of numerical tests enabled also to determine the featuresof the experimental test bench. The experimental tests were conducted for two threaded connectionswith a similar operational wear level. It has been developed test methodology, using a speciallydesigned and constructed test bench (diagram—Figure 7). The test liquid, with a similar pressurevalue, resulted in the loss of the threaded connection’s load capacity and, ultimately, in the “shearing”of thread pitches and the loss of tightness within the studied assembly. The experimental test resultsare shown in Figure 8.

Aerospace 2020, 7, 41 7 of 10Aerospace 2020, 7, x FOR PEER REVIEW 7 of 10
Figure 7. Diagram of a test bench for static loading of an aircraft fuel filter assembly: 1—filter, 2—NC filter body, 3—pressure sensors, 4—one-way valve, 5—manual hydraulic pump, 6—analogue signal translator, 7—computer.
The obtained value of the threaded connection destructive force is 84 and 86 kN (Figure 8) for shank No. 1 and 2, respectively, which corresponds to the value of the hydrostatic pressure inside the assembly housing at a level of 8.2–8.3 MPa. Shank elongation confirmed by experimental tests, relative to the tensile force (increase of internal pressure within the fuel assembly) is of linear and flexible character, in accordance with Hooke’s law [27]—R2 coefficient of approximately 0.99 and 1.00.
Figure 8. The results of experimental tests involving rupturing threads of two shanks.
Shank elongation Δl [mm]
Shan
k te
nsile
forc
e F r
[kN
]
Figure 7. Diagram of a test bench for static loading of an aircraft fuel filter assembly: 1—filter, 2—NCfilter body, 3—pressure sensors, 4—one-way valve, 5—manual hydraulic pump, 6—analogue signaltranslator, 7—computer.
Aerospace 2020, 7, x FOR PEER REVIEW 7 of 10
Figure 7. Diagram of a test bench for static loading of an aircraft fuel filter assembly: 1—filter, 2—NC filter body, 3—pressure sensors, 4—one-way valve, 5—manual hydraulic pump, 6—analogue signal translator, 7—computer.
The obtained value of the threaded connection destructive force is 84 and 86 kN (Figure 8) for shank No. 1 and 2, respectively, which corresponds to the value of the hydrostatic pressure inside the assembly housing at a level of 8.2–8.3 MPa. Shank elongation confirmed by experimental tests, relative to the tensile force (increase of internal pressure within the fuel assembly) is of linear and flexible character, in accordance with Hooke’s law [27]—R2 coefficient of approximately 0.99 and 1.00.
Figure 8. The results of experimental tests involving rupturing threads of two shanks.
Shank elongation Δl [mm]
Shan
k te
nsile
forc
e F r
[kN
]
Figure 8. The results of experimental tests involving rupturing threads of two shanks.
The obtained value of the threaded connection destructive force is 84 and 86 kN (Figure 8) forshank No. 1 and 2, respectively, which corresponds to the value of the hydrostatic pressure insidethe assembly housing at a level of 8.2–8.3 MPa. Shank elongation confirmed by experimental tests,relative to the tensile force (increase of internal pressure within the fuel assembly) is of linear andflexible character, in accordance with Hooke’s law [27]—R2 coefficient of approximately 0.99 and 1.00.
With the elongation value within the elastic range at a level of 3.4 mm, there is a sudden loss ofthread load-bearing capacity, pitch rupturing and a simultaneous loss of assembly tightness.
Aerospace 2020, 7, 41 8 of 10
3. Conclusions
Many aircrafts operated in the military reach a state referred to as aging at continuous operationalservice. That is why military aircrafts are in constant use for many decades, maintaining satisfactoryoperational capabilities. Aging of an aircraft is not the same as it becoming obsolete. The time when anaircraft reaches the aging state is usually much more difficult to determine. It is important to distinguishbetween the characteristics of the structure of a young aircraft and an aging aircraft. Sustainment of anaircraft is the act of keeping it operational (i.e., airworthy). Maintenance of an aircraft (that is, the workdone by mechanics in keeping it airworthy) is one aspect of sustainment. However, sustainment alsoincludes the engineering analyses and tests needed to determine an adequate maintenance plan for theaircraft. Sustainment is life management. One task of sustainment is the determination of structuralinspections based on damage tolerance principles. These inspections protect against failure fromdefects that could be in the structure because of manufacturing or from operational service [29].
In the absence of support from the aircraft manufacturer and the lack of original technicaldocumentation, it was necessary to reproduce those documentations by reverse engineering methods.Such works was carried out at the Air Force Institute of Technology. These works allowed themaintenance of continuous operation of post-Soviet combat aircraft in the Polish Air Force.
Unlike commercial aircraft structures, military aircraft airframe structures are rather fatigueresistant. Therefore, in the case of combat aircraft, disasters caused by fatigue of the airframe structuresare rare. More frequent causes of combat aircraft disasters are engine damage or malfunctions ofseemingly insignificant aircraft subsystems and damages of equipment elements. This article wasdevoted to the study of a fighter aircraft crash. The use of the finite element method allowed thedetection of the cause of damage in the fuel system, which was the direct cause of the accident.
The first step of this case study was developing of the geometrical model of the threadedconnection. This geometrical model was based on the measurements obtained in respect of an actualobject. The formulated boundary conditions (load, fastening) allowed to conduct numerical calculationsfor a geometrical model with recreated operational wear. The results of numerical tests confrontedwith environmental studies can be used as a base to evaluate the actual load-bearing capacity of athreaded connection for a given level of operational wear. At the same time, the experimental testresults enabled evaluating and validating the developed numerical method.
Based on the results of the numerical tests, it is possible to estimate a feasible load-bearing capacityof actual, operated threaded connections within a studied fuel system assembly. Using a computersimulation method enabled to verify the validity of the thesis in the analysed case. The Huber–Misesreduced stress values σred in the interfacing areas of the shank thread pitches and an aircraft fuelassembly nut, with modelled operational wear, obtained in the course of the simulation tests areconsistent with the experimental results. With the assumed internal fuel load of 8.5 MPa over significantareas of the studied thread, the reduced stresses σred exceed the yield point value. Such a state ofthe stress is a piece of evidence of lost load-bearing capacity of the threaded connection, which wasconfirmed by the results of experimental tests.
There are works devoted to forensic engineering of the causes of aviation accidents focusedon reconstruction of flight trajectories [30,31]. Simulation tests of flight dynamics in pre-disastertime intervals are particularly important in the absence of sufficient information registered by FlightData Recorder (FDR) [6,32]. In cases of full registration of flight parameters by FDR, simulationreconstruction of flight parameters is generally not necessary. However, questions arise regarding theimpact and damage of aircraft components to the occurrence of a disaster.
This article’s objective was to assist the Air Force in making difficult yet necessary choicesregarding its aging fleets in order to fulfil national security objectives at lowest cost. We have shownthe usefulness of computer methods in the process of reaching to indicate the direct cause of an aircraftcrash. It is an example of the use of computer simulation methods in forensic engineering. A simulationstudy of the cause of a fighter aircraft crash was carried out. The use of the finite element methodallowed the detection of the cause of the fuel system failure, which was the direct cause of the accident.

Aerospace 2020, 7, 41 9 of 10
Author Contributions: Conceptualization, P.S., A.B. and K.S.; methodology, P.S. and G.J.; software, P.S. and G.J.;validation, P.S., G.J. and A.B.; formal analysis, P.S. and K.S.; investigation, P.S., G.J., and A.B.; resources, P.S.; datacuration, P.S., G.J. and A.B.; writing—original draft preparation, P.S. and K.S.; writing—review and editing, K.S.;supervision, P.S. and K.S.; funding acquisition, P.S. All authors have read and agreed to the published version ofthe manuscript.
Funding: This research was internally funded by the Air Force Institute of Technology.
Conflicts of Interest: The authors declare no conflict of interest.
References
1. MacLean, L.; Richman, A.; Hudak, M. Failure Rates for Aging Aircraft. Safety 2018, 4, 7. [CrossRef]2. Sampath, S.G. Safety and Service Difficulty Reporting. In Aging Aircraft Fleets: Structural and Other Subsystem
Aspects; RTO Lecture Series 218, RTO-EN-015; Defense Technical Information Center: Fort Belvoir, VA,USA, 2000.
3. Masys, A. Aviation accident aetiology: Catastrophe theory perspective. Disaster Prev. Manag. 2004, 13, 33–38.[CrossRef]
4. Wood, R.H.; Sweginnis, R.W. Aircraft Accident Investigation, 2nd ed.; Endeavor Books: Casper, WY, USA, 2006.5. Bibel, G.D. Beyond the Black Box: The Forensics of Airplane Crashes; The John Hopkins University Press:
Baltimore, MA, USA, 2008; ISBN1 0801886317. ISBN2 9780801886317.6. Maryniak, J.; Lasek, M.; Sibilski, K.; Zyluk, A. Some Thoughts on Aircraft Accidents Reconstruction and
Simulation: A Forensic Engineering Case Studies (AIAA 2008-190 CP). In Proceedings of the 46th AIAAAerospace Sciences Meeting and Exhibit, Reno, NV, USA, 7–10 January 2008. [CrossRef]
7. Shepard, J.F. Learning from a tragedy: Explosions and flight 800. Eng. Sci. 1998, 61, 19–29, No 2.8. Anon. In-Flight Breakup Over the Atlantic Ocean Trans World Airlines Flight 800 Boeing 747-131, N93119 near
East Moriches, New York, July 17, 1996; Report No NTSB/AAR-00/03; National Transportation Safety Board:Washington, DC, USA, 2000.
9. Klich, E. Flight Safety; Łukasiewicz Institute for Sustainable Technologies Press: Radom, Poland, 2011;ISSN 978-83-7789-024-0. (In Polish)
10. Lasek, M.; Sibilski, K.; Zurek, J. Aviation accidents aetiology from catastrophe theory point of view, ICAS2010 proceedings Grant I. (ed.) CD-ROM. In Proceedings of the 27th Congress of the International Council ofthe Aeronautical Sciences, Nice, France, 19–24 September 2010; ICAS 2010-707TP. ISBN 978-0-9565333-0-2.Available online: http://www.icas.org/ICAS_ARCHIVE/ICAS2010/ABSTRACTS/707.HTM (accessed on7 April 2020).
11. Balac, M.; Grbovic, A.; Petrovic, A.; Popovic, V. FEM analysis of pressure vessel with an investigation ofcrack growth on cylindrical surface. Maint. Reliab. 2018, 20, 378–386. [CrossRef]
12. Chodurski, M.; Debski, H.; Samborski, S.; Teter, A. Numerical strength analysis of a supporting frame for auniversal head of a palletizing robot. Maint. Reliab. 2015, 17, 374–378. [CrossRef]
13. Debski, H.; Koszałka, G.; Ferdynus, M. The application of FEM in analysing the structure of a supportingframe in a trailer with variable operating parameters. Maint. Reliab. 2012, 2, 107–113. Available online:http://www.ein.org.pl/2012-02-03 (accessed on 7 April 2020).
14. Baranowski, P.; Damaziak, K.; Małachowski, J. Brake systems studies using numerical methods. Maint. Reliab.2013, 4, 337–342. Available online: http://ein.org.pl/2013-04-07 (accessed on 7 April 2020).
15. Lisowski, E.; Panek, M. CFD modeling of vane pump vanes operation. Maint. Reliab. 2004, 2, 36–41. Availableonline: http://www.ein.org.pl/2004-02-08 (accessed on 7 April 2020).
16. Lonkwic, P.; Rózyło, P.; Debski, H. Numerical and experimental tests of a progressive gripper structure usingthe finite element method. Maint. Reliab. 2015, 4, 544–550. [CrossRef]
17. López-Campos, J.A.; Segade, A.; Casarejos, E.; Fernández, J.R.; Vilán, J.A.; Izquierdo, P. Finite Element Studyof a Threaded Fastening: The Case of Surgical Screws in Bon. Symmetry 2018, 10, 335. [CrossRef]
18. Yu, Q.; Zhou, H.; Wang, L. Finite element analysis of relationship between tightening torque and initial loadof bolted connections. Adv. Mech. Eng. 2015, 7, 1–8. [CrossRef]
19. Kopecki, T.; Zacharzewski, J. Fatigue life and stress state analysis of cracked thin-walled plate under cyclesaxial tension. Maint. Reliab. 2006, 3, 19–26. Available online: https://www.ein.org.pl/ein/2006-03-0 (accessedon 7 April 2020).
Aerospace 2020, 7, 41 10 of 10
20. Kopey, B.; Kopey, V.; Lyskanych, M. Tool-joint thread modeling by finite element method. Drill. Oil Gas2005, 22, 201–204. Available online: http://journals.bg.agh.edu.pl/WIERTNICTWO/index.php?vol=2005-01(accessed on 7 April 2020).
21. Sun, Y.J.; Liao, R.D. The Effect of Helix on the Nonlinear Analysis of Threaded Connection. Adv. Mater. Res.2010, 148–149, 1741–1744. [CrossRef]
22. Wittenberghe, J.V.; De Baets, P.; De Waele, W. Modelling of preloaded threaded pipe connections.In Proceedings of the 8th National Congress on Theoretical and Applied Mechanics, Brussels, Belgium, 28–29May 2009; Available online: https://lib.ugent.be/catalog/pug01:673974 (accessed on 7 April 2020).
23. Dacko, M.; Borkowski, W.; Dobrocinski, S.; Niezgoda, T.; Wieczorek, M. Finite Element Method in StructuralMechanics; Arkady: Warszawa, Poland, 1994. (In Polish)
24. Gawecki, A. Mechanics of bar Structures and Materials; Poznan University of Technology Press: Poznan,Poland, 2003.
25. Loska, A. Remarks regarding the modelling of operating processes using scenario-based techniques. Maint.Reliab. 2012, 2, 92–98.
26. Markowski, T.; Mucha, J.; Witkowski, W. FEM analysis of C-fram rigidity in a device for manufacturingclinching joints. Maint. Reliab. 2013, 1, 51–57.
27. Brzoska, Z. Strength of Materials; PWN: Warsaw, Poland, 1972. (In Polish)28. Debski, H. Experimental and numerical studies involving post-critical behaviour of composite columns with
an omega cross-section. Maint. Reliab. 2013, 2, 106–110. Available online: http://www.ein.org.pl/2013-02-03(accessed on 7 April 2020).
29. Underwood, P.; Waterson, P. Systemic accident analysis: Examining the gap between research and practice.Accid. Anal. Prev. 2013, 55, 154–164. [CrossRef] [PubMed]
30. Calkins, D.E. Aircraft accident flight patch simulation and animation. J. Aircr. 1994, 31, 2. [CrossRef]31. Dietenberger, M.A.; Haines, P.A.; Luers, J.K. Reconstruction of Pan Am New Orleans accident. J. Aircr. 1985,
22, 8. [CrossRef]32. Sibilski, K. Some Thoughts on Mathematical Models for Aircraft Accidents Simulation. In Aviation Safety;
Soekha, H., Ed.; VSP Publishing Company: Utrecht, The Netherlands, 1997.
© 2020 by the authors. Licensee MDPI, Basel, Switzerland. This article is an open accessarticle distributed under the terms and conditions of the Creative Commons Attribution(CC BY) license (http://creativecommons.org/licenses/by/4.0/).