The structure-function relationship of the lung of the Australian ...
294
The Structure-Function Relationship of the Lung of the Australian Sea Liont Neophoc e clnerea by Anthony Nicholson B.V.Sc. A thesis submitted for the degree of Doctor of PhilosoPhY' Department of PathologY' UniversitY of Adelaide February 1984
-
Upload
khangminh22 -
Category
Documents
-
view
7 -
download
0
Transcript of The structure-function relationship of the lung of the Australian ...
The Structure-Function Relationship of the Lung
of the Australian Sea Liont Neophoc e clnerea
by
Anthony NicholsonB.V.Sc.
A thesis submitted for the degree of
Doctor of PhilosoPhY'
Department of PathologY'
UniversitY of Adelaide
February 1984
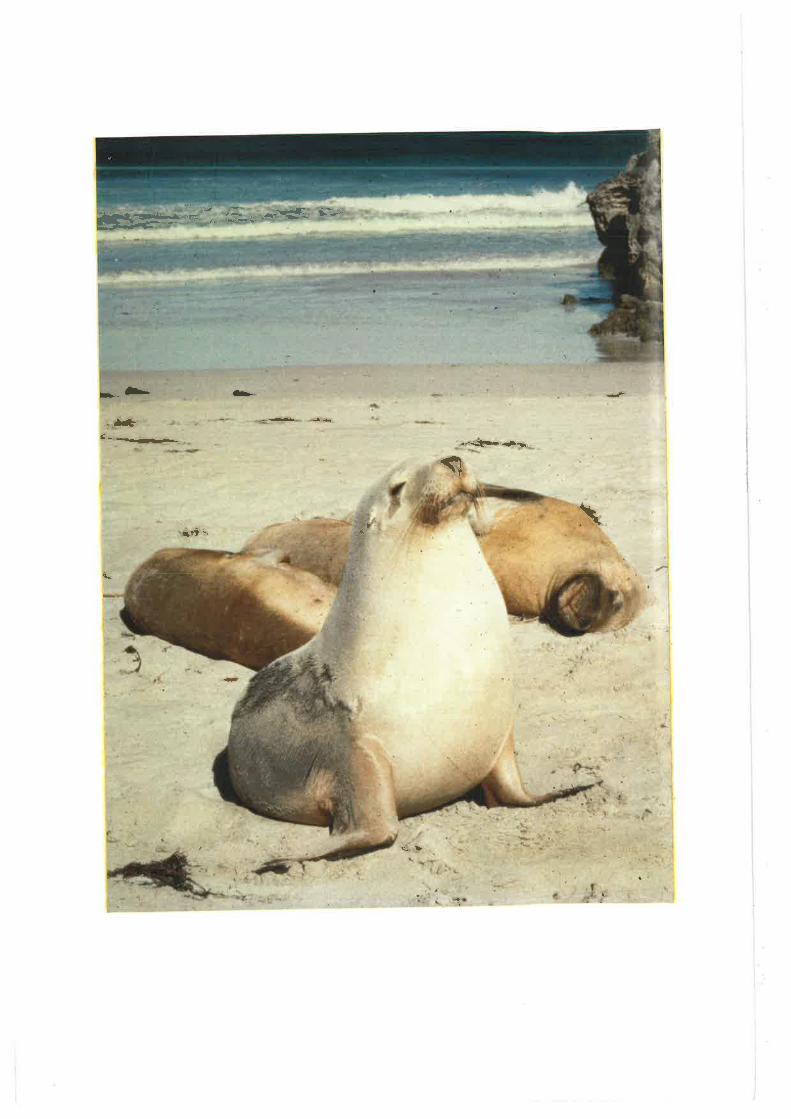
Frontispiece: Group of four adull female Australian sea lions baskingin the sun at Seal Bay, Kangaroo Island.
ËF:æ: oo',,, 'å¡ -*-d, l---
--a -
.-\tb.<¡-
.¡*É---
b'4
\
<}
.ltl ''
qÙ
CONTENTS
List of Figures
List of Tables
Abstract
Declaration
Acknowledge m ents
Chapter I. Introduction \I.I Classification of Marine Mammals
I.2', Distribution of Australian Pinnipeds
I.3 Diving CaPabilitY
Page
X
xi
XIV
XV
III2
1.4 Diving PhYsiologYl'.4.I Cardiovascular SYstem '
I.4.2 OxYgen StoresL.4.3 BiochemicalAdaPtationsI.4.4 PulmonarYFunctionI.4.5 Effects oi Incteased Hydrostatic Pressure
1.5 SummarY and Aims
3
4B
1lL3T6
Chapter 2.
?.I2.2
2.3
2.4
2.5
Chapter 5.
t.r3.2
3.3
3.4
3.5
Materials and Methods
Specimen Collection
Lung Fixation
Lung Votume Determination
Parasite Collection and Incubation
M icroscoPY2.5.I Light MicroscoPY2..5.2 Trãnsmission Electron Microscopy2.5.3 Scanning ElectronMicroscopy
Norm al ResPiratorY Structure
Introduction
Terrestrial Mam maI Respiratory System
1.2.I MacroscoPtc3.2.2 MicroscoPic
Pinniped ResPiratorY SYstem
3.3.I MacroscoPic3.3.2 MicroscoPic
Results1.4.L MacroscoPic3.4.2 MicroscoPic
Discussion3.5.I MacroscoPtc3.5.2 MicroscoPic
SummarY
l-8
20
20
2I2I22
22222323
25
25
252527
272728
3I3I32
7B7B79
923.6
IV
Page
Chapter 4.
4.1
4.2
4.3
4.4
Lung MorphometrY
Introduction
Methods4.2.I Basic Principles of Point Counting4.2.2 Sampling Design4.2.3 Animal and Regional Differences4.2.4 Interspecies ComParisoq
Results4.1.1 Species Results4.3.2 Animal and Regional Differences
4.3.3 Interspecies ComParison
D iscussion4.4.1 Discussion of Methods4.4.2 Discussion of Results
4.5 Summary
94
94
979B9B
110tt01r.1t1l_lll119
I23r23135
153
D5r55
D5b515B
Chapter 5- PulmonarY PathologY
5.1 Introduction
5.2
5.3
5.4
Results5.2.I Macroscopic5.2.2 M icroscopic
D iscuss ion5.3.I In vitro develoPment5.3.2 PathologY
Su mm ary
Discussion
Lung Structure
Lung MorphometrY
Diving PhysiologY
r69r69r69
170
r7tr73
L74
175175r77r77IB2tB5
187
r9l
Chapter 6.
6.r
6.2
6.t6.J.I6.3.26.3.36.3.46.3..5
Aerobic Dive LimitBioche m istrYPulmonary FunctionIncreased Hydrostatic Pressure and Lung CollapseNitrogen Absorption and Decompression Sickness
6.4 Conclusion
6.5 Future Research
Bibliography 193
Page
Figure
t.2.
3.
4.
5.
6.
7.
10.
B
9
LIST OF FIGURES
Dorsal view of excised lungs and trachea
Ventral view of excised lungs and trachea
Laleral view of left lung
Lateral view of right lung
Macroscopic view of lung samPle
Low power light micrograph of lung sample
Light micrograph of junction between tertiary and lobularbronchi
Higher power light micrograph of junction between tertiaryand lobular bronchi
scanning electron micrograph of junction between tertiary and
lobular bronchi
Transmission electron micrograph of transition region betweentertiary and lobular bornchi
Transmission electron micrograph of transition region
Transmission electron micrograph of secretory cells intransition region
High power transmission electron micrograph of secretory cell
Transmission electron micrograph of transition region
Transmission electron micrograph of non-secretory cells intransition region ¡
Transmission electron micrograph of columnar ciliated cellin transition region
Transmission electron micrograph of columnar microvillous cell
Transmission electron micrograph of migralory cell in transitionregion
Transmission electron micrograph of lobular bronchus
Transmission electron micrograph of cuboidal secretorymicrovillous cells
High power transmission electron micrograph of cuboidalsecretory microvillous cells
High power transmission electron micrograph of cuboidalsecretory micovillous cells
Scanning electron micrograph of lobular bronchus
Transmission electron micrograph of lobular bronchus showing
its relationshiP to an alveolus
Transmission electron micrograph of lobular bronchus
Transmission electron micrograph of columnar secretorymicrovillous cells in lobular bronchus
3B
3B
39
39
40
40
4I
4I
41,
42
42r1.
r2.
13.
14.
15.
16.
r7.18.
19.
20.
43
4J
44
44
45
45
47
47
4B
4B
49
49
2I
22.
2t.24.
25.
26.
46
46
50
VI
Page
?7. High power transmission electron micrograph of columnarsecretory microvillous cells
High power transmission electron microqraph of apex ofcolumnar secretory microvillous cell
Transmission electron micrograph of lobular bronchus
Transmission electron microqraph of non-secretory microvillouscell
High power transmission electron micrograph of non-secretorymicrovillous cell
Trançmission electron micrograph of non-microvillous cells
Transmission electron micrograph of non-microvillous cells
Scanning electron micrograph of cuboidal ciliated cell
Transmission electron micrograph of distal region of lobularbronchus
scanning electron micrograph of junction between tertiary and
lobular bronchi
Light'micrograph of two adjacent acini
Light micrograph of terminal lobular bronchus
Light micrograph of lobular bronchus
Low power transmission electron micrograph of distal regionlobular bronchus
Transmission electron micrograph of submucosal mast cell
Diagram of parenchymal subdivisions
scanning electron micrograph of tung parenchyma with lobularbronchus
Scanning electron micrograph of lung parenchyma
Transmission electron micrograph of thick septum in parenchyma
Transmission electron micrograph of thick connective tissueseptum
Transmission electron micrograph of thick septum containing apulmonary venule
Scanning electron micrograph of alveoli
scanning electron micrograph of termination of lobular bronchus
Scanning electrôn micrograph of alveolar duct
scanning electron micrograph of alveolar duct and sac walls
Transmission electron micrograph of alveolar duct wall
Transmission electron micrograph of alveolar duct wall
Transmission electron micrograph of alveolar sac wall
Transmission electron micrograph of part of alveolar sac wall
50
2B5L
5129.
30.
3r.
32.
33.
34.
35.
16.
37.
38.
39.
40.
4r.
42.
43.
,2
52.
5t5t54
54
55
55
56
56
57
57
62
63
63
6444.
45.
46.
47.
64
48.
49.
50.
51.
52.
53.
54.
55.
65
65
66
66
67
67
6B
6B
69
vil
Page
56.
57.
58.
59.
60.
6r.
62.
63.
64.
65.
66.
61.
68.
69.
70.
1L
72.
7t.
74.
75.
16.
77.
Transmission electron micrograph of alveoli showing alveolarduct and sac walls
Transmission electron microqraph of alveolar septum
Higher power transmission electron micrograph of alveolar
septu m
Transmission electron micrograph of alveolar type I epithelialcell
Transmission electron micrograph of alveolar type II epithelialcell
Scanningelectronmicrographofalveolarsurfaceshowingtypellce lls
High power scanning electron micrograph of alveolar type
II cells
Transmission electron micrograph of alveolar type II cells
Transmission electron micrograph of alveolar septum containingsingle capilìarY network
Transmission electron micrograph of alveolar septum rvith double
capillarY network
Transmissionelectronmicrographofalveolarseptumwithsingleand double caPillarY networks
Transmission electron micrograph of alveolar septum
Transmissionelectronmicrographofalveolarseptumbetweenadjacent alveolar sacs
Transmissionelectronmicrographofjunctionbetweenalveolarsepta from three alveoli
TransmissionelecLronmicrographofalveolarseptumwithtypelepithelial cell
Transmission electron micrograph of alveolar septum with
"pseudo-single" capillary network
Transmissionelectronmicrographofalveolarseptumwithdoublecapillary network
TransmissionelectronmicrographofalveolarseptumwithdoublecapillarY network
Transmission electron micrograph of alveolar septum withtranseptal anastomosis
TransmissionelectronmicrographofalveolarseptumwithmixedcapillarY networks
Transmission electron micrograph of double capillary alveolarseptu m
Highpoweltransmissionelectronmicrographofalveolarseptalinterstitiu m
Transmission electron microqraph of alveolar macrophage
Scanning electron micrograph of alveolar macrophage
69
70
70
7I
7L
72
72
13
73
74
14
74
15
15
75
15
75
75
75
75
76
76
17
7178.
19.
80.
BI.
Diagram outlining four-level morphometric sampling design
Logarithmic scale used to determine harmonic mean barrierth ickness
Allometric Plot of lunq volume
Allometric plot of alveolar surface area
Allometric plot of capillary surface area
Allometric plot of capillary volumer
Allometric plot of tissue harmonic mean thickness and
cap.illary load ing
Allometric plot of oxyqen diffusing capacity
Graph showing progressive means of perce-ntage of interacinarseptal volume occupied by respiratory surf ace
Graph showing progressive means of perce-ntage of interlobularseptal volume occupied by respiri tory surf ace
Graph showing the contribution of the interacinar and interlobularr"pi" to the total respiratory surface volume
Graph showing progressive means of total proportion of respiratoryrutf""" volume within the true parenchyma
Graphshowingprogressivemeansforcombinedvolumeporportionof single and ãouble capillary alveolar septa within the trueparenchym a
Graph showing progressive means of the percentage of airspace
volume within true ParenchYma
Diagram showing the distribution of pulmonary parasites in
Page
100
100
r20
l_20
I2LT2I
vlll
I22
r22
r26
r27
r29
I29
tll
I6I16r
16r
162
r62
r62
I62r63
r63
r63
r63
82.
83.
84.
85.
86.
81.
BB.
89.
91.
92.
93.
90
l_10
94
95.
96.
97.
Neophoca cinerea
Macroscopic view of rostral portion of maxillary turbinates
Macroscopic view of ethmoid turbinates
Scanning electron micrograph of trachea showing larvalO. diminuata
9B Macroscopic view of lung parenchyma with pathologic subpleural
nodule
Macroscopic view of lung parenchyma showing adult
P araf ilaro ides
Scanning electron micrograPh of adult Parafilaroides
Macroscopic view of larval mites on maxillary turbinate
Light micrograph of larval mite embedded in nasal turbinate
Light micrograph of embedded larva
High power light micrograph of embedded larval mite
Scanning electron micrograph of larval mite on trachealsurface
oo
100.
10I.
102.
l0l.104.
105. 164
Page
IX
r64
r64
r65
r65
r06.
107.
L0B.
109.
Scanning electron micrograph of larval mite on trachealsurface
Light micrograph of larval mite embedded in epithelium ofnasopharynx
High power liqht micrograph of larval mite embedded in
epithelium of nasoPharYnx
Liqht micrograph of larviparous female Parafilaroides Iyingin an alveolar duct I
LIO. Light micrograph of larval Parafilaroides lying free within an
alvêolar sac
I1l. Liqht micrograph of adult male Parafilaroides lying free withinan alveolar duct
High power light micrograPh of adult Parafilaroides
r64
r65
r65LIz.rll.
114.
]]_5.
116.
lr7.ItB.
119.
r20.I2I.r22.
r73.
r24.
High power light micrograph of lobular bronchus showinglymphocytic interstitial infiltrate
Light micrograph of tertiary bronchus showing fibrinous exudatewithi'n the lumen
High power light micrograph of tertiary bronchus showing cellularnature of bronchitic exudate
Light micrograph from bronchopneumonic region
High power light micrograph from bronchopneumonic region
Light micrograph of pneumonic reaction sumounding two larvalP araf ilaroides
Light micrograph of pneumonic lesion
Low power light micrograph of subpleural paren"nyt"
Light micrograph of subpleural lesion
Light micrograph of pneumonic region showing adultP arafilaroides
High power light micrograph of pneumonic exudate
High power light micrograph of larval Parafilaroides migratingthrough perivascular tissue
L66
166
166
r66
L67
r67
r67
r67
168
168
t6B
r6B

x
LIST OF TABLES
Page
Table
l_.
2.
3.
4.
5.
6.
7.
B.
9.
10.
11.
r2.
13.
14.
Biological data of animals used in this study
List of morphometric sYmbols
Morphometric results - levels I and II
Morphometric results - level III
Morphometric results - level IV
Morphometric results - absolute values
Morphomelric results - barrier thicknesses
Level I - analysis of variance
Level II - analysis of variance
Level III - analysis of variance
Level IV - analYsis of variance
t-test for differences between dorsal and ventral regions
t-test for differences between anterior and posterior regions
t-test for differences between predicted and measuredabsolute values
Results for grid systems trials - level I
Results for grid systems trials - level II
Results of comparison between SQ and STWQ subsampling -level IV
Results of comparison between lI and 17 class lògarithmicscales for harmonic mean barrier thickness
Comparison between SQ and STWG subsampling - whole lung
densities
species comparison of parenchyma, airspace and tissue volumes
expressed as Percentages
species comparison of absolute and specific morphometricparameters
Species comparison of alveolar diameter index, capillarydiameter and haematocrit
Effective capillary surface area and corrected oxygen diffusingcapacity for the Australian sea lion
oxyqen conductance values for individual components of the morpho-*"iii" model for estimating the oxygen diffusion capacity
Recorded incidence o pulmonary parasites in otariid species
20
97
IT2
II2114
115
t15
l_16
tl6Ir_6
TL7
ltBltB
l-5.
16.
r7.
18.
19.
20
2r.
22.
23.
24.
It9124
r25
L32
133
134
139
r47
r49
145
25.
152
156
XI
ABSTRACT
The lungs of the Australian sea lion, Neophoca cinerea, wele examined to
determine the arrangement of ultrastructural features of the terminal airways and
gas-exchange region. Morphometric studies were conducted to assess whether
observed structural modifications affected the oxygen diffusing capacity of the
lung.
The nìajor structural differences between the Australian sea lion lung and
those of terrestrial mammals are the generalized reinforcement of both the
airways, by cartilage, and the parenchyma, by pronounced interlobular and inter-
acinar septa and the general thickening of the alveolar septa' of the thickened
alveolar septa a significant proportion carried a double capillary network whilst
the majority possessed a single capillary network similar to that of terrestrial
mammals.
Morphometrically the parenchyma was found to occupy little more than 7070
of the lung volume, of which only 14% was respiratory tissue. Approximately 27o/o
of the alveolar septa contained a double capillary network' The interstitial com-
ponent of the alveolar septa showed significant regional differences being grealer
ventrally and posteriorly, whilst the alveolar surface area was significantly
greater ventrally. The mean values of adult of this species for various morpho-
metric parameters wele: lung volum e, 6.95L; alveolar surface area, 183m2; total
capillary surface area, 2O9m2; capitlary volumer 3g3 ml; tissue harmonic mean
thickness, 0.59 ymi and maximal oxygen diffusing capacity, 4'582 ml
O2.sec-l.mbar-Ì. When compared to predicted values for terrestrial mammals of
similar body weight, lhe total capillary surface area was 2370 greater, and the
capillary loading was B0% greater; both these results were statistically signi-
ficant. of the other parameters, the lung volume was 50% greater than predicted,
the capiliary volum e 6o0/o greater, the oxygen dif fusing capacity 260Á gteatet,
whilst the alveolar surface area was ll% less than predicted; however, none of
xil
these results were statistically significant. Of the double capillary septa, and the
interlobular and interacinar septa, approximately only one-half of the capillary
surface areas of these structures are effectively involved in gas exchange. When
these are taken into consideration, the effective capillary surface area was f47o
Iess than predicted. Inclusion of this effetive value into the calculation of the
maximal oxygen diffusing capacity resulted in a value of 4-287 ml
O2.sec-l.mbar-l which was about l-B% g.""t", than that predicted for a ter-
restrial mammal of similar body weight.
From the regions of pathology two halarachnid mites,
diminuala and O. attenuata. and a nematode lu ngworm of the genus Parafilaroides
were identified. The mites were found attached to the mucosa of the nasal tur-
binates, nasopharynx and trachea where they caused ulceration of the epithelium
with a localized infiltration of mononuclear cells and eosinophils. Within the lung
parenchyma the most prominent pathology was associated with free worms, both
adult and larval, which caused an acute bronchitis and bronchopneumonia which in
some areas developed into a purulent pneumonia with destruction of alveolar
walls.
The reinforced airways are important for enabling the high expiratory flow
rate achieved during normal respiration, and together with the increased con-
nective tissue of the septa for assisting the near complete alveolar collapse at the
end of expiration and when diving to depth. The parenchymal reinforcement will
also assist the reinflation of the alveoli during inspiration, as will the acinar
geometry by increasing the bulk flow of inspired air into the gas exchange region.
The large tidal volume will result in greater peripheral bulk flow of the inspired
air, and so reduce the distance for passive diffusion of oxygen in the aìveolar air'
The high oxygen utilization which results is due, in part, to this shorter diffusion
path and the inspiratory pause of normal respiration. These will enable more
efficient use of the increased maximal oxygen diffusing capacity as determined
morphometrically. The presence of mites in the nasal turbinates may limiL the gas
Orthohalarachne

xilt
flow rate during respiration, whilst the parenchymal pathology may reduce the
alveolar surface area available for gas-exchange.
The role of these structural and morphometric features are discussed in
relation to the diving ability of these animals and their ability to avoid decom-
pression sickness when diving to depth.
xrv
DECLARATION
This thesis contains no material which h"s'be"n accepted for the award of any
other aeqreê or diploma in any university. To the best of my knowledge and belief,
this thesis contains no material previously published or written by another person'
except when due reference is made in the text of the thesis. I consent to this
thesis being made available for photoeopying and loan.
Anthony Nicholson
XV
ACKNOWLEDGEMENTS
The research described in this thesis was performed in the Department of
pathology at the University of Adelaide. It was supported by a University
Research Grant Postgraduate Scholarship awarded by the University of Adelaide.
Support was also provided by a University of Adelaide Equipment and Maintenance
Committee Special Research Grant for 1979, and the Australian Marine Sciences
and Techrlology Advisory Committee for l980-l-981.
I wish to first thank my supervisor, Dr Joseph C. Fanning, for his assistance
in alt aspects of this study and with other problems that inevitably appear during
phD studies. .Professor Barrie Vernon-Roberts is also gratefully acknowledged for
his timely support and advice.
Of the many people who offered advice and assistance, there are those for
whom special mention needs be made:
Miss Marjorie Quin, Department of Pathology, for her help and expertise in
preparing the histological material;
Dr Oliver Mayo, Biochemistry Section, Waite Agricultural Research Insti-
tute, and Dr Lindsay C. Richards, Department of Restorative Dentistry, for their
advice and help with statistical analysis of the data;
Dr Brendon Griffin, Electron Optical Centre, for his advice and support in
general, but in particular for that in regard to the morphometry;
Mr Manohar Hullan, Medical Artist, Institute of Medical and Veterinary
Science, for his artistic skill and understanding;
Mr Dale Caville, Department of Pathology, for his professional help
throughout this project, and in particular for his enthusiasm and skills in the
production of the prinLs for this thesis;
Mrs Dorothy Wagstaff , Department of Pathology, f or her support and
secretarial assistance;
XVI
Mrs Carmen Carter, for her typing skills during the embryonic stages of this
thesis, and in particular, Ms Christine Gradolf, for her excellent typing and advice
in the final production of this thesis;
Finally, my family and many friends, for their continued support and
encouraqement throughout this project, to all of whom I am.deeply grateful.
Chapter I
INTRODUCTION
The efficiency with which marine mammals have adapted to their aquatic
environment has intrigued and fascinated humans for many years' Perhaps that
feature of their existence which has aroused most interest is their ability to
sustain long periods of submersion. This marked breathhold diving ability enables
some aquatip species to reach great ocean depths and remain under water for
extended periods of time.
I.I CLASSIFICATION OF MARINE MAMMALS
There âre three exlant groups of marine mammals; the cetacea which
includes the totally aquatic whales and dolphins, the Pinnipedia which comprises
the seals, sea Iions and walrus which are amphibious, and the lesser known totally
aquatic Sirenia, represented by the manatee and the dugong (Scheffer,1976)' The
pinnipeds are classed into two superfamilies which are most readily differentiated
by external characteristics, in particular their hindlimbs and the presence or
absence of external pinnae. The Phocidae, or true seals, cannot flex their hind-
limbs for terrestrial locomotion and have no external pinnae, whilst the Otarioidea
can use their hindlimbs for terrestrial locomotion and, except for the walrus, have
small external pinnae. The Otarioidea are further subdivided into two families, the
Otariidae which includes the sea lions and fur seals, and the Odobenidae
represented by the walrus (Repenning et al', 1979)'
I.2 DISTRIBUTION OF AUSTRALIAN PINNIPEDS
All of the pinniped species resident in and around Australian waters belonq
to the family otariidae. These are the Australian fur seal, Arctocephalus Pusillus
dor if erus the New Zealand fur seal, Arctoc eohalus forsteri. and the Australian
sea Iion, Neophoca cinerea (Marlow and King, I974). The distribution of the
2.
Australian seal extends south from the mid-north coasl of New South Wales to
southern Tasmania and west along the Victorian coast, whilst in Australian waters
the New Zealand fur seal is present along the coasts of Western Australia and
south Australia (Bonner, l981). The present range of the Australian sea.lion is the
islands and coasts of southern and southwestern Australia, from Houtman Abrolhos
(2BoS, tI4oE) in Western Australia to a rocky outcrop, The Pages (35o47's,
llBoIT'E) in South Australia (Walker and Lin|, lgBI)'
Althoùùh the Australian sea lion has a wide distribution, the estimated total
population is only 4r000-5r000, of which 60-70% occur in South Australian waters
(Ling and walker, I977). Due to this small population Neophoca is considered to be
a threatened but not endanqered species whose numbers have been relatively
stable since,the cessation of mass slaughtering by commercial sealers late last
century (Stirling, I97Ð. As a consequence of the relatively small total population
of this species, only a limited number of animals were made available for this
study from which other maLerial has been utilized and incorporated into a multi-
disciplinary study of this species. Other aspects of this overall project have
involved investigations into the population status and reproductive biology' and
the levels and effects of industrial and agricultural pottutants.
L' DIVING CAPABILITY
Among marine mammals the larger cetaceans are regarded as the most
capable divers. However, much of the data relating to these species is from
indirect evidence. The maximum depth attributed to a cetacean is 1,L00 m, the
depth at which a sperm whale, Physeter catodon, was reported to have become
entangled in submarine cables (Heezen, Ig57), whilst the longest reported duration
is I20 min., attributed to a harpooned bottle-nose whale, Hvoero odon amDullatus
(lrving, Ig3Ð. Many of the earliest dive duration records for pinnipeds were from
forced dives by restrained animals (scholandet, 1940). However, more recently
telemetric devices have been attached to freely-diving animals in the wild with
3
the greatest performances achieved by the Weddell seal, Leptonychotes weddelli.
The greatest recorded depth was 600 m (Kooyman, 1966) whilst the greatest
duration was 7J min. (Kooyman et al', 1980)' The diving capability of otariids is
generally considered to be less than that of phocids, but similar to that for most
smaller cetaceans (Ridgway, I976). From limited studies of voluntary diving
otariids the maximum depths recorded are 2O4 m for Lhe Afro-Australian fur seal,
Arctoce alus usillus (subspecies not specified) (Kooyman, 1982) and 207 m for
the Norther'n fur seal, Callorhinus ursinus (Gentry et al., lg8l). The maximum
duration. recorded for these two fur seals is 6.4min. for A. pusillus and 7.6 min.
forc.ursinus(KooymanrJ912;Gentryetal"rgïÐ'Theonlyotherdirectly
measured records for a freely-diving obariid were those obtained from a trained
California sea lion, Zalop hus californianus which reached a depth of 25O m and
remained submerged for B min. (Ridgway, I972i 1976). Little is known of the
diving ability of the Australian sea lion in regard to either depth or duration,
although indirect evidence indicates that pups are capable of dives to f6 m
(Walker and Ling, 19Bl) and there is no evidence to suggest that they differ in
their divinq ability from other otariids.
I.4 DIVING PHYSIOLOGY
The earliest attempts to elucidate those aspects which contribute to the
enhanced capabilities of diving animals were those reported by Paul Bert in l870
and Charles Richet in the late lB90's (Andersen,1966).5ince that time there have
been several periods of intensive investigation of diving species. The first of these
was during the mid i.9f0's and 1940's from which came several hallmark
monographs (Irving, 1939; Scholander, J-940). The work of this period was followed
some twenty years later by a number of investigators, much of whose work is still
in progress today utilizing more sophisticated technology and methods to gain new
insights into diving physioìogy and behaviour. As with the earlier studies, much of
the current work being undertaken is conducted on pinnipeds, and even then is
4
generally timited to a small number of species. The reason for this is largely due
to pinnipeds being easier to maintain and manage in captivity. Some pinniped
species have even proven to be tractable and suitable experimental animaìs in the
wild. Limited studies have been conducted on captive cetaceans. However, their
very large size and pelaqic behaviour makes study of them in the wild a mammoth
operation or mole usually impossible. For this reason much of the following
discussion on diving physioloqy is restricted to pinnipeds. The experimental results
are often inconclusive, because of the array of experiments performed on a wide
variety of species which can make interspecies extrapolation uncertain'
The general conclusion amongst physiologists, anatomists and biochemists is
that the diving ability of marine mammals is not due to the development of any
new 'rapparatusrr but rather is the result of the degree to which certain bio-
chemical and physiological features common to all mammals are utilized. These
features include a respiratory and cardiovascular diving response, the availability
and utilization of the body's oxygen stores, and the ability to minimise the ill-
effects of the metabolites of anaerobic pathways utilized during maximum
duration diving.
I.4.I Cardiovascular SYstem
In l870 Bert demonstrated a profound bradycardia in ducks in response to
forced submersion. Some thirty years later Richet demonstrated that this response
was neurally mediated by administering atropine to ducks prior to submergence
and noting that the bradycardia was blocked. Working with restrained seals, Irving
et al. Qg35) and Scholander (1940) produced a similar bradycardia to a level of
onty l0-I5yo of the pre-dive heart rate. They also observed that in these animals
the resting respiratory cycle often includes a prolonged inspiratory pause during
which the heart rate declines, but to a lesser extent than that during submersion'
since then a number of groups have shown that the reduction in the heart rate of
pinnipeds during forced submersion is gneater than that during voluntary diving
(Elsner, 1965; Harrison et al., I972; Kooyman and campbell, J-972). Kooyman and
5
Campbe¡ e97Z) demonstrated in free-swimming Weddell seals thal the decline in
heart rate is correlated with the duration of the dive so that the longer the dive
the more profound the bradycardia up till about 20 min. duration. Beyond 20 min'
the heart rate remained at 16 beats per minute which was about 50% of that for
5 min. dives.
In the California sea lion the stroke volume was maintained during the diving
bradycardia so that the cardiac output varied in accordance to the changes in
heartrate(Elsneretat.,1964).Morerecently,studiesofsimulateddivesbythe
harbor seal, Phoca vitulina indicated that the stroke volume decreases by about
)0% together with an B0% decrease in cardiac output (sinnett et al', l-978)' A
similar decrease in stroke volume was calculated by Blix et al', 1983' The
observed.differences in the stroke volurne between the harbor seal and the earlier
study on the california sea lion have been suggested to possibly result from
differences in experimental technique, differences in the degree of diving brady-
cardia which was more intense in the harbor seal, or the differences between the
species studied (sinnett et al., 1978). Despite these differences in regard to the
stroke volume, the decrease in cardiac output has been observed in a number of
other studies (Elsner et al., 1964; Murdaugh et al., I96Bi Zapol et al., I979; BIix eb
al., 19B3).
Atthough the heart rate and cardiac output decrease durinq diving'
measurements of the mean arterial blood pressure show that it is maintained or
even slightly increased due to extenstve peripheral vasoconstriction (Irving et al''
1942; Van Citters et al., 1965; Elsner et al., 1966; Stevens, I97I; Sinnett et al',
I97B; Zapol et al., Ig7Ð. The extent of this vasoconstriction has been visualized in
the harbor seal by the use of arteriograms (Bron et al.' 1966)' In the non-diving
seal injected contrast medium was rapidly cleared from the aorta and was seen
entering the peripheral organs, whilst during simulated diving there was very little
evidence of peripheral organ perfusion with delayed clearance of the aorta'
6
Angiograms of the cerebral circuìalion during diving and non-diving showed no
differences, indicating that perfusion to the brain is maintained. More recently
the effects of peripheral vasoconstriction on blood flow distribution during
simulated diving have been studied in the weddell seal (Zapol et al'' 1979)' the
Phoca vitulina and the grey seal, Halichoerus qrypus (Blix ethspotted seal'
al. tgBl), by the injection of radioactive microspheres into the left ventricle. The
results of these two studies are in agreement for the most part, with the notable
exception of the pulmonary blood flow. In both studies the cardiac output
decreased by B5-9Oo/o as did blood flow to the left and right ventricles' The
decrease in coronary flow is associated with the decreased work load of the heart
during bradycardia. Cerebral blood flow was constant in lhe Weddell seal whilst in
the spotted and grey seals there was an initial marked decline in cerebral blood
flow which then gradually increased throughout the l0 min. dive, although the
lower parts of the brain were less perfused than the higher structures. Dormer et
al. (1977), using a Doppler blood flow transducer, observed a similar initial
decrease in cerebral blood flow followed by a marked increase associated with
voluntary diving in the california sea lion. The blood flow to the adrenal glands, in
both microsphere studies, decreased by onty 25-4To/o from pre-dive values' In the
weddell seal nearly 3OVo of the injected microsphere dose was detected in the
lung, whilst in the spotted and grey seals the pulmonary f low was only 60/o of the
cardiac output. These differences in the amount of pulmonary flow may have been
a resuìt of differences in the degree of flow through the two pulmonary sources of
blood, these being the bronchial artery and the recirculation of blood through
peripheral arteriovenous shunts (Zapol et al., I979; BIix et al., I9B3). In both these
studies the blood f low to all other organs and the skeletal m usculature was
reduced by at least 90% from that at rest. This selective distribution of blood due
to the peripheral vasoconstriction therefore maintains an adequate blood supply'
and hence oxygen supply, to those tissues most susceptible to hypoxia as originally
postulated by Irving (1939).
1
The mechanisms which control this cardiovascular diving resPonse have also
been subject to intensive investigation with the first insight into the possible
mechanisms arising from the work of Richet in the IB90's (Andersen, 1966)' He
found that administration of atropine to ducks prior to submersion blocked the
bradycardia and so illustrated the involvement of the nervous system in the
control of the diving lesponse. other control mechanisms have since been identi-
fied, although the role each plays is uncertain, particularly in the light of species
response differences.
The bradycardia of diving is considered to result primarily from increased
parasympathetic activity mediated via the vagus nerve (Butler, I9BZ)' The
initiation of increased vagal tone during the apnoea of diving is considered by
some to result from the stimulation of facial receptors mediated through branches
of the trigeminal nerve (Dykes, L974; Daly, l981). Howevet, there is evidence to
support the suggestion that the bradycardia is, at Ieast in part, under hiqher
central nervous conlrol. During bouts of voluntary diving harbor seals frequently
displayed a pre-dive anticipatory bradycardia, and oflen an increase in heart rate
as the animals approached the surface toward the end of the dive (Jones et al"
I97Ð. Similar observations have been made in freely-diving harp seals, Paqophilus
qroenlandicus (Casson and Ronald, Ig75) (now called Phoca groenlandica, Ronald
and Healey, 1981). A similar anticipatory tachycardia toward the end of diving has
also been observed in california sea lions (stevens, I97l) which have also been
trained to decrease their heart rate on land in the absence of prolonged apnoea
(Ridgway et al., Ig75). The Weddell seal shows a similar anticipatory increase in
heart rate toward the end of voluntary dives and also decreases its heart rate in
accordance with the duration of the ensuing dive so that for longer dives there is a
more pronounced bradycardia (Kooyman and Campbell' L972)'
The peripheral vasoconstriction is mediated by sympathetic efferents actinq
via a-adrenoceptors (Butler, I1BZ), the stimulation of which has been suggested as
being independent of changes in the heart rate (Irving et al', 194I, 1942; Murdaugh
B
et al., 1968) and that it is under separate neural control (Elsner et al', 1966; Blix'
Ig75). This vasoconstriction is also likely to be influenced by circulating cate-
cholamines (Butler, Lg82) which would appear possible due to the minimal
reduction in perfusion of the adrenal glands during simulated diving (Zapol et al''
I979; BIix et al., I9B3).
Theonsetofapnoeahasalsobeendemonstratedasimportantforthe
initiation of diving, bradycardia, both in conjunction with other control
mechanisms (Butler, l-982) and alone as evidenced by the marked respiratory
associated cardiac arrhythmia displayed by many marind mammals (lrving et al.'
1963; Kooyman and campbell, 1977; Lin et al., I977i Tanjii et al', 1975; Casson
and Ronald, 1975; Dormer et al., I977i Pasche and Krog, l9B0)' Peripheral chemo-
receptors responding to changes in arterial blood gas tensions ale considered to be
important in the maintenance'of the diving bradycardia (Tanjii eL al., I975; Daly'
lgBI), rather than in its onset due to the immediacy of the initial decrease in
heart rate.
L.4.? Oxygen Stores
(a) Blood
The potential of diving vertebrates for an increased oxygen capacity was
first reported by Bert in lB70 when, after bleeding ducks and hens, he concluded
that ducks possessed approximately twice'the volume of blood per kilogram as did
hens (Andersen, 196::6). The blood volume of diving mammals has also been
measured and found to be higher than terrestrial mammals' In the weddell seal
and Dall porPoiset Phocoenoides dalli the blood volume has been estimated to be
equivalent to about I4o/o of total body weight (Lenfant et al', L969) whilst in the
Northern elePhant seal, Mirou a ust irostr is it has been estimated to be at
least 20% of total body weight (simpson et al., 1970). The blood volume tends to
be greater in phocids than otariids on a total body weight basis (Lenfant et al''
1970) and represents an even greater proportion of the metabolically active lean
body weight since the blubber fat may account f or up to 3\o/o of total body weight
in phocids (Lenfant et al., 1969; Ferren and Elsner, I979; Butler and Jones, I9B2)'
9
Apart from the blood volume there are a number of haematological para-
meters which are different in marine mammals. In particular. the haematocrit
value and haemoglobin concentration are generally much higher than in terrestrial
mammals. The haematocrit in marine mammals ranges from about 4oo/o to a little
more than 6070 (Lenf ant, 1969; Ridgway et al., I97O; Simpson et al., I97O; Geraci
and smith, 1975) as compared to values of 32o/o and 4lo/o in terrestrial mammals
(Lapennas and Reeves, 1982). The mean corpuscular volume of marine mammals is
generally greater than 100 ymJ whereas for most terreslrial mammals it is less
than 100 ¡rml (Riagway, I972). However, this increased mean corpuscular volume
only results in a slightly larger erythrocyte diameter (Lenfantr 1969). The total
haemoglobin concentration in marine mammals ranges from L4 to 26 qm
Hb/l_00 ml blood (Lenfant, 1969; Clausen and Ersland,1969) with the higher values
generally occurring in phocids, whilst the lowest values are similar to those of
humans, l-4 to J-5 gm Hb/100 ml blood (Clausen and Ersland, 1968)' As a con-
sequence of the higher haemoglobin concentrations the volume of oxygen which
combines with the blood is increased resulting in an increased oxygen capacity
ranging from lB to 36 mI 02/100 ml blood (Lenfant, 1969; Clausen and Ersland,
196Ð. The occurrence of these oxygen capacities within different species follows
a similar distribution to that of the haemoglobin concentrations so that the
highest capacities occur in phocids with the Iower limit of the range again being
similar to that found in humans (Clausen and Ersland, 1968). These differences in
the oxygen capacities of the blood of these animals show a trend whereby those
species which normally endure long dives have the higher blood oxygen capacities
(Lenfant et al., 1970). In studying the haematology of three genera of porpoises,
Ridgway and Johnston (1966) found that the blood volume, haematocrit, haemo-
globin concentration and hence total blood oxygen capacity were all greater in the
faster swimming, deeper diving pelagic species than the coastal dwelling species'
Whether or not such a direct correlation is present amongst all marine mammals'
the increased blood oxyqen store, due to an increased blood volume and an
10.
increased blood oxygen capacity, is an important source of oxygen during diving
for many specles.
other properties of marine m ammal blood are a sigmoidal oxygen-
dissociation curve similar to that in terrestrial mammals but with a higher P5gr an
increased Bohr effect, and an increase in the buffering capacity (Lenfant, 1969;
clausen and Ersland, I969i Lenfant et al., I97O; Dhindsa et al., L974; Lapennas
and Reeves, 1982). The lower affinity of the blood for oxygen, together with the
increased Bohr effect, will tend to retard the onset of severe hypoxia during
diving by enhancing the unloading of blood-bound oxygen to the tissues (Lenfant,
1969; Lutz, IgBÐ. The increased buffering capacity in these animals is a result of
an increase in the Haldane effect, which reflects the ability of reduced blood to
carry carbon dioxide. The advantage of an increased buffering capacity is that it
minimises the effects of shifts in the blood pH (Lutz, r9BÐ which, together with
the other respiratory properties of the blood, led Lenfant et al' (1970) to conclude
thal the blood of marine mammals is apparently betler adapted for ensuring a
rapid recovery after diving rather than for sustaining prolonged dives.
(b) Myoglobin
The myoglobin present in the skeletal musculature is not only an oxygen
depot but when in sufficient concentration is also important in facilitatinq the
diffusion of oxygen from the capillaries to the mitochondria (weber et al', 1981)'
The concentration of myoglobin present in skeletal muscle has been measured in a
variety of marine mammal species and was generally found to be increased above
the levels present in terrestrial species (Man'kovskaya, 1975; Blix, 1976; Glazova'
L977; Castellini, lgBt; castellini and somero, 198I). This increase in myoglobin
represents another important source of oxygen to marine mammals when divinq'
(c) Lung
Many marine mammals, except perhaps for the large whales, have a greater
lung volume that terrestrial mammals of a similar size (Goudappel and Slijper'
l95B; Kooyman, L97t). The tidal volume of many marine species is B0% or more of
the total lung capaeity (lrving et al., I94Ii Olsen et al., 1969)' In general phocids
11.
exhale either before a dive or during'' the early descent phase so that the actual
lung volume only represents ZO-6t% of the total Iung capacity (Scholander, I940;
Kooyman et al., I97Ii I972). Otariids and cetaceans are generally regarded as
diving on inspiration so that the lungs represent a relatively large oxygen store
during diving (Kooyman and Andersen, 1969; Ridgway et al., 1969; Kooyman'
I973). Atthough there is some evidence to suggest that, for the california sea lion
at least, dives are undertaken on only partial inspiration (Ridgway, I977) or that
theyexhalesomegasonsubmersion(Keremetal.,I975)whichresultsinabreath-
hold volume of 50-90% of their vital capacity (Matthews, 1977)' Thus there appear
to be differences between the "slow" phocid breathers and the "rapid" breathers,
the otariids and cetaceans, in regard to their reliance on lung oxygen stores during
diving which tends to be reflected in the differences in their haematological
properties (section 1.4.2(a)). Another feature of diving which tends to minimise
the contribution of lung oxygen stores is the alveolar collapse which occuts when
diving to depth, as first predicted by Scholander (1940) and since demonstrated in
several species (Ridgway et al., 1969; Kooyman et al., I97O; I97Ð. The
significance of this movement of air from the alveoli into the non-respiratory
airways will be further considered in regard to the effects of pressure whilst
diving to depth in ÏSection I.4.5 .
1.4.f Biochemical AdaPtations
Recent studies indicate that the majority of voluntary dives by free-diving
animals are well within the maximum limits observed in restrained and voluntarily
diving animals (Kooyman et al., I976; Kooyman et al., I9B0; Gentry et al', 19Bl)'
Kooyman 4_4. (1980) found that 9770 of voluntary dives by weddell seals were
within a limit of about 26 min., and that this was about the length of time beyond
which the lactic acid concentration in blood increased during the recovery; the
increase in lactic acid is an indicator of anaerobic metabolism, particularly in Lhe
skeletal musculature. They therefore concluded that for the weddell seal the
aerobic dive limit is in the order of 2o-25 min. Based on estimated body oxygen
12.
stores during a breath-hold dive and the rate of whole body aerobic oxygen utiliza-
tion, Hochachka (l98I) calculated a maximum aerobic dive limit of lB min., very
similar to that observed by Kooyman et al. (1980). These results suggest that the
vasoconstriction observed in forced dives is not nearly as important in the
majority of voluntary dives as originally predicted. These results also stress the
importance of large oxygen stores in the body, particularly those observed in the
blood and to a lesser extent those of the muscle. However, during maximum
duration diving the cardiovascular responses are of great importance to maintain
an adequate oxygen supply to the obligate aerobic tissues of which the brain is the
most important and sensitive.
That there is an accumulation of anaerobic metabolic end-products during
sustained diving, which aPpear in the blood during the recovery period, was first
reported by Scholander (1940). To account for this marked anaerobic capacity a
number of investigators have examined the tissues of various marine mammals to
determine if there are any biochemical differences when compared to terrestrial
species. The two glycolytic enzymes most frequently studied have been lactate
dehydrogenase and pyruvate kinase; pyruvate kinase because it is a useful index of
glycolytic activity (5imon gL-e!., I97Ð and its pivotal role in gtycolytic control
(storey and Hochachka, I974), and lactate dehydrogenase because it can function
in the mofe usual pyruvate to lactate direction, and under certain conditions in
the oxidation of lactate to pyruvate (Castellini et al', l9B1)' In a comprehensive
study of various tissues from a wide range of marine mammals and control ter-
restrial mammals, the activibies of these two enzymes, assayed at physiologic
temperatures, displayed no differences in the potential for anaerobic glycolysis
(castellini, 1981; Castellini et al., 1981). These authors concluded that the meta-
bolic stress of an extended dive is within the range of stresses encountered by
exercising terrestrial mammals. The only consistently increased enzymic activity
observed was that of lactate dehydrogenase, in both directions, in the marine
mammals but this was not correlated with the known differences in the diving
r3.
abilities of the species studied. Rather it rvas proposed that this increased activity
reflected an adaptation for the removal of blood lactate during or after diving
(Castellini
occasional
et al., tg8L). One observed apparent adaPtation
activ ity was the signif icant
to the need for
increase in theprolonged anaerobic
buffering capacity of skeletal muscle of marine mammals (Castellini and Somero,
I981). This buffering capacity was found to be strongly eorrelated to the
myoglobin concentrations and to the muscle lactate dehydrogenase activities'
consequently, when anaerobic glycolysis is activated, with the depletion of muscle
oxygen stores, this buffering capacity is able to m inim ise the associated pH
changes which would otherwise occur due to the accumulation of lactate'
I.4.4 Putmonary Function
The extent to which the lung contributes to diving ability appears to differ
between two groups of divers. The division into these two groups is based, in part'
on their respiratory patterns. The phocids tend to have periods at the surface
after a dive during which they ventilate a number of times, and have been called
ilslow,,breathers, whilst otariids and cetaceans have been called "rapid" breathers
because on surfacing from -a dive they will often only perfotm one respiratory
cycle before resubmerging (Kooyman, I973). tnis difference is also reflected in
the volume of air retained in the lungs when diving. Phocids generally dive on
expiration and otariids and cetaceans on inspiration, so that the lung oxygen store
would appear to be more important in "rapid" breathers (see Section 1.4.2(c))' All
marine mammals have large tidal volumes which, in the "rapid" breathers par-
ticularly, are associated with high flow rates' Studies with excised lungs have
demonstrated a peak expiratory flow rate of eight vital capacities (VC) per second
in the California sea lion (Kerem et al', 1975) and up to l0 VC/sec' for the lungs
of the harbor porpoise, Phoceana phoceana (Kooyman and sinnett, L979)' In live
animals the peak expiratory flow rates recorded have been lower than those from
excised lungs but still very high; up to 5 VC/sec. in the California sea lion (Kerem
et al., L975; Matthews, Lg77) and 6.1- VC/sec. by the bottle-nosed porpoise,
14.
TursioÞs truncatus (Kooyman and Cornell, l-9Bl). In the few larger cetacean
species studied, the peak expiratory flows measured were only about 2'5 VC/sec'
(spencer et al., 1967 Kooyman et al., 1975) which is still higher than the values
attainable by humans, about 1.5 VC/sec. (Pride et al', 1967)' Another striking
feature of expiration in marine mammals is that these high flow rates are
maintained even at low lung volumes (Kerem et al., 1975; Matthews, 1977;
Kooyman and sinnett, 1979; Kooyman and cornell, l9B1) whereas in humans the
peak expiratory flow is attained at 80% of the vital capacity, below which volume
the flow rate decreases rapidly (Pride et al., 1967)' The conclusion reached by
these investigators was that the cartilage reinforcement of the terminal airways
of otariids and cetaceans maintains the patency of these smallest airways during
the periods of these high flows and at low volumes (Kerem et al., I975; Matthews'
1977i Kooyman and sinnett, 1979; Kooyman and cornell, I9BI). This is in contrast
to humans where the expiratory flow rates are limited by the collapse of the
relatively thin-walled bronchioles (Hyatt et al., I95B; Macklem and Mead, 1968)'
The large tidal volumes and high flow rates exhibited by marine mammals result in
reduced residual volumes as evidenced by the degree to which the lungs are able
to empty (Denison et al., I97I; Matthews, I977i Kooyman and SinneLL, 1979)'
These factors contribute to a high turnover of alveolar 9as which aids the high
oxygen utilization achieved by these animals (scholander, 1940).
The oxygen utilization by marine mammals tends to be greater than that for
te¡estrial species. In many marine species the oxygen utilization is generally B-
10%, so that the inspired oxygen concentration of approximately ZLo/o is reduced
to ll-ll% in the expired air (Scholander, 1964; Andersen, 1966; Ridgway et al',
1969; Shapunov, 1971). Although in phocids the oxygen utilization is only 5-7%
(Andersen, 1966). The degree of oxygen utilization has been shown to depend on
several factors (Kooyman et al., I97Ð; the lung volume at the start of the dive'
the pre-dive ventilatory behaviour, and the depth of the dive which will be dis-
cussed in Section l-.4.5.

r.5.
During breath-hold dives marine mammals are able to withstand lower
arterial oxygen tensions and higher carbon dioxide tension than terrestrial
mammals (Scholander, 1940; Robin et al., I963i Ridgway et al', 1969; Lenfant et
eL., I97O; Pasche, I976i Gallivan and Best, 1980; Gallivan, l9B0)- Despite an
increased tolerance to high carbon dioxide tensions marine mammals are not
insensitive to it (Pascher I976), in fact it has beerr suggested that carbon dioxide is
the major factor in controlling ventilatory behaviour and diving duration in the
manatee (Gallivan, l9B0). In phocids alterations to the diving pattern appear to be
an important adaptation to variations in oxygen and carbon dioxide con-
centrations. In experimental dives with an increased inspiratory carbon dioxide
concentration, the duration of each dive was reduced (Pasche, I976) and more
time was spent at the surface (Craig and Pasche, 1980). Similar alterations were
observed in the diving patterns of harp seals in response to increased metabolic
oxygen requirements (Gallivan, l98la), whilst in the manatee metabolic adjust-
ments after- a long dive are made during a series of short dives (Gallivan and Best,
l_980).
The need to alter diving patterns rather than ventilatory patterns stems
from the limitations of ventilatory behaviour. The tidal volume of many marine
mammals is very large, often reaching 80-90% of total lung capacity (scholander,
194O; Scholander and Irving r Ig4I Irving et al., J-941; Olsen et al., 1969), although
it tends to be somewhat less in the large whales (Laurie, 1933; Andersen, 1966;
Wahrenbrock et al., Ig74). As a consequence the tidal volume approaches the vital
capacity and the end-expiratory volume is very small (lrving et al., l94I; Kerem
et al., 1975; Matthews, 1977; Kooyman and SinnetL, 1979; Kooyman and cornell,
lggl). Due to this large tidal volume, the minute ventilation is relatively high
even though the resting respiratory frequency is very low in most species and only
slightly higher in phocids (Andersen,1966i Ridgway, I972)' In the Weddell seal the
minute ventilation increases after diving with increasing dive time up until a dive
of l5 min. when the minute ventilation remains constant (Kooyman et al., I97l)'
r6.
The maximum increase in minute ventilation is achieved by doubling the tidal
volume and increasing the respiratory rate to three times that of resting so that
overall the minute ventilation is increased six times above that at rest- This
increase in minute ventilation is quite small when compared Lo the twenty times
increase attainable by exercising humans (Kooyman et al., l97l-). In the harp seal
the minute ventilation and oxygen extraction were observed to be at or near their
maximum so that any increase in one of these variables leads to a decrease in the
other (Gallivan, 1981a). In cetaceans, with very large tidal volumes, increases in
pulmonary ventilation are limited because any major increase in respiratory
frequency results in a decrease in the tidat volume (Scholander and Irving, )'94Ii
Andersen, 1966).
1.4.5 Effects of Increased Hydrostatic Pressure
As a consequence of the large tidal volumes and high oxygen utilization, the
alveolar oxygen and carbon dioxide tensions can vary quite markedly during the
various phases of the respiratory cycle. These gas concentrations are subject to
the particular activ ity of the ani m als. Working with a trained bottle-nosed
porpoise, Ridgway gl__d. Q96Ð observed that the oxygen concentration in the
expired air immediately after diving to depth, about 100 m' was greater than that
after surface breath-holds of similar duration. Similar results were obtained by
freely-diving Weddel seals in which the alveolar oxygen tension was greater after
a dive of 20 min., which are usually to a depth of 100-400 m, than during resting
apnoeic periods at the surface which averaged 4.5 min. (Kooyman, 1967; Kooyman
et al., I97r. The potential for this respiratory gas behaviour was outlined by
Scholander (1940) who predicted that when diving to depth, due to the increase
hydrostatic pressure, the alveoli would collapse, before the airways so that the air
would be sequestered away from the gas exchange surfaces' This was suggested as
a mechanism to limit the degree of gas exchange at depth and so prevent the
absorption of large quanities of nitrogen and hence minimise the potential for
decompression sickness during ascent. Scholander (I940) predicted that this
r7.
alveolar collapse would be complete at a depth of 100-200 m for cetaceans and
10-40 m for the grey seal. Based on alveolar oxygen concentrations after diving,
Ridgway gl_4. Q96Ð predicted that in the bottle-nosed porpoise alveolar collapse
would be complete at about J-00 m, whilst in the weddell seal, Kooyman et al.
(1971) predicted alveolar collapse to occur at a mean depth of 70 m. More
recently, Ridgway and Howard (I979), by measuring the nitrogen tension in the
dorsal epaxial muscles of bottle-nosed porpoises, estimated that the collapse of
the alveoli is nearly complete by 70 m but emphasised that this exclusion of gas
from the respiratory surface occurs gradually. They also remarked that despite
peripheral vasoconstriction, the skeletal muscles still receive an effective blood
supply during diving which agrees with the conclusion of Kooyman et al. (I980) and
Hochachka (L98l) that the majority of dives are aerobic so that the peripheral
blood supply wilt be maintained. However, in regard to shallow dives, Ridgway and
Howard (Ig79) concluded that the degree of alveolar collapse is insufficient to
limit nitrogen absorption during dives to less than 70 m'
The ability f or alveolar collapse, as originally suggested by scholander
(1940), is dependent on the rigidity of the term inal airways. In otariids and
cetaceans these airways are reinforced by cartilage down to the level of the
alveolar sacs, whilst in phocids the term inal portions of these airways a¡e
supported by a thickened muscular layer (Denison and Kooyman, I97Ð' These
authors predicted that the airways need only be about five times more rigid than
the alveolar walls to allow alveolar collapse to occur with increasing hydrostatic
pressure. They also noted that an important feature for alveolar collapse is that
the ratio of the alveolar volume to the dead space volume needs to be small so
that the gas from the alveoli wilt fitl the dead space. This movement of gas due to
increased pressure has been demonstrated radiographically in Weddell and Nor-
thern elephant seals (Kooyman et al., 1970). At the maiimum pressure to which
these animals were subjected, lI ATA equivalent to a depth of 100 m, the alveoli
were completely collapsed, the dorsoventral tracheal diameter was reduced more

lB.
than 5070, whilst the third to fifth order bronchi showed no change in size' There-
fore the lung volume estimated to be about 100 ml at ll ATA was contained
within the conducting zone of the lung. These authors also observed that the major
reduction in alveolar volume occurred by 3 ATA so that, when diving, the amount
of alveolar surface available must be greatly reduced before a depth of l0 m is
reached.
Alveolar collapse is dependent not only on airway reinforcement but also a
flexible thorax, Iarge distensible blood vessels within the thorax, large amounts of
elastic tissue in the lungs, and a resilient trachea (Ridgway, 1972)' A flexible
thorax, in the form of an increased number of floating ribs, is necessary to reduce
the resistance to the increased hydrostatic pressure. Distensible blood vessels such
as the reLe mirabilia of cetaceans and the pericardial venous plexus of many
pinnipeds and some cetaceans (Harrison and Tomlinson, 1963) are thought to
engorge with blood at depth and so partially fitl the thoracic cavity as the air in
the lungs is compressed (Ridgway,I972i Hui, I975). The elastic tissue of the lungs
allows them to become atelectic without separaLing from the chest wall, and the
resilient trachea allows the respiratory airways to collapse beyond the limits of
the sea-level dead-space volume (Ridgway, I972)'
I.5 SUMMARY
An important aspect in regard to the diving ability of marine mammals is
that the vast majority of dives undertaken are apparently within the aerobic dive
Iimit for each particular species. To enable the aerobic processes to function an
adequate oxygen supply is essential, which is achieved principally by an enlarged
blood oxygen store as compared to that of terrestrial mammals' This oxygen
source is supplemented by smaller amounts contained within the skeletal muscula-
ture and to a varying deqree that within the lun9s. other physiological and
biochemical mechanisms involved in diving, function to enable efficient utilization
of this oxygen supply. The role of the lung in diving is to ensure a rapid and
19.
sufficient supply of oxygen for the blood and muscle stores, and to minimize or
prevent the ill-effects associated with increased hydrostatic Plessure when diving
to deþth.
The aims of this study were therefore:
i) to examine and describe in detail the normal structure of the terminal
airways and gas exchange regions of the lung of an otariid species, the
Australian sea lion Neophoca cinerea, since many of the previous studies of
examples from this family have been cursory in reqard to these structures;
ii) to quantify, using morphometric techniques, those structures involved in gas
exchange and to determine the oxygen diffusing capacity of the lung, as
many detailed morphometric studies have been conducted on the lungs of a
wide variety of terrestrial mammals, birds, reptiles and amphibians, but no
report for a marine mammal species has yet appeared;
iii) to examine the lungs for evidence of patholoqy and where present to
describe the associated changes, and to isolate and identify the aetiological
agents; and
iv) to consider Lhe role of the normal respiratory structure and the morpho-
metric dif f using capacity in the availabiliLy and supply of the oxygen
required to perform aerobic dives and in the prevention of the problems
associated with increased hydrostatic pressure' and the influence of pul-
monary pathology on normal gas exchange'
20.
ChaPter 2
MATERIALS AND METHODS
2.I SPECIMEN COLLECTION
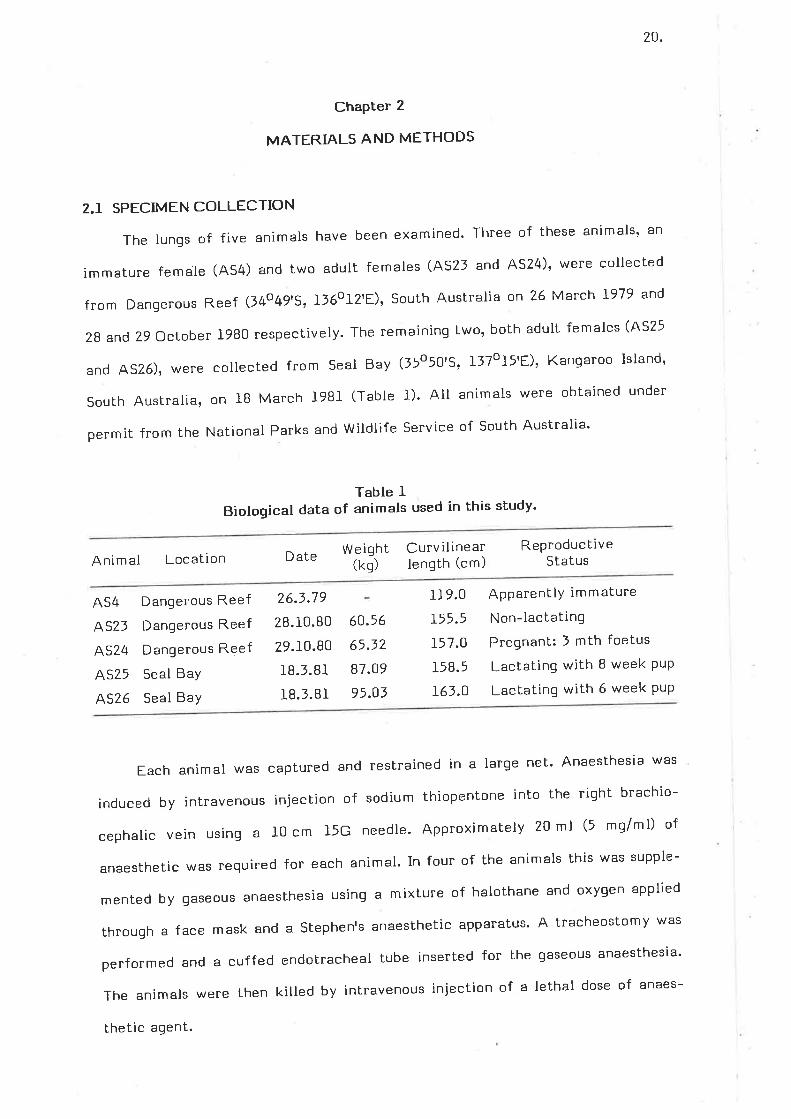
The lungs of five animals have been examined' Three of these animals' an
immature female (AS4) and two adult females (A52l and AS24)' were collected
from Dangerous Reef (l4o 4g'5, 136012'E)' South Australia on 26 March 1979 and
28 and 29 October 1980 respectively. The remaining two, both adult females (4525
and A526), were collected from Seal Bay (55050'5' ll7oI5'E)' Kanqaroo Island'
South Australia, on IB March l9B1 (Tabte 1). All animals were obtained under
permit from the National Parks and witdlife service of south Australia'
Table IBiological data of animals used in this study'
Animal Location Date Weight(kq)
Curv ilinearlenqth (cm)
ReproductiveStatus
AS4
AS23
AS24
AS25
4526
Dangerous Reef
Dangerous Reef
Dangerous Reef
Seal Bay
Seal BaY
26.3.79
28.10.80
29.10.80
1B.l.Bl
18.1.81
60.56
65.32
87.O9
95.O3
119.0
þ5.5L57.O
158.5
161.0
ApparentlY immature
Non-lactating
Pregnant: I mth foetus
Lactating with B week PuP
Lactating with 6 week PuP
induced bY intravenous
cephalic vein using a
Eachanimalwascapturedandrestrainedinalargenet.Anaesthesiawas
injection of sodium thiopentone into the right brachio-
l0 cm l5G needle. Approximately 20 ml (5 mg/ml) of
anaesthetic was required for each animal' In four of the animals this was supple-
mented by gaseous anaesthesia using a mixture of halothane and oxygen applied
through a face mask and a stephenrs anaesthetic apparatus' A tracheostomy was
performed and a cuffed endobracheal tube inserted for the gaseous anaesthesia'
The animals were then killed by intravenous injection of a lethal dose of anaes-
[hetic agent.
2T
2.2 LUNG FIXATION
Fixation of the lungs in situ was achieved by instillation through the endo-
tracheal tube, of Karnovsky's paraformaldehyde-glutaraldehyde fixative
(Karnovsky, 1965) in either 0.05 M sodium cacodylate buffer at pH 7'3 and
400 m0sm (animal AS4), or phosphate buffer at pH 7'4 and lB0 m 0sm (by freezing
point depression). A conslant head of pressure of l0 cm of water above the
sternum was maintained for one hour before the tube was clamped. The apex of
the left ventricle was also cannulated, through an upper' midline abdominal
incision and the same fixative perfused at a pressure of 120 mm of mercury'
Pressure in the cardiac cannula was measured by a sphygmomanometer and main-
tained by a foot pump connected to a 20 litre reservoir of fixative. Perfusion was
mainlained for one hour before the cannula was clamped' The nasal cavities of
animals AS25 and A526 were fixed by packing the nasopharynx with cotton wool'
fillinq the cavities with l0% buffered formalin, and packing the external nares
with cotton wool. The carcases were then placed in large polythene bags partially
filled with fixative and transported to the laboratory for detailed examination.
2.] LUNG VOLUME DETERMINATION
The trachea, lungs and heart were lemoved in toto four days to three weeks
afler arrival at the laboratory where the carcases had been stored in a cold room
at 4oC. The heart and major arteries and veins wele carefully dissected from the
Iungs. The lungs were reinflated to l0 cm pressure of water above mid-lung
height, with fresh fixative administered through a plastic tube inserted into the
trachea. Fixative from the lungs and tracheas of animals AS25 and A526 were
dnained off for collection of any free parasites within the airways. The Iungs were
then reinflated with fresh fixative to l0 cm pressure of water.
The left and right major bronchi were ligated as close as possible to the lung
parenchyma and the lungs divided. The volume of the right and left lung from each
animal was measured by water displacement. For this, each lung was carefully
22.
Iowered into a large plastic tub filled to the brim with water, completely sub-
merged and held in this position until no more water overflowed' The lung was
carefully removed from the tub and the tub refilled with measured quantities of
water until the level at the brim was reached, the volume of water needed to
refill the tub being the volume of the lung. Samples for morphological examination
were taken from peripheral and central areas of the right lung in each case, whilst
the left lungs wete reserved for morphometric study'
2.4 PARASITE COLLECTION AND INCUBATION
Any fluid which escaped from the lungs during sampling for morphology and
morphometry was collected. All of this fluid collected from the lungs and
tracheae was filtered through fine silk and any specimens of worms and mites
recovered were transferred to 70% ethanol'
The skulls of animals 4523, 24' 25 and ?6 were bisected on the midline and
examined in detail for the presence of mites' Despite fixation of the nasal cavities
with l0% formalin and subsequent storage in a cold room at 4oC for several
weeks, upon examination of the nasal cavities of animal 4525 a number of live
larval mites were recovered. These were incubated by placing them into a shallow
layer of physiological saline in a petri dish at room temperature of approximately
ZOIC, as described by Furman and Smith (I97r, to observe any in vitro develop-
ment.
2.5 MICROSCOPY
2-5.L Light MicroscoPY
setected samples of lung tissue, up to 1.0 x 2.0 x 0.5 cm in size, alonq with
parasitized regions of trachea, nasopharynx, and nasal turbinate were dehydrated
in alcohol and embedded in paraffin wax. Five micron sections were stained with
haematoxylin and eosin (H & E) or Miller's elastic stain (Miller, 1971)' Parasitized
regions of lung, nasopharynx and nasal turbinate were also embedded in
23
glycolmethacrylate according to the method of sims (I974), except that only
o.?5 g of benzoyl peroxide was used rather than 0.5 g. Two micron sections were
cu.t on a SorvaII JB-A microtome with Ralph knives made from either glass strips
fB mm wide and 6.5 mm thick (Bennett et al., I97O or ordinary glass slides
(Semba, IgiÐ. The sections were stained with Massonts Trichrome (Foote
Modification) as used routinely in this laboratory'
2.5-2 Transmission Electron Microscopy
samples from selected regions of the lungs were diced into small pieces,
l-l mmJ, and rinsed in several changes of 0.I M sodium cacodylate buffer (pH7'3'
120 m0sm) and Ieft in buffer overnight. Following this the specimens were post-
fixed for one hour in l% osmium tetroxide (oso4) in cacodylate buffer, rinsed at
least five times with distilled water to prevent precipitate formation, and then
block stained with 0.5% aqueous uranyl acetate for one hour' Specimens were
rinsed again with distilled water, dehydrated in increasing concentrations of
alcohol, and embedded in spurr's low viscosity resin held in Beem capsules
(Glauert, Ig75). These specimens were cured in a 70oC oven overnight' The blocks
were trimmed and I pm sections cut using glass knives. The sections were stained
with methylene blue - azure II and examined to enable specimen orientation'
ultra-thin sections, pale gold to silver, were cut with a diamond knife on a
Reichert 0m U2 ultramicrotome, mounted on either 200 mesh Cu/Rd grids or 75 x
J00 mesh Cu grids, and stained with 50% ethanolic uranyl acetate and Reynoldrs
lead citrate (Lewis and KnighL, L977). These were examined in a Philips EM 100
electron microscope with high resolution stage at 60 kV'
2.5.3 Scanning Electron Microscopy
Samplesoflung,upto5.0xJ.0x0.5cminsize,wereselectedto
demonstrate the terminal airways, and prepared by the method described by
Malick and wilson (Murphy, Ig78). Specimens were rinsed in sodium cacodylate
buffer, pH 7.3 and 32O mOsm, Ieft overnight, post-fixed in J-% oso4 for 1-2 hours
then processed as follows:
24.
l. Rinsed in six changes of distilled water over 15 minutes.
Z. Immersed in freshly prepared l% thiocarbohydrazide (TCH) (Eastman Kodak)
zO-tO minutes.
3. Rinsed in distilled water as in step J''
4. Immersed in 1% aqueous OsO4 'for 2-3 hours'
5. Rinsed in distilled water as in step I'
6. Step 2 repeated.
7. Rinsed in distilled water as in step 'I'
B. Step 4 repeated.
9. Rinsed in distilled water as in step I'
Throughout the procedure specimens were placed on a rotator aL 6O levo-
lutions per minute. The TCH solution was prepared by rinsing 0.5 g TCH in
distilled water several times until the majority of crystals turned from a dark grey
to an off white colour. Twenty-five mitlilitres of distilled water was added to the
beaker containing the TCH and then heated to 60oC for several minutes. The
solution was allowed to cool to room temperature in a cupboard to avoid direct
sunlight. prior to being added to the specimens the solution was filtered through a
0.47 pm Millipore filter.
The specimens were dehydrated by passing them through 71o/o acelone for
10-15 minutes and then kept in 100% acetone overnight. This was followed by two
changes of dry 100%o acetone over the next 24 hours. specimens were critically-
point dried in a Denton critical-point drier, mounted on stubs with colloidal silver
(Pelco) and examined in a siemens Etec Autoscan at 20 kv. some specimens,
which were dissected following initiat examination to expose suitable areas' were
coated with 10 nm of carbon and 20 nm of gold-palladium in a Denton vacuum
evaporator and re-exam ined.
25.
ChaPter 5
NORMAL RESPIRATORY sTR UCTURE
}.I INTRODUCTION
Research into the diving capabilities of marine mammals, pinnipeds in
particular, has been principally by physiological methods to determine the depth
and duration of dives (Scholander, 1940; Kooyman' 196Ò and the utilization of
oxygen during such dives (lrving, 1939; Scholander, I94O; Ridgway et al', 1969;
Kooyman, et al., I97I1 I97Ð. Detailed microscopic examination of the respiratory
system has been, for the most part, Iimited to the cetaceans (wislocki, 1929; 1942;
Bélanger, J-940; Fanning, I97Ð and the sirenians (wislocki, L935) whilst most
studies of the pinniped respiratory system have been limited to the upper airways
and light microscopic examination (Denison and Kooyman, 1973; Boshier and Hill'
L974; Boyd, 1975).
f.2 TERRESTRIAL MAMMAL RESPIRATORY SYSTEM
f.Z.I MacroscoPic
classically the mammalian respiratory system has been divided into three
distinct functional zones:
i) the conducting zone: which contains the nose and nasopharynx; the larynx;
the trachea; the two major, or primary, bronchi; the secondary bronchi; the
tertiary bronchi and their subdivisions including the terminal bronchi; and
the bronchioles.
ii) the intermediate zone: containing the terminal bronchioles; the respiratory
bronchioles; the alveolar ducts; and the alveolar sacs'
iii) the respiratory zone: which contains the alveoli and their associated
caPillarY network.
The components of each zone ate not always present nor as well developed
in all species.
26.
The lungs are also divisible by structural features into zones which possess
some functional characteristics. The first division is into two lungs, left and right,
one lying on either side of the thoracic midline, each being supplied by a major
bronchus. The next zone) present in most terrestrial mammals, is into lobes;
generally there are more lobes on the right side. Each lobe is supplied by a branch
of the primary bronchus, the secondary ot lobar bronchus. The division into lobes
is by fissures in the surface of the lung which penetrate into the parenchyma for a
variable distance. These fissures are lined by a continuation of the visceral pleura
which covers each lung. Each lobe is subdivided into bronchopulmonary segments
which are supplied by tertiary, or segmental, bronchi. The segments are struc-
turally separated by connective tissue septa which are most apparent subpleurally
but become tenuous and indistinct deeper within the parenchyma (Krahl, 1964;
Reid, 1967).
The next zone is the secondary pulmonary lobule which, despite certain
disagreements, mainly of a semantic nature, is described as the smallest region of
the lung outlined by connective tissue septa (von Hayek, 196O; Thurlbeck and
Wang, I974; Murray, L916). The secondary pulmonary lobules are the smallest
macroscopic subdivisiong of the lung (Pump, 1964) and contain 3-5 terminal bron-
chioles together with the parenchyma they supply (Reid, 1967; Murray, I976;
Inselman and Mellins, IgBl).
The final structural zone also has a functional basis and for this reason a
number of definitions have been presented, with two in particular gaining favour
with pulmonary anatomists and physiologists. The first of these definitions and the
term pulmonary acinus were introduced by Rindfleisch in IB72 (Nagaishi, 1972) Lo
describe the terminal morphological and functional unit of the lung. This defini-
tion considers those structures distal to, but excluding, the terminal bronchiole as
the acinus, a view still held by many (Reid, 1967; Gamsu et al., I97Ii Thurìbeck
and wang, L974; Murray, I976; Inselman and Mellins, 19Bl). Then in I92I
Loeschcke (Nagaishi, Ig7Ð considered the pulmonary acinus to comprise the
27.
terminal bronchiole together with the structures distal to it, a definition still
adopted by others (Pump, 1969; Boyden, I97Ii Nagaishi, 1972; Hansen et al', L975;
Young et al., 1980; Schreider and Raabe, lg8l).
3.2.2 Microscopic
The normal microscopic structure of the respiratory system has been studied
in a wide variety of terrestrial mammals. Details of the normal structure, with
mention of species differences, can be found in the reviews of Weibel (1973),
Rhodin (I97Ð and Breeze and Wheeldon (1977).
].] PINNIPED RESPIRATORY SYSTEM
The pinniped respiratory system is typically mammalian in its overall design,
having the three functional zones.
f.f.I Macroscopic
The division of phocid lungs, into lobes, vaties greatly between different
species. The ribbon seal, Histriophoca fasciata (now called Phoca fasciata Burns,
l-981), at one extreme, has no external fissures to divide either lung into lobes and
has no accessory lobe (Sokolov et aI., I97L), On the other hand, in the bearded
seal, Eriqnathus barbatus nauticus and the ringed seal, Pusa hispida kraschennikovi
(now called Phoca hi ida his ida Frost and Lowry, lgBl) each lunq is divided into
three distinct, independent lobes, as well as an accessory lobe on the right
(Sokolov et al., l97l). Between these extremes are the Weddell and the grey seals
which have only two lobes on the left, and three (grey seal) or four lobes (Weddell
seal) on the right side (Hepburn, J-896; I9I2; Boyd, I975)'
Less variation appears to exist in the lung lobation of otariids. In the
Stellerrs sea lion, Eu m atop ius iubatus. the left lu ng is incompletelY divided into
two lobes whitst the right lung is deeply fissured to form four lobes (Sokolov et al.,
l97l). The lungs of the California sea lion have been described as Possessing three
distinct lobes on each side (Green, I97Ð'
28.
Inphocidlungstheintrapulmonaryairwaysaresupportedbyhyalinecar-
tilageplatesdowntotheleveloftheterminalbronchioles,whilstinotariidsthe
carlilage plates are present to the airway termination'
5.J.2 MicroscoPic
(a) IntrapulmonarY airwaYs
The walls of the intrapulmonary airways consist of a mucous membrane; a
muscular layer; a submucosa; a f ibrocartilaginous layer; and an adventiLia.
The mucous membrane comprises an epithelium, a basement membrane and
a lamina proPrta.
(i) Epithelium: The conducting airways are Iined by a pseudostratified ciliated
columnar epithelium with goblet cells. This becomes a simple columnar epithelium
without ciliated cells and fewer goblet cells in the smallest bronchi of phocids
(BoshierandHilì,IgT4;Boyd,1975;WelschandDrescher'1982)'
(ii) Basement membrane: The epithelium rests on a thick basement membrane'
(iii) Lamina propria: The thick, predominantly circular lamina propia contains
collagen and elastic fibres'
(iv) Submucosa: The submucosa of smooth muscle and connective tissue elements
contains many large mucous glands, Iymphocytic accumulations, medium-sized
bloodvesselsand,intheWeddellseal,gland-Iikediverticulae.Thesmoothmuscle
bundles of the submucosa form a helical network which is continued down to the
level of the bronchioles. The simple, branched tubulo-alveolar bronchial glands
contain a predominance of cuboidal mucous secreting cells wiLh small numbers of
pure serous and seromucous alveoli. The large diverticulae, which are closely
associated with the glands in the trachea, have a non-secretory epithelium of low
cuboidal and simple squamous cells (Boshier and Hill, 1974; Boyd, I975; Welsch and
Drescher, I9BZ).
(v) cartitage: In phocids the airway cartilage plates become smaller and more
irregular distally, down to the level of the terminal bronchioles at which point the
distinct smooth muscle layer alone forms the support for the airway walt (King
29
and Harrison, 196I; Simpson and Gardner, I972i Denison and Kooyman, 1971;
BoshierandH.LllrI974 Boyd,IgT5iWelschandDrescher'1982)'
The terminal airways of otariids are supported by irfegular plates of carti-
lage down to the level of the alveolar sacs' at which point the cartilage plates
form a terminal ring (Denison et al., I97I; Simpson and Gardnet' I972; Denison
and Kooym an, L973).
(b) Bronchioles
Bydefinitionabronchioleisanintrapulmonaryairwaywhichdoesnothave
cartilaginous support in its wall (Reid, 1967). However, in the literature the
terminal airways of both phocids and otariids have generally been referred to as
bronchioles despite the presence of cartilage within their walls' For this reason
the ,,bronchioles,, of otariids (simpson and Gardner, I972; Denison and Kooyman'
Ig73)havebeenincludedinthisdescriptionofthebronchioles.
(i) Epithelium: In phocids the epithelium of the terminal bronchioles is formed of
simple cuboidal cells with no ciliated or goblet cells' This continues into the
respiratory bronchioles which carry occasional alveolar outpouchings in their walls
(BoshierandHill,LgT4;Boyd,IgT5iWelshandDrescher'1982)'
(ii) submucosa: In phocids no glands or diverticulae are present in the submucosa'
and the outer elastic fibre layer of the upPer airways eontinues down to this level'
surrounding the smooth muscle (Boyd, L975)' In otariids, the arrangement of some
of these structures is quite variable in the lower airways' In a small bronchus of a
steller's sea lion epithelial goblet cells were extremely abundant but no sub-
mucosal glands were evidence' whilst in a similar airway in a california sea lion
the reverse situation was observed (Simpson and Gardner' 1972)'
(c) ParenchYmal subdivisions
The secondary lobule is considered to be the terminal respiratory unit in
phocid lungs. This lobule is about 1.5 x 2.0 mm in size and is supplied by an
occasionally alveolated muscular terminal bronchiole which branches into several
respiratory bronchioles (welsch and Drescher, IgB2)' This structure is considered
30.
tobeasecondarylobulebyBoydQgT5)whosta|edthattheprimarylobuleisthat
connective tissue-bound region supplied by a cartilage-supported "bronchiole"
which then branches to form B-L0 terminal bronchioles'
In otariids the terminal airway Ieads directly into a pair of alveolar sacs'
called a secondary lobule, which is contained within a fibrous connective tissue
sheath (Denison et al., I97L; Denison and Kooym an, 1973). These fibrous sheaths,
which divide the parenchyma into discrete lobules, are characteristic of pinniped
Iungs and are more pronounced in the lungs of otariid seals than phocids (simpson
and Gardn et, I972i Denison and Kooym an' 1973)'
(d) Alveolar ducts and alveolar sacs
The respiratory bronchioles in phocid lungs are continued distally as the
alveolar-lined alveolar ducts which have a simple squamous epithelium' The ducts
terminate as alveolar sacs which are divided into alveoli by the alveolar septa
(Boshier and Hill, I974;Boyd, I975; Welsch and Drescher, I9B2). In otariid lungs
therearenoalveolarducts;thealveolarsacsarisedirectlyfromtheterminal
airways (Denison and Kooym an, 1973)'
Several descriPtions of phocid lungs report the formation of myoelastic
bronchioles and alveolar ducts (Belanger' 1940;sphincters in the resPiratorY
Simpson and Gardn et, LgThiBoshier and Hill, I974; Welsch and Drescher, l9B2) but
these have not been reported by others (Denison and Kooym an' 1973; Boyd' 1975)'
(e) Alveoli
The alveoli first aPpear in the walls of the respiratory bronchioles in phocid
lungs and become more abundant distally, forming part of the walls of the alveolar
ductsandsacs.Inotariidsthealveoliarepresentonlyinthealveolarsacs.
(i) Alveotar septum: The alveolar septum of phocids is very similar to that of
terrestrial mammals, with typical squamous type I epithelial cells and their cyto-
plasmic extensions which cover the majority of the septal walls (Boshier and Hill'
Ig74; Boyd, I975i Welsch and Drescher, 1982)' The secretory type II epithelial
cells contain the lamellar bodies considered to be a source of alveolar surfactant'
3r.
Adjacent epithelial cells are joined by desmosomes and tight junctions; the epi-
thelium lies on a distinct basement membrane which in some regions is formed in
part by fusion with the basal lamina of the underlying, typically mammalian non-
fenestrated capillary endothelium. The fibrous framework of the alveolar wall
consists of fibroblasts, some smooth muscle cells and collagen and elastic fibres.
(ii) Capitlary arrangement: The alveolar walls of pinniped lungs are generally
considered to carry a single capillary network as has been well demonstrated in
phocids (Simpson and Gardner, I972; Boshier and Hill, I974; Boyd, I975; Welsch
and Drescher, l9B2). For otariids, however, there are two preliminary reports
which describe the presence of a double capiltary network in the alveolar wall of
the Steller's sea lion (Simpson and Gardner, 1972) and the Australian sea lion
(Fanning, 1977). This double capillary arrangement is generally regarded as being
unique to the Cetacea and Sirenia (Simpson and Gardnerr IgT2; Fanning, 1977)'
(iii) Alveolar macrophages: Occasional macrophages containing lysosomes were
found free in the alveoli (Boshier and H ill, I974; Boyd, I975)'
,.4 RESULTS
f.4.1 Macroscopic
(a) Trachea
The trachea and main stem bronchi consisted of dorsally incomplete rings of
hyaline cartilage. The ends of the cartilages overlapped and were joined by a
strong fibrous connective tissue sheath. The trachea divided into the right and left
major bronchi one-quarter of the distance from the larynx to the hilum (Fi9s. I
and 2).
(b) Lungs
Each lung was triangular in shape with the apices lying cranially, caudally
and ventrally (Figs. I and 4). The lungs were divided by complete pleura-lined
fissures into lobes. The left Iung had only one fissure which divided the lung into
cranial and caudal lobes (Fiq. l). The right lung was divided into three major lobes;
32.
cranial, middle and caudal (Fiq.4). On the medial aspect of the right caudal lobe
[here was a small accessory lobe (Fig. 2). Apart from the complete fissures which
divided the lungs into lobes, all surfaces of the lungs carried a variable number of
similar but incomplete fissures (Figs. J and 4). The division of the parenchyma into
lobules by connective tissue septa was readily apparent through the pleura (Figs. 5
and 4).
(c) Lobular bronchi
The tobular bronchi were up to 0.25 mm in diameter (Figs. 5 and 6). The
Iength of these bronchi was highly variable and depended on the region of the lunq.
This has not been studied in detail.
3.4.2 MicroscoPic
(a) Lobular bronchi
The Iobular bronchi arose from the tertiary bronchi; the junction between
the two was well demarcated by an abrupt change from the pseudostratified
ciliated columnar epithelium with goblet cells of the tertiary bronchus to the
pseudostratified to simple columnar non-ciliated cells of the lobular bronchus
which became simple cuboidal distally (Figs' 7, B and 9)'
(i) Epithelium: The epithelium of the lobular bronchus has been divided into two
regions; an initial transition region of columnar cells, and the main part of the
lobular bronchus with cuboidal cells.
The epithelium of the short transition region was columnar in type and the
cells were either secretory or non-secretory. occasional ciliated and microvillous
cells were also Present.
For most of the tength of the lobular bronchi the epithelium was cuboidal in
type and could be classified into microvillous or non-microvillous cells. Occasional
areas of the epithelium contained squamous cells and cuboidal ciliated cells'
The lateral surfaces of adjacent epithelial cells were joined by tight
junctions near the lumenal surface with pronounced intercellular interdigitating
processes.
3t.
The transition region contained four types of epithelial cells,and migratory
cells.
i) Secretory cells: The secretory cells which measured from -l-0 to lB pm in
height contained a round to ovoid nucleus, up to 6 ¡rm in diameter, which
was basally situated and occasionally appeared bi-lobed in section (Fiqs. L1
and I2). The apical cytoplasm contained a variable number of membrane-
bound granules which ranged in diamter from 0.6 to l-.0 um. Many of [hese
granules wele homogeneously electron-denser whilst others were of
moderate electron density and contained an obvious electron-dense core of
variable size (Figs. l2 and Il). Other organelles present included a supra-
nuclear Golgi complex, scaltered mitochondria, many small clear vesicles up
to 0.1 um in diameter, profiles of rough endoplasmic reticulum, free ribo-
somes, and occasional bundles of fine fibrillar material. The apical surface
camied a small number of microvillous-like projections up to 0.5 pm high
and 0.ll um wide (Fiqs. 12 and 1l)'
ii) Non-secretory cells: Much of the cytoplasm of these columnar cells, up to
15 um in height, was occupied by the large ovoid nucleus which was B pm
x 4 um (Figs. 14 and l5). The remainder of the cytoplasm contained endo-
plasmic reticulum, most of which was rough, mitochondria, a Golgi complex,
an occasional secretory granule 0.25 to 0.5 um in diameter, an occasional
multivesicular body, and ofLen a large lysosome. On the apical surface was a
small number of blunt cytoplasmic projections 0.7-0.9 x 0.4-0.6 um which
sometimes contained a few organelles such as ribosomes or profiles of
endoplasmic reticulum. The lateral surfaces had long thin cytoplasmic
processes which interdigitated with those of adjacent cells.
iii) Citiated cells: The transition region contained small numbers of columnar
ciliated cells, ll to 2l Um high (Figs. L0 and ll). These cells had many
typically structured cilia, up to 6 um long, projecting from the apical
surface between which were many slender microvilti 1.5 x 0.08 ¡rm in size
34.
(Fiq. 16). The cilia could be seen to originate from the basal bodies of the
apical cytoplasm. The oval nucleus was basally situated, above which was a
zone of many elongate mitochondria I.6 x 0.1 um. Other organelles present
included clear vesicles about 0.2 ym in diameter' an occasional membrane-
bound granule up to 0.5 pm diameter, some endoplasmic reticulum, free
ribosomes and occasional bundles of cytoplasmic filaments.
iv) Microvillous cells: A small number of columnar microvillous cells, 9 to
tl ym in height, were present in the transition region (Figs. l-l and 14). They
carried a variable number of regularly-shaped microvilli, 0.9 x 0.15 Fm, on
their apical surface. The microvilli contained fine axial filaments which
continuedintotheapicalcytoplasm(Fiq.u).Theovoidnucleuswasbasally
situated, and the majority of the organelles occurred in the apical cyto-
plasm. These included mitochondria, a small number of free ribosomes, an
occasional vacuole and multivesicular body, and small bundles of fine fila-
ments (Figs. 14 and l7).
v) Migratory cells: Occasional migratory cells were observed in the epithelium
of the transition reqion and the lobular bronchi (Fig' lB)' The shape of these
cells was hiqhly variable, depending on their location. The cytoplasm was
pale staining and contained many round, homogeneously electron-dense
granules 0.6 to 1.0 um in diameter. Other organelles included a small
number of mitochondria, a few profiles of endoplasmic reticulum and many
scattered ribosomes. The nucleus often appeared bi-lobed.
There were six types of epithelial cells present in the main part of the
lobular bronchi as well as a small number of migratory cells.
vi) Cuboidal secretory microvillous cells: These cuboidal cells, from 6 to B ,ym
high, contained a variable number of large vesiclesr 0.6 to 2 vm, which often
contained osmiophilic lamellae or amorphous material (Figs. 19, 20 and 24).
Also present were smaller vesicles,0.2 to 0.5 um, with granular contents
and an occasional multivesicular body (Figs. 20 and 21). The large, often
35.
indented, nucleus tended to be centrally situated, and numerous mito-
chondria which varied in shape from round, 0.1 to 0.4 ¡'rm, to elongate,
I.j x O.j um, were scattered throughout the cytoplasm. A Golgi complex
was generally present adjacent to the nucleus, together with many profiles
of rough endoplasmic reticulum. Also present within the cytoplasm wete
many free ribosomes and scattered bundles of fine filaments (Fiqs. 2Or 2I
and ZZ). The short microvilli, 0.5 x 0.9 Um, occurred predominantly on the
apical surf ace and contained slender axial f ilaments which entered a
terminal web within the apical cytoplasm (Figs. 2or 22 and 23).
vii) Columnar secretory microvillous cells: These secretory microvillous cells
appeared columnar in shape, B to l2 ¡rm high, due to their apical cytoplasm
which bulged into the airway lumen (figs. 23r 25 and 26). The apical cyto-
plasm contained many profìles of rough and smooth endoplasmic reticulum
which often appeared dilated (Figs. 27 and 2B). Scattered throughout the
cytoplasm were several large vesicles,0.5 to 1.0 ¡im diameter, which con-
tained osmiophilic lamellae or amorphous material, and a small number of
moderately electron-dense secretory granules 0.5 ym in diameter' The
mitochondria were most often elongatedr 0.l-0.6 x I.0-l'0 pm, and generally
possessed distinct cristae. Other organelles present included free ribosomes,
a prominent Golgi complex and an occasional multivesicular body. The large
ovoid nucleus was centrally located. A small number of microvilli,
0.6 x 0.I um, which contained slender axial fitaments, projected mainly from
the periphery of the apical surface of the cell'
viii) Non-secretory microvillous cells: The non-secretory microvillous cells were
present in small numbers in the epithetium of the lobular bronchi (Figs.25
and 29). These squat cells tended to be wider, 7 Lo 9'¡rm, than they were
high,4 to 6 ym (Figs. 29 and 30). They had many regularly-shaped, closeìy-
arrayed microvilli, 0.7 x 0.12 pm, which wete generally located on the
central region of the apical surface. The prominent axial filaments within
36.
the microvilli extended into the apical cytoplasm (Fiqs. f0 and ll). The celts
contained a basally situated ovofd nucleus, a Golgi complex, elongate mito-
chondria 0.1-0.2 x 1.0-2.0 pm, free ribosomes, smooth endoplasmic
reticulum, an occasional vacuole or membrane-bound vesicle, 0.2 y m
diameter, multivesicular bodies and bundles of cytoplasmic f ilaments.
ix) Non-microvillous cells: These squat, cuboidal cells, 7.6-8.8 x 6.6-7.6 ¡tm,
had round to oval, centrally-located nuclei, some elongated mitochondria
O.3 x 2.5 ¡rm, profiles of rough endoplasmic reticulum, and variable numbers
of vesicles up to 0.5 Um and membrane-bound granules up to 0.3 pm in
diameter. Some of these cells possessed small, blunt cytoplasmic plo-
jections, 0.09-0.16 xO.2O-O.28 Ìrm, on their lateral and apical surfaces (Figs.
29,32 and ll).
x) Ciliated cells: The ciliated cells were found in the lower regions of the
lobular bronchi in very small numbers (Fiqs. 23 and l4). These cells were
similar, in most aspects, to those of the transition region. However, they
tended to be more cuboidal in shape, being only about 7 ¡rm high.
xi) Squamous cells: The squamous cells were similar to the type I cells of the
alveolar septal walls. They occurred infrequently in the more distal seg-
ments of the lobular bronchi. The thin cytoplasmic extensions of these cells,
which most commonly contained only small pinocytotic vesicles, covered the
occasional capillaries which protruded between the cuboidal cells (Figs. )5
and 36).
(ii) Basement membrane: The basement membrane underlyinq the epithelium
consisted of a thin distinct basal lamina with variable numbers of associated
collagen and elastic fibres (Figs. 12, 14,26 and 32).
(iii) Lamina propria: This was a prominent fibrous connective tissue layer that
supported the basement membrane. It consisted of collagen and elastic bundles in
varying proportions (Figs. IIr 25 and 26). The extent of the lamina propria was
evident in LM sections stained with Millerrs elastic stain (Figs. 17 and lB).
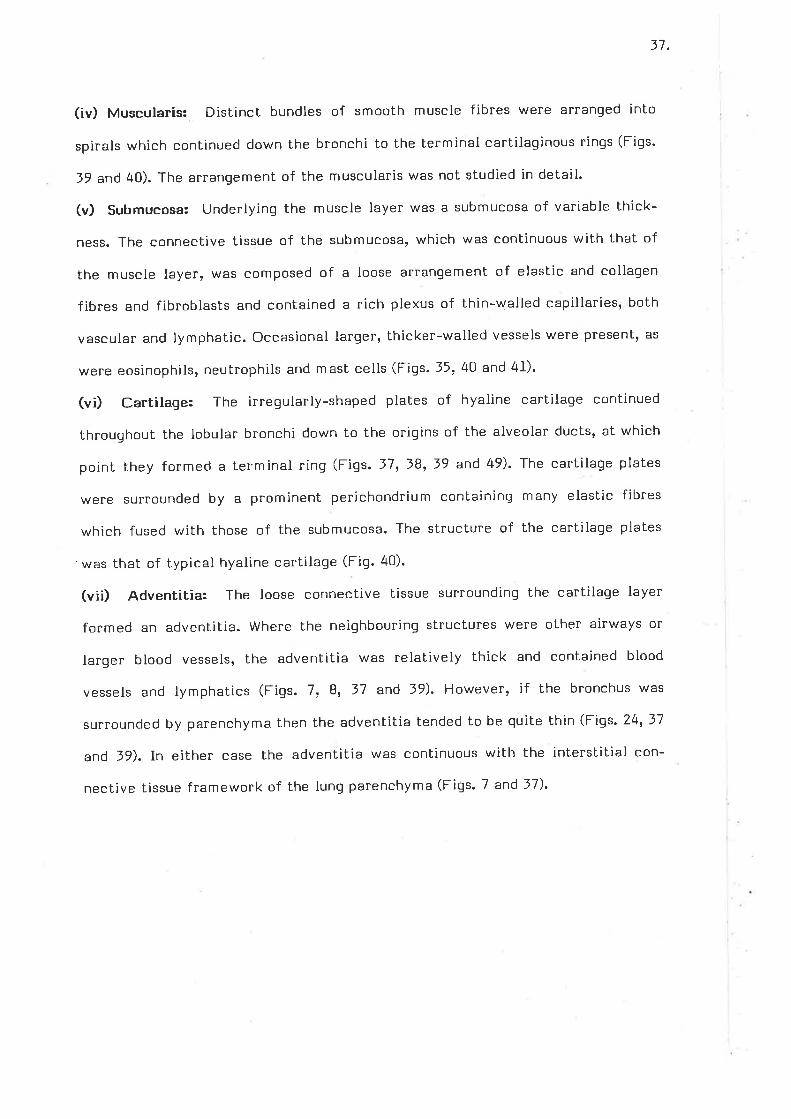
31.
(iv) Muscularis: Distinct bundles of smooth muscle fibres wete arranged into
spirals which continued down the bronchi to the terminal cartilaginous rings (Fiqs.
39 and 40). The arrangement of the muscularis was not studied in detail.
(v) Submucosa: Underlying the muscle layer was a submucosa of variable thick-
ness. The connective tissue of the submucosa, which was continuous with that of
the muscle layer, was composed of a loose arrangement of elastic and collagen
fibres and fibroblasts and contained a rich plexus of thin-walled capillaries, both
vascular and tymphatic. Occasional larger, thicker-walled vessels were present, as
were eosinophils, neutrophils and mast cells (Figs.35r 40 and 4l).
(vi) Cartilage: The irregularly-shaped plates of hyaline cartilaqe continued
throughout the lobular bronchi down to the origins of the alveolar ducts, at which
point they formed a terminal ring (Fiqs. t7r i9r 39 and 49). The cartilage plates
were surrounded by a prominent perichondrium containing many elastic fibres
which fused with those of the submucosa. The structure of the cartilage plates
.was that of typical hyaline cartilage (Fiq. 40).
(vii) Adventitia: The loose connective Lissue surrounding the cartilage layer
formed an adventitia. Where the neighbouring structutes were other airways or
larger blood vessels, the adventitia was relatively thick and contained blood
vessels and lymphatics (Figs. 7, B, 37 and 39). However, if the bronchus was
surrounded by parenchyma then the adventitia tended to be quite thin (Fi9s. 24r 37
and l9). In either case the adventitia was continuous with the interstitial con-
nective tissue framework of the lung parenchyma (Figs. 7 and J7).
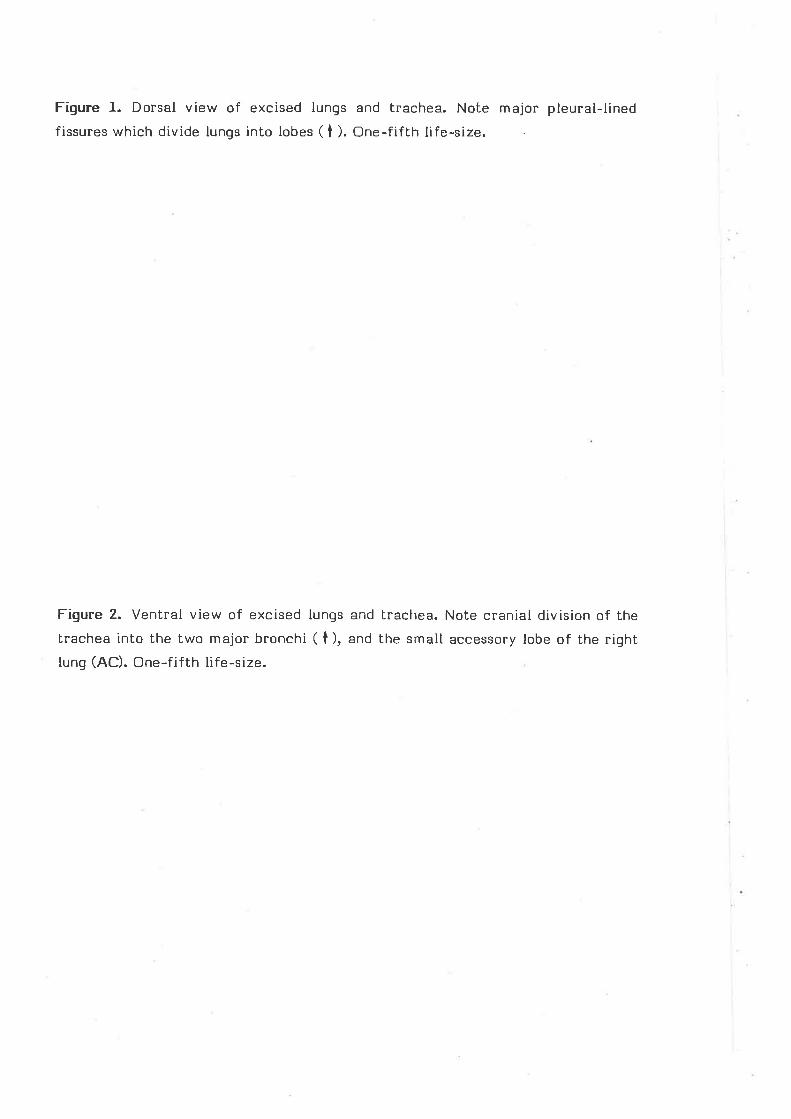
Figure l. Dorsal view of excised lunqs and lrachea. Note major pleural-lined
fissures which divide lungs into lobes ( t ). One-fif th life-size.
Figure 2. Ventral view of excised lungs and trachea. Note cranial division of the
trachea into the two major bronchi ( t ), and the small accessory lobe of the rightlunq (AC). One-fifth Iife-size.
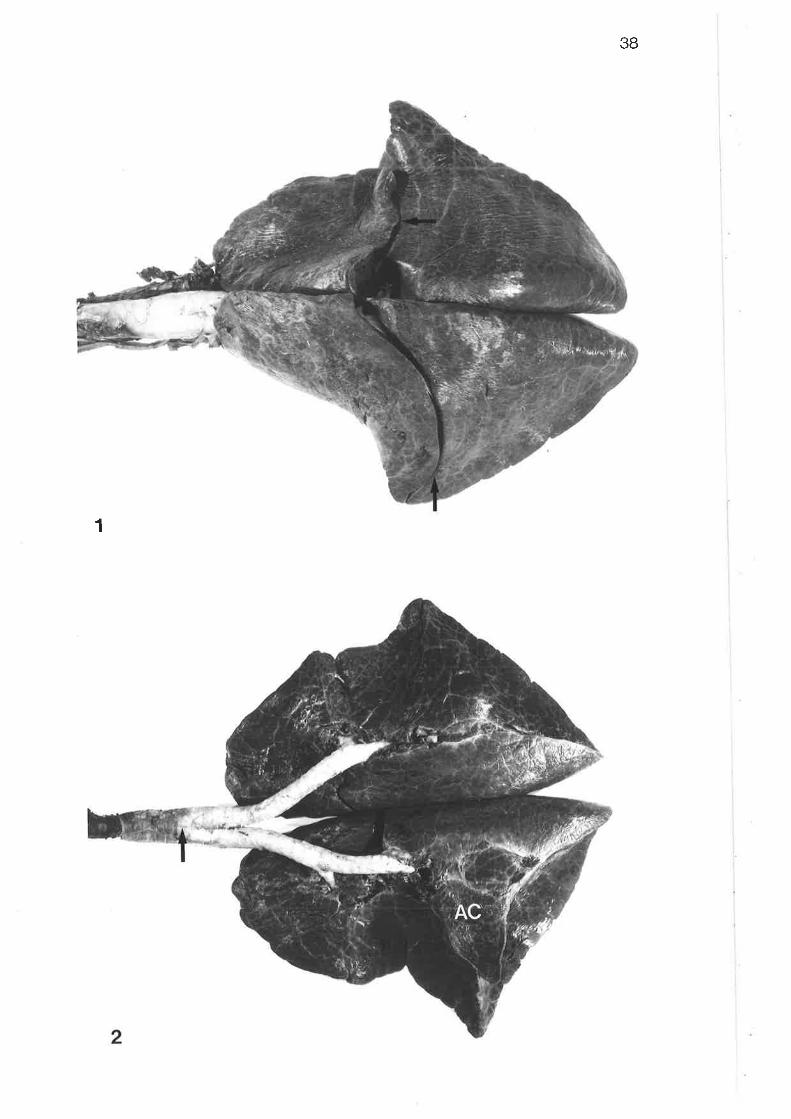
38
1
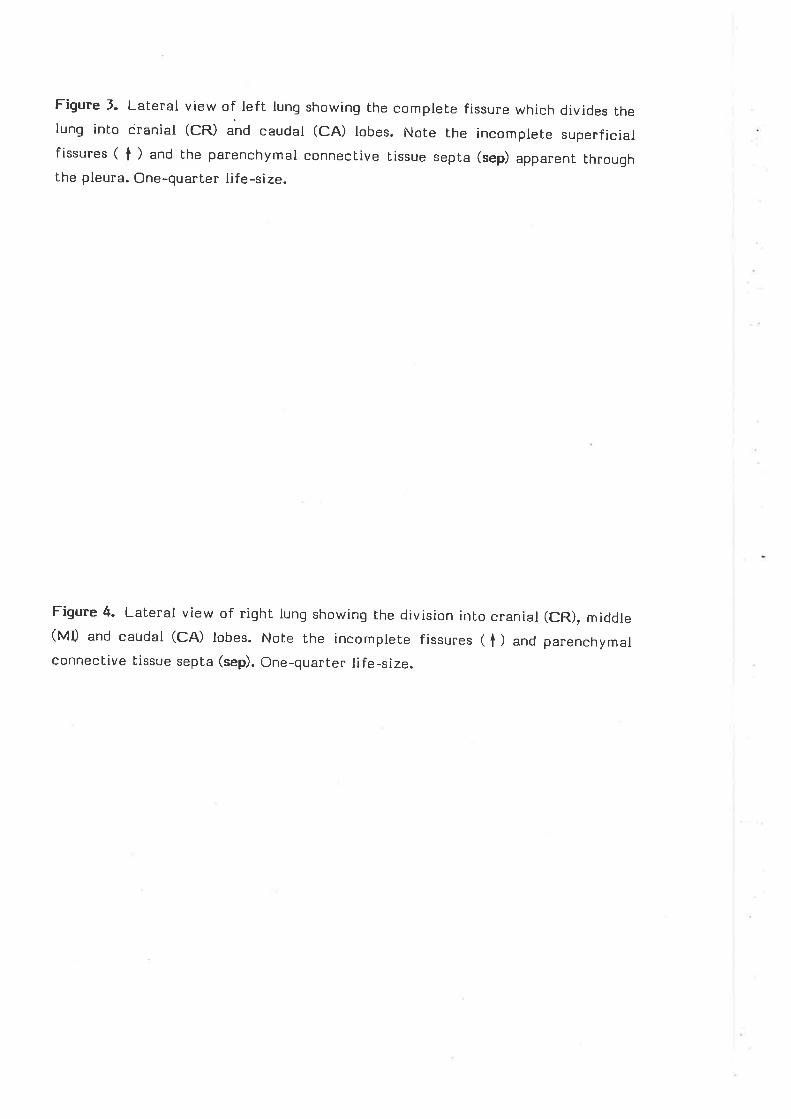
Figure i- Lateral view of left lung showing lhe complete fissure which divides thelung into cranial (CR) and caudal (CR) toUes. Note Lhe incomplete superficialfissures ( I ) and the parenchymal connective tissue septa (sep) apparent throughthe pleura. One-quarter life-size.
Figure 4- Lateral view of right lung showing the division into cranial (CR), middle(MI) and caudal (CR) tones. Note the incomplete fissures ( I ) and parenchymalconnecLive lissue septa (sep). One-quarter life-size.
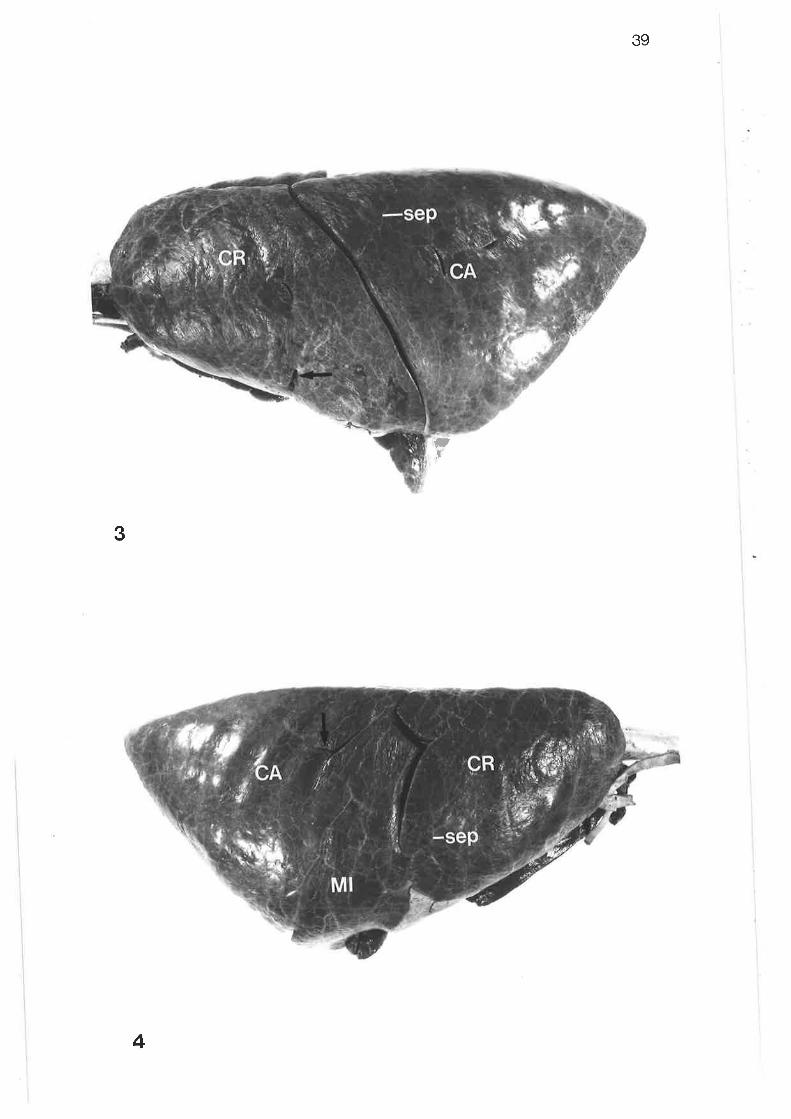
39
pI
3
4
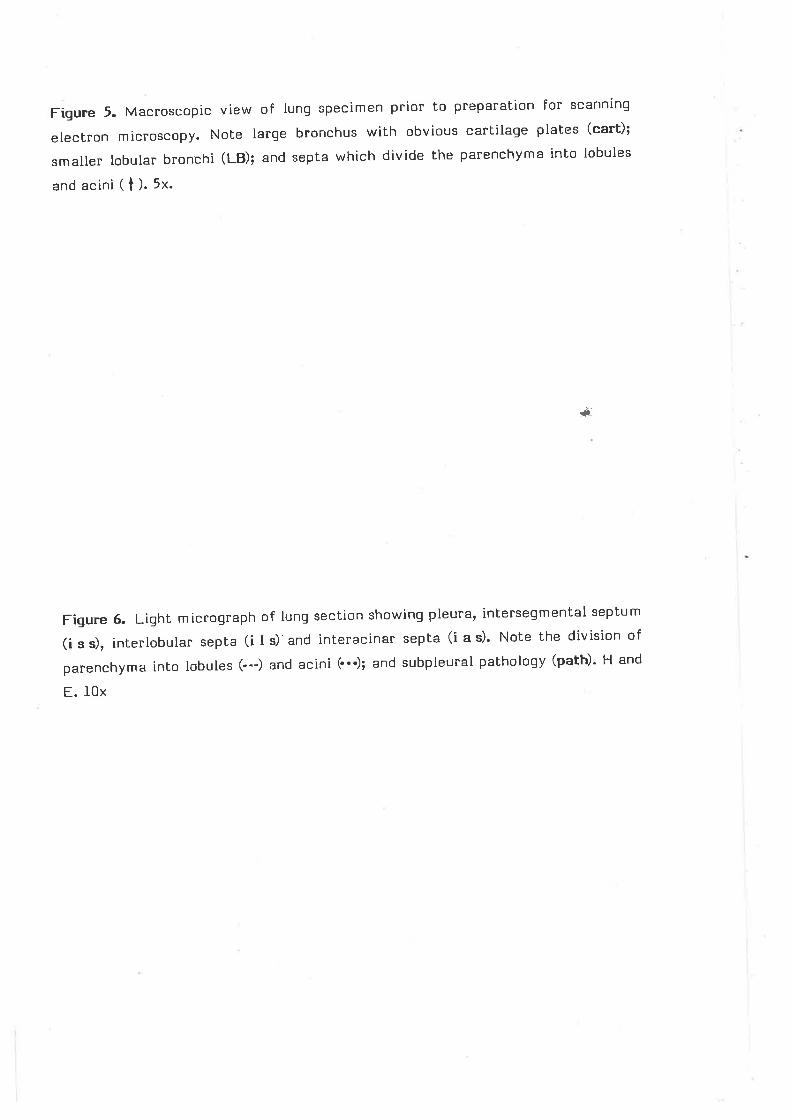
Figure 5. Macroscopic view of lung specimen prior to preparation for scannlng
electron microscopy. Note large bronchus with obvious cartilage plales (cart);
smaller lobular bronchi (LB); and septa which divide the parenchyma into lobules
and acini ( t ). 5x.
I
Figure 6. Light micrograph of lung section showing pleura, intersegmental septum
(i s s), interlobular septa (i I s)'and interacinar septa (i a s)' Note the division of
parenchyma into lobules G--) and acini (...); and subpleural pathotogy (path)' H and
E. lOx
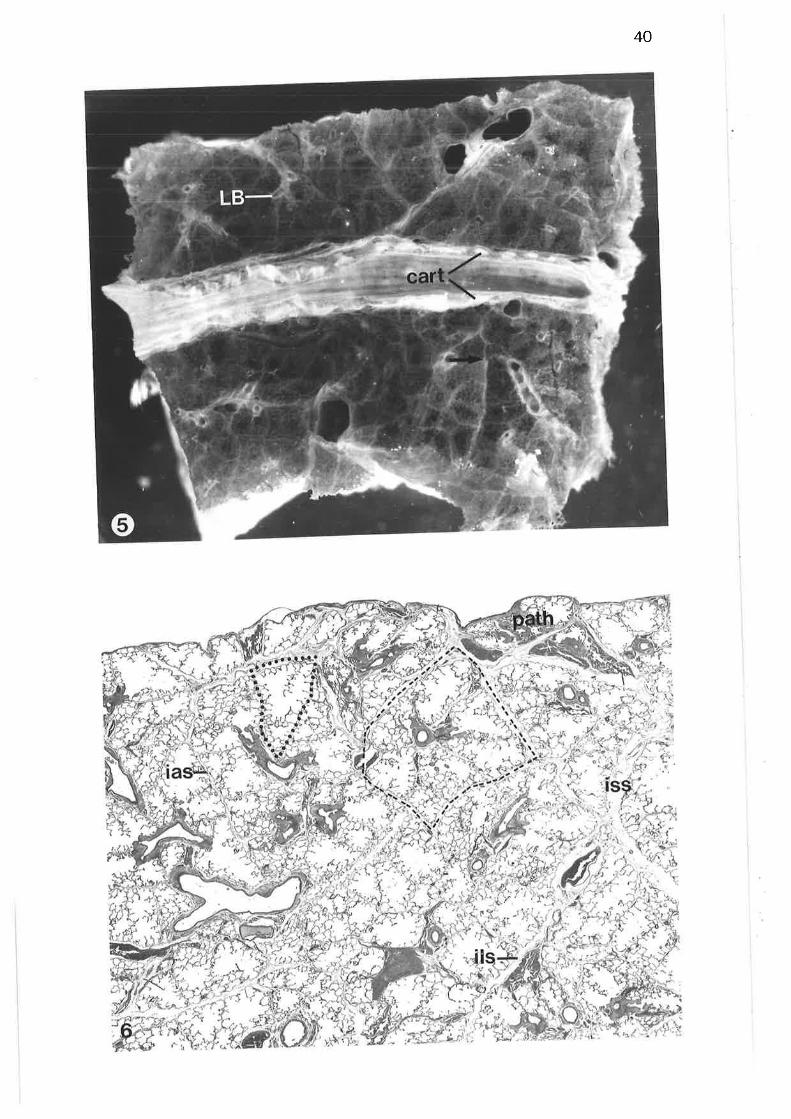
40
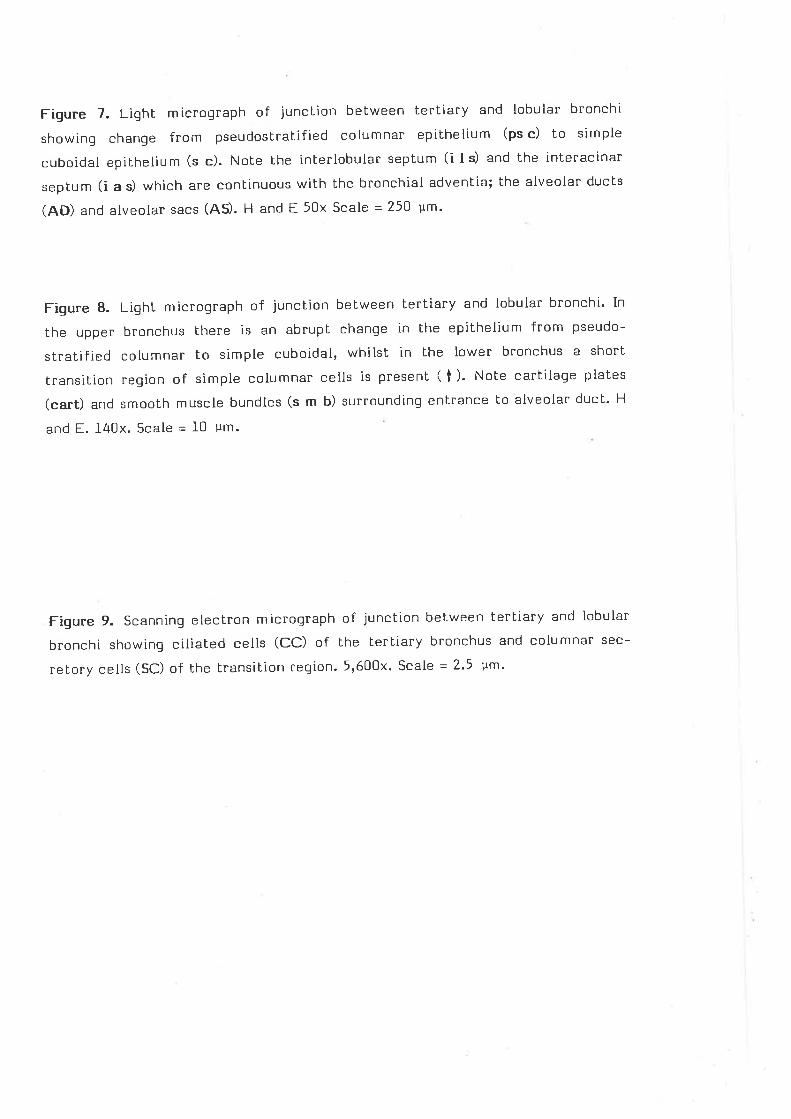
Figure 7. Light micrograph of junction between tertiary and lobular bronchi
showing change from pseudosbratified columnar epithelium (ps c) to simple
cuboidal epithelium (s c). Note the inLerlobular septum (i I s) and the interacinar
septum (i a s) which are conlinuous wilh the bronchial adventia; the alveolar ducts
(AD) and alveolar sacs (AS). H and E 50x Scale - 250 ¡rm'
Figure B. Light micrograph of junction belween tertiary and lobular bronchi. In
the upper bronchus there is an abrupt change in the epithelium from pseudo-
stratified columnar to simple cuboidal, whilst in the Iower bronchus a short
transition region of simple columnar cells is present ( t ). note cartilage plates
(cart) and smooth muscle bundles (s m b) surrounding entrance to alveolar duct. H
and E. 140x. Scale - I0 um.
Figure 9- Scanning electron micrograph of junction between terLiary and lobular
bronchi showing ciliated cells (CC) of the tertiary bronchus and columnar sec-
refory cells (sc) of the transition negion. 5,600x. scale = 2.5 vm.
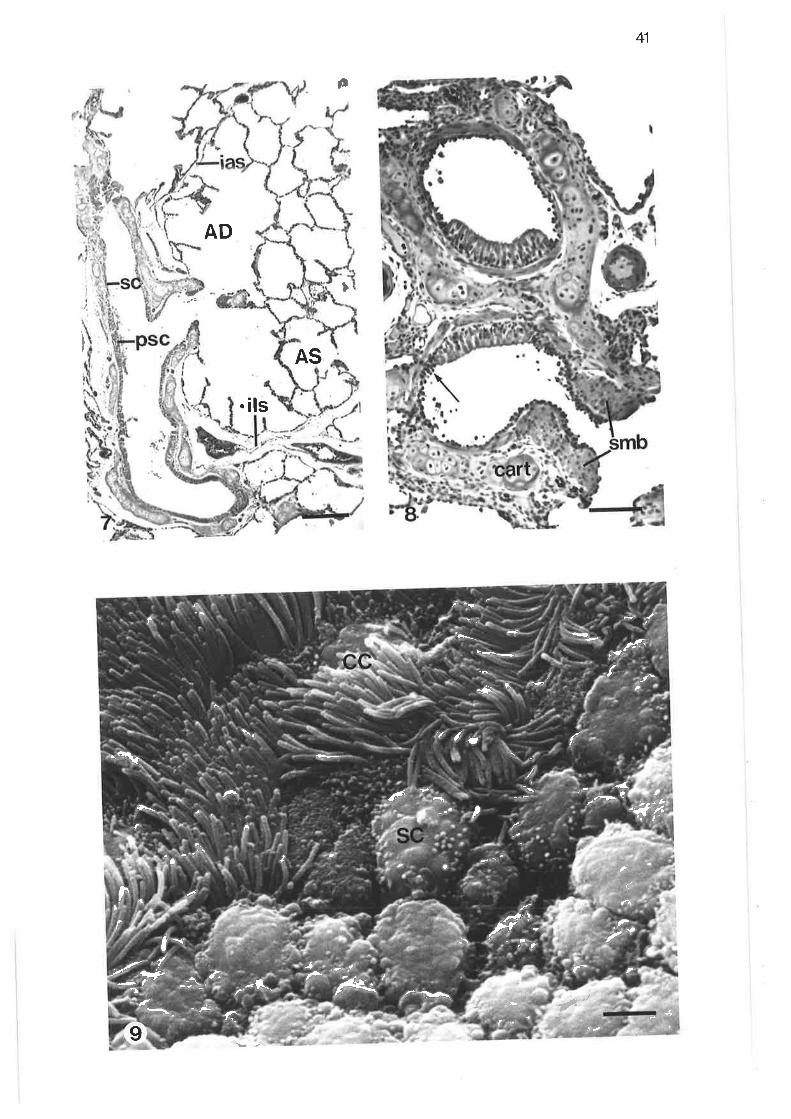
41
n
1
AD
I
1
I
AS
. ils
+r
'¿ /?
I
z¿,
f ,
4
_2.
à/l.2.* A
\¡
¿t
¡)
t¿l>
.¡ r-(
I/-
t
r.; tt?
.\
a ,
l-l \¡r-
.;a
-..É'tL 1
-çi
If
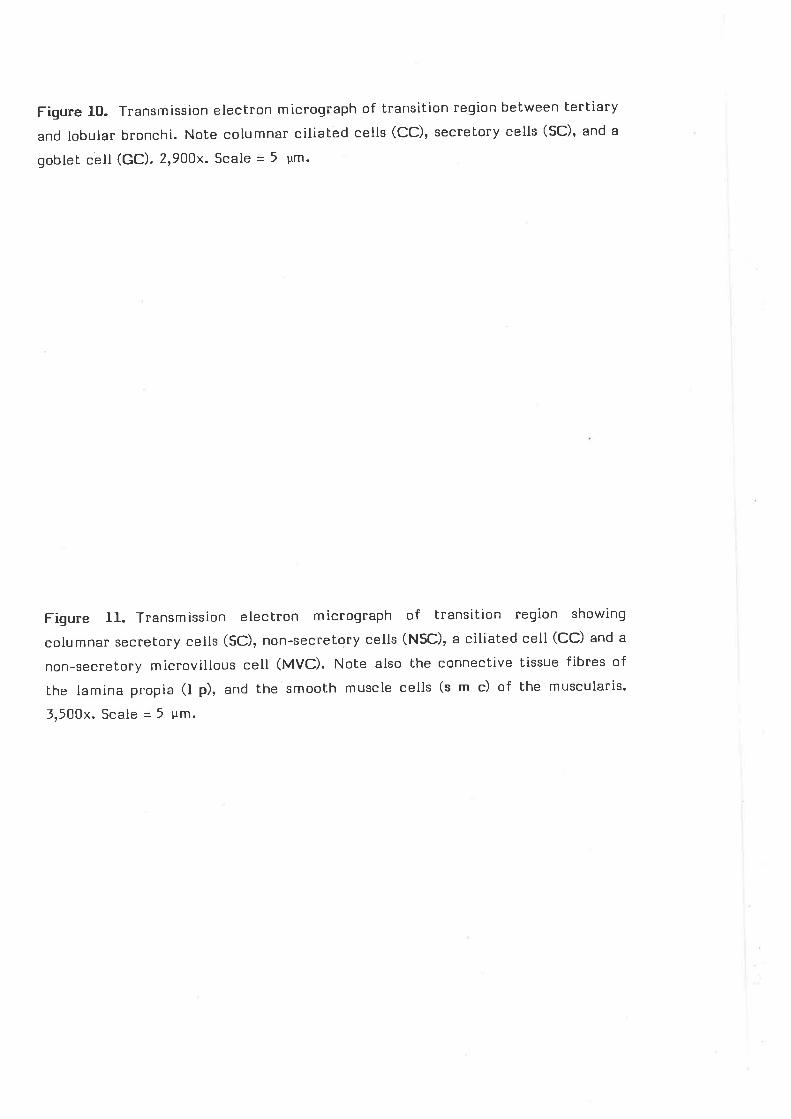
Figure 10. Transmission electron micrograph of transiIion region between bertiary
and lobular bronchi. Note columnar ciliated cells (CC), secrelory cells (5C), and a
goblet cell (GC). 2,9OOx. Scale = 5 pm.
Figure ll. Transm ission electron m icrograph of transition region showing
columnar secrebory cells (SC), non-secrelory cells (NSC), a ciliated cell (CC) and a
non-secretory microvillous cell (MVC). Note also the connective tissue fibres of
lhe lamina propia (l p), and the smooth muscle cells (s m c) of the muscularis.
3,500x.Scale-5 um.
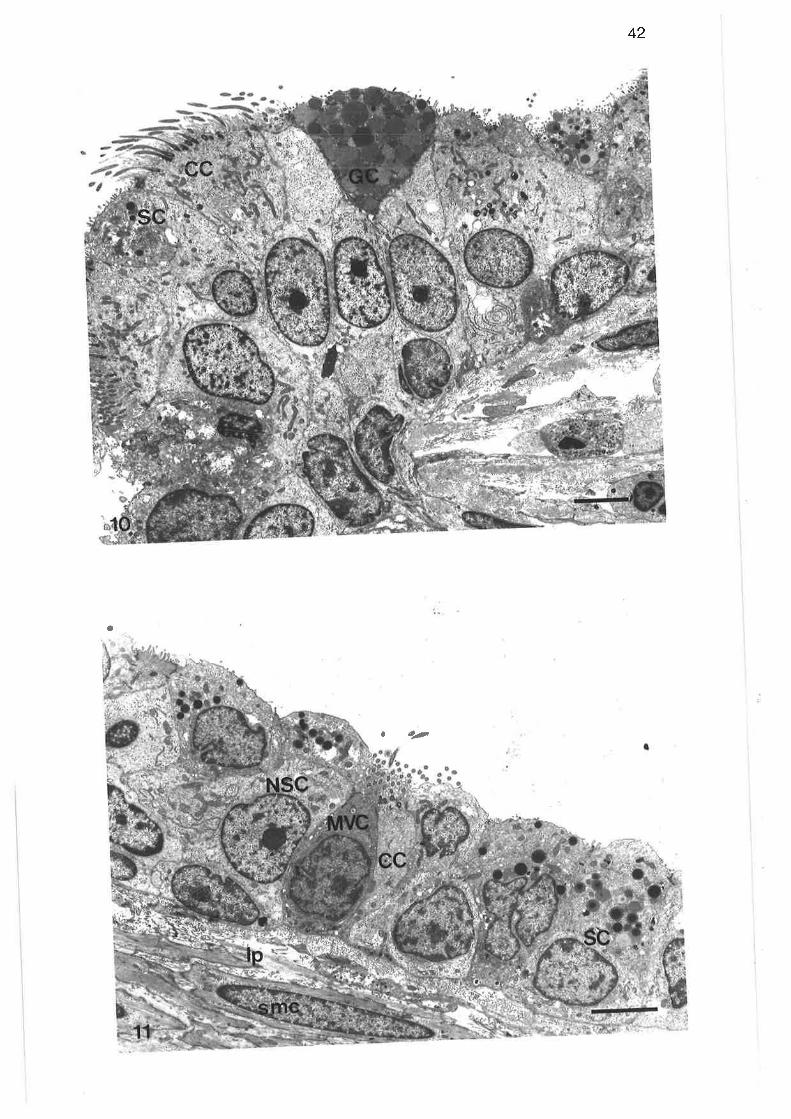
42
a
a taz
Figure 12. Transmission electron micrograph of secretory iells in the transition
region. Note the bi-lobed nucleus (N), the membrane-bound secretory granules
(s g), some with electron-dense cores, a Golgì complex (G), the microvillous-like
projections (MV) on the apical surface, and the basal lamina (b D. 7'000x. Scale =
2 um.
Figure ì-5. High power transmission electron micrograph of one secretory cell of
the transition negion. Note lhe membrane sumounding the secretory gnanules ( 1),
and the Golgi complex (G). 26'I00x. Scale - 500 nm'
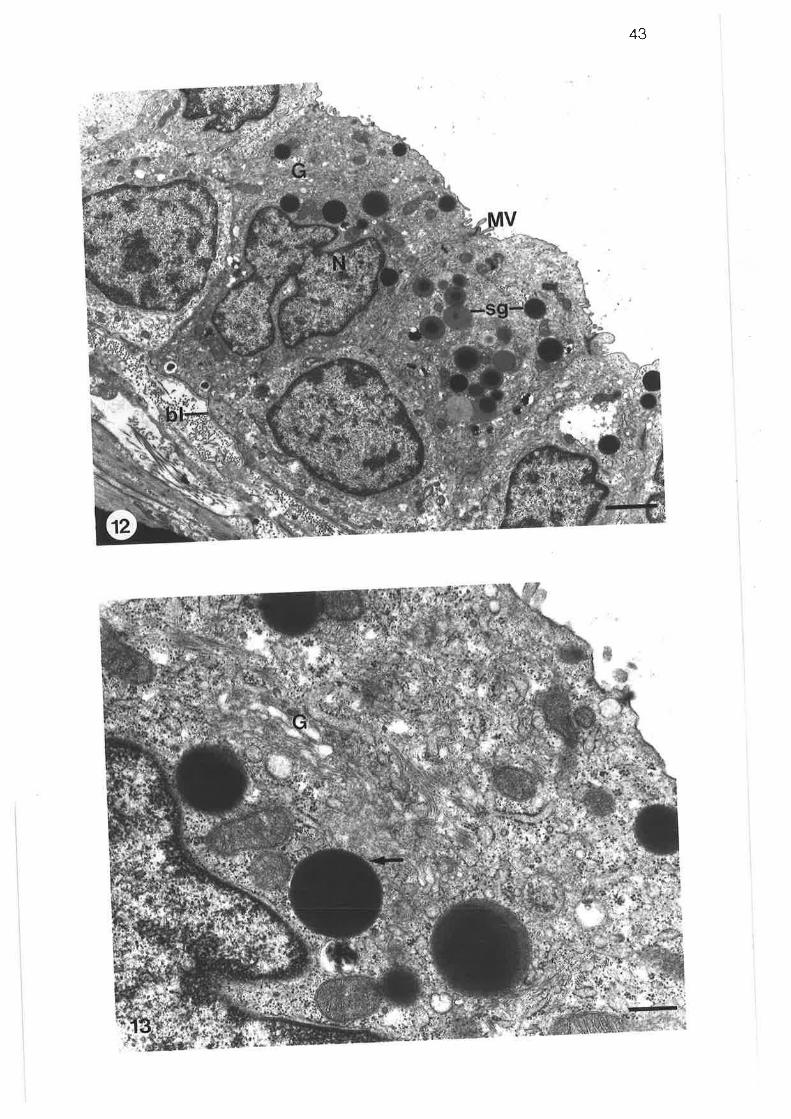
43
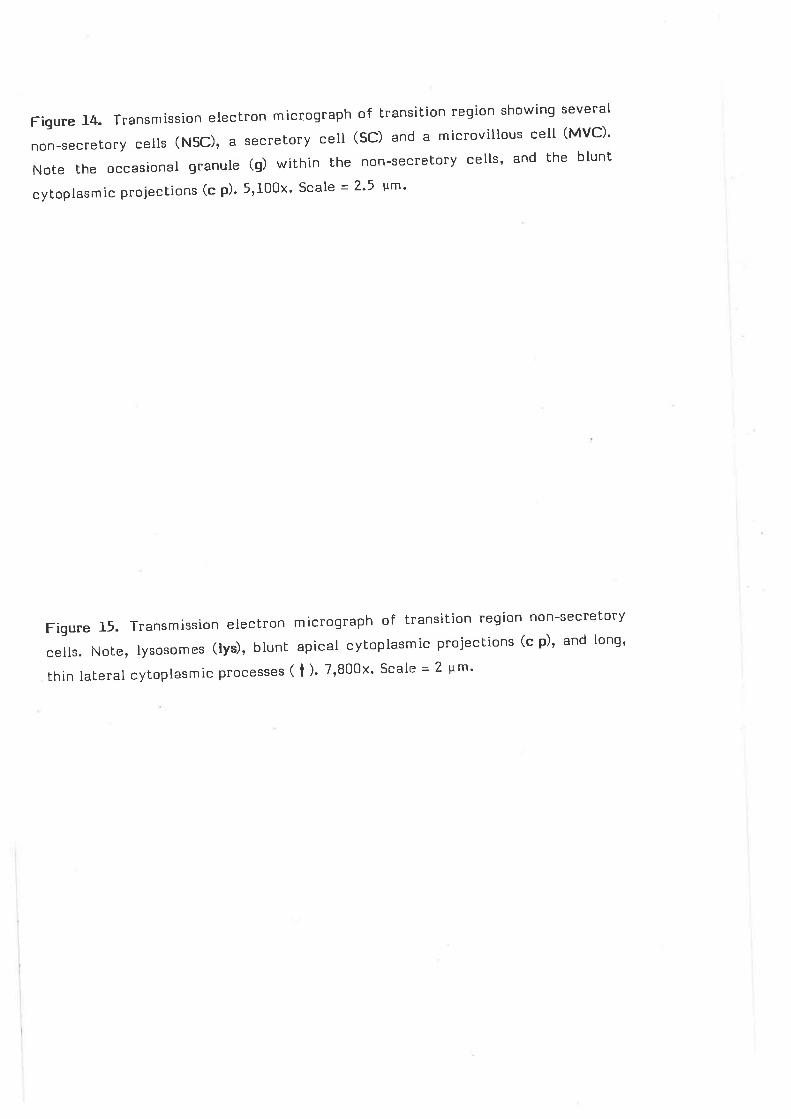
Figure14.Transmissionelectronmicrographoftransitionregionshowingseveralnon-secretory cells (NSC), a secretory cell (sc) an¿ a microvillous cell (Mvc)'
Note the occasional granule (g) within the non-secretory cells' and the blunt
cytoplasmic projections (c p)' 5,100x' Scale - 2'5 um'
Figure15.Transmissionelectronmicroqraphoftransitionregionnon-secretorycells. Note, lysosomes (lys), blunt apical cytoplasmic projections (c p)' and long'
thin laberal cytoplasmic processes ( t ). 7,800x' Scale = 2 sm'
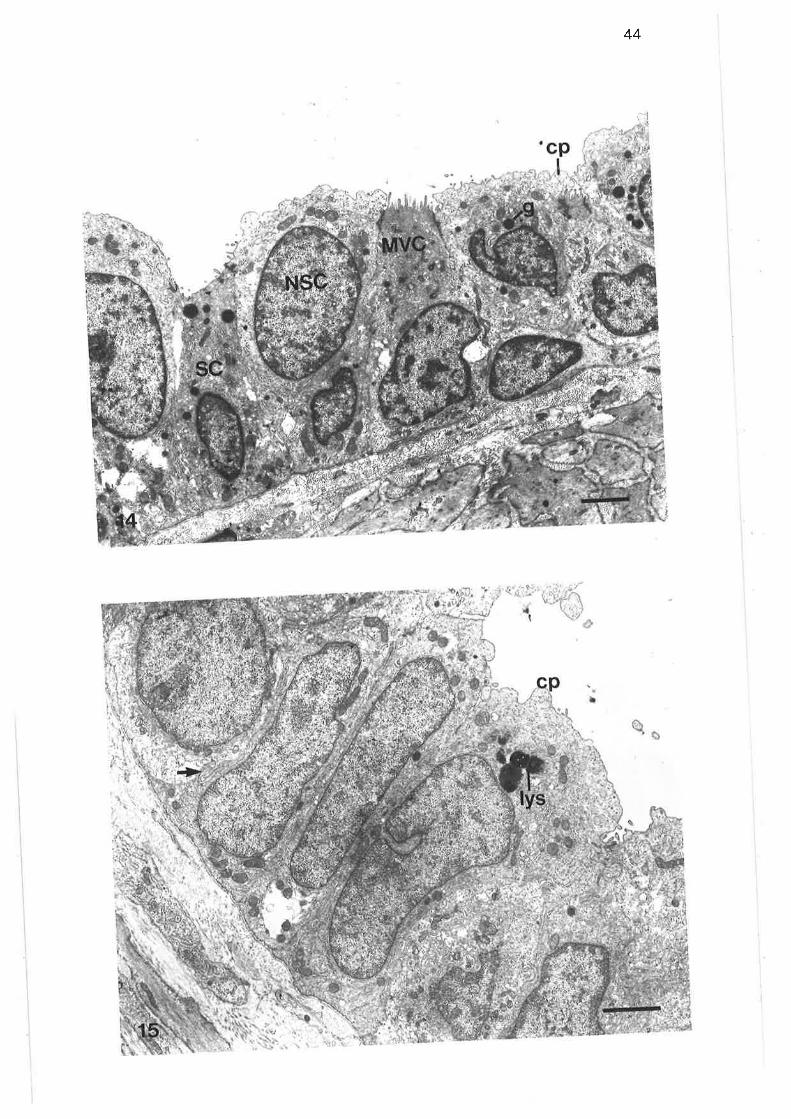
44
(-l
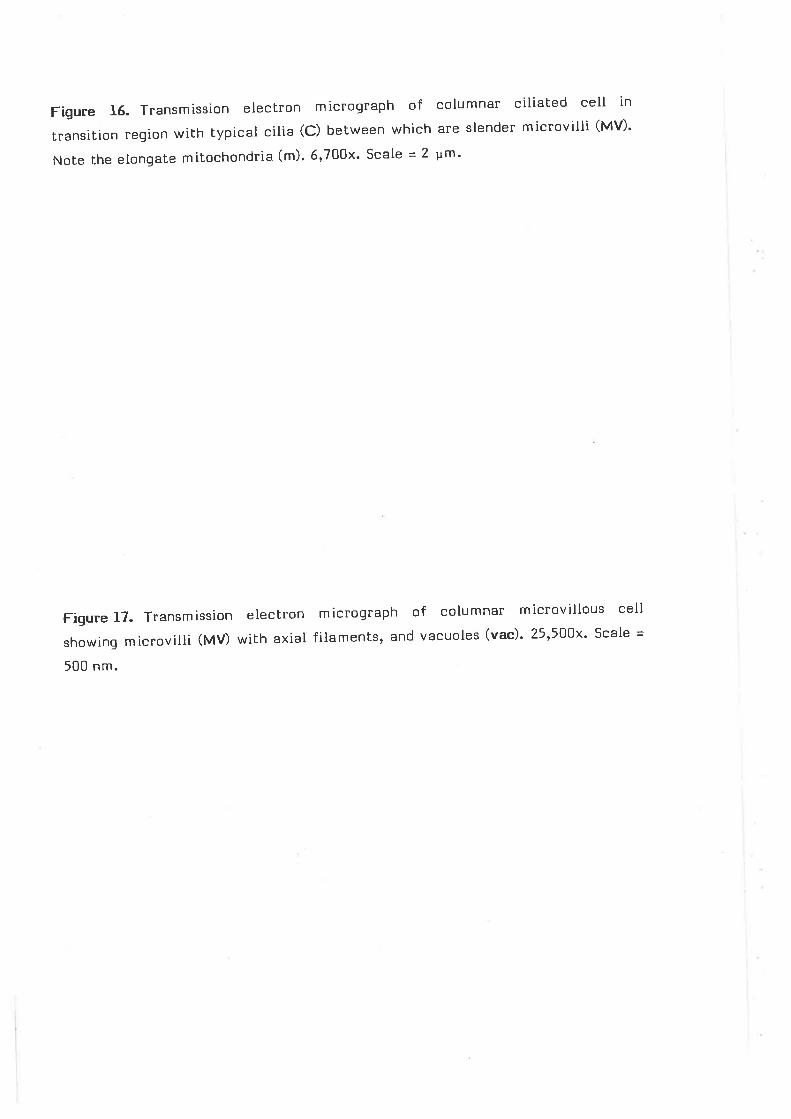
Figure 16. Transmlsslon eleclron m icrograph of columnar ciliated cell in
transition region with typical cilia (C) between which are
Note the elongate mitochondria (m)' 6,700x' Scale - 2 um'
slender microvilli (MV).
Figure 17. Transmission electron micrograph of columnar microvillous cell
showing microvilli (MV) with axial filaments, and vacuoles (vac)' 25,5OOx' Scale =
500 nm.

45
té
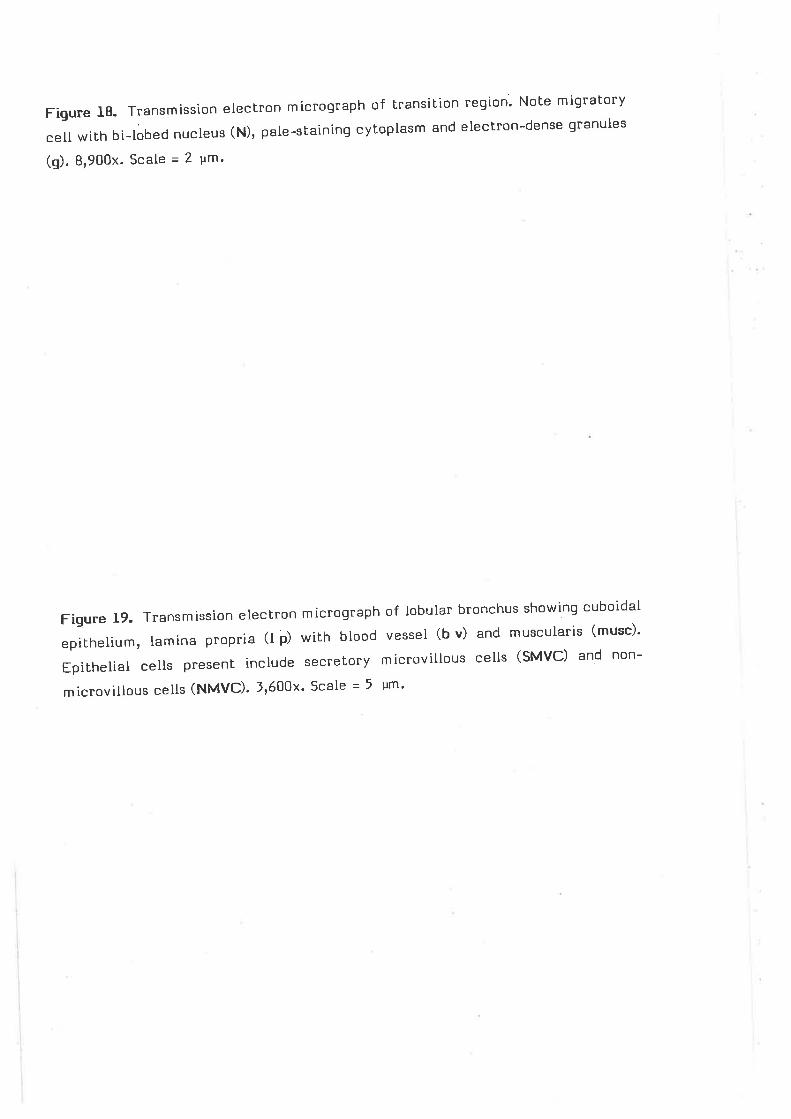
Figure IB. Transmission electron micrograph of Lransilion region' Nole migratory
cell with bi-tobed nucleus (N), pale-staining cytoplasm and eleclron-dense granules
(q). B,gOOx. Scale = 2 Pm'
Figure 19. Transmission electron micrograph of lobular bronchus showing cuboidal
epithelium, lamina propria (l d with blood vessel (b v) and muscularis (musc)'
Epithelial cells present include secretory microvillous cells (SMVC) and non-
microvillous cells (NMVC). 1,600x. Scale - 5 um'
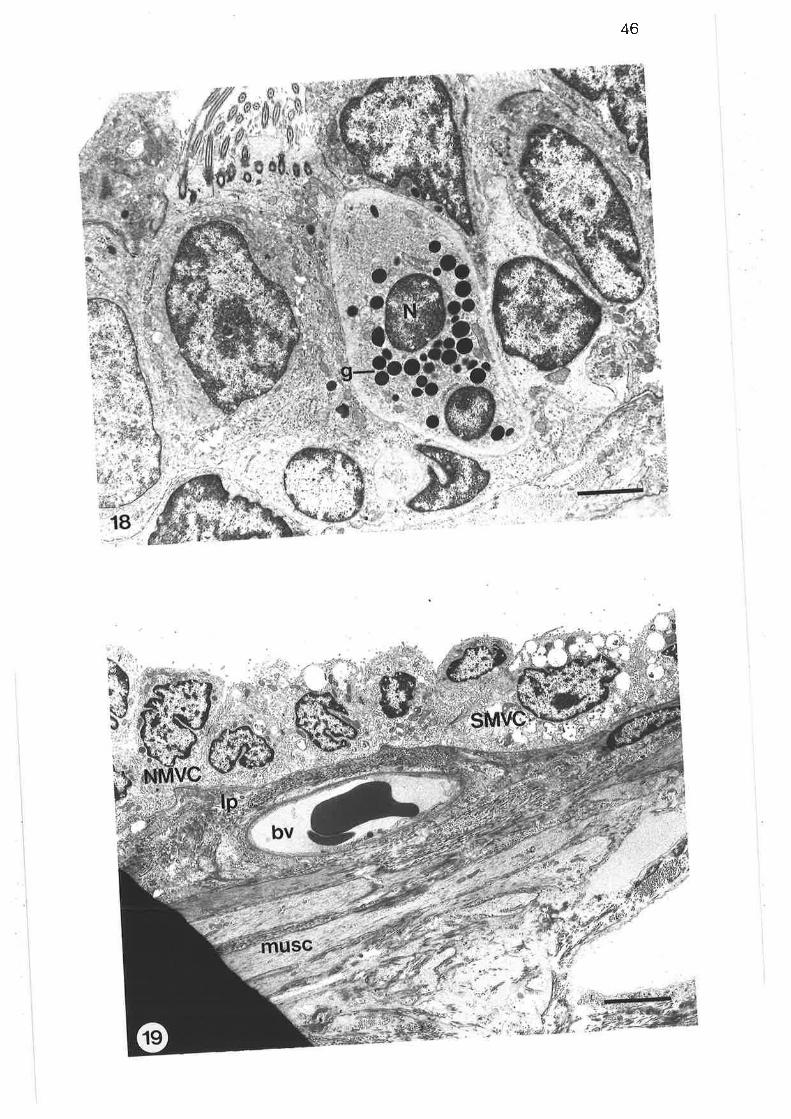
46
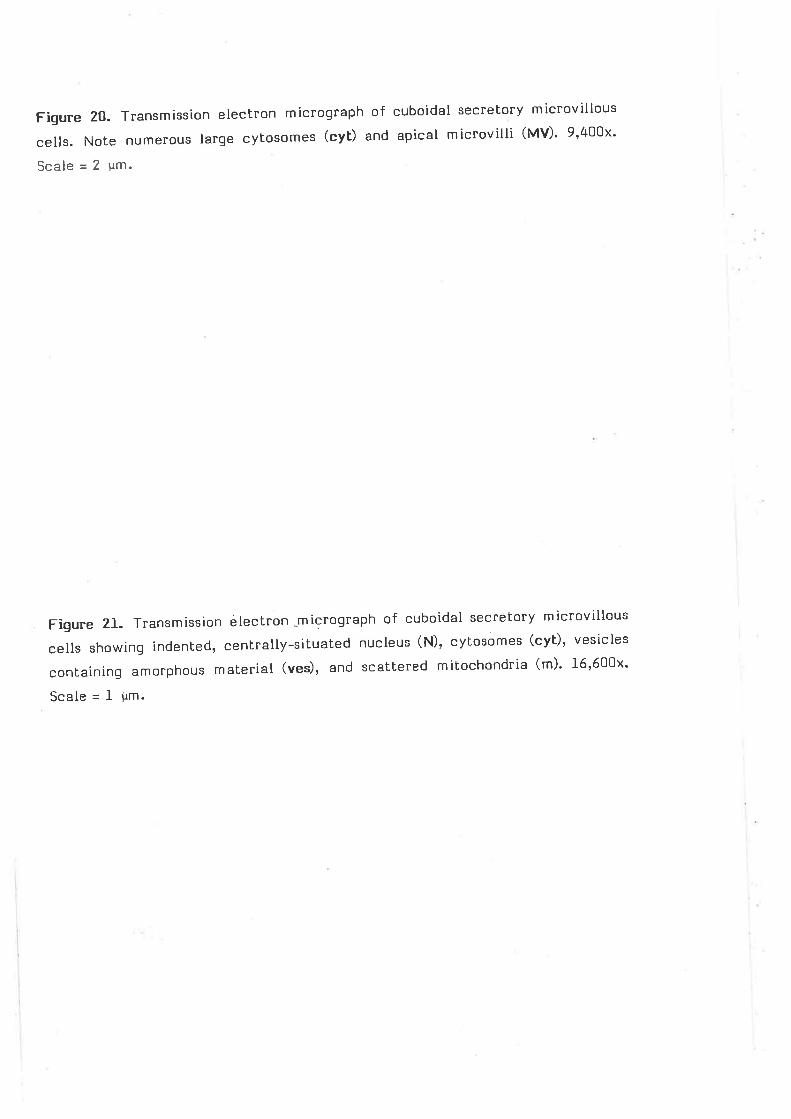
Figure 20. Transmission electron micrograph of cuboidal secretory microvillous
cells. Note numerous larqe cytosomes (cyt) and apical microvilli (MV)' 9'400x'
Scale = 2 gm.
Figure 21. Transmission electron -micrograph of cuboidal secretory microvillous
cells showing indenled, centrally-situated nucleus (N), cytosomes (cyt)' vesicles
containing amorphous material (veÐ, and scattered mitochondria (m)' I6,600x'
Scale = J- irm.
i
1

47
:7
-c
17 L2It Ð ':!..;
Ð
€)
iÛd
æ(.
iJ
,È'?e
rt
'4-:
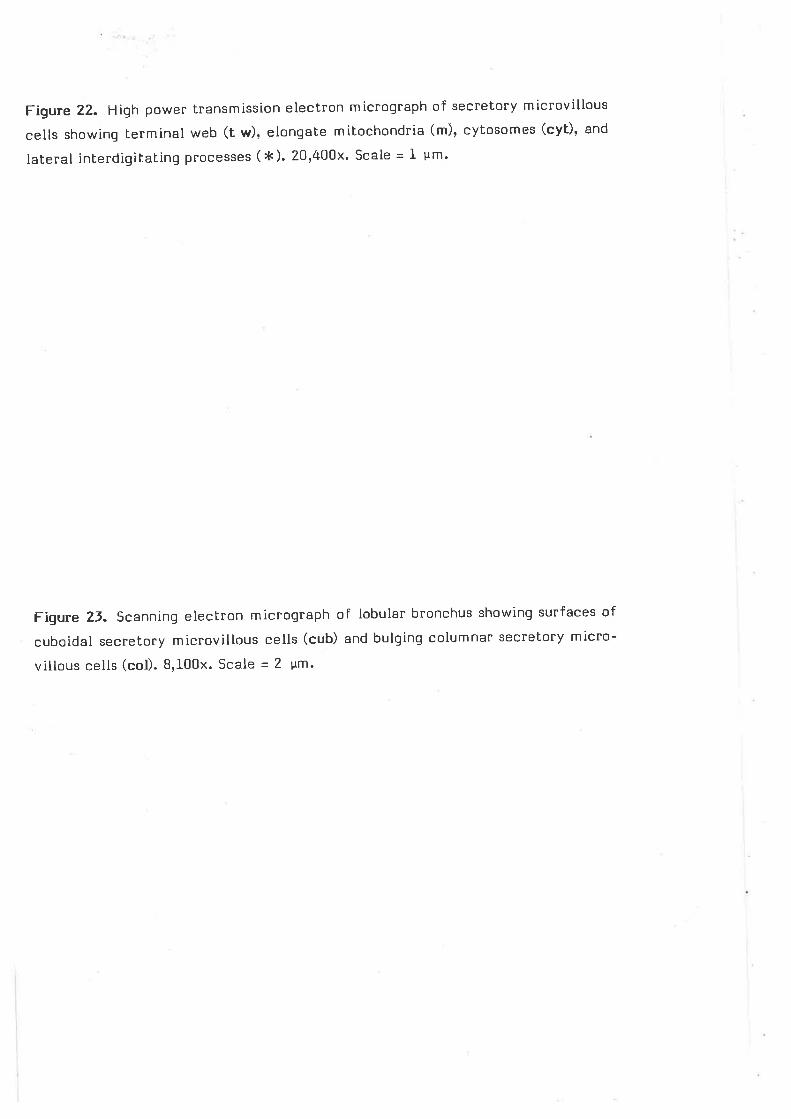
Figure ZZ. High powen transmission electron micrograph of secretory microvillous
cells showing lerminal web (t w), elongale milochondria (m), cytosomes (cyt), and
lateral interdigitating processes ( t<). 20,400x' Scale = I ¡rm'
Figure 2J. Scanning electron micrograph of lobular bronchus showing surfaces of
cuboidal secretory microvillous cells (cub) and bulging columnar secretory micro-
villous cells (col). 8,100x. Scale = 2 vm.
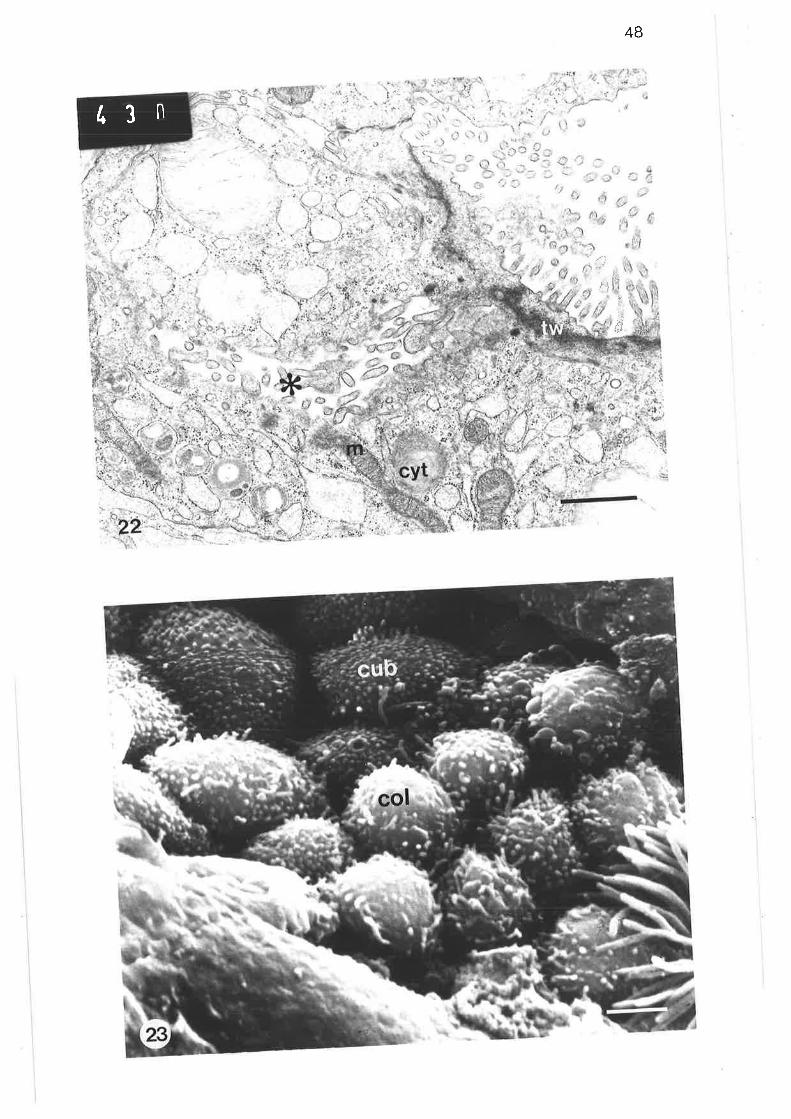
48
/1
¡. It1
;
L 3 n
Figure 24. Transmission electron micrograph of lobular bronchus (tB) showing its
relationship to the alveolus (alv). Note the similarity between the cuboidal
secretory microvillous cells (SMVC) of the lobular bronchus and lhe alveolar Lype
II epithelial cell (ep ID; the hyaline cartilage (cart) and the thin adventitia (adv)
separaEing the bronchus and the alveolus. 2,300x. scale = 5 um.
Figure 25. Transmission electron micrograph of lobular bronchus showinq the
epithelium which contains a non-secretory microvillous cell (MVC) and columnar
secretory microvillous cells (SMVC) wiLh butging apical cytoplasm' Note the thin
lamina propia (l p) which separates the epithelium from the cartilage (cart); and
the intralumenal macrophages (mac). 3,400x' Scale = 5 ¡rm'
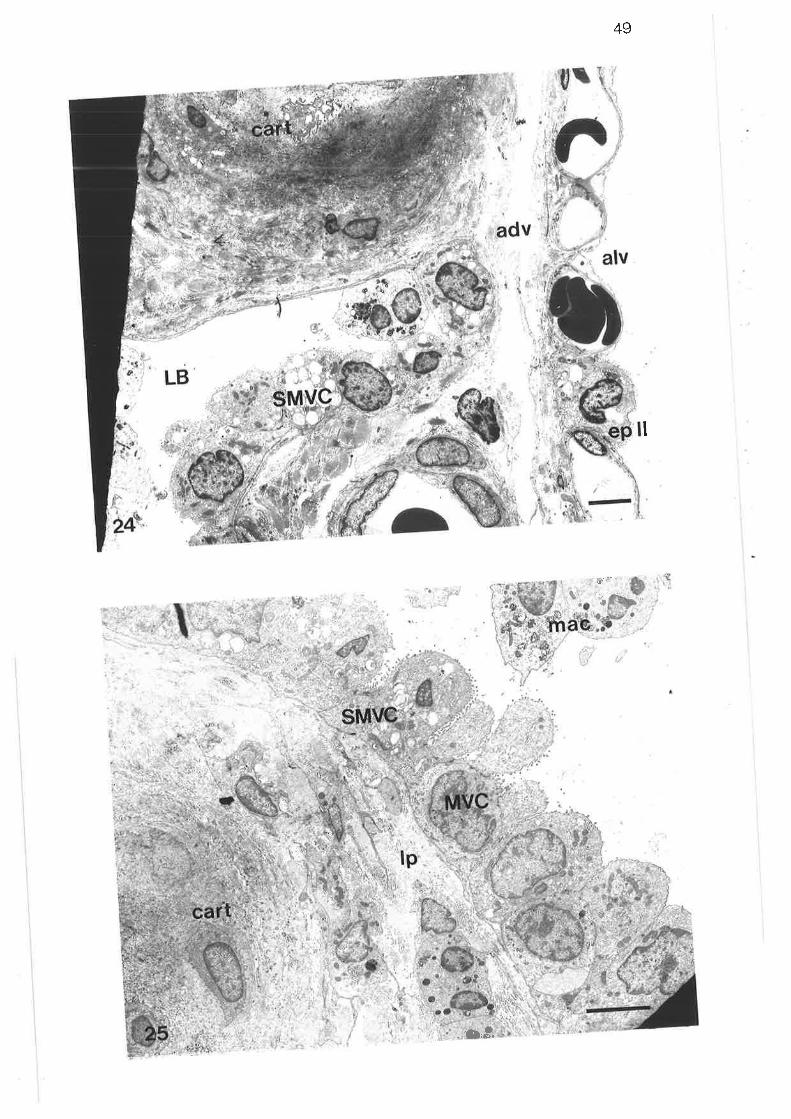
49
I
,dr...::
t:Ð
"tO,Ê''
Figure 26. Transmission electron micrograph of columnar secretory microvillous
cells. Note large nucleus (N), and large vesicles (ves) containing amorphous
matenial; the thin lamina propia (l p) and Lhick muscularis (musc). 5r?OOx. Scale =
2.5 ü,m'
Figure 27- High power transmission electron micrograph of columnar mierovillous
secretory cells. Note dilated endoplasmic reticulum (e r), osmiophilic lamellae
within large vesicles (ves), and peripherally siLuated microvilli (MV). 17,500. Scale
=1gm.
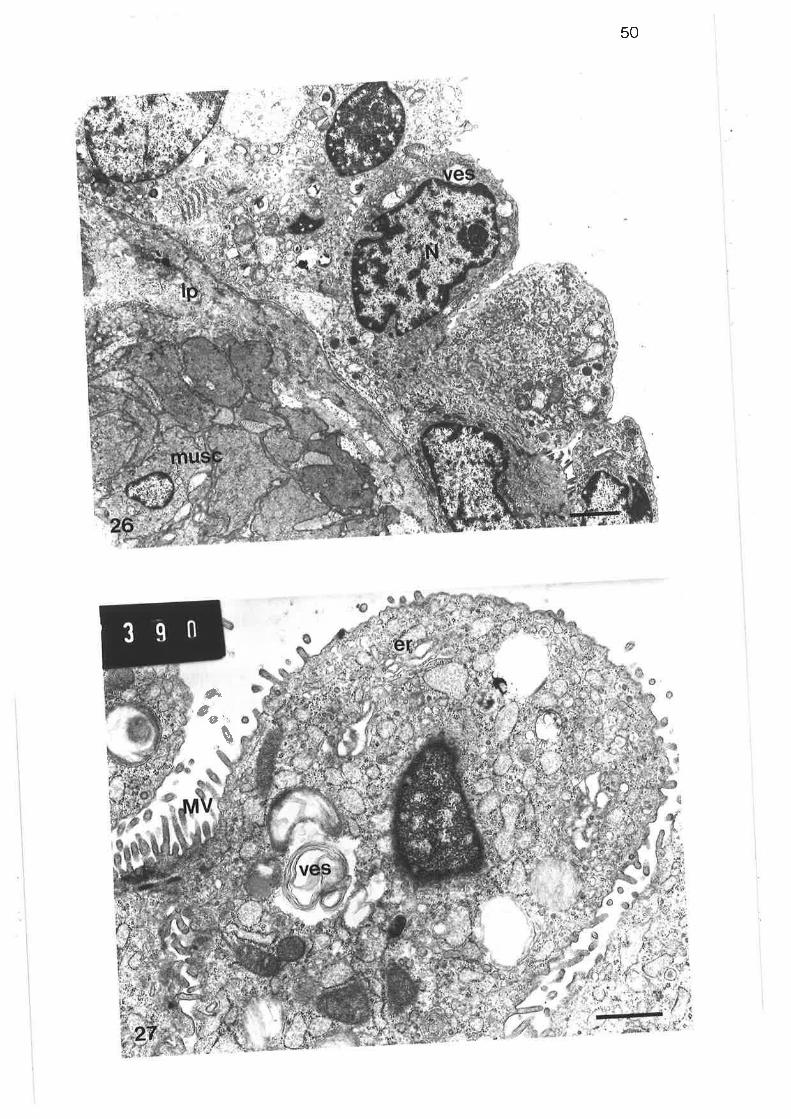
50
ç"êr.,
\
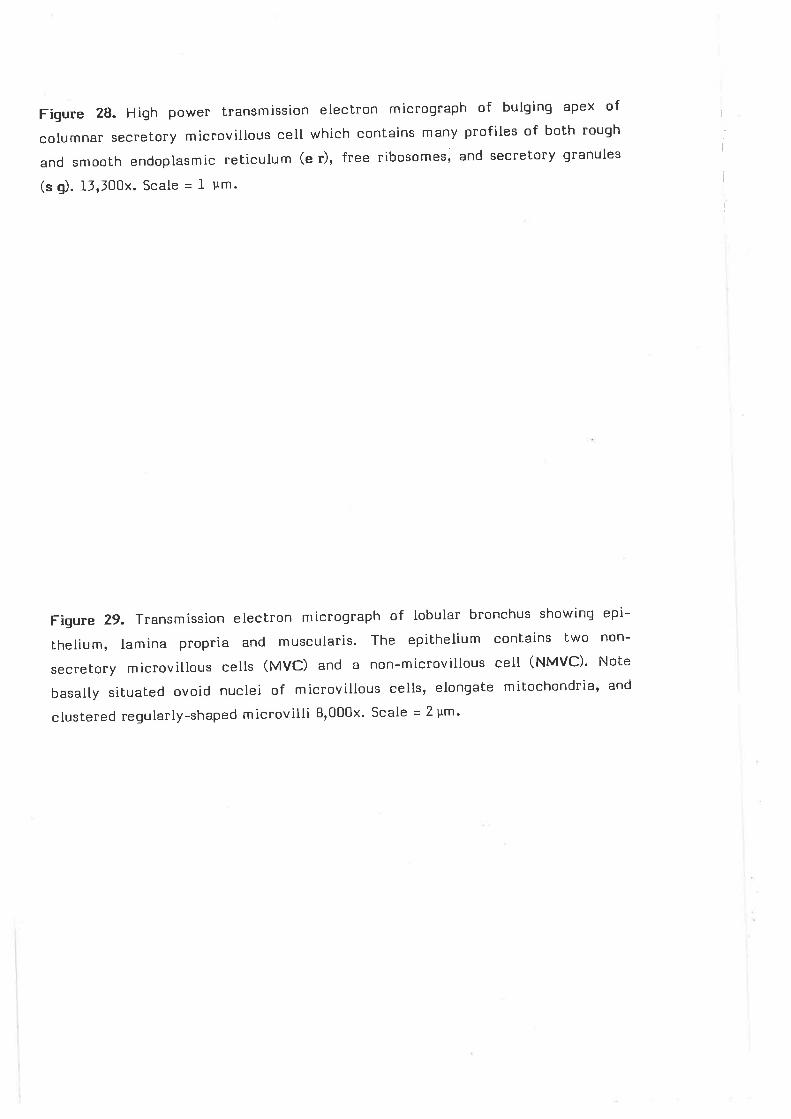
Figure 28. Hiqh power transmission eleclron micrograph of bulging apex of
columnan secretory microvillous cell which contains many profiles of both rough
and smooth endoplasmic reticulum (e r), free ribosomes' and secretory granules
(s g). tl,l0Ox. Scale = l- Fm.
Figure 29. Transmission electron micrograph of lobular bronchus showinq epi-
thelium, Iamina propria and muscularis. The epiLhelium contains two non-
secretory microvillous cells (MVC) and a non-microvillous cetl (NMvc)' Note
basally situaled ovoid nuclei of microvillous cells, elongale mitochondria, and
clustered regularly-shaped microvilli 8,000x' Scale = 2 gm'
I
I
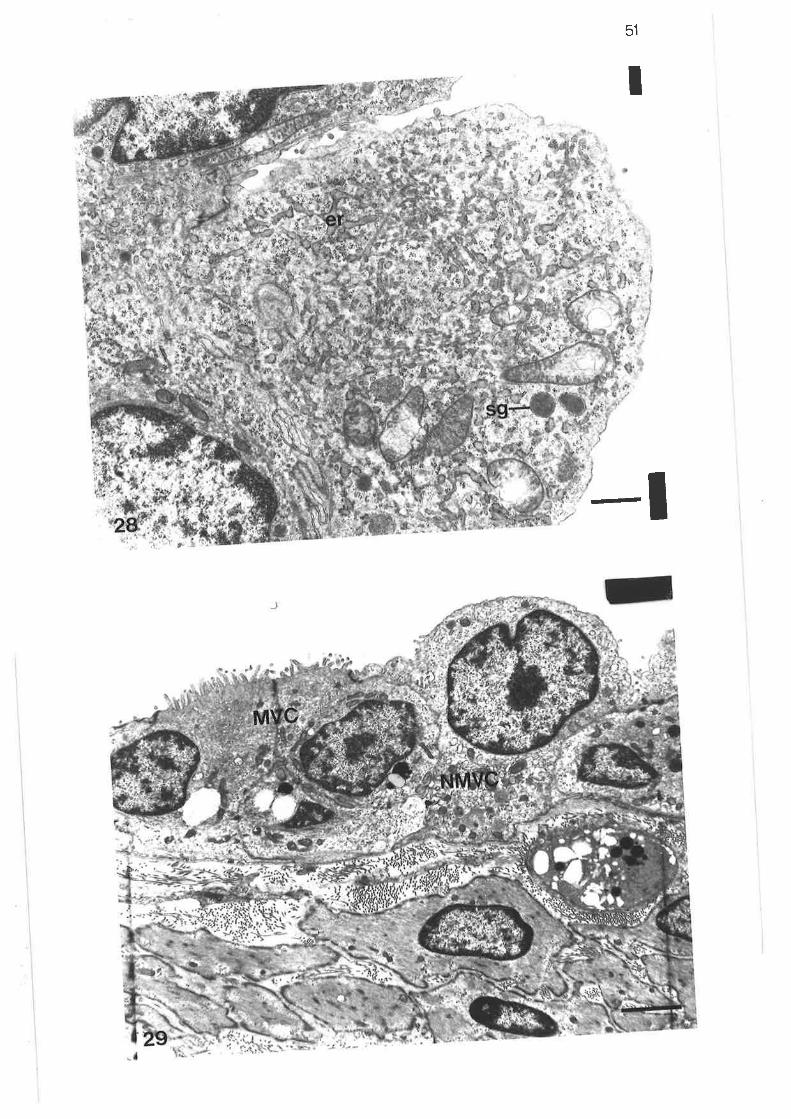
51
I
-I

Figure J0. Transmission electro
showing the centrallY-situated,
n micrograph of non-secrelory microvillous cell
reqular microvilli, the large ovoid nucleus and
elonqate mitochondria' 13,700m' Scale = L vm'
Figure 1I. High power Lransmission electron micrograph of apical portion of non-
microvillouscell.No|etheaxialfilamentsofthemicrovilliwhichsecretorY
extend in to lhe cytoplasm (f ). and the vacuoles (vac)' 39'800x' Scale - 500 nm'
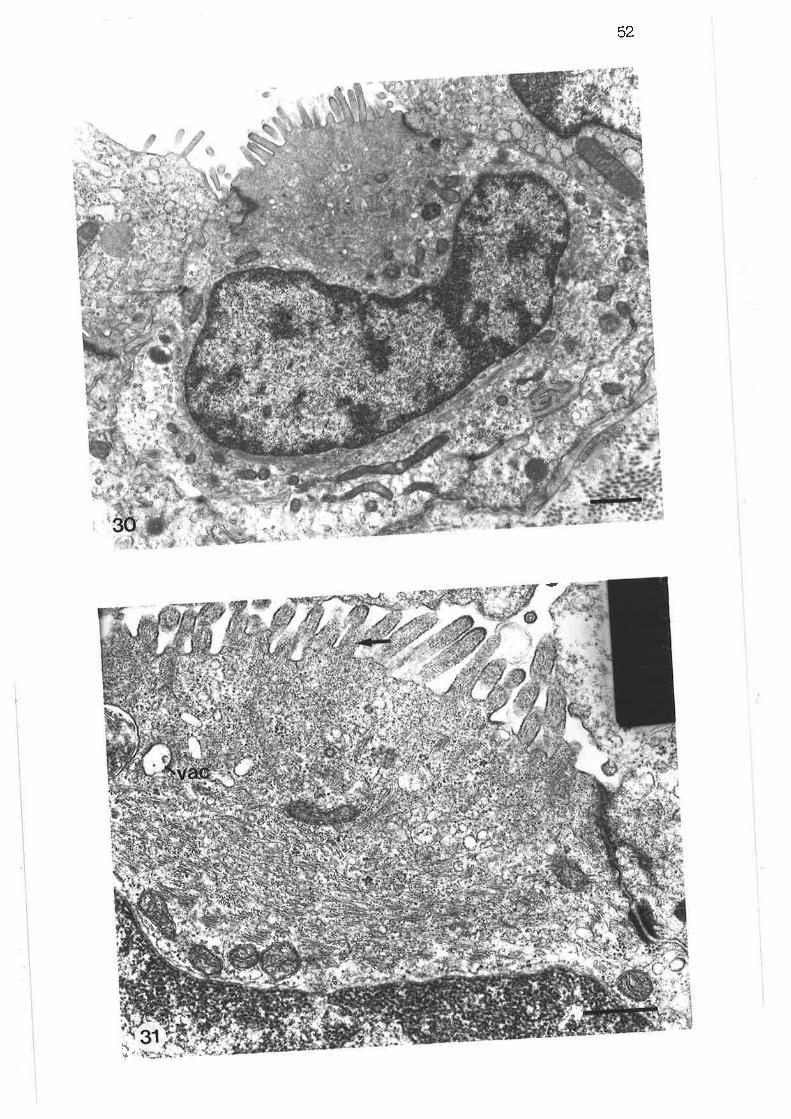
52
{'ui
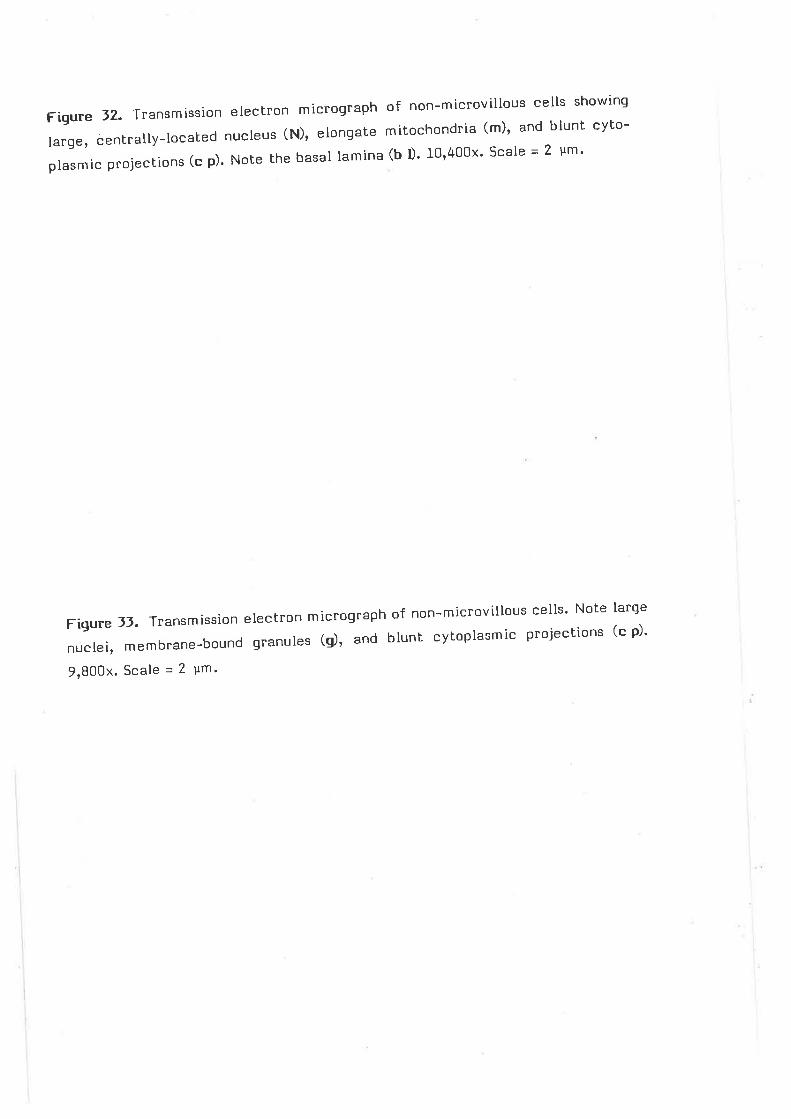
FigureJ2.Transmissionelectronmicrographofnon-microvillouscellsshowinqlarge, centrally-Iocated nucleus (N), elongate mitochondria (m), and blunt cyto-
plasmic projec|ions (c p). Note the basal Iamina (b l). I0,400x. Scale = 2 Fm.
Figure]J.Transmissionelectronmicrographofnon-microvillouscells.Notelarqenuclei, membrane-bound granules (g), and blunt cytoplasmic projections (c p)'
9,B00x.Scale=2 Ym'
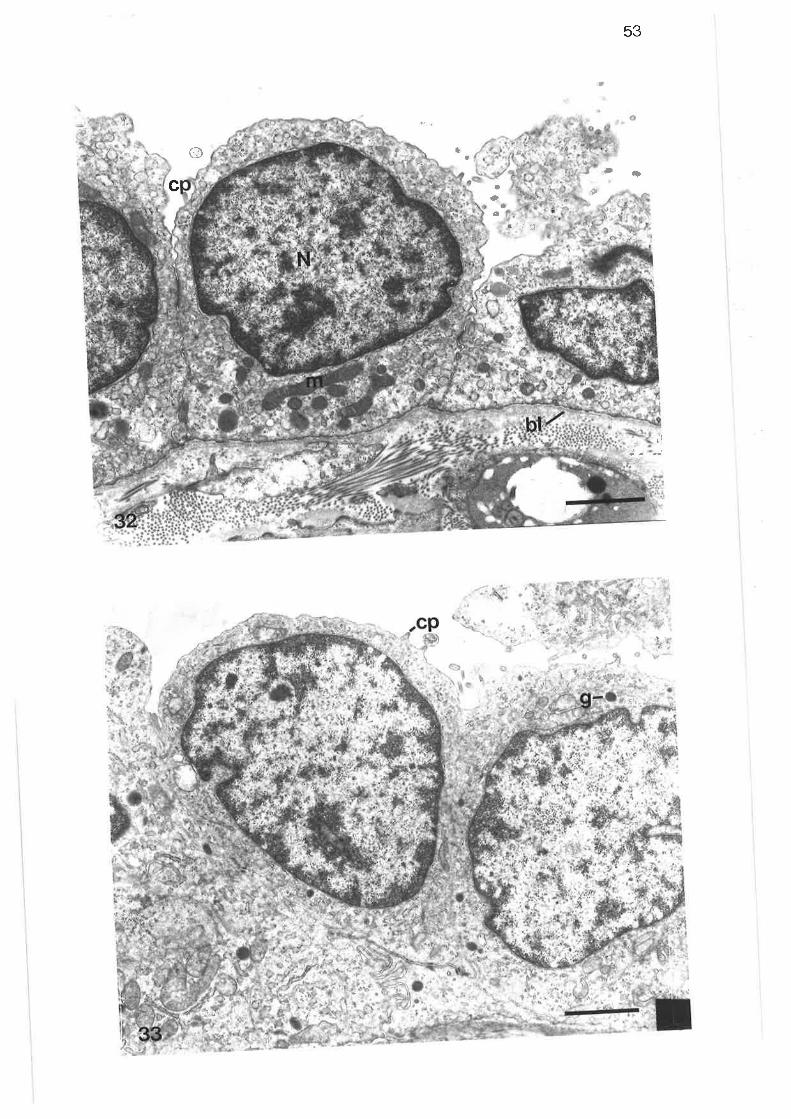
53
,
o fa
'ÐCc t
t.: q
a
aCo
rl
+
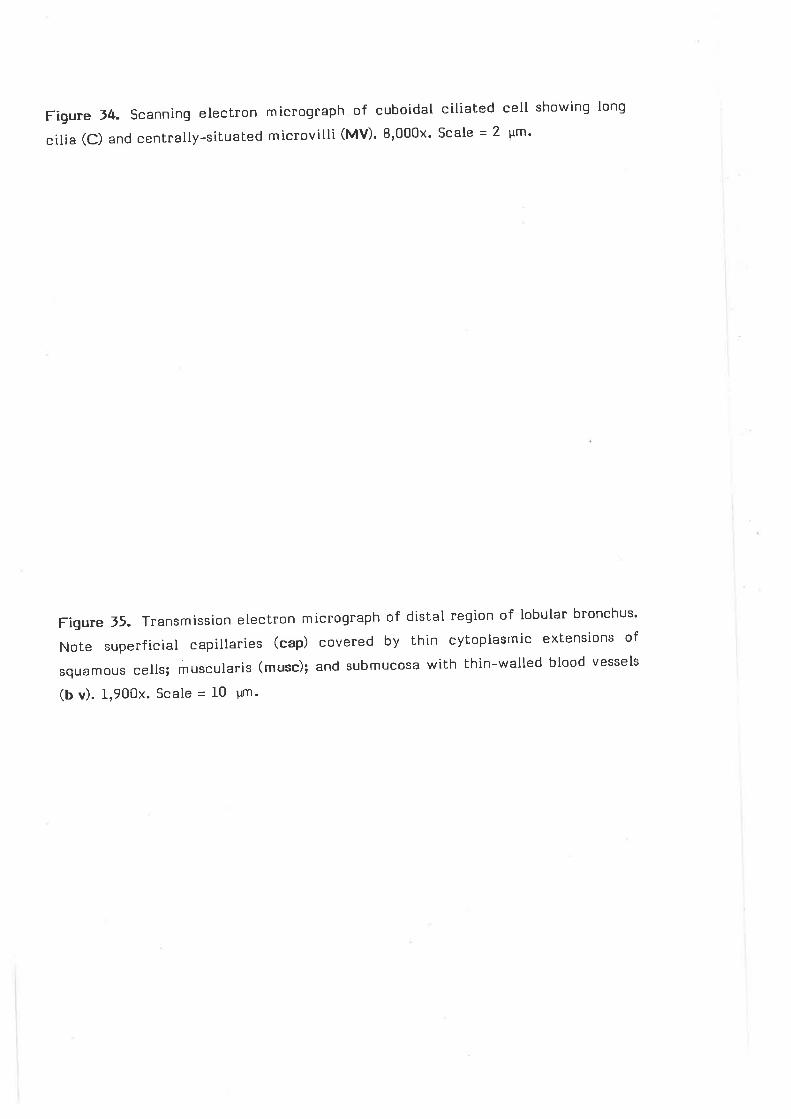
Figure f4. Scanninq electron micrograph of cuboidal ciliated cell showing long
cilia (C) and centrally-situaLed microvilli (MV)' 8,000x' Scale = 2 ym'
Figure J5. Transmission electron micrograph of distal region of lobular bronchus'
Note superf icial capillaries (cap) covered by thin cytoplasmic extensions of
squamous cells; muscularis (musc); and submucosa with thin-walled blood vessels
(b v). 1,900x. Scale - I0 um.
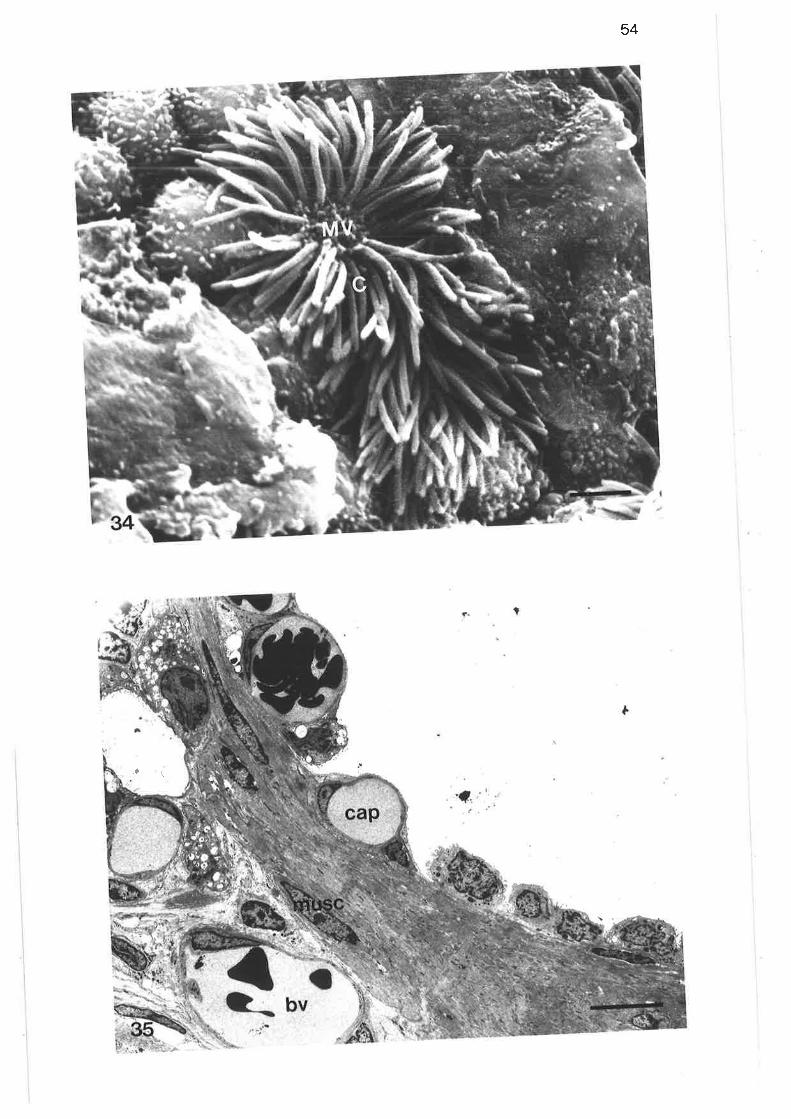
54
.ti
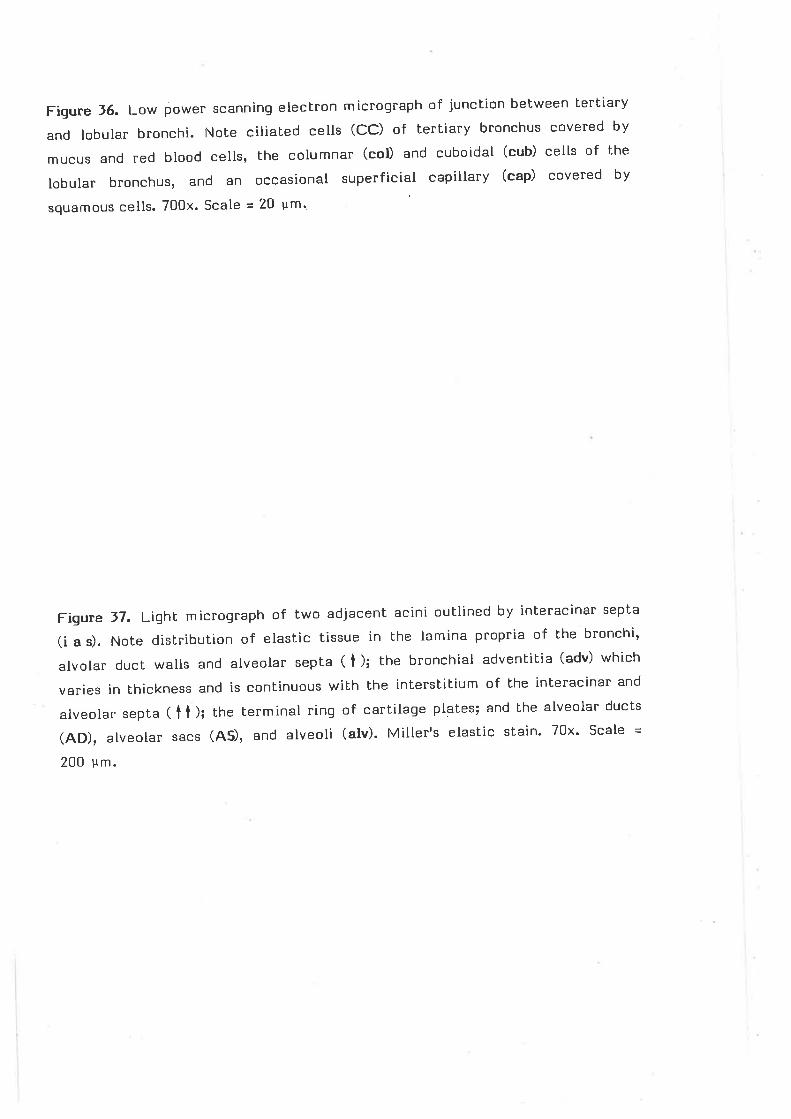
Figure J6. Low power scanning electron microqraph of junction be[ween terliary
and lobular bronchi. Note cilialed cells (CC) of tertiary bronchus covered by
mucus and red blood cells, the columnar (col) and cuboidal (cub) cells of the
lobular bronchus, and an occasional superficial capillary (cap) covered by
squamous cells. 700x. Scale = 20 um'.
Figure 37. Liqht micrograph of two adjacent acini outlined by interacinar septa
(i a s). Note distribution of elastic tissue in the lamina propria of the bronchi,
alvolar duct walls and alveolar septa ( t ); the bronchial adventitia (adv) which
varies in thickness and is continuous wibh the interstitium of lhe inleracinar and
alveolar septa ( t 1); the terminal ring of cartilage plates; and lhe alveolar ducts
(AD), alveolar sacs (45), and alveoti (alv). Miller's elastic stain' 70x' scale =
200 um.
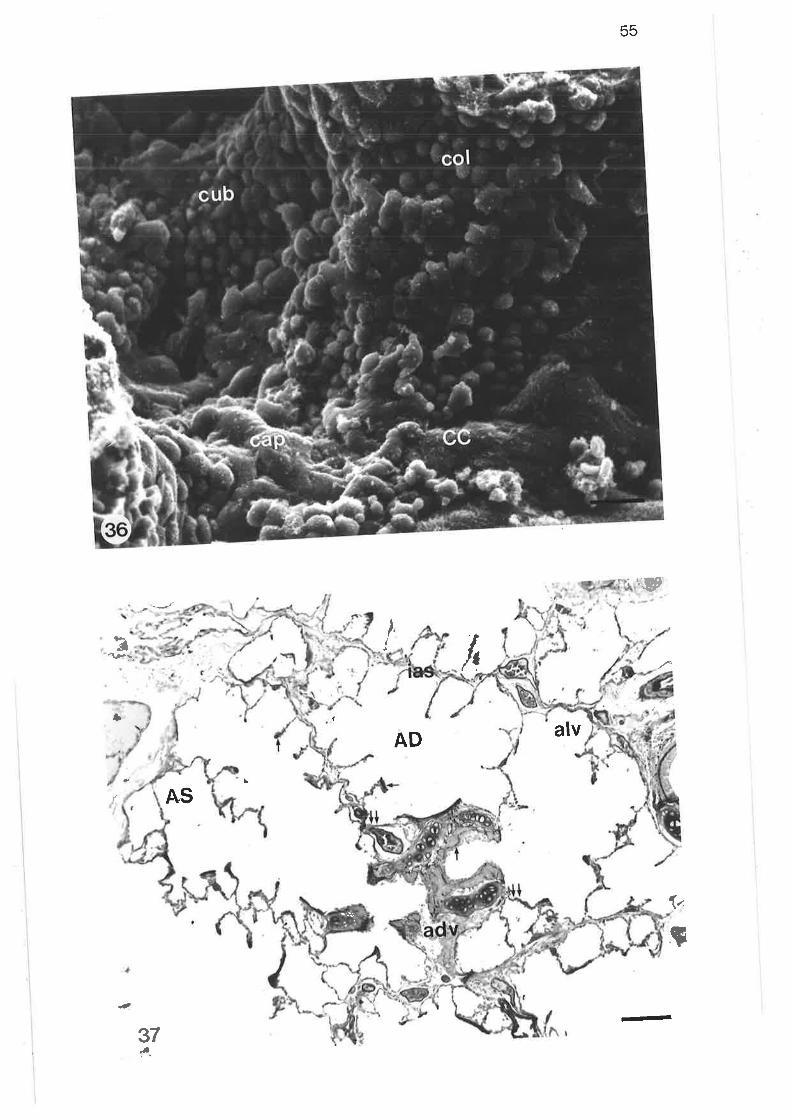
55
r-Ul
/+
I!t
.zt¡'fa,
AD alvII
I
AS(
\t
s
37t.
----
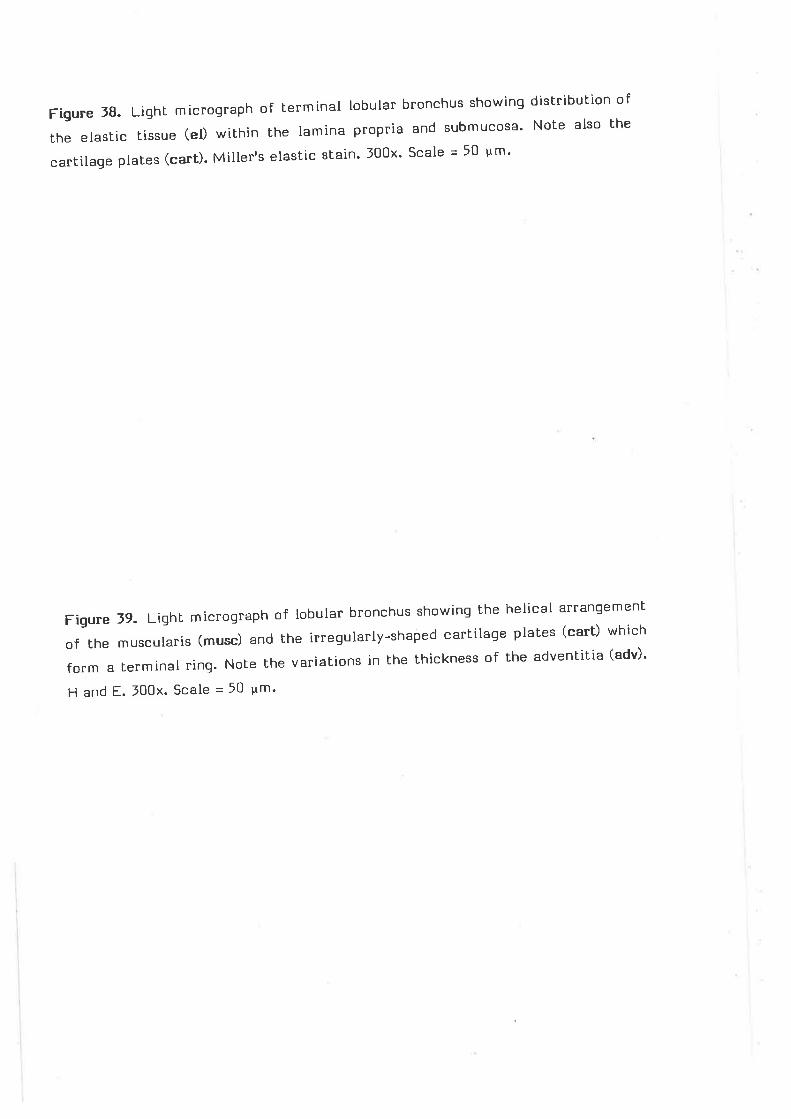
Figure 18. Light micrograph of [erminal lobular bronchus showing dis[ribution of
the elaslic lissue (el) within the lamina propria and submucosa' Note also the
cartilage plates (cart)' Miller's elastic stain' l00x' Scale = 50 um'
Figure 19. Light micrograph of lobular bronchus showing the helical arrangement
of lhe muscularis (musc) and Ihe irregularly-shaped cartilage plates (cart) which
form a terminal rinq. No[e the variations in the Lhickness of the advenIitia (adv)'
H and E. 100x. Scale - 50 ¡rm'
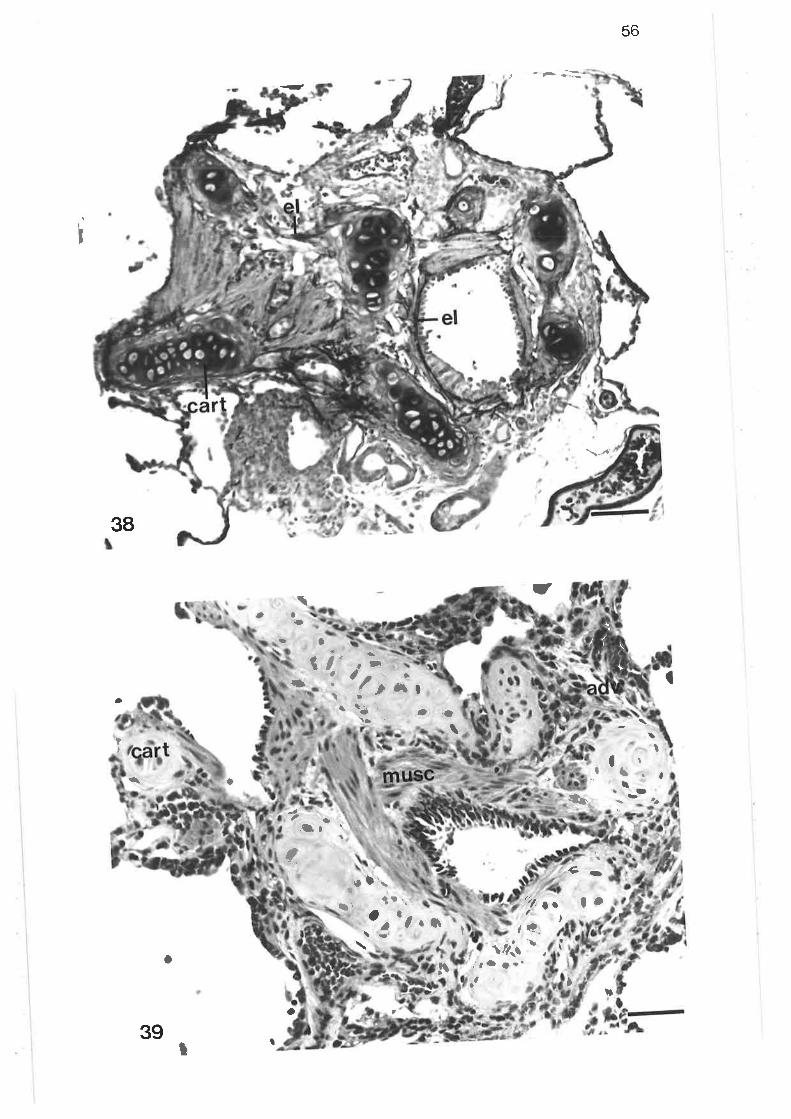
56
; -Ê'-i-
i
<aJ
aa¿D
a
t
38
a
Ja
a
Ia
åt'.a
\ \
t ,i,t-,'a\D
I
tll'.
(
'a\
I)
I
II
ta
ttI
I -5
aa\\
a.lr
ÇI ç ¡ 4-
,)1, fta¡,
,Q.t/¿lr \ , t
I
o tr.l.a\ I
,'raD o-'t
I ¡ t,
I
I
39
o
i
a
ìt
!ô
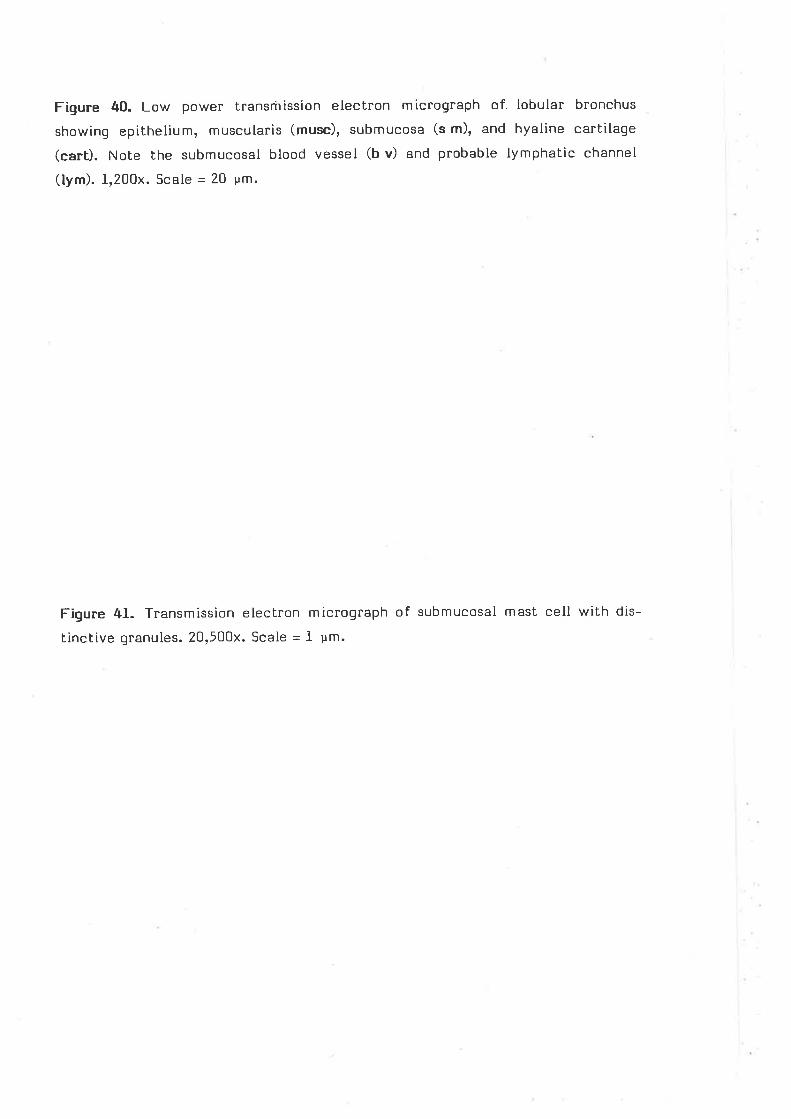
Figure 40. Low power transmission electron micrograph of lobular bronchus
showing epilhelium, muscularis (musc), submucosa (s m), and hyaline cartilage
(cart). Nole bhe submucosal blood vessel (b v) and probable lymphatic channel
(lym). 1,200x. Scale = 20 ym.
Figure 4l- Transmission electron micrograph of submucosal mast cell with dis-
tinctive granules. 20,500x. Scale = I um.
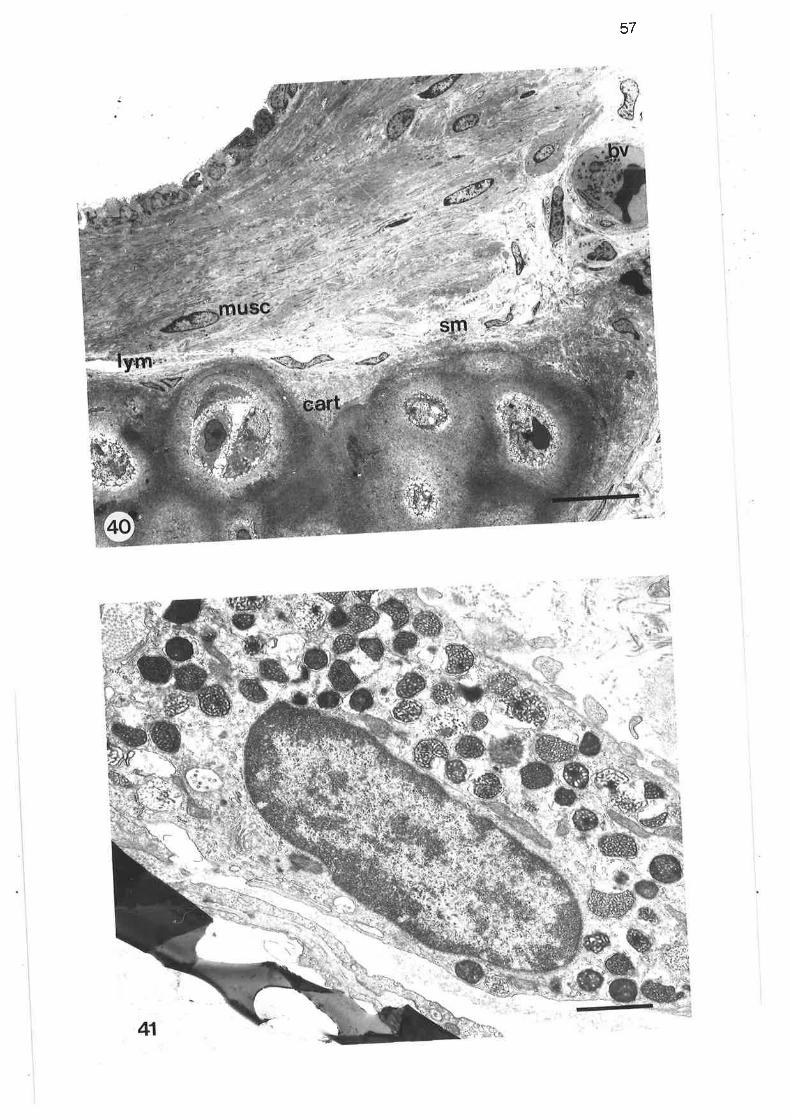
57
58.
(b) ParenchYmal subdivisions
Theparenchymaofthelungwasdividedintoanumberoflargesegments
which were separated by thick, prominent connecLive tissue sepla (Figs' 5 and 6)'
The thinner connective tissue septa which divided the lung parenchyma wete
a prominent feature even at Iow magnification (Figs' 5' 6' 7 and l7)' These septa
divided the lung into lobules and acini' Each lobule was supplied by a lobular
bronchusandincludedalltheparenchymalstructurestowhichthebronchusqave
rise(Figs.6,42and4]).Thelobulewasfurtherdividedintoanumberofacini.
Eachacinus,onterminalrespiratoryunit,containedthoseparenchymalstructures
distaltoaterminalcartilagerinqinthewallofthelobularbronchus.Those
structureswithinanacinusgenerallyincludedtwoormorealveolarductsandthe
various alveolar sacs and alveoli to which they gave rise (Figs. 6, J7,47,43 and
44).
Theconnectivetissueoftheseparenchymalsubdivisionscontainedtypical
.collagenandelasticfibres,fibroblasts'Somesmoothmusclecellsandoccasional
mastcells;itwascontinuouswiththeconnectivetissuecoreofthealveolarsepta
(rigs.45and46).Thesethickerseptacontainedthepulmonaryarterioles,venules
andlymphatics.Occasionallyanalveolarcapillarycouldbeseentodraindirectly
into a venule (Fiqs' 47 and /+B)'
AII of these thicker sePta were lined on each surface by a single capillary
network and covered by typical alveolar epithelium, of type I and type lI cells'
which was continuous with that of the alveolar septa (Fiqs' 45 and 46)' Thus these
thickerseptaformedthebaseofsomealveoli(Figs.6,7,'7and4B).
(c) Alvolar ducts and alveolar sacs
Eachlobularbronchusterminatedbygivingrisetoaseriesofalveolarducts
andalveolarsacs.Theentrancetoeachgroupofductswasdelineatedbyaringof
cartilageinthewalloftheairway(Fiqs.37,'gand49).Atthispointtherewasan
abrupLchangeintheepithelium;fromthecuboidalbronchialcellstotheextenstve
squamoustypeofthealveolarsepta(Fig.49).Thealveolarductswerelarge
59.
passages lined with alveoli which either branched to form further generations of
ducts or gave rise to the alveolar sacs. Each sac was a collection of alveoli which
opened into a common area for 9as mixing (Figs.7r37r 43r 44 and 50).
The walls of the alveolar ducts tended to be more pronounced than those of
the sacs (Fiq.5l). Bundles of collagen and elastic fibres were the most prominent
feature of these walls, which also contained occasional smooLh muscle cells and
fibroblasts (Figs. 52,53,54 and 55). The walls of the ducts and sacs were generally
lined on both surfaces by alveolar capillaries which were covered by the
attenuated cytoplasmic processes of the type I alveolar epithelial cells' These cell
processes extended beyond the capillaries to cover those parts of the duct and sac
walls that were exposed to the duct or sac lumen. The connective tissue of the
duct and sac walls was continuous with the interstitium of the alveolar walls'
(d) Alveoli
The alveoli formed part of the walls of the alveolar ducts and sacs. They
were open-ended polygons which faced on to the alveolar ducls and sacs (Fiqs' 37'
44, 48r 50 and 56). The walls of the alveoli consisted of a f ine capillary network
suspended in a connective tissue framework, the whole of which was covered by
alveolar epithelium. The alveolar septal walls carried either a single capillary
network, or a double capillary arrangement whereby the connective tissue core
supported a capillary network on each surface'
(i) Epithelium: There were only two cell types which formed the alveolar lining'
i) Type I cells: The nuclei of the type I cells tended to be located in niches of
the capillary network (Fig. 57); however, they occasionally protruded into
the alveolar lumen (Fig. 5B)' The nuclei were surrounded by a thin cyto-
plasmic layer which contained the majority of the sparse organelles' which
included a few mitochondria, a Golgi complex, free ribosomes and some
profiles of endoplasmic reticulum (Fi9s.57r 58 and 59)' The thin attenuated
sheets of cytoplasm which radiated from the perinuclear region generally
contained numerous pinocytotic vesicles and occasional mitochondria (Figs'
60.
59 and 60). Occasionally a cytoplasmic process was seen to cross the septum
on to the surface of an adjacent alveolus; this was only observed in areas of
single capillary network.
ii) Type tI cells: The type II epithelial cells tended to occur in groups of two to
three, although they did occur singly (Figs. 57,60r 611 62 and 6l). They most
often lay in gaps between the capillaries of the septal wall. The cells were
ovoid to cuboid in shape and contained a wealth of organelles; many mito-
chondria, a prominent Golgi complex, smooth and rough endoplasmic
reticulum, free ribosomes, multivesicular bodies and, most characteristi-
cally, osmiophilic lamellar bodies or cytosomes. These cytosomes, which
were 0.6 to 1.7 pm in diameter, contâined an irregular array of lamellae of
variable thickness which generally formed concentric layers. Infrequently a
cytosome could be seen discharging its contents on to the alveolar surface.
Many short microvilli, 0.7 x 0.1¡rm,projected from the apical surface of the
type II cells, whilst the lateral and basal surfaces carried slender inter-
digitating processes which communicated with adjacent cells (Figs. 60r'62
and 63).
The alveolar epithelium lay on a thin distinct basal lamina which at
times fused with that of the capillary endothelium (Figs.60 and 76).
Adjacent cells of the epithelium were attached by tight junctions (Fiqs.60
and 6l).
iii) Type III cells: No type III cells were observed in the alveolar septum.
(ii) Capillaries: The capillaries of the septal walls formed a dense meshwork
which was most easily appreciated in scanning electron micrographs of an en face
view of an alveolar wall (Figs. 48, 51 and 56). These vessels were lined by a non-
fenestrated endothelium (Figs.59, 64 and 76). The perinuclear region contained
the majority of cytoplasmic organelles; mitochondria, a Golgi complex and some
endoplasmic reticulum (Figs. 59 and 6l). The cytoplasmic processes contained
occasional mitochondria and many pinocytotic vesicles. The endothelial cells were
surrounded by a thin distinct basal lamina (Fiqs. 76 and 77).
6I.
(iii) Interstitium: The interstitium, which was composed of fibrous connective
tissue, formed a supporting framework for the capillary network' The major
components of the interstitium were typicat collagen and elastic fibres (Fiq.77).
Associated with this fibrous component were fibroblasts and smooth muscle cells
that often were apparent only as cytoplasmic processes' Thin cytoplasmic
processes and an occasional cell body could be found in close association wiLh Lhe
interstitial aspect of the endothelium. These contained few orqanelles, principally
mitochondria, and probably represented pericytes (Fig.76)' Also present was an
occasional mast cell with its distinctive crystalline granules.
The arrangement of the connective tissue elements varied according to the
capillary arrangement. Where the capillaries were most closely applied to the
alveolar epithelium the interstitium consisted of the fused basal laminae of the
epithelium and the endothelium. Generally in those parts of the alveolar wall with
a single capillary arrangement, one side of the capillary was in close association
with the epithelium, whilst the other side abutted the connective tissue core of
the septum (Figs. 55, 64 and 7l). This connective tissue core occasionally con-
tained only small numbers of collagen and elastic fibres but more often a marked
thickening together with some cellular elements. Where there was a double
capillary alrangement the two capillary layers were usually separated by a well
developed connective tissue core which contained fibrous and cellular components
(Figs. 6i,661 67 and 72). There were occasional areas in which the central con-
nective core was intact but carried a sparse capillary network on both sides, so
that gaps were present between adjacent capillaries on the same side of the
septum (Figs.7l and 7f). Occasionally the capillary network from either side of
the septum joined together to form a typical single capillary arrangement (Fig.
66), whilst at other times there were transeptal anastomoses between the two
networks (Figs. 65 and74)-
(iv) Macrophages: Typical macrophages were occasionally found on the surface of
the alveoli and lobular bronchi (Figs. 25r 78 and 79).
Figure 42. Diagram of parenchymal subdivisions'
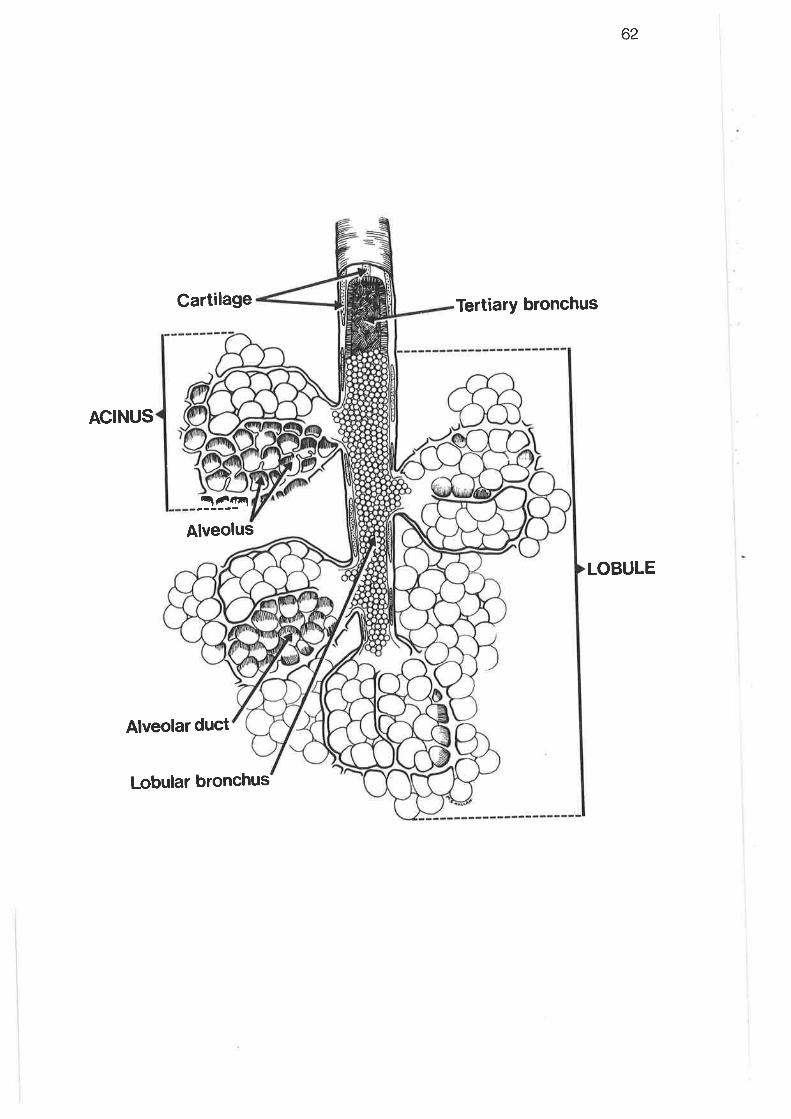
Cartilage Tertiary bronchus
62
LOBULE
ACINUS
ñr!ìliítÌltrirl
Alveolus
Alveolar duct
Lobular bronchus
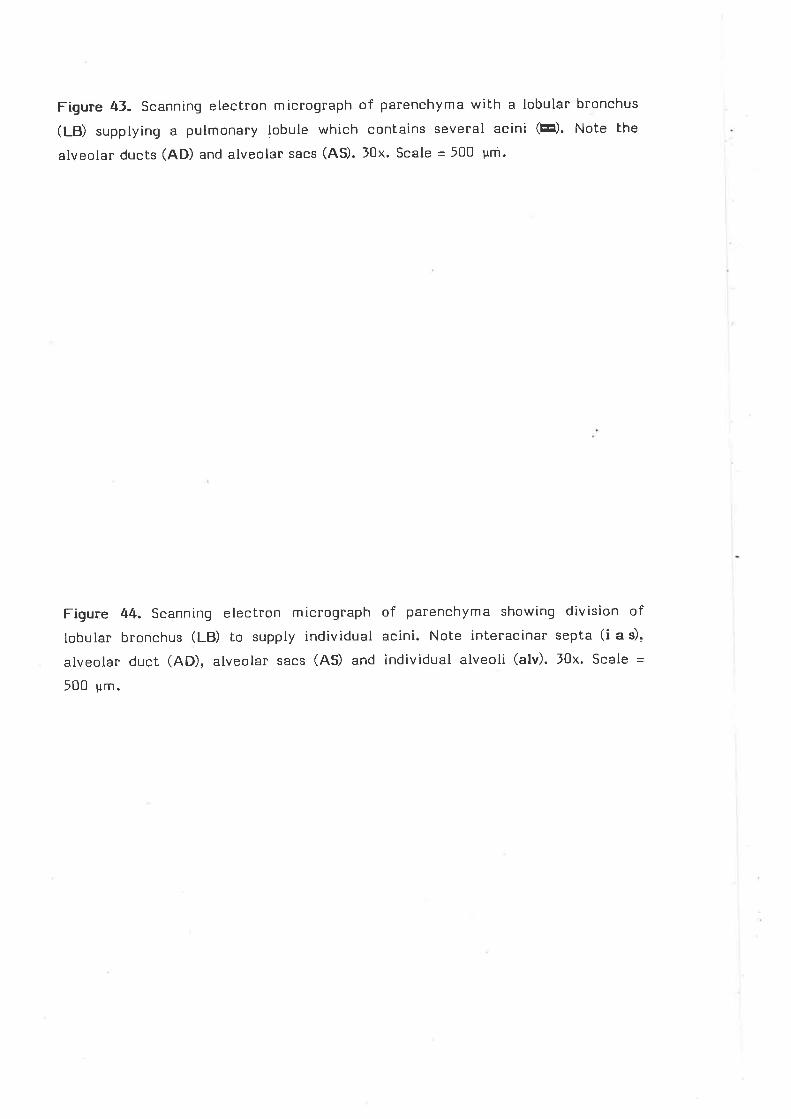
Figure 4f. Scanning electron micrograph of parenchyma with a lobular bronchus
(LB) supplying a pulmonary lobule which contains several acini (En). Nole the
alveolar ducls (AD) and alveolar sacs (AS). lOx. Scale = 500 pm.
Figure 44. Scanning electron micrograph of parenchyma showing division of
Iobular bronchus (LB) to supply individual acini. Note interacinar septa (i a s).
alveolar duct (AD), alveolar sacs (45) and individual alveoli (alv). JOx. Scale =
500 pm.
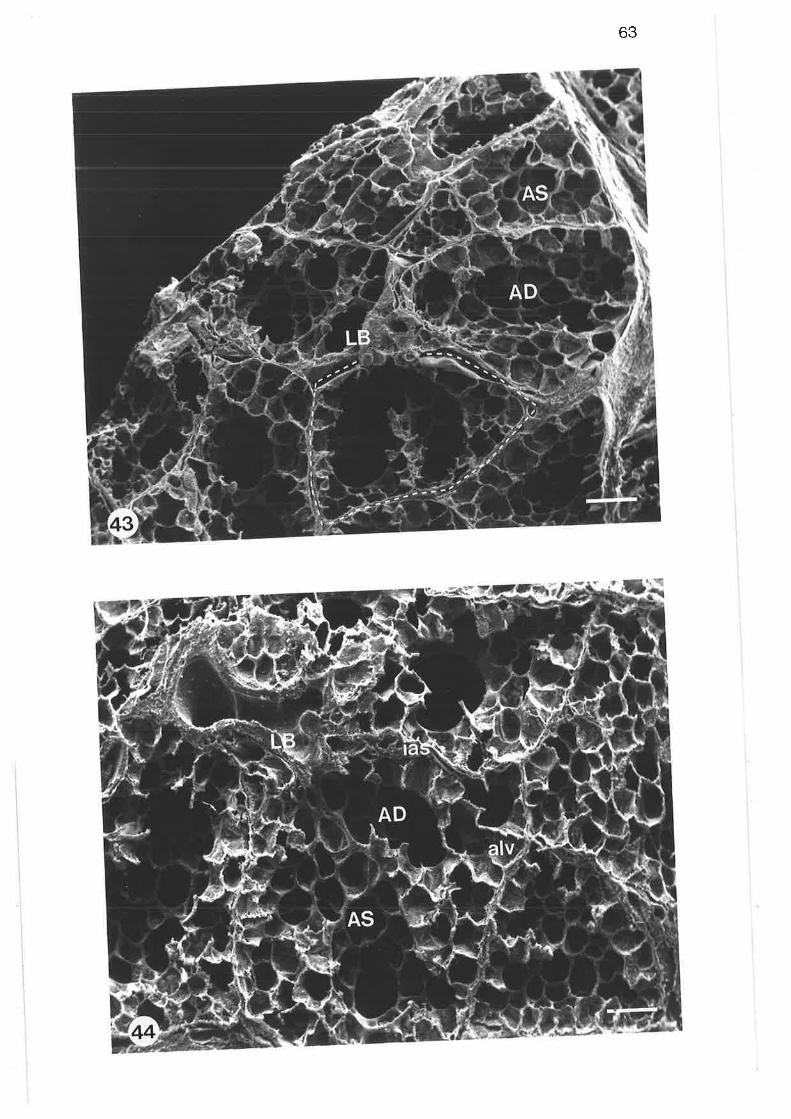
63

Figure 45. Transmission elecLron micrograph of thicker septum. Note the con-
nective Iissue elements, particularly the collagen (coll), the fibroblasts (fib), and
the mast cell (MC); the conlinuily between the connective tissue of the thick
septum and that of the alveolar septum ( 1); and the respiralory epithelium which
covers the thick septum ( tt) Z,¡OOx. Scale = 5 Fm.
Figure 46. Transmission eleclron micrograph of thick connecbive tissue septum
whose elements are continuous with those of the alveolar septum. Note also the
respiratory epithelium lining the thick septum. 2rZOOx, Scale = 5 ¡rm.
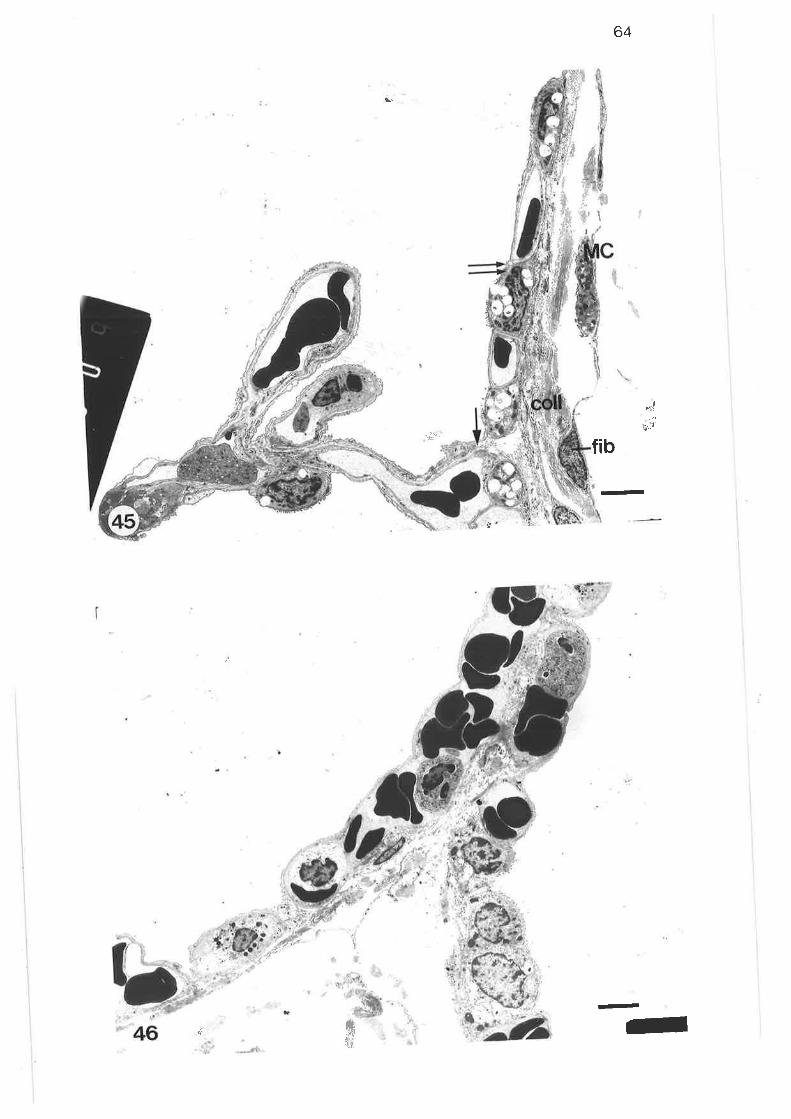
64
fib
--t-f
\.
I4:
,.rf(ç,
-
-
t!! /.
L
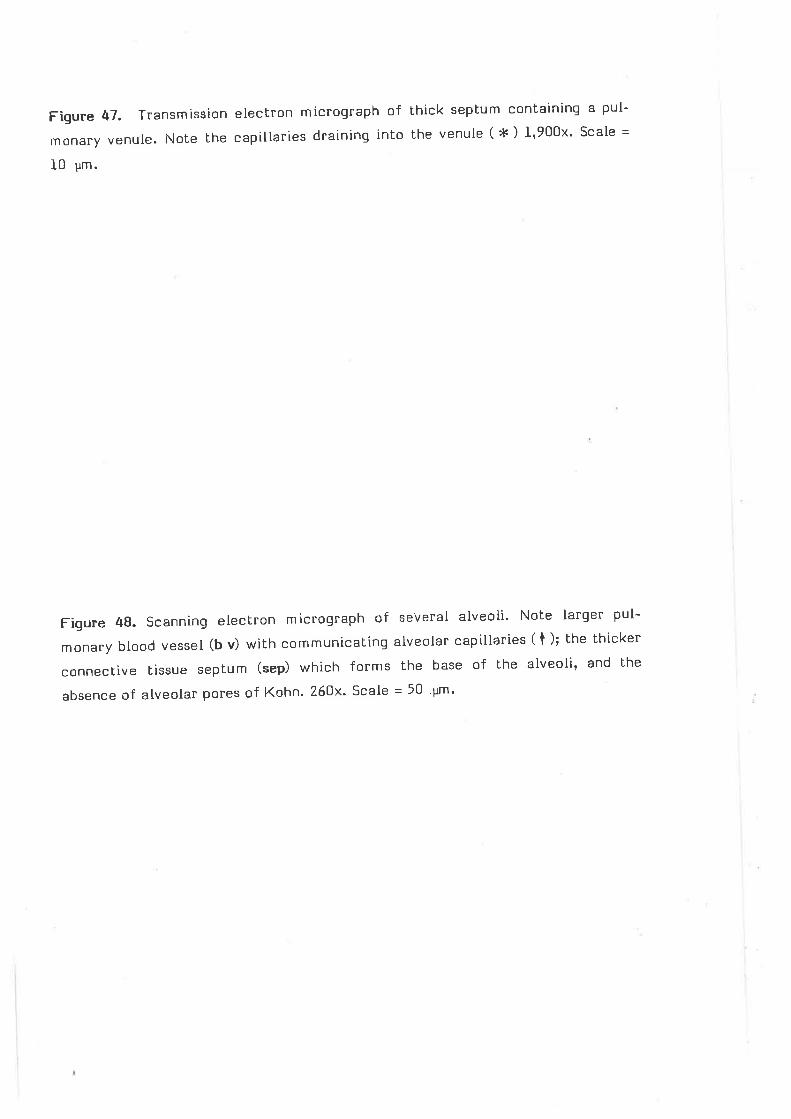
Figure 47. Transmission electron micrograph of thick septum containinq a pul-
monary venule. Note the capillaries draining into the venule ( d' ) L'900x' Scale =
I0 ym.
Figure 48. Scanning electron micrograph of several alveoli' Note larqer pul-
monary blood vessel (b v) with communicating alveolar capillaries (t ); the thicker
conneclive tissue septum (sep) which forms the base of the alveoli' and the
absence of alveolar pores of Kohn' 26Ox' Scale - 50 vm'
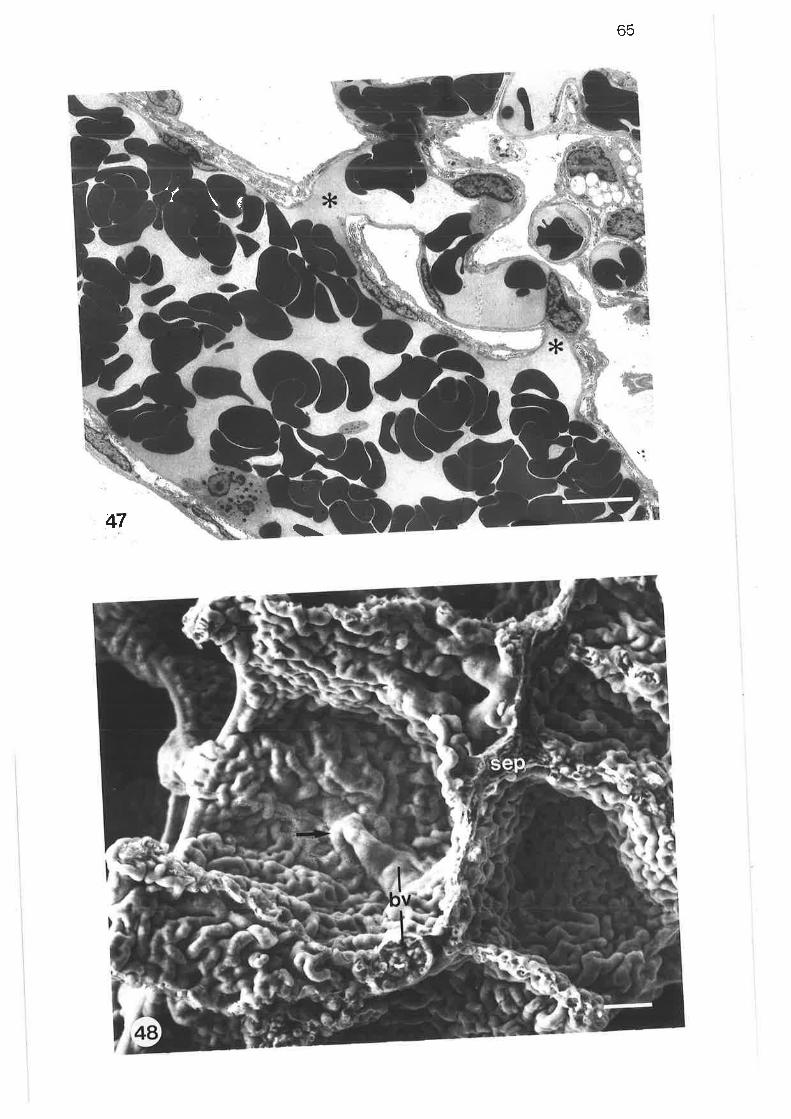
65
47 \
'( \q
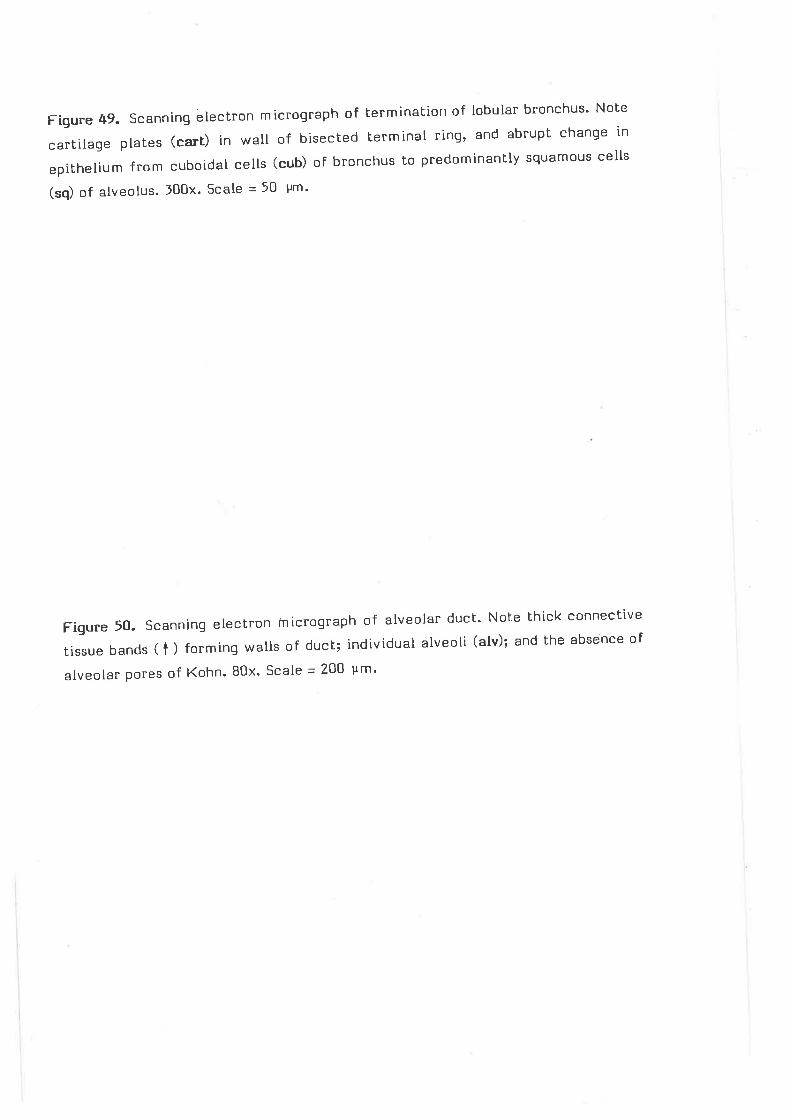
Figure 49. Scanning electron mierograph of termination of lobular bronchus' Nole
cartilage plates (cart) in wall of bisected Lerminal ring, and abrupt chanqe in
epithelium from cuboidal cells (cub) of bronchus to predominantly squamous cells
(sq) of alveolus. l00x' Scale = 50 Pm'
Figure 50- scanning electron micrograph of alveolar duct' Note thick connective
tissuebands(t)formingwallsofduct;individualalveoli(alv);andtheabsenceofalveolar pores of Kohn. BOx' Scale = 200 um'
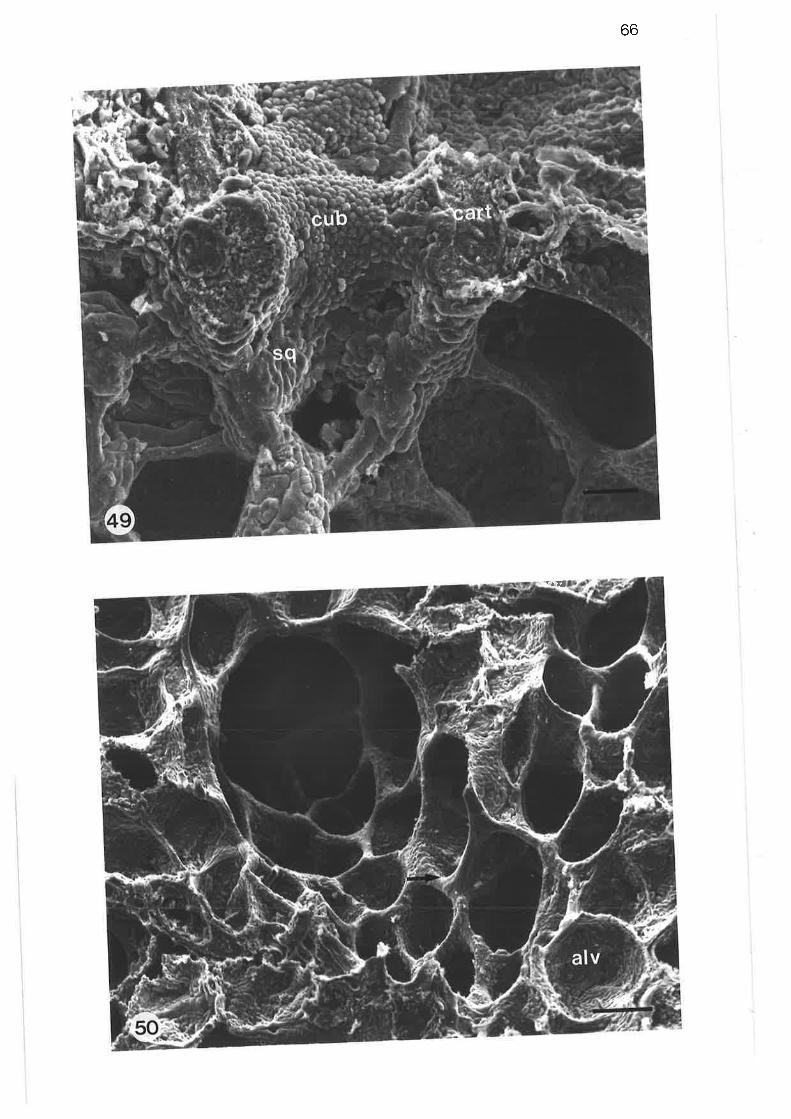
66
-.¡l
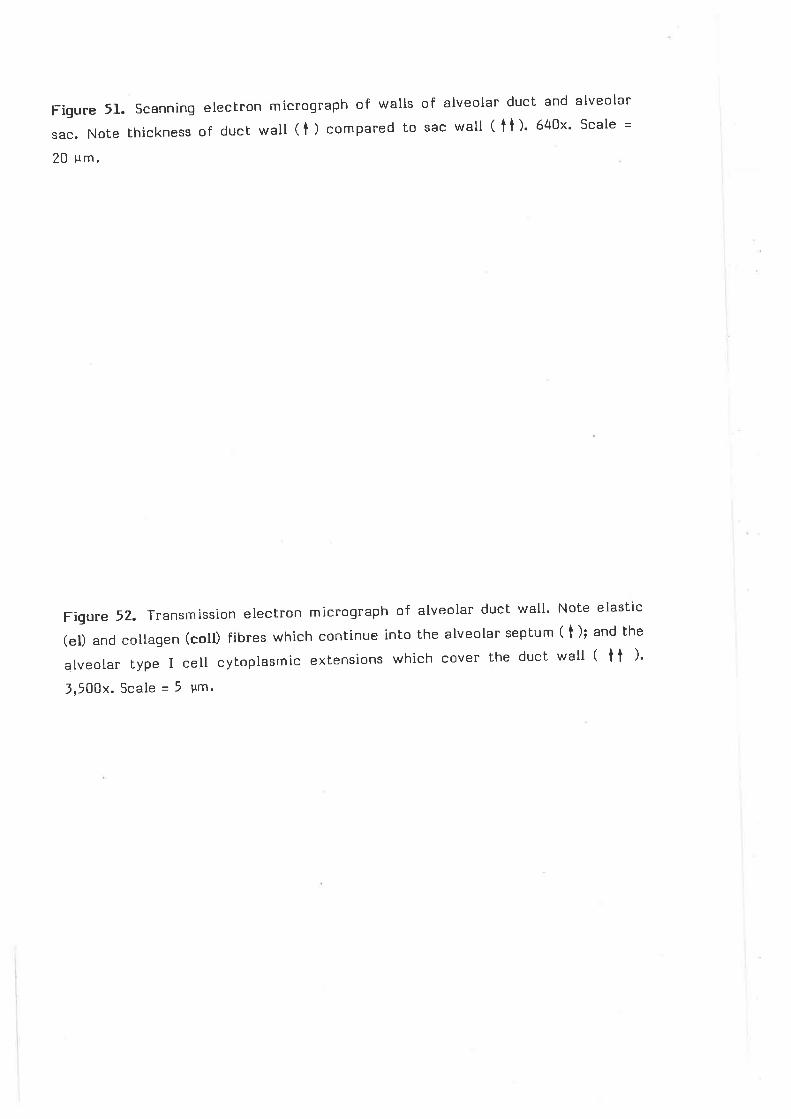
Fiqure 51. scanning elecLron micrograph of walls of alveolar duct and alveolar
sac. Note thickness of ducb wall (t ) compared to sac wall ( tt )' 640x' Scale =
20 um.
Figure 52. Transmission electron micrograph of alveolar duct wall' Note elastic
(el) and collagen (coll) fibres which continue into the alveolar septum ( 1); and the
alveolar type I cell cyloplasmic extensions which cover the duct wall ( tt )'
3,500x.Scale-5 um.
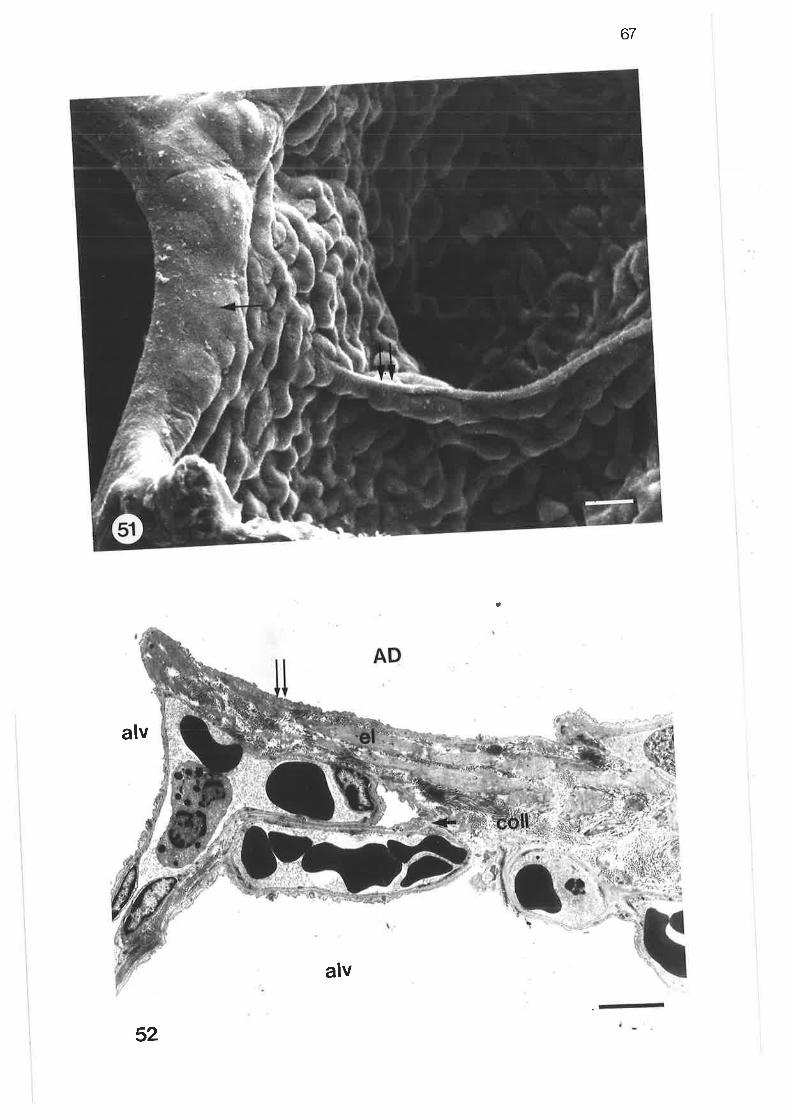
67
a
alv
52
alv
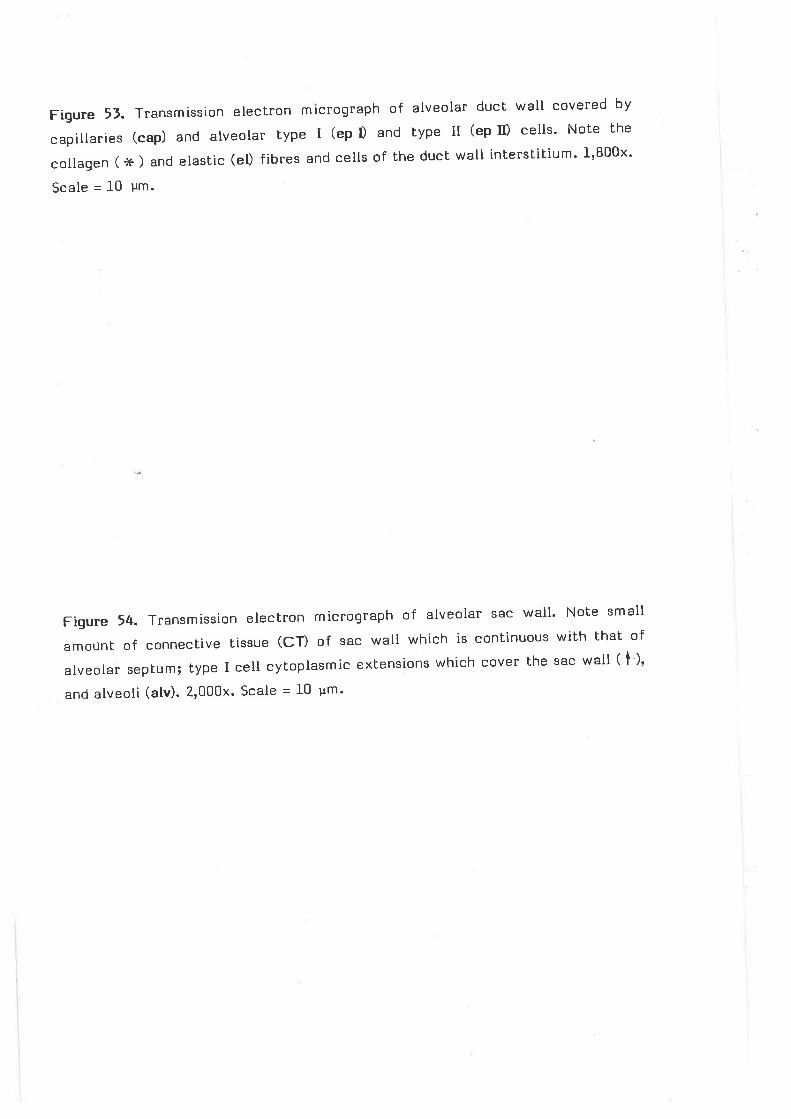
Figure 5J. Transmission electron mtcrograph of alveolar duct wall covered by
capillaries (cap) and alveolar type I (ep D and type II (ep II) cells' Note the
collagen ( x ) and elastic (el) fibres and cells of the duct wall inlersti[ium' 1,800x'
Scale - l0 um.
Figure 54. Transmission electron micrograph of alveolar sac wall' Note small
amoL¡nt of connective tissue (CD of sac wall which is continuous with lhat of
alveolar septum; type I cell cytoplasmic extensions which covet the sac wall ( l-)'
and alveoli (alv). 2,000x. Scale - 10 um'
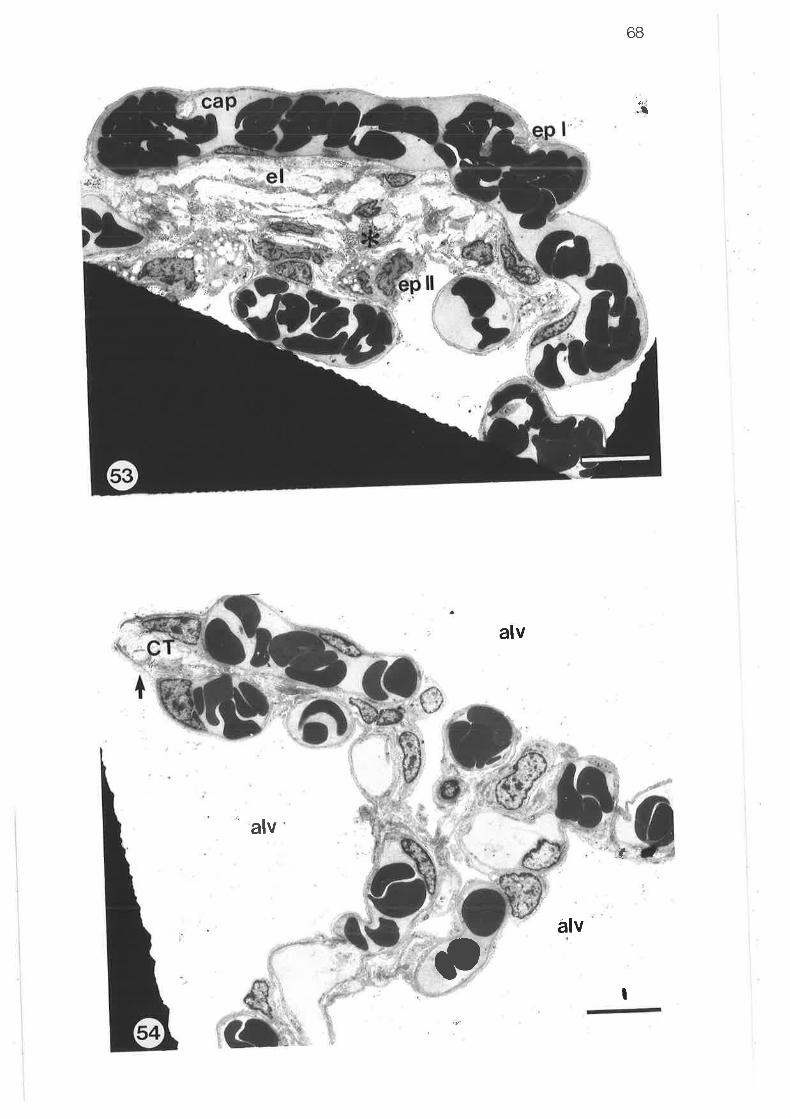
68
,.1
alv
:i'alv
d
çt
alv
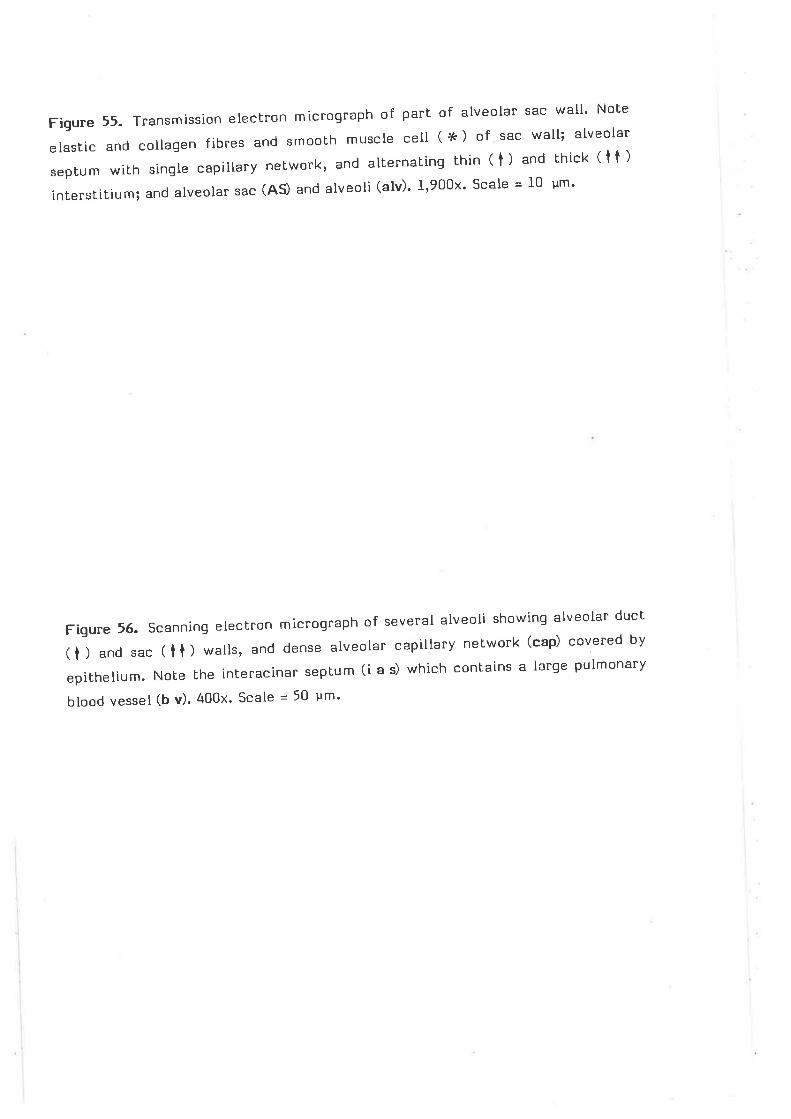
Figure55.Transmissionelectronmicrographofpartofalveola[Sacwall.Noteelastic and collagen fibres and smoolh muscle cell ( ¡¡ç ) of sac wall; alveolar
septum with single capillary network, and alternaling thin ( t ) and thick ( t t )
interstitium; and alveolar sac (AS) and alveoli (alv)' 1,900x' scale = I0 ym'
Figure 56. Scanning electron micrograph of several alveoli showing alveolar duct
( l ) and sac ( t l ) walls, and dense alveolar capillary network (cap) covered by
epithelium. Nole the interacinar septum (i a s) which contains a large pulmonary
blood vessel (b v). 400x' Scale = 50 um'
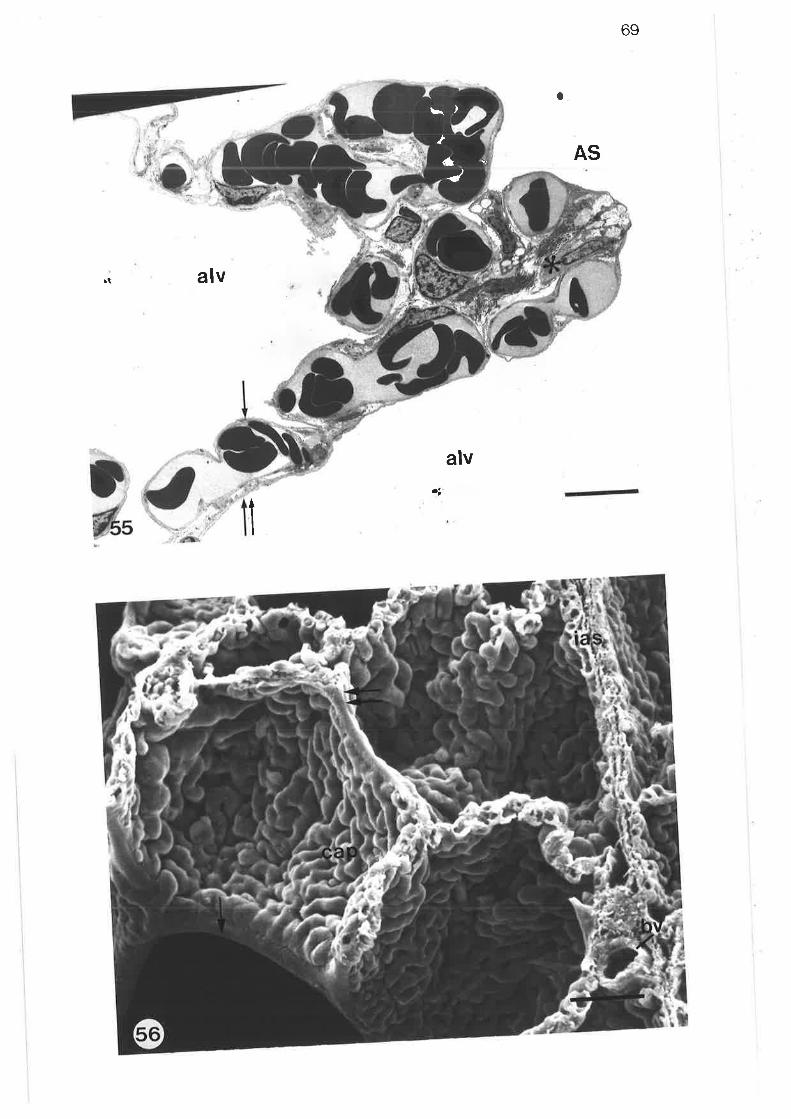
¿
\
t
)
ói;
69
o
AS
alvrt
alv.i
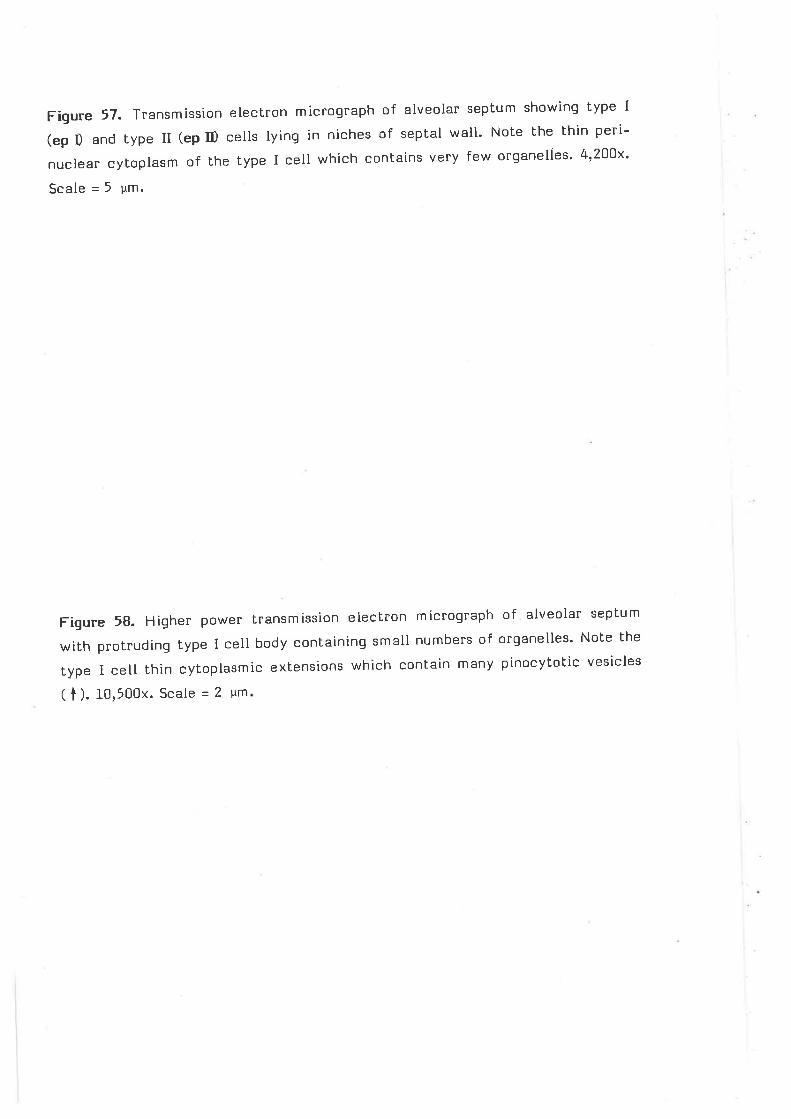
Figure 57. Transmission electron micrograph of alveolar septum showinq type I
(ep D and type u (ep II) cells lying in niches of septal wall' Note the thin peri-
nuclear cytoplasm of the type I cell which conlains very few organelles' 4'200x'
Scale = 5 ym.
Figure 58. Higher power transmission eleetron micrograph of alveolar septum
with protruding type I cell body containing small numbers of organelles' Note the
type I cell thin cytoplasmic extensions which contain many pinocytolic vesicles
( t ). f0,500x. Scale = 2 um
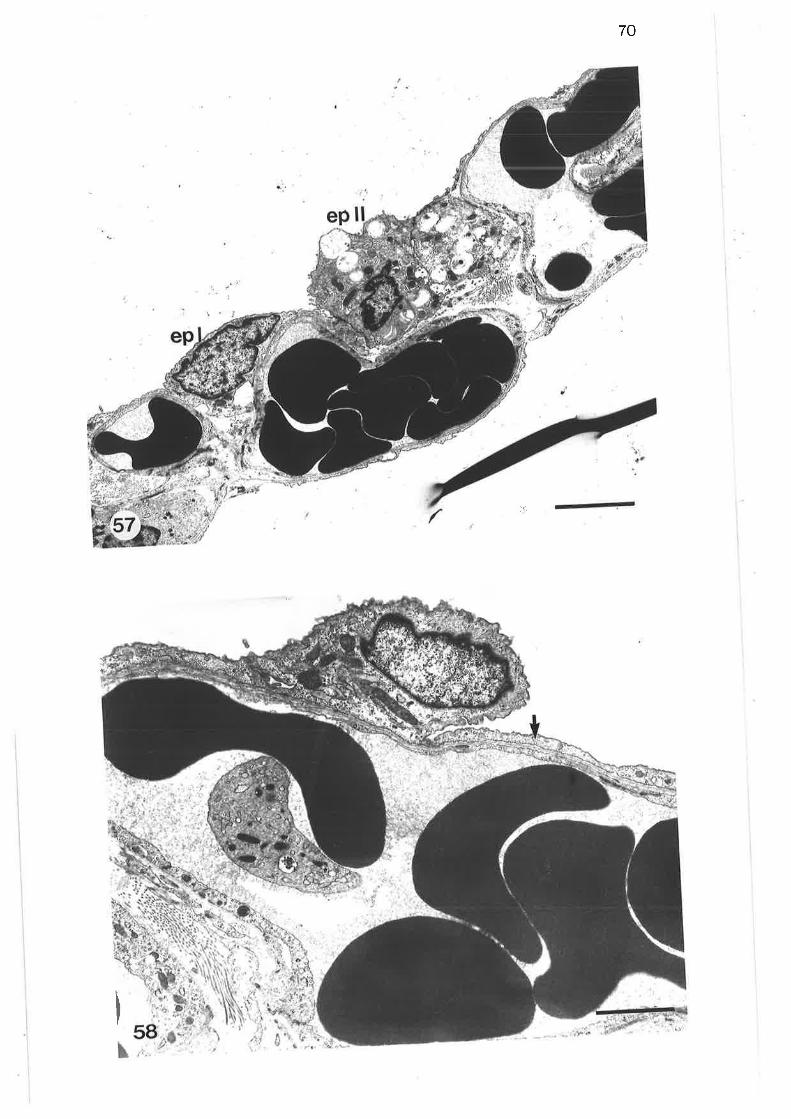
70
:ri
Figure 5g. Transmission electron micrograph of type I cell. Note sparse perl-
nuclear organelles and pinocytotic vesicles of cytoplasm ic extensions; non-
fenestrated endothelium of capillaries with sparse perinuclear (N) organelles and
cytoplasmic pinocytotic vesicles ( t )' 7,700x' Scale = 2 um'
Figure 60. Transmission electron micrograph of type II cell' Br600x' scale = 2 um'
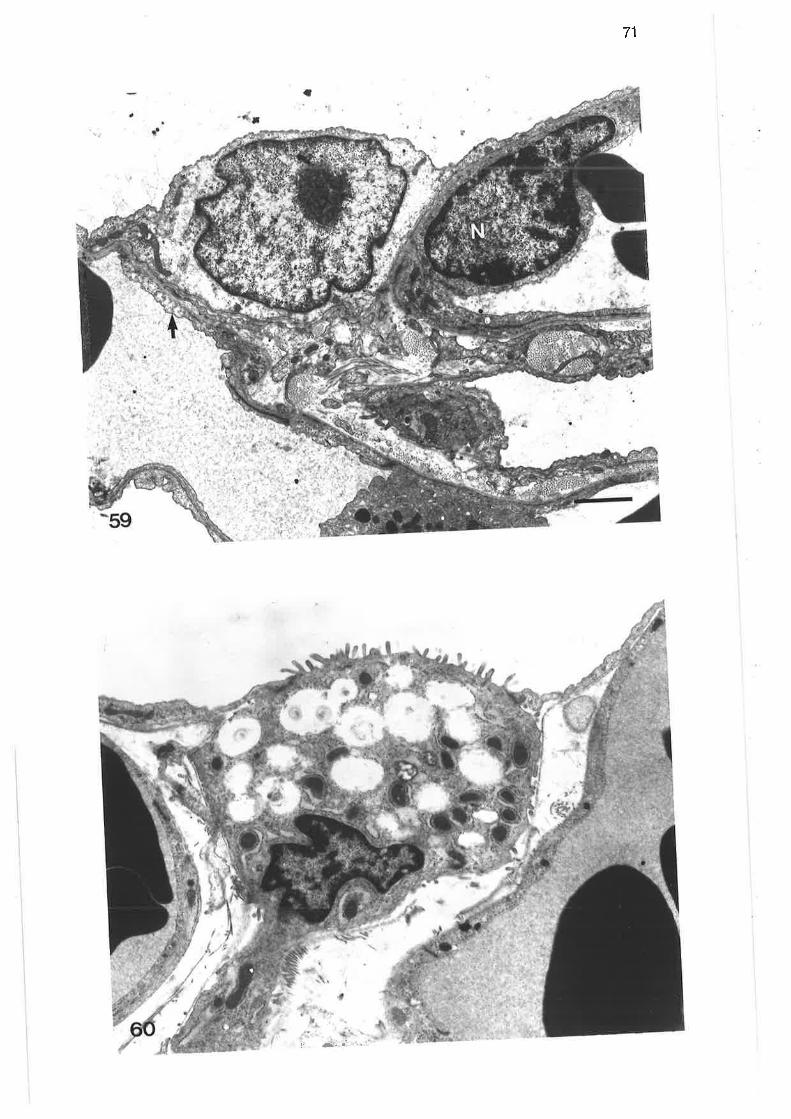
71
l' ¿¡' ¡ '' l
Figure6l.ScanningelecLronmicrographofalveolarsurfaceshowinggroupsoftype II cells (ep u) lyinq wilhin niches between capillaries' 2'2OOx' Scale = J'0 pm'
Figure 62. High power scanning electron micrograph of alveolar type II cells'
Note numerous superficial microvilli (MV); and junction line between cytoplasmic
sheets of type I cells ( t ). e,fOOx' Scale = 2 uin'
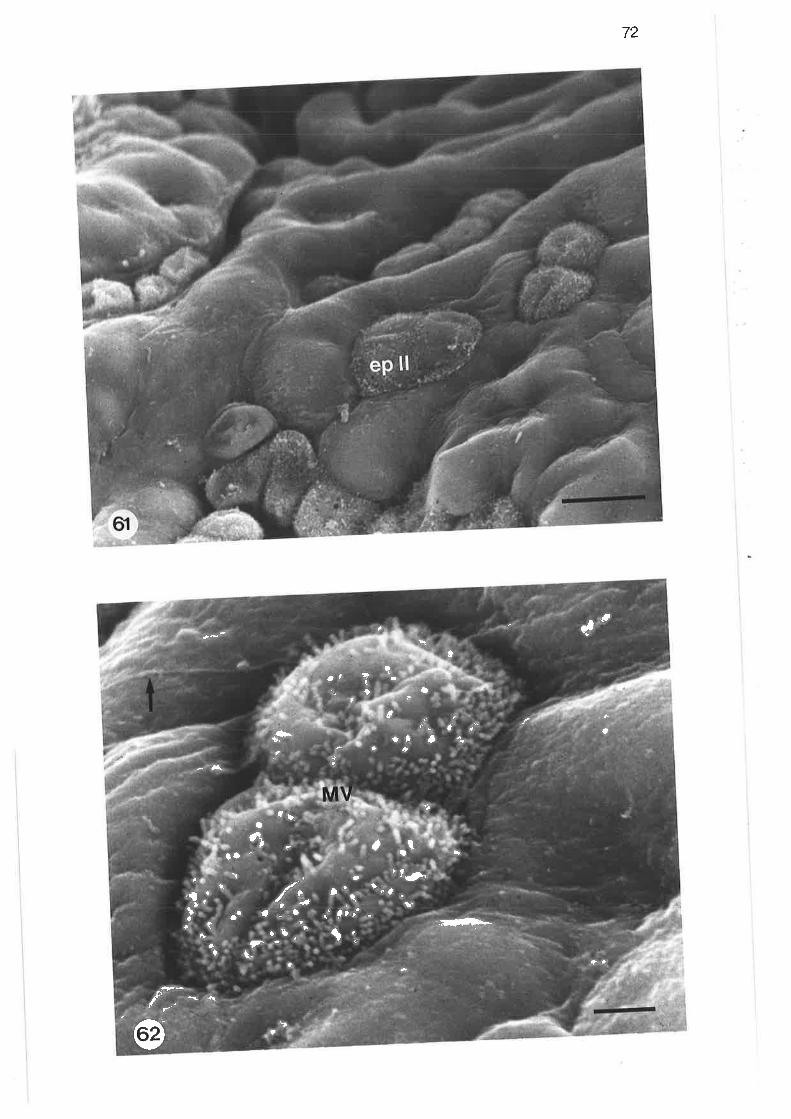
72
ta
-A
to',le,
.tII
C
ç4.
Ðct
aÊ
t**
tqÒ ì
ìç
a
õ I'
ri :Ìrl+]I \- Ì
f _..
1'@
t
.7
a
ì
Ia
¡
a¡.
l' t 'èa
at'
"l a
('frt' .
l'"
/.".,Ò
¡ù'"
f
q.Ì i,:1
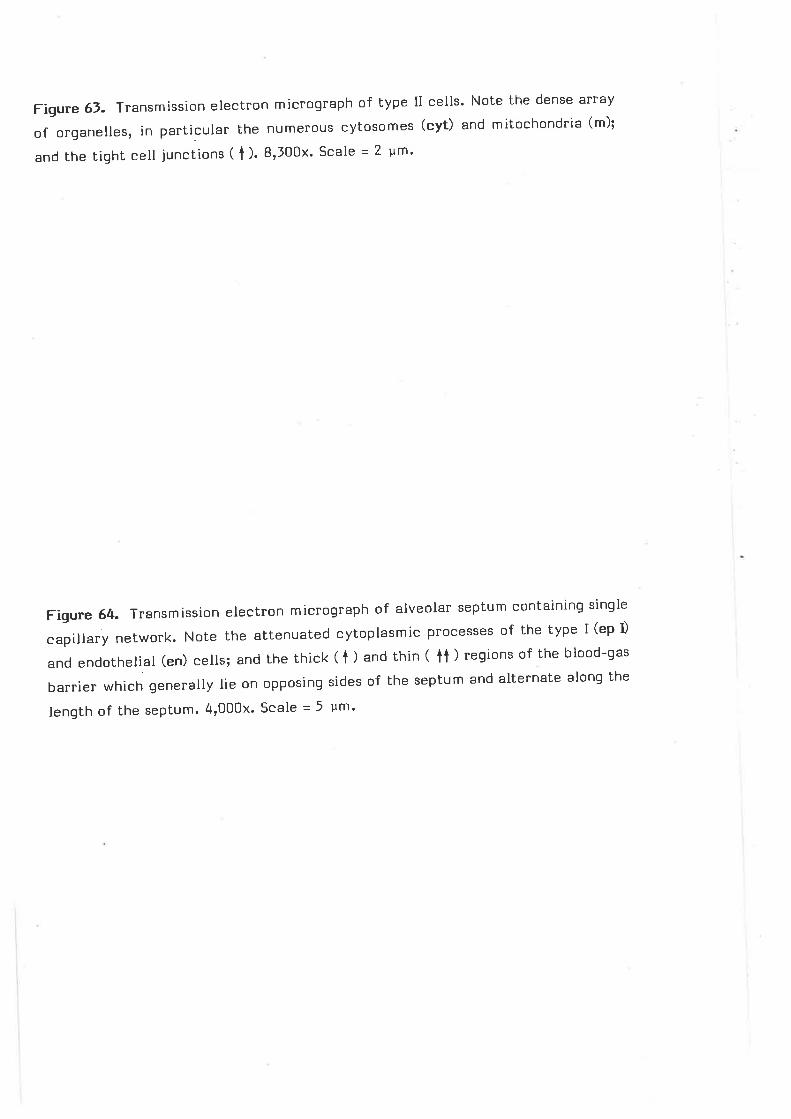
Figure 6J. Transmission electron microqraph of type Il cells' Note the dense array
of organelles, in particular the numerous cy[osomes (cyt) and mitochondria (m);
and the tight cell junctions ( t )' B,l00x' Scale = 2 ¡rrTì'
Figure 64. Transmission electron micrograph of alveolar septum containing single
capillary network. Note the attenuated cytoplasmic processes of the type I (ep I)
and endotheli,al (en) cells; and the thick ( t ) and thin ( tt ) regions of the blood-gas
barrier which generally lie on opposing sides of the septum and alternate along the
length of the septum. 4r000x' Scale = 5 um'
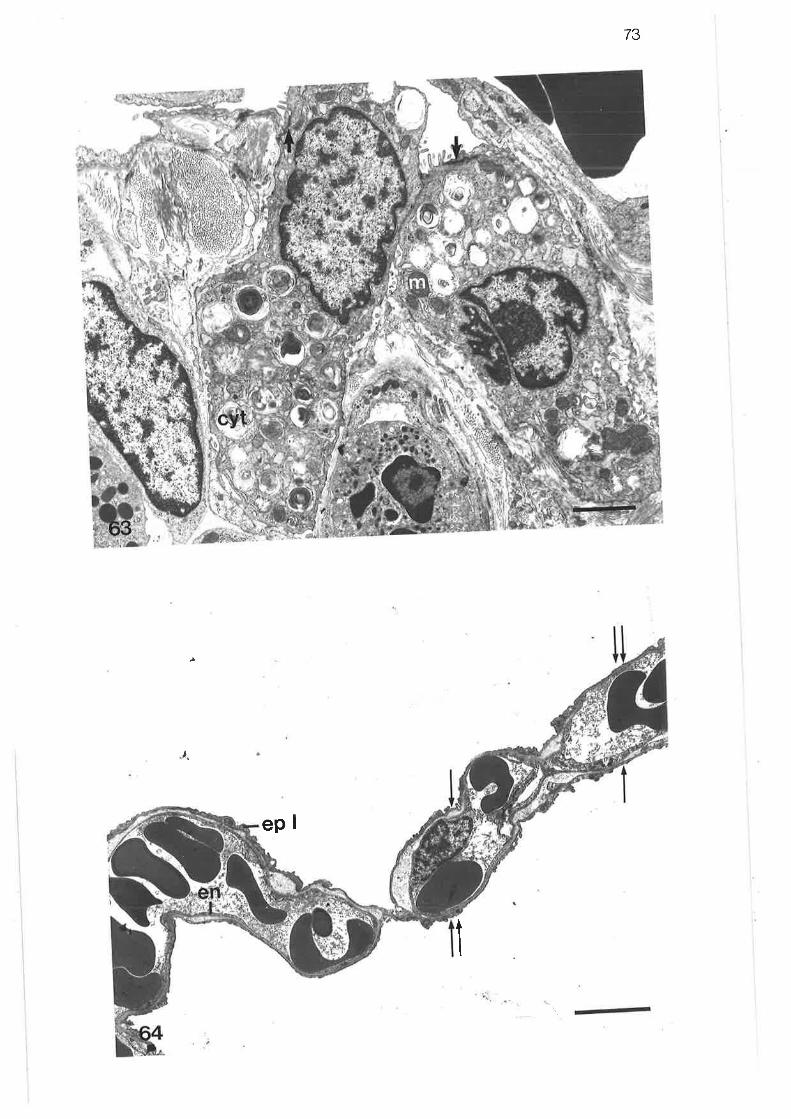
73
ì
epl
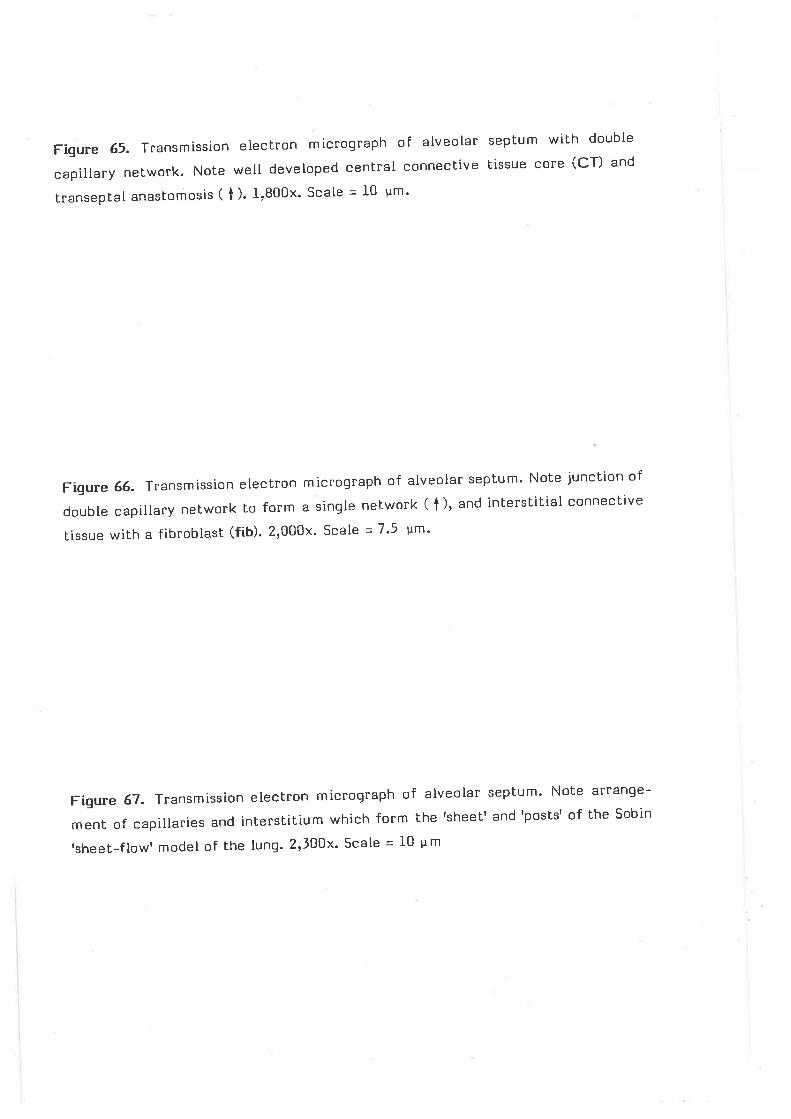
Figure 65. Transmission electron micrograph of alveolar septum with double
capillary network. Note well developed central connective lissue core (cT) and
transeptal anastomosis ( 1)' l,B00x' Scale - l0 um'
Figure 66. Transmission electron micrograph of alveolan septum' Note junction of
double capillary network lo form a single network ( t ), and interstitial connective
tissue with a fibroblast (fib)' 2,000x' Scale - 7'5 ¡rm'
Figure 67. Transmission electron micrograph of alveolar septum' Note arrange-
ment of capillaries and interslitium which form thersheet'andtposLs'of the sobin
'sheet-flow' model of the lung' 2,300x' Scale - l0 pm
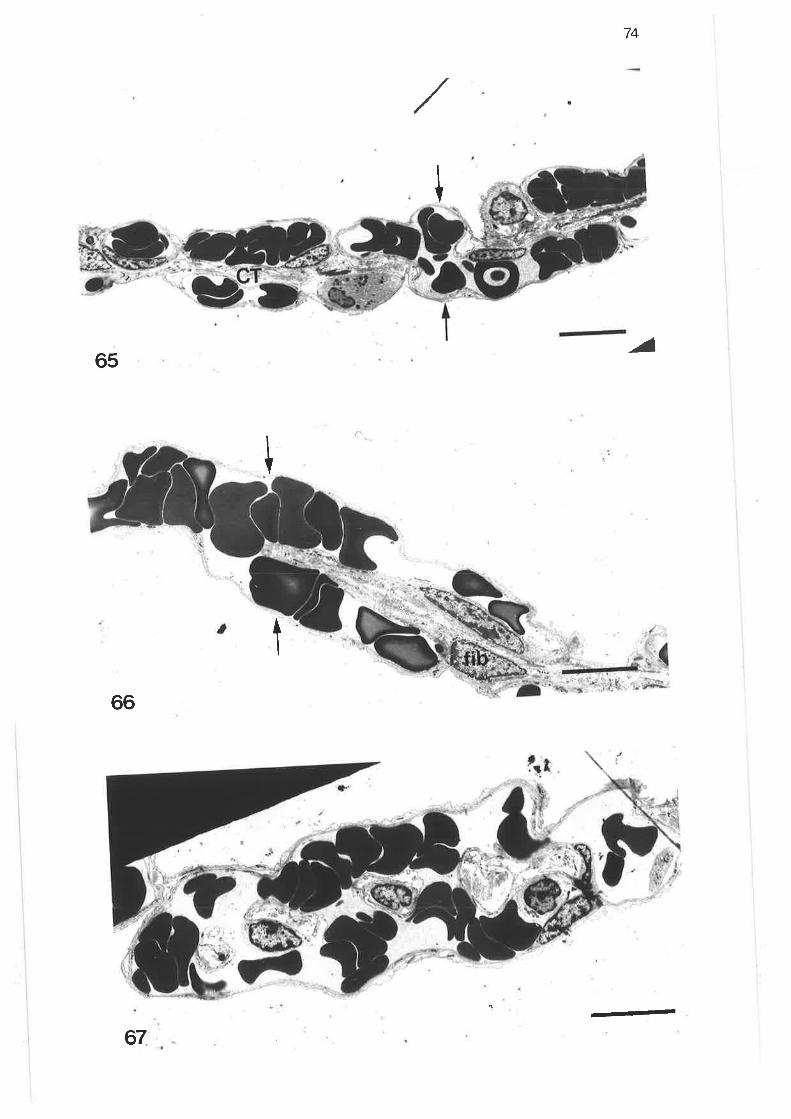
74
/
I
-/65
I
66
-167
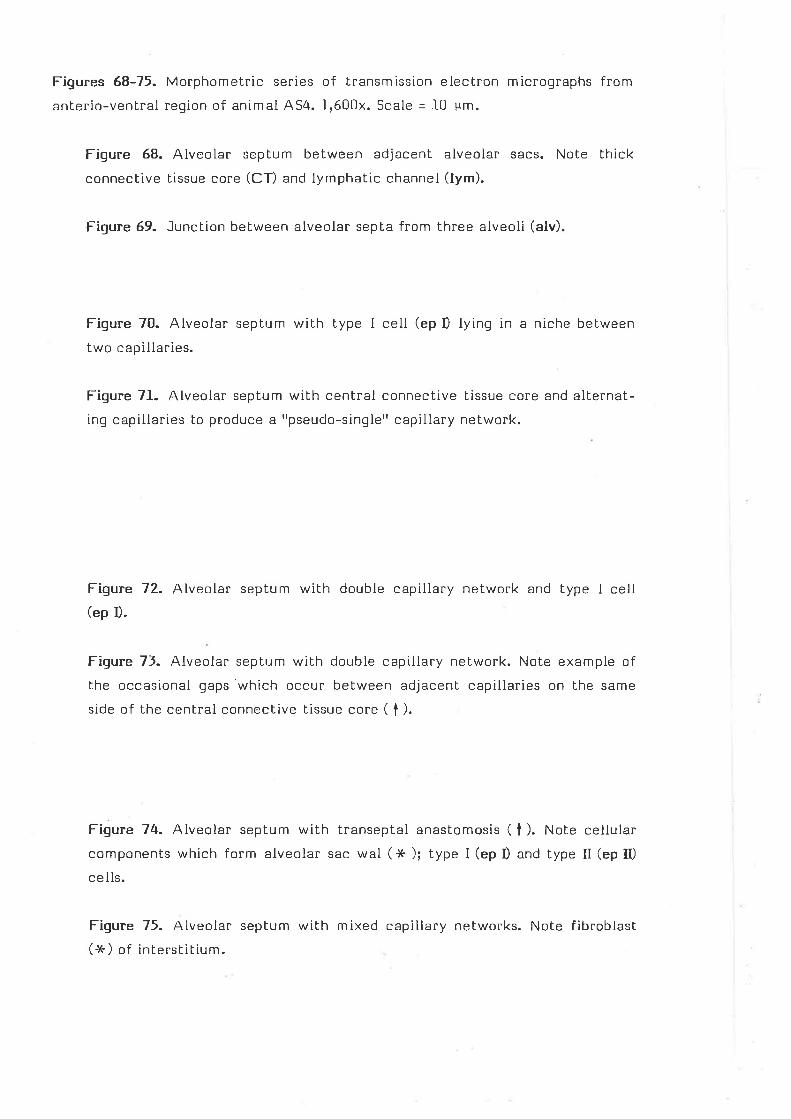
Figures 68-75. Morphometric series of transmission eleclnon micrographs from
anlerio-ventral region of animal A54. 1,600x. Scale = L0 Fm.
Figure 68. Alveolar septu m between adjacent alveolar sacs. Note thick
connective lissue core (CT) and lymphalic channel (lym).
Figure 69. Junclion between alveolar sepla from three atveoli (alv)
Figure 70. Alveolan septum with type I cell (rp D lying in a niche belween
two capillaries.
Figure 71. Alveolar septum with central connective tissue core and alternat-
ing capillaries to produce a "pseudo-single'r capillary network.
Figure 72. Alveolar septum with double capillary network and type I cell(ep D.
Figure 7f. Alveolar septum with double capillary network. Note example of
the occasional gaps which occur between adjacent capillaries on the same
side of the cenlral conneclive tissue core ( I ).
Figure 74. Alveolar septum with transeptal anastomosis ( t ). Note cellular
components which form alveolar sac wal (+ç ); type I (ep D and type II (ep tr)
c e Ils.
Figure 75. Alveolar septum with mixed capillary networks. Note fibroblast(x ) ot interstilium.
75
alv
alv
alv
--68
E
TI
LE*
/73
u \----
I
ep
^ås. /75
Figure 76. Transmission electron micrograph of double capillary septum. Nole
endothelial cell nucleus (N), probable pericyctes (peri), and fused basal laminae
(b t) of epithelium and endothelium.7,200x. Scale - 2 pm.
Figure 77. High power transmission eleclron micrograph of alveolar septal inter-stitium. Note collagen and elastic fibres, and fibroblast (fib). 13,900x. Scale =
I um.
76

Figure 78- Transm ission electron m icrograph of alveolar m acrophaqe. Note
adhesion of macrophage to seplal surface, and pseudopodia ( t ). ff.fOOx. Scale =
I um.
Figure 79. Scanning electron micrograph of alveolar surface with macrophage
attached by pseudopodia ( t ). Z,9OOx. Scale - 5 um.
77
-
18.
'.5 DTSCUSSION
f.5.I MacroscoPic
(a) Trachea
ThestructureinN.cinereaissimilartothatfoundinterrestrialmammals
(Rhodin,I974).However,thedorsalwallofthetracheaisaffordedgreaterpro-
tection in Neophoca by the ends of the cartilage rings which overlap each oLher'
In Neo ohoc a. as in other otariid seals studied (Sokolov et al'' I97Ii Green'
I912),thetracheadividesintothetwomajorbronchiwellforwardint'hethoracic
cavity,sothatthebronchiareaslongas,andsometimeslongerthan,thetrachea.
Thisisincontrasttot,hesituationinterrestrialmammals(BloomandFawcett'
1968; Rhodin, Ig7Ð and phocid seals (Sokolov et aI. , I97I Green, 1972; Tarasoff
andKooyman,IgT3b)wherethetracheabifurcatesat,ornear'Lhehilumofthe
lung.
(b) Lungs
Thedivisionofthelungsintolobesbycompletepleura-Iinedfissures,is
morelikethaLofmanyterrestrialmammals|hanthatofsomemarinemammals.
The division, in Neo hoca of the riqht lung into four lobes and the left into two
lobes is the same as that found in cats, dogs, sheep and pigs (Miller et al'' 1964;
Robinson, rgfjÐ.As in these species the left cranial lobe may be deeply fissured to
indicate apical and cardiac segments' The lobar division of the Australian sea lion
lung is in marked contrast to that of the cetaceans (Green' 1972; Fanning and
Harrison, I974) and some phocids (sokolov et aI'' IgTI' Tarasoff and Kooyman'
I973a)wherethereisno,olVerylittle,evidenceoflobation.Thelunglobationin
NeophocaisthesameasthatdescribedfortheSteller'ssealion(Sokolovetal.,
]97I)andWeddellseal(Byd,|975),andisverysimilartothatoftheCalifornta
sea lion (Green, L972)'
(c) Terminal airwaYs
Thedivisionofthecartilage-containingterminalairways,fromthetertiary
bronchustothelobuìarbronchuswhichdirectlygivesrisetothealveolarduct,is
19.
in marked contrast to the bronchial-bronchiolar arrangement present in terrestrial
mammals (Krahl, Lg64iRhodin' I974; Banks' l9B1) and phocid seals (Simpson and
Gardner,I972;DenisonandKooyman,J.gT}).Inphocidsthebronchiolesarere-
inforcedbythickenedbundlesofsmoothmuscle(BoshierandHill,IgT4;Boyd,
Igl5;Welsch and Drescher, l9B2). The presence of cartilage-reinforced terminal
airways has been described in cetaceans (wislock\' I929i I9J5; I942i Wislocki and
Bêlanger,I94O;Bélanger,1940;SimpsonandGardner'I972iKooyman'1973;
Fanning and Halrison, L974; Fanning, 1977), sirenians (Wistocki, L935; Bälanger,
1940)andotherotariids(DenisonetaI.,IgTIiSimpsonandGardner,IgT2;Denison
andKooyman,IgT3;Kooyman,LgT,.TheterminalairwaysoftheAustraliansea
lioncontaincartilaginousreinforcementtogetherwithprominentbundlesof
smoothmuscle.Thereinforcementofterminalairwaysinallmarinemammalsis
important for alveolar collapse (Ridgway et al.' 1969i Denison et al.' r97I)' and in
cetaceans and otariids to enable high expiratory flow rates (Kerem et al'' I975i
Matthews,I97l;KooymanandSinnetL'!919;KooymanandCornell'1981)'
5.5-Z M.icroscoprc
(a) Lobutar bronchi
(i)Epithelium:Thefourcelltypesobservedinthetransitionregionareall
columnar in shaPe'
Thesecretorycellswhichcontainelectron-densemembrane-boundqranules
are,inmanyrespects,similartotheepithelialserouscellsdescribedintherat
(Jeffrey and Reid, 1975) and in human foetuses (Jeffrey and Reid, 1977), The
secretorygranulesinNeophocameasureduptol:ilmindiameterwhichiswithin
thesizerangeof0.6to].2pmforthesegranulesintherat(JeffreyandReid,
I975iSpiceretaI.,r9B0).However,otherfeaturesofepithelialserouscells
described in rats, such as abundant rough endoplasmic reticulum and lumenal
microvilliwereabsentfromthesecellsintheAustraliansealion.Therefore
cytochemicaltechniquesneedtobeappliedtodeterminethetruenatureofthese
cells.
BO
ThemosLnumerousnon-secretorycellinthetransitionregionwasacell
devoidofanystrikingcharacteristicfeatures.Thesecellscorrespondtothe
intermediatecellsdescribedinmanyspecies(JeffreyandReid,]'975;L971i
BreezeandWheeldon,ISTT).Similarcellsinhumansandhamstershavebeen
termed indifferent cells because of their undifferentiated appearance (McDowe'
etaI.,I97BiBeccietal.,I97B).Inseveralspeciesthesecellshavedisplayedsigns
of differentiating into either ciliated cells or mucous cells (Breeze and wheeldon'
L97\iMcDowelletaI.,I97B),andhavebeenmorecommoninregeneratinqres-
piratoryepithelium(McDoweIIetaI.,IgTB).Itappearslikelythatthenon-
secretory cells of the Australian sea lion perform a similar replacement function'
asoccasionallythesecellsindicaiedsomedifferentiation.Thesecellscontaineda
small number of granules similar to lhose found in the secretory serous-like cells;
however, none of the cells observed displayed signs of ciliogenesis'
Theciliatedcellspresentinthetransitionregion,andthoseinthelobular
bronchi,showednoessentialdifferencestoLhosefoundinterrestrialspectes
(Rhodin, I966i I974; Breeze and Wheeldon' 1977)'
Thenon-secretorymicrovillouscells,withtheirdistinctivemicrovilliand
prominentaxialfilaments,werepresentinsmallnumbersinboththetransition
region and the Iobular bronchi. They contained many organelles, the most dis-
tinguishingofwhichwerethebundlesofcytoplasmicfilaments.Theappearanceof
these cells was similar to that of the brush cetl in the airways of many terrestrial
mammals(Baskerville,lgT0;Rhodin'I914;JeffreyandReid'1975;Breezeand
wheeldon,rgTtiAllan,rgTB;Kennedyetal.,rgl}iHydeetal',1979)andinthe
alveoli of the rat (Meyrick and Reid, 1968;Weibel' I973i Hijiya et al., 1977)'
Thegranularmigratorycellsobservedintheepitheliumofthelobular
bronchiappealidenticaltosomeofthemigratorycellsofthesubmucosaandto
granulocytes observed within the alveolar capillaries' of the two miqratory cells
described in the epithelium of other species' the lymphocyte and the globule
Ieukocyte (Jeffrey and Reid, 1975; 1977; Breeze and Wheeldon, 1977), those found
81.
in the lobular bronchi most resemble the granular globule leukocyte' Globule
leukocytes are mononuclear cells with large, refractile qranules and may possess
microvillous projections. These cells are considered to arise from the subepithelial
mast cells which they resemble (Breeze and wheeldon' I97Ð' The migratory cells
in Neoohoc a. however, Possess a bi-lobed nucleus, unif orm Iy electron-dense
granulesandnocytoplasmicprocesses.Thedistributionofthesecellsin
NeoohoCâ. togetherwiththeirstructure'indicatethattheyaremostprobably
eosinophils. Eosinophil granules are generally regarded as containing a crystalloid
inclusion, atthough the absence of such inclusions has been observed in the eosino-
phils of the horse and the cow (Schalm et al', I975)' Eosinophils have been found
tooccurparticularlyinlooseconnectivetissueassociatedwithvarioustypesof
epithelium,includingthatoftherespiratorytract(Schalmetal.,1975),aS
observedhere.Parasitism,particularlyinassociationwithmigratinglarvae'
causesaneosinophilia(Schalmetal.,I97Ðwhichisacommonfindinginthe
peripheral blood of the Australian sea Iion (Needham et al'' 19B0)' These findinqs'
togetherwiththeobservedpulmonaryparasiticinfestationoftheseanimals
(Chapter5),wouldsuggestthatthesecellsareeosinophilsratherthanglobule
Ieukoc Ytes.
Thereweresixtypesofepithelialcellsobservedinthelobularbronchus.
Themostprominentfeatureofthecuboidalsecretorycellsofthelobular
bronchiwasthelargenumberofsecretoryvesicles.Thesevesiclesqenerally
contained osmiophilic Iamellae which were similar in appearance to the lamellar
cytosomesfoundinthealveolartypellcells.Thecolumnarsecretorycellsonthe
other hand, contained very few, if any, vesicles with osmiophilic lamellae but
rathertheycontainednUmerousprofilesofendoplasmicreticulumandan
occasionalsecretorygranule.Thesecellspossessedmanyofthefeaturesdescribed
for the non-ciliated bronchiolar (Clara) cells of rals (Smith et al'' I974; Jeffrey
andReid,I975;SmithetaI.,I979;Plopperetal.,IgBOa),mice(Nidenand
Yamada,1966;SmithetaI.,I979;Plopperetal.,l9B0a;PacketaI.,tgBt),rabbits
82.
(cutz and conen , rg7r; smith et al., 1979; Plopper et al., l980a) and.humans (cutz
and Conen , I97Il André-Bougaran et al., 1975; Smith et al., 1979; Plopper eL al.,
].980c).Unlikeinmostterrestrialspecies,thesecolumnarsecretorycellsinthe
Australian sea lion contained very few secretory granules' However' similar small
numbers of granules have been observed in the non-ciliated bronchiolar cells of
dogs (Hyde et al., I97B; Plopper et al., l980b), cattle (Plopper et al'' L980b) and
ferrets (Hyde et al', Ig79), whilst in cats no granules are Present (Plopper et al"
1980b).Clara-Iikecells,inwhichsecretorygranulesarepresent,haveonlybeen
describedinthreeothermarinemammalspecies,theSouthAustraliandophin
(FanningandHarrison,IgT4;Fanning,Lg77)andtheWeddeltandcrabeater'
Lobodon carclno ha US seals (Welsch and Drescher, I9BÐ' The occurrence of
species differences in the appearance of non-ciliated broncholar cells has been
well recognized (Breeze et al., I976; Smith et al', 1979; Plopper et al'' I9B0c;
widdicombe and Pack, l9B2) together with differences within the one specles
(Smithetal.,I974;Packetal',1981;WiddicombeandPack'I9BÐ'
Thepresenceofcellsintheterminalairwayssimilartothealveolartypell
cells has only been described in the distal regions of the respiratory bronchioles of
macaques (Castleman et al., Ig75), in the third order bronchioles of humans
(Andre-Bougaran et al., I975) and in the respiratory bronchioles of the weddell
and crabeater seals (Welsch and Drescher, J-982)' Thus it would appear that the
epithelium of the lobular bronchi of Neophoca contains both clara-like cells and
alveolar tYPe ll-like cells'
Thepresenceofthesetwotypesofsecretorycellinthelobularbronchiis
interesling in terms of lower airway function and the extracellular lining layer in
boththeairwaysandthealveoli.Thepresenceofanextracellularlayerinthe
bronchioles of terrestrial mammals which behaved similarly to alveolar sur-
factant, was demonstrated by Macklem et al' (1970)' This layer has since been
observedelectronmicroscopically(GilandWeibel,IgTI;KuhnetaI.,1974)and
was found to consist of an amorphous hypophase covered by a thin, strongly
83.
osmiophiliclayer.ThisagreeswiththeEMappeatanceofalveolarsurfactant(GiI
andWeibeI,1969),andthetwolininglayerswerefoundtobecontinuousatthe
transition between respiratory bronchioles and alveoli (Gil and weibel' L97I; Kuhn
et al., I97Ð-
Theexactsourceofsurfactant,bothalveolarandbronchiolar.isinsome
doubt. Niden Qgi|)suggested that it was produced by the bronchiolar Clara cells
and then phagocytosed by the alveolar type ll cells' This suggestion has qained
little support, and subsequent cytochemical and autoradiographic examination has
red Lo the concrusion that the non-ciriated bronchiorar cets, together with the
alveolartypellcells,contributetothehypophasewhilstthealveolartypellcells
alonesynthesisethetensio-activesurfacefilm(CutzandConen,IgTI;Kuhnet
a|.,I974;PetrikandColleL,Igl4;BreezeetaI.,I916;WiddicombeandPack.
I9B!;GailandLenfant,Lgas).Theremayhoweverbeabronchiolarsourceofthe
osmiophilicsurfacefilm,thatis,theoccasionallyobservedtypell-likecells
presentintherespiratorybronchiolesofmacaques'humansandSomeseals
(CasLlemanetal.,LgT5;André-Bougaranetal',1975;WelschandDrescher,lg82).
Anotherpossiblebronchiolarsourceisthatofthenon-ciliatedbronchiolarcellsin
which occasional osmiophilic lamellae f igures have been observed (Nagaishi, I972;
BreezeandWireeldon,IgTÐalthoughnofunctionhasbeenascribedtothese.
occasionat clara-like cells in the lobular bronchi of Neophoca were also found to
contain osmioPhilic lamellae'
Theperipheralairwaysofmarinemammalshavebeendemonstratedtohave
greaterstabilityLhanthoseofIerres|rialspecieswhichhasgenerallybeen
attributedtothereinforcementoftheseairwayseitherbycartilaqe,smooth
muscle, or bo|h (Scholander, 1940; Denison et al., IgTIiKerem et aI., I975i Leith'
I976;Viatthews,1977;KooymanandSinnett,IglglKooymanandCornell,IgBl).
ThisreinforcementisconsideredtoenablenearCompletealveolaremptyingin
excised lungs (Denison et al. , I97I) as was first proposed for animals drvinq to
depth (scholander, 1940) and since demonstrated in the porpoise (Ridgway et al''
84.
Ig6Ð,Theairwayreinforcementisalsoconsideredtoassistinthemaintenanceof
highexpiratoryflowrateswhichhavebeenrecordedfromtheseanimals(Kerem
etaI.,L915;Matthews,ISTTiKooymanandSinnetL,Ig7giKooymanandCorneII,
IgBl). The type ll-like cells in the terminal airways may' if they do release sur-
factant,contributetotheabilityforalveolalre-eXpansionafterdivingtodepth'
aswellasthegreaterflowproperties.However,preliminarysurfactantextraction
studiesperformedonthelungsofWeddetlsealsfoundthattheamountof
surfactant was much less than that found in terrestrial species and associated with
this was an apparent reduction in the number of alveolar type II cells present
(Boyd,Ig75).ThisisincontrasttotheobservationsofBoshierandHill(]974)and
Wetsch and Drescher (1982) who were impressed by the relative abundance of
alveolartypellcellspresentintheWeddellseal.IntheAustraliansealionthe
alveolartypellcellswerereadilyapparentandfrompreliminaryobservations
werefoundtooccupyapproximately5%ofthevolumeofthetissuecomponentof
the lung parechyma. In the rat the volume proportion of the type II cells was
nearly]0%oftheparenchymaltissuewheretheycomprised]4.57oofthetotal
parenchymal cell number (Haies et al., lgBI)' This finding' together with the
measured reduction in the parenchymal fraction of the lung and the reduced
proportion of septal tissue within the parenchyma (section 'l'I(b))' would appear
to indicate [hat there is an overall reduction in the number of alveolar type II
cells present in the Australian sea lion lung' confirmation of this will require
number and volu me of the cell types present in thedetermination of the
parenchYma. Howevert if as is indicated, there is a reduced number of type II cells
present in the alveoli, then this may well be compensated for by the type ll-like
cells in the lobular bronchi'
Thenon-microvillouscellsofthelobularbronchiweresimilartothenon-
secretory intermediate-like cells of the transition region but no indications of
differentiation such as granule formation or ciliogenesis were observed' These
cells were similar to the intermediate cells described in many species (Jeffrey and
85
Reid,I975;BreezeandWheeldon'LSTTiJeffreyandReid'L971)andthe
indifferent cells of humans (McDowell et al'' I97B) and hamsters (Becci et al''
l97B).
(ii) Muscularis: The smooth muscle bundles of the muscularis are predominantly
arrangedinaspiralfashion,andcontinuedistallytotheterminalcartilagerings
ofthelobularbronchi.Thepersistenceofprominentmusclebundlesdowntothe
terminationoftheairwaysisafeaturecommontoallmarinemammalsstudied
(Wislocki, 1935; Bélanger, 1940; Simpson and Gardner'
Kooyman, I973; Kooyman, I971 Boyd' 1973; Boshier and
Ig77;Welsch and Drescher, I9B2). However in Neophoca, as in other otariids' the
muscle bundles do not form myoelaslic sphincters or valves as they do in smaller
cetaceans (Bélanger, I94O;Kooyman' I973; Fanning' 1977)' the manatee (Wislocki'
Ig35i Bélanger, L940) and some phocids (Bélanger, I94Oi Boshier and Hill' I974i
Welsch and Drescher, IgB2). ln the Australian Sea Iion, aS in other matlne
mammals, this muscle layer continues beyond the terminal airways to form the
pillars of muscle within the walls of the alveolar ducts and sacs'
(ii¡) cartilage: The presence of cartilage down to the airway termination is a
feature unique to the lungs of Cetacea, Sirenia and otariidae (Wislocki, L9Z9;
1935;Bélanger,l-940;SimpsonandGardnet'I97?iDenisonandKooyman'I973;
Fanning, 1977). InNeophocathecartilageisfoundasirregularlyshapedplates
which form distinct rings wherever the lobular bronchus gives rise to alveolar
ducts.
I972; Denison and
Hill, 1974; Fanning'
(b) ParenchYmal subdivisions
The division of the parenchyma into lobules and acini in Neophoca is readily
apparent.SinceallintrapulmonaryalrwaysintheAustraliansealionpossess
cartilaginous support, they are all bronchi by definition (Reid, 1967). There are
also no alveolar structures arising from the walls of any airways' so no structures
equivalenttorespiratorybronchiolesarepresent,althoughsmallnumbersof
squamoUscoveredcapillariesdooccurlnthedistalregionsofthelobularbronchi.
86.
In the Australian sea lion the terminal airway divisions are: the tertiary bronchus'
with pseudostratified columnar ciliated and non-ciliated cells; and the lobular
bronchus, with cuboidal cells which are predominantly non-ciliated' The lobular
bronchus gives rise to the alveolar ducts from the terminal cartilage rings' This
arrangementdiffersmarkedlyfromthatfoundinterrestrialmammalsandsome
other marine species. In terrestrial species the terminal cartilage-containing
bronchi give rise to the non-cartilaginous bronchioles which divide for several
generations until the terminal bronchioles are reached' Each of these gives rise to
a number of respiratory bronchioles, with alveolar outpouchings in their walls'
beyond which are the alveolar ducts and sacs (Krahl' 1964; Rhodin' I974; Inselman
andMellins,lg8l).Respiratorybronchiolesarenotpresenl'nor'aswelldeveloped
insomespecies,inwhichcasetheterminalbronchiolesleaddirectlytothe
alveolar ducts (Banks, IgBl)' Phocid lungs possess the general terrestrial arrange-
ment;however,thecartilagereinforcementextendsfurtherperipherally'downto
the Ievel generally Lermed the "terminal bronchioles" (King and Harrison' I96l;
f(ooyman, 1913; Boyd, 1975; Welsch and Drescher' l9B2) although Boshier and Hill
(1974) described the cartilage support stopping before the smallest "bronchi" were
reached. Beyond this point there is general agreement that the respiratory bron-
chioles lead into the alveolar ducts' ln the cetacea and sirenia all terminal
airwayscontaincartilagesupportdowntotheleveloftherespiratorySacor
alveolar duct (wislocki, 1929; 1935; L942i Wislocki and Belanger', J'940; Simpson
andGardner,IgT2;Kooyman,I973;FanningandHarrison,IgT4;Fanning,L977).
Theterminalairwaysincetaceanshavemorerecentlybeentermedrespiratory
bronchi (Fanning and Harrison, L974) or sphincteric segments (Fanning, L977)
because of the presence of cartilage and an extensive capillary plexus' In otariids
the terminal airways which contain cartilage have also generally been referred to
as bronchioles (Simpson and Gardner, r972i Kooym an, r973i Denison and Kooyman'
Ig7Ðbutapartfromthisdifferencetheterminalairwayarrangementinthose
otherspeciesexaminedissimilartot'hatobservedinNeophoca.
87.
The partitioning of lobules and acini by distinct connective tissue septa is in
contrast to terrestrial mammals in which the presence and extent of interlobular
septaishightyvariable,andinwhichnointeracinarseptaarefound.Distinct
complete interlobular septa are present in cattle, sheep and pigs; in horses and
humans they are incomplete; and are absent in the dog, cat and monkey
(Mclaughlin et al., L96I; Tyler et al., I97I; Mariassy et al'', 1975)' The lunqs of
cetaceans contain no connective septa which divide the lungs into lobules or acini
(Fanning,L977),whilstinthelunqsofallpinnipedsexaminedtheseseptaare
particularly distinct although the definition of the lobule varies greatly (see
section 3.2.r) (Hepburn, l,gr2; Bélanger, J-940; Pizey, r954; Denison et al'' r97L;
SimpsonandGardnet,LgT2;DenisonandKooyman,IgT3lBoshierandHill,I9T4;
Boyd, 1975 Welsch and Drescher' l9B2)'
Thepresenceofsuchextensiveparenchymalseptaislikelytoaffectatleast
twoaspectsofrespiratoryfunction.Firstly,theseseptaformacontinuous
network which originates at the pleural surface and persists throughout the paren-
chymatoconnectwiththeadventitiaoftheairwaysandbloodvessels,andwith
the interstitial component of the. alveolar septa' This is Iikely to assist the re-
inflation of the alveoli during the initiat phase of inspiration and after diving to
depth. It has been demonstrated that otariids have a high expiratory flow rate and
an associated near complete emptying of the lung (Kerem et al'' L975; Matthews'
Ig77)with a great potential for alveolar collapse (Denison et al'' 197I)' This would
then require a stronq
force is exerted bY
inflationary force to reopen the alveoli' The inflationary
an increasingly negative intrathoracic pressure which is
generated by contraction of the oblique diaphragm and the inspiratory intercostal
muscles. This force could then be transmitted through the parenchyma by these
septawiththealveolarreinflationbeingassistedbytheforceoftheinspiredair
and the bronchial and alveolar surfactant' Another factor which may assist in the
eãrly reinflation of alveoli is the elasticity of the connective tissue fibres, in
particular,thecollagen.Thismayresultfromtherecoilofthesefibresafter
BB.
complession'associa|edwithalveolarcollapse,toreturnthemtotheirrelaxed
state.Ifcollagendoesinfactpossesssuchamechanicalproperty,thenthiscould
beexpectedtobeofparticularsiqnificancewhenreturningtothesurfaceafter
diving to dePth.
SecondlY, these thickened septa would prevenL collateral ventilation' In
terrestrial mammals, three pathways have been identif ied which enable collateral
ventilation;however,notallpathwayshavebeenobservedinallspecies.These
pathwaYs are:
i)theinteralveolarpolesofKohnwhichallowcommunicationbetweenindi-
vidual alveoli,
ii) the accessory bronchiole-alveolar canals described by Lambert (1955) which
allow communication between distal bronchioles and surrounding alveolar
sYstems, and
iii) the collateral ventilation which occurs between respiratory bronchioles in
dogs (vtàrtin, 1966) and through the intersegmental respiratory bronchioles
in humans (Andersen and Jespersen' l9B0)'
In the Australian sea Iion, as in other marine mammals studied, no alveolar
poresofKohnhavebeenobserved.DemonstrationofoLhercollateralpathways
requires either extensive serial sectioning (Lambert, 1955; Martin' 196Ö or resin
casting of the airways (Andersen and Jespersen, J-980)' In the present study no
resin casts were made of the airways, and in the Iimited number of serial sections
examined no channels were apparent which would indicate possible collateral
ventilabion. From examination of the pulmonary pathology (Chapter 5) it appears
unlikely that there is any collateral ventilation between adjacent lobules' although
some may occur between acini within the same lobule'
(c) Alveolar ducts and alveolar sacs
Thewallsofthealveolarductsandalveolarsacshaveasimilarstructure.
They consist of the openings of the individual alveoli together with the rings of
interstitial tissue which surround lhese openings and appear as pillars in the duct
89.
and sac walls. The pillars of the duct walls are generally thicker than those of the
sac and contain more interstitium. This interstitium is continuous with both thaL
of Lhe airway adventitia and thal of the alveolar septa, as occufs in terrestrial
mammals(Rhodin,I974;Murray'I976;WeibelandGil'L977)'
(d) Alveolar sePtum
(i) Epithetium: The type I cells which line most of Lhe alveolar septal surface and
the type II cells with their distinctive osmiophilic lamellar bodies' have a similar
appearance to those described in terrestrial mammals (Rhod\n' I974i Weibel' I91)i
Murray,I976;WeibelandGiI,IITT)andinothermarinemammals(Boshierand
Hill, 1974; Boyd, I915;Fanning' I977; Welsch and Drescher' l9B2)'
(ii) capillaries: The structure of the endothelium of the pulmonary capillaries in
theAustraliansealionisverysimilartothatinterrestrialmammals(Weibel'
I97:);Rhodin,]978).Thecytoplasmextendsoutfromtheperinuclearregionin
thin, non-f enestrated sheets which contain nU merous pinocytotic vesicles and
occasional m itochondria'
(iii) Interstitium: The connective tissue components which form the septal inter-
stitium are similar to those described in terrestrial species (Rhodin' L914; Hance
and Crysta I, I9l5;Forrest, IglÐ.The most abundant components are the collagen
andelasticfibres,togetherwithfibroblastswhicharemostlyapparentasthin
cytoplasmicprocesses.Othercellspresentinsmallnumbersaresmoothmuscle
cells, pericytes and mast cells. No interstitial cells containing contractile fibres
as described by Kapanct et al. Q974) in the septa of rats, lambs, monkeys and
humans were observed despite extensive examination of many septa'
NeophocathearrangementofthealveolarseptumpossessesfeaturesIn
common
to the
toboththeCetaceaandSirenia,thatisadoublecapillarynetwork,and
terrestrial mammals, that is a single capillary network' in temestrial
mammalsthesinglecapillaryplexusissupportedbytheseptalinterstitiuminsuch
awaythatbothsurfacesofeachcapillaryareexposedtoalveolarairatsome
poinr along the .septum (Nagaishi, I972; Weibel, I973; Rhodin' I97Ð' The
90.
connecLiVetissueofthesep|aisgenerallyarrangedsothatonesurfaceofthe
capillary endothelium is in direct contact with the alveolar epithelium, through
Lheir fused basal laminae, whilsL the opposite surface is separated from the ept-
thelium by a variable amount of interstitium (Weibel, Ig7ll. In the lungs of
cetaceansandsireniansthereisaLhickconnectivetissuecorewhichliesbetween
thecapillarynetworkoneithersurfaceoftheseptum,sothatonlyonesurfaceof
eachcapillaryisexposedtoalveolarair(Fiebeger,1916lWisIocki,I9z9;1935;
Haynes and Laurie , 1937i Wislocki and Bélanger, 1940; Bélanger, L94o; Simpson
and Gardn er, I972; Fanning and Harrison, I974i Fanning, 1917; Haldiman et aI.,
19B0).Thecapillalyallangementinphocidseal.sissimilartothatofterrestrial
mammals containing a single plexus only (SimRson and Gardner, I912; Boshier and
Hill,l974;Boyd,I975;WelschandDrescher,IgB2),whilsIinotariidsthereis
generallyconsideredtobeasinglenetwork,althoughadoublecapillarysupplyhas
beenobservedintheStellelrssealion(SimpsonandGardner'I912)andN eophoca
eoohoca may contain a single capillaryinN(Fanninq, IglÐ. The alveolar sePla
alrangement,adoublecapiliaryartangement,ortheoneseptummaycontainboth
arranqements.Nosignificantregionaldifferenceswerefoundinregardtothe
occurrence of either the single or double capillary arranqements'
ThemajordifferencebetweenthealveolarseptaoftheAustraliansealion
and terrestrial mammals is in the organization of the two networks within the
walls;thatisthecapillarynetworkandtheinterstitialnetwork.Severaltheories
havebeenproposedtodescribethealrangementofthesenetworksinterrestrial
mammals.Inoneofthese,thecapillariesaresaidtoformadensehexaqonal
network which is intertwined with the flat meshwork of the interstitial fibres, so
thatthecapillariesappeatfirstononesideoftheinterstitiumandthenonthe
other(Weibel,L963;1971;WeibeIandGiI,LgTl).Thisisincontrasttothesheet-
flow model of sobin and his colleagues (Fung and sobin' 1969; Sobin et al'' I91O;
Rosenquist et al.. Ig73). ln this model the walls of adjacent capillaries are
separatedbypillarsofconnecLiveLissuetocreateanextensive,essentiallyflat
9r.
space through which a 'rsheet" of blood flows' Ryan Q961; I973)' from work with
thehamsterlung,hassuggestedthattherearetwoseparatecapillarynetworks
isolated from each other by a central core of connective tissue with occasional
anastomosingbranchestoconnectthetwonetworks.Thisisinagreementwith
observations of [he lungs of neonatal mammals (Burr\' L974)' but is not generally
considered to be the case in adult terrestrial mammals' Although' similar observa-
tionshavebeenmadeinthelungsofSomereptileswhichhavebeentermed
,,pseudo-single,, capillary network (Perry , I9B3). More recently Rosenquist (I981)
hasshownihecollagencontentofthehumanalveolarwalltobearrangedpartly
as described by Ryan Q969; I97J) and parLly as described by the sheet-f low model
(Funq and Sobin, L969; Sobin et al'' I97O Rosenquist et al'' f973)'
InNeophocathealveolarseptahavesimilaritiestoeachofthesedes-
criptions.WhereLhereisasinglecapillarynetworktheseptalwallappearssimilar
to Weibel's description (1971), in which the capillary crosses the midline of the
septumtoexposethe,,thin,,portionoftheair-bloodbarriertothealveolarlumen
ononesideoftheseptumandthentothealveolarlumenontheotherside.often
where there is a single capillary network the capillary occupies a major portion of
the septal waII with only smaII areas of ,,thick,,connective tissue Space scattered
oneithersideofthecapillary.AlsopresentarealeaSofconnectivetissue
betweencontiguouscapillarieswhichapproximatetherrpostS||ofthesheet-flow
model.
In lhose areas of a double capillary arrangement each network of capillaries
lies on either side of a well developed central core of interstitium' capillaries are
occasionallyfoundwhichclossthiscentralcoreandSoarecapableofqas
exchangeonbothsurfaces.ThisarrangementissimilartothedescriptionofRyan
(1969;IgT,andcorrespondstothereptilian',pseudo-single''arlangementdes-
cribed by Perry (I98l). However, in the Australian sea Iion the capillary network
whichlineseachsurfaceoftheseptumis,forthemostpart,complete'sothat
therearefewareasof,,thick'|interstitiumexposedtothealveolarlumen.
network tYPes,
California sea
92.
lnpreliminaryobservationsofotherotariidspecies,amixtureofcapilìary
as in Ne oohoc a. was found in the Steller's sea lion and the
Australian fur seal and theIion, and to a lesser extent in the
Northern fur seal (Nicholson and Fanning' unpublished observations)' This apparent
increase in specialization of the lung parallels the evolutionary appearance of
these species. The two earliest otariid groups, Arctocephalus and the diverqent
Uallorhinus, are first separately identifiable from about six million years ago and
together show the least amount of double capillary plexus. The other extant
speciesexamined,evolvedfromabranchoftheArctocePhaluslineabouttwoto
three million years ago (Repenning and Tedford, 1977; Repenning et al'' 1979)'
Thesespeciesshowagreaterproportionofdoublecapillarynetworkintheir
alveolarsepta.Thismaywellrepresentaformofconvergentevolutiontoward
thatofthecetaceansofwhichtheearliestextantformsevolvedsometwenty
millionyearsago(Gaskin,19B2).However,somelowervertebratessuchasthe
lungfish,amphibiansandSomereptilesalsopossessadoublecapillaryplexus
within |heir alveolar septa (Hughes and Weibe|, I976 Hughes, I91B; Perry, l9B])
as do late foetal and neonatal terrestrial mammals (Krahl' 1964; Burri' 1974)' It
hasbeensuggested(Fanning,Ig77)thatthePresenceofthedoublecapillary
plexusincetaceansrepresentsapersistenceofthemammalianfoetalpattern.To
determine whether Lhis is to some degree the case in otariids will require exami-
nation of both foetal and neonatal lungs, material which is presently not available'
].6 SUMMARY
ThelungsoftheAustraliansealionpossessseveralstructuralfeatureswhich
differ from those of terrestrial mammals' These include a generalized reinforce-
ment of both the lower airways and the parenchyma. The airways are reinforced
bycartilageplatesandsmoothmusclebundlesdowntotheirtermination.These
lobular bronchi are lined by a simple columnar and cuboidal epithelium whose cells
aregenerallysimilartothosefoundinthelowerairwaysofterrestrialspecies.
93.
The parenchyma is reinforced by an increased connective tissue component
which forms pronounced interlobular and interacinar septa' Each pulmonary lobule
is supplied by a lobular bronchus and contains a number of distinct acini' This
connective tissue thickening also occurs within the alveolar septa so that these
septa carry a typical single capitlary network, a "pseudo-si¡gle" capillary network'
or a double caPillarY network'
These structural modifications permit the high expiratory flow rates
exhibited by these animals, and assist in the reinflation of the nearly completely
collapsed alveoli as occurs at end-expiration and after divinq to depth'
i
I
I
94.
ChaPter 4
LUNG MORPHOMETRY
4.I INTRODUCTION
Stereologyisthatbodyofmathematicalmethodswhichenablesthethree-
dimensional interpretation of structures from examination of two-dimensional
images of these structures. The application of stereological principles to quanti-
tate structures is the realm
I9B0). The develoPment of
of morphometry (Weibel, I979a; EIias and Hyde'
methods for the morphometric estimation of lung
structural parameters has progressed rapidly in the twenty years since the first
extensive examinations by weibel and Gomez G962) and weibet (1961)' In this
periodtheprinciplesandapplicationsoflungmorphometryhaveexpandedtothe
pointwheretherespiratoryorgansofmanyanimalspecies.bothmammalianand
non-mammalian, have been studied under normal and various experimental con-
ditions.
The structural features of lungs that have most often been morphometrically
estimated are those which contribute to the calculation of the structural pul-
monary diffusing capacity of the lung for oxyqen' O'O, (Weibel' 1970a)' The
pulmonarydiffusingcapacityisameasureofthelung'sconductanceforoxygen
fromalveolarairtocapillaryblood.Thiscanbeexpressedbytheequation'
oro, = i grle gor-Fóo, (Bohr' r9o9 weibel' 1970a)
where V.. is the flow of O2 from air to blood by molecular diffusionv2
tOO, is the 02 tension of alveolar air' and
Þ"O, is the mean alveolar capillary blood 02 tension'
Thestructuralpulmonarymodelfromwhichmorphometricparametersaredeter-
mined and the procedures undertaken have been described by weibel (1963'' I97Oa'
I979a)andWeibelandKnightf]964).Thestructuralfeatureswhichneedtobe
quantified for calculation of lhe pulmonary diffusing capacity are the areas of the
diffusing surfaces, that is, the alveolar epithelial surface exposed Lo the air and
95.
the alveolar capillary surface, the thickness of the diffusing barriers, particularly
that of the tissue which forms the air-blood barrier and the plasma barlier
betweentheendotheliumandtheerythrocytes;andthevolumeofthealveolar
capi Ilaries.
AllorsomeofthesefeatureshavebeenstudiedinLhenormallunqsofa
varietyofmammalianspecies.Theseincludeavarietyofspeciesofshrews'
including the smallest mammal, the Etruscan shrew (Gehr et al'' l9B0; weibel et
aI., l9B0); the mouse (Geelhaar and Weibe|, I97I; Hugonnaud et al., ]-977); the
Epauleted fruit bat (Maina et al., I9B2); the syrian golden hamster (Kennedy et
a!., ]978); the rat (Burri and Weibel, I97la,b; Burri et aÌ.,I974; Crapo et al.,
L97ka,b;Gehretal.'IgTBb,BurriandSehovic,IgTg;PinkertonetaI.,]-982);the
dog(Siegwartetal.,IgTIiGehrandWeibel,IgT4;Gehretal.,l9Bla;Berendsen
tgBZ); the pigtail macaque (Boatman et al'' L979); the horse
Tyler, L9671 Gehr and Erni, J-980; Gallivan' l9B1b); a ranqe of
and viverrids (Gehr et al', fg8lb); and the human (Weibel and
and De Fouwt
(GillesPie and
African bovids
Gomez,I962;Weibel,)'963;Dunnill,1964;Thurlbeck,1967iHasleton,I9l2;Weibel
et al., I975i Gehr et al', 1978a)'
The results of these studies present a wide range in the values of the mor-
phometricparameterswhichisareflectionofthewiderangeinthebodysizeof
bhose species studied. Thus for the Etruscan shrew with a body weight of only
2.5 g through to the horse with a body weight of Some 500 kg, the lung volume
rangesfromabout0.]mlupto]TL.Similarlythestructuraldiffusingcapacity
for oxygen ranges from 0.00018 ml O2.sec-l.mbar-l for the shrew up to 34'080 ml
O2.sec-f.mbar-l for the horse (Gehr et al., IgBlb)' Not all morphometric para-
meters increase so dramaticatly with this increase in body size' The harmonic
mean thickness of the tissue barrier only increases from 0.27 um in the shrew up
to0.60uminthehorse(GehretaI.,IgBIb).Thisreflectsthebasicneedofall
animalstomaintainaneffectivebarrierofminimalthicknesstoallowo2
d if f usion.
96
Guantitationoftheapparentproportionalityofmorphometricparametersto
bodysizehasbeenachievedbythedeterminationofallometricreqression
equations.Thiswasfirstattemptedforawiderangeofmammalianspeciesby
TenneyandRemmers(196]).Theyfoundthatlungvolumewasnearlylinearly
proportionaltobodyweightandthatthealveolarsurfacearearelaLedtothe
wholebodyoxygenConsumptioninasimilarfashion.Sincethattimeanumberof
studies have established allometric relationships for various morphometric para-
melers, both between different species (Stahl, 1967i Weibel' Igl2'' 1913; Weibel
andGiI,IgTTiLechner,IgTB;WeibeI,I9796;GehretaI.,l9Blb;Heusner,l9B])
and between animals of the one species with different body weights (siegwart et
aI.rI97I;Gehretal',198la;Weibeletal''IgBÐ'Theconclusionfromthese
variousstudiesrvasthaLmostofthemorphometricparametersofthelungscale
about linearlY with bodY weight'
Thisinterestinmorphometrystemsfromitsabilitytodescribestructural
featuresofthelungintermsoflungfunction.Hencethestructuraldiffusing
capacityofthelungforoxygen'DLo',canbecomparedtothephysiologically
determinedoxygenconsumption'UOr'thesameanimals'oranimalsofthe
Samespecies(Weibel,L972,1973;WeibelandGiI,ISTT;Lechner,I91B;Gehret
al.,l-980;WeibeletaI.,19B]).Comparisonoftheresultsfromthesetwomethods
indicates that the morphometric diff using capaqity exceeds the physiologic oxygen
consumption.Thisdiscrepancyarisesbecausethemorphometricmethodmeasures
themaximumpossiblediffusingcapacity,asthemodelassumesthatallregionsof
the lung are venLilated and perfused maximally at the one point in time (weibel'
I91Ð. Despite this discrepancy' morphometry IS presentlY the mostI97Oa,
suitable methodavailabletogainquantitativefunctionalinformationfrompul-
monarY structure'
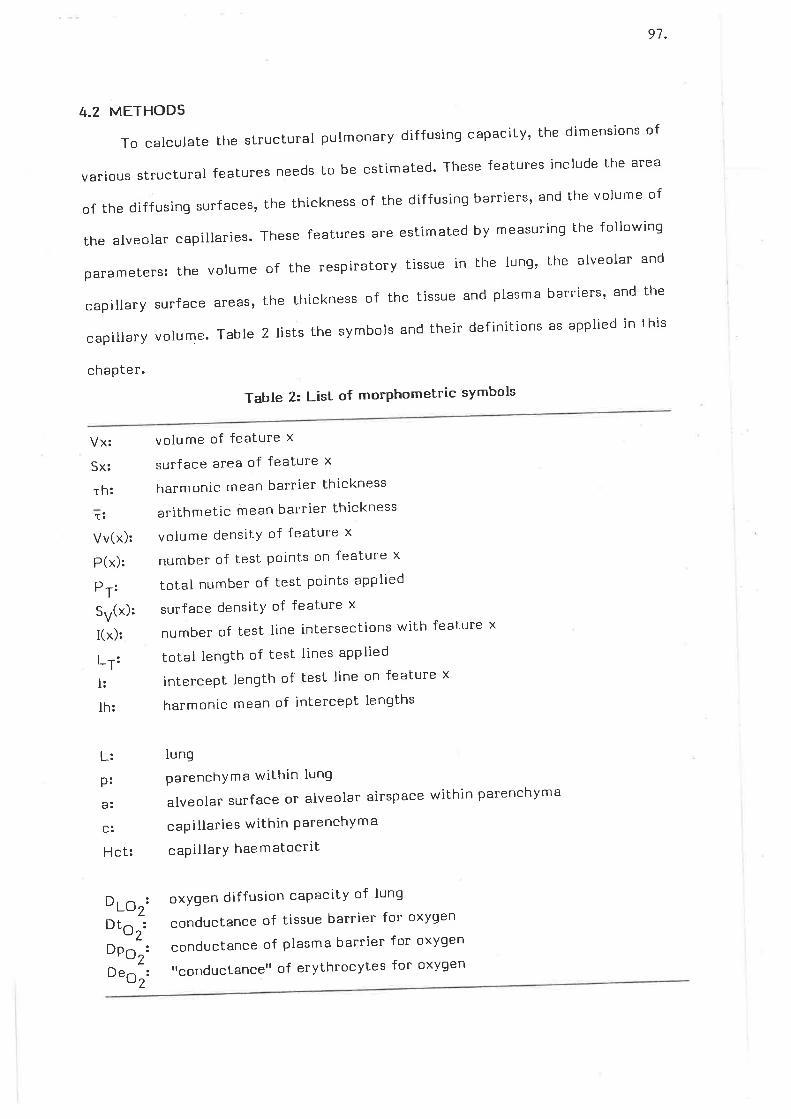
97.
4.2 METHODS
Tocalculatethestructuralpulmonarydiffusingcapacity,thedimensionsof
various structural features needs Lo be estimated' These features include lhe area
of the diffusing surfaces, the thickness of the diffusing barriers' and the volume of
the alveolar capillaries. These features are estimated by measuring the following
parameters: the volume of the respiratory tissue in t'he lung' the alveolar and
capillarysurfaceareas'thethicknessofthetissueandplasmabarriers,andthe
capillary volume. Table 2lists the symbols and their definitions as applied in this
chapter.
Table 2: List of morphometric symbols
Vx:
Sx:
th:
T:
volume of feature x
surface area of feature x
harmonic mean barrier thickness
arithmetic mean barrier thickness
volume densitY of feature x
number of test Points on feature x
total number of test points applied
surface densitY of feature x
number of test line intersections with feature x
total length of test lines aPPlied
intercept length of test line on feature x
harmonic mean of intercept lengths
lung
parenchYma within lung
alveolar surface or alveolar airspace within parenchyma
capillaries within ParenchYm a
capillarY haematocrit
oxygen diffusion caPacitY of lung
conductance of tissue barrier for oxyqen
conductance of plasma barrier for oxygen
rrconductancett of erythrocytes for oxygen
Vv(x):
P(x):
PrtSy(x):
I(x):
LrtI:
lh:
L:
p:
Hct:
otortPto2:
OpO2
o"o,
9B
4.2.I Basic Principtes of Point Counting
(a) Volume densitY
The relative volume densities of lung components were estimated by point
counting of thin sections. Each section examined was covered by a test grid of
linesandpointsandthenumberofpointslandingonthatfeaturewerecounted.
The volume density of that feature, Vy(x), was determined by the equation:
Vy(x) = P(x)/PT (Weibel' L979a)
where p(x) is the number of poinls tanding on feature x
PT is the total number of test points counted'
(b) Surface densitY
The relative surface area, or surface density, of a feature was estimated by
counting the number of intersections of the surface of the feature with a series of
test lines of known length. The surface density, Sy(x), was then calculated using
the equation:
sy(x) = 2.I(x)/L1 (weibel', r979a)
wherel(x)isthenumberofintersectionsoftestlineswiththesurfaceofthe feature x
LT is the total length of the test lines'
(c) Harmonic mean bamier thickness
Alsonecessarytothedeterminationofthelunglsconductanceforoxygenis
the harmonic mean barrier thickness (¡h), which is proportional to the diffusion
resistance of the membrane (weibel and Knight, 1964)' This was estimated by the
equation:
rh = 213 . lt-t (Weibel and Knight ' 1964)
wherelhistheharmonicmeanofatlinterceptlengthsofthetestlines.
4.2.2 SamPling Design
Amulti-levelsamplingdesign,withfourlevelsofincreasingmaqnification
was used, as described by weibel 9l-4. (19BIa)' Stratified sampling (Gehr et al''
1978a)waSalsoapptiedtodetermineifanyregionaldifferencesexistedas
99
described for the dog lung (Glazier et al., 1967; Gehr and weibel, I97Ð and the
horse lung (Gehr and Erni, l9B0). An outline of the sampling design is presented in
Fiq.B0.Throughoutthisdescriptionofthesamplingtechniquestheterm
parenchyma refers to: the alveolar septa, air in the aveoli and alveolar sacs' and
the respiratory surface lining the abundant interacinar and interlobular septa' The
remaining features, which constitute the non-parenchyma include: the airways'
the blood vessels larger than capillaries, the core of thicker connective tissue
septa, and the Pleura.
At level I the volume density of "coarse" parenchyma'
parenchymalstructureslargerthan].mminthelungwereestimated.Atlevelll
the volume density of "fine" non-parenchymal structures, less than I mm' in the
,,coarse" parenchyma wele estimated' Levet III was for the estimation of the
volume density of respiratory surface within the "fine" parenchyma' At level IV
the parameters of features within the alveolar septa were estimated (weibel et
al., l98la).
Level I(a)
TheleftlungofeachanimalwasdividedintothreestrataasusedbyGehret
at. (1978a) for examination of the human lung' The strata consisted of an approxt-
mately I cm thick slice taken from the apical, middle and basal regions of each
and ttcoarset' non-
microtome knife. The first slice was
lung (Fiq. B0).
The lungs were sliced with a J5 cm
taken by cutting off, approximately, the first one-third of the lung' The bulk of
thelungwasthenplacedcutsurfacedownonapelspexcuttingboardwithlcm
high borders along which the knife was moved to cut the slice' A similar technique
was used for each subsequent slice'
Both surfaces of each lung slice were photographed, enlarged to twice life-
size,andprinted.Theprintsfromoneanimalwereinitiallyexaminedonalight
box with a weibel multi-purpose test system transparent overlay with lines 22 mm
in length (weibel et al., Lg66).This led to the finding that very few points fell on
Figure 80. Diaqram outlining four-level morphometric sampling design
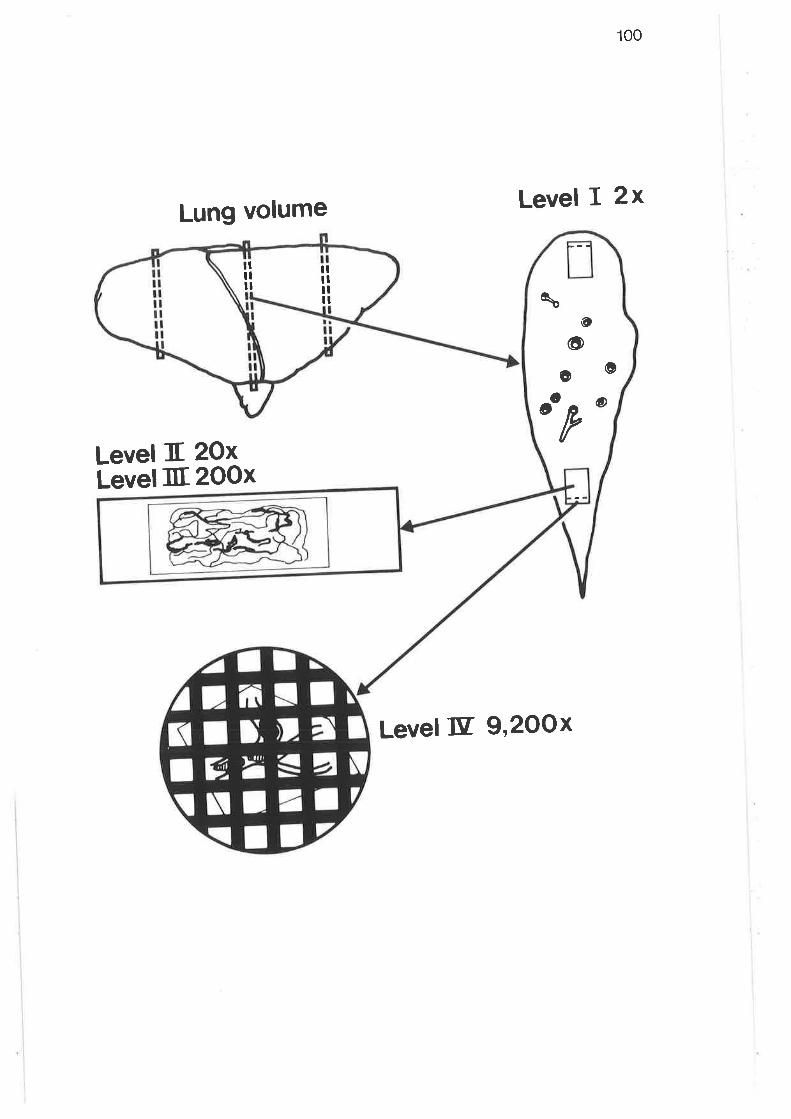
100
Level I 2xLung volume
Level It 2OxLevel Itr 2OOx
ililil
llililil \
oGD
oorP o
Level trt 9,2OOx
the test area, so a f-cm squate labtice grid overlay was also used. The po
intersections of the horizontal and vertical lines, were counted to dete
whether they fell on parenchyma, or non-parenchymal structures larger than I mm
life -s i ze.
To record the number of points on each feature a ten channel electronic
counter in two rows of five, with summation for each row, was used (designed and
built by Adelaide university Medical school workshop). The total number of points
Ianding on any one lung slice was determined by the size of the slice, so that the
total number of points varied between slices'
The results for the two grid systems were compared by estimating the range
for the true volume density, using the equation'
Vyt aVy=Pp* PP . (l-PP) (Exner, I976)
whereVVisthevolumedensityofthefeatureofinterest'
A VV is the estimated range of the volume density'
PPisthevolumefractionofthefeatureofinterest,and
PT is the total number of test points counted'
The I cm-square lattice grid proved to be more precise and was subsequently used
for all animals.
(b) Level II
From each lung slice used in level I two blocks of tissue, approximately 2.5 x
1.5 x 1.0 cm, were selected; one from the dorsal end of the slice and one from the
ventral end (Fig. B0) (Gehr et al., 1978a). Each block was embedded in paraffin
wax from which a 2 um section was cut, stained with H & E, and examined at 20x
magnification. The procedure undertaken was to mount each section into a Durst
L1000 Photographic enlarger with point light source and 55 mm lens' The enlarged
image was projected on to a test grid of points. The number of points falling on
non-parenchymal structures less than l- mm diameter, were counted, as were
points falling on parenchymal features. The parenchymal features counted were:
the alveolar septa, the alveolar airspace, the duct airspace, the intersaccular'
interacinar and interlobular connective tissue septa.
PT
102.
Three grid systems wefe tested on one set of slides from one animal and the
ranges for the true volume densities estimated. The most efficient test system
was subsequently used for all five animals. The term efficient as employed, con-
siders not only which grid resulted in the greatest precision, but also takes into
consideration the time taken to perform each series of counts (Mathieu et al''
19Bl). The three grid systems used were:
i) a f cm-square lattice'
ii) a Weibel multi-purpose test system with lines of 1l mm lenqth, and
iii)aWeibelmulti.purposetestsystemwithlinesof22mmlength.
The totat number of points per section was determined by the test system
used and the area of each section, so that the total number of points counted
varied between each section.
The weibel multi-purpose test system with lines of ll mm proved to be the
most efficient, in the trial procedure, and was used for the other four animals'
(c) Level III
The z pm sections used in level II were examined by light microscopy with a
Wild M50l Sampting Microscope (Wild Heerbrugg, Switzerland; courtesy of the
Department of Anatomy and Histology, Adetaide university)' Attached to the
microscope was a ground-glass viewing screen on the surface of which was placed
a 42 point weibel multi-purpose test sysLem, with lines lB mm in lenqth' Points
falling on single alveolar septa, double alveolar septa, intersaccular septa, the
epitheliunrespiratory ¡i-'*"änd the core of larger septa, and non-parenchyma were
counted.
In morphometric studies of terrestrial mammals all connective tissue septa
have been included in the non-parenchyma (weibel et al', lg8la)' The reason for
this is that in most terrestrial species there are few connective tissue septa
present "nd
,nyg"s-exchange tissuerhey
may carry would be insignificant when
volume of epitheliumcompared to the ;"t-"h;teitator!'- A-.ln the Australian sea lion lunq there are
a large number of interacinar and interlobular septa which form an integral part
t0l.
of the alveolar structure. In section each surface of these septa is Iined by res-
piratory epithelium and capillaries which contribute to the total respiratory tissue
within Lhe parenchyma. At levels I and II many of these thicker septa had been
includedwiththeparenchyma.Thiswasbecausetheresolutionattheselevelswasepithel iun
insufficient to determine whether a point landed on the respirator/ A or the
connective tissue of the septa' For this reason it was considered necessary to
include these structures at level III'
Todeterminethemostsuitablemagnificationandthemostefficientnumber
of fields to be eXamined, a trial series of counts was undertaken using one section.
This was examined at three levels of screen magnification' 60x' l20x' and 240x'
ThewholeIissueareaofthissectionwassampledbyconsecutivefieldsofviewat
each magnification level and the results for each successive ten fields summated'
Thevolumedensitiesforthefeaturescountedweredeterminedforeach
groupoftenfields,andthentheprogressivemeanforthetotalnumberoffields
was calculated and plotted on a graph. plotted on the graph were the t 570 limits
of the final value for each feature, except for the volume density of the paren-
chymal airspace where + 1% limits were used'
ThegraphsforallfeaturesweÎeexaminedtodeterminethenumberoffields
where the values consistently fell within the plotted limits' From these trial
countsitwasconcludedthatthemostefficientmethodwouldbethecountingof
seventyfieldsfromeachsectionexamined,atthemagnificationof24ox.
However, prior to the final counting being undertaken the eyepiece lens of the
microscopewaschangedfrom6xtolOx,duetoatechnicalproblem.Asaresultof
thischangeamagnificationof240xwasnolongerpossiblesothatthenearest
magnification of 200x was used with a subsequent increase in the number of fields
persectiontoeighty.lnthiswayatotalof3,36opointswasappliedtoeach
section.
Each section was systematically sampled (Weibel, 1970b) to cover the com-
plete section with each field separated by a distance of approximately r'75 mm'
t04.
Any field in which more than half the points landed on non-parenchyma was
excluded, as these were included in level II above (weibel et al.' lg8la)' and the
section moved to the next field'
(d) Level IV
Fromthemedialaspectofeachblockselectedforlevelllasmallslicewas
taken for EM examination. This tissue was diced into l-l mml pieees and
processedasdescribedpreviously(Section2.5.2).Ultra-thinsectionsfromone
randomlyselectedblockfromeachofthesixregionsofeachlungweremounLed
on 200-mesh cu/Rd grids, stained with 50% ethanolic uranyl acetate and Reynolds
lead citrate, and examined in a Phillips EM 100 electron microscope' All micro-
graphs were taken at approximately 1'400x magnification'
(i) subsampling method: To determine the most suitable method for subsampling
of sections a trial was conducted using one section from each of the six regions
fromanimalAs .Twomethodsofsubsamplingwerecompared,one,aligned
systematic quadrat (sa) (weibel et al., 1966) and the oLher' a form of systematic
quadrat samPling with
Müller et al., 19Bl).
area-weighting (SAWG) (Cruz-Orive and Weibel' 1981;
Inthealignedsystematicquadratsubsamplingmethodthegridsquereinthe
UpperleftsideofthesectionistranslatedtothecentreoftheEMscreen.The
image was then translated so that the upper Ieft hand corner of that qrid square
would be included in the micrograph. The exact position of the image was deter-
mined by aligning the grid bars at the top and the left of that grid square with the
topleftandbottomleftortoprightmicrographareamarkerlinesetchedintothe
EM screen (see Fig' 6, Weibel et al'' 1966)'
Thesectionimagewasthentranslatedtothenextfifteenconsecutivegrid
squares and the upper left hand corner of each grid square aligned as described'
The sixteen grid squares were arranged in a 4 x 4 pattern (see Fig' 6a' Cruz-orive
and weibel, lg8l). If there was no tissue in the sampled area' no micrograph was
taken bu[ this was noted. In this way a maximum of sixteen micrographs were
r.05.
possible for each sec[ion with the actual number varyinq, in this trial, from eight
to thirteen.
Theunaliqnedsystematicquadratsamplingwithtissue.weightinq(STWa)
was devised to approximate the systematic area-weighted quadrat (sAwa) system
described by cruz-orive and weibel (I9Bl) and Mütler et al' (l98l)' The sAwG
systemwasdesignedtoincludeasmuchofthereferencephase'thealveolar
septa,aspossibleineachrandomelectronmicrograph.TheSTWGsystemwas
similar to that for sG subsampling; however, when septum was present in the grid
squalecornertheimagewasrealignedtoincludeasmuchaspossibleoftheseptal
tissue within the area of the micrograph. corners of grid squares which contained
notissuewereignored.Afixednumberofeightmicrographswastakenofeach
section, and if insufficient material was found in the upper Ieft hand corners then
a similar sampling procedUle waS applied in turn to the Iower right, Iower left, and
ifnecessaryUpperrighthandcolnersofthegridsquares.Thismodificationtothe
sAWG subsampling system was necessary as the facilities available did not allow
fortheappropriatealterationstotheEMscfeenasdescribedbyMüIIergt-e!.
(1981). Figures 68 to75 represent an sTWG sample from one region of animal AS4'
Themicrographsfromthetwosubsamplingmethodswerecontactprintedon
strips of 70 mm wide ortho s Litho film (Du Pont) together with the "waffle"
calibration grid, of 2,4OO lines/mm (Ladd), which was photographed at the end of
each recording session on the electron microscope. The strips of positive imaqes
were examined with a projection unit (weibel et al'' 1966) at a final magnification
ofapproximatetyg,200x.MountedontheScreenoftheprojectionunitwasa
Weibelmulti-purposetestsystemof84lines22mminlengthwhichwasusedto
determine the volumes and surface areas of the structures within the alveolar
septa.
UsingtheresultsfromthesetwoproceduresthevaluesforVc,saandSc
were calculated from the whole lung using two methods:
r06.
t)
IU
Lwo-level sampling using level I values for parenchymal volume, and the
resultsfromsQsubsamplingofelectronmicrographsasthesecondleve];
four-level sampling using the results from the sTWG subsampling at level
four.
lr4ethod two resulted in the Ieast standard error and was subsequently used to
examine all sections.
(ii) Harmonic mean barrier thickness: For estimation of the harmonlc mean
bamier thickness of the tissue (tþt) and plasma (thp) an appropriate logarithmic
scale had to be devised. To do this a total of eight micrographs from four sections
ofanimalAs4wereanalysedwiththeprojectionunitmountedwitha2cm-square
lattice grid (weibel, 1970a). The intercepts measured for the tissue thickness were
from where the lines of the grid, in either the vertical or horizontal direction'
overlaid the airspace surface of the epithelium through to the Iumenal surface of
the endothelium. For the plasma thickness, the intercept measured was from the
surface of an erythrocyte to the lumenal endothelial surface (see Fig' 5, Weibel'
1970a).Inthosecasesofadoublecapillarynetworkintheseptum,onlytheplasma
thickness toward the thin part of the septum was measured'
From these micrograpl'ts 2J6 measufements, in millimetrest wele made of
the tissue and plasma thicknesses using a pair of dial calipers marked in 0'05 mm
d iv isions.
The reciProcals of these measurements were calculated (1/l) as were the
logarithms of the reciprocals (log l/t). The logarithmic reciprocal values ranged
from -2.00 for the greatest thickness, to +1.00 for the smallest' The log Ul values
were plotted on graph paper at 0.02 unit intervals to indicate the distribution of
values. The log l/l values were classed into intervals of 0'1 units which gave 2)
evenly-sized classes and two slightly larger end classes to accommodate the few
extreme values in either direction. To decrease the number of classes the log 1/l
values were regrouped into scales with intervals of 0'15 units and 0'25 units'
forming seventeen and eleven classes respectively' The classes at either end were
again slightlY larger.
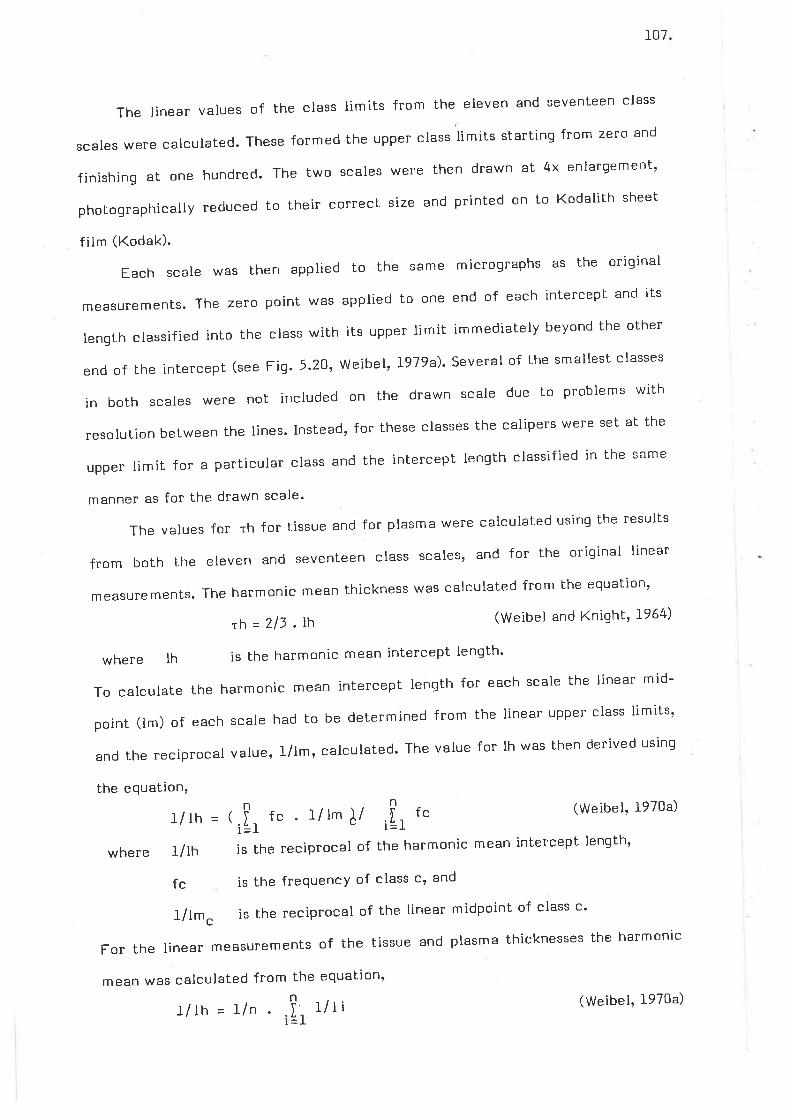
107
The linear values of the class limits from the eleven and seventeen class
scales were calculated. These formed the upper class limits starting from zero and
finishingatonehundred.Thetwoscaleswerethendrawnat4xenlargement,
photographicallyreducedtotheircorrectsizeandprintedontoKodalithsheet
film (Kodak).
Each scale was then applied to the same micrograPhs as the original
measurements.Thezeropointwasappliedtooneendofeachinterceptandits
Iength classified into the class with its upper limit immediately beyond the other
end of the intercept (see lig.5.2O, Weibel, I979a)' Several of the smallest classes
in both scales were not included on the drawn scale due to problems with
resolution between the lines. Instead, for these classes the calipels were set at the
Upperlimitforaparticularclassandtheinterceptlengthclassifiedinthesame
manner as for the drawn scale'
The values for th for tissue and for plasma were calculated using the results
from both the eleven and seventeen class scales, and for the original linear
measurements. The harmonic mean thickness was calculated from the equation'
rh = Zl3 . lh (Weibet and Knight ' 1964)
is the harmonic mean intercept length'
To calculate the harmonic mean intercept tength for each scale the linear mid-
point (tm) of each scale had to be determined from the linear uppel class Iimits'
and the reciprocal value, J./lm, calculated. The value for Ih was then derived usinq
the equation'
t/ th = , ,[, t" . 1/ Im ]/ ,[,
t" (weibel' ]e70a)
where]/Ihisthereciprocaloftheharmonicmeaninterceptlength,
fc is the frequencY of class c' and
l/lmc is the reciprocal of the linear midpoint of class c'
For the linear measurements of the tissue and plasma thicknesses the harmonic
mean was calculated from the equation'
1/¡¡=l/n î. Llli (weibel'l97oa)I =-L
where Ih
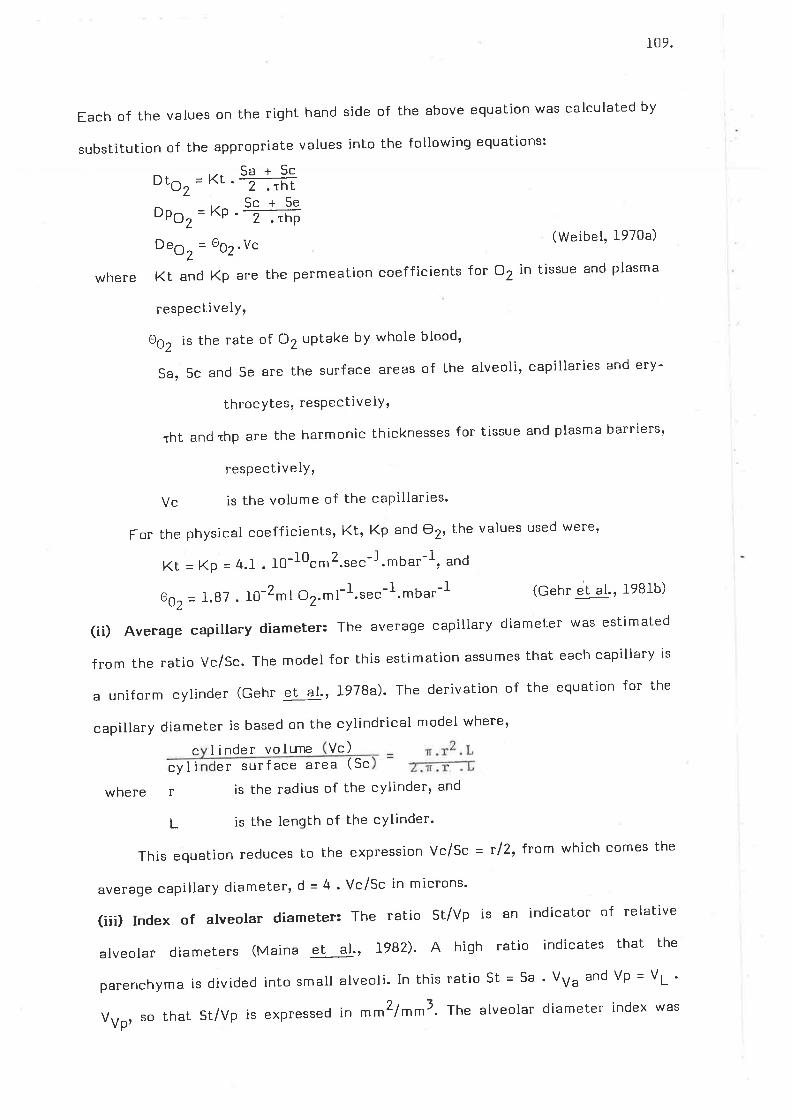
109.
Each of the values on the right hand side of the above equa[ion was calculated by
substitution of the appropriate values into the following equations:
oro, = Kt. -j#Sc+SeoPo2-KP'-T-=ñ
Den^ = o6r.Vc (Weibel' l97oa)
-/-KtandKparethepermeationcoefficientsfor02intissueandplasmawhere
resPectivelY'
Og, is the rate of O2 uptake by whole blood,
Sa,5c and Se are the surface areaS of the alveoli, capillaries and ery-
throcytes, resPectivelY,
rht and thp are the harmonic thicknesses for tissue and plasma barriers'
respectivelY,
Vc is the volume of the capillaries'
For the physical coefficients' Kt, Kp and O2, the values used were'
Kt = Kp = 4.I .l0-I0cmZ'sec-f'tbar-f, and
oo2= 1.87 . l0-2mt 02.rl-1.r""-1.mbar-I (Gehr "t "1., l98lb)
(ii) Average capillary diameter: The average capillary diameter was estimated
from the ratio Vc/Sc. The model for this estimation assumes that each capillary is
a uniform cylinder (Gehr et al., 1978a). The derivation of the equation for the
capillarydiameterisbasedonthecylindricalmodelwhere'c I inder vol uîe Vc)
er surface area (sc
where is the radius of the cYIinder, and
is the length of the cYIinder.
This equation reduces lo the expression Vc/Sc - tl2, from which comes the
average capillary diameter, d = 4 ' Vc/Sc in microns'
(iii) Index of alveolar diameter: The ratio St/Vp is an indicator of relative
alveolar diameters (Maina et al., IgB2). A hiqh ratio indicates that the
parenchyma is divided into small alveoli. In this ratio st = 5a ' Vy" and Vp = V¡ '
VVp, ro that St/Vp is expressed in rn*2/rntl. The alveolar diameter index was
cyliT
L
11"0.
estimated for the Australian sea lion, together with those for several other
species for comParison.
4.2.7 Animal and Regional Differences
To test for differences between the five animals, and between the six
sampling sites, the results for levels I, II and III, together with the results for the
capillary volume density and the alveolar and capillary surface densities from
Ievel IV were analysed using nested analysis of variance, the HSD ANOVA II
package (Madigan and Lawrence, l9B2) (courtesy of L' Richards, personal com-
m unicatioh).
Regional differences in the absolute values of various morphometric para-
meters were tested for using a t-test by paired comparison (sokal and Rohlf, 1969)
based on the difference between the dorsal and ventral, or anterior and posterior'
values for each Parameter'
For those morphometric parameters in which the calculation of the absolute
value required the lung volume, which is related to body size, only the results for
animalsAsLJr24r25and26wereconsideredforinvestigationofregional
differences (Section 4.4'2(a))' These parameters included Sa' Sc' Vc' Vc/Sa' the
estimated capillary diameLer, the alveolar-diameter index, and otor'Those
parameters whose regional differences were compared between the five animals
werethearithmeticandharmonicmeanbarrierthicknessesofthetissueandthe
plasma, and the haematocrit. Also tested were the results for the proportion of
double capillary septa estimated at Ievel III'
4.2.4 IntersPecies ComParison
The results for the Australian sea lion population were compared to results
from other studies on terrestrial mammals' In the comparisons between species
only the results from four of the sea lions were used to establish a species mean'
This was due to the fact that no weight was measured for animal AS4 due to
transport problems encountered during the first field trip' Most methods of
species comparison ate done on a body weight basis and for this reason the results
from animal A54 were excluded'
tll.
Allometric regression equations have been used to quantify interspectes
comparisons of morphometric data. Gehr et al' (r98lb) have presented allomelric
regressions for several morphometric parameters from a wide range of terrestrial
mammalian species, their'rextended" population' The data from the present study
wereplottedonlog-toggraphsdrawntoshowtheregressionlinebasedonthe
allometric regression equations presented by Gehr g!--g!. (198tb)' This enabled
visualappraisalofthedifferencesbetweenthesealionsandtheterrestrial
species studied. To test for any significant differences between the sea lions and
terrestrialspeciesthepredictedvalueforeachmorphometricparameterwas
calculatedbysubstitutingtheweightofeachSealionintotheappropriate
allometric equation. A t-test for paired comparisons (sokal and Rohlf' 1969) was
then used to test for any significant difference between the predicted values and
the measured values for each morphometric parameter'
Discussion of the methods (Section 4'4'I) is presented after the results'
4.' RESULTS
4.5.1 SPecies Results
(a) Level I volume densities
TheresultsforlevellarepresentedinTable].Themeanvalueforthefive
animals indicated that about z3o/o of the lung was "coarse" non-parenchyma and
77Vo was I'coarse'r ParenchYma'
(b) Levet II volume densities
TheresultsforlevelllarealsoshowninTableJ.Forthepopulationabout
7Vo of rrcoarse" parenchyma was in fact non-parenchyma with about 93o/o'rfine'
parenchYma.
Thetotalvolumedensityoftheparenchymainthelung,Vv(p2,¡)isgivenbY
the equation, Vv(p2,¡) = Vv(Pl,¡) ' Vv(p2'p1)' The results for this are shown in
Tabte].Thepopulationmeanforthetrueparenchymalvolumedensityinthelung
was 7I.5%.
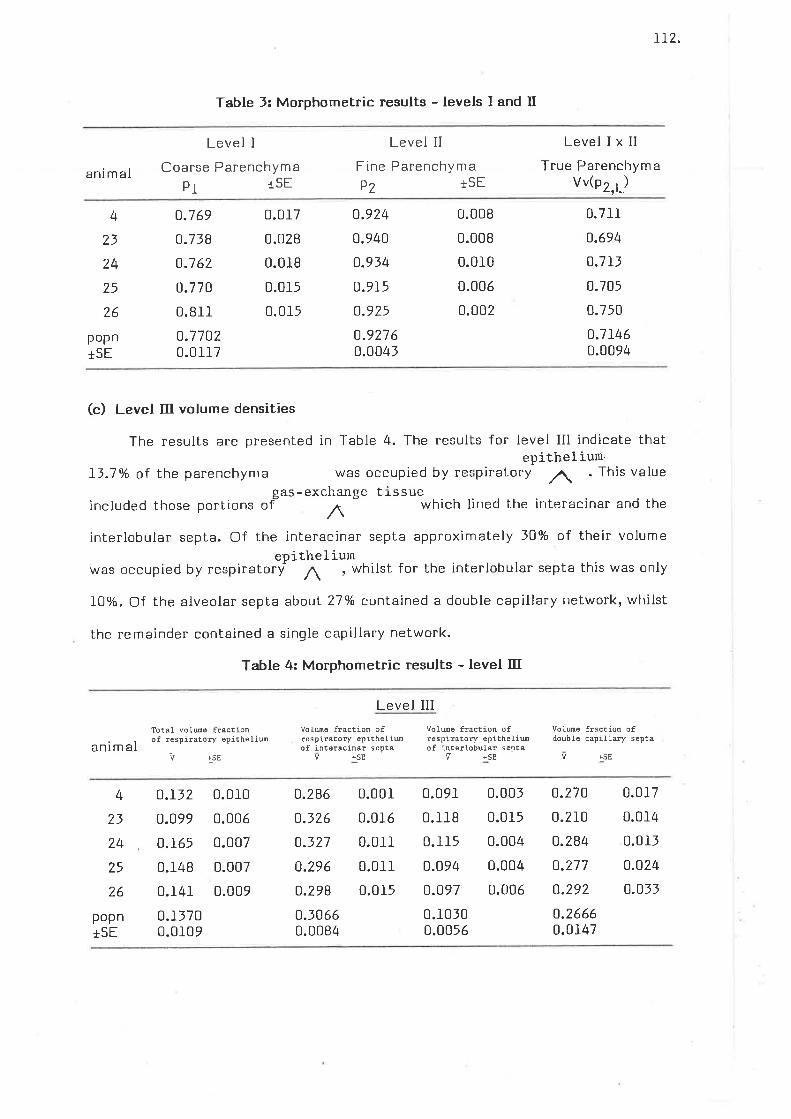
IT2.
Table 5: Morphometric results - levels I and tr
animal
Level I
Coarse ParenchymaP1 tSE
Level II
Fine ParenchymaP2 tSE
Level I x II
True ParenchymaVv(t2,¡)
4
23
24
25
26
popnISE
o.7 69
o.738
o.7 62
0.770
0.8il_
o.77020.0117
0.017
0.028
0.018
0.01_5
0.015
o.924
0.940
o.934
o.9I5
o.925
o.92760.0041
0.008
0.008
0.010
0.006
0.002
0.711
o.694
o.7I3
0.705
0.750
o.71460.0094
(c) Level III volume densities
The results are presented in Table 4. The results for level III indicate thatePithel ium'
I3.7Vo of the parenchyma was occupied by respiratory /\, . This valuegas-exchalge tissue
included those portions of"
^
which lined the interacinar and the
interlobular septa. Of the interacinar septa approximately 3lo/o of their volume
was occupied by respiratofypttfittTïhitst for the interlobular septa this was only
1070. Of the alveolar septa about 27Vo conlained a double capillary network, whilst
the remainder contained a single capillary network.
Table 4: Morphometric results - level trI
Level III
animalTotal voluo E¡actionof respiratory epitheliw
VoImo fraction ofrespiratory epitheliuof interacinar septa
V +SE
Volwo f¡action of¡espiratory epiEheliuof intê¡lobular septa
ü +sE
Volue fraction ofdouble capillary sopta
+SE+SE
4
23
24
25
26
popn+SE
o.I32
0.099
0.165
0.148
0.1_41
0.11700.0109
0.010
0.006
0.007
0.007
0.009
o.286
0.326
0.327
0.296
o.298
o.30660.0084
0.001
0.016
0.011
0.01_1
0.015
0.091
0.118
0.115
0.094
o.097
0.10100.0056
0.001
0.015
0.004
0.004
0.006
0.270
0.210
o.284
o.2t7
o.292
o.26660.0147
0.017
0.014
0.011
o.o24
0.011
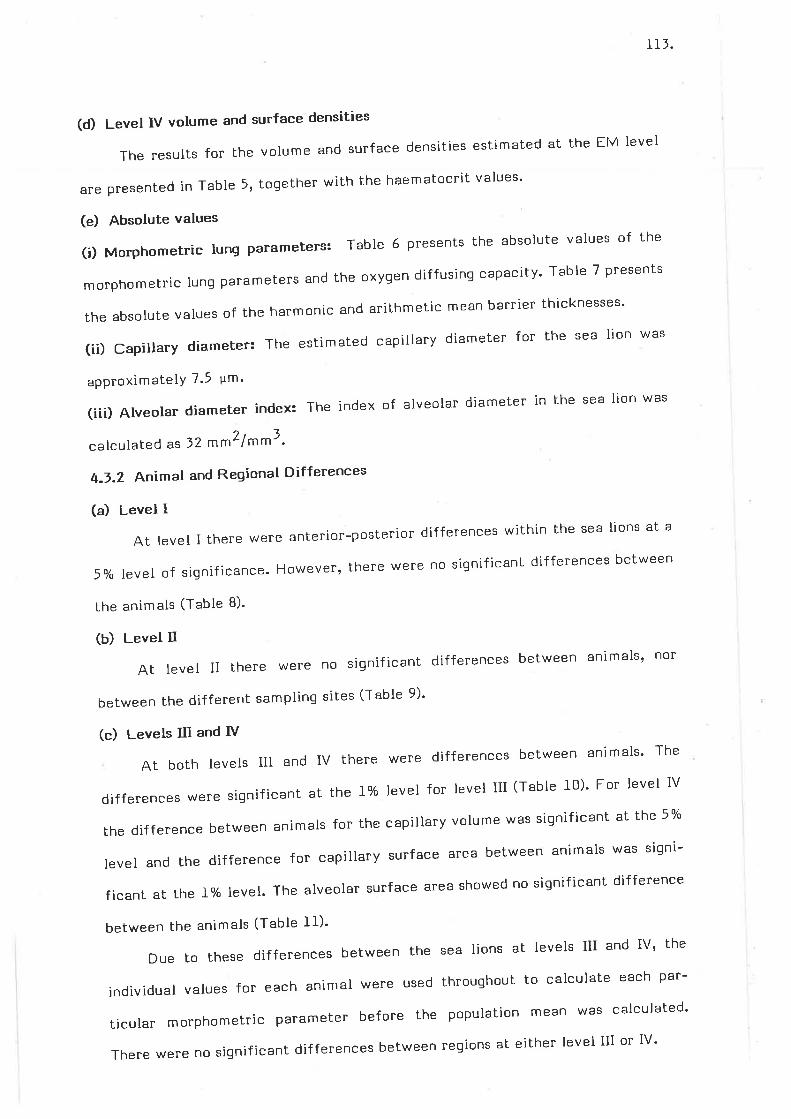
ll l.
(d) Level IV volume and surface densities
TheresulLsfor[hevolumeandsurfacedensitiesestimatedattheEMlevel
are presented in Table 5, together with the haematocrit values'
(e) Absolute values
(i) MorPhometric lung Parameters: Table 6 presents the absolute values of the
morphometric lung parameters and the oxygen diffusing capacity' Table 7 presents
theabsolutevaluesoftheharmonicandarithmeticmeanbarrierthicknesses.
(ii)Capiltarydiameter:Theestimatedcapillarydiameterforthesealionwas
approximatelY 7.5 ¡rm'
(iii) Alveolar diameter index: The index of alveolar diameter in the sea lion was
calculated as 32 mm2/mmJ'
4.1.2 Animal and Regional Differences
(a) Level I
Atlevelltherewereanterior-posteriordifferenceswithinthesealionsata
5Tolevelofsignificance.However,therewerenosignificantdifferencesbetween
the animals (Table B)'
(b) Levet tr
At level lI there were no
between the different sampling sites (Table 9)'
(c) Levets III and IV
At both levels III
significant differences between animals' nor
and IV there were differences between animals' The
differences were significant at the l% level for level III (Table L0)' For level iV
the difference between animals for the capillary volume was significant at the 5%
levelandthedifferenceforcapillarysurfaceareabetweenanimalswassigni-
ficant at the l-% level. The alveolar surface area showed no significant difference
between the animals (Table 1l)'
Due to these differences between the sea Iions at levels III and IV, the
individualvaluesforeachanimalwereusedthroughouttocalculateeachpar-
ticularmorphometricparameterbeforethepopulationmeanwascalculated.
TherewerenosignificantdifferencesbetweenregionsateitherlevellllorlV.
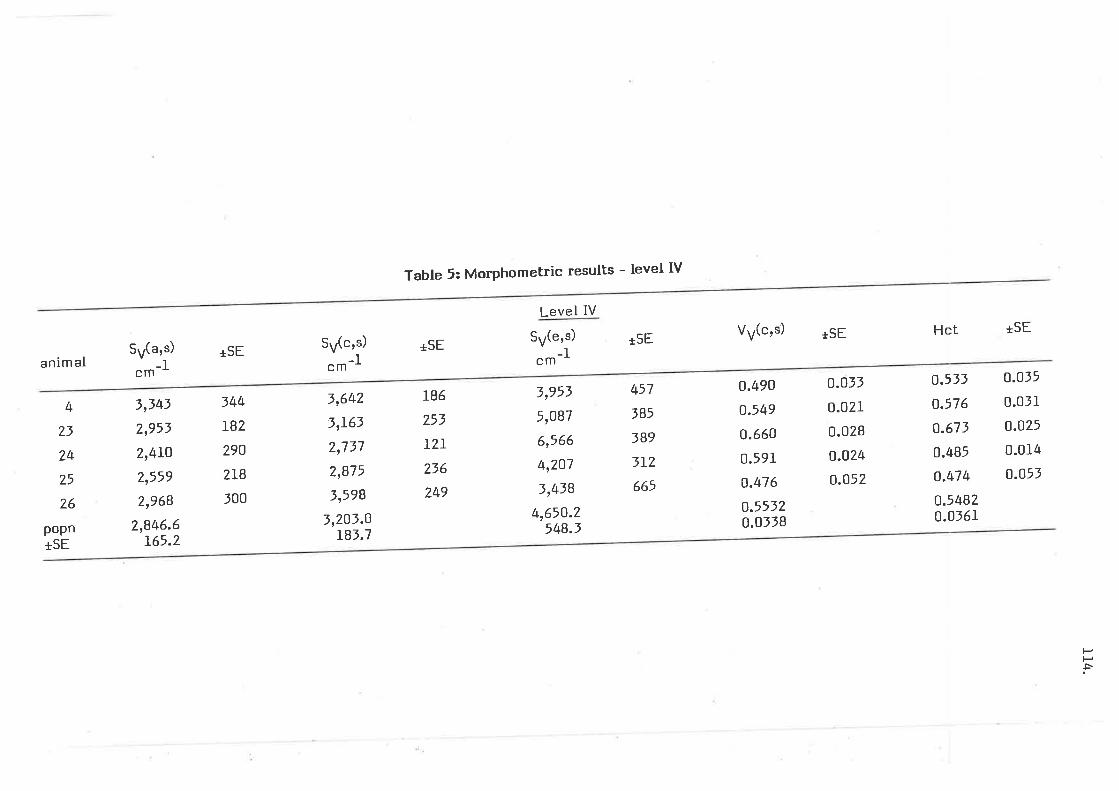
Table 5: Morphometric results - Ievel [V
Level IV
Sy(a,s) +SESy(c,s) *SE
Sy(e,s) +5EVy(c,s) +SE
-1 cm -I_'lcm* cm
Hct +SE
anim al
4
2t
?4
25
26
popn*SE
3r34t
2,953
2,4ro
21559
2,968
2,846.6L65.2
34t+
IB2
290
zTB
100
t1642
51163
2,737
?r875
3,598
3,^Ot.oT83.7
L86
25t
L?I
256
249
tr95t5,O87
6,566
4r2O7
3,4t8
4,650.?548.t
457
385
t89
3rz
665
o.490
o.549
o.660
0.591
o.476
o.55320.0lrB
o.o3t
0.021
0.028
o.o24
o.o52
o.5tto.576
o.67t
0.485
o.474
o.54820.016r
o.o35
0.011
o.oz5
0.0r4
o.o5J
P-ñ
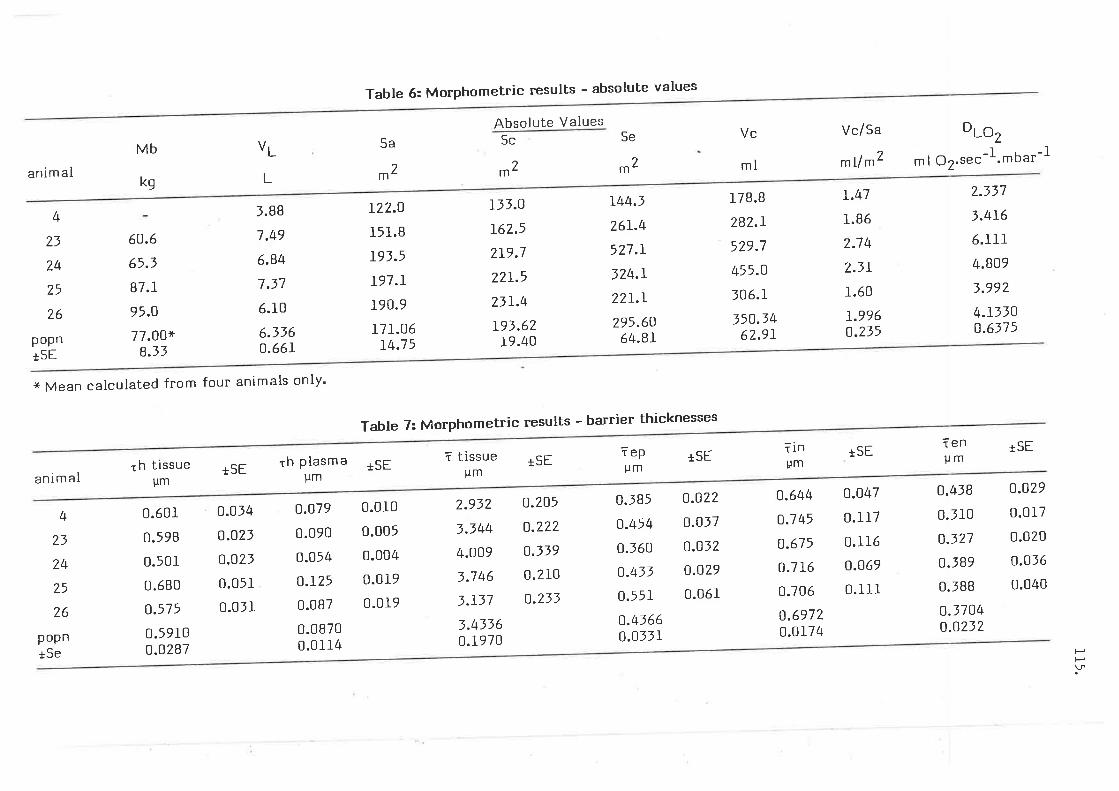
animal
animal
4
23
24
25
26
popntSe
Mb
60.6
65.3
87.1
95.O
77.00+8.33
th tissueum
0.601
0.598
0.501
0.680
o.575
0.5910o.o2B7
].BB
7.49
6.84
7.37
6.10
6.336o.66L
Lt3.O
162.5
2L9.7
22L.5
2JL.4
L9J.6219.40
r44.3
26r.4
527.r
324.r
22I.I295.60
64.8I
Vc
ml
I7B.B
282.1,
529.7
455.O
306.L
J50.3462.91,
Vc/Sa
mtlm2
L.47
r.B6
2.7 4
2.3L
1.60
r.996o.2i5
rSE
o.o47
0.117
0.1r6
o.069
0.11-l-
VL
Table 6: Morphometric results - absolute values
Absolute Values
5a Sc Se
m 2 m2
oto,
ml O2.sec -f . tbar-I
2..337
3.416
6.111
4.809
3.992
4.IJJO0.6375
tenìlm
+5E
2L mk9
4
?3
24
25
26
popntSE
* Mean calculated from four animals only'
r22.O
151.8
L9J.5
I97.IL90.9
L7r.O614.75
Table 7: MorPho
*SE
o.034
o.o23
o.o23
0.05r
0.0J1
o.o79
0.090
0.054
o.r25
0.087
0.08700.0rr4
0.0I0
0.005
0.004
0.0r9
0.019
2.932
3.344
4.009
3.746
J.t37
3.43360.1970
o.385
o.454
o.360
o.433
o.55r
0.4J66o.o33L
o.022
o.o37
o.o32
o.o29
0.061
îinum
o.644
O.7 t+5
0.675
o.7 16
o.706
o.69720.0r74
O.t+38
0.110
o.327
o.389
O.]BB
o.3704o.0232
o.o29
0.017
0.020
o.o36
0.040
th plasma rSEum
metric results - barrier thicknesses
repum
rSE1 tissueum
+SE
o.205
o.222
o.t39
0.210
o.233
PP
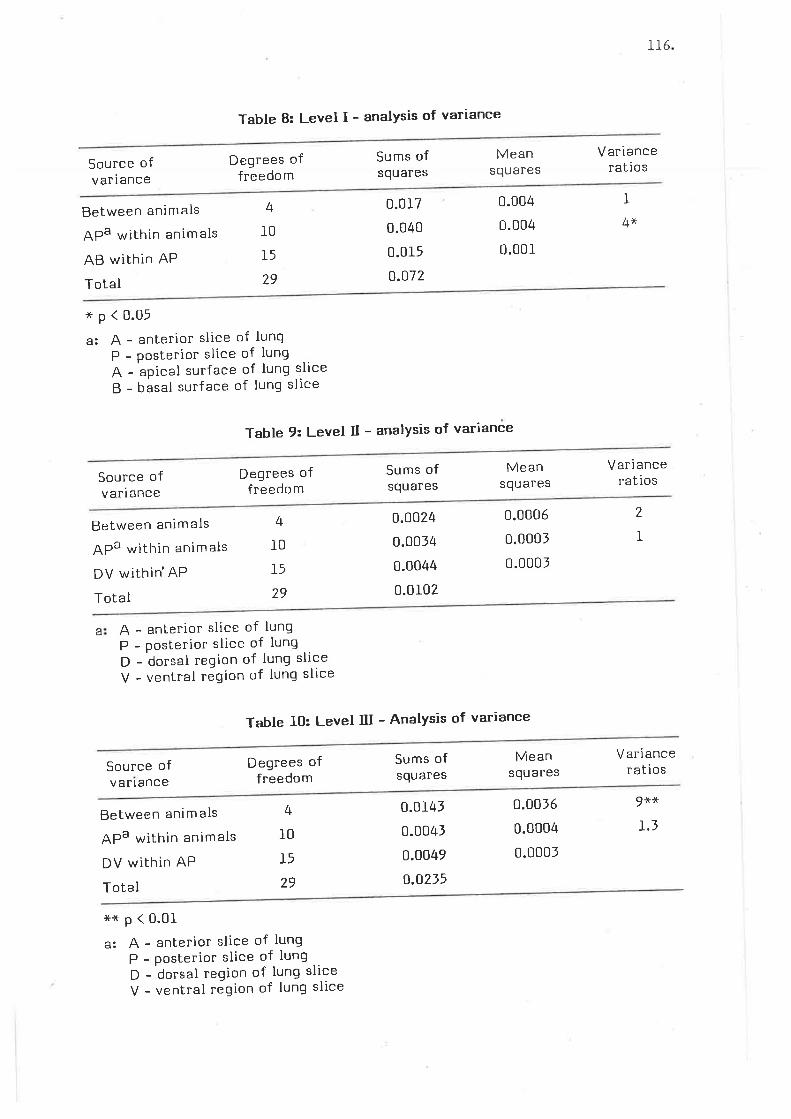
Table B: Level I - analysis of variance
Degrees offreedom
4
10
15
29
Sums ofsquares
Meansquares
0.004
0.004
0.001
Varianceratios
116
Variancerat ios
9*x
L'
xp(0.05a: A - anterior slice of lung
P - Posterior slice of lung
A - aPical surface of lung sliceB - basal surface of Iung slice
Source ofv ar i ance
Between animals
APa within animals
AB within AP
Total
Source ofvariance
Between animals
APa within animals
DV within'AP
Total
a
Source ofvarlance
Between animals
APa within animals
DV within AP
Total
Table 9: Level II - analysis of variance
0.0r7
0.040
0.015
o.o72
Sums ofsquares
0.0024
0.0014
0.0044
0.0r02
I4*
VarianceratiosDegrees of
freedom
4
IO
L5
29
Meansquales
0.0006
0.0001
0.0001
2
I
A - anterior slice of lungP - posterior slice of lunqD - dorsal region of lung sliceV - ventral region of lung slice
Tabte I0: Level III - Analysis of variance
Degrees offreedom
4
t0
l529
Sums ofsquares
0.0141
0.0041
0.0049
o.0235
Meansqu ares
0.0016
0.0004
0.0001
xx p ( 0.01
a: A - anterior slice of lungP - Posterior slice of lungD - dorsal region of lung sliceV - ventral region of lung slice
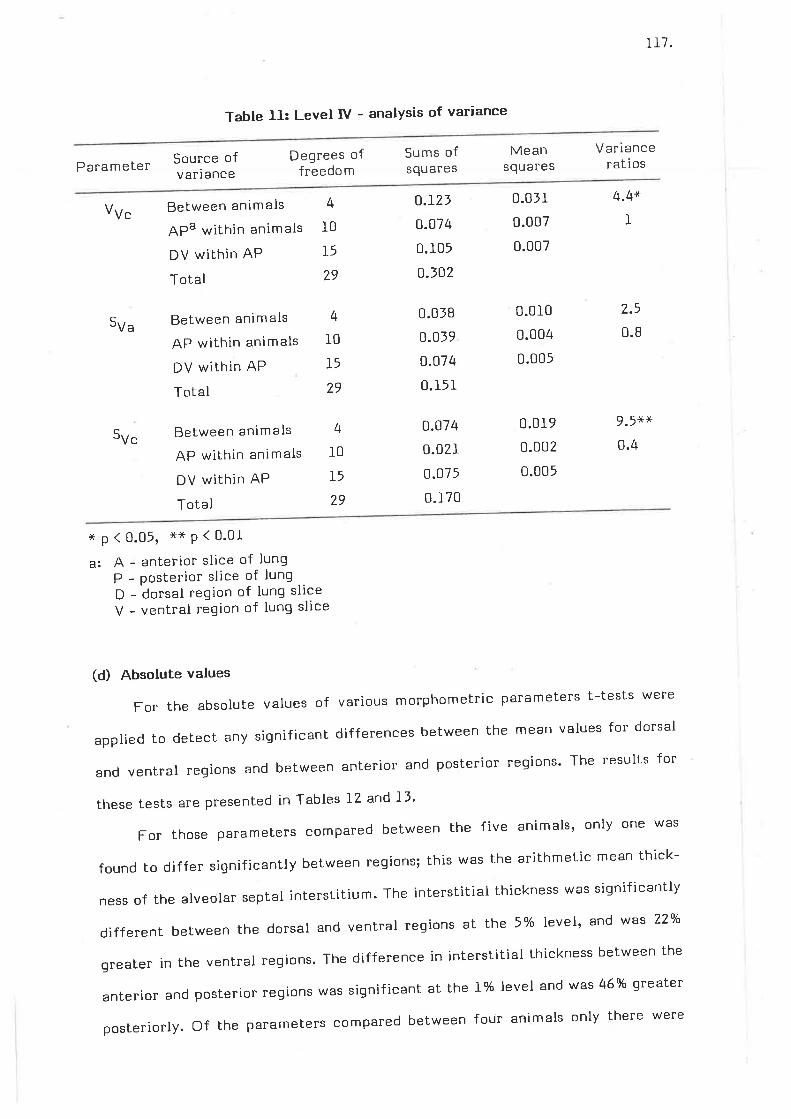
117.
Table Il: Level IV - analysis of variance
ParameterDegrees of
freedo m
4
IO
É29
Sums ofsquares
o.r23
0.074
0.105
o.toL
0.018
0.019
0.074
0.151
0.074
0.02r
0.075
0.170
Meansquares
0.01r
0.007
0.007
0.010
0.004
0.005
0.0r9
0.002
0.005
Varianceratios
4.4+
l
?.5
0.8
9.5x*
0.4
Vv"
Source ofvariance
Between animals
APa within animals
DV within AP
Total
c,Va
c,Vc
Between animals
AP within animals
DV within AP
Total
Between animals
AP within animals
DV within AP
Total
4
10
I5
29
4
t0
15
29
*p(0.05, xxP(0.01
a: A - anterior slice of lungP - Posterior slice of lungD - dorsal region of Iung sliceV - ventral region of lung slice
(d) Absolute values
For the absolute values of various morphometric parameters t-tests were
apptied to detect any significant differences between the mean values for dorsal
and ventral regions and between anterior and posterior regions' The results for
these tests are presented in Tables I2 and 1l'
For those parameters compared between the five animals' only one was
found to differ significantly between regions; this was the arithmetic mean thick-
ness of the arveolar septar interstitium. The interstitiar thickness was significantly
different between the dorsal and ventral regions at the 5% level, and was 22o/o
greater in the ventral regions. The difference in interstitial thickness between the
anterior and posterior regions was significant at the f o/o Ievel and was 46% greater
posteriorly. of the parameters compared between four animals only there were
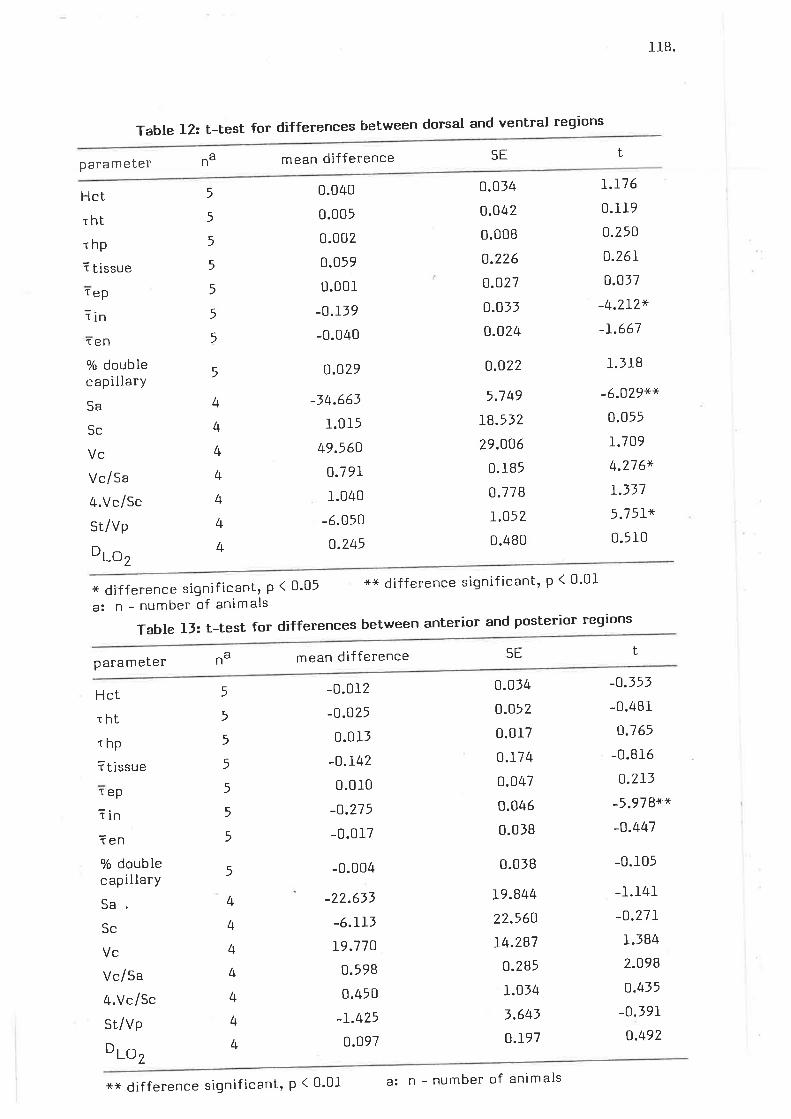
rl8.
T
Parameter
Hct
thtrhpI tissue
tep
linTen
7o doublecapillary
Sa
Sc
Vc
Vc/sa
¿r.Vc/Sc
St/Vp
oao,
able12:t-testfordifferencesbetweendorsalandventralregions
nâ mean difference SE t
* difference signif icant, P < 0'05
a: n - number of animals
Table
0.014
o.o42
0.008
o.226
o.o27
o.o33
o.o24
o.o22
5.7 49
rB.53Z
29.006
0. lB5
o.778
r.o520.480
x* difference signif icant, P < 0'0I
SE
5
5
5
5
5
5
5
5
4
4
4
4
4
4
4
0.040
0.005
0.002
0.059
0.00I
-0.L39
-0.040
o.o29
-34.663
r.015
49.560
o.79r
1.040
-6.050
o.745
mean difference
-0.012
-o.o25
0.0I1
-o.r42
0.010
-o.275
-0.017
-0.004
-27.633
-6.rrtL9.770
0.598
0.450
-r.425
0.097
T.I76
0.1r9
o.250
o.26I
o.o37
-4.2r2x
-I.667
l.llB
-6.O29+x
0.055
1.709
4.276x
r.337
5.75rx
0.5r0
tIJ: t-test for differences between anterior and posterior regions
parameter nâ
Hctthtrhp
? tissue
1ep
îinîen% doublecapillarY
Sa,Sc
Vc
Vc/5a
4.Vc/Sc
St/Vp
oto,
0.014
o.o52
0.017
o.r7 4
o.o47
0.046
0.018
0.018
L9.844
22.560
14.287
0.285
r.o34
3.643
0.197
5
5
5
5
5
5
5
5
4
4
4
4
4
4
4
-o.353
-0.481
o.165
-0.816
o.zr3
-5.97gxx
-o.447
-0.105
-1.r4r-o.27r1.184
2.O98
o.455
-0.191
o.492
xx difference signif icant, p ( 0'0J- a: n - number of animals
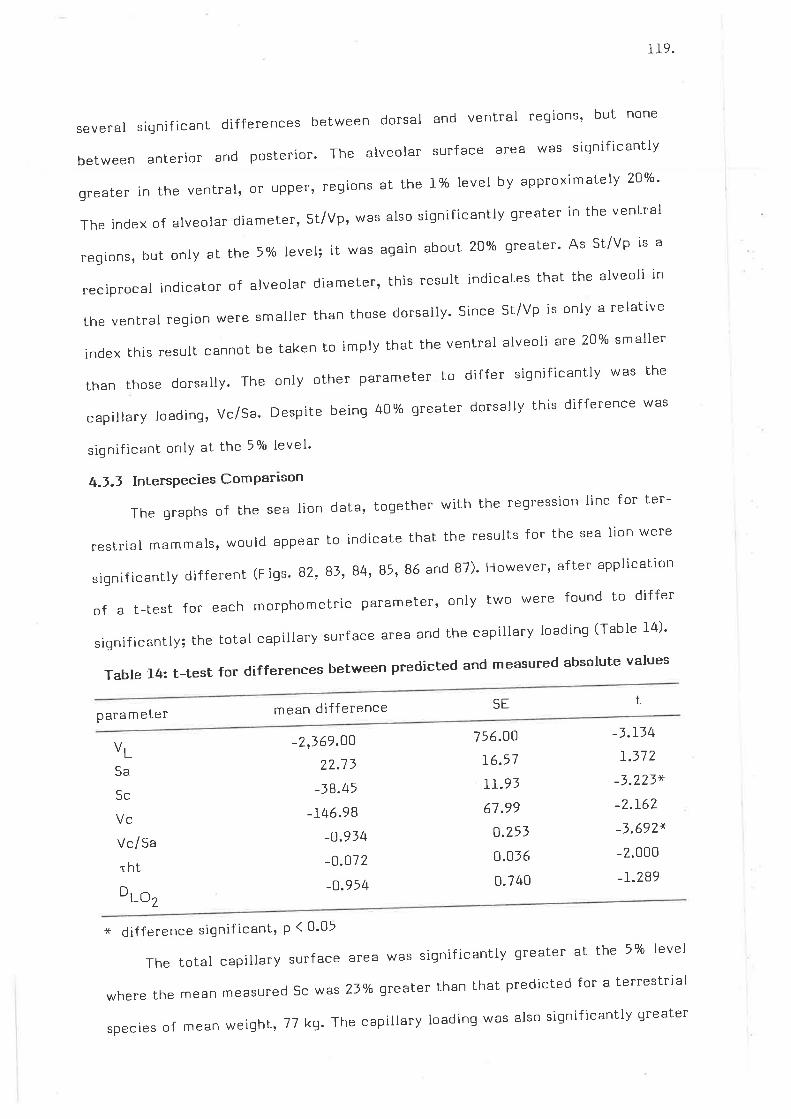
I 19.
several significant differences between dorsal and ventral regions' but none
between anterior and posterior. The alveolar surface area was significantly
greaterintheventral,orupper,regionsatthel%levelbyapproximately20%'
The index of alveolar diameter, St/Vp, was also significantly greater in the ventral
regions, but only at the 5o/o Ieve¡; it was again about 20% greater' As St/Vp is a
reciprocal indicator of alveolar diameter, this result indicates that the alveoli in
the venLral region wele smaller than those dorsally' Since St/Vp is only a relative
index this result cannot be taken to imply that the ventral alveoli ate 2oo/o smaller
thanthosedorsally.Theonlyotherparametertodiffersignificantlywasthe
capillary loading, vc/sa. Despite being 40% greater dorsally this difference was
siqnif icant only at tl'te 5o/o level'
t+-1.3 InhersPecies ComParrson
Thegraphsofthesealiondata,togetherwiththeregressionlineforter-
restrialmammals,wouldappeartoindicatethattheresultsforthesealionwere
significantly different (Figs. 82,83,84, 85, 86 and B7)' However' after application
of a t-test for each morphometric parameter, only two were found to differ
significantly; the total capillary surface area and the capillary loading (Table I4)'
Table 14: t-test for differences between predicted and measured absolute values
mean difference SEparameter
t
VL
Sa
Sc
Vc
Vc/Sa
thtoro,
-2,369.OO
22.7t
-38.45
-146.98
-o.934
-o.o72
-o.954
156.OO
r6.57
IT.93
67.99
o.253
0.016
0.740
-3.I34r.372
-3.223x
-2.L62
-3.692x
-2.000
-r.289
dif ference signif icant, P ( 0'05
Thetotalcapillarysurfacealeawassignificantlygreateratthe5%olevel
where the mean measured sc was 23o/o grea1er than that predicted for a terrestrial
speciesofmeanweighL,Tlkg.Thecapillaryloadingwasalsosignificantlygreater
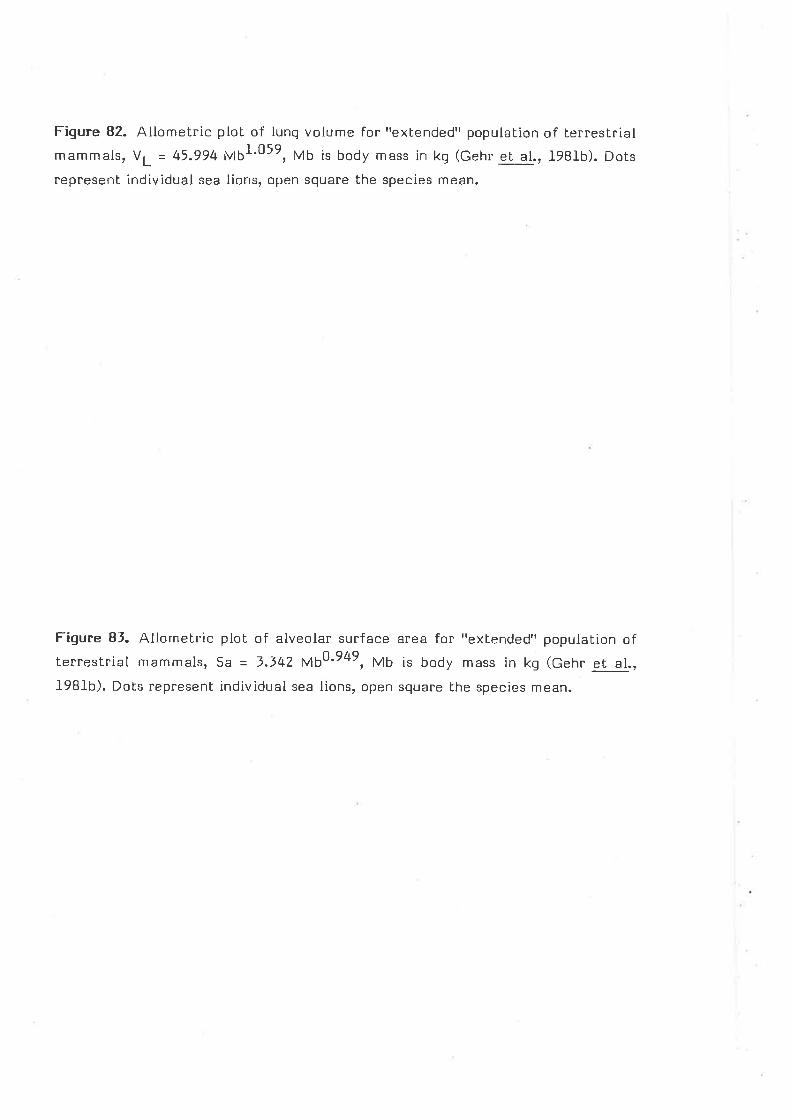
Figure 82. Allometric plot of lung volume for I'exlended" population of terrestrialmammals, V¡ = 45.gg4 Mbl'059, Mb is body mass in kg (Gehr et al., l98lb). Dots
represent individual sea lions, open square the species mean.
Figure Bf. Allometric plot of alveolar surface area for "extended" population ofterrestrial mammals, Sa = 3.t42 Mb0'949, Mb is body mass in kg (Gehr et al.,
1981b). Dots represent individual sea lions, open square the species mean.
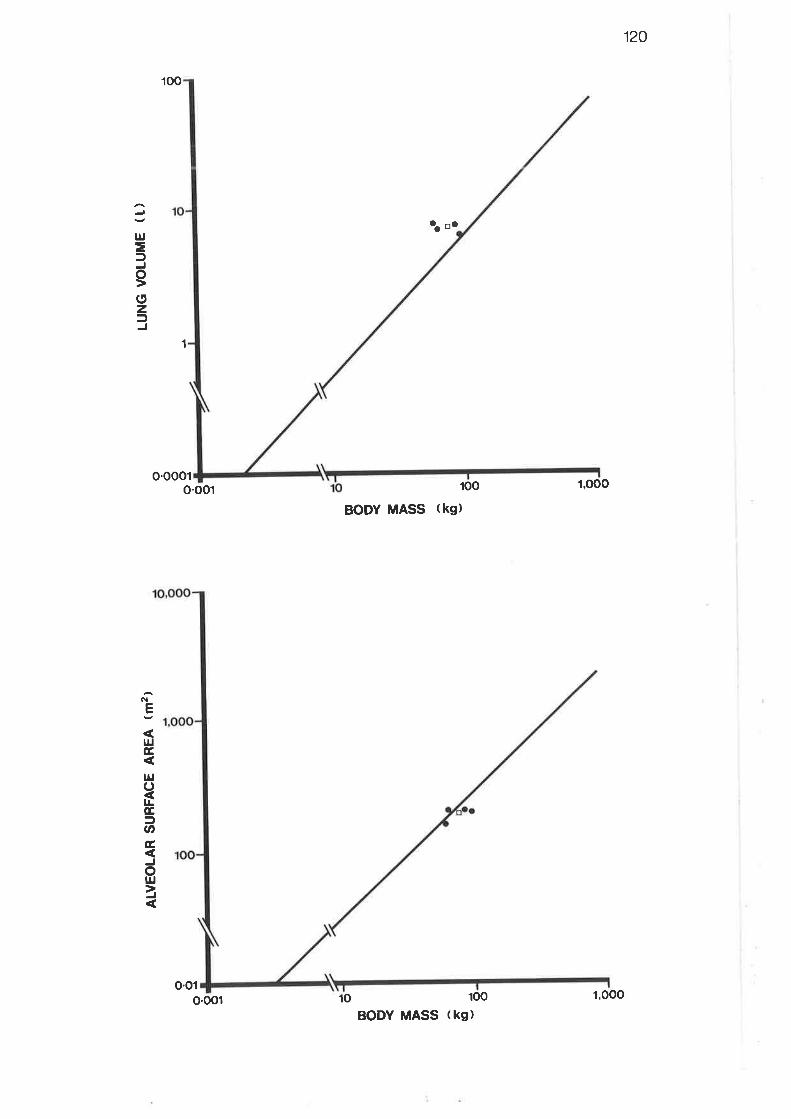
120
t¡J
=ÐJoozD
100
o'oool
aa tra
100
BODY MASS (kg)
100
BODY MASS (kg)
1
o.oo1 l,ooo
ôE
l¡JG,
¡¡¡oÉÉ,Ð(tÉ,
Jot¡¡z
o'o1o.ool 10 l,ooo
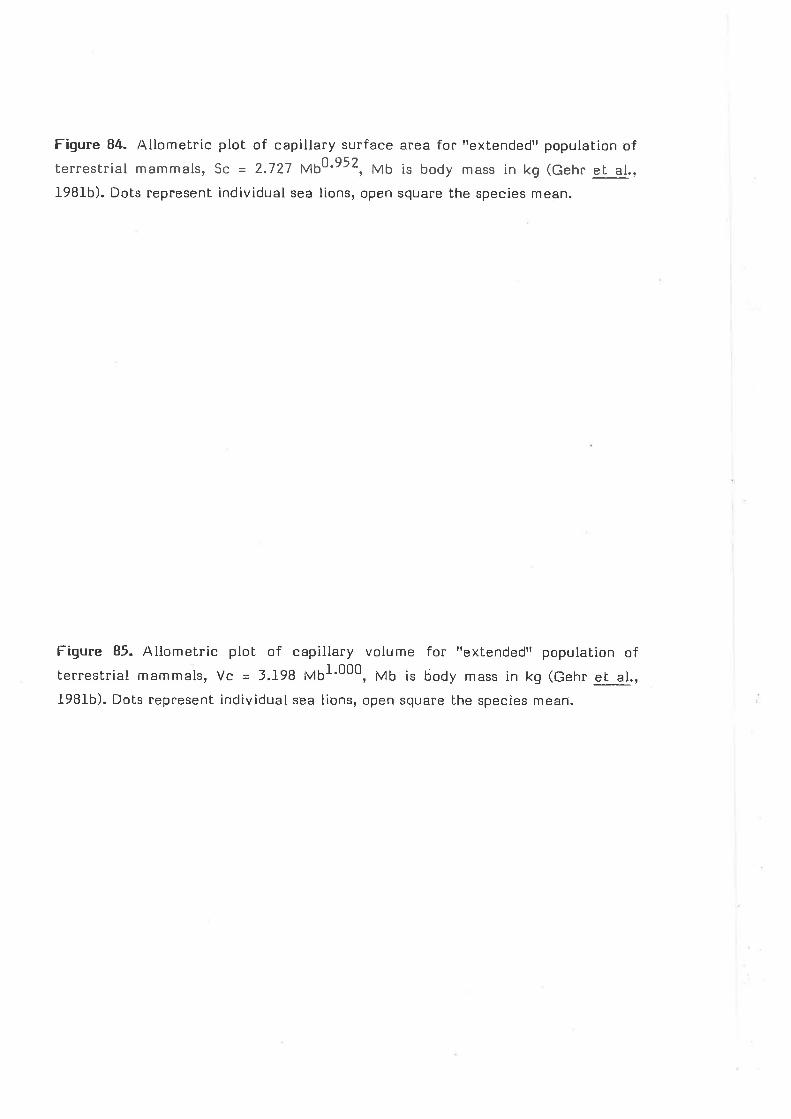
Figure 84. Allometric plot of capillary surface area for I'extended" population ofterrestrial mammals, g¿ = 2.727 MbtO'952, Mb is body mass in kg (Gehr ql al.,
l98lb). Dots represent individual sea lions, open square the species mean.
Figure 85. Allometric plol of capillary volume for rrextended'r populaIion of
terrestrial mammals, Vc = 3.198 Mbl'000, Mb is body mass in kg (Gehr eL al.,lg8fb). Dots represent individual sea lions, open square the species mean.
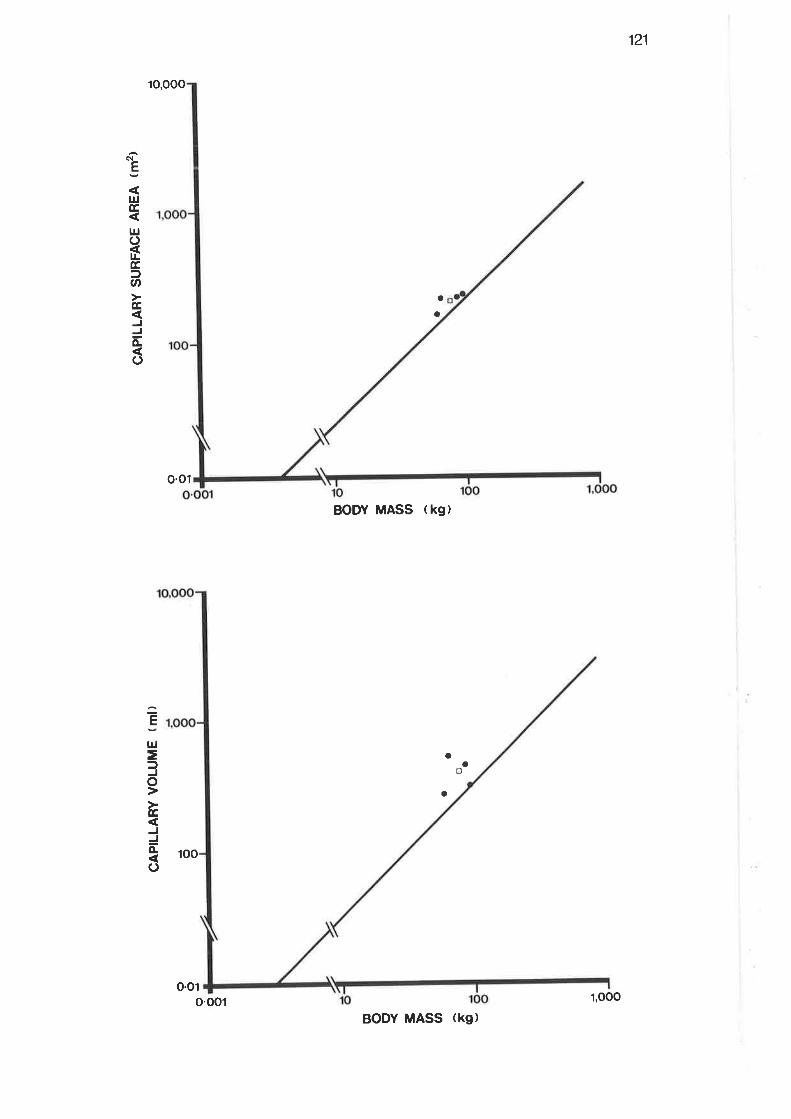
CA
PIL
LAR
Y S
UR
FA
CE
AR
EA
tM
z)
-9 o o oI o
I o
CA
PIL
LAR
Y V
OLU
ME
(m
l)
o o
a
I o o
@ o 0 =Þ Ø U, - ral
a
@ o o =Þ Ø U, x ,o-
aa
oo
-o o oJ to J
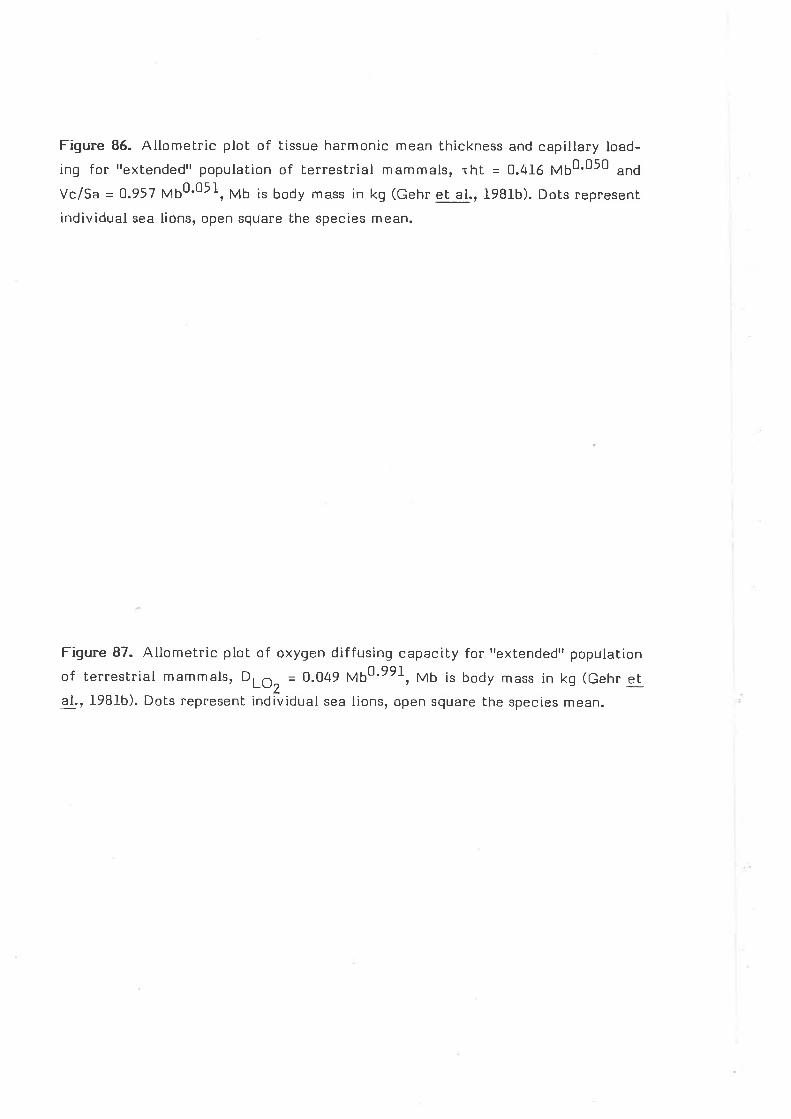
Figure 86. Allometric plot of tissue harmonic mean thickness and capillary load-
ing for "extended" population of terrestrial mammals, rht = 0.416 Mb0'050 and
Vc/Sa = 0.957 Mb0'05I, Mb is body mass in kg (Gehr et al., f981b). Do[s represent
individual sea lions, open square the species mean.
Figure 87. Allometric plot of oxygen diffusing capacity for "extended" population
of terrestrial mamm"¡r, DLoz = 0.049 Mb0'991, Mb is body mass in kg (Gehr etal., 198lb). Dots represent individual sea lions, open square the species mean.
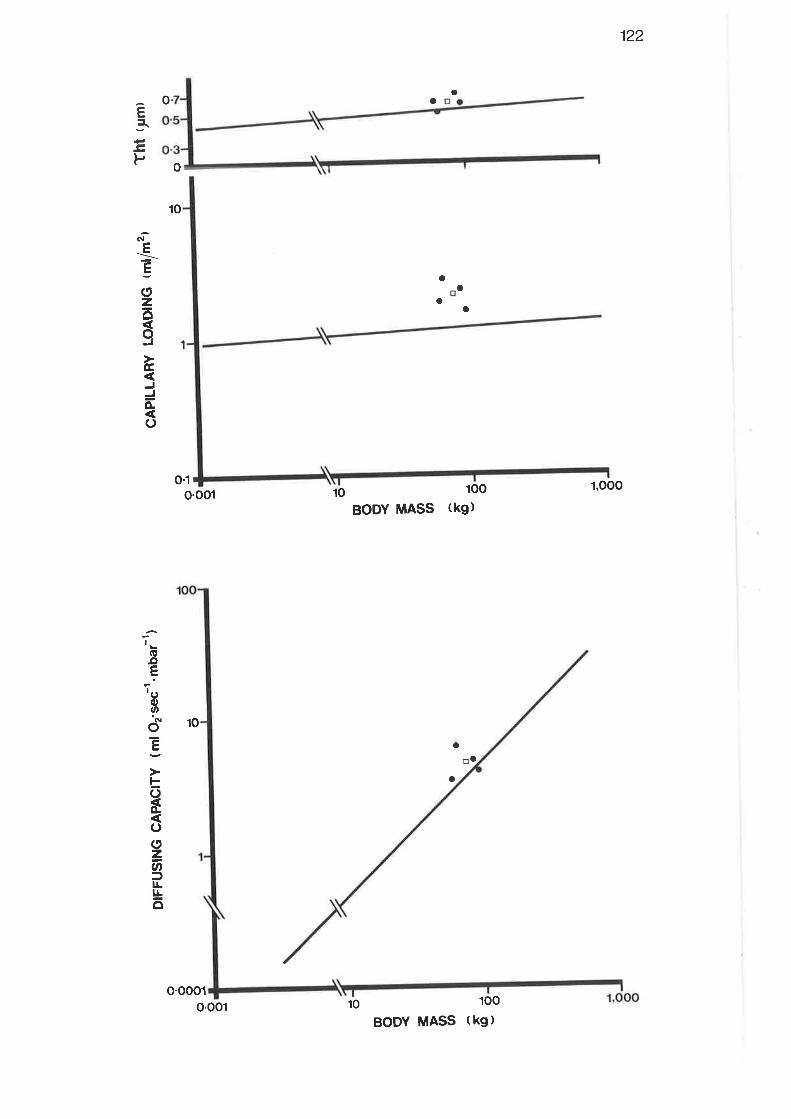
DIF
FU
SIN
G C
AP
AC
ITY
(m
l O2'
sec-
1'm
bai1
)C
AP
ILLA
RY
LO
AD
ING
tm
l/m2r
Tht
t¡m
t
I o oo
I o o oI o o
ooo a
o
oo
ao
@ o 0 3 Þ U' Ø F G¡J
o
ao a
a
@ o o 3 Þ U'
U' = €g
O¡
a
'o o oT
\) f\)
r23.
at the 5% Ievel with a mean measured 7\o/o ÇreaLer than that predicted. Apart
from these two, the mean measured value for various other parame[ers were
considerably greater than predicted but were not found to be statistically signi-
f icant. This was due, in part, to Lhe sm all sample size involved, and to the
associated relatively large standard error of the means. These parameters
included the lung volume which was approximately 50%o greater than the predicted
value, the capillary volume which was nearly 6070 Çreater than predicted, the
tissue harmonic mean thickness which was l-4% greater, and the total diffusing
capacity which was 26o/o greater. The mean alveolar surface area was the only
parameter less than that predictedi it was about -Il% smaller.
4.4 DISCUSSION
4-4-I Discussion of Methods
(d Level I
The results for the eslimation of the I'coarse" parenchymal volume density
from each lung slice of animal 454 using the two grid systems are presented in
Table 15. Also included in the table are the estimated ranges for the true volume
densityl These estimated ranges show that the error for 22 mm Weibel grid was
approximately 60/o and approximately 3Vo for the l- cm grid. Therefore, the
approximately five-fold increase in the number of test points generated by the
I cm grid reduced the error of the estimate by 50o/o. To gain advantage of this
increased precision the I cm grid was used for all animals.
(b) Level II
In the trial count of one 2 '¡rm section with the three grid systems tested, it
was found that the 1 cm-square lattice generated over 1,300 test points. This
number of points required an unreasonable and hence costly amount of time to
count. It has been demonstrated that in conducting stereological estimations no
benefit is gained in the efficiency of the final estimate from very precise exami-
nations of small areas. Rather, less precise estimations of more areas oI even
r24.
more animals, depending on the cost of each, is often more efficient and can
result in a more accurate final estimate (Gundersen and Østerby, 198J-; Mathieu et
"I., lg8l). Another factor in the accuracy of the final result is that of the
bìological variation between animals, as it has been demonstrated that the major
source of variation in results often stems from the differences between the indi-
vidual animals (Shay, I975:. Gundersen and Østerby, J-98l; Mathieu et al., J-98l;
Gupta et al., 19Bl). For these reasons the I cm Iattice was excluded from further
tri als.
Table 15: Results for grid systemsr trials - level I
gridsyste m
22 mm Weibel grid J- cm-square lattice grid
slice Pp1/P1 Vvt ¿Vv ep1/P1 Vv+ ¡Vv
A/AA
A/B
M/A
M/B
PIAPIB
4rlst4r153
t4l 44
301J7
t 5.5
* 5.4
x 5.7
+ 5.7
t 6.3
x 6.4
17II2I4164l?r7
t751240
r9gl26e
r6tl2r5r49lr76
79.9 ¡ 2.7
15.6 + 2.9
72.9 ¡ 2.9
73.6 ¡ 2.1
75.8 t 2.9
83.5 + 2.8
44
48
J7l401
B4.l
83.3
77.4
77.4
77.3
B 1.l
a: A - anterior slice of lungM - middle slice of lungP - posterior slice of lungA - apical surface of lung sliceB - basal surface of lung slice
The two Weibel grid systems gave comparable results for the one seclion
counted, so it was decided to include all six sections from animal A54 in the trial.
The results of this trial are presented in Table 16. From these results it can be
seen that the ll mm grid was marginally, and consistently, more precise and even
though it involved counting nearly twice the number of points generated by the
22 mm grid, it was used for the other animals. However, in retrospect, it would
appear that the overall efficiency of the final result would not have been greatly
impaired by using tl-te 22 mm grid. fhe 22 mm grid would be suitable for lwo
reasons: one, the effect of biological variation mentioned above; and two, when
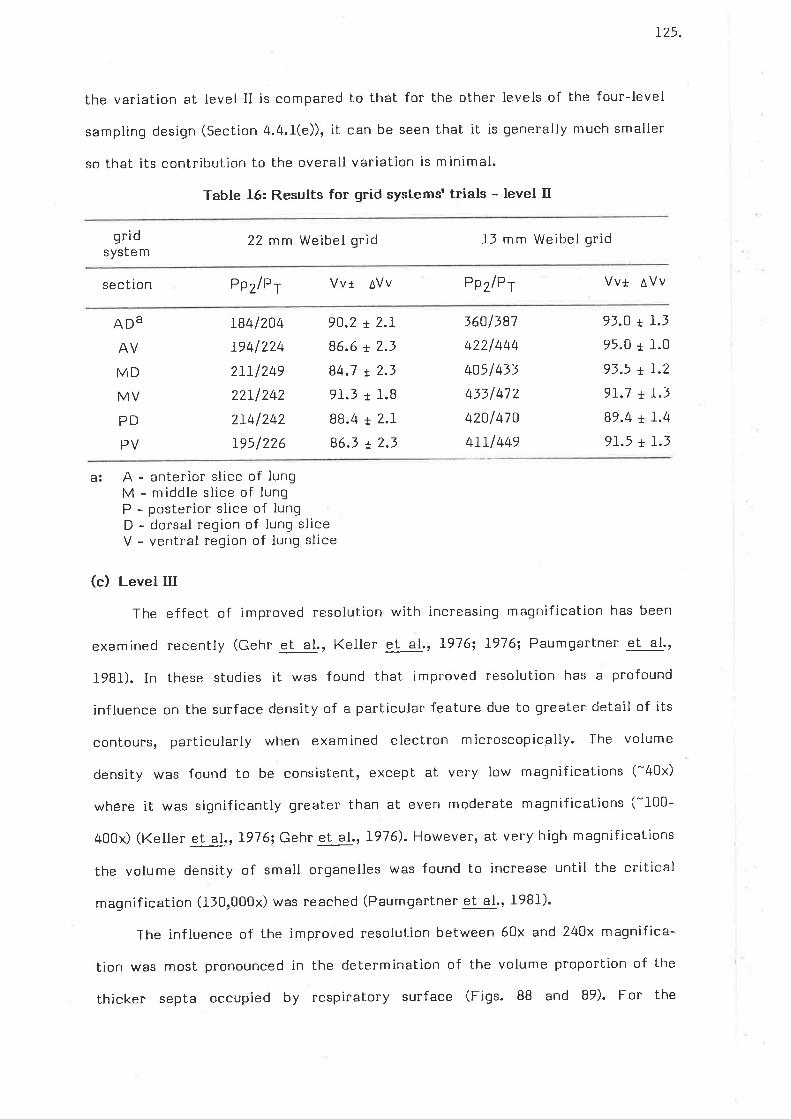
r25.
the variation at level II is compared to that for the other Ievels of the four-level
sampling design (Section 4.4.Ì(e)), it can be seen that it is generally much smaller
so that its contribution to the overall variation is minimal.
Table 16: Results for qrid systemsr trials - level II
gridsystem
22 mm Weibel grid ll mm Weibel grid
section ep2lP¡ Vvr ÂVv PpzIPT Vv+ aVv
ADA
AV
MD
MV
PD
PV
rB4l204
1941224
2rrl2492211242
2141242
r95l?26
9O.2 + 2.I86.6 + 2.3
84.7 + 2.3
9l-.1 + l.B
BB.4 r 2.1
86.3 t 2.3
3601381
4221444
4051433
4331 412
4201 470
4rrl 44e
93.O t I.395.0 + l-.0
93.5 + I.2
9I.7 + I.3
89.4 t 1.4
9I.5 ¡ I.3
a A - anterior slice of lungM - middle slice of lungP - posterior slice of lungD - dorsal region of lung sliceV - ventral region of lung slice
(c) Level III
The effect of improved resolution with increasing magnification has been
examined recently (Gehr et al., Keller et al., 1976; I976i Paumgartner et al.,
1981). In these studies it was found that improved resolution has a profound
influence on the surface density of a particular feature due to greater detail of its
contours, particularly when examined electron microscopically. The volume
density was found to be consistent, excepl at very low magnifications (-40x)
whére it was significantly greater than at even moderate magnifications (-100-
400x) (Keller et al., I976; Gehr et al'r I976)' However, at very high magnifications
the volume density of small organelles was found to increase until the critical
magnification (110,000x) was reached (Paumgartner et al., l9Bl).
The influence of the improved resolution between 60x and 240x magnifica-
tion was most pronounced in the determination of the volume proportion of the
thicker septa occupied by respiratory surface (Figs. BB and 89). For the

Figure BB. Graph showing progressive means of percenlage of interacinar septal
volume occupied by respiratory surface, delermined at three levels of magnifica-
lion.
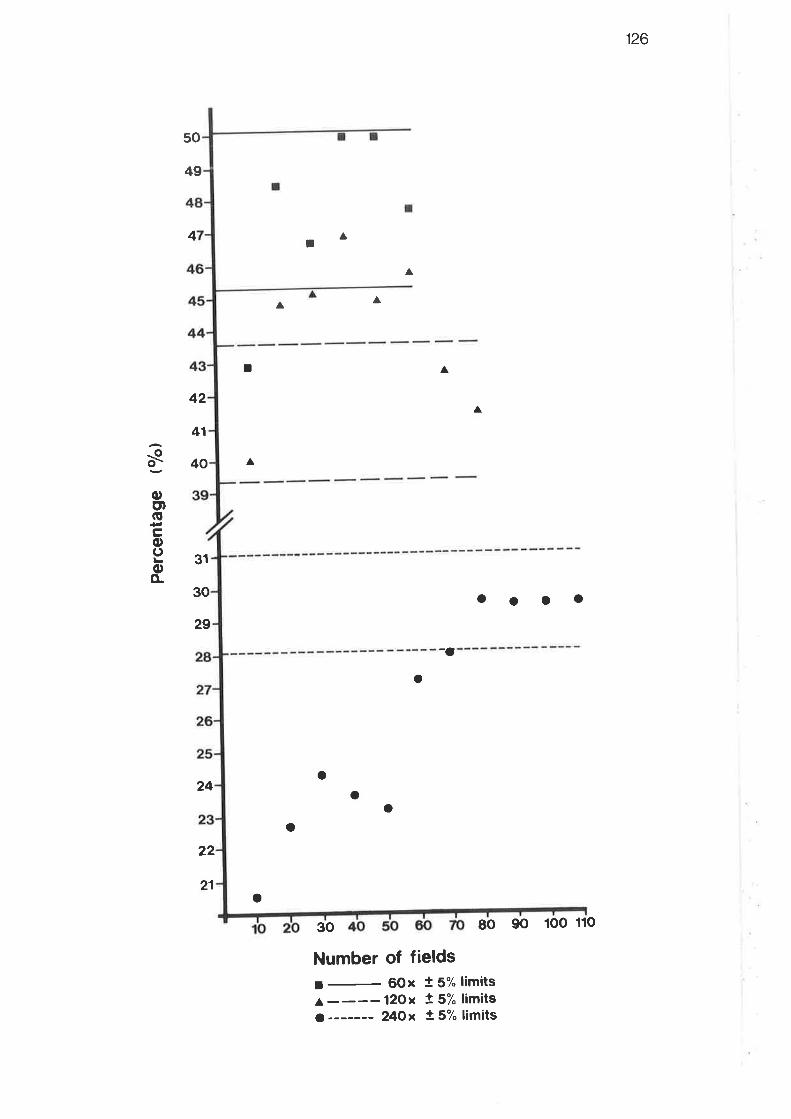
126
50
49
A4 ¡A
^¡
A
42^
Eoct)ogooLoo.
41
40 A
31
30
29
ooao
-a
o
o
Number of fields6Ox t 5% limits
^----120x ! 5% limits
o ------- 24Ox t 5% limits
80
24 aO
O
22
21o
30 90 100 110
Figure 89. Graph showing progressive means of percentage of inlerlobular septal
volume occupied by respiralory surface, delermined at three levels of magnifica-
tion.
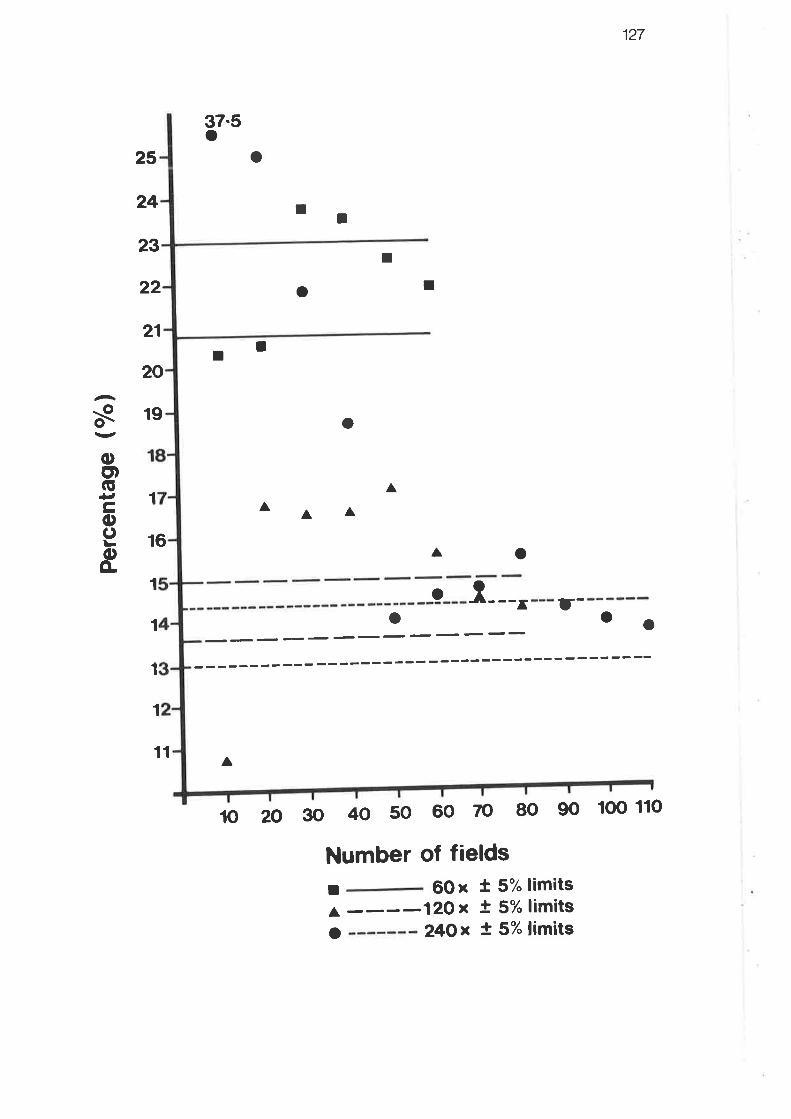
Per
cent
age
(%l
JJ
J¿J (''
¿J (o
l\) oÌs
8ts
N (,|
I ¡
t ¡
t
I
J J
.t u|o
o
o
o
o þ ¡ I ¡ ì q I
I I I I I I I lo I I I I I
o o
I I I I I I I I I ¡ I I ¡ I I I I I I I ¡ I I ¡ ¡ ¡ ¡ I ¡ I I I I I I I I I I I I I
¿ o À) o (, o
z =5
CT E8
9.o
+o d! cL
oo
@ o t ¿ I ¿ ¿ o
I o) o x l+ (,| ñ 3 ,1ì n,
I I I I ¿ ]\¡ o x l+ ('l àe 3 30
o 19 Þ o x t+ (rl
àQ 3 =o
J N) !
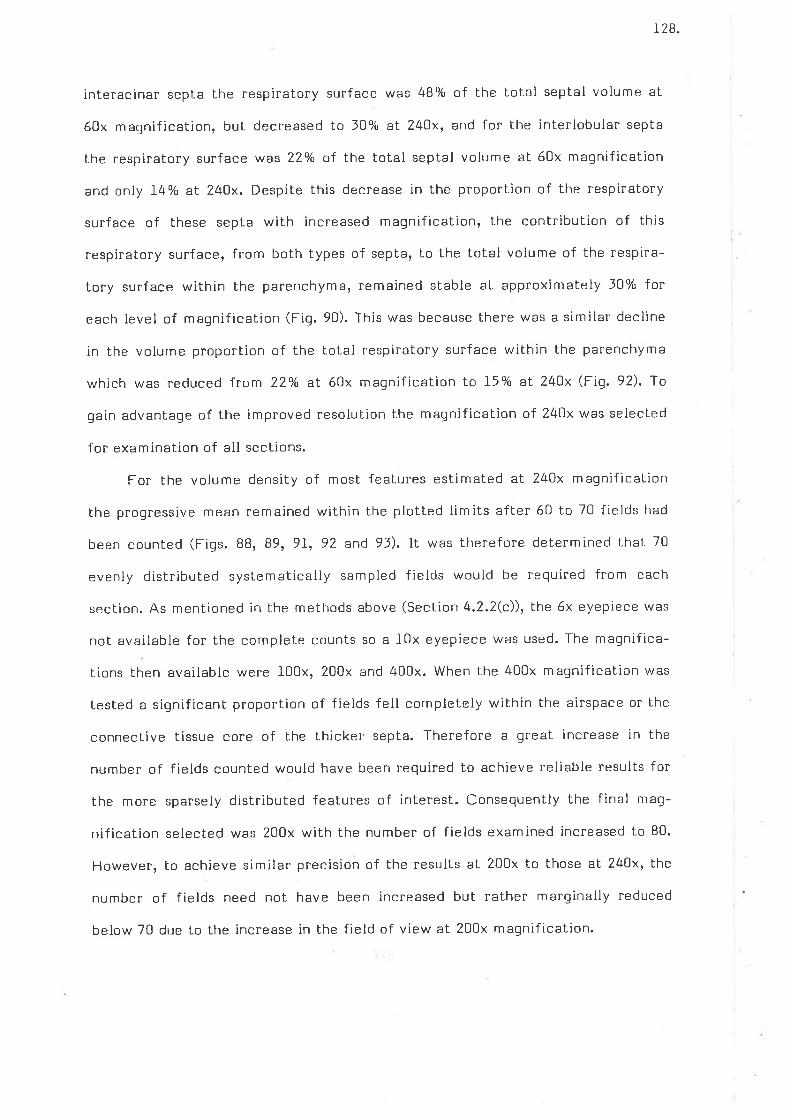
r28
interacinar septa the respiratory surface was 487o of the total septal volume at
60x magnification, but decreased to l0o/o at 24Ox, and for the interlobular septa
the respiratory surface was 22%o of the total septal volume at 60x magnification
and only l4o/o at 24Ox. Despite this decrease in the proportion of the respiratory
surface of lhese septa with increased magnification, the contribution of this
respiratory surface, from both types of septa, Lo the total volume of the respira-
tory surface within the parenchyma, remained stable at approximately l0% for
each Ievel of magnification (Fiq. 90). This was because there was a similar decline
in the volume proportion of the total respiratory surface within the parenchyma
which was reduced from 22o/o at 60x magnification to t5o/o aL 24Ox (Fig. 92). To
gain advantage of the improved resolution the magnificalion of 240x was selected
for examination of all sections.
For the volume density of most features estimated aL 24Ox magnification
the progressive mean remained within the plotted limits after 60 to 70 fields had
been counted (Figs. BB, 89, 9Ir 92 and 93). It was therefore determined that 70
evenly distributed systematically sampled fields would be required from each
section. As mentioned in the methods above (Section 4.2.2(c)), the 6x eyepiece was
not available for the complete counts so a f0x eyepiece was used. The magnifica-
tions then available were l-00xr ZOOx and 400x. When the 400x magnification was
tested a significant proportion of fields fell completely within the airspace or the
connective tissue core of the thicker septa. Therefore a great increase in the
number of fields counted would have been required to achieve reliable results for
the more sparsely distributed features of interest. Consequently the final ma9-
nification selected was 200x with the number of fields examined increased to 80.
However, to achieve similar precision of the results at 200x to those at 240x, the
number of fields need not have been increased but rather marginally reduced
below 70 due to the increase in the field of view at 200x magnification.

Figure 90. Graph showing the contribution of the interacinar and interlobularsepta to the total respiratory surface volume, determined at three levels of mag-
nif ica tion.
Figure 9I. Graph showing proqressive means for combined volume proportion ofsingle and double capillary alveolar septa within the parenchyma, determined atthree levels of magnification.
129
I
10 20 30 40 50 60 70
Number of fields¡-6Oxr ----12Oxa ------ 24Ox
I
T
A
80 90 100 110
IIrIIIIIII
31
29
doC'ìocoooô.
t,,t,tt
25
a
2
T
16
14
13
I
Ëoo)oyCoIboÀ
AA
11
10
9
T---aoa -:-- õ---o-î
O o__t__-o
30 40 50 60 70 80 90 100 110
Number of fields.- 6Ox ! 57" limitsa --- 12Ox + 57. limitso------ 24Ox ! 5% limits
710 20
Figure 92. Graph showing progressive means of total proportion of respiratory
tissue volume within the true parenchyma, detenmined at lhree levels of maqni-
f ic ation.
24
23
130
tl
AA^a
---a- A
--r- ---t---aoooo OO
o
10 20 30 40 50 60 70 80 90 100 110
Number of fields¡ 60 x ! 5Y" limitsA ----12Ox t 5% limitso --------24Ox t 5% limits
¡
-oo.-
oo)o+tco(JLoo.
21
19
1
14
A
15
13
Figure 93. Graph showing progressive means of the percentage of airspace volume
wi[hin lhe parenchyma, determined at three levels of magnif ication.
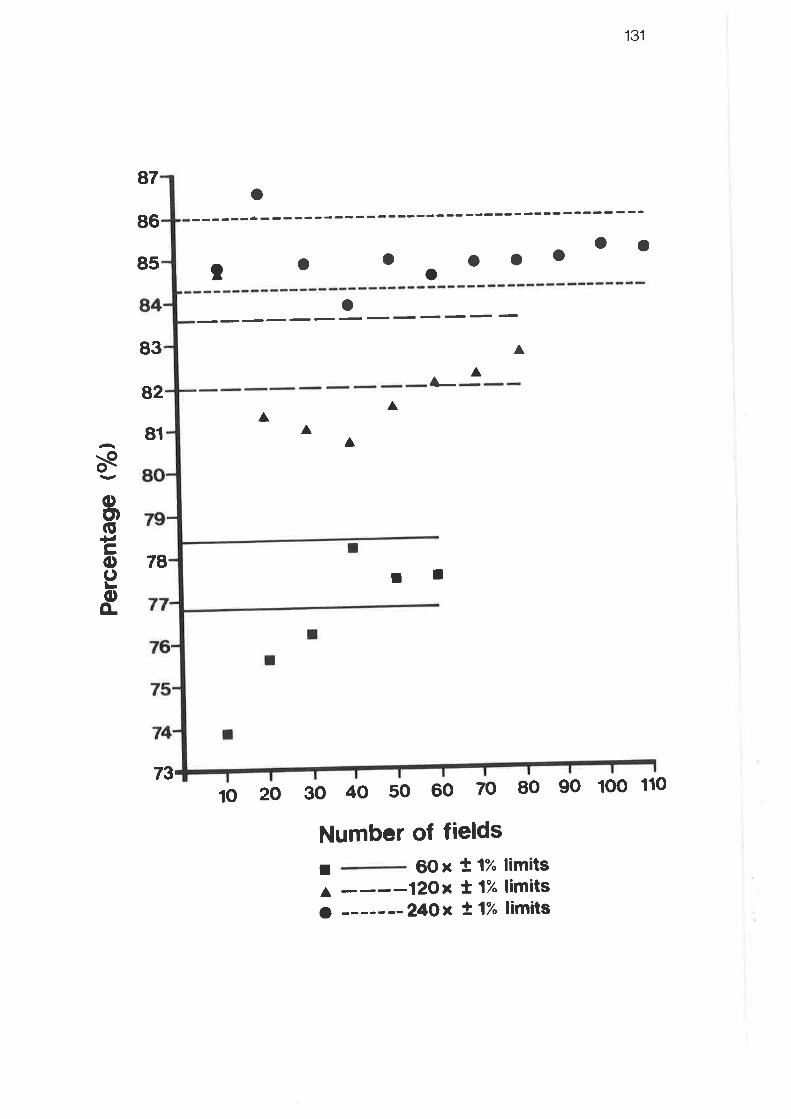
87
86
85
83
82
81
131
ooo OOI O
oo
A
A '
A
A
It
10 20 30 40 50 60 70 80 90 100 110
Number of fields¡ 60 x ! 1% limitsA --- -12Ox t 1% limitso ----- --24Ox !1% limits
o
AA
dog)o+.gooLoo-
78
73
r32.
(d) Levet tV
(i) Subsampling method: The results for the two methods of subsampling of
eleclron micrographs are presented in Table 17. The table shows the mean density,
from the six sampling sites, for each feature under consideration. The results for
the two methods are significantly different but this is because each method is
applicable to a particular overall sampling design. The SQ subsampling was used in
two-level sampling whilst the STWQ subsampling was used in four-level sampling.
Table 17: Resutts of comparison between SGì and STWG¡
subsampling - level IV
SG subsampling
Sv(a,s) sv(c,s) Vv(c,s)_l -lcm- cm-
STWA subsampling
Sv(a,s) Sv(c,s) Vv(c,s)_r -lcm* cm*
density
SE
%o SE
r,596.9
313.2
23.4
r,194.5
422.8
23.6
0.068
0.012
r1.6
3,223.8
178.2
5.5
4,t3O.5
245.O
6.r
o.507
0.016
3.2
The feature of interest in Table l-7 is the percentage standard error of the
mean. The mean value for the estimation of the alveolar and capillary surface
densitiés and the capillary volume density all have a large percentage standard
error for SG subsampling. For the STWG subsampling the equivalent results are
consistently small, being between f our to f ive times sm alle'r than f or the SG
subsam pling.
(ii) Harmonic mean barrier thickness: Tabte .l-B shows the values for the harmonic
mean thickness of the tissue and the plasma calculated directly from the Iinear
measurements, and using the eleven and seventeen class log scales. The last
column in the table shows the percentage variation between th calculated from
the linear measurements and h for the two log scales.
For the tissue, direct application of the eleven class scale overestimated the
rh by about 2% whilst the seventeen class scale overestimated it by about 3.5Vo.
For the plasma, the eleven class scale underestimaled the t h by 27o and the
I1J.
seventeen class scale underestimated by nearly 6%. Therefore, using the eleven
class scale resulted in a th within 2o/o of the measured th which was smaller than
the seventeen class scale variation, and for lhis reason the eleven class scale was
used.
Table I8: Results of comparison between Il and 17 classlogharithmic scales for harmonic mean barrier thickness
(.h - .hc)aLr/rh th . 100thL
Tissue Harmonic Mean Thickness
linear measurement
ll- class Iog scale
17 class log scale
Plasma Harmonic Mean Thickness
linear measurement
l-L class log scale
L7 class log scale
0.150
o.r47
0.r45
o.897
0.916
o.952
4.440
4.535
4.598
o.l4io.728
0.700
-2.14
-3.56
+2.O2
+5.7 9
a: .hL - linear harmonic mean thickness
thc - log class determined harmonic mean thickness
(e) Comparison of two-level and four-level samping designs
The results for each level of the two sampling designs, together with the
whole lung densities for the three parameters estimated are presented in Table l-9.
The whole lung densities for the parameters under consideration, were calculated
by the appropriate serial multiplication for each sampling design. The whole lung
density was calculated for each feature from each of the six sampling sites from
which the animal mean was determined.
The percentage standard errors of the means for the whole lung densities
were generally larger than for any of the component levels. The percentage
standard errors were approximately 2.5 Limes greater for the three paramelers
with the two-level design than with the four-level design.
The main reason for the greater vaniability in the resulLs of the two-level
design was the presence of the interacinar and interlobular septa. With this design
it was only possible, at the EM Ievel, to differentiate between the nespiratory
Four-level SamPling Design
Table 19: comparison between sGl and STWGI subsampling - whole lung densities
Level Densities
III IV
Whole Lung Densities
II
Vy(p1,L) Vy(P2¡P1) V(s,pZ) Sy(a,s) Sy(c,s) Vy(c,s) Sy(a,L) Sy(c,L) Vy(c,L)
_lcm- _lcm*_lcm- cm -t
I
density
SE
%SE
o.769
0.017
2.2
o.924
0.008
0.9
o.L32
0.010
7.6
3,223.8
T78.2
5.5
4,03O.5
245.O
6.r
0.507
0.016
J.2
307.3
to.5
9.9
]85.8
43.J
rt.2
0.048
0.001
6.3
Two-level SamPling DesignWhole Lung Densities
Level Densities
IIA
density
SE
%SE
IA
Vy(p1,L)
o.769
0.0r7
2.2
r,596.9
373.2
2J.4
r,794.5
422.8
23.6
0.068
0.0r2
17.6
r,24B.B
298.3
23.9
r,404.3
]BB.B
27.7
o.o56
0.009
I6.I
Sy(a,p) Sy(c,p) Vy(c,P) Sy(a,L) Sy(c,L) Vy(c,L)
-1 -1 cm -l-1 cm cm
cm
P
Þ
r35.
portion and the connective tissue core of these septa, and for this reason they had
to be included at this level. However, due to the small area of tissue sampled in
each block for EM, the number of these septa included was both very small and
highly variable. In the trial with this design a number of quadrats from some
sections were completely occupied by the core of these septa, whilst in other
sections sampled no thicker septa were included. Therefore, to achieve reliable
results with the two-level design, the number of samples examined at the EM level
would need to be greatly increased. This would then become an inefficient
approach because of the increased cost and time involved in producing and
analysing an adequate number of micrographs (Shay, I975i Gundersen and Østerby,
lgBl). The presence of these irregularly-distributed septa also influenced the
variability of the results for the four-level design. Level III, the level at which
these septa were considered, had the largest percentage standard error of the four
levels. However, this was only marginally larger than the results for level IV.
The effect of the presence of the thicker septa was also apparent in the
differences between the whole lung density mean values for the two sampling
designs. Both the alveolar and capillary surface densities were much larqer for the
two-level design. This was due to the limited sampling of thicker septa with the
SG subsampling which introduced a bias toward the thinner alveolar septa. This
bias would indicate that the alveolar septa have a greater surface density through-
out the parenchyma than is actually the case.
4.4-2 Discussion of Results
(Ð BoAy weights and reproductive status
The weight of only four of the animals was recorded at the time of capture,
and it was only from these animals that there was any indication of their repro-
ductive status (Table l). From these observations it would appear that the animals
AS2l , 24, 25 and 26 were mature breeding females. For animal AS4 its weight
could be predicted from the relationship between standard length and body weight
for female Australian sea lions from Seal Bay'
136.
log L = I.52 + 0.33 log w (Walker and Ling, l98l)
where L is standard length in cm, and
w is body weight in kg.
However, only curvilinear lengths were measured which, if substituted for
standard length in the above relationship, will give an inflated weight prediction.
By substitution of the curvilinear lengths of animals A525 and 26, those captured
at Seal Bay, the measured weights were approximately 25o/o smaller than those
predicted, whilst for animals AS2l and 24, from Dangerous Reef, the measured
weights were approximately 40%o less than predicted. Substitution of the curvi-
linear length of animal A54, also from Dangerous Reef, gave a predicled weight of
48 kq which, if similarly overestimated by 25-4O%, would result in a body weight
of 29-36 kg. This result is 40-50% less than the smallest animal weighed in this
series, that is, 60 kg which was at the bottom of the range for adult females
weighed in the field (Walker and Ling, 1980, lgBl). This predicted weight for A54,
together with the lack of evidence in regard to reproductive status, would indicate
that this animal was not a mature breeding female. Since no weight was recorded
for animal AS4, and the indication that it was not an adult animal, the morpho-
metric results for this animal have been excluded from the species comparison.
The differences observed between the four other animals may have been a
result of age, seasonal variation, or locational differences. No reliable method has
been developed for accurate age deLermination of otariid seals, so any differences
could not be determined. The two pairs of animals were collected six months apart
so that seasonal variations, such as availability of food, may have resulted in
weight differences. The two animals from Seal Bay had weigh|"s 25% ìess than
predicted, whilst for those from Dangerous Reef this difference was 40%. Thus
there may also be a Iocational difference between the two populations. However,
insufficient data has been recorded from the Dangerous Reef population to
establish such a difference. Another possible factor for the difference between
the two groups may have been their reproductive status. Both animals from Seal

ril
Bay were lactating and suckling young pups, whilst neither animal from Dangerous
Reef was lactating although animal AS24 was pregnant with a three month old
foetus (J.K. Linq, personal communication).
(b) Lung inflation and fixation
It has been suggested that instillation fixation of lungs with an inflation
pressure between 20 to l0 cm H20 above mid-chest height is sufficient to get
complete unfolding of the alveolar surface (Weibel, I97Oa, I973). It has recently
been demonstrated that the degree of inflaIion is increased by fixation in situ, and
is affected by the type of fixative, the initial flow rate of fixative and the final
transpulmonary pressure (Hayatdavoudi et al., 1980). Glutaraldehyde fixes tissues
rapidly and for this reason needs high initial flow rates to ensure adequate
inf lation.
In the present study the fixative was instilled via the trachea to a pressure
of l0 cm H20 above mid-chest height. Due to the size of the trachea in the sea
Iion and the reinforced airways, the fixative would have been rapidly distributed
throughout the lung at a sufficient pressure to result in near complete unfolding of
the alveolar surface. That this was in fact the case was evident in low power
micrographs where the alveoli were large and open' and at the EM level where the
integrity of the tissue com ponents was m aintained and there was only very
occasional folding or pleating of the septal wall as observed in terrestrial species
(Gil and Weibel, I972; Assimacopoulos et al., I976; Weibel et al', I973; Mazzone
et al., l97B). No regions of septal wall folding or pleating were found in those
blocks randomly selected for morphomelric evaluation'
Increasing inflation pressures and over-inflation of the lung by instillation of
fixative or by air in perfusion fixed lungs results in decreased capillary volume
(Weibel et al., I973; Fopest, I976; Mazzone, 1980) and deformation of capillary
shape (Assimocopoulos et al., I976). Gualitative evidence of overinflation was
present in some regions of animal A526 where some of the alveolar capillaries
appeared flattened and quantitatively the increase in the capillary volume was
much less than for the other animals when compared to the predicted values.
I lB.
The value for total lung volume of fixed lungs has been shown to represent
between 70 to gOVo of the total lung capacity determined by other methods
(WeibeÌ et al., 19BJ-a; Gallivan, l9Blb). It has also been suggested that large lungs
may lose about 5o/o of their volume during the first few hours after instillation
fixatiôn (WeiUel et al., l98la). This decrease has been attributed in part to some
residual elastic recoil and to trapped air in the more craniaÌ regions of the apical
lobes. If residual elastic recoil does in fact decrease the lung volume, then it may
be expected to cause a greater decrease in the sea lion lung due to the greatly
increased content of elastic tissue. No work has been conducted to determine if
this is in fact the case.
(c) Absolute values
(i) parenchymal volume: The volume fraction of the parenchyma in the sea lion
lung was 7I.5Vo. This value is well below the range from 80-90 % found in
terrestrial species (Table 20). The decrease in lung parenchymal volume is a
consequence of the increased number of the thickest connective tissue septa.
These are the septa which divide the lung into segments and are generally greater
than I mm in thickness. In terrestrial mammals the septa which demarcate the
division of the parenchyma into bronchopulmonary segments are generally only
apparent subpleurally. These septa arise from the pleura and penetrate into the
lung for a distance of only 2-3 cm (Krahl, 1964; Reid, 1967). In the sea Iion lung
the intersegmental septa also arise from the pleura but maintain a relatively
constant size as they continue throughout the parenchyma. There was no apparent
regional variation in the distribution of these septa and they appear as a regular
feature throughout the parenchyma.volume fraction ePrthelirrm - . -(ii) Respiratory tissue: The A of respiratory - /\ within the paren-
chyma was IJ.7o/o for the sea lions sampled. This included the respiratory epitheliunttotal
lining the interacinar and interlobular septa. Thisiivalue is similar to that observed
in the larger terrestrial species examined, but only about 6O-7OVo of that in small
mammals (Table 20). The tissue and capillary components of the alveolar septa
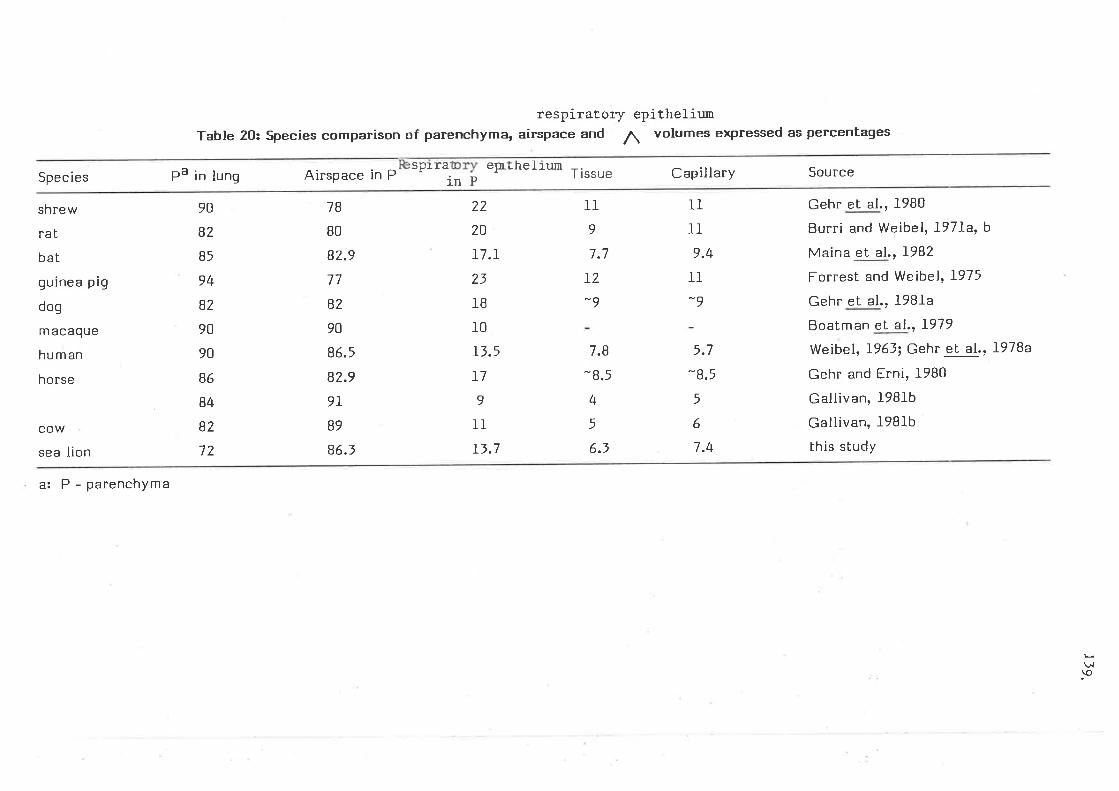
respiratory epithel iutrr
Table 20: Species comparison of parenchyman airspace and 71 volumes expressed as percentages
Species
shrew
rat
bat
guinea pig
dog
macague
human
horse
cow
sea lion
a: P - parenchyma
Pa in lung Airspace in Psprra eu-thelium -., I ISSUe Capillary Source
Gehr et al., J.980
Burri and Weibel, I97Ia, b
Maina et al., I9BZ
Forrest and Weibel, I975
Gehr et al., I98J-a
Boatman et al., I979
Weibel, 1963; Gehr el al.r I97Ba
Gehr and Erni, l9B0
Gallivan, l98lbGallivan, l98lbthis study
inP90
BZ
B5
94
B2
90
90
B6
84
B2
72
7B
BO
82.9
77
B2
90
86.5
82.9
9I89
86.3
22
20
I7.I23
]B
10
13.5
I79
1lL3.7
l19
7.7
I2-9
7.8
-8.5
4
5
6.3
11
1l9.4
11
-9
5.7
-8.5
5
6
7.4
Pv.l\o
r40.
each constitute approximately 50 o/o of the septal volume. This division of the
septal volume is similar to that found in other species (Table 20)' tnis was despite
the fact that approximately 27o/o of the alveolar septa carried a double capillary
network. In the sea lion the volu me proportions of the intra-alveolar septal
components were determined at level IV which excluded the interacinar and
interlobular septa. If these septa had been included at level IV then the tissue
fraction within all respiratory septa would have been markedly increased and that
for capillary volume decreased. At level III the distinction between lhe respiratory
epitheJ"ium and the connective tissue of these septa was possible. From this ìt
was found that approximately 3\o/o of the interacinar septal volume was occupied
by respiratory tissue, and for the interlobular septa this value was l-0%. The
epithel iunrespiratory'-
-
^--""
of the interacinar and interlobular septa contributedenithel ium
approximately one-third of the total respiratory' ^
volume determined at
Ievel III.
(d) Regional differences
(i) parenchymal distribution: At level I there was a significant anterior-posterior
difference in the volume density of "coarse" parenchyma at the 570 level. The
volume proportion of "coarse" parenchyma was approximalely 7o/o greater pos-
teriorly than anteriorly. This regional difference was not apparent for the "fine"
parenchyma determined at level II, nor was it apparent for the total volume
fraction of parenchyma in the lung.
The significant anterior-posterior difference detected at level I is primarily
a reflection of the inhomogeneous distribution of the coarse non-patenchymal
structure, that is, the major intrapulmonary airways, the pulmonary blood vessels,
and the prominent intersegmental septa. Many of these structures enter the lung
at the hilum and divide repeatedly into smaller and smaller branches which supply
all the parenchyma with air and blood. The bronchi, and the pulmonary arteries
which closely follow the bronchi in the more proximal regions, divide by an
irregular dichotomy (Weibel, 1963; Thurlbeck and Wang,I974), so that at any
t4l.
given disLance from the hilum any two airways of the same generalion will nol
necessarily be of bhe same diameber. This irregularity is most marked between
branches of the axial pathways (Reid, L967). Each axial pathway runs directly
from the hilum to the distal pleural surface of the segment it supplies, so bhat its
length and bhe number of its qenerations depend on the size and shape of that
segment. In this way the intrapulmonary bronchi, and their associated blood
vessels, are inhomogeneously distributed throughout the lunq parenchyma' There-
fore, the position along the anterior-posterior axis of the lung from which each of
the three I cm lung slices was collecled, would determine, to a degree, the
proportion of the "coarseil non-parenchymal structules present. This is borne out
by the fact that there were no significant regional differences in the distribution
of the "fineu parenchyma. No work has yet been done lo determine the distribution
of major airways and blood vessels in the sea lion lung which would most
effectively be achieved by resin casting.
(iD Body mass independent parameters: Within the five animals only one
parameter was found to differ significanlly between the regions. This was the
arithmetic mean thickness of the septal interstitium which was significantly
greater ventrally than dorsally, and significantly greater posleriorly than
anteriorly. This result is surprising when one considers the distribution of stresses
in the lung. West (1978) has shown that the stresses within the human lung are
greatest at the apex in both the vertical and lateral directions. This means that
the mechanical forces which act on the alveolar walls are greaLest in the apical
region, so that in the sea lion lhese forces would be greatest in lhe dorsal region.
This redistribution of str.esses with a change in orientalion of the lung has been
demonstrated in dogs by Glazier g!_gl. 0967). They found that the stresses in the
apical region of upright doqs behaved similarly to lhose in the dorsal region of
standing dogs. Therefore if increased stresses due to lhe lung were counteracted
by septal reinforcement one would expecl this to occur in [he dorsal region in lhe
lungs of quadrupeds and the sea lion, and in the apical region in human lungs.
r42.
Reinforcement such as this has not been demonstrated in those species examined.
The ventro-posterior thickening of alveolar septa in [he sea lion may well be a
response to the type of respiralion of these animals and to diving. The Australian
sea lion, in common with many marine mammals, possesses an obliquely oriented
diaphragm and a ftexibte rib cage (Scholander, 1964; Green, L972; Harrison and
Kooyman, 19BJ-). These structures, together with airway reinforcement' have been
demonstraled to enable very high expiratory flow rales in anolher otariid, the
california sea lion (Kerem et al., 1975; Matthews, L977). It has also been
demonslrated in excised california sea Iion lungs, that as a consequence of airway
reinforcement the alveoli are able to empty of air almost compleLely when under
pressure (Denison eI al., ]-971). This alveolar collapse has been predicted to be
similar to that which occurs during diving due to the increased pressure at depth
(scholander, 1940). If the reinforcement of alveolar septa, together with the
enlarged inleracinar and interlobular sepba, are structural modifications to assist
respiration and Iung collapse, lhen it is possible that the forces acting during these
activities are greater ventro-posteriorly which has resulted in an increased
thickening of the interalveolar septa in this region'
(iii) Body mass dependent parameters: For those features compared between the
four animals only, there were seVeral regional differences' The alveolar surface
area was approximately 2To/o gteater in the ventral (upper) region which was
significant at the 1% level. The index of alveolar diameter (St/Vp) was also sig-
nificangy greater in the venlral region at the 5o/o level, again being about 20%
larger ventrally. The alveolar diameter index is a reciprocal indicator of alveolar
diameter, so that the larger the index value then the smaller the alveoli. There-
f ore the venlral alveoli were sm aller than those dorsally. This dif ference in
alveolar diameter is reflected in the associated increase in Sa, since more of the
smaller alveoli will be contained in a unit volume. This decrease in the size of the
uppermost alveoli was the reverse to [hat found in dogs (Glazier et al'' 1967;
siegwarl et al., I97L; Gehr and weibel, I97Ð. Glazier-9!-g!. (1967) found that the
L4J.
extenl of the difference in size between upper and dependent alveoli was
influenced by the vertical distance between the upper and lower regions and the
transpulmonary pressure at the time of lung fixation. They found bhat the size
difference in alveoli was greater with increased vertical distance, and with low
inflation pressure. In the sea lions the verlical dis[ance was only l] to 20 cm,
whilst the inflation pressure was approximalely 30 cm H20. These conditions
would therefore tend to minimise the dorso-venLral differences but not accounL
for the reversal of the findings in dogs. Associated wi[h the increase in alveolar
size in the upper region of dog lungs, Gehr and Weibel (I974) also demonstrated a
significant, although small, increase in alveolar volume density in the ventral
(upper) region and a I07o smaller tissue volume density ventrally. This difference
also indicates the presence of larger alveoli in the upper region. Gehr and Weibel
(Ig74) also presented various factors that may contribute to regional differences'
of which the shape of the lhorax and the weigh[ of abdominal contents are the
most likely to affect the sea lion. In lhe sea lion, lhe thorax, as with the whole
body, is elongated in shape. Associated with this shape is a very obliquely oriented
diaphragm which extends anteriorly from lhe xiphoid process to the dorsal body
wall at the level of the second lumbar vertebra (Green, l'97Ð. As a result of these
struclures and a very flexible lhoracic cage, the lungs tend to undergo dorso-
ventral compression when in the normal prone posilion (Scholander' 1964)' It has
been demonstrated thaL in Lhe horse in the supine position the posterior regions of
the lungs are compressed by the abdominal contents (McDonnell, I974; McDonnell
et al., I979). Therefore it is possible that in lhe sea lion fixation at a pressure of
l0 cm H20 diminished any expected difference in alveolar size due to the vertical
gradient, and Lhat the weight of the flexible thorax, together with that of the
abdominal contents, caused a reduction in alveolar volume in the ventral (upper)
regron.
The other fealure which showed a significant difference belween lhe dorsal
and ventral regions, relates to the capillary arrangemenl in the alveolar walls.
r44.
This was the capillary loading, Vc/Sa, which was significantly different al the 570
level; it was found lo be approximately 4070 grealer in the dorsal (dependent)
region. concomitant wilh lhis was the finding that lhe capillary volume was
approximately l)70 greater in the dorsal region, Lhat the proportion of alveolar
septa with a double capillary arrangement was 1270 greater dorsally, and thal the
capillary diameter was 14% greater dorsally. Howevet, none of these differences
were found to be sta[istically significant. The combined effect of these small
differences, with the siqnificanlly smaller Sa in the dorsal region, was sufficient
to result in a significantly greater capillary loading dorsally' This increase in
capillary loading and the smaller increase in capillary volume are in aqreemenl
with the results of Glazier 9!-9!. (1969) and Gehr and Weibel Q97Ð' Both groups
found that, in the dog, the dependent region showed a significant increase in lhe
capillary volume. This increase also agrees with the finding in humans thal blood
flow also shows regional differences, being greater in the dependent regions (West'
1978).
(e) Interspecies comParison
(i) Absolute and specific values: Table 21 presenls the absolute values of various
morphometric parameters from the sea lion, together with those from four ter-
reslrial species. The terrestrial species included are those whose body weighb was
most like that of the sea lion. Also included in the table are several weight-
specif ic results.
comparison of the absolute resulbs would appear to indicate that some of
the morphomelric paramelers are increased in the sea lion' Howevelt examinaLion
of the specific results indicates a different interpretation. The only specific result
for the sea lion that is consistently greater than for the other species is the lung
volume. DespiÈe this increase in lung volume, the OtO, per kg body weight is
similar lo lhat for lhe other species, except humans. It has been shown previously
(Weibel, L972) that the neduced OrO, for hum,ans is more like that for inactive or
captive species than of active, free-living species'
r45.
Tabte 2J.: Species comparison of absolute and specificm orPho metric Parqmeters
Sea lion Humana Dogb wildebeestb waterbuckb
Mb(kq)
vL(L)
sa(m2)
5c(m2)
Vc(mt)
tht ( um)
rht (um)
thp (pm)
oto,(ml O2.sec
vL/Mb(L.ke-r)
sa/vu(m 2.k9-r)
sc/wb(m z.kg-l)
vc/ wb(mt.kq-r)
77
6.95
t8l209
393
3.56
o.59
0.09
4.582-1.rb".-1)
0.090
2.38
2.7r
5.10
74
4.34
r43
L26
2r1
2.22.
o.62
0.15
2.470
0.059
I.9J
1.70
2.BB
o.o33
46
2.89
177
L32
2t4
o.53
2.84I
o.o63
3.85
2.87
5.O9
o.062
LO2
7;68
39L
28L
473
It07.84
383
3tB
584
0.37
0.22
6-305
0.075
J.B3
2.75
4.64
o.o62
0.46
0.r7
1.24r
0.071
J.4B
J.O1
5.3r
0.066DLo./Mb 0.060
{r tó2..""-r.mbar-r.t q-t)
a: from Gehr et al., L97Ba, excePt D
b: from Gehr et al., 1981b-Loz from b
That the sea Iion possesses large alveoli is reflected in the specific alveolar
surface area, which is closer to that for humans than for the other species (Table
ZI). Another indicator of alveolar diameter is the ratio St/Vp. The alveolar
diameter indices for several species are presented in Table 22' The index for the
sea lion is the same as that for man, which is the smallest index indicating the
largest alveoli. Alveolar diameter was not delermined in this study, but has been
measured in humans (Dunnill, L962; Weibel, 196Ð and in the california sea lion
and ofher otariid seals (Denison et al., L97I; Denison and Kooyman, I973)- In adult
humans the alveolar diameter has been estimated to be 25O-280 urn, whilst in
otariids it was estimated to be 200-250 ym. These results indicate that lhe alveoli
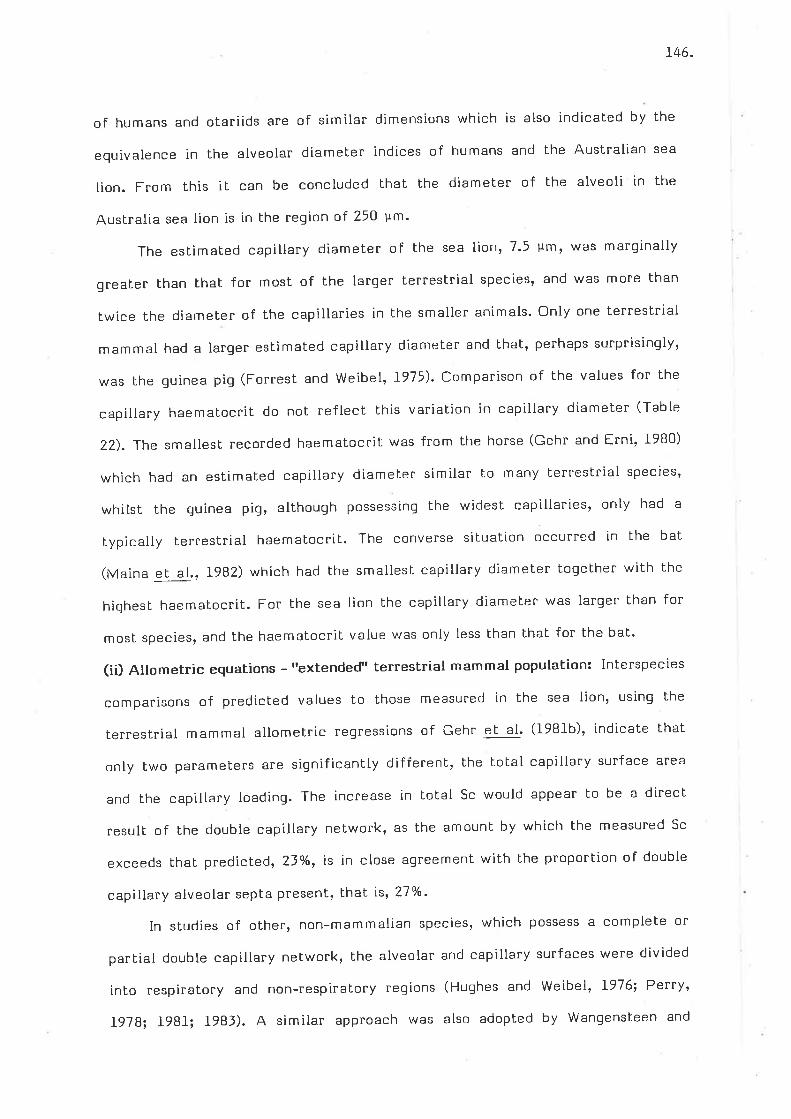
146.
of humans and otariids are of similar dimensions which is also indicated by the
equivalence in the alveolar diameter indices of humans and the Australian sea
lion. From this it can be concluded Lhat the diameter of the alveoli in the
Australia sea lion is in the region of 250 um'
The estimated capillary diameter of the sea lion,7.5 Pm' was marginally
greater than that for most of the larqer terrestrial species, and was more than
twice the diameter of the capillaries in lhe smaller animals. Only one terrestrial
mammal had a larger estimated capillary diameter and that, perhaps surprisinqly,
was the guinea pig (Forrest and Weibel, 1975). Comparison of the values for the
capillary haematocrit do not reflect this variation in capillary diameter (Table
ZZ). The smallest recorded haematocrit was from the horse (Gehr and Erni, I9B0)
which had an estimated capillary diameter similar lo many terrestrial species,
whilst the guinea pig, although possessing the widest capillaries, only had a
typically terrestrial haematocriL. The converse situation occurred in the bat
(Maina et al., I9B2) which had the smallest capillary diameter together with the
highesl haematocrit. For lhe sea lion the capillary diameter was larger than for
most species, and the haematocrit value was only less than that for the bat.
(ii) Atlometric equations - I'extended" terrestrial mammal population: Interspecies
comparisons of predicted values to those measured in the sea lion, using the
terrestrial mammal allometric regressions of Gehr -91-4' (198lb)' indicate that
only two parameters are significantly differenb, the tolal capillary surface area
and the capillary loading. The increase in total Sc would appear to be a direcl
resull of the double capillary network, as the amount by which the measured Sc
exceeds thal predicLedr 23To, is in close agreement with the proportion of double
capillary alveolar septa presenl, LhaL is, 27o/o'
In studies of other, non-mammalian species, which possess a complete or
partial double capillary nelwork, lhe alveolar and capillary surfaces were divided
info respirat,ory and non-respiralory regions (Hughes and weibel, I976; Perry,
f91B; J.981; l98l). A similar approach was also adopted by Wangensteen and
Table 22: Species comparison of alveolar diameter index, capillary diameter and haematocrit
shrew
bat
guinea pig
dog
horse
human
sea lion
Alveolar Diameter Index
(mmZlmml)
t0B
L2I57
6I63
t232
Capillary Diameter
( r,m)
4.r4
3.r5
8.10
7.O9
6.73
6.77
7.53
Haematocrit
o.466
o.6tro.499
o.46t
o.334
o.46
0.548
Source
from Gehr et al., 1980
from Main a et al., 1982
from Forrest and Weibel, 1975
from Gehr et al., I9BIa, b
from Gehr and Erni, 1980
from Gehr et al., I978a
this study
tsN{
148.
Weibel (f982) in their morphometric study of gas exchange in the avian egg. The
respiratory regions were generally def ined as those parts of t'he alveolar and
capillary surfaces which formed an air-blood barrier and contributed to gas
exchange. The non-respiratory regions were the remaining portions of each
surface which do not assist in gas exchange.
In most morphometric studies of mammalian lungs all of [he alveolar and
capillary surfaces were considered lo be respiratory. This assumption was also
made al the outset of this study because the proportion of the double capillary
septa and the extent (volume proportion) of the thicker septa were unknown.
However, the effective capillary surface area in the sea lion can be approximated
by excluding those portions of the capillary surf ace which abutt the cenLral
connective lissue core of the double capillary alveolar septa and the interacinar
and interlobular septa as these do not form part of the air-blood barrier. Since
ZJo/o of the alveolar septa contained a double capillary network and almost31o/o of
the respiratory tissue volume consisted of interacinar and interlobular septa, then
approximately half of the surface area of these capillaries is ineffective in gas
exchange; the effective Sc is then only about 7\o/o of the total. The correcled
values for the effective Sc of the four animals used in the species comparisons are
presented in Table 21. When compared to the predicted values, the effective Sc is
not significantly different (mean difference 23.87, SE I2.2J, t I.952), and lhe
mean sea lion value is in fact 14% less than that predicted. When the values for
the effective Sc are substituted inlo lhe calculation of DLO2,Lhe total diffusing
capacity is reduced by 5-B% (Table 23), and the corrected measured value for
OrO, is about lB% greater than predicted. No such correction is possible for the
alveolar surface area, so the mosb appropriate method to accurately estimate thist
and the Sc, would be to adopt an approach similar to thal of Huqhes and Weibel
(I916) and Perry (1978; J-981; 19Bl) where the surfaces are divided into respiratory
and non-respiratory components. No alteration was made to the capillary volume
since the binding of oxygen lo haemoglobin is considered lo involve the entire
r49.
erythrocyte volume contained within the capillaries (Wangensteen and Weibel,
r9B2).
Table 23= Elrective capillary surface area and correctedoxygen diffusing capacity for the Australian sea lion
effective Sc corrected OtO,
ml O2.sec-1.mb"r-lanimal
2m
2t
24
25
26
meanrSE
I2T.4
151.6
r52.4
l_60.4
146.45B.5B
3.249
5.693
4.440
3.7 64
4.2865o.5285
Associated with this increased Sc was a marked, but nob statistically sig-
nificant, increase in the capillary volume which was nearly 610/o greater than
predicted. This increase was not significant because of Lhe small sample size and
the large standard ertot of the mean of Lhe measured values. The Vc ranged from
2BZ ml up to 510 ml. This variability in the Vc reflects, in part, the variation of
the capillary haematocrit values which ranged from 0.474 LoO.673, with a mean of
0.548. A higher haematocrit indicates a grealer number of erythrocytes present
per unit volume which will tend to make lhe capillaries bulge more and hence
increase their volume. The extent of capillary bulging is also influenced by the
conditions prevailing during lung fixation (Section 4.4.2(b)). The mean and range of
haematocrit values measured morphomelrically are similar to the results recorded
from peripheral blood samples taken from a larger sample of adult female
Australian sea lions (Needham et al., L9B0). The mean from that study was 0.557
with a range from 0.481 to O.642. The resulls for the haemalocrit and the
capillary volume in the present study, therefore, appear to be realistic estimates
for this species.
The capillary surface area to alveolar surface area ratio for lhe Lotal Sc had
a mean of t.Ll5. This indicates bhat the tolal capillary sunface area was
150.
consistenEly greater than that of the alveoli, which is the reverse to thal found in
most terrestrial mammals. In terrestrial species Sc/Sa ranges from 0.7 in the
horse (Gehr and Erni, 1980; Gallivan, 19B1b) up to about 0.9 in the human (Gehr et
al., l978a) and a range of African mammals (Gehr et al., lg8fb). However, sub-
stitution of the effective Sc into this ratio results in a mean of 0.705' so thab the
effective capillary surface area is less than the total alveolar surface area. These
results for Sc/5a again reflect an increase in the lotal capillary surface area but
not in the effective surface area.
The alveolar surface area was 1l-70 less than that predicted but was not
statistically significant. Tenney and Remmers (I96J) reported that marine
mammals have a reduced alveolar surface area when compared to terrestrial
mammals. They concluded that this was largely due to [he large size of their
alveoli. The results of the present study are in agreement with those of Tenney
and Remmers in regard to bolh the reduced alveolar surface area and the large
alveoli (Section a.a.2(eXii)).
The reduction in alveolar surface area, together with the increase in
capillary volume, are also reflected in the capillary loading which was 78%
qreater than predicted. This is an index of the suitability of the parenchymal
lissue for gas exchange (Hughes and Weibel, I976) where a low ratio, Vc/Sa,
implies favourable conditions for gas exchange because of the high degree of
exposureofthecapillaryblood(Perry,]978).ThehighVc/Sainthesealion,
Z.IJ ml/m2 from animals A323-26 only, indicates thal the parenchyma is slightly
less specialized for gas exchange than that of terrestrial mammals where the
values are generally in the ranqe I.L to l.l m Ilm2. The only species from the
ilextended" population of Gehr gl_4. (l981b) which were found to have a capillary
loading similar to thal of the sea lion, were the domesticated bovine species in
which Vc/Sa ranged from l.B2 to 2.25 mtl^2. From the allometric regression
equation for the capillary loading of the "extended" population (Gehr et al.,
lgBlb), the increased result for the sea lion was found lo be significanLly different
at the 5o/o level.

t5 1.
Despite this increased capillary loading, the specific capillary volume of
5.10 ml/kg for the sea lion is similar to lhat for terrestrial mammals of similar
body mass (Table 2l). Therefore lhe double capillary nelwork may represent a
compensation for the decreased proportion of parenchyma in the lung so that the
total capillary volume present is similar to lhat in terrestrial species, and thus
maintains a comparable specific diffusing capacity'
More recently, in studying the lungs of various reptiles, Perry (1981) has
used the reciprocal of the capillary loading to evaluate the degree of specializa-
tion. This ratio, Sqq/Vc, where 54p is the respiratory portion of the lung surface,
implies that a large surface-to-volume ratio in the capillaries is beneficial to gas
exchange. In comparing his results with those for various species, Perry found the
rat, as the representative mammal, to have the highest value, 8.2 cmzlcnl' Th"
species with the Iowest ratio were those which have a complete double capillary
network in lheir lungs. These were the turtle and the lungfish with values of aboul
0.8 cmZl"^3. The reptiles, with a mixed type of lung, had inlermediate values of
3-4 cmZlcrJ. In the sea lion, also with an intermediate lung type, S4p/Vc was
4.-l cmilcm2. Ho*"u"r, in calculating the value for lhe rat, Perry assumed 100%
of the alveolar surface to be respiratoryr âs was done for the sea lion. This
assumption results in a slighl overestimation of the respiratory surface area in the
sea lion, so that the true SO*/Vc value would be even closer to thal for the
reptiles.
The measured lung volume, although not significanlly different, was found to
be approximately 50% greaber than predicted. This increase in the lung volume has
been observed in other marine mammals (Slijper, L962; Tenney and Remmers,
1963 Kooyman, L97t). Slijper (196Ð found a similar increase in the lung volume of
the smallen toothed whales, whilst Kooyman (I973) found marine mammal lungs
generally to be slightly larger than those of terrestrial mammals. Kooyman (L973)
presenled an allometric prediclion equation for marine mammal lung volumes;
when the mean weight of the Australian sea lion was substituted into this
152.
equation, the predicted lung volume was very similar to the mean value recorded
in this study.
The net result of these differences in the morphometric parameters of lhe
sea lion was an increase in the oxygen diffusing capacity. The mean D¡gr, using
the effective capillary surface alear for the four sea lions was
4.287 mI O2/sec.mbar which was 18% greater than predicted but this was not
found to be statisticalty significant. When the diffusing capaciby is broken down
into the values for each of lhe three componenbs from the model, then the con-
tribution of each can be appreciated (Table 24). Also included in the table are the
values for the membrane diffusing capacity, D¡yr which represents the combined
contribution of the lissue and plasma layers.
Table 242 Oxygen conductance values for individual components of themormphometric model for estimating the oxygen diffusion capacity
Dt Dp D M-l -l
Deanim al
m I O2.sec .mbar
oao,
23
24
25
26
meanrSE
9.366
14.LZL
ro.5J6
t2.525
IL.6J7OI.0539
87.t93
257.655
78.146
89.894
L28.222043.2174
8.458
13.381
9.284
I0.99J
t0.51051.0887
5.275
9.905
8.509
5.724
7.35J)1. r_111
3.249
5.69J
4.440
t.7 64
4.2865o.5285
From Tabte 24 it can be seen that 02 conductance is most rapid within the
plasma layer and slowest within the erythrocytes. The high conductance of the
plasma layer is primarily a result of the very small plasma harmonic mean thick-
ness, which for the four animals considered here had an avelage value of
0.089 um. This thp is similar to lhe smallest measured in terrestrial mammals,
from several species of shrew (Gehr et al', l9B0)' The small thp in lhe sea lion
resulls from the large capillary volume and the associated high haemaLocrit. The
high haematocrit means that a large proportion of the erythrocytes will lie close
lo the capiltary surface and so reduce the thickness of the plasma layer.
r53.
The tissue barrier conductance is markedly less than that of lhe plasma,
largely due to the tissue harmonic mean thickness. The average tht for these four
animals was 0.589 um, an order of magnilude greater than that for plasma, similar
[o the difference between the average tissue and plasma conductances (Table 24).
The conductance of the erythrocytes, as the slowest, is the rate limiting
step in the overall diffusing capacity. The rate of O2 uptake by whole blood, which
is required for calculation of De, has only been reliably determined in humans
(Holland et al., 1977). As the size of erythrocytes in mosL terrestrial species is
similar and shows no correlalion with body mass, the human value has generally
been used in morphometric studies (Gehr et al., lgBlb). Whether this uptake rate
is appropriate for marine mammals is not known; therefore the human value has
been used here since it at least allows for comparisons between the sea lions and
other species.
In regard to the overall diffusing capaciby of the sea lion lung, the increase
above that predicted for a terrestrial mammal of similar body mass results from
an increase in the capitlary volume and a high haematocrit. The effect of these
two factors is important to the erythrocyte conductance for 02 but both also
contributes to the reduced plasma harmonic mean thickness and consequently to
the high plasma conductance.
4.5 SUMMARY
The mean total lung volume of lhe five animals studied was 6.34 L of which
lI.5Yo was true parenchyma. Of this true parenchyma I3.7 7o wâs respiralory
tissue. The alveolar surface area was 171.I t2, th" total capillary surface area
I9J.6 r2, th" capillary volume )50.3 ml, bhe tissue harmonic mean thickness
0.59 ¡rm, the plasma harmonic thickness 0.09 ym, the tissue arithmetic mean
thickness 3.43 ym, and the oxygen diffusing capacity 4.Il ml O2.sec-l.mbar-1.
There were significant regional differences in the interstiLial thickness and lhe
alveolar surface area. The alveolar septal interslitium was 22o/o gtea|er venlnally
154.
than dorsally, and 460/o greaLer posberiorly than anteriorly. The alveolar surface
area was about 2oo/o qtealer ventrally.
For the four animals whose results were compared to the predicted values
for the terrestrial species of sim ilar body weightr lwo parameters wete
significantly different. These were the capillary loading which was nearly B0%
greater than predicted, and the total capillary surface area whicl't was 23o/o
greater. However, the effective capillary surface area involved in gas exchange
was l-470 less lhan that predicted. Other parameters which were qrealer than
predicted included the lung volume, which was 50% greater, the capillary volume,
60% greater, and the tissue harmonic mean thickness, 147o greater. The alveolar
surface area was Ll% less than predicted. The total oxygen diffusing capacity was
260/o greater than predicted, but consideration of the effective capillary surface
area resulted in a diffusing capacity 18% greater than predicted.
155.
Chapter 5
PULMONARY PATHOLOGY
5.I INTRODUCTION
The occurfence of pulmonary disease in free-living and captive pinnipeds is a
well recognized and common phenomenon (Daitey, L97O; Sweeney, I97Ð' Of the
two types of parasites which inhabit Lhe respiratory tract of pinnipeds, lhe pul-
monary nematodes often lead to death of the host (Johnston and Ridgway, 1969;
Dailey, I97O; Fleischman and Squire, I97O; Migaki et al., I97Ii Morales and
Helmboldt, I97I; Sweeney and Gilmartin, I974; Stroud and Dailey, I97B:' Stroud
and Roffe, IgTg), whilst the nasal mites, although commonly pnesent, are only of
minor significance clinically (Keyes, 1965; Kurochkin and Sobolewsky, I975;
Dunlap et al., 1976; Kim et al., 1980; Fay and Furman, I9B2). These parasiles
occur in both the Phocidae and lhe Otariidae, often being of t.he same genus bul
generally different sPecies.
The two groups of parasites which have been described from the respiratory
system of otariids are the lungworms of the genus Parafilaroides (Nematoda:
Metastrongytoidea), and the nasal and lung mites of the g enus Orthohalarachne
(Acarina: Halarchnidae). The recorded incidence and otariid host species for these
parasites are listed in Table 25. Of lhese species recorded, only O. altenuaLa has
previously been rep orted from N. cinerea (Domrow, I974)- The distribution of
lhese parasites in the Australian sea Iion is shown in Fig. 94'
5.2 RESULTS
5.2.1 Macroscopic
(a) vites
Two species of orthohalarachnid mites have been collected from all animals
examined, and identified as O. altenuata (Banks) and O. diminuala (Doetsch) (R.
Domrow, personal com munication) Of the O. attenuata examined only adult
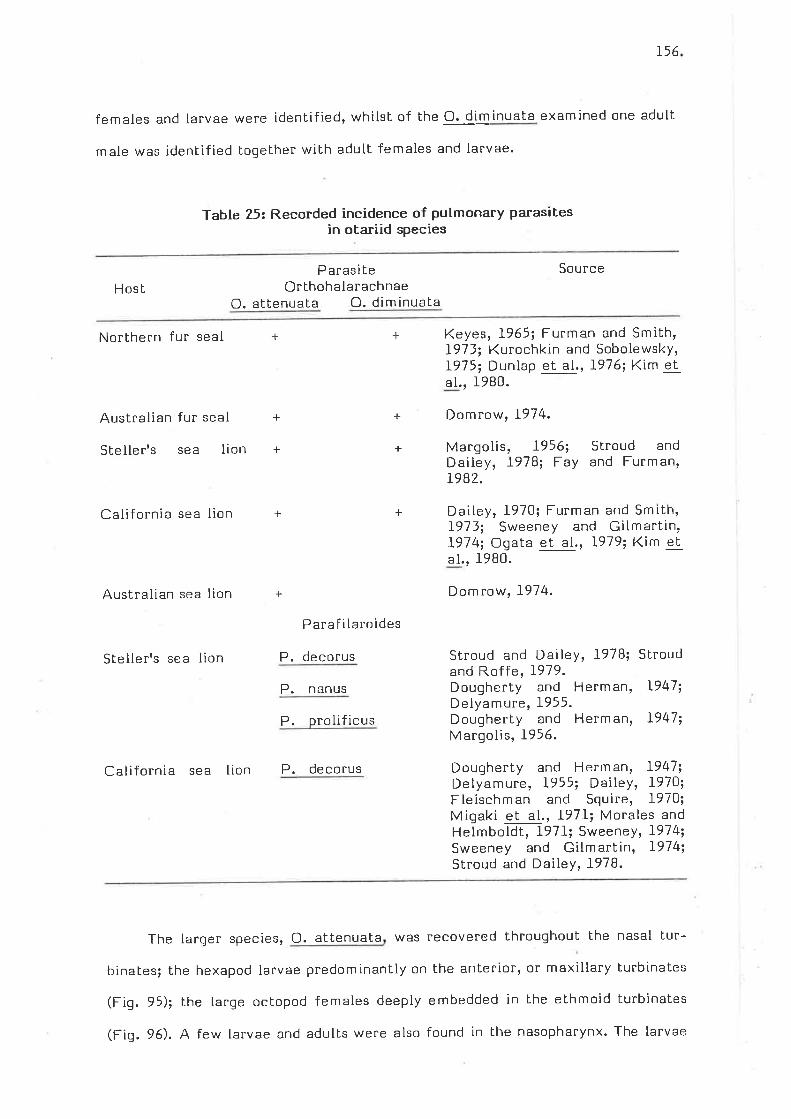
156
females and larvae were identified, whilst of lhe O. diminuata examined one adult
male was identif ied Logelher with adult females and larvae.
Table 25: Recorded incidence of pulmonary parasitesin otariid species
P arasiteOr bhoh alarach nae
O. attenuata O. diminuata
SourceHost
Northern fur seal +
Australian fur seal
Steller's sea lion
+ Keyes, 1965; Furman and Smith'I973; Kurochkin and SobolewskY,I975i Dunlap et al., I976; Kim etaI., J-980.
Domrow, I974.+
+
+
+
+
Margolis, I956;Dailey, I97B; layT982.
Slroud andand Furman,
California sea lion
Australian sea lion +
P araf ilaro ides
Stellerrs se a Iion P. decorus
P. nanus
P. prolificus
California sea lion P. decorus
Dailey, L97O; Furman and Smith'),973; Sweeney and Gilmartin,I974; Ogata el al., 1979; Kim etal., I980.
Domrow, I974.
Stroud and Dailey, I97B; Stroudand Roffe, 1,919.Dougherty and Herman, 1947;Delyamure, 1955.Dougherty and Herman, 1947;Margolis, I956.
Dougherty and Herman, 1947;Delyamure, 1955; Dailey, I97O;Fleischm an and Squire, I97O;Migaki et al., I97L; Morales andHelmbotdt, L97I1' Sweeney, I974;Sweeney and GilmarIin, I974;Stroud and Dailey, 1978.
+
The larqer species, O. attenuata was recovered throughout the nasal tur-
binales; the hexapod larvae predominantly on the anterior, or maxillary turbinates
(Fig.95); the large octopod females deeply embedded in the ethmoid turbinates
(Fiq. 96). A few larvae and adults were also found in lhe nasopharynx. The larvae
r57.
of the smaller species, O. diminuata were found in the nasal lurbinates (Fiq. 95),
nasopharynx and trachea (Fiq. 97), whilst the adulls were only recovered from the
f ixaLive collected from the lungs.
The live larvae collecled from the nasal turbinates of animal AS25 were
incubated in petri dishes containing a shallow layer of physiological saìine at room
temperature for variable periods of time up to )B days. Of the total of 15 live
larvae recovered, two were O. diminuata and ll were O. attenuata. Both O.
diminuata specimens died within 48 hours of incubation during which time one had
moulted to produce an octopod adult female. Only three of the O. attenuala
larvae moulted to become adult females. These started to moult between 3 and 6
days post incubation. No further evidence of moulting took place after B days'
incubation even though none of these adults had completely shed their cuticles.
Over the next two days these three adult females died. Four O. attenuala larvae
survived incubation for as long as 38 days but showed no signs of moulting. At no
stage were nymphal forms observed.
(b) Worms
On gross examination the lungs of all animals were apparently normal.
However, on close inspection a small number of creamish-white subpleural nodules
were found in all Iungs and section of the lung revealed a number of similar lesions
(Fiq. 9B). Some of these nodular lesions were found to contain adult worms (Fiqs.
99 and 100).
Specimens of adult females, an adult male and larvae which were recoveled
from bhe lung fixative have been preliminarily identified as a new species of
Paraf ilaroides (M.D. Dailey, personal communication). The basis for this tentative
identificalion is lhe very small size of mature wotms, parlicularly the male, when
compared to P. decorus which is lhe most common lungworm in the California sea
Iion (Dougherty and Herman, L947; Fleischman and Squire, I97O; Sweeney, 1972;
Sweeney and Gilmartin, 1974) and is also common in the Steller's sea lion (Stroud
and Dailey, I97B).
l5B
5.2.2 Microscopic
(a) Nasal turbinates
In the turbinates the larval mites were found on the mucosal surface, often
within a thick layer of mucus (Fiq. LOl), or deeply embedded in the mucosa (Fig'
102). The adull female O. aL,tenuata were generally found with their heads deeply
embedded in the mucosa with only their elongated, gravid opisthosoma protruding
into the lumen (Fiq. 96).
Where the mites had become deeply embedded in the mucosa there was
marked erosion and flattening of the epithelium, wilh minimal associated haemor-
rhage (Fiq. l-02). There was an inflammatory infiltrate into the lamina propria
often involving the periosteum of the bony trabeculae. This infiltrale was prin-
cipally mononuclear in cell type, with macrophages, lymphocytes and plasma cells.
The bony trabeculae showed areas of osleolysis adjacent to the mite wilh new
bone formation on the opposite surface (Fiq. f03). The cellular exudate surround-
ing the m ites was m ixed in type, consistinq of both m ononuclear cells and
neutrophils (Fig. 104). Intact areas of turbinate mucosa were covered, in part, by a
purulenl exudate characterised by polymorphonuclear cells and macrophages (Fig.
101).
(b) Nasopharynx and trachea
Larvae of both species of mile were found sitting on and embedded in the
epithelium of the nasopharynx and trachea (Fig. I05). The mites tended to flatten
the underlying epibhelium with some erosion and ulceration at the points of
attachment (Fiq. 107) and the feeding site (Fiq. 105). As a result of this ulceration
the mites were surrounded and covered by an exudate of mucust some red blood
cells, f ibrin and cellular debris (Figs. 106 and 107). The lam ina propria
immediately subjacent to the mites was thickened due to a heavy infiltrate of
mononuclear cells, particularly macrophages, some lymphocytes and plasma cells,
and many eosinophils (Figs. 107 and l0B).
I59.
(c) Lung
Intact adult worms, males and larviparous females, and larvae were
occasionally observed Iying free in the lung parenchyma (Figs. 109' 110 and l-ll).
The presence of these worms elicited either no obvious inflammatory response or
a minimal cellular reaction. This consisted of hypertrophy of the epithelial cells of
the alveolar septa, an exudate of plasma cells, small lymphocytest some macro-
phages and an occasional multinucleate gianl cell in the affecbed alveoli (Fig.
IL2). There was minimal involvement of the adjacenl alveolar septa (Figs. 109 and
l-l-2). Associated with this reaction was a variable amount of hyperaemia of nearby
blood vessels (Figs. l-09 and l-I0) and a predominantly lymphocytic inLerstitial
infiltrate of adjacent bronchi (Figs. lIl and lLl).
In the terminal and lobular bronchi the larvae caused an acute bronchitis
someLimes with an associated bronchopneumonia. The acute bronchitis was
characterized by an increase in mucus secretion, a fibrinous exudate with many
neutrophils and some macrophages (Figs. 114 and ll-5), and acute congestion of the
bronchial and surrounding alveolar vessels with a moderale interstitial infiltrate
of lymphocytes. The bronchopneumonia consisted of bronchi filled with inflam-
matory cells (Figs. 116 and 1l-7) as were many of the immediately neighbouring
alveolar structures (Fiq. I16). The bronchial interstitium was often heavily
infiltrated by tymphocytes (Fiq. 117). The pneumonic inflammatory response was
often centred around individual larvae or intact adult wotms (Figs. J.LB, ll9 and
L21). The cells involved were predominantly mononuclear, particularly Iympho-
cytes and macrophages with some plasma cells and multinucleate giant cells (Figs.
lL9 and I2l) with an occasional polymorphonuclear cell.
The intense pneumonic reaction often involved complete and adjacent acini
(Fig. I2l) or even compleL,e lobules (Fiq. 120) being contained by the interlobular
or inLeracinar septa. In some regions the reaction was so intense as to obliterate
the alveolar septa (Figs. 1lB, 119 and 121) or to even disrupt their integrity (Figs.
Il9 and I23). In other areas the inflammatory response had become purulent due
l_60.
to the degeneration and necrosis of the inflammatory cells (Fiq. I22). An
occasional larva was observed migrating through the perivascular tissue (Fiq. 124).
(d) Other pathology
In some ateas there was a marked acute hyperaemia of the vessels of whole
acini. This hyperaemia involved the vessels in the walls of the terminal airways
and all the alveolar walls; however, there was no fluid or cellular exudate into the
lumen nor was there any cellular infiltrate into the alveolar walls. Some bronchi
associated with these lesions were heavily infiltrated with lymphocytes, whilst
others showed apparent marked hyperplasia and hypertrophy of bronchial muscle
and had variable numbers of lymphocytes in their walls. A number of these lesions
were examined by exhaustive serial sectioning but no aetiological agent could be
identified. Occasionally an atelectic acinus was found in which the alveolar walls
appeared thickened and fibrotic, possibly the result of more proximal bronchial
obstruction.
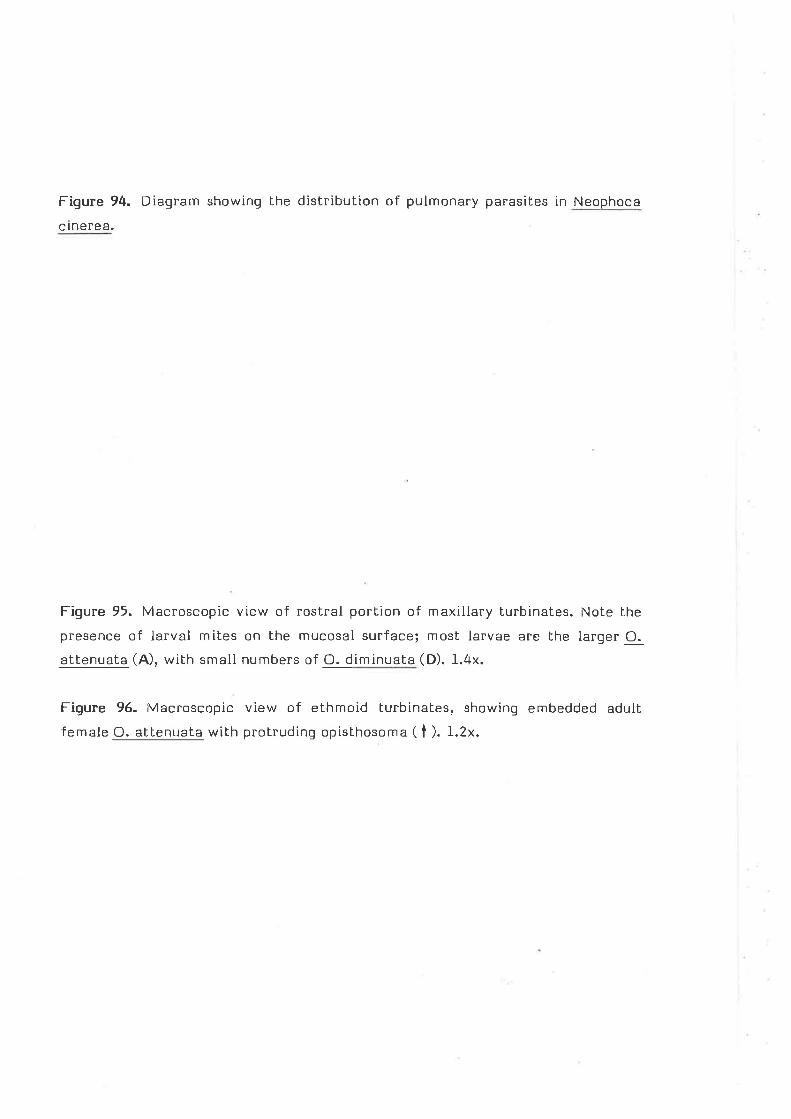
Figure 94- Diagram showing the distribution of pulmonary p
c tnerea.
arasites in Neophoca
Figure 95. Macroscopic view of rostral por[ion of maxillary turbinates. Note lhe
presence of larval mites on the mucosal surface; most larvae are Lhe larger O.
attenuata (A), with small numbers of O. diminuata (D). 1.4x.
Figure 96- Macroscopic view of ethmoid turbinates, showing embedded adult
f emale O. atlenuata with protruding opist,hosoma ( t ). 1.2x.
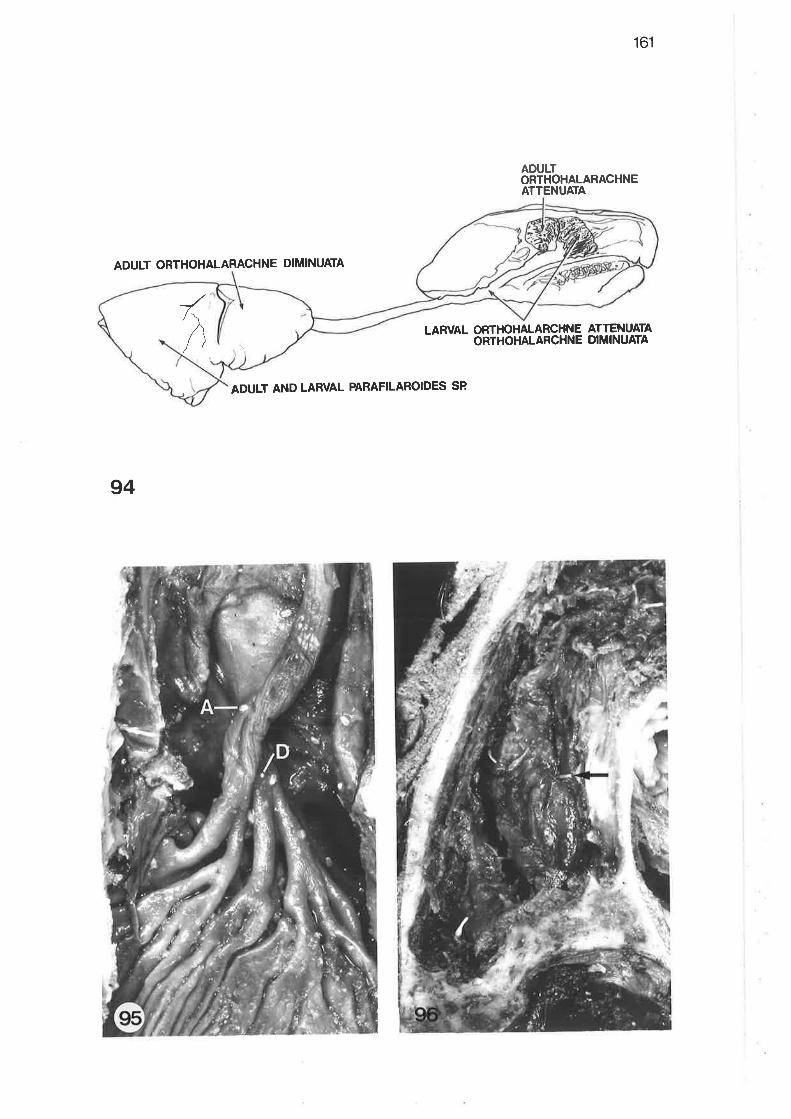
161
ADt,lLTORTHOHALARACHNEATTENUATA
ADULT ORTHOHALARACHNE DIMINUATA
,ÀLARVAL ORTHOHALARCHNE ATTENUATA
ORTHOHALARCHNE DIMINUATA
ADULT AND LARVAL PARAFILAROIDES SP
94
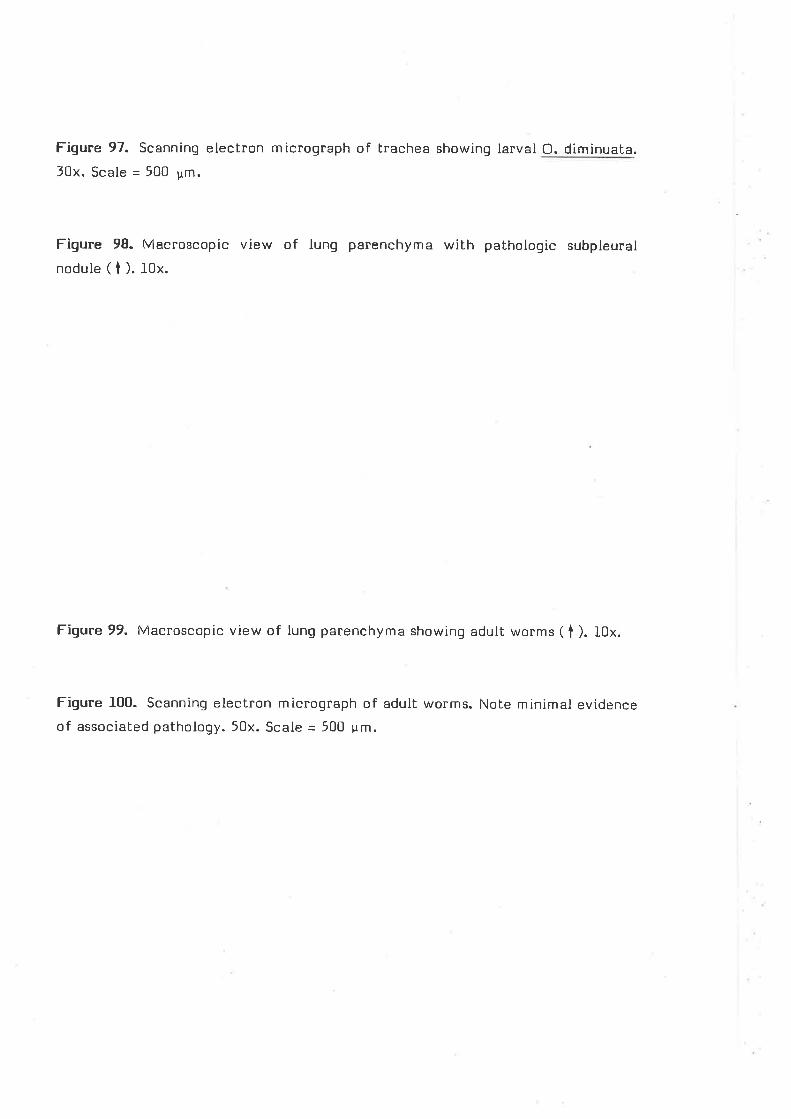
Figure 97. Scanning electron m icrograph of trachea showing larval O. diminuata.
f[x. Scale = 500 Um.
Figure 98. Maeroscopic view of lung parenchyma with pathologic subpleural
nodule(t).fOx.
Figure 99. Macroscopic view of lung parenchyma showing adult worms ( t ). 10x.
Figure 100. Scanning eleclron micrograph of adult worms. Note minimal evidence
of assoeiated pathology. 50x. Scale - 500 ym.
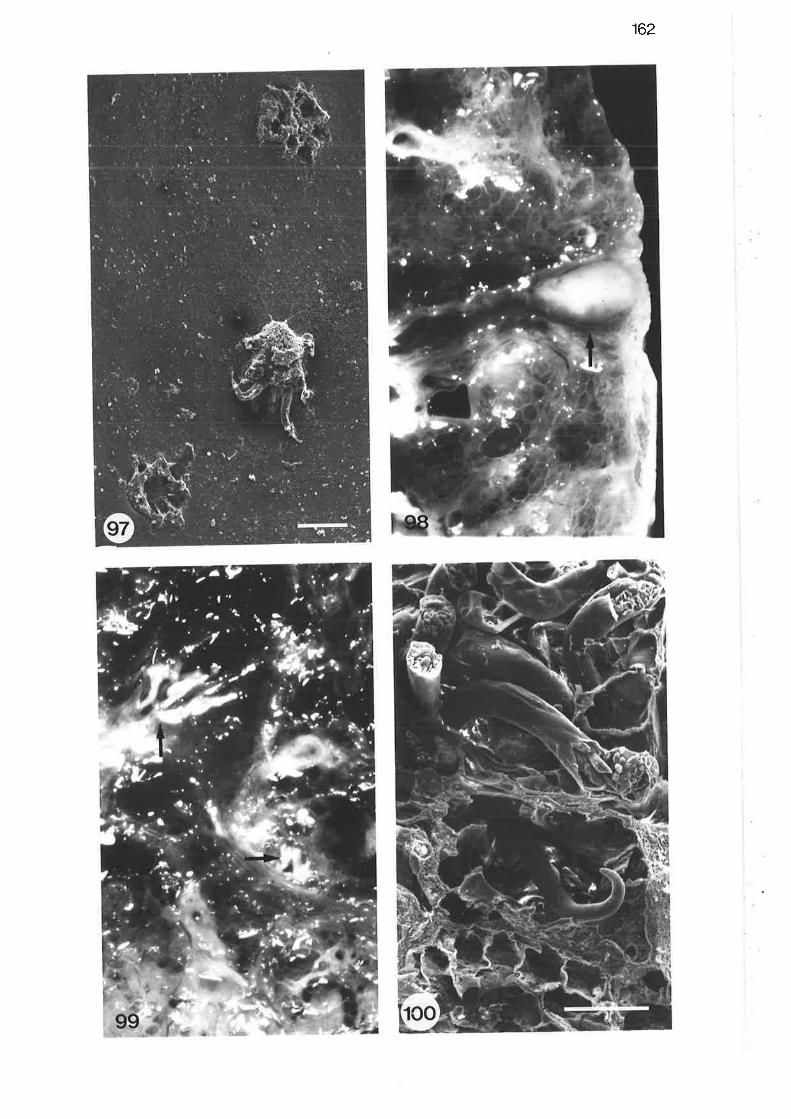
162
I
)sa
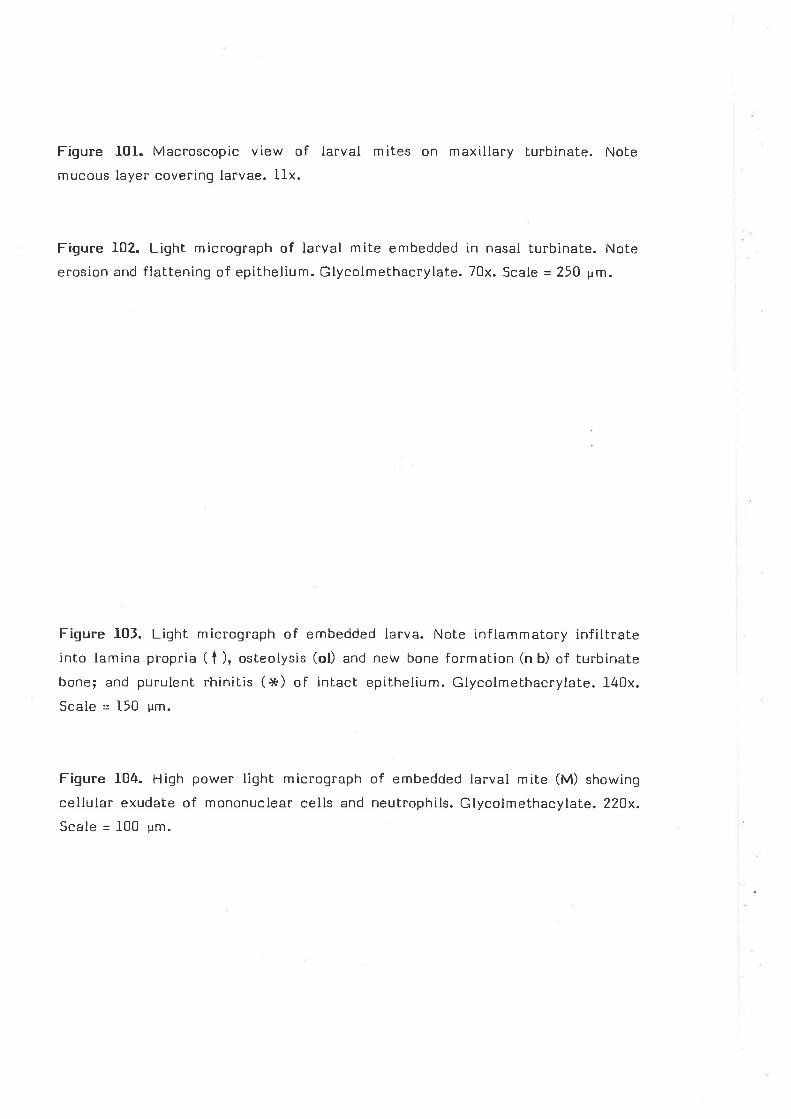
Figure LOI. Macroscopic view of larval mites on maxillary turbinate. Nole
mucous layer covering larvae. llx.
Figure J.02. Light micrograph of larval mite embedded in nasal turbinate. Note
erosion and flattening of epithelium. Glycolmelhacrylale. 70x. Scale = 250 um.
Figure I03. Light micrograph of embedded larva. Note inflammatory infiltrateinto lamina propria ( t ), osteolysis (ol) and new bone formation (n b) of turbinatebone; and purulenl rhinitis (x) of inlact epithelium. Glycolmethacrylate. 140x.
Scale = l-50 Um.
Figure 104. High power light micrograph of embedded larval mite (M) showing
cellular exudate of mononuclear cells and neutrophils. Glycolmelhacylate. 220x.
Scale = L00 Um.
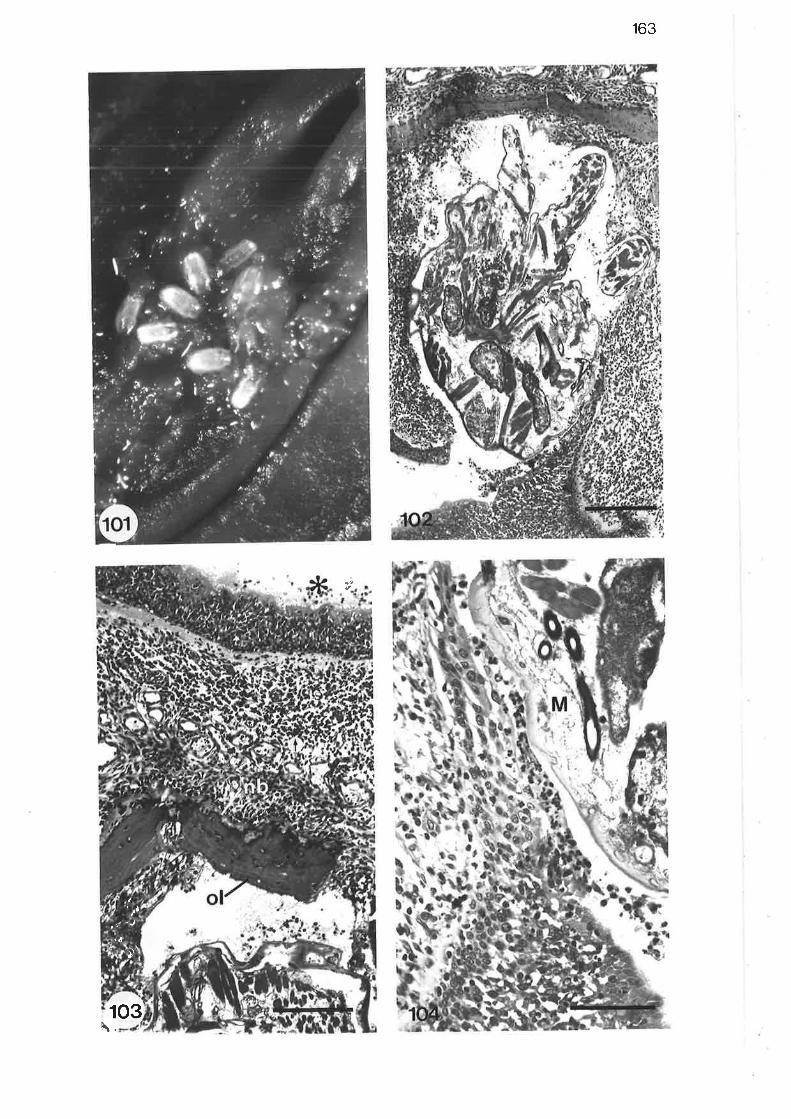
163
¿'
"lt-ã
103\,
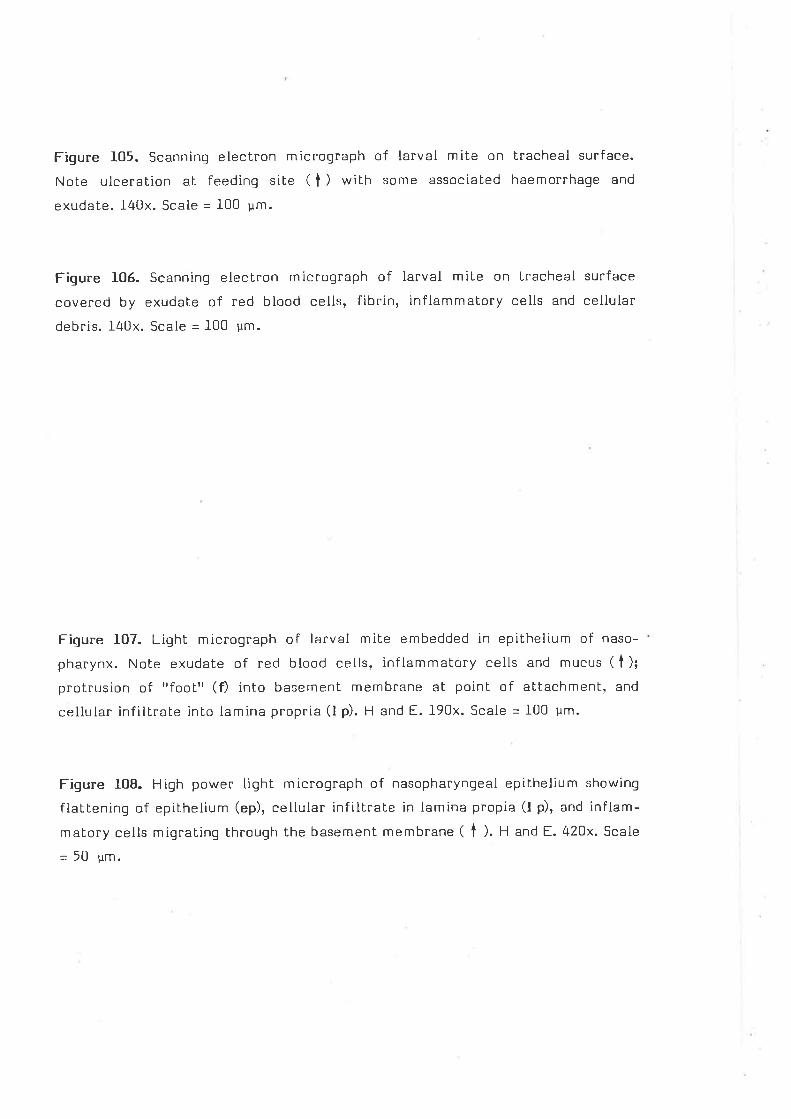
Figure 105. Scanning electron micrograph of larval mite on
Nole ulceration at feeding siLe ( t ) with some associated
exudate. 140x. Scale = 100 um.
tracheal surface.
haemorrhage and
Figure 106. Scanning electron micrograph of larval mibe on tracheal surface
covered by exudate of red blood cells, fibrin, inflammatory cells and cellular
debris. l_40x. Scale = 100 um.
Figure 107. Light micrograph of larval mite embedded in epithelium of naso-
pharynx. Note exudate of ned blood cells, inflammatory cells and mucus ( t );protrusion of "fool" (f) into basement membrane at point of altachment, and
cellular infiltrale into lamina propria (l p). H and E. 190x. Scale - 100 um.
Figure 108. High power light micrograph of nasopharyngeal epithelium showing
flattening of epithelium (ep), cellular infiltrale in lamina propia (t p), and inflam-
matory cells miqraling through the basement membrane ( t l. H and E. 42Ox. Scale
- 50 pm.
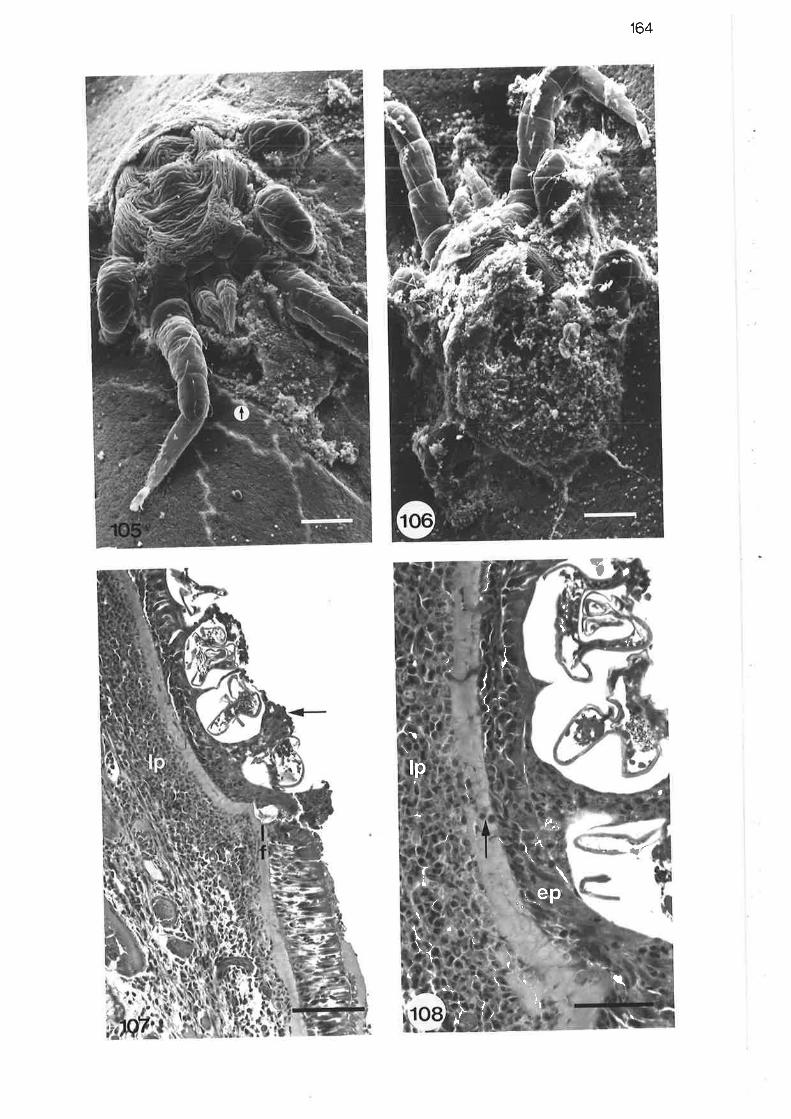
T
164
*''
(a
I
a'
ìI
t
r;,
t
i
I
a
\(i
a
\ fi"l
¡
t-
lp
,ì'\r
\
\',{
I
I(')
\.'_ep
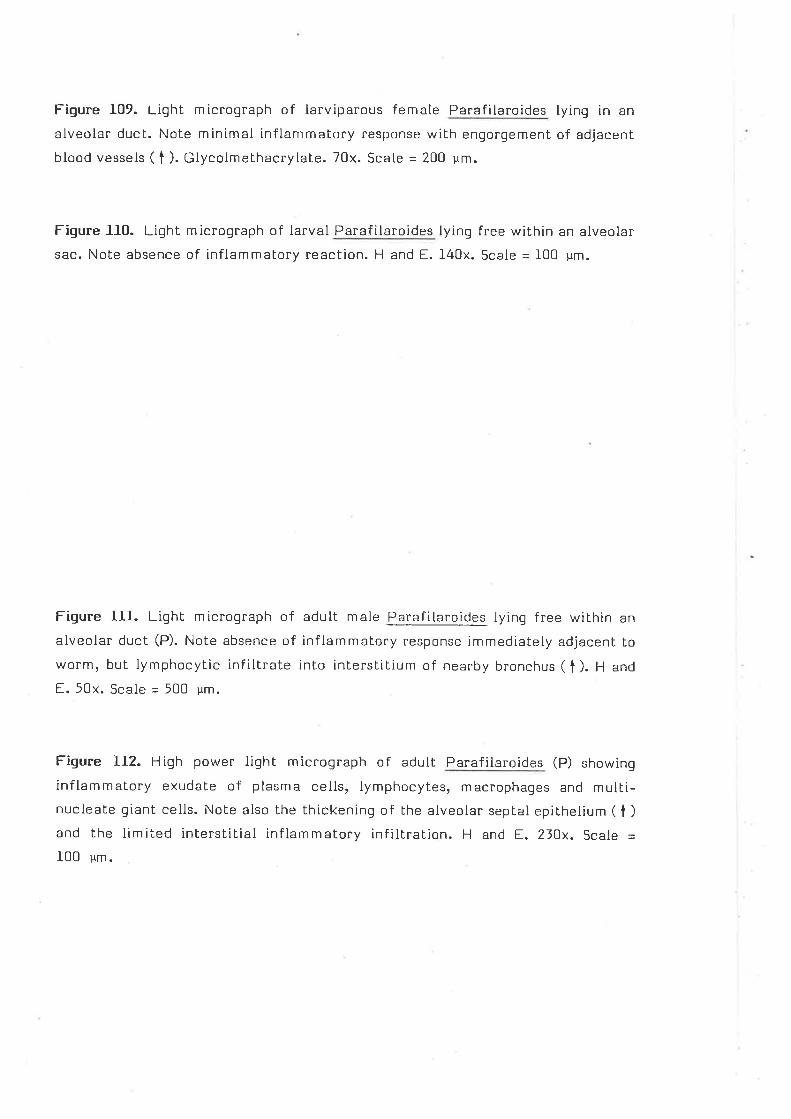
Figure J.09. Light micrograph of larviparous female Parafilaroides Iyrng ln an
alveolar ducl. Note minimal inf lammatory response wilh engorgement of adjacenl
blood vessels ( t ). Gtycolmethacrytate. 70x. Scale = 200 um.
Figure J-I0. Light micrograph of larval Paraf ilaroides Iying free within an alveolar
sac. Note absence of inflammatory reaction. H and E. 140x. Scale = l-00 um.
Figure IlI. Liqht micrograph of adult male Parafilaroides lying free within an
alveolar duct (P). Note absence of inflammatony response immediately adjacent to
worm, but lymphocytic infiltrale inlo interstitium of nearby bronchus ( t ). H an¿
E. 50x. Scale = 500 um.
Figure LIz. H iqh power light micrograph of adult Parafilaroides (P) showin g
inflammatory exudate of plasma cells, lymphocytes, macrophages and multi-nucleale giant cells. Note also the thickening of the alveolar septal epithelium ( t )
and the Iimiied inlerslitial inflammatory infillration. H and E. 23Ox. Scale =100 um.
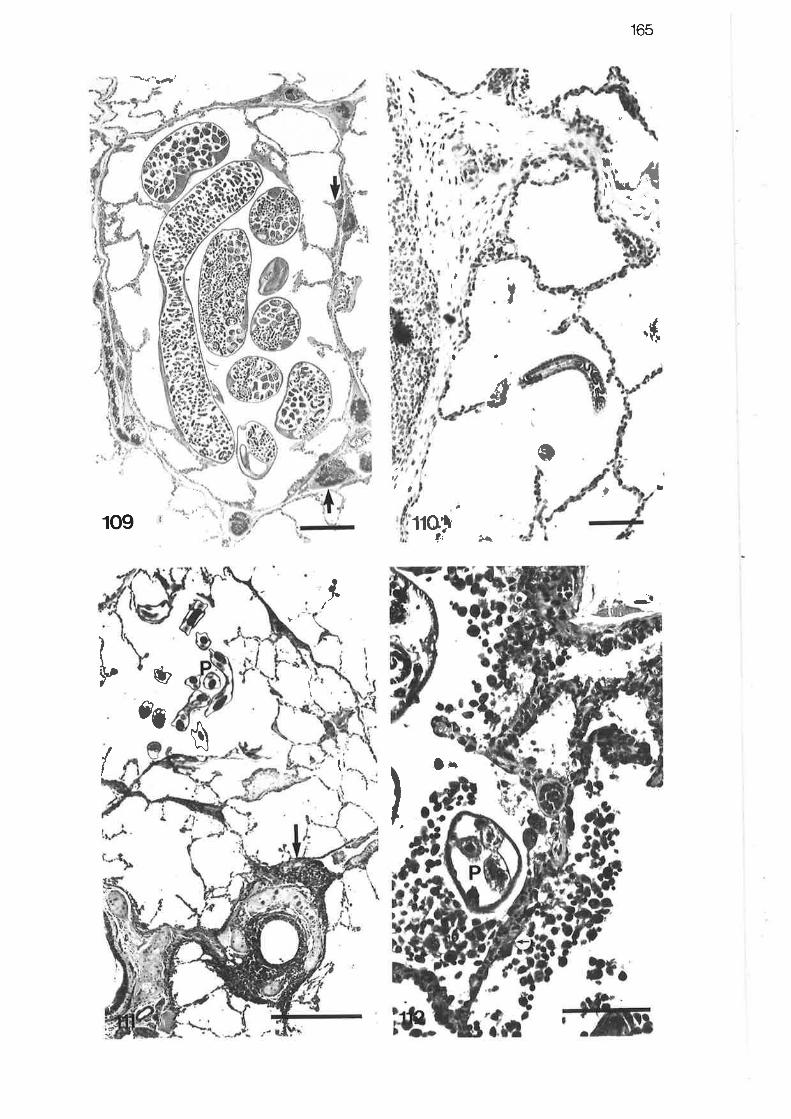
t
Or
g
165
-r
/4ì
J
t.\l'¡t\Ll.
t
t,
¡
.$,
¡Ð
I,,
11o!ît
109å.-
t
I
\t
3gtII
ûI
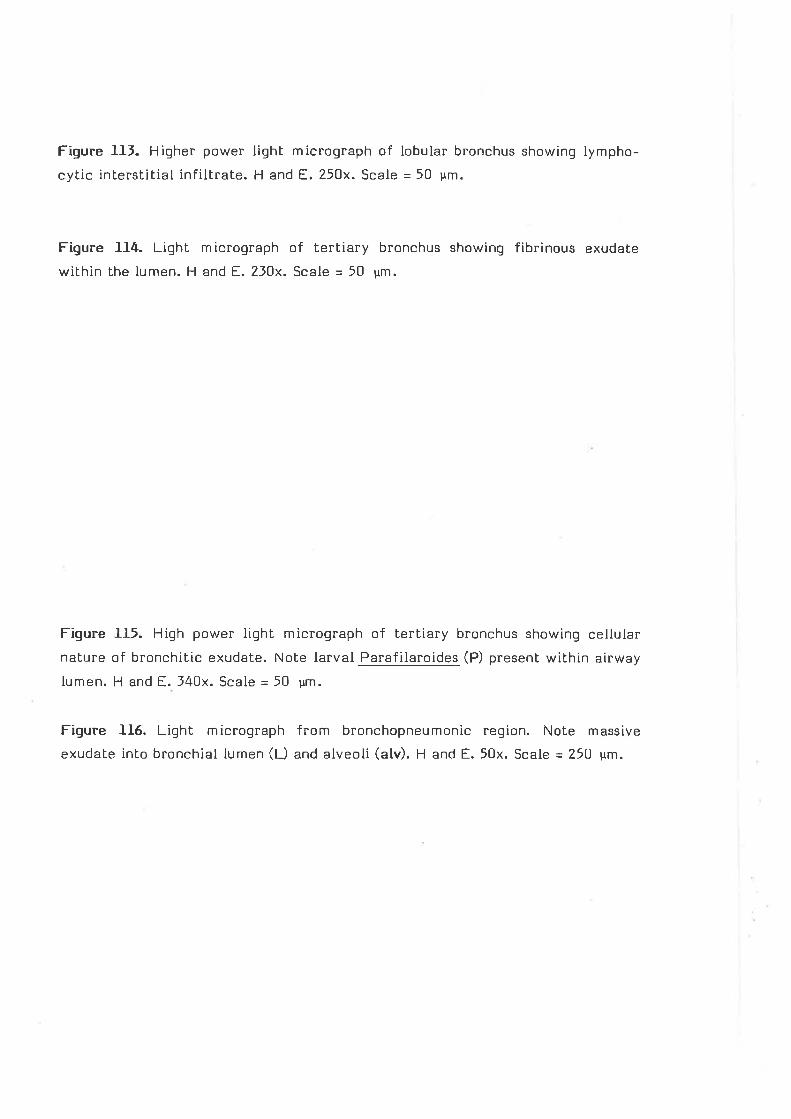
Figure tll. Higher power light micrograph of lobular bronchus showing lympho-
cytic interstitial infiltrate. H and E. 250x. Scale = 50 um.
Figure 114. Light micrograph of tertiary bronchus showing fibrinous exudale
within Lhe lumen. H and E. 23Ox. Scale - 50 ym.
Figure J-I5. High power light micrograph of tertiary bronchus showing cellularnature of bronchitic exudate. Note larval Parafilaroides (P) present within airway
lumen. H and E. 140x. Scale = 50 um.
Figure Ll6. Light micrograph frorn bronchopneumonic region. Note massive
exudate into bronchial lumen (Ð and alveoli (alv). H and E.50x. Scale = 250 um.
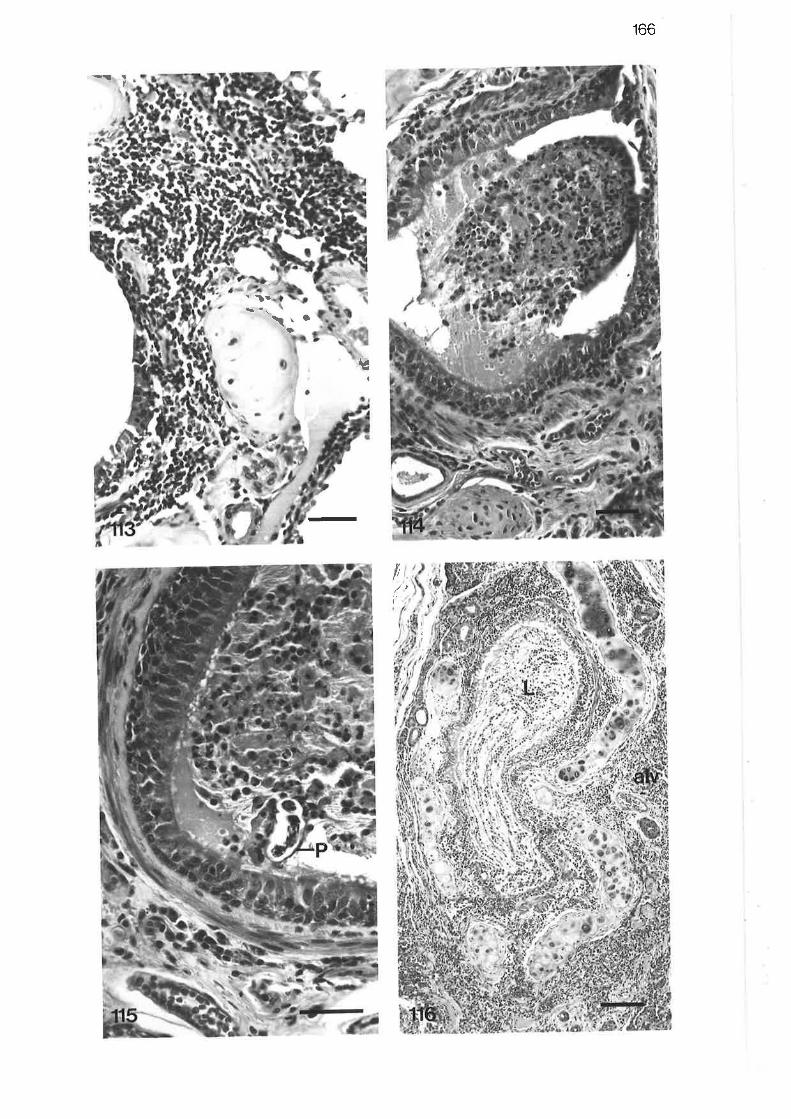
(o(or
È-\._._
¡r',
a')/a/?t,l
II
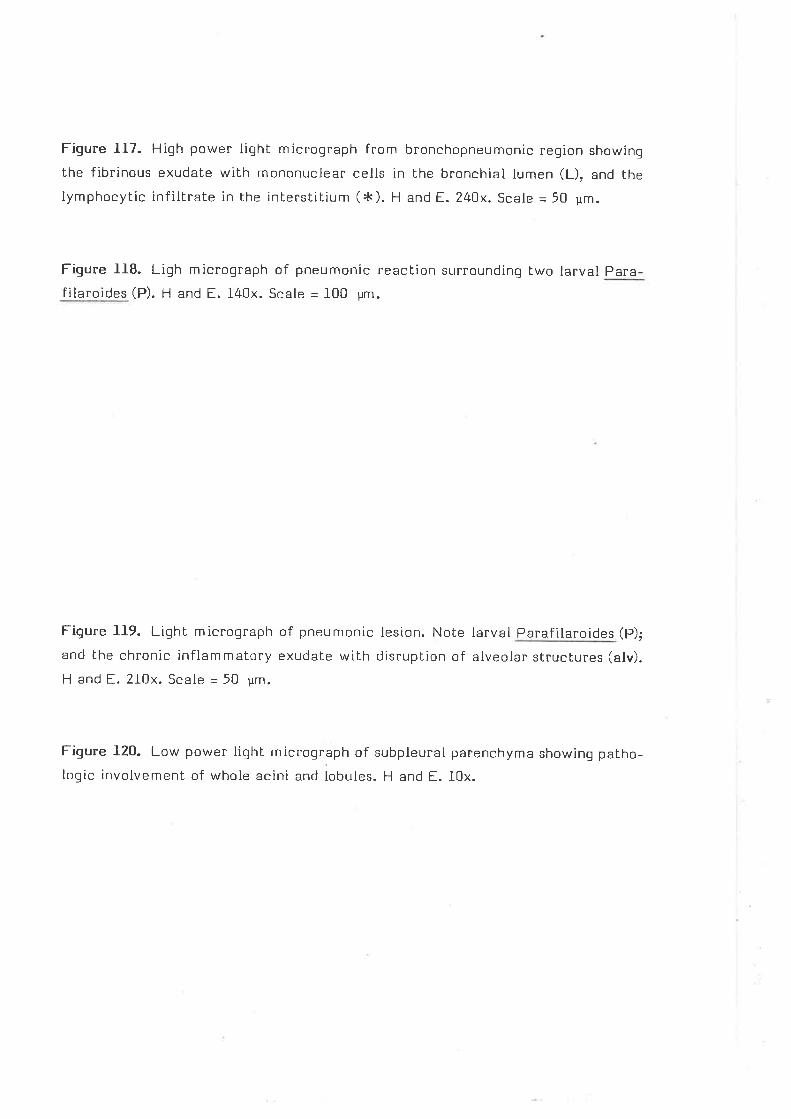
Figure ll7. High power light micrograph fnom bronchopneumonic region showing
the fibrinous exudate with mononuclear cells in the bronchial lumen (L), and the
lymphocytic infiltrate in the inlerstitium ({c). H and E.240x. Scale = 50 pm.
Figure ll8. Ligh micrograph of pneumonic reaction sumounding two larval Para-filaroides (P). H and E. 140x. Scale = 100 pm.
Figure 119. Light microqraph of pneumonic lesion. NoLe larval Parafilaroides (P);
and the chronic inflammatory exudate with disruplion of alveolar structures (alv).
H and E. 210x. Scale - 50 ¡rm.
Figure 120. Low power light micrograph of subpleural parenchyma showing patho-logic involvement of whole acini and lobules. H and E. lOx.
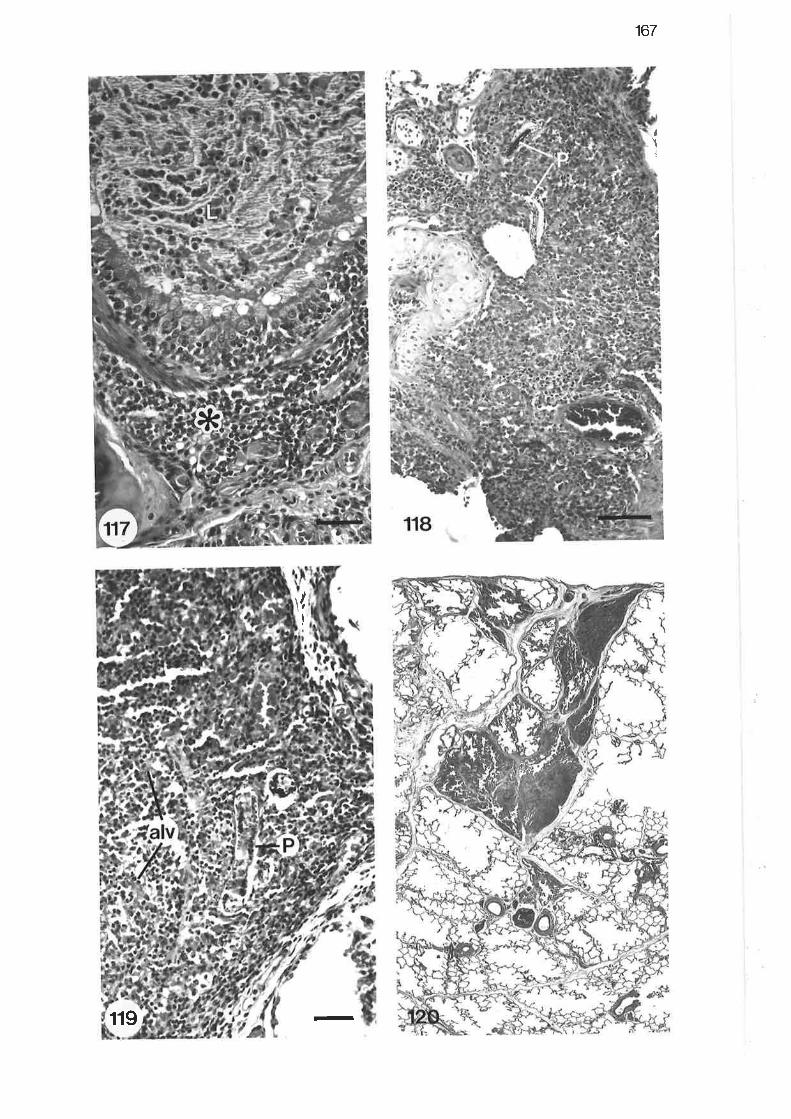
167
a\
\II
119
-
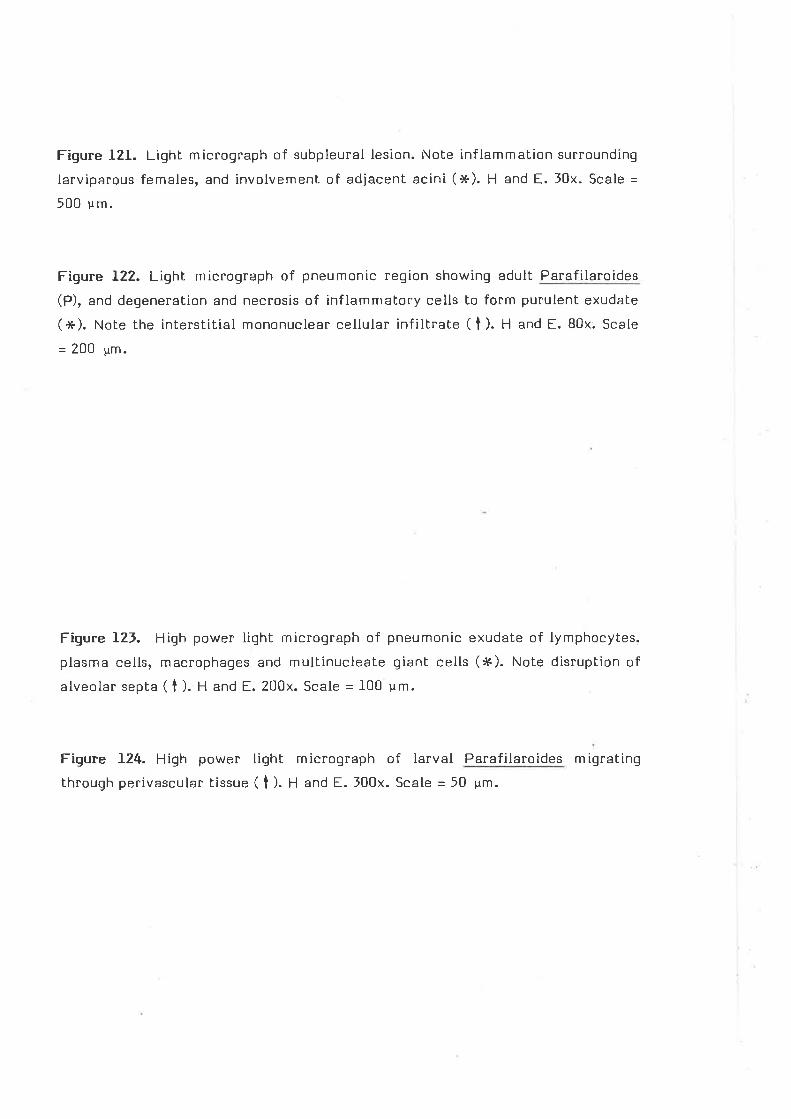
Figure l2ì-. Liqht micrograph of subpleural lesion. Note inflammation surrounding
larviparous females, and involvement of adjacent acini (åç). H and E. JOx. Scale =
500 um.
Figure 122. Liqht micrograph of pneumonic region showing adult Parafilaroides
(P), and degeneralion and necrosis of inflammatory cells to form purulent exudate
(x). Note the interstitial mononuclear cellular infiltrate ( t ). H and E. B0x. Scale
- 200 ym.
Figure I25. High power light micrograph of pneumonic exudate of lymphocytes.
plasma cells, macrophages and multinucleate giant cells (#). Note disruption of
alveolar septa ( t ). U and E. 200x. Scale - 100 um.
Figure L24. High power liqht micrograph of larval Parafilaroides m igrating
through perivascular tissue ( t ). H and E. 100x. Scale = 50 um.
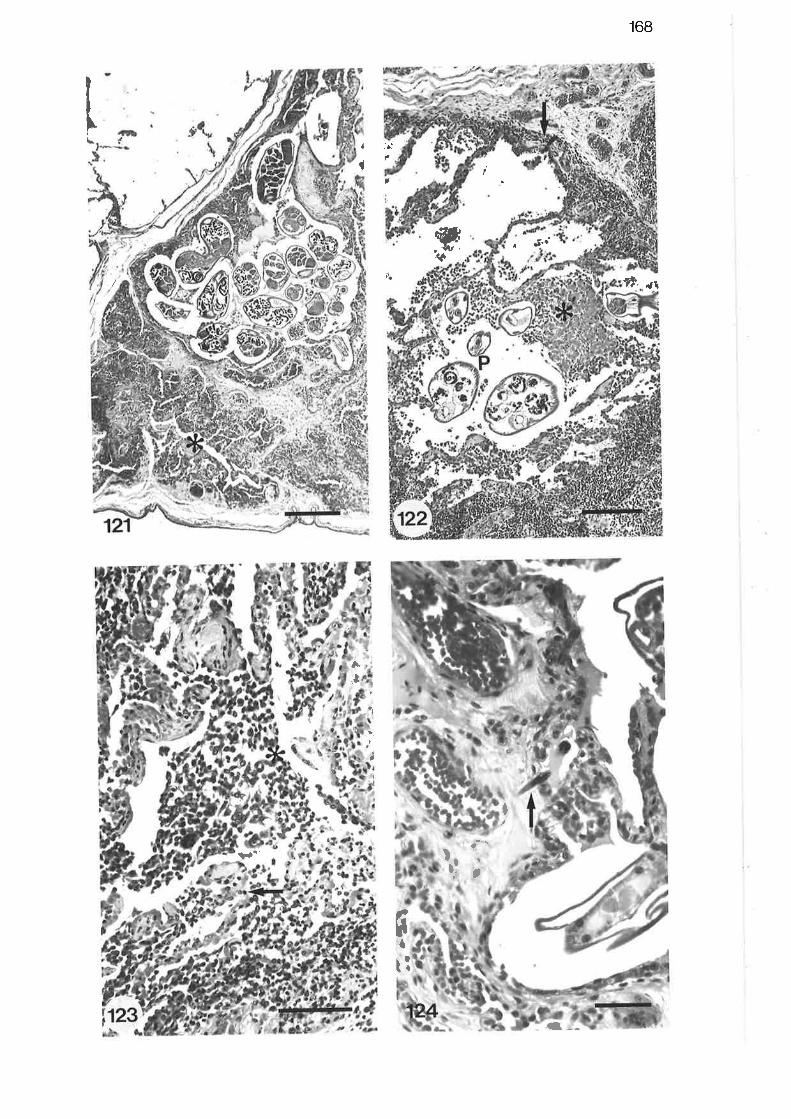
I Jí"''
168
â. r1
:ò'I
t I)
vl¡
,f\¡
I
J
I
aI
tt¡ìa"'
na
ì:
(¡ --
r69
5.3 DISCUSSION
5.f-l In vitro Development
The in vitro development of larvae of bolh species occurted more rapidly
than described by Furman and Smith (L971). This may possibly have been due to
the extended time from capture of the host animal to the examination of the
skutl. Neither probonymphal nor deutonymphal octopod instars were noled during
the rapid developmenl of either species.
5.3.2 Pathology
(a) Mites
The lesions in the nasal cavities and nasopharynx associated with the mites
were essentially the same as those described previously in other otariids
(Kurochkin and Sobolewsky, I975; Dunlap et al., )'976; Kim et al., 1980; Fay and
Furm an, I9B2).
The distribution of larval mites was similar to that described in other
otariids (Dunlap et al., L976; Kim et al., 1980; Fay and Furman, 1982). Most adult
females of O. attenuata were found embedded deep within the eLhmoid turbinates,
whilst only very few were found in the nasopharynx, the preferred habitat in olher
host species (Dunlap et al., I976; Kim et al., 1980). Further detailed inspection of
the mites to delermine the numbers present in each Iocalion was not undertaken.
No mites were found associaled with any parenchymal lesions and the most
distally situated mites observed were in the terminal bronchi. However, some of
the lesions in the parenchyma, with no apparent aetiology, were similar to those
described for lunq mite infestation in OId World monkeys (Kim, 1977; 1980).
Despite this, until an adult O. diminuata is demonstrated within a parenchymal
Iesion it can only be speculated that those recovered from lhe lung washings were
responsible for these, ot anyr lesions.
(b) Worms
Fatal verm inous pneu monia as a consquence of inf estation with Para-
filaroides spp in young otariid seals has been well documenled (Fleischman and

170.
Squire, L97O; Dailey, L97O; Migaki et al., L97L; Morales and Helmboldt, l97J-;
Sweeney and Gilmartin, 1974; Stroud and Dailey, I97B; Slroud and Roffe, 1979). It
has been suggesled that the mosl severe lesions of the verminous pneumonia are
the result of a hypersensitivity reaction in response to dead or degeneraling adull
worms. This was indicated by the observation that the most severe reaction often
surrounds degeneraLing adults and that these lesions contain many eosinophils
(Fleischman and squire, L97o; Migaki et al', 1971)' A pronounced inflammatory
reaction has also been observed in response to the presence of intacL larvae in the
airways and parenchyma (Fleischman and Squire, L97O; Morales and Helmboldt,
1971). In terrestrial species an intense mixed cellular inflammatory reaction
occurs in the lung in response to the migratory phase of larval nematodes regard-
less of whether or not lhe adult predeliction si[e is in the lungs (Jubb and
Kennedy, I97O; Smith et al., I972; Leid and Williams, I979).In the present study
at intense reaction was observed bolh in relation to the larvae and to the intact
adult worms. However, those adults surrounded by an inflammalory response wele
generally larviporous females so that the reaction may have been to lhe presence
of newly released larvae rather lhan to the adults. If this were in fact the case
then the observed response would be more in line with lhat reporled for olher
otariids (Fleischman and Squire, I97O; Migaki eL al., I97I; Morales and Helmboldt,
L97l).
In other olariid species the strong immunological reaction to the worms
would appear to be importanl in limiting the infection rate in older animals
(Morales and Helmbotdt, 197I; Stroud and Dailey, 1978) and to even resull in
voiding the host of these parasites by about four years of age (Sweeney, I974;
Sweeney and Gilmartin, L91Ð. This is supported by the results of a survey of 5l
stranded California sea Iions in which lungworms were most prevalenL in lhe l5 to
20 month-old age group (Sweeney and Gilmartin, l97lr). However, in contrasb to
this, a smaller survey of adull California sea lions found Iungworms [o be present
in eighl of eleven animals examined (Fleischman and Squire, 1970). Four of the
17 l.
sp ecimens of Neoph oca exam ined in the present study were adult breeding
females, whilsl the fifth animal was an immature female. All five of these
animals were found lo be infected with lungworms, so despite an immunological
reaction to the presence of lhe worms, it would appear that in those animals
examined it was insufficient to rid them of these parasites but at the same time it
may well have limited the degree lo which the hosts became infested. Within the
infecLed animals, the distribution of the disease may also have been limited by the
presence of the interacinar and interlobular septa. These septa would tend to
contain the parasites within individual acini or lobules as well as limit the spread
of the inflammatory cells and exudate as the presence of these septa precludes
any channels for collateral ventilation between adjacent parenchymal units.
The specimens of Neophoca examined in this study were all apparently
healthy ab the time of capture. Some animals in the local populations did,
however, show several of the symptoms observed in infected California sea lions
(Fleischman and Squire, L97O; Sweeney, I974; Ogata et al., I919). These included
sneezing, "coughing", and the discharge of tenacious phlegm, but none of the more
severe symptoms found in moribund, infected animals. Thus it would appear lhat
the presence of orthohalarachnid mites and Parafilaroides worms are of minor
consequence generally, but may be important in younger animals or during times
of stress such as diving when the full respiratory capacity may be required.
The presence of mites, together with the associated inf lammalory response,
in the nasal passages may, if they reached sufficient numbers, inhibit the high
expiratory flow rate which has been demonstrated for other olariids (Kerem et al.,
L975; Matthews, 1977). A potential obstruction due to the mites was not apparent
in lhe animals examined. By involving whole acini and even whole lobules the
worms present in lhe lung would reduce the amount of the alveolar surface
available for potenLial gas exchange. The proportion of the lung parenchyma
affected by these parasites has nol been delermined nor has lhe distribution of
Iesions, although from preliminary examinations of the maberial available, mosl
172.
lesions occurred subpleurally. If infeslation with lungworms were to be a pro-
gressive condition, ralher than a self-limiling one as proposed for other otariids
(Morales and Helmboldt, l97l; Sweeney and Gilmartin, ),974; Stroud and Dailey,
I97B), then it could result in the situation where the lung's function as a gas
exchange organ is severely impaired.
5.4 SUMMARY
Two species of orthohalarachnid m ites were present in lhe respiratory
system of the Australian sea lion. Most larvae of both species, Orthohalarachne
attenuata and O. diminuata were found lying on the nasal turbinates with small
numbers in the nasopharynx and trachea. Adult female O. altenuala were deeply
embedded in the epithelium of the ethmoid turbinates, whilst adult O. diminuata
were only recovered from the fixative from the lungs. The mites caused localized
erosion and ulceralion of the epithelium.
Specimens of a species of Parafilaroides were found in nodules and Iying free
in the parenchyma; some were also recovered from the lung fixative. The most
common pathology associated with the larval and adult worms was eilher an acute
bronchitis or bronchopneumonia. Occasionally worms were present in the paren-
chyma with no surrounding inflammatory response.
With gross infestation by the nasal mites the associated response may well
cause an obstruction to air flow in the nasal passages so thal the generally high
expiratory flow rale would be reduced. For this to occur the mites would need to
be present in very large numbers. The presence of worms in lhe lung parenchyma
together with the associated inflammatory reaction will lead to a reduction in the
available gas exchange surface. In large numbers these parasites may severely
impair the normal respiralory function of the lunqs.
r73.
Chapter 6
DISCUSSION
6.I LUNG STRUCTURE
The lungs of the Australian sea Iion possess several structural characteri-
stics which distinguish them from the Iungs of lerrestrial species. Foremost
amongst these, being obvious both grossly and m icroscopically, is the great
increase in the number of thick septa throughout the parenchyma and the amount
of connective tissue within them. These septa divide the lung into discrete, inde-
pendent units of smaller and smaller size. The largest of these septa divide the
parenchyma into large bronchopulmonary seqments which are furlher divided into
many pulmonary lobules. Each lobule contains a variable number of acini also
separaled from each olher by thickened septa. Within each acinus are two or more
alveolar ducts, a number of alveolar sacs and many alveoli whose septal walls are
thickened by an increased content of connective tissue. The alveolar septal
thickening is so exlreme in parts that approximately one-quarter of the alveolar
septa contain a double capillary network, a feature which in adult mammals is
unique to various aquatic species.
Another prominent feature of the lungs of Neophoca, also observed in other
oLariids (Denison and Kooyman, L973), is the reinforcemenl of Lhe lerminal air-
ways, here termed lobular bronchi, with hyaline cartilaqe plales and a thickened
muscularis. The epithelial tining of these airways is, for the most part, similar to
that of the bronchioles in terrestrial mammals. One feature of this epithelium in
these animals, rarely observed in Lerreslrial species and only occasionally
observed in oLher marine species, is Lhe presence of significanl numbers of
alveolar type II-like cells in the most distal porlions of these airways. Although no
histochemical studies were conducted on lhese cells, ultrastruclurally they are
almosl identical to lhe type II cells of the alveolar septa.
17 4.
6.2 LUNG MORPHOMETRY
Morphomelrically there are a number of parameters which show marked
differences from those predicted for a terrestrial species of similar body weight.
The [olal lung voìume is 500/o greater than predicted, a well recognised feature of
marine mammals lungs (Goudappel and Slijper, J.958; Kooyman, 1973), The alveolar
surface area is about ll% less than predicted, whilst bhe tolal capillary surface
area is 23% greaLer than predicted, resulling in a Sc/Sa ratio of l.l-l which is the
reverse of lhal found in most lerrestrial species. However, when the capillary
surface of the double capillary septa and the interlobular and interacinar sepla
which is nol involved in gas exchanqe is considered, the effective Sc is 14% less
than predicted, and the Sc/Sa ratio is 0.7I, similar to that in many terrestrial
species (Gehr et al., 1978a; Gehr and Erni, 1980; Gallivan, 1981b; Gehr et al',
IgBIb). The totat capillary volume is 60% grealer than predicted, in part due to
the double capillary septa. The tissue harmonic mean barrier thickness is l47o
greater than predicted, whilst the plasma harmonic mean thickness,0.09 um, is
similar Lo the smallest yet measured in mammals; several species of shrew (Gehr
et al., f9B0). The net result is a maximal oxygen diffusing capacity 26¿/o gteater
than predicted, whilst consideration of the approximalions for lhe effective Sc
results in a diffusing capacity 18% grealer lhan predicted. Therefore the true
maximal oxygen diffusing capacity for adults of this species lies in the range 4.281
Lo 4.582 ml o2.sec-l.tb"r-1.
In marine mammals the blubber accounts for 20-1070 of the total body
weight (Kooyman, I973) whilst in humans the fat component is only 15% of total
body weight (Schmidt-Nielsen, I97Ð. However, the proporLion of body fal is
directty correlated with body size, and caged wild species exhibil increased fat
accumulation (Pitts and Bullard, I96B). Thus some of the larger wild African
species in the study by Gehr g!_el. (l98lb) may have had a body fat content
approaching that of smaller marine mammals. Therefore, had lhe allometric
equalions been based on tean body weight, Lo consider only the metabolically

r75.
aclive tissues, the morphomelric results for the sea lion could be expected to have
been further increased when compared lo the terrestrial mammals.
6.3 DIVING PHYSIOLOGY
Despile these differences in structure and morphometry, the role of the lung
in enhancing the diving duration of these animals would appear to be minimal. As
outlined in [he Introduclion (Chapter l) there are a number of non-pulmonary
aspects which characterize diving duration in marine mammals. Of particular
importance is the obsenvalion that the vast m ajority of dives, in pinnipeds at
least, are well within the maximum duralion possible for each particular species.
Not only are most dives much shorter Lhan the maximum possible, m'ost are also
within the aerobic dive limit for that species. (Kooyman et al., t9B0; Kooyman,
regz).
6-l.I Aerobic Dive Limit
The prolonged dive limit displayed by pinnipeds is a result of two features in
particular, the large total body oxygen store available during a dive, and the
initiation of the diving response upon submersion.
(a) Body oxygen stores
The major conLribution to the total body oxygen store is that of lhe blood
due to an increased oxygen storage capacity. This large blood oxygen slore results
from increases in the blood volume, haematocrit and haemoglobin concentration
(Lenfant, 1969; Clausen and Ersland, 1969; Lenfant et al., I97O; Ridgway et al.,
I97O; Simpson et al., 1970). The total body oxygen store is augmented by an
increased muscle oxygen storage capacily due to an increased myoglobin con-
centration (Man'kovskaya, I975; Blix, I976; Castellini, I98I; Castellini and
Somero, LgBI). The degree to which the lunq oxygen conLributes to the lotal body
oxygen store during diving is largely species dependent. Phocid seals tend to
exhale eilher prior to diving or during the inilial descent phase so that the diving
lung volume is only 20-60% of the total lung capacity (Scholander, 1940; Kooyman
r1 6.
et al., I970; I972). Otariids and cetaceans are generally considered to dive on full
inspiration (Kooyman and Andersen, J-969; Ridgway et al., 1969; Kooyman, I973).
However, the diving lung volume of California sea lions, *ni"n have been observed
to exhale small volumes during descent, has been eslimated to be 5O-9OVo of their
vital capacity (Kerem et al., I975; Malthews, I977). It would therefore appear
that otariids and cetaceans have a greater reliance on lung oxygen during the
early stages of a dive than do phocids. Regardless of the diving lung volume, all
marine mammals studied undergo progressive compression collapse of the lung due
to the increased hydrostatic pressure at depth (Kooyman, I973). Therefore the
effectiveness of the lung as an oxygen store will diminish with increasing depth
and will cease beyond the depth at which complete collapse occurs, estimated to
be about 70 m (Kooyman et al., I97\ Ridgway and Howard, I979).
(b) Diving response
The diving response, which has been shown to be common to many verte-
brale classes, is most readily observed as a bradycardia. The intensity of this
bradycardia is not the result of a simple reflex response. In the Weddell seal it has
been demonstrated that a more profound decrease in heart rate occurs with an
increase in the anticipated dive duration up to about l5 min. (Kooyman and
Campbell, 1972) which is reasonably similar to the aerobic dive limit of 2O to
26 min. for this species (Kooyman et al., l-980). Associated with this bradycardia is
a decrease in cardiac output and a peripheral vasoconstriction so that arterial
blood pressure is maintained, or even increased slightly (Irving et al., 1942; Elsner
et al., 1964; Elsner et al., I96Q Murdaugh et al., 1968; Sinnett et al., I97B; Zapol
et al., I979; Blix et al., 198l). As a consequence of the peripheral vaso-
constriction, perfusion through the peripheral tissues and organs is reduced
slightly during aerobic dives but is markedly reduced, or even completely stopped,
during maximum breath hold dives (Bron et al., 1966; Zapol et al., 1979; Blix et
al., 1983).
r71.
6.J-2 Biochemistry
Biochemical studies have indicated that marine mammals have no majon
adaptations to enhance anaerobiosis but, rather, their biochemisLry is geared to
minimizing the effects and clearance time of anaerobic end-products (Hochachka
et al., 1977; Murphy et al., J.980; Castellini eb al., l9BÌ; Hochachka, 1981). The
skeletal musculature, where Lhe majority of the primany anaerobic end-product,
lactate, is formed, has an increased bufferinq capacity (Castellini and Somero,
l9Bl). The buffering capacily of the bìood is also increased to minimize pH
changes during the laclate washout from the muscle when the peripheral perfusion
is re-established at lhe end of the dive (Scholander, J-940; Lenfanl, 1969; Lenfant
et al., I97O; Lutz, I9B2). There are also biochemical modif icalions which allow the
central organs to utilize laclate during and after a dive but particularly during
recovery, when blood lactate levels are highest, so that the relurn to pre-dive
levels is hastened (Hochachka et al., I977; Murphy et al., L9B0).
6-l.f Pulmonary Function
The struclural modificalions of the pulmonary sys[em appear Lo be of major
importance in enabling the Australian sea lion to rapidly load lhe body oxyqen
stores prior lo a dive and to limit the absorption of nitrogen when diving Lo depth.
Otariids and cetaceans have a large lidal volume which approaches B0 to
9O% of total lung capacity, and as such is very similar lo their vital capacity
(Irving et al., I94I; Scholander and Irving, I94I; Olsen eL al., 1969). Normal res-
piration generally involves a single respiratory cycle of exhalalion followed by
inhalation during a brief period at lhe water's surface. This type of respiration
results in high flow rates, particularly during expiration, and near complete
alveolar emptying al end-expiration (Kerem et al., I975; Malthews, 1917;
Kooyman and Sinnelt, 1979; Kooyman and Cornell, l-98L). It has previously been
suggested (Denison el al., I97I; Denison and Kooyman, 1973; Kooyman, 1973) that
the attainment of such high flow rates is made possible by the reinforcement of
the terminal airways; this is assisted by the elastic recoil of the lung, a flexible
r-78.
thorax and the obliquely oriented diaphragm (Slijper, 1962). In lerreslrial
mammals peak expiratory flow rates are achieved at about 80%o tolal lung
capacity and lhen rapidly decrease until flow is obstructed by collapse of the lhin-
walled bronchioles at low lung volumes (Hyatt et al., 1958; Pride et al., 1961;
Macklem and Mead, l96B). In otariids the peak expiratory flow rale is mainlained
at a plateau even down to lung volumes as low as 2070 of total lunq capacity
(Kerem et al., 1975; Matthews, 1977).
Expiration by marine mammals is generally considered to be passive, as with
humans (Olsen et al., 1969). However, Kerem g!-e!. Q915) have suggested that in
the California sea lion lhe variable expiralory flow rates for a constant expired
volume are dependent on the muscular effort that can be developed from a par-
ticular chest wall position, whereas in terrestrial mammals the maximum
expiratory flow rates are independent of lhe expiratory effort and depend in part
on the elastic recoil of the lung (Leith, I916). Despile an increased interstilial
connective lissue component in marine mammal lungs, the lung elastic recoil and
compliance are similar to those of terrestrial species (Olsen et al., 1969; Gillespie,
l98l). However, the thoracic wall of marine mammals has a relatively hiqh com-
pliance (Gillespie, IgBi). This resulls in a very low lung relaxation volume so lhal
the functional residual capacity differs very little from lhe residual volume and
minimum alveolar volume (Leith, I976). The lung relaxation volume in phocids,
and probably most aquatic species, only constitutes aboub 3.5o/o of the lotal lung
capacity as compared to about 20 to 6O% in many terrestrial species (Gillespie,
re93).
Such a low functional residual capacity means that inflation, which starts al
a low lung volume, needs to overcome the tendency for the alveoli to collapse
further. This is achieved by the surfactant which reduces Lhe alveolar surface
lension, and by lhe distribution of inflationary forces throughout the parenchyma
along the connective Lissue networks. The surfactant of marine mammals has
rarely been examined, bul in two reports fnom pinnipeds the amounl of sunfactant
r19.
present, Lhe phosopholipid components and surfactant activity, were found to be
similar Lo terrestrial mammals (CIements et al., I97O; Denison et al., f97L).
However, there is one report, as a personal communication, that the amount of
surfacIant present in the lungs of the Weddell seal is considerably less than that in
terrestrial mammals (Boyd, I975). More recently the effect of intermittent
increased tidal volumes on surfactanl release has been examined in terrestrial
mam mals. Lavage of isolated perf used rat lungs af ler a single deep brealh
indicated that surfactant release had been increased, and it was also observed that
this large brealh resulted in the opening of ateleclic alveoli and an increase in the
oxygen diffusing capacity (Nicholas el al., I9BZ). Monphological examination of rat
alveolar type II cells after periodic deep breaths of four times the normal tidal
volume, indicated that an increased tidal volume slimulated surfaclant release
(Massaro and Massaro, 1983). Whelher or not a normally larqe tidal volume, such
as lhat of marine mammals, has a similar effect on surfactant release has yel to
be determined. If this is in fact the case, it may help compensate for the apparent
reduclion in the volume of alveolar type II cells in the lung of lhe Australian sea
lion.
As a consequence of lhe reduction in surface lension by the sunfactanl, lhe
inflationary pressure required lo reinflate or reopen Lhe alveoli is kept lo a
minimum. The inflationary pressure which is crealed by active inspiralion involves
the flexible thorax which is capable of moving relaIively large distances during
respiration (Leith, I976) and the obliquely oriented diaphragm which is common lo
many marine mammals (Green, I972). The large inspiratory volume, moving at a
reduced flow rate as compared to expiration (Kerem et al., 1975; Matthews, 1977;
Kooyman and Cornell, 19BI) tends to fill the lung lo near total capacity so that
alveolar recruitment will be al or near its maximum during normal respiralion.
Associated with the large tidal volume is a respiralory arrhythmia which
leads to an increased heart rate during inspiration with an increased cardiac
output and hence a grealer pulmonary blood flow (lrving et al., 1963; Kooyman and
IBO.
Campbell, I972; Lin et al., L972; Casson and Ronald, I975; Tanjii et al., I975;
Dormer et al., I977;Pasche and Krog, 1980). This increased blood tfà1r¿ wiff lead to
a greater pulmonary capillary filling and/or capillary recruitment during inspira-
tion when alveolar oxygen tensions are maximal.
Therefore the increased alveolar recruilment, resulling from the large lidal
volume, together with the increase capillary filling and/or recruitment should
result in less ventilalion-perfusion mismatching. This in turn will enable better
utilization of the available diffusing capacity than occurs in terrestrial mammals
at rest. Reduction in ventilalion-perfusion inhomogeneity has been suggested as a
factor in the increase of the oxygen diffusing capacity in heavily exercising
humans (Veicsteinas et al., I976).In exercising humans the respiratory and cardio-
vascular events partially parallel those of marine mammals at rest; there are
increases in oxygen consumplion, ventilalion and cardiac output so thal the
physiologically determined pulmonary diffusing capacity during exercise is
increased nearly f.5 Limes above that at rest (Veicsteinas et al., I976). Although
the physiologically determ ined oxygen dif f using capacity is increased during
exercise, this value is still only 5O-65Vo of that measured morphometrically
(Siegwart et al., I97I; Weibel, I972; I973; I979b; 19Bl). This is in part due to the
fact that instillalion fixation of the Iung exposes the tolal alveolar surface so that
the diffusing capacity is 20 to 50% greater than that for air-filled perfusion-fixed
lungs (Weibel et al., I973). Whether lhe morphometric diffusing capacity of
marine mammals is similarly I.5-2 times greater lhan that determined physiolo-
gically during heavy exercise in humans (Weibel, I98l) has yel lo be established.
However, it has been demonstrated that the oxyqen utilization by the lung of
marine mammals is almost twice that of terrestrial species (Scholander and Irving,
1941; Andersen, 1,966). This implies a greater utilization of the available diffusing
capacity, which may in part be a reflection of the inspiralory apnoea common to
many marine mammals (Scholander, J.940; Scholander and Irving, I94I; Olsen el
al., L969).
lB1.
During normal respiration, particularly in otariids and cetaceans, lhe
ventilation and perfusion of the lung are likely to be well matched since alveolar
recruitment approaches the maximum as does lhe capillary filling and/or recruit-
ment. However, there is evidence in terrestrial mammals that on a microscopic
level the ventilation and perfusion of the Iungs are not ideally matched due to the
stratification of oxygen tensions within the alveolar duct system (Adaro and
Piiper, I976; Piiper, I979; Nixon and Pack, 1980; Weibel, 19Bl). This occurs
because ventilation of the alveoli, or more accurately ventilation of lhe alveolar
surface of the blood-gas barrier, involves two mechanisms: one, the bulk flow of
inspired air to the level of the respiraLory bronchioles, the other, diffusion of
oxygen from the respiratory bronchioles to the blood-gas barrier along an oxygen
concentration gradient (Weibel, I9Bl). It has been suggested that the depth to
'which the bulk flow of air reaches in the alveolar duct system is dependent on the
tidal volume, with deeper penetralion occurring with larger tidal volumes (Weibel,
1981). In marine mammals bulk flow can therefore be expected to extend well
within the alveolar duct system due to the large tidal volume. It has furlher been
suggested lhal the degree of oxygen stratificational inhomogeneity depends on the
lenglh of lhe alveolar duct system (Weibel et al., lg8]b). These aulhors report
that preliminary evidence suggests a body size dependence for this duct system, so
lhat in larger animals it is longer which results in a reduced oxygen tension at the
blood-g as barrier. In Neophoca, although the alveolar ducl length has not been
delermined, the structural arrangement of the acinus whereby the first generalion
alveolar ducls arise directly from Ihe reinforced lobular bronchi, will assisl the
inspiralory bulk flow and hence this dislance for oxygen diffusion and the stratifi-
calion of oxygen tensions.
Weibel (i-98l) has proposed a model of "parallel perfusion and series ventila-
tion" in which lhe capillaries of all alveoli within an acinus are equally perfused
whilsl the ventilation of alveoli is dependent on the stratified oxygen diffusion
gradienl within lhe acinus. In this m odel lhere is an axial oxygen dif fusion
182.
gradient along the alveolar ducts and a radial oxygen diffusion gradient within lhe
indiv idual alveoli. Weibel has suggesled this resulls in a higher oxygen con-
centration within bhe alveoli closest to the alveolar duct enlrance and a lower
concentration in those further distal, resulting in mismatching of venlilation and
perfusion. These stralificational gradient,s are Iikely to be reduced in the otariid
Iung due to the large tidal volume and the simple acinar geomelry. If this is the
case then grealer advantage can be taken of the maximal diffusinq capacity as
measured morphometrically. Thus it is likely that if the oxygen diffusing capacily
were also Lo be determ ined physiologically lhere would be less discrepancy
belween the two than observed in terrestrial species.
6.f-4 Increased Hydrostatic Pressure and Lung Collapse
The degree lo which this increased pulmonary diffusing capacity will be
affected during the early phase of a dive will depend on lhe rate of descent, the
rate at whìch the aìveoli collapse and the way in which the alveolar septa fold
during collapse.
(a) Rate of lung collapse
The averaqe rate of depth change for the Norlhern fur seal, is 70 m/min.
(Kooyman el al., I916) whilst the mean rate of descent for the Weddell seal is
abou[ 35 mlmin., with a maximum recorded of about 100 m/min. (Kooyman, L967).
However, the descent rate for prolonged dives greater lhan 20 min. by Weddell
seals, which are to a mean depth of ll0 m, is generally less than that for shorter
deeper dives (Kooyman et al., I97l-). With such descent rates the depth at which
complete alveolar collapse has been predicted to occur, 70 m (Kooyman el al.,
I97),; Ridgway and Howard, L979), will be quickly achieved. The descent rale,
together with the accompanying increase in hydrostatic ptessure, will determine
the rate of alveolar collapse. From a lung model, the ability fon alveolar collapse
was predicted to depend on a small alveolar volume to dead-space volume ratio,
and terminal airways which are at least five times as rigid as the alveoli (Denison
and Kooyman, 1973). In phocids a small alveolar to dead-space volumes ratio is
IBJ.
achieved by exhaling to only 20-60%o of lolal lung capacity either before a dive or
in early descent (Scholander, 1940; Kooyman el al., I970; I97Ð. Olariids and
ceIaceans tend lo dive on full inspiralion (Kooyman and Andersen, 1969; Ridgway
et al., 1969; Kooym an, I973), allhough the California sea lion has been observed lo
exhale small quantities of gas on descent which resuìts in a diving lung volume of
5}-g}o/o of the vilal capacity (Kerem el al., 1975; Matthews, 1977)- The large
diving lung volume will result in a slightly larger alveolar to dead-space volumes
ratio, but this will be partially offset by the more extensive rigidly reinforced
terminal airways which marginally increase the dead-space volume. Togelher with
the fact thal the airways are considerably more rigid than the alveolar walls, this
will ensure bhat alveolar collapse precedes thal of the airways. Evidence from
phocid sea-[s in a pressure chamber indicates that the alveoli are in fact the first
respiratory slructures to respond to increased hydrostatic pressure (Kooyman et
al., 1970). Radiographs, taken of these seals when pressurized, demonstraled
substantial but not complete collapse of the lrachea whilst Lhe medium-sized
bronchi and "bronchioles" mainlained their pre-dive diamelers even at ptessures
equivalent to a depth of 3O6 m. The authors concluded that there had been con-
siderable collapse of the alveoli at pressures equivalent to Iess than 30 m depth.
(b) Nature of lung collapse
Sludies of lhe excised lungs from the California sea Iion have demonstrated
that otariid lungs are capable of near complete alveolar collapse (Denison et al.,
L97l). These authors only examined lhis lung material light microscopically and so
did not observe the way in which the alveoli collapsed. The only studies which
indicate the nature of septal folding have been those conducted on ral lungs
perfusion fixed al different positive inflation pressures (Gil and Weibel, I972;
Weibel et al., 1973). The mechanies of these two situations will most certainly
have been differenl, as lhe sea lion lungs were exposed to variations in exlernally
applied pleural pressure. However, the fealure of interest is the behaviour of the
alveolar septa wilh decreased inflation and lhe influence of this on the diffusing
I 84.
capacity. The major morphological feature at low inflation was that with foldinq
of the septum the larger components, such as the epithelial and interstitial cell
bodies and connective tissue fibres, were displaced into the depth of Lhe septum.
In this way the m ajority of the ef f ective blood-gas barrier consisted of the
thinnest portions, those of the fused epithelium and endothelium (Gil and weibel,
Ig72). In the present study evidence of similar alveolar folding due to incomplete
inflation was observed in occasional areas; however the degree of submaximal
inflation was unknown.
As the structural amangement of the alveolar septal components in
Neophoca is similar to that of terrestrial species, it is likely that the folding of
the septa, due to compression or at end-expiration, would be similar to that
observed in the rat. In the rat a smooth alveolar surface was maintained at sub-
maximal inflation pressures by the displacement of the surfactant which was
thinnest over the thin exposed portions of the gas-exchange barrier and formed
pools in the folds and plications of the thicker reqions (weibel et al', l97l)' This
surfactant is important for alveolar stability and reinflation by minimizing the
surface tensions as the alveolar surface area is reduced. In the present study, due
to the method of fixation, the majority of this alveolar surface lining layer was
removed leaving only occasional pockets of surfactant associated with septal
f olds.
(c) Effect of lung collapse on gas-exchange
The morphometric results of the rat lung showed that with submaximal
inflation the available pulmonary diffusing capacity is reduced by as much as 50 to
75% when compared to completely unfolded instillation fixed lungs (Weibel et al.,
Ig73).5imilar changes in the oxygen diffusing capacity of marine mammal lungs
can be expected to occur with compression collapse which will reduce not only
oxygen diffusion but also nitrogen absorption. Therefore the effect of alveolar
collapse on limiting nitrogen absorption is dependent not only on total lung
collapse, estimated to occur by about 70 m (Kooyman et al., I97I; Ridgway and
rB5.
Howard, I979), but also on the degree to which the alveolar collapse, prior to this
point, reduces the capacity for nitrogen absorption. However, this decrease in the
effective alveolar surface area and subsequent decrease in diffusion capacity will
be partly offset by the increase in the partial pressure of nitrogen in the reduced
lung volume. This leads to an increase in the nitrogen diffusion gradient, from
alveolar air to capillary blood, resulting in enhanced nitrogen absorption across
the exposed regions of the blood-gas barrier. That this is the case has been
demonstrated in dolphins diving to less than 100 m (Ridgway and Howard, 1979).
The results from that study indicated significant levels of nitrogen absorption at
depths of less Lhan 70 m; therefore, despite partiaì alveolar collapse and
diminished nitrogen absorption, marine mammals appear lo be potentially capable
of absorbing sufficient nitrogen to suffer from nitrogen narcosis and decom-
pression sickness. During simulaLed dives to depths between l0 and 212 m phocid
seals displayed increased blood nitrogen tensions which were lower than the level
theoretically possible at such depths. Even though the arterial nitrogen levels,
particularly those in the harbor seals, were above the level at which nitrogen
narcosis occurs in humans and bubble formation occurs in cats, these animals
displayed no symptoms (Kooyman et al., 1912).
6.3-5 .Nitrogen Absorption and Decompression Sickness
Repetitive breath hold dives by humans to depths of 15 to 20 m have
resulted in decompression sickness (Paulev, 1965); therefore it would appear that
marìne mammals are potentially capable of suffering from increased nitrogen
absorption when diving, particularly to depths less than 70 m and when making
repetitive dives. However, the mechanism by which they avoid such consequences
remains to be elucidated. Kooyman (1973) outlined five possible mechanisms by
which marine mammals may avoid the problems of excessive nitrogen absorption:
i) qreater tolerance to nitrogen through greater solubility in tissues and blood;
ii) distribution of nitrogen throughout the tissues;
iii) restriction of the duration and depth of dives;
t86.
iv) the presence of tissues to specifically absorb nitrogen;
v) prevention of nitrogen absorplion.
There is no evidence available to fully support any of these mechanisms.
Nitrogen solubility in seal blood was not found to differ significantly from that in
human blood (Kooyman et al., \972). Although lhere is extensive peripheral vaso-
constriction during dives to depth and during restrained or simulated dives (lrving
et al., 1942; Van Citters et al., 1965; Elsner et al., L966; Stevens, L97I; Sinnett el
al., I97B;Zapol et al., 1979), the results of Ridgway and Howard (1979) indicate an
effective perfusion of skeletal muscle whilst diving to depths of at least 70 m.
After divinq, lhe nilrogen tensions in the dorsal epaxial muscles of the dolphins
were two to three times greater than lhat at rest at the surface, rèsulting in
levels similar to arterial nitrogen tensions which have caused problems in humans
(Kooyman et al., I972), Therefore this distribution of nitrogen would not appear lo
be an effective prevenlalive mechanism as lhe levels present in the muscle lissue
are sufficiently high to potentially cause problems with decompression during
rapid ascenb.
The diving behaviour of the few pinniped species studied in detail indicate
that the duration, depth and frequency of dives are potenlially capable of result-
ing in decompression sickness (Kooyman -et al., I976; t9B0; Kooyman, I9B2; Gentry
ef al., lg8l), as has been shown to occur in humans (Paulevr 1965) and other ler-
restrial mammals (enitp, I97Ð. No special nitrogen-absorbing tissues have yet
been identified although nitrogen is approximately five times more soluble in
blubber than other tissues, and Kooyman (1913) speculated that the blubber may
act as a nitrogen sink during ascent when the peripheral vasoconstriclion relaxes.
However, the nitrogen tensions in the blubber of repetitively diving dolphins was
less than that in the dorsal epaxial muscles (Ridqway and Howard, 1979), so this
also appears lo be an unlikely explanation. The prevention of nitrogen absorption
by alveolar collapse has been discussed above and was also shown to be inadequate
to prevent decompnession sickness.
lB7.
Another mechanism which may prevent decompression sickness in marine
mammals relates to intravascular events which result from decompression. In
terresL,rial species these include red blood cell clumping, rouleaux formation, the
sludging of blood in small vessels, a decrease in the number of platelets, and
haemoconcentration (Pnitp, I974:, Strauss, 1979) which are believed to resull from
the gas-blood interface of nitrogen bubbles. Associated with these changes is the
electron microscopic observation that bubble growth in decompression sickness
involves the coating of the bubbles by a thin Iayer of fibrinogen, and the aggrega-
tion of lipid micelles and platelets (Philp, I97Ð.
There are no reports in the lilerature of similar changes in the blood of
diving marine mammals. However, the in vitro clotting time of cetacean blood has
been shown to be prolonged as compared to terreslrial species, whilst the blood of
several celacean species is deficient in blood clotting factor 12 (Hageman factor)
(Robinson et al., 1969; Ridgway el al., I91O; Ridgway, 1972). Whether or not these
affect intravascular coagulation has not been established. The clotting time of
blood from the Soulhern elephant seal, Mirounqa leonina, however, did not differ
from thal of terrestrial mammals (Bryden and Lim, 1969). Platelet counts in
marine mammal blood have rarely been undertaken with one report indicating that
in the killer whale, Orcinus orca, the number of platelets were within the normal
human range whilst those of the bottle nose dolphin were somewhat low (Robinson
et al., L969). It therefore appears that differences in intravascular properties of
marine mammals may be an importanl factor by which these animals are able to
avoid the problems associated with excessive nitrogen absorption.
6.4 CONCLUSION
The role of the lung in marine mammals is to rapidly supply sufficient
oxygen for the body oxygen slores which will enable full utilizalion of their
aerobic diving capabilily. The m ajor oxygen store is the blood, whose storage
capacity is increased above that of terrestrial mammals. This results from
]- BB
increases in lhe whole blood volume, haematocrit, and haemoglobin concenlration.
Thus, in',rapid" breathers such as Neophoca cinerea, the role of the lung is to
rapidly oxygenate this large blood pool as it circulates through the pulmonary
capillaries during the animals'brief sojourn al the air-water interface. To achieve
this a large readily available oxygen source needs to be delivered to the gas-
exchange surface, which then needs to rapidly pass from the alveoli lo the
erythroc ytes.
The necessary supply of òxygen to the blood-gas barrier is made possible by
several slructural, and associated physiological, modifications of the general
terrestrial pallern. Foremost amongst these is the large tidal volume of the
"rapid" breathers. The ability to move such volumes of air is achieved'in pant by
the presence of cartilage-reinforced lower airways. These lobular bronchi remain
patent at low Iung volumes and during periods of high air flow. The high expiralory
flow rate and large tidal volume lead to a very small residual volume. Thus at end-
inspiration the inspired oxygen concentration will rem ain relatively hiqh' as
compared to the atmospheric concentration, due to a small physiologic dead-space
volume of gas present to dilute the inspired air.
The relatively high inspired oxygen concentration is then more fully utilized
through the structural arrangement of the terminal respiratory unit, or acinus. In
Neophoca each lobular bronchus supplies a number of acini whose alveolar ducts
arise directly from the bronchial terminal cartilage rings. This acinar geometry,
logether wibh the reinforced airways, enhances the bulk flow distribution of
inspired air, and hence diminishes lhe distance necessary for inlra-ductal and
intra-alveolar diffusion by oxygen. This reduction in stratificational inhomo-
geneity within the acinus is com plem enled by an inspiratory tachycardia, and
hence increased pulmonary blood f low, so that any ventilation-perfusion m is-
matching will be minimized.
The effect of Lhis increased oxygen concentration at the blood-gas barrier
and the diminished ventilation-perfusion mismatching will be enhanced by the
189.
increase in the effective morphometrically determined oxygen diffusion capacity
of the lung. The increase in oxygen diffusion capacity, when compared to ter-
restrial species, is achieved primarily through increases in the oxygen conduclance
of the plasma componenl of [he morphometric model and the pulmonary capillary
volume. The increase in the plasma oxygen concltlctance results from a markedly
increased haematocrit which increases the volume of the pulmonary capillaries
and consequently decreases the plasma harmonic mean thickness. If interspecies
comparison of the pulmonary oxygen diffusing capacity were to consider lean body
weight rather than total body weight, then the sea Iion oxygen diffusion capacity
would be further increased when compared to terrestrial species. This is due to
the large proportion, up to )Oo/o, of the body weighl of marine mammals which is
relalively mebabolically inactive adipose tissue.
The increased bulk flow of an increased inspired oxygen concenLralion which
reaches the bÌood-gas barrier, together with an increased pulmonary diffusion
capacity, lead to the high oxygen utilization which has been observed in marine
mammals. The normal respiratory cycle of these animals contributes to the
oxygen uLilization as there is an extended inspiratory pause even when resling on
Iand. In this way the high oxygen requirement for the predominantly aerobic dives
of marine mammals is made available by these structural and physiologic modifi-
cations [o the respiratory system.
The structural modifications of the respiratory system are also importanl
for the ability of marine mammals to dive to depth. it has been well established
that when mammals dive lo depth there is collpase of gas-containing organs and
struct.ures due to the increase in hydrostatic pressure. In marine mammals, the
nu.mber of gas-containing structures has been minimized, in particular the bony
sinuses of lhe skull which are enlirely absent. The major gas-containing organ is
the lung which in marine mammals has been shown to undergo near complete
collapse at deplh. The only slructures wibhin the lung which mainlain their
patency are the cartilage-reinforced intrapulmonary airways and the trachea,
1 90.
whilst the alveoli collapse completely. This capacity of the alveoli to collapse
prior to [he small airways is important to prevent rupture of [he alveolar
slructures and to minimize nitrogen absorplion. Alveolar collapse is achieved by
the increased airway rigidity of these species, and a small alveolar volume to
dead-space volum e rabio. Sim ilar collapse of the alveoli occurs in "rapid"
breathers at the end of expiration due to Lhe large tidal volume and the resullant
small residual volume.
Reinflation of the alveoli is made possible by two features, one physico-
chemical and one struclural. The surfactant secreted by the type II cells of lhe
alveolar epithelium, and possibly also the type II-like cells of the lobular bronchi,
acts to reduce the surface tension of the alveoli as their volume, and hence
surface area, is diminished. The effect of the surfactant is to minimize the force
required to reinflate the alveoli durinq inspiralion and ascent, and to maintain
alveolar stability at low lung volumes. The structural modification which assisls
reinflation is lhe increase in the connective tissue septa throughout lhe paren-
chyma. These septa form a continuum which passes from the pleura of the lung
surface to lhe adventitia of the airways and larger blood vessels. In this way the
negative inflationary pressure crealed within lhe thoracic cavity is readily trans-
mitted throughout the parenchyma. During inspiralion the negative intrathoracic
pressure is created by the lateral movement of the thoracic wall, and lhe caudal
and ventral movement of the diaphragm. The thoracic wall of marine mammals is
highly compliant which enables it to move relaIi.vely large distances during res-
piration and so create the necessary negative intrathoracic pressure for
inspiration. The action of the thoracic wall inspiratory musculature is aided by the
obliquely orienled diaphragm which will act in a similar fashion. Also imporlanl
for reinflation of lhe alveoli during inspiration is lhe more peripherally distributed
bulk flow of inspired air, due to the airway reinforcement and acinar geometry.
The increased alveolar seplal rigidity, as determined by an increased inler-
slitial component, was found to be significantly greater in the venlro-posterior
r91.
region of lhe lung. This may ref lect an increased stress on this region durinq
normal respiration and when divinq to depth. When at depth the increased hydro-
stalic pressure will act on the whole body and tend to move the abdominal
conten[s toward the collapsing thorax, particularly during the descent phase.
Similar shifts of abdominal organs will also tend to occur, bul to a lesser degree,
during expiration, partly as a result of lhe position of the very obliquely orienled
diaphragm, Therefore, the increased reinforcement of the delicate alveolar septa
in lhe ventro-posterior regions may have developed in response lo this mechanical
stress.
Although bhe lungs of marine mammals undergo compression collapse when
diving to depth, this reduction in the available gas-exchange surface is insufficient
to completely inhibit nitrogen absorption. It has been demonstrated that the
absorption of potentially hazardous nitrogen occurs to a depth of at least 70 m.
This resulbs, in part, from the likely paltern of alveolar septal collapse, in which
exposure of the thinnest portions of the blood-gas barrier is m aintained until
complete collapse occurs. The other factor which will influence nitrogen absorp-
lion is the increase in the par[ial pressure of nitrogen when al depth so thal the
diffusion qradient from alveolar air to capillary blood is increased. Therefore
there are likely to be other mechanisms in marine mammals which operate to
minimize or eliminate the complications of excessive nilrogen absorption.
6.5 FUTURE RESEARCH
There are a number of avenues of research arisinq from this study which
would likely conLribute to further understanding of lhe role of Lhe respiralory
system in lhe diving capability of marine mammals.
These include:
i) the estimation of the morphometric pulmonary dif fusing capacity of another
marine mammal species for which various physiologic estimates of pul-
monary function have been determined. This would perhaps be best achieved
192.
by examination of a phocid species, in particular lhe Weddell seal, since this
species has been identified as the master diver amongst pinnipeds, and whose
pulmonary function has been extensively studied;
ii) the determination of the rate of oxygen uptake by the erythrocytes of one or
several aquatic species, as this has only been assessed with any accuracy for
human red blood cells. The rate of oxygen uptake by erythrocytes is an
imporlant faclor for the erythrocyte component of the morphometric lung
model and any differences between this rate for humans and marine
mammals may further affect the observed increase in the pulmonary diffus-
ing capacity of the Australian sea lion;
iii) establishing the relalionship between the pulmonary diffusing capacity
determined morphometrically and that determined physiologically for a
marine mammal. In humans it has been demonslrated that the morphometric
diffusing capacity of the lung is I.5-2 times greater than thal determined
physiologically durinq heavy exercise. From the available evidence in regard
lo oxygen utilization and the efficiency of lhe lung as a gas-exchange organ'
it is likely that the discrepancy between the results of these two melhods
would be diminished in marine mammals;
iv) the exam ination of the intravascular events, in an aquatic species,
associaled with the compression and decompression when diving to depth. In
terreslrial species the development of a hypercoagulable state and
associated haematological changes have been demonstrated to be important
consequences of rapid decompression and the formation of intravascular
bubbles. It appears lhat marine mammals may possess certain haematoligic
and biochemical adaptalions which prevenl, or limit, such intravascular
events.
193
BIBLIOGRAPHY
Adaro, F. and Piiper, J. I916. Limiting role of stratification in alveolar exchange
of oxygen, R iration Ph siolo 26, 195-206.
Allan, E.M. 1978. The ultraslructure of the brush cell in bovine lung . Research in
Veterinar Sc ience.25 , 3r4-3r1.
Andersen, H.T. 1966. Physiological adaptations in diving verlebrates. Phys ioloqical
Reviews, 46, 2I2-24J.
Andersen, J.B. and Jespersen, W. 1980. Demonstration of intersegmental
respiratory bronchioles in normal
Respiratory Diseases, 6I, 331 -34I.
human lunqs. European Journal o!
André-Bouqaran, J., Pariente, R., Legrand, M. and Cayrol, E. I915. Normal
ultrastructure of small bronchi and bronchioli in man. Patholoqie Bioloqie,23,
629-638.
Assimacopoulos, 4., Guggenheim, R. and Kapanci, Y.1,916. Changes in alveolar
capillary configuration at differenl levels of Iung inflation in the rat. An
ultrastructural and morphometric study . LaboraLory Investiqation, 34, IO-22
Banks, W.J. l98l. Aop Iied Veterinarv Histoloqv. Baltimore: Williams and Wilkins
Baskerviìle, A. I97O. Ultrastructural studies of the normal pulmonary lissue of the
prg R esearch in Velerinarv Science. ll- , 150-r55
Becci, P.J., McDowell, E.M. and Trump, B.F. l-978. The respiratory epithelium. II.
Hamster trachea, bronchus, and bronchioles. Journal of the Nalional Cancer
Institute, 6I,55I-56L
Bélanqer, L.F. 1940. A study of the histological struclure of the respiraLory
portion of the lungs of aquatic mammals. American Journal of Anatomy,67,
437-469.
Bennetl, H.S., Wyrick, A.D., Lee, S.W. and McNeil, J.H. Jr. L976. Science and art
in preparing tissues embedded in plaslic for light m icroscopy, with special
refenence to glycol meLhacrylate, glass knives and simple stains. Stain
Technoloqy, 5I' lI-97.
194.
Berendsen, P.B. and De Fouw, D.O. I1BZ- An ultrastructural morphometric
comparisonoftherightandleftsidesandlobesofthedoqlung . Anatomical
Record, 2O4r 39-44-
Blix, A.S. I975. The Elicitatio n and Requlation of the Cardiova scular ResPonses to
Divino. Transo, Norway: University of Transo' Inst' Med' Biol'' Sect' Physiol
pp 5-2O.
Blix, A.s. Ig76. Metabolic consequences of submersion asphyxia in mammals and
birds. B iochemical Societ UK) m ostum 4r, 169-178.
BIix, 4.s., Elsner, R. and Kjekshus, J.K. l-981. cardiac output and its distribution
through capillaries and A-V shunts in diving seals AcLa Phys ioloqica
Sc andinav ia. llB , l_09-116.
Bloom, w. and Fawcett, D.W. 1968. A Textbook of Histoloqy' Philadelphia: w'B'
Saunders Co.
Boatman, E.5., Arce, P', Luchtel, D't Pump' K'K' and Martin' C'J' 1919'
pulmonary function, morphology and morphometrics, in Bowden, D'M' (ed')'
AqinqinNo n-humanPrimates.NewYork:VanNostrandReinhold,pp.292-'13.
Bohr, c. 1909. ueber die spezifische Tätigkeit der Lungen bei der respiratorischen
Gasauf nahme. Scand inav ian Archives of Phys ioloov. 27, 22I-28O. Cited bY
We.ibel, E.R. 1970a. Morphometric estimation of pulmonary diffusion capacity'
. I. Modet and method, Respiration Physiology, LI,54-75.
Bonner, w.N. 198I. Southern Fur Seals - Arctocephalus, in Ridgway, s'H' and
Harrison, 3.¡. (eds): Handbook of M arine Mammals, V ot. l. The Walrus, Sea
Lions, Fur seals and sea otter. London: Academic Press, pp. 16l-208'
Boshier'
d iffuFunc
D.P.andHilI'P.McN.IgT4.Structuralaspectsofventilationandsion in the Weddell seal tf-eptonycnotes weO )' in Hamison' R'J' (ed')'
tional Anato myofM arine Mammals, Vol. 2. London: Academic Presst pp
I97 -229.
Boyd, R.B IITJ.Acomparativeanatomicalstudyoftherespiratorysystemsofthe Antarctic Weddell and Crabeater seals'
Internati on al 34,5292-8.
D issertation Abstracts
I95.
Boyd, R.B. l-975. A gross and micnoscopic study of the respiratory analomy of the
Anfarctic Weddell seal, Leptonychotes weddelli, Journal of Morpholoqy, I47,
309-336.
Boyden, E.A. l97l-. The slructure of the pulmonary acinus in a child of six years
and eight months, American Journal of Anatom r32,275-3OO.
Breeze, R.G. and Wheeldon, E.B. 1977. The cells of the pulmonary airways,
American Review of R i ra Ior D isease 116, 705-777.
Breeze, R.G., Wheeldon, E.B. and Pirie, H.M. L976. Cell structure and funclion in
the mammalian lung: ïhe trachea, bronchi and bronchioles. Veterinary
Bullef in, 46, 3I9-337.
Bron, K.M., Murdaugh, H.V. Jr, Millen, J.E., Lenthall, R., Raskin P. and Robin,
E.D. 1966. Arterial constrictor response in a diving mammal. Science, 152,
540-543.
Bryden, M.M. and Lim, G.H.K. 1969. Blood parame[ers of the Southern elephant
seal (Milsglgq _!ge!il_Ð Linn.) in relalion to diving . Comparalive Biochemislry
and Physio loqy, 28, I39 -I48.
Burns, J.J. I9Bt. Ribbon seal - Phoca fasciata in Ridgway, S.H. and Harrison, R.J.
(eds), Handbook of Marine Mammals, Vol. 2.994q. London: Academic Press,
pp. B9-I09.
Burri, P.H. I974. The postnatal growth of lhe rat lung. III. Morphology,
Anatom icaì Record IBO,77-98.
Burri, P.H. and Weibel, E.R. I97la. Morphometric evaluation of changes in lung
sLructure due to high altitude, in Porter, R. and Knight, J. (eds), Hiqh Altitude
Physioloqy: Cardiac and Rqsplratory 4SgeqÞ. Edinburgh: Churchill
Livingstone, pp. 15-10.
Burri, P.H. and Weibel, E.R. L971b. Morphomelric estimation of
diffusion capacity. II. Effect of POZ on the growing [ung,
pulmonary
Resp iralion
Physioloqy, lI , 247 -264.
196.
Burri, P.H., Dbaly, J. and Weibel, E.R. 1974. The poslnatal qrowLh of the rat lung.
I. Morphometry, Anatomical Record r7B,1II-730.
Burri, P.H. and Sehovic, S. L979. The adaptive response of Lhe rat lung after
bilobectom y, American Review of R esoiratorv Disease. Ll9, 769-771.
Buller, P.J. 1982. Respiratory and cardiovascular control during diving in birds and
mammals, JournalofE erimental Biolo LOO, L95-22I.
Butler, P.J. and Jones, D.R. 1982. The comparative physiology of diving in
v ertebrates, Advances in Comparative Physioloqy and Biochemistry, B, r79-
364.
Casson, D.M. and Ronald, K . 1.915. The Harp seal, Pagophilus qloelþfldjçu!(Erxleben, 1977) - XIV. Cardiac arrhythmias, Comparative Biochemistry and
Physiolooy, 50A, JOl -3I4.
Castellini, M.A. 1981. Biochemical adaptations for diving in marine mammals.
DissertaLion Abstracts International 41, 4401_-8.
Castellini, M.A. and Somero, G.N. 1981. Buffering capacity of vertebrate muscle:
Correlations with potentials for anaerobic function, Journal of Comparative
Physioloqy, I43, l9I-I98.
Castellini, M.4., Somero, G.N. and Kooyman, G.L. L98l-. Glycolytic enzyme
activilies in tissues of marine and terresLrial mammals, Physioloqical Zooloqy,
54,242-252.
Castleman, W.L., Dungworth, D.L. and Tyler, W.S. 1975. Inlrapulmonafy airway
morphology in three species of monkeys: A correlated scanning and
transm ission electron m icroscopic study, American Journal of Anatomy, I42
ro7-r22.
Clausen, G. and Ersland, A. 1968. The respiralory properties of the blood of lwo
diving rodenls, lhe beaver and lhe water vole, Respiration Physioloqy, 5r 350-
359.
Clausen, G. and Ersland, A. 1969. The respiralory properties of the blood of the
bladdernose seal (Cystophora cristata), Respi¡ation Physioloqy, 7 , l-6.
r97.
Clements, J.4., Nellenbogen, J. and Trahan, H.J. 1970. Pulmonary surfactanI and
evolution of the lungs, Science, 169, 603-604.
Craig, A.B. Jr and Pasche, A. J-980. Respiratory physiology of freely diving harbor
seals (Phoca vitulina), Physioloqical Zooloqy, 53, 4I9-432.
Crapo, J.D., Marsh-Salin, J., Ingram, P. and Pratt, P.C. l978a. Tolerance and
cross-tolerance using NOZ and O2. II. Pulmonary morphology and
m orphome try, Journal of Applied Ph vs io loo v. 44, J7O-379.
Crapo, J.D., Peters-Golden, M., Marsh-Salin, J. and Shelburne, J.S. l97Bb.
Pathologic changes in the lungs of oxygen-adapted rats: A morphometric
analysis. Laboratory Investiqalion, 39, 640-653.
Cruz-Orive, L.M. and Weibel, E.R. l-98L. Sampling designs for stereology, Journal
of Microscopy, I22, 235-257.
Cutz, E. and Conen, P.E. L971. Ultrastruclure and cytochemistry of Clara cells,
American Journal of Patholo ov. 62 , r21-r34.
Dailey, M.D. I91O. The transmission of Parafilaroides decorus (Nematoda:
Metaslrongyloidea) in the Calif ornia sea lion (Zat"pnus catitorn .
Proceedinqs of the Helm!1llploqical Society of Washinqton, 37, 215-222.
Daly, M. de B. lg8l-. The diving response, in Pethes, G. and Frenyo, V.L. (eds),
Advances in Animal and Comparalive Physioloqy. Buda pest: Akademiai Kiado,
pp 289-296
Delyamure, S.L. 1955. Helminthofauna of marine mammals (ecoloqy and
phyloqeny) (1968), Academy of Sciences USSR, I-52I. Translated from Russian.
Israel Program for Scientif ic Translations, Jerusalem.
Denison, D.M., Warrell, D.A. and Wesl, J.B. 1971. Airway structure and alveolar
emptying in lhe lungs of sea lions and dogs. Respiration Physioloqy, 1,3r 253-
260.
Denison, D.M. and Kooyman, G.L. L973. The struclure and function of Lhe small
airways in pinniped and sea oller lungs, Re iralion Ph siolo 17,1-10.
l9B.
Dhindsa, D.S., Metcalfe, J., Hoversland, A.S. and Hartman, R.A. I974.
Comparalive studies of the respiratory functions of mammalian blood. X.
Killer whale (Orcinus orca, Linnaeus) and beluga whale (Delphinaplerus leucas),
Resp iration Phvsioloov. 20 ,93-ro3.
Domrow, R. 1974. Notes on halarachnine larval morphology and a new species of
Pneumonvssus Banks (Acari: Dermany ssidae). Journal of the Australian
Entomolo ical Sociel 13, I7-26.
Dormer, K.J., Denn, M.J. and Stone, H.L. L917. Cerebral blood flow in the sea lion
(Zalophus californianus) during volunlary dives, Comparalive Biochemistry and
Physioloqy, 5BA, 11-lB.
Dougherty, E.C.and Herman, C.M' 1941. New species of the genus Parafilaroides
Dougherty, 1946 (Nematoda: Metastrongylidae), from sea-lions, wilh a list of
the lungworms of the PinniP edia. Proceedinq s of the Helmintholoqical Society
of Washington, 14, 77-87.
Dunlap, J.S., Piper, R.C. and Keyes, M.C. I976. Lesions associated
Orthohalarachne attenuata (Halarachnidae) in the Northern fur
Callorhinus ursinus). Journal of Wildlife Diseases I2, 4?-45.
with
seal
(
Dunnill, M.S. 1962. Postnatal growth of the lung, Thorax, Ll,329-333.
Dunnill, M.S. 1964. Evaluation of a simple method of sampling the lung for
19, 443-448.quantitative hislolog ical analysis, Thorax
Dykes, R. W. 1974. Factors related Lo the dive ref lex in harbor seals: Sensory
contributions from the lrigem inal region, C anadian Journal of Phvsioloov and
Pharm acoloqy, 52, 259 -265.
EIias, H. and Hyde, D.M. 1980. An elementary introduclion to stereology
(quantitative microscopy), American Journal of Anatomy, I59, 4II-446.
EIsner, R. l-965. HearI rate response in forced versus trained experimental dives in
p innipeds, Hvalradets Skrifter 48,24-29.
Elsner, R.W., Franklin, D.L. and Van Citters, R.L. 1964. Cardiac oulput during
diving in an unrestrained sea lion, N a ture 202, Bo9-BLo.
r99.
EIsner, R.W., Franklin, D.L., Van Citters, R'L' and KenneY, D.W. 1966-
r53,94r-949.Cardiovascular defense against asphyxia' Science
Exner, H.E. Ig16. Derivations of the working rela[ionship of stereology. A. Volume
fnaction analysis, in underwoocl, E.8., de wit, R. and Moore, G.A. (eds),
Proceedinqs Fourth International Conqr ess for Stereoloqy. National Bureau of
Sbandards, Special Publication 411. Washingbon: Government Printing Office'
pp 446-448.
Fanning, J.C. Ig7l. The submicroscopic structure of the dolphin lung. Ph.D.
Thesis, UniversitY of Adelaide.
Fanning, J.C. and Harrison, R.J. 1974. The structure of the trachea and lungs of
the South Australian bottle-nosed dolphin, in Harrison, R.J. (ed.), Functional
Anatomy o f Marine Mammals, Vol. 2. London: Academic Press, pp 23I-252'
Fay, F.H. and Furman, D.P. L982. Nasal miles (Acari: Halarachnidae) in the
other pinnipeds of Alaskan waters.spotled seal, Phoca laroha Pallas, and
rB, 63-68.Jou rnal of Wildlife Diseases
Ferren, H. and Elsner, R. I978. Diving physioloqy of the ringed seal: Adaptations
and implications, in Alaska Fisheries: 200 Years and 200 Miles of Chanqe.
proceedings 24th Alaska Science Conference, August I918. Sea Grant Report
79-6, August L979. College, Alaska: Alaska Division, American AssociaLion for
the Advancement of Science.
Fiebiqer, J. 1916. Uber eigentümlichkeiten im Aufbau der Delphinlunge und ihre
physiologische Bedeutungt Anabom ischer Anzeiqer, lt8 , 540-565. Cited by
Belanger, L.F. 1940. A study of the histological structure of the respiratory
portion of the lungs of aquatic mammals, American Journal of Anatomy,67,
437 -469.
Fleischman, R.W. and Squire, R.A. I97O. Verminous pneumonia in lhe California
sea lion (Zalophus californianus). Patholoqia Veterinaria. 7, 89-101.
Forresf, J.B. Ig76. Lung lissue plasticity: Morphometric analysis of anisotropic
strain in liquid filled lungs, Respiration Physioloqy. 21,223-239.
200.
Forresl, J.B. 1979. Structural aspects of gas exchange, Federation Proceedin
38,209-214.
Forrest, J.B. and Weibel, E.R. 1975. Morphometric estimation of pulmonary
diffusion capacity. VII. The normal guinea pig lung' iration Ph lo 24,Re
L9L-202.
Frost, K.J. and Lowry, L.F. l98L. Ringed, Baikal and Caspian seals - Phoca
hispida, Phoca sibirica and Phoca caspica, in RidgwaY, S.H. and Harrison, R.J.
(eds), Handbook of Marine Mammals Vol. 2, lgglg. London: Academic Press,
pp. 29-51.
Fung, Y.C. and Sobin, S.S. 1969. Theory of sheet flow in lung alevoli. Journal of
App Iied Phvsioloqy, 26 , 47?-488.
Funman, D.P. and Smith' A.W. 1973. In vitro development of two species of
Orthohalarachne (Acarina: H alarac hnidae) and ad aptations of lhe life cycle
for endoparasitism in mammals, Journal of Medical Entomoloqy, I0, 415-416-
Gail, D.B. and Lenfant, C.J.M. 1983. Cells of the lung: Biology and clinical
implications, American Review of Respiralory Disease, 1,27, 366-J87.
Gallivan, G.J. l-980. Hypoxia and hypercapnia in the respiratory control of lhe
Amazonian manatee (Trichechus inunquis) , Physiological Zool!W, 5J, 254-26I
Gallivan, G.J. l-98la. VenLilation and gas exchange in unrestrained harp seals
hoca roenlandic . Comparative Biochemist nd Phvsioloov. 694 ,809-811.rYa
Gallivan, G.J. l98l-b. Comparative pulmonary slructure and function in two larqe
mammals, the horse and the cow. Ph.D. thesis, McMaster University.
Gallivan, G.J. and Best, R.C. I980. Metabolism and respiration of the Amazonian
m anatee richechus inu u is), Physioloqical Zooloqy, 5J, 245-253.
Gamsu, G., Thurlbeck, W.M., Macklem, P.T. and Fraser, R.G. I97I. Peripheral
bronchographic morphology in the nonmal human lung, Investiqative Radioloqy,
6, l6l_-170.
201.
Gaskin, D.E. 1982. The Ecoloqy of Whales and Dolphins. London: Heinemann
Educational Books.
Geelhaar, A. and Weibel, E.R. I97I. Morphometric estimation of pulmonary
diffusion capacity. III. The effecl of increased oxygen consumption in Japanese
waltzing mice, Respiration Physiolooy, II, J54'366.
Gehr, P. and Weibel, E.R. 1974. Morphometric esLimabion of regional differences
in the dog Iung, Journal of Applied Physioloqy. 37, 648-653.
Gehr, P., Bachofen, M. and Weibel, E.R. l978a. The normal human lung:
Ultrastructure and morphometric estimation of diffusion capacity . Respiration
Physioloov, J2, I,ZL-I4O.
Gehr, P., Hugonnaud, C., Burri, P.H., Bachofen, H. and Weibel, E.R. 1978b.
Adaptation of the growing Iung to increased Vgr: III. The effecl of exposure to
cold environment in rats, Respiration Physioloqy, 32, 345-J5J.
Gehr, P. and Erni, H. 1980. Morphometric eslimalion of pulmonary diffusion
capacif y in two horse lungs, Respiration Physioloqy, 4I' I99-2IO.
Gehr, P.,Sehovic, S., Burri, P.H., Claassen, H. and Weibel, E.R. 1980. The lung of
shrews: Morp hometric estimalion of diffusion capacity, Respiralion
Physioloqy, 40 ,3t-47.
Gehr, P., Siegwart, B. and Weibel, E.R, l9BLa. Allometric analysis of the
morphometric pulmonary diffusing capcity in dogs, Journal of Morpholoqy, 168,
5-r5.
Gehr, P., Mwangi, D.K., Ammann,4., Maloiy, G.M.O., Taylor, C.R. and Weibel,
E.R. 1981b. Design of [he mammalian respiratory system. V. Scaling
morphometric pulmonary diffusing capacity to body mass: wild and domestic
mammals, Respiration Physiolooy. 44, 6I-86.
Genlry, R.L., Kooyman, G.L. and Goebel, M.E. 1981. Feeding and diving behavior
of Northern fur seals, Callorhinus ursinus. Unpublished m anuscript.
202.
Geraci, J.R. and Smith, T.G. L975. Funclional hematology of ringed seals (Phoca
Gil, J. and Weibel, E.R. 1969. Improvements in demonstration of lining layer of
lung alveoli by electron microscopy. Respiralion Physioloqy. B, L3-36.
Gil, J. and Weibel, E.R. L97I. Extracellular lining of bronchioles after perfusion-
fixation of rat lungs for eleclron microscopy' Anatom ical Record t69, r85-
200.
Gil, J. and Weibel, E.R. I912. Morphological study of pressure-volume hysleresis
in rat lungs fixed by vascular perfusion, Respiralion Physioloqy, 15, I9O-2I3.
Gillespie, J.R. I98l. Mechanisms that determine functional residual capacity in
different mammalian species. American R eview of Resoiratorv Disease. f 2 B,
7 4-17 . (Suppl.)
hispida) in the Canadian Arctic,
Canada, 32, 2559 -256t+-
1967.
horse
the Greenland seal, h ilus
Journal of Fisheries Research Board of
lung, American Review of Respiratory
Journal of
Gillespie, J.R. and Tyler, W.S.
interalveolar septa of the
Quantitative electron m icroscopy of lhe
D isease 95,477-483.
Glauert, A.M. 1975. Fixalion, dehydralion and embedding of biological specimens,
in Glauerl, A.M. (ed.), Prac lical Methods in Eleclron Microscoov. Amsterdam:
North Holland, l(1), pp l'-2O7.
Glazier, J.8., Hughes, J.M.B., Maloney, J.E. and West, J.B. l-967. Vertical gradient
of alveolar size in lungs of dogs frozen intact, Journal of Applied Physioloqy.
23,694-705.
Glazier, J.8., Hughes, J.M.B., Maloney, J.E. and Wesl, J.B. 1969. Measurement of
capillary dimensions and blood volume in rapidly frozen lunqs,
Applied Physiology, 26, 65-76.
Glazova, T.N. 1977. Physiological and biochemical characteristics of the blood of
enland icusP
Bioche m istry and Phvsioloqy. 1l ,220-224.
Journal of Evolulionary
203.
Goudappel, J.R. and Slijper, E.J. I958. Microscopic slructure of the lungs of lhe
botflenose whale, Nalure, IB2, 479-
Green, R.F.1972. Observations on the anatomy of some cetaceans and pinnipeds,
in Ridgway, S.H., Mammals of the Sea: Bioloqy and Medicine. Springfield: C.C.
Thomas, pp 247-297.
Gundersen, H.J.G. and Østerby, R. 1981. Optimizing sampling efficiency of
stereological studies in biology: Or'Do more less well!', Journal of Microscopy,
r2r, 65-73.
Gupta, M., Mayhew, T.M., Bedi, K.s., sharma, A.K. and White, F.H. Inter-animal
variation and its influence on the overall precision of morphometric estimates
based on nested sampling designs. Journal of Microsco nr, r47-r54.
Haies, D.M., Gil, J. and Weibel, E.R. I9BI. Morphometric study of rat lung cells. I.
Numerical and dimensional characteristics of parenchymal cell population,
American Review of Res p iratorv Disease, l-2J ,5J3-54L.
Haldiman, J.T., Henry, R.W., Henk, W.G., Abdelbaki, Y.2., Al-Bagdadi, F.K. and
Duffield, D.w. l-980. Respiratory anatomy of the bowhead whale (_Egþ9rlg
myslicetus) of Alaska, American Zoologisl, 20,759 (abstract).
Hance, A.J. and Cryslal, R.G. 1975. The connective tissue of lung, American
Review of Resp iratory Disease, lJ- 2, 651-7 rL.
Hansen, J.E., Ampaya, E.P., Bryant, G.H. and Navin, J.J. L975. Branching pattern
of airways and air spaces of a single human terminal bronchiole, Journal of
Applied Physioloqy, 38' 9Bt-989.
H arrison, R.J. and Tomlinson, J.D.W. 1963. Anatomical and physiological
adaplions in diving mammals, View inls in Biolo 2, rr5-L62.
Harrison, R.J., Ridgway, S.H. and Joyce, P.L. 1972. Telemelry of heart rale in
diving seals, Nature. 237r ZBO.
Harrison, R.J. and Kooyman, G.L. 1981. Diving in marine mammals, in Head, J.J.
(ed.), Carolin a Bioloov Read ers. 6. Carolina Bio logical Supply Company.
204.
Haslefon, P.S. I972. The internal surface area of the adult human Iung, Journal of
A natomv. lI2 , l9l_-400.
Hayatdavoudi, G., Crapo, J.D., Miller, F.J. and O'Neil, J.J. l9B0' Factors
determ ining degree of inf Iat ion in intracheally f ixed rat lungs. Journal of
Aoolied Ph vsioloov - ResÞirator v Environmental and Exercise Phvsioloqy. 4 B,
389-193.
Haynes, F. and Laurie, A.H. I9J1. On the histological struclure of cetacean lungs,
D iscov ery Reoorts. l-7 , I-6'
Heezen, B.C. 1957. Whales entangled in deep sea cables, Deep-Sea Research,4,
105-l_r5.
Hepburn, D. I896. Halichoerus qrypus: the qrey seal. Observations on its external
appearances and visceral anatomy. IV. Examinalion of the viscera, Journal of
Anatom y and Physioloqy, 30, 4BB-501.
Hepburn, D. IgI2. Scottish National Antarctic Expedilion: Observalions on the
ana[omy of the W eddell seal (Leptonychotes weddelli). III. The respiralory
system, and Lhe mechanism of respiration, Transactions of the Ro I Societ
Ed inburoh. 48 ,32r-332.
Heusner, A.A. 1983. Body size, energy metabolism, and the lungst Journal of
Applied Physioloqy - ResPirator y Environme ntal and Exercise PhysioloqY, 54
867-873.
Hijiya, K., Okada, Y. and Tankawa, H. 1977. Ultrastructural study of the alveolar
brush cell, Journal of Electron Microsc 26,32r-329.
Hochachka, p.W. 1981. Brain, lung and heart functions during diving and recovery.
Science, 2I2,5O9-5I4.
Hochachka, P.w., Liggins, G.c., Gvist, J., Schneider, R., snider, M.Y., Wonders,
T.R. and Zapol, W.M. I977. Pulmonary metabolism during diving: Conditioning
blood for the brain, Science. I9B' Bll-814.
W. and Zubzanda, J. 1977. Velocity of oxygenHolland, R.A.B., Van Hezewijk'
uptake by partlY saturated
Physioloov.29 ,2O3-Jr4.
adult and fetal human red cells, Respiralion
205.
Hughes, G.M. l-978. A morphological and ultrastructural comparison of some
vertebrate lungs, in, Klika, E. (ed.), XIXth Morpholooical Conoress Symposia.
Prague: Charles University' pp 393-4O5.
Hughes, G.M. and Weibel, E.R. 1976. Morphometry of fish lungs, in Hughes, G.M.
(ed.), Respiration of Amphibious Vertebrates. London: Academic Press, pp 2I3-
232.
Hugonnaud, C., Geht, P., Weibel, E.R. and Burri, P.H. 1,977. Adaptation of lhe
growing lung to increased oxygen consumplion. II. Morphometric analysis,
Resp iration Phvsioloqv. 29 , l-10.
Hui, C.A. 1975.
dolphin, R
Hyatt, R.E., Schilder, D.P. and Fry, D.L. L958. Relationship between maximum
expiratory flow and degree of lung inflaLion. Journal of Applied Physioloqy, 13,
33r-336.
Hyde, D., Orthoefer, J., Dungworth, D., Tyler, W., Carter, R. and Lum, H. )-918-
Morphometric and morphologic evaluation of pulmonary lesions in Beagle dogs
chronically exposed to high ambient levels of air pollutants, Laboratory
Investioation. JB ,455-469.
Hyde, D.M., Samuelson, D.4., Blakeney, W.H. and Kosch, P.C. I979. A correlative
light microscopy, transmission and scanning electron microscopy study of the
ferret lung, Scanninq Electron Microscoov. III, 891-898.
Inselman, L.S. and Mellins, R.B. l98l. Growth and Development of the lung,
Journal of Paediatrics. 98 , l-l_5.
Irving, L. 1939. Respiration in diving mammals, Physioloqical Reviews. 19, Il'2-
134.
Irvinq, L., Solandt, O.M., Solandl, D.Y. and Fisher, K.C. 1935. The respiratory
metabolism of the seal and its adjustmenl to diving,
Thoracic
iration Ph
collapse
to
as affected by
25, 63-70.
the retia thoracica in the
Comparative Physioloqy, 7, r31-r5I.Journal of Cellular and
206.
Irvinq, L., Scholander, P.F. and Grinnell, S.W. I94I. The respiration of the
porpo ise, Tursiops truncalus, Journal of Cellular and Comparalive Physioloqy,
I7, l-lt5-168.
Irving, L., Scholander, P.F. and Grinnell, S.W. 1942. The regulation of arterial
blood pressure in the seal during diving, American Journal of Physiology, 135,
557 -566.
Irving, L., Peyton, L.J., Bahn, C.H. and Peterson, R.S. L961. Aclion of the hearL
and breathing during the development of fur seals (Callorhinus ursinus).
Physioloq ical Zooloqy, J6 , r-2o.
Jeffery, P.K. and Reid, L. 1915. New observations of rat airway epithelium: A
quantilative and electron microscopic study, Journal of Anatomy, I2O, 295-
320.
Jeffery, P.K. and Reid, L.M. l-977. The respiratory mucous membrane, in Brain,
J.D., Proctor, D.F. and Reid, ¡.¡¡4. (eds), Resoiratory Defence Mechanisms:
Parf l. New York: Marcel Dekker, pp. I93-245-
Johnston, D.G. and Ridgway, S.H. l-969. Parasitism in some marine mammals.
Journal of the American Veterinary Medical Association, I55, 1064-101 2.
Jones, D.R., Fisher, H.D., McTaggart, S. and West, N.H. 1971. Heart rate during
brealh-holding and diving in the unrestrained harbour seal (Phoca vitulina
richard i), Canadian Jo urnal of Zooloov. 5 r,67t-680.
Jubb, K.V.K. and Kennedy, P.C. I97O. Patholoqy of Domestic Animals. Vol. 1. 2nd
Ed. London: Academic Press.
Kapanci, Y., Assimacopoulos,4., Irle, c., Zwahlen, A. and Gabbiani, G. L974,
"Contrac tile interstiLial cells" in pulm onary alveolar sep ta: A possible
regulator of ventilalion/perf usion ralio? UltrastrucLural, immunofluorescence'
and in vitro sludies, Journal of Cell Bioloqy. 60 , J75-392.
Karnovsky, M.J. 1965. A formaldehyde-glutaraldehyde f ixative of high osmolality
for use in electron microscopy. Journal of Cell Bioloqy, 27' I37A-I3BA.
201.
Keller, H.J., Friedli, H.P., Gehr, P., Bachofen, M. and weibel, E.R. 1976. The
effects of optical resolution on the estimation of stereological parameters, in
Underwood, E.E., de Wit' R. and Moore, G.A. (eds), Proceedinqs Fourth
International Conqress for Stereoloqv. National Bureau of Standards , Special
Publication 43I. Washington, DC: US Government Printing Office, pp 409-4J-0.
Kennedy, 4.R., Desrosiers, 4., Terzaghi, M. and Little, J.B. I918. Morphometric
and histological analysis of lhe lungs of Syrian golden hamsters, Journal of
Anatomy, I25,521-55J.
Kerem, D.H., Kylslra, J.A. and Saltzman, H.A. I975. Respiratory flow rates in the
sea lion, Undersea Biomed ical Research. 2, 20-27.
Keyes, M.C. l-965. PathologY o f the Northern fur seal. Journal of the American
Veterinarv Medical Association. l-47 , l_090-1095
Kim, J.C.S. I911. Pulmonary acariasis in Old World monkeys. Veterinary Bulletin,
47, 249-255.
Kim, J.C.S. 1980. Pulmonary acariasis in OId World monkeys: A review, in
Montali, R.J. and Migaki, G. (eds), The Comparalive PaLholoqy of Zoo Animals.
Washington, DC: Smithsonian Institution Press, pp. 383-394.
Kim, K.C., Haas, V.L. and Keyes, M.C. 1980. Populations, microhabitat preference
and effecls of infestation of two species of Orthohalarachne (Halarachnidae:
Acarina) in the Northern fur seal. Jou rnal of Wildlife Diseases. I6, 45-5r
King, J.E. and Harrison, R.J. 196I. Some notes on the Hawaiian monk seal, Pacific
Science. l'5, 282-293.
Kooyman, G.L. 1966. Maximum diving capacilies of lhe Weddell seal,
Leptonychotes weddelli, Science. I5I, I553-L554.
Kooyman, G.L. 1967. An analysis of some behavioral and physiological
characterislics relaled to diving in the Weddell seals, in Llano, G.A. and
Schmitt, W.L. (eds), Bioloqy of lhe Antarctic Seas, III. Antarctic Research
Series, Vol. 11. Washington: American Geophysical Union, pp 227-26I

208.
Kooyman, G.L. 1973. Respiratory adaptalions in marine mammals, American
Zoo ist. ll ,457-468.
Kooyman, G.L. 1982. How marine mammals dive, in Taylor, C.R., Johansen, K.
and Bolis, L. (eds), A Comp anion to Animal Phvsioloov. Cambrid ge: Cam bridge
Universily Press, pp 15l-160.
Kooyman, G.L. and Andersen, H.T. L969. Deep diving, in Andersen, H.T. (ed.), The
Bioloqy of Marine Mammals. New York: Academic Press, pp 65-94.
Kooyman, G.L., Hammond, D.D. and Schroeder, J.P. 1970. Bronchograms and
tracheograms of seals under pressure, Science, 169, 82-84.
Kooyman, G.L., Kerem, D.H., Campbell, W.B. and Wright, J.J. l97l-.. Pulmonary
function in freely diving Weddell seals, Leptonychotes weddelli, Respiration
Physioloqy, I2, 27 L-282.
Kooyman, G.L. and Campbell, W.B. 1972. Heart rates in freely diving Weddell
seals,
3I-36.
Leotonvcho le s weddelli. Comparative Biochemistry and Physioloqy, 4JA,
Kooyman, G.L., Schroeder, J.P., Denison, D.M., Hammond, D.D., Wright, J.J. and
Bergman, W.P. I972. Blood nitrogen tensions of seals during simulated deep
d iv es, American Journal of Phvsioloqy, 22J , 101_6-1020.
Kooyman, G.L., Kerem, D.H., Campbell, W.B. and Wrighl' J.J. 1973. Pulmonary
gas exchange in freely diving Weddell seals, Respiration Physioloqy, I7,283-290.
Kooyman, G.L., Norris, K.S. and Gentry, R.L. 1975. Spout of the gray whale: Its
physical characterisbics, Science. l90r 908-910.
Kooyman, G.L., Gentry, R.L. and Urquhart, D,L. I976. Norlhern fur seal divinq
behavior: A new approach to its study, Science, I93r 4IL'4L2.
Kooyman, G.L. and Sinnett, E.E. 1979. Mechanical properties of lhe harbour
porpoise lung, Phocoe na ohocoena. Respiration Physioloqy. 36, 287 -3O0.
209.
Kooyman, G.L., Wahrenbrock, E.4., Castellini, M.A., Davis, R.W. and Sinnett, E.E.
1980. Aerobic and anaerobic melabolism during voluntary diving in Weddell
seals: Evidence of preferred pathways from blood chemistry and behaviour,
Journal of Compar ative Phvsioloov 8.. Il 8,3t5-J46.
Kooyman, G.L. and Cornell, L.H. l9BL. Flow properties of expiration and
inspiration in a trained bottle-nosed porpoise, o ical Zool 54, 55-6r.Ph
Krahl, V.E. 1964. Analomy of the mammalian lung, in Handbook of Physioloqy,
Section R ira ti Volume l-. Washington, DC: American Physiological
Society, pp 213-284.
Kuhn, C., Callaway, L.A. and Askin, F.B. L974. The formation of granules in the
bronchiolar Clara cells of the rat. I. Electron m icroscopy, Journal of
Ultrastructure Research 49, tB7-4O0.
Kurochkin, Y.V. and SobolewskY, E.I. L975. Nasal mites Orthohalarachne attenuata
of Norther f ur seals. Raooorts et Proces-Verbaux des Reunions. Conseil
International oour ItExoloration de la Mer. 169 , 362.
Lambert, M.W. 1955. Accessory bronchiole-alveolar communications, Journal of
Patholoqy and Bacterioloqv. 70 , 3rL-3I4.
Lapennas, G.N. and Reeves, R.B. 1982. Respiratory properties of blood of lhe gray
seal, Halichoerus qrypus, Journal of Comparalive Physioloqy, I49' 49-56-
Laurie, A.H. 1933. Some aspects of respiration in blue and fin whales, Discovery
Reports, 7, 363-406.
Lechner, A.J. 1978. The scaling of maximal oxygen consumption and pulmonary
dimensions in small mammals, Respiration Physioloqy, 34 ,29-44.
Leith, D.E. 1976. Comparative mammalian respiratory mechanics, Physioloqist,
t9, 485-510.
Lenfant, C. 1,969. Physiological properLies of blood of marine mammals, in
Andersen, ¡.7. (ed.)¡
Press, pp 95-1J.6.
The Bioloqy of Marine Mammals. New York: Academic
2IO.
Lenfant, C., Elsner, R., Kooyman, G.L. and Drabek, C.M. 1969. Respiratory
function of blood of the adult and fetus Weddell seal, Leptonychotes weddelli,
American Journal of Ph iolo 216, 1595-1597.
Lenfant, C., Johansen, K. and Torrance, J.D. l-970. Gas transport and oxygen
slorage capacity in some pinnipeds and the sea otter, Respiralion.-P¡y-s-t-qþ-911-'
9,277-286.
Lewis, P.R. and Knight, D.P. 1977. Staining meLhods for sectioned material, in
Glauert, A.M. (ed.), Praclical Methods in Electron Microscopy. Amslerdam:
North Holland, :(I)' pp 1-111.
Lin, Y.-C., Malsuura, D.T. and Whittow, G.C. I972. Respiratory variation of hearL
rate in the California sea lion, Americ an Journal of Phvsioloov.222 ,260-264.
Ling, J.K. and Walker, G.E. I977. Seal studies in South Australia: Progress report
for the period January I976 to March 1977. South Australian Naturalist, 52,
LB-27.
Leid, R.W.Jr and Williams, J.F. 1919. Helminth parasites and the host
II,229-27r.inflammatory system. Chemical Zo
Lutz, P. 1982. Oxygen transport in vertebrale blood: Challenges, in Taylor, C.R.,
Johansen, K. and Bolis, L. (eds), A Companion to Animal Physioloqv
Cambridge: Cambridge University Press, pp 65-72.
McDonnnell, W.N. I974. The effect of anaesthesia on pulmonary gas exchange and
arterial oxygenation in the horse. PhD thesis, Cambridge University. Cited by
Gallivan, G.J. 198lb. Comparative pulmonary structure and function in two
large mammals, the horse and the cow. PhD thesis, McMas[er University.
McDonnell, W.N., Hall, L.W. and Jeffcott, L.B. I979. Radiographic evidence of
impaired pulmonary function in laterally recumbent anaeslhelised horses.
Equine Veterinary Joqrnaf II, 24-32.
McDowell, E.M., Barrett, L.4., Glavin, F., Harris, C.C. and Trump, B.F. 1978. The
respiratory epithelium. I. Human bronchus,
Inst i lu te 6I,539-549.
Journal of the National Cancer
2II.
Macklem, P.T. and Mead, J. 1968. FacLors determining maximum expiralory flow
in dogs, Journal of Applied Physioloqy. 25, I59-169.
Macklem, P.T, Proctor, D.F. and Hogg, J.C. 1970. The stability of peripheral
airways, Respiration Physioloqy. B, I9I-2O3.
McLaughlin, R.F., Tyler, W.S. and Canada, R.O. l-961-. A study of the subgross
pulmonary anatomy in various mammals, American Journal of Anatomy, l0B,
r49-165.
Madigan, S. and Lawrence, V. 1982. A General Analysis of V ariance Prooram for
the Apple II,H SD Anova II Packaqe. Norlhri dge: Human Systems DYnamics.
Maina, J.N., King, A.S.and King, D.Z. L982. A morphometric analysis of the lung
of a species of bat, Res iration Ph iolo 50, l-11.
Man'kovskaya, I.N. I975. The conlent and distribulion of myoglobin in muscle
tissue of Black Sea dolPhins,
Physioloqv, II, 22I-225.
Journal of EvolutionarY Biochem istry and
Margolis, L. L956. Parasilic helminths and arthropods from pinnipedia of the
Canadian Pacific coast. Journal of Fish eries Researc h Board of Canada. lJ
489-505.
Mariassy, A.T., Plopper, C.G. and Dungworth, D.L. 1975. Characteristics of bovine
Iung as observed by scanning electron microscopy,Anatomical Recor4 1"83, 13-
26.
Marlow, B.J. and King, J.E. L974. Sea lions and fur seals of Auslralia and New
Zealand, Journal of the Australian Mammal Society, l- , rL7 -rJ5.
Marfin, H.B. 1966. R.espiratory bronchioles as the pathway for collateral
ventilation, Journal of lied Ph iolo 21., 1443-1,447.
Massaro, G.D. and Massaro, D. I9Bl. Morphologic evidence lhat large inflaLions of
the Iung stimulate secretion of surfactant. American Review
D isease 1,27, 235-236.
of Re ira lor
2I2.
Mathieu, O., Cruz-Orive, L.M., Hoppeler, H. and Weibel, E.R. -ì.98L. Measuring
error and sampling variation in slereology: Comparison of the eff iciency of
various methods for planar image analysis, Journal of Microsco Lzr,75-BB.
Matthews, R.C. 1971. Pulmonary mechanics of California sea lions, Zalophus
californianus. Master's Thesis, San Diego State University.
Mazzone, R.W. 1980. Influence of vascular and transpulmonary pressures on the
functional morphology of the pulmonary microcirculation, M icrovascular
Research, 20,295-306.
Mazzone, R.W, Durand, C.W. and West, J.B. 1978. Electron microscopy of lung
rapidly frozen under controlled physiological conditions, Journal of Applied
Physiolocy - R esoiralory Environmental and Exercise P hvsioloov. 45 ,325-33J.
Meyrick, B. and Reid, L. 1968. The alveolar brush a third
pneum onocyte, Journal of Ultrastructure Research
Migaki, G., van Dyke, D. and Hubbard, R.C. 1971. Some histopathological lesions
caused by helminths in marine mammals. Journal of Wildlife Diseases 7,2Br-
289.
Miller, M.E., Christensen, G.C. and Evans,
Philadelphia: W.B. Saunders Co.
H.E. 1,964. Anatomy of the Dog.
Miller, P.J. 1971. An elastin stain, Medical Laboratory Technoloqy, 28, I4B-I49.
Morales, G.A. and Helmbotdt, C.F. I97),. Verminous pneumonia in the California
sea lion (Zalophus californianuÐ Journal of Wildlife Diseases 7, 22-27.
Müller,4.E., Cruz-Orive, L.M., Gehr, P. and Weibel, E.R. 1981. Comparison of
lwo subsampling methods for electron microscopic morphometry, Journal of
M icroscopy, I23, 35-49.
Murdaugh, H.V.Jr, Cross, C.E., Millen, J.E., Gee, J.B.L. and Robin, E.D. 1968.
Dissociation of bradycardia and arlerial constriction during diving in lhe seal
cell in rat lung
2t,7r-BO.
P hoca vi[ulina. Science. 1,62, 364-365.
MurPhY, B'' ZaPoI, W'M' an
heart, Iung , and braïn dur
fA IiedPh iol Re t1 aIor Env
1980. Metab olic activities of the
d Hochachka' P'W'Weddell seal' Journal
erY in theing drving and recov
andronm ntal Exercisee
Ph SIO
48, 196-605'
echniques [o render biological specimens
iúurPhY' J.A. r97B' Non-coating t
fi, L15-194'ElecttonM icro
conductive .5c annis andT rea Imen tof
JÍ. t916' The N or maI The ASIS rD nosB fo
MurraYtase. PhiladelPhia:
W .8. Saunders Co'
Pu lm ona1 D lseof rheLu BaILimore:
An [om and H isIo
Z. I cI ion aI a
o
Naga
U
ishi, C' 197
niversity Park Press'
un
ction of [he non-c
Needham, D'J'' Cargill, C'F' and
67. Bronchiolar and
Niden, A'H' 19t5B,1373'
m etabolism I 5cle nce
Nident A.H. and Yamada' E. 1966' So
iliated bronc
Sheriff, D' l9B0' H aematologY of the Auslralian
Jour lo fW iIdI ife D rse ASES 16, lol-ro7'a na
sea lion, Ne cac
J.H.T. 3¡i Barr¡
Nichoias, T'E'' Power'
a deeP breaLh .R iraLionPh ïoIo
H.A. I9B2' The pulmonary consequences of
49, trïlz4
n the fine structure and
me observaLions o
hiolar cells' in U yeda' R. (ed'), EIecLron
uzen Co' LLd., PP' '99-600'
Iarge alveolar ceII in pulmonary phosphotipid
Lt24.
fun
M. TokYo: Mar
if fusivity on alveolar gas
Nixon, W' "n¿ packr n 1980' Effec I of altered gas d
exchangea iheor ebical studY'
Ph iolo
Journal48, 141-L'3'ofA lied olo .R lr ator
Env m ental and I tse S
case of PulmonarY mite
H. and Suzuki' f. L919. A
Ogata' M., Itagaki' H'' 5irouzur lin oft heA Veterl na C ollezab
ïnfestation of a Calïfornian sea lion' Bu lle
4, zo1-2o9 'HaIe, F .C. and Elsner' R' 196g.Mechanics
of ventilation in the pilot
Olsen, C'R''
P
U
whale' Re iraEion Ph ioÌ 1 L' 1-L49.
214.
Pack' R'J'' Al-ugaily, L'H' and Morris, G. l-981. The ceils of the tracheobronchialepithelium of the mouse: A quanlitative light and electron micnoscope study,Journal of Anatomy, I3Z, 7I_84.
Pasche, A' r976' The effect of hypercapnia on respiraLory characteristics anddivinqbehaviouroffreelydivingseals,@26,IBJ-Ig4.
Pasche, A. and Krog, J. 1980. Heart rate inCom rative B ioche m is lr and Ph siolo
Paulev, P. 1965. Decompression
Journal of Aoolied Physiolo qv.
resting seals on land and in water.67A,77-83.
sickness following repeated breath_hold dives,20, IO2B-IO3I.
Paumgartner, D., Losa,
stereological esli matiof fractal dimensions,
G. and Weibel, E.R. I98l. Resolution effect on theon of surface and volume and its interprelation in termsJournal of M icrosco I2I, 5I-63
for
Perry, S.F. I978. euanti tative anatom y of the lungs of the red_eared turile,Psuedem S SCII ta ele ans Respiration ph yst oloqy, 35,245-262.
Pemy, s.F. r98l. Morphometric anarysis of purmonary structure: Methodsevaruation and comparison of unicamerar rungs, Mikroskopie, 38, 278_293.
Perry, S.F. l_98l Reptilian lungs: Functionar anatomy and evorutiòn, Advances inAnatom Emb and Cell Bi olo 79, I-BI.
Petrik, P. and Collet, A.J. L
autoradiography of in vivo incorpoand lH-galactose in non-ciliatedJournal of Anatomy, Ij9, 5Ig_534.
974. Quantitative electron mìcroscopicration of lH-choline, JH-leucine, lH_acetate
bronchiolar (Clara) cells of mice, American
Philp, R.B. 1974. A rdecompression: Rela
eview of blood changes associated with compression_
Research l_, tt7-150.tionship to decompression sickness. Undersea Biomedical
Piiper, J. I979. Series ventilation, diffusion in airways, and stratifiedinhom ogeneity, Federati on Proceedin 38, 17-2I.
2L5.
Pinkerton, K.8., Barry, 8.E., O'Neil, J.J., Raub, J.4., Pratt, P.C. and Crapo, J.D.
1982. Morphologic changes in the lung during the lifespan of Fischer 344 rats,
American Journal of Anatomv. 164 , r55-r74.
Pitts, G.C. and Bullard, T.R. 1968. Some interspecific aspects of body composition
in mammals, in Body Composilion in Animals and Man. Proceed ings of a
Symposium, May L961. Washinglon, DC: National Academy of Sciences, pp. 45-
70.
Pizey, N.C.D. 1954. The struclure of lhe pinniped lung, Journal of Anatomy, BB,
552 (abstract).
Plopper, C.G., Mariassy, A.T. and H ill, L.H. l-980a. Ultrast,ructure of the
noncilialed bronchiolar epithelial (Clara) cell of mammalian lung. I. A
comparison of rabbit, guinea pig, rat, hamster and mouse. Experimental Lunq
Research, I, I39-I54.
Plopper, C.G., Mariassy, A.T. and Hill, L.H. l-980b. Ultrastructure of the
nonciliated bronchiolar epitheliaÌ (Clara) cell of mam malian lung. II. A
comparison of horse, steer, sheep, dog and cat. Experimental Lunq Research,
\ t55-169.
Plopper, C.G., Hill, L.H. and Mariassy, A.T. l9B0c. Ultrastructure of the
nonciliated bronchiolar epilhelial (Clara) cell of mammalian lung. III. A study
of m an with comparison of 15 m am m alian species. Experimental Lunq
Research 1, It7-180.
Pride, N.8., Permutt, S., Riley, R.L. and Bromberger-Barnea, B. 1967.
Determinants of maximal expinatory flow from t,he lungs, Journal of Applied
Physioloqy, 2l , 646-662.
Pump, K.K. L964. The morphology of the finer branches of the bronchial tree of
the human lung, Diseases of lhe Chest, 46, Jl9-399.
Pump, K.K. 1969. Morphology of the acinus of the human lung,
Chesf, 56, 126-134.
hReid, L. 1967. The Patho of Em ma. London: Lloyd-Luke.
Diseases of the
216.
Repenning, C.A. and Tedford, R.H. I971. Otarioid seals of the Neogene, United
Slales Geoloq ical Survev Professional Paper, 992 , I-93.
Repenning, C.4., Ray, C.E. and Grigorescu, D. L979. Pinniped biogeography, in
Gray, J. and Boucot, A.J. (eds), Historical Biqqeqqlep¡)4 elatp_fqçlq!þlrqlqthe Chanqinq Environmenl. Oregon State University Press, pp 357-369.
Rhodin, J.A.G. 1966. Ultrastructure and funclion of the human lracheal mucosa,
American R eview of Resoiralorv Disease. 9J , 1-r5.
Rhodin, J.A.G. I974. Histoloqy: A TexL and Atlas. New York: Oxford University
Press.
Rhodin, J.A.G. L978. Microscopic anatomy of Lhe pulmonary vascular bed in the
cat lung, M icrovascular Research, I5 , L69-r93
Ridgway, S.H. L912. Homeoslasis in the aquatic environment, in Ridgway, S.H.
(ed.), Mammals of the Sea: Bioloqy and Medicine. Springf ield: C.C. Thomas, pp
590-7 47 .
Ridgway, S.H. 1976. Diving mammals and biomedical research, Oceanus, )-9,49-
55.
Ridgway, S.H. and Johnston, D.G. L966. BIood oxygen and ecology of porpoises of
three qenera, Science r5r, 456-458.
Ridgway, S.H., Scronce, B.L. and Kanwisher, J. \969. Respiration and deep diving
in the bottlenose porpoise, Science. 166, 165I-1654.
Ridqway, S.H., Simpson, J.G., Patton, G.S. and Gilmartin, W.G. 1970. Hematologic
f ind ings in certain small cetaceans, Journal of lhe Amenican Veterinary
Medical Associalion r57, 566-575.
Ridgway, S.H., Carder, D.A. and Clark, W. L975. Conditioned bradycardia in the
sea lion Zalophus californianus, Nature, 256, J7-38.
Ridgway, S.H. and Howard, R. 1919. Dolphin lung collapse and inlramuscular
circulation during free divinq: Evidence from nitrogen washoul, Science,206,
1r.8 2-r.l_Bl.
2rl.
Robin, E.D., Murdaugh, H.V.Jr, Pyron, W., Weiss, E. and Soteres, P. 1963-
Adaptations to diving in the harbour seal - gas exchange and ventilatory
response to CO2r American Journal of Physioloqy, 2O5, II75-II77-
Robinson, 4.J., Kropatkin, M. and Aggeler, P.M. 1969. Hageman factor (factor
XII) deficiency in marine mammals. Science 166, 1420-1422.
Robinson, N.E. 1982. Some functional consequences of species differences in lung
anatom y, Advances in Veterinary Science and Comparative Medicine, 26, I-32
Ronald, K. and Healey, P.J. I9BJ.. Harp seal - Phoca qroenlandica, in Rid 9waYt
S.H. and Harrison, R.J. (eds), Handbook of Marine Ma mmals. Vol. 2, Seals.
London: Academic Press, pp. 55-87.
Rosenquist, T.H., Bernick, S.. Sobin, S.5. and Fung, Y.C. 1973. The structure of
the pulmonary interalveolar microvascular sheet, Microvascular Research 5)
r99-2r2.
Ryan, S.F. 1969. The structure of the interalveolar septum of the mammalian
lung, Anatomical Record 165,467-484.
Ryan, S.F. L973. The structure of the primary lung lobule, Annals of Clinical and
Laborator Science 3, r47-r55.
Schalm, O.W., Jain, N.C. and Carroll, E.J. I975. Velerinary Hematoloqy. lrd Ed
Philadelphia: Lea and Febiger
Scheffer, V.B. L976. A Natural History of Marine Mammals. New York: Charles
Scribner's Sons.
Schmidt-Nielsen, K. I979. Animal Phvsioloqv: Adaptation and Env ironment.
Second Edition. Cambridge: Cambridge University Press.
Scholander, P.F. l-940. Experimental investigations on the respiratory function in
diving mammals and birds, Hvalradets Skrifter 22, I-I3r.
Scholander, P.F. 1964. Animals in aquatic environments: Diving mammals and
b irds, in Handbook of Physioloqy - Adaptation to the Environment. Washi
DC: American Physiotogical Society, pp 729-739.
ngton,
2LB.
Scholander, P.F. and Irving, L. 1941-. Experim enlal invesligations on
respiralion and diving of the Florida m anatee. Journal of Cellular
Comparative Physioloqy, 17 , r69-L9I.
Schreider, J.P. and Raabe, O.G. 198l-. Struclure of the human respiratory acinus,
American Journal of Anatom L62,22r-232.
Semba, R. 1979. Contributions to semithin sectioning on a conventional rotary
microtome, Stain Technolo 54,25r-255.
Shapunov, V.M. 197I. Evaluation of the economy and effectiveness of external
respiration in the dolphin Phoceana phoceana, Journal of Evolutionar
Bioche m istry and Physioloqy, 7 ,33I-335.
Shay, J., L975. Economy of effort in electron microscope morphometry, American
Journa I of Patholoov. Bl ,5O3-5L2.
Siegwart,8., Gehr, P., Gil, J. and Weibel, E.R. I971. Morphometric estimation of
pulmonary diffusion capacity. IV. The normal dog lung, Respiration Physioloqy,
I3, r4I-I59.
Simon, L.M., Robin, E.D., Elsner, R., Van Kessel, A.L.G.J. and Theodore, J. I914.
A biochemical basis for differences in maximal diving time in aquatic
m am m als, Comp arative Biochemistry and Physioloqy, 478 ,2O9-2L5.
Simpson, J.G., Gilmartin, W.G. and Ridqway, S.H. L970. Blood volume and olher
haematologic values in young elephant seals, American Journal of Veterinary
Research, ) r, L449-1452.
Simpson, J.G. and Gardner, M.B. 1912. Comparative microscopic anatomy of
selected marine mammals, in Ridgway, S.H. (ed.), Mammals of the Sea: Bioloqy
and Medicine. Springfield: C.C. Thomas, pp 298-418.
Sims, B. I974. A simple method of preparing I-2 pm sections of large tissue blocks
using glycol methacrylate, Jou rnal of Microscoov. lOL , 223-227.
Sinnett, E.E., Kooyman, G.L. and Wahrenbrock, E.A. 1978. Pulmonary circulalion
of the harbour seal, Journal of Applied Physioloqy
the
and
and Exencise Physioloqy, 45, 1 IB-721.
- Resoiratory Environmenlal
Slijper, E.J. 1962. Whales, Lranslated by Pomerans' A.J. London: HuLchinson.
2r9.
D. 1972. Veterinary Patholoqy. 4th Ed.Smith, H.4., Jones, T.C. and Hunt' R
Philadelphia: Lea and Febiger.
Smith, M.N., Greerrberg, S.D. and Spjut, H.J. I979. The Clara cell: A comparalive
ultrastructural study in mammals, American Journal of Anatomy, I55, I5-3O.
5mith, P., Healh, D. and Moosavi, H. I974. The Clara cell, Thonax 29, 1.47-163.
Sobin, S.S., Tremer, H.M. and Fung, Y.C. I970. Morphometric basis of the sheet-
flow concept of the pulmonary alveolar m icrocirculation in the cal,
Circulation Research, 26 , 397 -4r4.
Sokal, R.S. and Rohlf, F.J. 1969. Biometry. San Francisco: Freeman.
Sokolov,4.S., Kosygin, G.M. and Shustov, A.P. I97I. Slructure of lungs and
trachea of Berinq Sea pinnipeds, in Arsenrev, V.A. and Panin, K.I. (eds),
Pinnipeds of the North Pacìfic. Translated from Russian. Jerusalem: Israel
Program for Scientific Translations, pp 25O-262.
Spencer, M.P., Gornall, T.A. and Poulter, T.C. 1967. Respiralory and cardiac
activity of killer whales, American Journal of Physioloqy. 22r 974-98I.
spicer, s.s., Mochizuki, I., selser, M.E. and Martinez, J.R. 1980. Complex
carbohydrales of rat tracheobronchial surface epithelium visualized
u ltras lruc tural ly. Ame rican Journal of Anatomv. 15 8,93-LO9
stahl, w.R. 1967. Scalinq of respiratory variables in mammals, Journal of
Physioloqy, 22 , 453-460.
Stevens, C.M. l-971. The cardiovascular responses to breath-hold diving in the
free-swimming California sea lion, Zalophus californianus. Disserlation
Abslrac Ls Internalional.32 , l_lBt-B - 1182-B
Stirling, I. I972. Observations on the Australian sea lion,
(Peron). A ustralian Journal of Zooloov. 20 , 27r-279.
Neophoca cinerea
220.
Storey, K.B. and Hochachka, P.W. L974. Glycolytic enzymes in muscle of lhe
Pacific dolphin: Role of pyruvate kinase in aerobic-anaerobic transilion durinq
div ing, Comparative Biochem is lry and P hvsioloov.49B ,1l_9-128.
Strauss, R.H. 1979. Diving medicine,
ll9,1001-ro23.American Review of Respiralory Disease,
Canadian Journal of
Stroud, R.K. and Dailey, M.D. t978. Parasites and associated pathology observed
in pinnipeds stranded along the Oregon coast. Journal of Wildlife Diseases, J-4,
292-298.
Stroud, R.K. and Roffe, f .J. I919. Causes of death in marine mammals stranded
along the Oregon coasl, Journal of Wildlife Diseases t5, 9r-97.
Sweeney, J.C. I914. Common diseases of pinnipeds. Journal of the American
Ve terin ary Medical AssociaLion, 16 5, 805-810.
Sweeney, J.C. and Gilmartin, W.G. I914. Survey of diseases in free-living
California sea lions. Jour nal of Wildlife Diseases. l0 , J7O-376
Tanji, D.G., Weste, J. and Dykes, R.W. 1975. Interactions of respiration and the
bradycardia of submersion in harbor seals, - anadian Journal of Phvsioloov and
Pharm acoloqy, 53, 555-559.
Tarasoff, F.J. and Kooyman, G.L. I913a. Observalions on the anatomy of the
respiratory system of lhe river otter, sea otter, and harp seal. I. The
lopography, weighb, and measurements of the lungs,
Zooloqy, 51,, 163-170.
Tarasoff, F.J. and Kooyman, G.L. I97ib. Observations on lhe anatomy of the
respiratory system of the river otler, sea otter, and harp seal. II. The trachea
and bronhial tree, Canadian Journal of Zoolo 5L, L7l.-r77.
Tenney, S.M. and Remmers, J.E. L963. Comparative quantitalive morphology of
the mammalian lung: Diffusing area, Nalure, I97, 54-56.
Thurlbeck, W.M. 1967. The internal surface area of nonemphysemalous lungs,
American Rev iew of Resoiratorv Disease. 95 ,165-773
22r.
Thurlbeck, W.M.and Wang, N.S. 1974. The structure of the lungs, in Widdicombe,
J.G.W (ed.), Res irator Ph siolo MTP International Review of Science
Physioloqy Series l, Volume 2. London: Bullerworths, pp 1-30.
Tyler, W.S., Gillespie, J.R. and Nowell, J.A. 197I. Symposium on pulmonary and
carcliac function. I. Modern funclional morphology of lhe equine lung, Equine
Veteninary Journal, t, 84-94.
Van Citters, R.L., Franklin, D.L., Smith, O.A.Jr, Walson, N.W. and Elsner, R.W.
1965. Cardiovascular adaptations lo diving in the northern elephant seal
M iroun a ust iros tr i Comparative Biochemistrv and Phvsioloqv. l6 , 267-
27 6.
Veicsteinas, A., Magnussen, H., Meyer, M. and Cerretelli, P. I976. P.ulmonary 02
diffusing capacity at exercise by a modified rebreathing method. European
Journal of App lied Physioloqy, 35 ,79-BB.
von Hayek, H . L960. The Human Lung (translated by Krahl, V.E.). New York:
Hafner Publishing Co.
R. and Kenney, D.W. I974.Wahrenbrock, E.A., Maruschak, G.F., Elsner,
Respiration and metabolism in two baleen
Review (US Nat.Mar.Fish.Service), 36, J-9.
whale calves, M arine Fisheries
Walker, G.E. and Ling, J.K. 1980. Body weights and dimensions of adult female
Australian sea lions, Neophoca cinerea, Journal of Mammolo 6r, 164-165.
Walker, G.E. and Ling, J.K. I981. Australian sea lion - Neophoca cinerea, in
Ridgway, S.H. and Harrison, R.J. (eds), Handbook of Marine Mammals Vol. IThe Walrus. Sea Lions, Fur Seals and Sea Otter. London: Academic Press, pp
99-118.
W angens teen, D. and Weibe I, E.R. 1982. M orpho m etric ev alualion of
chorioallanLoic oxygen transport in the chick embryo. Respiration Physioloqy,
47, r-2O.
Weber, R.E., Johansen, K. and Abe, A.S. l9Bl-. Myoglobin from the burrowing
rep I ile Amphisbaena alba. ConcentraLions and functional characleristics,
ComDarative Biochemislrv and Phvsioloov. 68A , r59-165.
222.
Weibel, E.R. 1961. Morphomelry of lhe Human Lunq. Berlin-Gottingen-Heidelberg:
Spri nger-Verlag.
Weibel, E.R. 1970a. Morphometric estimation of pulmonary diffusion capacity. I.
Model and method, ResÞ iration Phvsiolooy. 1l ,54-75.
Weibel, E.R. 1970b. An
Journal of Microsco
aulomatic sampling stage m icroscope f or stereology,
9, l-lB.
Weibel, E.R. 1972. Morphometric estimation of pulmonary diffusion capacity. V.
Comparative morphometry of alveolar lungs, R iration Ph iolo r4, 26-
43.
Weibel, E.R. L973. Morphological basis of alveolar-capillary gqs exchange,
Physioloc ical Reviews. 53, 419-495.
Weibel, E.R. I979a. Stereoloq ical Methods. Volume 1. Practical Methods for
Bioloq ical Morphometry. London: Academic Press.
Weibel, E.R. 1979b. Oxyqen demand and lhe size of respiratory slructures in
mammals, in Wood, S.C. and Lenfant, C. (eds), Evolution of Respiralory
Processes: A Com oarative oroach. pp 289-346. New York: Marcel Dekker
Weibel, E.R. 1981. Morphological basis for üO/O distribution, in Hutas, I
Debreczeni, L.A. (eds), Advances in Physioloqical Science. Volume
Respiration. Budapest: Akademiai Kiado, pp J.79-J-89.
Weibel, E.R. l98l. How does lung structure affec[ gas exchange? Chesl, 83,657-
665.
Weibel, E.R. and Gomez, D.M. l-962. Architecture of the human lung, Science,
t37, 517-585.
Weibel, E.R. and Knighl, B.W. 1964. A morphometric study on the thickness of lhe
pulm onary air-blood barrier, Journal of Cell Bio 2r, J67 -384.
Weibel, E.R., Kistler, G.S. and Scherle, W.F. 1966. Practical stereological melhods
and
10.
for m orphometric cytology, Journal of Cell Bio 3O,23-JB.
22i
Weibel, E.R., Untersee, P., Gil, J. and ZuIauf, M. L971. Morphometric estimalion
of pulmonary diffusion capacity. VI. Effect of varying positive pressure
inflation of air spaces, Respiratory Physioloqy. IB, 285-108.
Weibel, E.R., Bachofen, M. and Gehr, P. I975. Estimation of pulmonary diffusing
capacity in human lungs by morphometry, Proqress in Resp iratorv R esearch. B,
110-140.
Weibel, E.R. and Gil, J. 1.917. Struclure-function relationships at the alveolar
level, in West, J.B. (ed.),
Marcel Dekker, pp. l-BJ-.
Bioenqineerinq Aspects of the Lung. New York:
Weibel, E.R., Claassen, H., Gehr, P., Sehovic, S. and Bumi, P.H. 1980. The
respiratory system of the smallest mammal, in Schmidt-Nielsen,. K., Bolis, L.
and Taylor, C.R. (eds), Comparative Physioloqy: Primitive Mammals.
Cambridqe: Cambridge University Press, pp lBJ--19J..
Weibel, E.R., Gehr, P., Cruz-Orive, L.M., MÜller, 4.E., Mwangi, D.K. and
Haussener, V. l98l-a. Design of the mammalian respiratory system. IV.
Morphometric estimation of pulmonary diffusing capacity; critical evaluation
of a new sampling method, Respiratory Physioloqy, 44, 39-59.
Weibel, E.R., Taylor, C.R., Gehr, P., Hoppeler, H., Mathieu, O. and Maloiy,
G.M.O. I98Ib. Design of the mammalian respiratory system. IX. Funclional
and structural limils for oxyg en flow. Respiralory Physioloqy, 44, 15I-164.
Weibel, E.R., Taylor, C.R., O'Neil, J.J., Leith, D.E., Gehr, P., Hoppeler, H.,
Langman, V. and Baudinette, R.V. 1983. Maximal oxygen consumption and
pulmonary diffusing capacity. A direct comparison of physiologic and
m orp hometric measurements in canids. Respiralion Physioloqy, 54, L7J-rBB.
Welsch, U. and Drescher, H.E. L9B?. Liqht- and electron m icroscopical
observations on lhe terminal airways and the alveolar parenchyma of the
Antarctic seals Lobodon carcinophaqus and Leptonychotes weddelli, Polar
Bioloqy, l, 105-l-14.
West, J.B. 1978. Regional differences in lhe lung, Chest, 4, 426-437
224
European Journal ofWiddicombe, J.G. and Pack, R.J. 1982. The Clana cell,
Respiratory Diseases, 63, 2O2-22O.
Wislocki, G.B. 1,929. On the structure of the lungs of the porpoise t_Iq!þpgtruncatus) American Journal of Anatomy, 44, 47 -77 .
Wislocki, G.B. 1915. The lungs of the manalee Trichechus latirost ris) compared
with those of other aquatic mammals, Bioloqical Bulletin, 6 8,385-396.
Wislocki, G.B. L942. The lungs of the cetacea, with special reference to the
harbour porpoise (Phoca"na phoc""na , Analom ical Records, 84, lt7-LzI.
Wislocki; G.B. and Belanger, L.F. 1940. The lungs of the larger cetacea compared
to those of smaller species, Bioloqical Bulletin, 7B , 289-297.
Young, 1., Vazzone, R.W. and Wagner, P.D. 1980. Identification of functional lung
unil in the dog by graded vascular embolization, Journal of Applied Physioloqy
- Resoirat,orv Environmental and Exercise Physioloqy. 49, rJz-r4r.
Zapol, W.M., Liggins, G.C., Schneider, R.C., Qvisl, J., Snider, M.T., Creasy, R.K.and Hochachka, P.W.I979. Regional blood flow during simulated diving in the
conscious Weddell seal, Journal of Aoolied Ph ysioloqy - Respinalory
Environmental and Exercise Physioloqy, 47 , 968-97).