Highlights from the full Australian Report: challenges for Australian education: results from PISA...
25
Australian Council for Educational Research ACEReSearch OECD Programme for International Student Assessment (PISA Australia) National and International Surveys 12-1-2010 Highlights from the full Australian Report: challenges for Australian education: results from PISA 2009 Sue Thomson ACER, [email protected] Lisa De Bortoli ACER, [email protected] Marina Nicholas ACER, [email protected] Kylie Hillman ACER, [email protected] Sarah Buckley ACER, [email protected] This Report is brought to you for free and open access by the National and International Surveys at ACEReSearch. It has been accepted for inclusion in OECD Programme for International Student Assessment (PISA Australia) by an authorized administrator of ACEReSearch. For more information, please contact [email protected]. Recommended Citation Thomson, Sue; De Bortoli, Lisa; Nicholas, Marina; Hillman, Kylie; and Buckley, Sarah, "Highlights from the full Australian Report: challenges for Australian education: results from PISA 2009" (2010). OECD Programme for International Student Assessment (PISA Australia). http://research.acer.edu.au/ozpisa/8
Transcript of Highlights from the full Australian Report: challenges for Australian education: results from PISA...

Australian Council for Educational ResearchACEReSearchOECD Programme for International StudentAssessment (PISA Australia) National and International Surveys
12-1-2010
Highlights from the full Australian Report:challenges for Australian education: results fromPISA 2009Sue ThomsonACER, [email protected]
Lisa De BortoliACER, [email protected]
Marina NicholasACER, [email protected]
Kylie HillmanACER, [email protected]
Sarah BuckleyACER, [email protected]
This Report is brought to you for free and open access by the National and International Surveys at ACEReSearch. It has been accepted for inclusionin OECD Programme for International Student Assessment (PISA Australia) by an authorized administrator of ACEReSearch. For more information,please contact [email protected].
Recommended CitationThomson, Sue; De Bortoli, Lisa; Nicholas, Marina; Hillman, Kylie; and Buckley, Sarah, "Highlightsfrom the full Australian Report: challenges for Australian education: results from PISA 2009"(2010). OECD Programme for International Student Assessment (PISA Australia).http://research.acer.edu.au/ozpisa/8

Programme for International Student Assessment
The PISA 2009 assessment of students’ reading, mathematical
and scientific literacy
Sue ThomsonLisa De Bortoli
Marina NicholasKylie Hillman
Sarah Buckley
PISA in Brief
Highlights from the full Australian Report:
Challenges for Australian Education: Results from
PISA 2009


Challenges for Australian Education: Results from PISA 2009 1
PISA is a survey of the knowledge and skills of 15-year-olds, mainly in industrialised countries.
◗ The survey, first carried out in 2000, is repeated every three years so that changes over time can be measured.
◗ Almost 470,000 students from 65 countries and economies took part in PISA 2009.
◗ Students answered a pen-and-paper assessment booklet containing questions from one or more of the reading, mathematical and scientific literacy domains. They also answered a 30-minute questionnaire about their background, their attitudes to school, and the learning strategies they use.
◗ Principals answered a 30-minute questionnaire about the level of resources in the school, the school environment and qualifications of staff.
PISA assesses young people’s ability to apply their knowledge and skills to real-life problems and situations rather than how well they have learned a specific curriculum.
◗ As in previous PISA assessments, PISA assessed students’ capabilities in reading, mathematical and scientific literacy. The word ‘literacy’ reflects the focus on broader skills and is used to mean much more than the common meaning of being able to read and write.
◗ To answer the PISA 2009 tasks correctly, students had to understand key concepts, use a range of processes in the correct way and apply their knowledge and skills in different situations.
◗ Some of the assessment tasks were multiple-choice questions, but many required students to construct and write their own answers.
PISA looks for answers to several important questions related to education, such as:
◗ How well prepared are young adults to meet the challenges of the future?
◗ What skills do young adults have that will help them adapt to change in their lives? Are they able to analyse, reason and communicate their arguments and ideas to others?
◗ Are some ways of organising schools and school learning more effective than others?
◗ What influence does the quality of school resources have on student outcomes?
◗ What educational structures and practices maximise the opportunities of students from disadvantaged backgrounds?
◗ To what extent is student performance dependent on their background? How equitable is education provision for students from all backgrounds?
What PISA tells usPISA in Brief summarises the results from the PISA 2009 assessment of students’ reading, mathematical and scientific literacy skills. It tells us about how students performed in the assessment and describes some wider findings about what lies behind their results.
The full Australian report is called Challenges for Australian Education: Results from PISA 2009, and is available from http://www.acer.edu.au/ozpisa/reports.
PISA 2009 assessed students’ capacities to apply knowledge and skills in reading, mathematical and scientific literacy. More assessment time was given to reading literacy, as this was the main focus for this cycle. Reading literacy was also the focus of PISA 2000, which allows us to make comparisons of reading performance between 2000 and 2009. In 2003 and 2006, more time was devoted to assessing mathematical and scientific skills and knowledge respectively. In 2012, the focus will again be on mathematical literacy and any changes over time will be able to be monitored.
In this way, PISA provides regular information on educational outcomes within and across countries. It provides insight into the range of skills and competencies in different assessment domains that are considered to be essential to an individuals’ ability to participate in and contribute fully to society, particularly a society that experiences rapid technological change.
PISA, like many other international studies, reports results as mean scores – a measure of average performance – along with various statistics that reflect the distribution of performance. PISA also provides a more detailed picture of performance by providing a profile of what students have achieved in terms of skills and knowledge – what they can do and what they know. This performance scale is divided into levels of difficulty, or ‘proficiency levels’. Students who have reached a particular proficiency level not only typically demonstrate the knowledge and skills associated with that level, but also the proficiencies required at lower levels. A student who performs at proficiency level 4, for example, is expected to show all the skills and knowledge of Levels 2 and 3, and to be able to complete any assessment tasks that are illustrative of those proficiency levels.
What is PISA (Programme for International Student Assessment)?

2 PISA in Brief
PISA participantsIn 2009, 65 countries participated in PISA. This included 34 OECD countries and 31 partner (non-OECD) countries and economies, as shown on the map below.
AlbaniaArgentinaAzerbaijanBrazilBulgariaChinese TaipeiColombiaCroatiaDubai (UAE)Hong Kong – ChinaIndonesiaJordan
KazakhstanKyrgyzstanLatviaLiechtensteinLithuaniaMacao – ChinaMontenegroPanamaPeruQatarRomaniaRussian Federation
SerbiaShanghai – ChinaSingaporeThailandTrinidad and TobagoTunisiaUruguay
Partner Countries/EconomiesAustraliaAustriaBelgiumCanadaChileCzech RepublicDenmarkEstoniaFinlandFranceGermanyGreece
HungaryIcelandIrelandIsraelItalyJapanKoreaLuxembourgMexicoNetherlandsNew ZealandNorway
PolandPortugalSlovak RepublicSloveniaSpainSwedenSwitzerlandTurkeyUnited KingdomUnited States
OECD Countries
Who took part in Australia?Just over 14,000 students from 353 schools around Australia took part in PISA 2009. The schools and students were randomly selected. The table below shows the number of schools and students who participated in the assessments across the states and territories and in the three school sectors.
Sector State/Territory
ACT NSW VIC QLD SA WA TAS NT Total
GovernmentStudents 528 2177 1279 1649 920 842 867 453 8715
Schools 13 52 35 39 26 22 21 9 217
CatholicStudents 355 676 542 456 304 321 272 172 3098
Schools 8 17 13 11 7 7 6 4 73
IndependentStudents 153 460 475 426 300 323 138 163 2438
Schools 4 12 11 11 8 9 4 4 63
TotalStudents 1036 3313 2296 2531 1524 1486 1277 788 14251
Schools 25 81 59 61 41 38 31 17 353

Challenges for Australian Education: Results from PISA 2009 3
Reading, mathematical and scientific literacy achievement by country Reading the tablesThe tables in the following section provide the mean scores on the relevant assessment domain (reading, mathematical or scientific literacy), along with the standard error, confidence interval around the mean and the difference between the 5th and 95th percentiles for participating countries.
Although there are 65 participating countries in PISA 2009, not all are reported in these tables. For the sake of brevity and clarity in figures, only results for those countries that recorded a mean score higher than the lowest performing OECD country, Mexico, are presented here. Results for all of the participating countries are available in the OECD International PISA report.
Australia’s results in each of the assessment domains – reading, mathematical and scientific literacy – were significantly higher than the OECD average (the average score for students in all participating OECD countries considered as a whole). Below are tables that summarise the distribution of performance for a selection of countries, along with the OECD average for comparison.
Reading literacyCountry/Economy
Mean
scoreS.E.
Confidence
interval
Difference between
5th and 95th percentileSix countries: Shanghai – China, Korea, Finland, Hong Kong – China, Singapore and Canada, scored significantly higher in reading literacy than Australia. Three of these countries: Finland, Hong Kong – China and Canada, had outperformed Australia in reading literacy in PISA 2006 as well. Shanghai – China and Singapore participated in PISA for the first time in 2009.
New Zealand, Japan and the Netherlands had mean scores that were not significantly different from Australia’s score of 515 points. All other countries (including the United States, Chinese Taipei and the United Kingdom) performed at a level significantly lower than Australia.
The range of reading literacy scores between the 5th and 95th percentile was wider for Australian students than the OECD average of 305 score points. A narrower range of scores indicates that there is a smaller gap between the performances of the highest- and lowest-achieving students.
Shanghai – China 556 2.4 551 - 561 262
Korea 539 3.5 532 - 546 258
Finland 536 2.3 531 - 540 284
Hong Kong – China 533 2.1 529 - 537 279
Singapore 526 1.1 524 - 528 320
Canada 524 1.5 521 - 527 296
New Zealand 521 2.4 516 - 525 335
Japan 520 3.5 513 - 527 328
Australia 515 2.3 510 - 519 325
Netherlands 508 5.1 498 - 518 285
Belgium 506 2.3 501 - 511 330
Norway 503 2.6 498 - 508 301
Estonia 501 2.6 496 - 506 274
Switzerland 501 2.4 496 - 505 308
Poland 500 2.6 495 - 506 293
Iceland 500 1.4 498 - 503 317
United States 500 3.7 493 - 507 317
Liechtenstein 499 2.8 494 - 505 270
Sweden 497 2.9 492 - 503 325
Germany 497 2.7 492 - 503 307
Ireland 496 3.0 490 - 501 309
France 496 3.4 489 - 502 347
Chinese Taipei 495 2.6 490 - 500 284
Denmark 495 2.1 491 - 499 274
United Kingdom 494 2.3 490 - 499 312
Hungary 494 3.2 488 - 500 300
OECD average 493 0.5 492 - 494 305
Portugal 489 3.1 483 - 495 286
Macao – China 487 0.9 485 - 488 251
Italy 486 1.6 483 - 489 311
Latvia 484 3.0 478 - 490 262
Slovenia 483 1.0 481 - 485 297
Greece 483 4.3 474 - 491 311
Spain 481 2.0 477 - 485 287
Czech Republic 478 2.9 473 - 484 302
Slovak Republic 477 2.5 472 - 482 297
Croatia 476 2.9 470 - 481 284
Israel 474 3.6 467 - 481 366
Luxembourg 472 1.3 470 - 475 342
Austria 470 2.9 465 - 476 326
Lithuania 468 2.4 464 - 473 283
Turkey 464 3.5 457 - 471 270
Dubai (UAE) 459 1.1 457 - 462 350
Russian Federation 459 3.3 453 - 466 298
Chile 449 3.1 443 - 455 274
Serbia 442 2.4 437 - 447 274
Bulgaria 429 6.7 416 - 442 368
Uruguay 426 2.6 421 - 431 327
Mexico 425 2.0 421 - 429 276
Significantly higher than
Australia
Not significantly different from
Australia
Significantly lower than Australia

4 PISA in Brief
Mathematical literacyCountry/Economy
Mean
scoreS.E.
Confidence
interval
Difference between
5th and 95th percentileTwelve countries performed significantly higher than Australia in mathematical literacy in 2009, seven of whom had outperformed Australia in this area of assessment in 2003 and 2006 as well (Hong Kong – China, Finland, Korea, the Netherlands, Liechtenstein, Japan and Canada).
Four countries had mean scores that were not significantly different from that of Australia: New Zealand, Belgium, Germany, and Estonia. All other countries (including the United States and the United Kingdom) performed at a level significantly lower than Australia.
In Australia, the range of scores between the 5th and 95th percentile was similar to that found for the OECD as a whole.
Shanghai – China 600 2.8 595 - 606 336
Singapore 562 1.4 559 - 565 342
Hong Kong – China 555 2.7 549 - 560 313
Korea 546 4.0 538 - 554 292
Chinese Taipei 543 3.4 537 - 550 342
Finland 541 2.2 536 - 545 270
Liechtenstein 536 4.1 528 - 544 286
Switzerland 534 3.3 527 - 540 326
Japan 529 3.3 522 - 536 308
Canada 527 1.6 524 - 530 286
Netherlands 526 4.7 517 - 535 287
Macao – China 525 0.9 523 - 527 281
New Zealand 519 2.3 515 - 524 316
Belgium 515 2.3 511 - 520 340
Australia 514 2.5 509 - 519 308
Germany 513 2.9 507 - 518 319
Estonia 512 2.6 508 - 517 265
Iceland 507 1.4 504 - 509 300
Denmark 503 2.6 498 - 508 286
Slovenia 501 1.2 499 - 504 314
Norway 498 2.4 493 - 503 283
France 497 3.1 491 - 503 331
Slovak Republic 497 3.1 491 - 503 311
Austria 496 2.7 491 - 501 312
OECD average 496 0.5 495 - 497 300
Poland 495 2.8 489 - 500 290
Sweden 494 2.9 489 - 500 304
Czech Republic 493 2.8 487 - 498 308
United Kingdom 492 2.4 488 - 497 287
Hungary 490 3.5 483 - 497 303
Luxembourg 489 1.2 487 - 491 319
United States 487 3.6 480 -494 300
Ireland 487 2.5 482 - 492 280
Portugal 487 2.9 481 - 493 301
Spain 483 2.1 479 - 488 298
Italy 483 1.9 479 - 487 302
Latvia 482 3.1 476 - 488 259
Lithuania 477 2.6 471 - 482 290
Russian Federation 468 3.3 461 - 474 280
Greece 466 3.9 458 - 474 294
Croatia 460 3.1 454 - 466 292
Dubai (UAE) 453 1.1 450 - 455 325
Israel 447 3.3 440 - 453 343
Turkey 445 4.4 437 - 454 310
Serbia 442 2.9 437 - 448 298
Azerbaijan 431 2.8 426 - 436 207
Bulgaria 428 5.9 417 - 440 324
Romania 427 3.4 420 - 434 260
Uruguay 427 2.6 422 - 432 300
Chile 421 3.1 415 - 427 266
Thailand 419 3.2 412 - 425 259
Mexico 419 1.8 415 - 422 259
Significantly higher than
Australia
Not significantly different from
Australia
Significantly lower than Australia

Challenges for Australian Education: Results from PISA 2009 5
Scientific literacyCountry/Economy
Mean
scoreS.E.
Confidence
interval
Difference between
5th and 95th percentileAustralian students recorded a mean score of 527 points on the scientific literacy scale. Six countries scored significantly higher than Australia: Shanghai – China, Finland, Hong Kong – China, Singapore, Japan, and Korea. In 2006, Finland, Hong Kong – China and Canada scored higher than Australia in scientific literacy.
Seven countries had mean scores that were not significantly different from that of Australia, while all other countries (including the United Kingdom, Macao – China and the United States) performed at a level significantly lower than Australia.
Australia showed a comparatively wide distribution of student performance in scientific literacy, with 333 score points between the 5th and 95th percentile.
Shanghai – China 575 2.3 570 - 579 270
Finland 554 2.3 550 - 559 294
Hong Kong – China 549 2.8 544 - 554 287
Singapore 542 1.4 539 - 544 342
Japan 539 3.4 533 - 546 325
Korea 538 3.4 531 - 545 266
New Zealand 532 2.6 527 - 537 349
Canada 529 1.6 526 - 532 292
Estonia 528 2.7 523 - 533 277
Australia 527 2.5 522 - 532 333
Netherlands 522 5.4 512 - 533 311
Chinese Taipei 520 2.6 515 - 526 284
Germany 520 2.8 515 - 526 330
Liechtenstein 520 3.4 513 - 527 286
Switzerland 517 2.8 511 - 522 314
United Kingdom 514 2.5 509 - 519 324
Slovenia 512 1.1 510 - 514 306
Macao – China 511 1.0 509 - 513 251
Poland 508 2.4 503 - 513 286
Ireland 508 3.3 502 - 514 315
Belgium 507 2.5 502 - 512 340
Hungary 503 3.1 496 - 509 288
United States 502 3.6 495 - 509 321
OECD average 501 0.5 500 - 502 308
Czech Republic 500 3.0 495 - 506 318
Norway 500 2.6 495 - 505 298
Denmark 499 2.5 494 - 504 302
France 498 3.6 491 - 505 339
Iceland 496 1.4 493 - 498 317
Sweden 495 2.7 490 - 500 327
Austria 494 3.2 488 - 501 332
Latvia 494 3.1 488 - 500 254
Portugal 493 2.9 487 - 499 273
Lithuania 491 2.9 486 - 497 280
Slovak Republic 490 3.0 484 - 496 308
Italy 489 1.8 485 - 492 314
Spain 488 2.1 484 - 492 286
Croatia 486 2.8 481 - 492 276
Luxembourg 484 1.2 482 - 486 342
Russian Federation 478 3.3 472 - 485 297
Greece 470 4.0 462 - 478 298
Dubai (UAE) 466 1.2 464 - 469 344
Israel 455 3.1 449 - 461 348
Turkey 454 3.6 447 - 461 265
Chile 447 2.9 442 - 453 268
Serbia 443 2.4 438 - 447 277
Bulgaria 439 5.9 428 - 451 344
Romania 428 3.4 422 - 435 257
Uruguay 427 2.6 422 - 432 316
Thailand 425 3.0 419 - 431 262
Mexico 416 1.8 412 - 419 254
Significantly higher than
Australia
Not significantly different from
Australia
Significantly lower than Australia

6 PISA in Brief
Reading literacy ◗ The Australian Capital Territory outperformed Victoria,
South Australia, Tasmania and the Northern Territory, and performed similarly to Western Australia, Queensland and New South Wales in reading literacy. Western Australia performed significantly higher on average than South Australia, Tasmania and the Northern Territory and on a par with Queensland, New South Wales and Victoria. Tasmania and the Northern Territory scored significantly lower on average than the other states and were statistically similar to each other.
◗ The difference in mean reading literacy scores between students in the highest and lowest performing states is 50 points, the equivalent to over two-thirds of a proficiency level or one-and-a-half years of schooling.
◗ Tasmania scored similarly to the OECD average for reading literacy, and the Northern Territory scored significantly lower than the OECD average. All other states performed significantly higher than the OECD average in reading literacy.
Mathematical literacy ◗ Western Australia, the Australian Capital Territory,
Queensland, New South Wales and Victoria scored on a par with each other; however, the Australian Capital Territory scored statistically significantly higher than Victoria. South Australia was outperformed by Western Australia and the Australian Capital Territory and scored similarly to Queensland, New South Wales and Victoria. The lowest performing states were Tasmania and the Northern Territory.
◗ The difference in mean mathematical literacy scores between students in the highest and lowest performing states is equivalent to approximately two-thirds of a proficiency level or one year of schooling.
◗ Tasmania and the Northern Territory performed at a level not significantly different from the OECD average, while all other states scored significantly higher than the OECD average in mathematical literacy.
Scientific literacy ◗ The Australian Capital Territory, Western Australia,
New South Wales and Queensland performed similarly to one another. The Australian Capital Territory and Western Australia performed significantly higher than four states (Victoria, South Australia, Tasmania and the Northern Territory), and New South Wales and Queensland performed statistically similarly to Victoria and South Australia, and significantly higher than Tasmania and the Northern Territory.
◗ The difference in mean scientific literacy scores between students in the highest and lowest performing states is equivalent to approximately three-quarters of a proficiency level or almost one-and-a-half years of schooling.
◗ Tasmania and the Northern Territory scored similarly to the OECD average. All other states performed significantly higher than the OECD average in scientific literacy.
State/Territory Mean score
S.E. Confidence interval
Difference between 5th and 95th percentile
ACT 531 6.0 520 - 543 339
NSW 516 5.6 505 - 527 330
VIC 513 4.7 504 - 523 316
QLD 519 7.0 505 - 532 327
SA 506 4.8 497 - 516 303
WA 522 6.3 510 - 534 328
TAS 483 5.8 472 - 495 332
NT 481 5.6 469 - 492 385
Australia 515 2.3 510 - 519 325
OECD average 493 0.5 492 - 494 305
State/Territory Mean score
S.E. Confidence interval
Difference between 5th and 95th percentile
ACT 528 6.4 516 - 541 323
NSW 512 5.2 502 - 523 313
VIC 512 4.9 502 - 522 297
QLD 518 7.5 503 - 533 311
SA 509 5.3 499 - 519 284
WA 529 7.2 515 - 543 317
TAS 487 5.1 477 - 497 307
NT 487 4.9 478 - 497 332
Australia 514 2.5 509 - 519 308
OECD average 496 0.5 495 - 497 300
State/Territory Mean score
S.E. Confidence interval
Difference between 5th and 95th percentile
ACT 546 6.0 534 - 558 353
NSW 531 5.7 519 - 542 341
VIC 521 4.9 512 - 531 324
QLD 530 7.5 515 - 544 332
SA 519 5.0 509 - 529 303
WA 539 7.3 525 - 553 334
TAS 497 5.3 487 - 508 327
NT 492 7.7 477 - 507 392
Australia 527 2.5 522 - 532 333
OECD average 501 0.5 500 - 502 308
Reading, mathematical and scientific literacy results for the Australian states and territories
Challenges for Australian Education: Results from PISA 2009 7
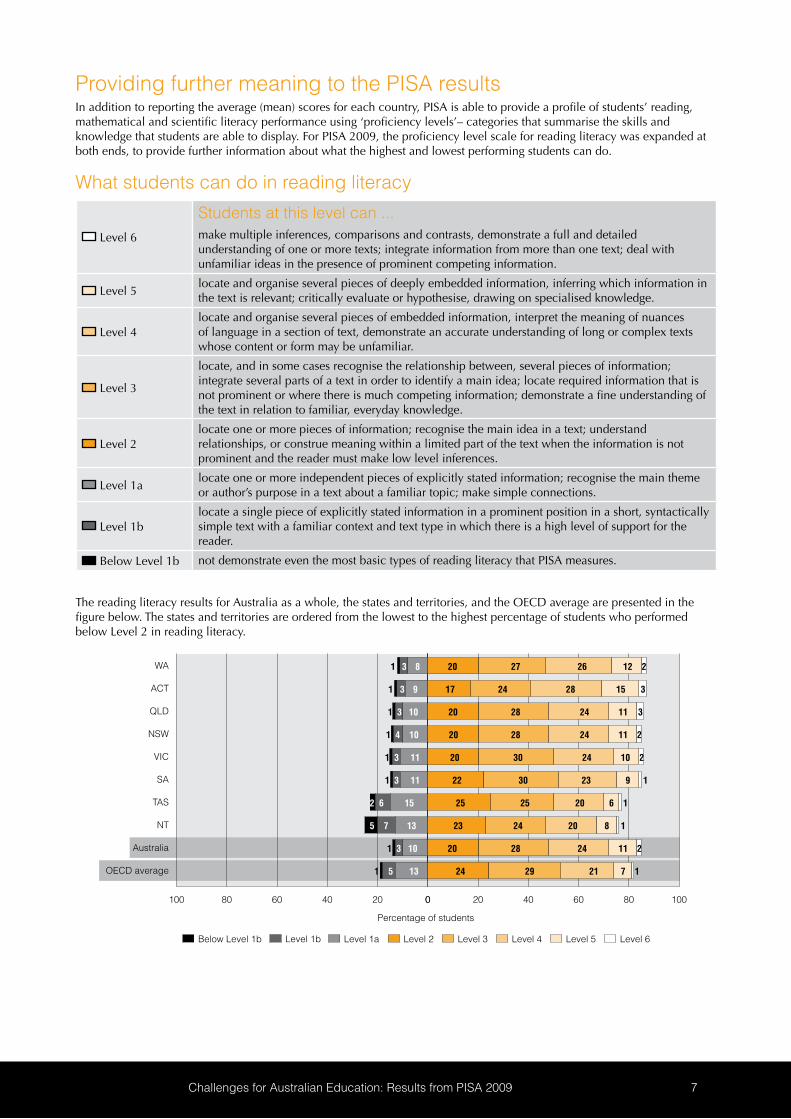
Providing further meaning to the PISA resultsIn addition to reporting the average (mean) scores for each country, PISA is able to provide a profile of students’ reading, mathematical and scientific literacy performance using ‘proficiency levels’– categories that summarise the skills and knowledge that students are able to display. For PISA 2009, the proficiency level scale for reading literacy was expanded at both ends, to provide further information about what the highest and lowest performing students can do.
What students can do in reading literacy
Level 6
Students at this level can ...make multiple inferences, comparisons and contrasts, demonstrate a full and detailed understanding of one or more texts; integrate information from more than one text; deal with unfamiliar ideas in the presence of prominent competing information.
Level 5locate and organise several pieces of deeply embedded information, inferring which information in the text is relevant; critically evaluate or hypothesise, drawing on specialised knowledge.
Level 4locate and organise several pieces of embedded information, interpret the meaning of nuances of language in a section of text, demonstrate an accurate understanding of long or complex texts whose content or form may be unfamiliar.
Level 3
locate, and in some cases recognise the relationship between, several pieces of information; integrate several parts of a text in order to identify a main idea; locate required information that is not prominent or where there is much competing information; demonstrate a fine understanding of the text in relation to familiar, everyday knowledge.
Level 2locate one or more pieces of information; recognise the main idea in a text; understand relationships, or construe meaning within a limited part of the text when the information is not prominent and the reader must make low level inferences.
Level 1alocate one or more independent pieces of explicitly stated information; recognise the main theme or author’s purpose in a text about a familiar topic; make simple connections.
Level 1blocate a single piece of explicitly stated information in a prominent position in a short, syntactically simple text with a familiar context and text type in which there is a high level of support for the reader.
Below Level 1b not demonstrate even the most basic types of reading literacy that PISA measures.
The reading literacy results for Australia as a whole, the states and territories, and the OECD average are presented in the figure below. The states and territories are ordered from the lowest to the highest percentage of students who performed below Level 2 in reading literacy.
0 20 40 60 80 100100 80 60 40 20 0
OECD average
Australia
NT
TAS
SA
VIC
NSW
QLD
ACT
WA
Below Level 1b Level 1a Level 2 Level 3 Level 4 Level 5 Level 6Level 1b
1 3 8 20 27 26 12 2
1 3 9 17 24 28 15 3
1 3 10 20 28 24 11 3
1 4 10 20 28 24 11 2
1 3 11 20 30 24 10 2
1 3 11 22 30 23 9 1
2 6 15 25 25 20 6 1
5 7 13 23 24 20 8 1
1 3 10 20 28 24 11 2
1 5 13 24 29 21 7 1
Percentage of students

8 PISA in Brief
What students can do in mathematical literacy
Level 6
Students at this level can ...conceptualise, generalise, and utilise information; are capable of advanced mathematical thinking and reasoning; have a mastery of symbolic and formal mathematical operations and relationships; formulate and precisely communicate their findings, interpretations and arguments.
Level 5
develop and work with models for complex situations; select, compare, and evaluate appropriate problem solving strategies for dealing with complex problems; work strategically using broad, well-developed thinking and reasoning skills; reflect on their actions and formulate and communicate their interpretations and reasoning.
Level 4work effectively with explicit models for complex concrete situations; select and integrate different representations, including symbolic ones; utilise well-developed skills and reason flexibly; construct and communicate explanations and arguments.
Level 3execute clearly described procedures, including those that require sequential decisions; select and apply simple problem solving strategies; interpret and use representations; develop short communications reporting these.
Level 2interpret and recognise situations in contexts that require no more than direct inference; extract relevant information from a single source and make use of a single representational mode; employ basic procedures; make literal interpretations of the results.
Level 1
answer questions involving familiar contexts where all relevant information is present and the questions are clearly defined; identify information and carry out routine procedures according to direct instructions in explicit situations; perform actions that are obvious and follow immediately from the given stimuli.
Below Level 1not demonstrate even the most basic types of mathematical literacy that PISA measures. These students are likely to be seriously disadvantaged in their lives beyond school.
Mathematical literacy results for Australia and each of the states and territories, as well as the OECD average are presented in the figure below and ordered from the lowest to the highest percentage of students who performed below Level 2 in mathematical literacy in PISA 2009.
0 20 40 60 80 100100 80 60 40 20 0
OECD average
Australia
TAS
NT
NSW
SA
VIC
QLD
ACT
WA
Below Level 1 Level 2 Level 3 Level 4 Level 5 Level 6Level 1
5 9 17 23 24 16 6
5 9 17 24 24 15 7
5 10 20 25 22 13 5
5 11 21 27 22 11 4
4 12 21 27 22 11 2
5 11 20 26 21 11 5
12 12 22 24 20 8 2
9 16 23 25 17 8 2
5 11 20 26 22 12 4
8 14 22 24 19 10 3
Percentage of students

Challenges for Australian Education: Results from PISA 2009 9
What students can do in scientific literacy
Level 6
Students at this level can ...identify, explain and apply scientific knowledge in a variety of complex life situations; link information sources and explanations and use evidence from those sources to justify decisions; clearly and consistently demonstrate advanced scientific thinking and reasoning; use their scientific understanding in support of solutions to unfamiliar scientific and technological situations.
Level 5
identify the scientific components of many complex life situations; apply both scientific concepts and knowledge about science to these situations; use well-developed inquiry abilities; link knowledge appropriately and bring critical insights to situations; construct explanations based on evidence and arguments.
Level 4
work effectively with situations and issues that may involve explicit phenomena; integrate explanations from different disciplines of science or technology and link those explanations directly to aspects of life situations; reflect on actions and communicate decisions using scientific knowledge and evidence.
Level 3identify clearly described scientific issues in a range of contexts; select facts and knowledge to explain phenomena and apply simple models or inquiry strategies; interpret and use scientific concepts from different disciplines and apply them directly.
Level 2use adequate scientific knowledge to provide possible explanations in familiar contexts or draw conclusions based on simple investigations.
Level 1present scientific explanations that are obvious and follow explicitly from given evidence; scientific knowledge is limited to a few, familiar, situations.
Below Level 1not demonstrate even the most basic types of scientific literacy that PISA measures. These students are likely to be seriously disadvantaged in their lives beyond school.
Scientific literacy results for Australia and each of the states and territories, as well as the OECD average, are presented in the figure below and are ordered from the lowest to highest percentage of students who performed below Level 2 in scientific literacy in PISA 2009.
0 20 40 60 80 100100 80 60 40 20 0
OECD average
Australia
NT
TAS
VIC
NSW
SA
QLD
ACT
WA 3 7 18 27 27 15 3
3 8 15 25 29 15 5
3 9 20 28 24 12 4
3 9 21 31 25 9 2
4 9 19 28 25 12 4
3 10 21 29 23 11 2
6 14 24 28 20 7 1
10 12 21 26 21 9 1
3 9 20 28 25 11 3
5 13 24 29 21 7 1
Below Level 1 Level 2 Level 3 Level 4 Level 5 Level 6Level 1
Percentage of students

10 PISA in Brief
Gender differences in reading, mathematical and scientific literacy
Reading literacy ◗ The difference in the average reading literacy performance of females and males in Australia was 37 score points –
around half of a proficiency level or the equivalent of about one year of schooling. In 2000 and 2003, the gender difference in reading literacy was also in favour of females, by about the same margin.
◗ In Australia, 16 per cent of females and 10 per cent of males reached Level 5 or 6, compared to 10 per cent of females and just six per cent of males across OECD countries. However, there were twice as many males as females who failed to reach Level 2 for both Australia and across the OECD.
Males
Females
Males
Females
Aus
tralia
OEC
D a
vera
ge
0 20 40 60 80 100100 80 60 40 20 0
Below Level 1b Level 1a Level 2 Level 3 Level 4 Level 5 Level 6Level 1b
1 2 7 19 30 27 13 3
2 5 13 23 27 21 8 2
1 3 9 22 31 25 9 1
2 7 17 26 27 17 5 1
Percentage of students
Mathematical literacy ◗ Australian males scored ten points higher, on average, than Australian females in the PISA 2009 mathematical literacy
assessment. This was a significant difference. In 2003 there was no significant difference in the scores between males and females in mathematical literacy.
◗ About the same proportion of Australian male and female students performed below Level 2. A slightly higher proportion of male students (18%) than female students (15%) performed at Level 5 and Level 6. This is similar to the pattern seen across the OECD.
Aus
tralia
OEC
D a
vera
ge
Below Level 1 Level 2 Level 3 Level 4 Level 5 Level 6Level 1
100 80 60 40 20 0
Males
Females
Males
Females
20 40 60 80 100
5 11 21 27 21 11 4
5 10 19 25 22 13 5
8 15 23 25 18 8 2
8 13 21 24 19 11 4
Percentage of students
Scientific literacy ◗ There was no significant difference between the average scientific literacy scores of male and female students in Australia.
◗ The proportions of Australian males and females who did not reach Level 2 in scientific literacy were smaller than the OECD averages – 14 per cent of Australian males compared to 18 per cent across OECD countries, and 11 per cent of Australian females compared to 17 per cent on average across the OECD.
◗ Slightly more Australian males (16%) than Australian females (14%) achieved Level 5 or higher in scientific literacy.
Aus
tralia
OEC
D a
vera
ge
Below Level 1 Level 2 Level 3 Level 4 Level 5 Level 6Level 1
Percentage of students100 80 60 40 20 0
Males
Females
Males
Females
20 40 60 80 100
3 8 21 30 25 11 3
4 10 19 27 24 12 4
4 13 25 30 21 7 1
5 13 24 27 21 8 1

Challenges for Australian Education: Results from PISA 2009 11
Results for different groups of students
Indigenous students ◗ Altogether, 1,143 Indigenous students participated in the PISA 2009 assessment.
◗ Indigenous students scored 82 points lower, on average, than non-Indigenous students in reading literacy. This difference equates to more than one proficiency level or more than two full years of schooling. Indigenous students also performed significantly lower than the OECD average, by 57 score points.
◗ Indigenous females performed 47 score points higher on average than Indigenous males in reading literacy. In terms of schooling, this places Indigenous males more than one year behind Indigenous females.
◗ There is a substantial under-representation of Indigenous students at the higher end of the reading literacy proficiency scale and a similarly substantial over-representation of Indigenous students at the lower end. Only two per cent (2.4%) of Indigenous students reached Level 5 and there were even fewer Indigenous students (0.3%) who were placed at Level 6.
◗ Almost 40 per cent of Indigenous students did not reach Level 2, compared to 19 per cent of students across the OECD and 14 per cent of non-Indigenous students in Australia.
100 80 60 40 20 0
OECD average
Non-Indigenous
Indigenous
20 40 60 80 100
Below Level 1b Level 1a Level 2 Level 3 Level 4 Level 5 Level 6Level 1b
4 12 22 26 23 10 2
1 3 10 20 29 25 11 2
1 5 13 24 29 21 7 1
Percentage of students
◗ In mathematical literacy, Indigenous students recorded a mean score of 441 points, compared to a mean score of 517 points for non-Indigenous students. This difference of 76 score points in mathematical literacy performance equates to more than one proficiency level or almost two full years of schooling.
◗ In scientific literacy, Indigenous students recorded a mean score of 449 points, 81 points lower on average than the mean score of 530 points for non-Indigenous students. This difference is the equivalent of more than one proficiency level or more than two full years of schooling.
12 PISA in Brief
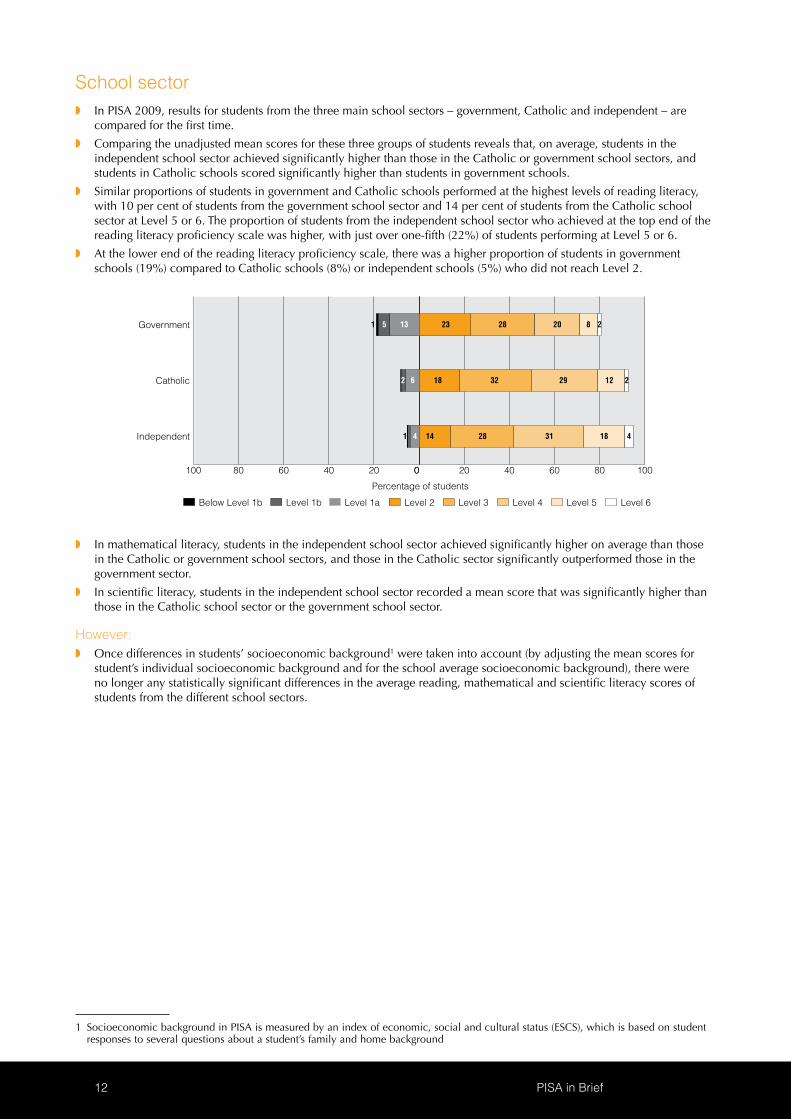
School sector ◗ In PISA 2009, results for students from the three main school sectors – government, Catholic and independent – are
compared for the first time.
◗ Comparing the unadjusted mean scores for these three groups of students reveals that, on average, students in the independent school sector achieved significantly higher than those in the Catholic or government school sectors, and students in Catholic schools scored significantly higher than students in government schools.
◗ Similar proportions of students in government and Catholic schools performed at the highest levels of reading literacy, with 10 per cent of students from the government school sector and 14 per cent of students from the Catholic school sector at Level 5 or 6. The proportion of students from the independent school sector who achieved at the top end of the reading literacy proficiency scale was higher, with just over one-fifth (22%) of students performing at Level 5 or 6.
◗ At the lower end of the reading literacy proficiency scale, there was a higher proportion of students in government schools (19%) compared to Catholic schools (8%) or independent schools (5%) who did not reach Level 2.
100 80 60 40 20 0
Independent
Catholic
Government
0 20 40 60 80 100
1 5 13 23 28 20 8 2
2 6 18 32 29 12 2
1 4 14 28 31 18 4
Below Level 1b Level 1a Level 2 Level 3 Level 4 Level 5 Level 6Level 1b
Percentage of students
◗ In mathematical literacy, students in the independent school sector achieved significantly higher on average than those in the Catholic or government school sectors, and those in the Catholic sector significantly outperformed those in the government sector.
◗ In scientific literacy, students in the independent school sector recorded a mean score that was significantly higher than those in the Catholic school sector or the government school sector.
However: ◗ Once differences in students’ socioeconomic background1 were taken into account (by adjusting the mean scores for
student’s individual socioeconomic background and for the school average socioeconomic background), there were no longer any statistically significant differences in the average reading, mathematical and scientific literacy scores of students from the different school sectors.
1 Socioeconomic background in PISA is measured by an index of economic, social and cultural status (ESCS), which is based on student responses to several questions about a student’s family and home background

Challenges for Australian Education: Results from PISA 2009 13
Socioeconomic background ◗ Socioeconomic background in PISA is measured by an index of economic, social and cultural status. Across all literacy
domains, the results show the higher the level of socioeconomic background, the higher the student performance.
◗ In reading literacy, students in the highest socioeconomic quartile achieved a mean score of 562 points, which was 30 score points higher than the average score of students in the third socioeconomic quartile, 58 score points higher than students in the second socioeconomic quartile, and 91 score points higher than students in the lowest socioeconomic quartile.
◗ The gap between students in the highest and lowest socioeconomic quartile is equivalent to more than one proficiency level or almost three full years of schooling.
◗ Four per cent of students from the lowest socioeconomic quartile, compared to 25 per cent of students from the highest socioeconomic quartile, performed at the higher end of the reading literacy proficiency scale (Levels 5 and 6).
◗ At the lower end of the reading literacy proficiency scale, there were a higher proportion of students in the lowest socioeconomic quartile (25%) compared to students in the highest socioeconomic quartile (5%) who had failed to reach Level 2.
100 80 60 40 20 0
Highest quartile
Third quartile
Second quartile
Lowest quartile
20 40 60 80 100
2 6 17 29 28 15 4
3 11 23 32 22 7 1
2 7 18 30 28 13 3
1 4 12 26 33 20 5
Below Level 1b Level 1a Level 2 Level 3 Level 4 Level 5 Level 6Level 1b
Percentage of students
◗ In mathematical literacy, students in the lowest socioeconomic quartile scored on average 90 score points lower than those students in the highest socioeconomic quartile.
◗ Twenty-eight per cent of students in the lowest socioeconomic quartile were not achieving Level 2 in mathematical literacy, compared to five per cent of students in the highest socioeconomic quartile. Only six per cent of students in the lowest socioeconomic quartile achieved Level 5 or above, compared with 29 per cent of students in the highest socioeconomic quartile.
◗ In scientific literacy, the gap between students in the highest and lowest socioeconomic quartiles was, on average, 96 score points.
◗ Twenty-two per cent of students in the lowest socioeconomic quartile were not achieving Level 2 in scientific literacy, compared to four per cent of students in the highest socioeconomic quartile. Only six per cent of students in the lowest socioeconomic quartile achieved Level 5 or above, compared with 28 per cent of students in the highest socioeconomic quartile.
14 PISA in Brief
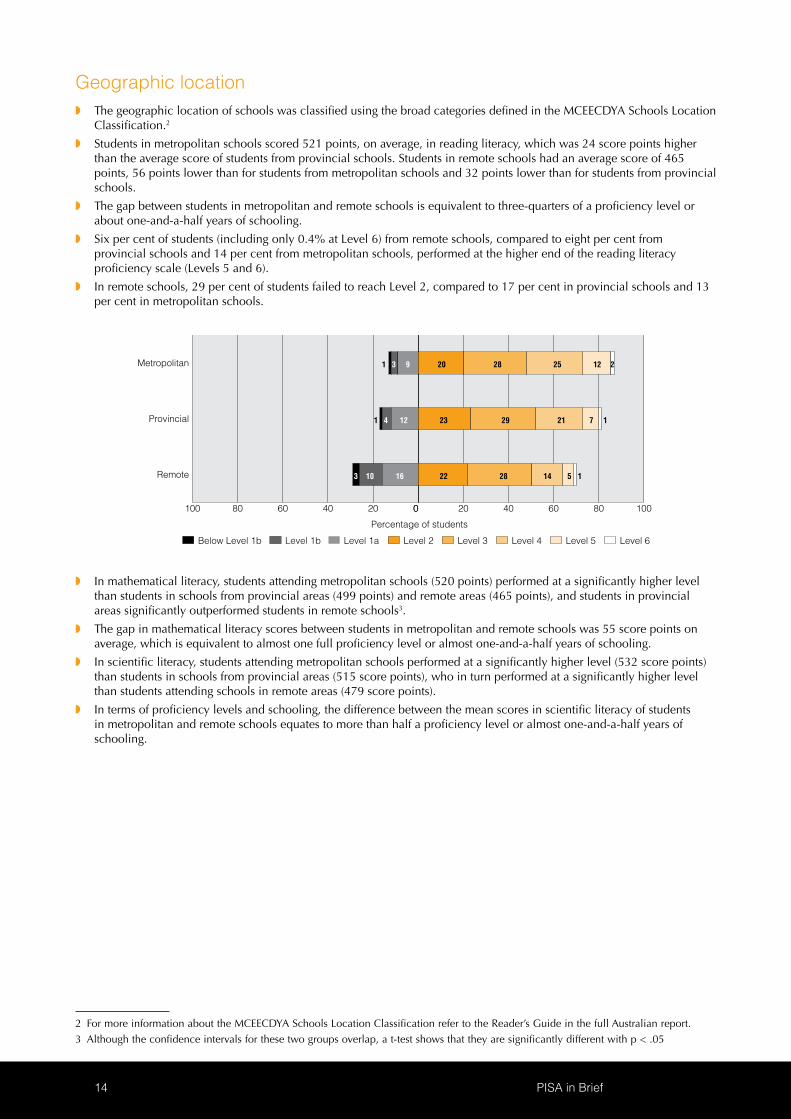
Geographic location ◗ The geographic location of schools was classified using the broad categories defined in the MCEECDYA Schools Location
Classification.2
◗ Students in metropolitan schools scored 521 points, on average, in reading literacy, which was 24 score points higher than the average score of students from provincial schools. Students in remote schools had an average score of 465 points, 56 points lower than for students from metropolitan schools and 32 points lower than for students from provincial schools.
◗ The gap between students in metropolitan and remote schools is equivalent to three-quarters of a proficiency level or about one-and-a-half years of schooling.
◗ Six per cent of students (including only 0.4% at Level 6) from remote schools, compared to eight per cent from provincial schools and 14 per cent from metropolitan schools, performed at the higher end of the reading literacy proficiency scale (Levels 5 and 6).
◗ In remote schools, 29 per cent of students failed to reach Level 2, compared to 17 per cent in provincial schools and 13 per cent in metropolitan schools.
100 80 60 40 20 0
Remote
Provincial
Metropolitan
0 20 40 60 80 100
1 3 9 20 28 25 12 2
1 4 12 23 29 21 7 1
3 10 16 22 28 14 5 1
Below Level 1b Level 1a Level 2 Level 3 Level 4 Level 5 Level 6Level 1b
Percentage of students
◗ In mathematical literacy, students attending metropolitan schools (520 points) performed at a significantly higher level than students in schools from provincial areas (499 points) and remote areas (465 points), and students in provincial areas significantly outperformed students in remote schools3.
◗ The gap in mathematical literacy scores between students in metropolitan and remote schools was 55 score points on average, which is equivalent to almost one full proficiency level or almost one-and-a-half years of schooling.
◗ In scientific literacy, students attending metropolitan schools performed at a significantly higher level (532 score points) than students in schools from provincial areas (515 score points), who in turn performed at a significantly higher level than students attending schools in remote areas (479 score points).
◗ In terms of proficiency levels and schooling, the difference between the mean scores in scientific literacy of students in metropolitan and remote schools equates to more than half a proficiency level or almost one-and-a-half years of schooling.
2 For more information about the MCEECDYA Schools Location Classification refer to the Reader’s Guide in the full Australian report.3 Although the confidence intervals for these two groups overlap, a t-test shows that they are significantly different with p < .05

Challenges for Australian Education: Results from PISA 2009 15
Immigrant status and language background ◗ Three categories of immigrant status were defined based on students’ responses to questions regarding where they and
their parents were born.4
◗ Language background was based on students’ responses regarding the main language spoken at home – English or some other language.
◗ Australian-born students achieved a mean score of 512 points in reading literacy, which was significantly lower than the average score for first-generation students (527 points). First-generation students scored 10 points higher on average than foreign-born students (517 points). No significant differences were found between the average reading literacy scores of Australian-born and foreign-born students.
◗ There were no significant differences in the average reading performances of students who spoke English as their main language at home compared to those students whose main language at home was a language other than English, with mean scores of 519 points and 503 points respectively.
◗ There were 12 per cent of Australian-born students, 16 per cent of first-generation students and 14 per cent of foreign-born students who achieved Levels 5 or 6 in reading literacy. At the other end of the scale, 14 per cent of Australian-born students, 11 per cent of first-generation students and 15 per cent of foreign-born students failed to reach Level 2.
100 80 60 40 20 0
Foreign-born
First-generation
Australian-born
0 20 40 60 80 100
1 3 10 21 29 24 10 2
2 8 19 28 26 13 3
1 3 11 20 27 23 11 3
Below Level 1b Level 1a Level 2 Level 3 Level 4 Level 5 Level 6Level 1b
Percentage of students
◗ Thirteen per cent of students who spoke English at home and 20 per cent of students who spoke another language performed at Level 5 or 6. There was a higher proportion of students who spoke a language other than English not reaching Level 2, compared to those students who spoke English at home (20% and 13% respectively).
◗ In mathematical literacy, Australian-born students achieved a mean score of 511 points, which was significantly lower than the average score for first-generation students by 15 score points. No significant differences were found between the average scores of Australian-born and foreign-born students, nor between the scores of first-generation and foreign-born students.
◗ There were no significant differences found in the average mathematical literacy performance of students who spoke English as their main language at home compared to those students whose main language at home was a language other than English, with mean scores of 516 points and 517 points respectively.
◗ In scientific literacy, Australian-born students had a mean score of 526 points, which was significantly lower than that of first-generation students (with a mean score of 538 score points) but not statistically different to the mean score for foreign-born students (524 score points). First-generation students performed at a significantly higher level in scientific literacy compared to foreign-born students.
◗ On average, students who spoke English at home scored significantly higher in scientific literacy (532 score points) than did students who spoke a language other than English (512 score points).
4 For more information about the definition of immigrant status, refer to the Reader’s Guide in the full Australian report.

16 PISA in Brief
Monitoring changes over time
Reading literacy ◗ Although the OECD average for reading literacy has not changed between 2000 and 2009, ten countries have
significantly improved their performance over this time, while five countries, including Australia, have declined significantly.
◗ Australia’s reading literacy performance has declined, not only in terms of rankings among other participating countries but also in terms of average student performance. The mean scores for Australian students in PISA 2000 was 528 points, compared to 515 for PISA 2009. A decline in average scores was also noted between PISA 2000 and PISA 2006, when reading literacy was a minor domain.
PISA 2000 PISA 2009 Change between 2000 and 2009 (PISA 2009 – PISA 2000)
Females Males Overall Females Males Overall Females Males Overall
Mean score S.E. Mean
score S.E. Mean score S.E. Mean
score S.E. Mean score S.E. Mean
score S.E. Score dif. S.E. Score
dif. S.E. Score dif. S.E.
546 4.7 513 4.0 528 3.5 533 2.6 496 2.9 515 2.3 -13 8.6 -17 8.3 -13 6.5
Note: Values that are statistically significant are indicated in bold.
◗ In terms of the proficiency levels, the proportion of students who achieved Level 5 or 6 declined significantly between PISA 2000 and PISA 2009, from 18 per cent in PISA 2000 to 13 per cent in PISA 2009.
◗ At the lower end of the reading literacy proficiency scale, 12 per cent of students failed to reach Level 2 in PISA 2000 compared to 14 per cent in PISA 2009 (this was not a significant change).
State level ◗ Although the difference in mean reading literacy scores decreased in all states between PISA 2000 and PISA 2009,
statistically significant declines were found in only four states.
◗ In Tasmania and South Australia, there was a 31 score point decline, which is the equivalent of almost half a proficiency level or about one full year of schooling.
◗ In New South Wales and the Australian Capital Territory, the decline in reading literacy performance was 23 and 21 score points respectively, which is representative of approximately one-third of a proficiency level or about half a year of schooling.
◗ The mean reading literacy performance in Queensland, Victoria, the Northern Territory and Western Australia was statistically similar in PISA 2000 and PISA 2009.
StatePISA 2000 PISA 2009
Difference between PISA 2000 and PISA 2009 Mean score S.E. Mean score S.E.
TAS 514 9.7 483 5.8
40 30 20 10 0
SA 537 7.7 506 4.8
NSW 539 6.3 516 5.6
ACT 552 4.6 531 6.0
WA 538 8.0 522 6.3
NT 489 5.6 481 5.6
VIC 516 7.6 513 4.7
QLD 521 8.6 519 7.0
Differences between 2000 and 2009 significantDifferences between 2000 and 2009 not significant
◗ There was a significant decline in the proportion of top performers in four states (the Australian Capital Territory, South Australia, Western Australia and Tasmania) from PISA 2000 to PISA 2009.
◗ For the lower performing students, there was an increase in the proportion of students who achieved below Level 2 from PISA 2000 to PISA 2009. This occurred in the Australian Capital Territory and South Australia, with an increase of five per cent, and in New South Wales, with an increase of four per cent of students performing below Level 2.
Gender ◗ While females continue to outperform males in reading literacy, the average scores of Australian males and females have
declined significantly since reading literacy was first a major domain of assessment for PISA, by 17 and 13 points respectively.
◗ There was a significant decline in the proportion of top performing Australian males and females and a significant increase in the proportion of males performing at lower levels.
◗ The change in the proportion of top performing students from PISA 2000 to 2009 was six per cent for Australian females and four per cent for Australian males. On average across the OECD the decline was one per cent for males and females.
◗ There was a four per cent increase in the proportion of Australian males who failed to reach Level 2, from 16 per cent in PISA 2000 to 20 per cent in PISA 2009. On average across OECD countries there was no significant change.

Challenges for Australian Education: Results from PISA 2009 17
Mathematical literacy ◗ In mathematical literacy, there was no significant change
in the average performance of Australian students between PISA 2003 and PISA 2006. In PISA 2009, however, the average mathematics score was 514 points, ten points lower than it was in 2003 – representing a statistically significant decline in mathematical literacy.
◗ In Australia there was no significant difference from PISA 2003 to PISA 2009 in the proportion of students not achieving Level 2.
◗ In PISA 2003, 20 per cent of Australian students reached Level 5 or above, compared to 15 per cent of students across the OECD. In PISA 2009, the proportion of Australian students who reached these high levels decreased to 16 per cent, while the proportion of students who reached Level 5 or above declined to 13 per cent across OECD countries.
◗ The Australian Capital Territory, New South Wales, South Australia and Western Australia all showed large and significant declines in average mathematical literacy scores from PISA 2003 to PISA 2009. The largest change was in South Australia, where the average score decreased by 26 score points, then the Australian Capital Territory with a decrease of 20 score points, Western Australia with a decrease of 19 score points, and New South Wales with a decrease of 14 score points.
◗ Students in Victoria, the Northern Territory, Queensland and Tasmania showed no change in scores over the three cycles (2003, 2006 and 2009).
◗ In South Australia and Western Australia, the proportion of students not reaching Level 2 in mathematical literacy increased significantly by five percentage points.
◗ At the same time the proportion of students from South Australia who reached the highest achievement levels decreased by nine percentage points, and in the Australian Capital Territory, the proportion of students who performed at Levels 5 or 6 also decreased – from 27 per cent in PISA 2003 to 21 per cent in PISA 2009.
Scientific literacy ◗ Scientific literacy was assessed as a major domain for
the first time in PISA 2006. In 2009, scientific literacy was a minor domain of assessment and there was no change in the average scores of Australian students in this area, with average scores of 527 points in each cycle.
◗ In terms of proficiency levels, the proportion of Australian students who did not reach Level 2 in scientific literacy remained unchanged between PISA 2006 to PISA 2009, at 13 per cent.
◗ At the higher end of the scale, 15 per cent of Australian students performed at Levels 5 or 6 in scientific literacy in PISA 2006 and PISA 2009.
◗ As expected, given the lack of change for Australia as a whole, there were no significant changes in scientific literacy performance within each of the states between PISA 2006 to PISA 2009.
◗ In terms of proficiency levels, there were no changes in the proportions of students from different states who performed below Level 2 in scientific literacy.
◗ The only change in the proportions of students who performed at the higher proficiency levels was in South Australia. In PISA 2006, 15 per cent of South Australian students achieved Level 5 or above, while in 2009, the proportion of students who performed at these levels was just over 10 per cent.

18 PISA in Brief
Quality and equity in Australian schoolsOne of the most important indicators of equity in education is the strength of the relationship between the social background of students and their educational achievement. If the relationship is strong, the education system is not acting to produce more equitable outcomes, but is instead reinforcing educational privilege where it exists by conferring higher scores and denying privilege where it does not already exist.
In PISA, the socioeconomic background of students is measured using a composite index (ESCS), which is based on the occupations of students’ parents or guardians, the highest level of education of parents (converted into years of education), an index of educational resources in the home, an index of cultural possessions in the home, and an index of family wealth.
What are socioeconomic gradients?The terms ‘socioeconomic gradient’ or ‘social gradient’ refer to the relationship between an outcome and socioeconomic background. PISA data show that there is a significant relationship between students’ performance and their socioeconomic background as measured by ESCS. This relationship is evident in Australia and all PISA countries, although the strength of the relationship differs among countries. In a graphical representation the line of best fit for the points that represent performance against socioeconomic background (ESCS) provides information about several aspects of the relationship. The line is referred to as the socioeconomic or social gradient.
The analysis of socioeconomic gradients is a means of characterising student performance and providing guidance for educational policy. Socioeconomic gradients can be used to compare the relationships between outcomes and student background across and within countries and to examine changes in gradients that occur from one cycle of PISA to another.
Four types of information are relevant to a consideration of social gradients:
◗ The average level of the line in the graph gives an indication of how well the overall population has achieved on the given assessment. Lines at higher levels indicate higher mean performance by students.
◗ The strength of the relationship between achievement and socioeconomic background. The closer all the points are to the line of best fit, the greater is the strength of the relationship. This aspect of the social gradient is represented by the percentage of the variation in performance that can be explained by the ESCS index. If the percentage is large it indicates that performance is relatively highly determined by ESCS, whereas if it is small it indicates that performance is not highly determined by ESCS.
◗ The slope of the gradient line is an indication of the extent of inequality in the relationship between students’ results and their socioeconomic background (as measured by ESCS). A steeper slope indicates a greater difference in performance between low socioeconomic background students and high socioeconomic background students. Education systems typically aim to decrease the differences in performance between different social groups. Greater equity would thus be indicated by a flatter gradient.
◗ The length of the line indicates the range of ESCS. The graphs are plotted between the 5th percentile of ESCS and the 95th percentile of ESCS, that is, the graphs span the middle 90 per cent of the values of ESCS for each country. A smaller range indicates less difference in socioeconomic background between students from the highest and lowest socioeconomic backgrounds in the country.

Challenges for Australian Education: Results from PISA 2009 19
For most Australian states and territories, as shown in the figure below, there is a moderately steep slope, indicating that there is a moderately strong relationship between socioeconomic background and achievement.
However, there are differences between the states in terms of the average achievement of students of the same socioeconomic background:
◗ At the very lowest levels of socioeconomic background, students in Western Australia, New South Wales, Victoria and Queensland clearly score substantially higher than students in Tasmania and the Northern Territory. Low socioeconomic students in the Australian Capital Territory may not be particularly well-served by their education system, with average scores for these students only just above those for Tasmania and the Northern Territory, and between 19 and 24 score points lower than students of the same socioeconomic level in the other five states.
◗ The vertical line at ESCS=0 in the figure shows that there are also quite different scores for students of average ESCS in the different states. Students in the Australian Capital Territory have ‘caught up’ with their peers in Western Australia, Victoria, New South Wales, South Australia and Queensland, and students in these states performed at a higher level than those in the Northern Territory or Tasmania.
◗ At the highest level of socioeconomic background, students in Queensland, Western Australia and the Australian Capital Territory achieve at the same level, outperforming those in Victoria and New South Wales, who at the same time outperformed those in South Australia, Northern Territory and Tasmania.
-2 -1.5 -1 -0.5 0 0.5 1 1.5 2
ESCS Index
400
500
600
Rea
ding
lite
racy
per
form
ance
NSW
SAWA
QLD
VIC
TAS
AUS
NT
ACT

20 PISA in Brief
The figure below explores the relationship between equity (the strength of the social gradient) and mean reading literacy for a sample of countries that participated in PISA 2009 and Australian states and territories. The horizontal axis represents the strength of the relationship between socioeconomic background and performance, used as a proxy for equity in the distribution of learning opportunities. Mean performance in reading literacy is plotted on the vertical axis, with the line at 493 representing the OECD mean.
As with all data there are confidence intervals. The markers on the figure that are orange are those in which the difference between the strength of the relationship for that country or state is not significantly different to the OECD average. Countries or states that are bold are those for which the reading literacy score is higher than the OECD average.
In the PISA 2000 International report, Australia’s overall performance in reading literacy was described as “High Quality – Low Equity”, meaning that while the overall scores in reading literacy were higher than the OECD average, the impact of socioeconomic status was also higher than the OECD average. For this cycle, Australia is still a High Quality country, having above average performance, and average impact of socioeconomic background, so Average Equity.
The high-scoring countries such as Hong Kong – China, Finland and Canada, are clearly in the High Quality, High Equity quadrant. All these countries significantly outperformed Australia in reading in PISA 2009.
Although graphically the states and territories appear in different quadrants, the differences in the strength of the relationship between each of the jurisdictions and the OECD average is not significant, so all can be classified as Average Equity.
Percentage of variance in performance in reading literacy explained by the ESCS index (r-squared × 100)
ACT
New ZealandSingapore
Australia
United StatesUnited Kingdom
SA
NT
TAS
WAQLD NSW
Canada
Finland
Korea
Shanghai – China
Hong Kong – China
VIC
Rea
ding
Lite
racy
per
form
ance
30 25 20 15 10 5 0430
450
470
490
510
530
550
570High QualityLow Equity
Low QualityLow Equity
High QualityHigh Equity
Low QualityHigh Equity
OECD average -
Quality
OE
CD
ave
rage
-
Equ
ity

Challenges for Australian Education: Results from PISA 2009 21
In Australia, the results from PISA are used to provide data on the progress of Australian school students towards achieving the Educational Goals for Young Australians as described in the Melbourne Declaration (MCEECDYA, 2010). These goals aim to promote equity and excellence in Australian schools, to ensure a world-class curriculum and world-class outcomes.
Above average but declining performanceAustralia has now participated in four cycles of PISA. Throughout these four cycles, Australian students have performed at a level significantly higher than the OECD average in all three assessment areas: reading literacy, mathematical literacy and scientific literacy.
However, in PISA 2009, with the focus on reading literacy, Australia was outperformed by Finland, Korea and Canada (Korea and Canada were two countries whose scores were not significantly different to those of Australia in PISA 2000), by Hong Kong – China (whose score was significantly lower than that of Australia in PISA 2003), and by newcomers Shanghai – China and Singapore.
Reading literacy
Australia’s reading literacy performance has declined not only in terms of rankings but also in terms of average student performance. Australia was the only high performing country to show a significant decline in reading literacy performance in PISA 2009. Of concern is that the decline is primarily among high-achieving students, and that the proportion of both males and females in the highest two proficiency levels declined significantly over the nine-year period, while the proportion of males in the lowest proficiency levels increased.
Enjoyment of reading was found to have a strong relationship with performance; however, one-third of Australian students reported that they did not read for enjoyment. Students in Shanghai – China reported the highest levels of reading for enjoyment.
Mathematical literacy
In mathematical literacy in PISA 2009, Australia was outperformed by twelve countries. Again, the decline is not just in terms of rankings but in terms of Australia’s mean score.
Scientific literacy
In scientific literacy in PISA 2009, Australia was outperformed by six countries. However, the score for scientific literacy was not significantly different to that in PISA 2006.
EquityThe performance of students with higher levels of socioeconomic background in reading literacy was one full proficiency level above that of students from lower levels of socioeconomic background, or the equivalent of nearly three years of schooling. At the higher socioeconomic level, the average score for Australia is higher than the average score for Shanghai – China, a top performing country. At the lowest level of socioeconomic background, average performance is significantly lower than the OECD average.
The effect of aggregated high levels of socioeconomic background can be seen in Australia’s school system, in which
we have many children of parents with high socioeconomic backgrounds pooled into the independent school sector and, to a lesser extent, the Catholic sector. The advantage that these schools have in terms of this pooling of resources is demonstrated by the fact that, after adjusting for student and school socioeconomic background, there are no significant differences between the results of students in government schools and those in independent schools. Of course, we do not live in a world where such adjustments are made, and so more must be done to address the level of resourcing in schools that the majority of Australian students attend.
Gender Significant gender differences in reading literacy in favour of females were found in all PISA 2009 countries. The average difference between males and females in Australia was 37 score points, representing one full year of schooling. For students who reported reading frequently, there were no significant gender differences in reading literacy.
Significant gender differences in mathematics were also found in Australia, in favour of males. The re-emergence of gender differences shown in PISA are a salutary reminder to schools and systems that this is still an issue and that if Australia is to improve its performance in mathematics, females’ scores must improve.
Programs to support female participation in mathematics and science, and male participation in reading activities, should be continued and strengthened.
Indigenous studentsThe low achievement of Australia’s Indigenous students continues to be a concern. Further investigation at a later date will examine the data more closely to attempt to isolate factors that will assist in boosting the performance of Indigenous students.
Students in remote locationsThe relatively low performance of students in remote locations calls for attention; the difference between their average reading literacy score and that of students in metropolitan schools was equivalent to almost two years of schooling. Schools in remote locations face many issues, such as attracting and retaining qualified and experienced teachers, maintaining services and providing resources, and creating capacity for staff to attend professional development. Solutions to these issues still prove evasive, so new paradigms will be needed to help address them.
In conclusionAustralia remains committed to the principle of equity and social justice in education, and to the goal of allowing and encouraging all children to fulfil their full educational potential. To a large extent, these goals are realised; evidenced by the high average achievement levels in all three assessment domains in PISA.
However, there are clear signs of serious issues that must be faced. Australia has chosen to participate in PISA in order to monitor national outcomes on a regular basis – the challenge is to act on these findings, as other countries have, to lift educational outcomes for all students.
Main policy messages from PISA 2009 for Australia

www.acer.edu.au/ozpisa • www.oecd.org