Particle Size Distribution in Gas-phase Polyethylene Reactors
Upload
khangminh22Category
view
7download
0
NBS
PUBLICATIONS
NBSIR 84-2989 (NASA) AlllOM DSn^E
The Structure and Properties of
Polyethylene Films Used In HeavyLift Balloons
Report for the Period
January-May, 1984NASA Order S01834D
December 1 984
Issued March 1985
-QC-100 EPARTMENT OF COMMERCE.U56 AL BUREAU OF STANDARDS8^-2989
198b
c. 2


NBSIR 84-2989 (NASA)
NATIONAL BUREAUOF STANDARDS
LIBRARY
The Structure and Properties of
Polyethylene Films Used in Heavy
Lift Balloons.0
I
F. Khoury
J.M. Crissman
B.M. Fanconi
H.L. Wagner
LH. Bolz .
C.A. Harding
Report for the Period
January-May, 1 984
NASA Order S01834D
December 1 984
Issued March 1 985
U.S. DEPARTMENT OF COMMERCE, Malcolm Baldrige, Secretary
NATIONAL BUREAU OF STANDARDS, Ernest Ambler, Director


(i)
Abstract
The following features of five polyethylene films used by NASA in the
construction of heavy lift balloons have been examined: molecular weight,molecular weight distribution, branching, melting behavior, density,
surface texture, birefringence, orientation of crystalline regions,uniaxial deformation in the machine and transverse directions, and the
effect of sample geometry and strain rate on deformation behavior. Thegoal of this exploratory study was to determine whether there are
significant differences in any of the above mentioned features, or
combination of features between the films. The acquisition of suchinformation is a first step towards determining whether there are anyspecific correlations between film characteristics and the incidence of
catastrophic failure of balloons during ascent through the troposphere.This exploratory study has resulted in the identification of similaritiesand differences between various features of the films. Close similaritieshave been found in methyl group content, crystallinity, and peak meltingtemperature. The preferred orientations in the crystalline regions appearto be qualitatively similar or related. Differences among the films havebeen revealed in two features, namely between their molecular weights, andin the balance of the strain to break behavior in the machine directionrelative to that in the transverse direction.
(ii)
Table of Contents
A. Introduction 1
B. Molecular Weight and Molecular Weight Distribution 2
(i) Dilute Solution Viscosity 2
(ii) Size Exclusion Chromatography (SEC) 2
C. Fourier Transform Infrared (FT-IR) Analysis of MethylGroup Content M
D. Differences between Infrared Spectra of Films 5
E. Density Measurements 6
F. Differential Scanning Calorimetry (DSC) 6
G. Fine Structure and Orientation 8
(i) Fine Structure 8
(ii) Orientation 9
(a) Birefringence 9
(b) Wide Angle X-Ray Diffraction andInfrared Spectroscopy 1
2
H. Mechanical Properties 15
(i) Creep Behavior 15
(ii) Elongation to Break, Tensile Strength, YieldStress 1
5
(iii) Effect of Strain Rate 18
(iv) Comparison of Tensile Properties of DifferentRolls of Category I Film 19
(v) Haziness 19
(vi) Wide Strip Geometry 20
(vii) Bubble Inflation 21
(viii) An Example of the Influence of MolecularWeight and Molecular Weight Distribution onthe Tensile Properties of Polyethylene 21
I. Summary 23
J. Concluding Remarks 25
K. References 27
L. List of Tables 29
M. List of Figures 30

A. Introduction
The study described in this report was sponsored by the Balloon Projects
Branch of the National Aeronautics and Space Administration (NASA). It
was carried out in the period January-April 198M as part of an ongoing
investigation by NASA to determine the causes of the catastrophic
failure of 'heavy-lift* balloons.
Helium filled heavy-lift balloons, in which the helium is contained by
low density polyethylene film, are used by NASA to raise instrument
payloads of up to -BOOOKg (gross inflation) to elevations of over 30Kmfor various research projects. The thickness of the polyethylene film
is usually in the range 13um“25|jm. The capacity of the balloons at
float altitude can be as large as 1*16x10^ cu. meters. Since 1980 NASAhas experienced an increased incidence of catastrophic balloon failuresduring ascent at elevations between 12Km-l8Km where the ambient tempera-ture is The causes of the increased failures of this type from
1980 to the present as compared to the performance of balloons prior to
1980 have been elusive. Limitations inherent in the design characteris-tics of the balloons, inadvertent flaws which may occur in the processof balloon assembly (construction), and differences between the mechani-
cal properties of the polyethylene film used in the balloons prior to
and since 1980, are among the possible causes NASA is investigating.The present exploratory study is concerned with the latter of these pos-sibilities .
The mechanical properties of polyethylene films are governed by both the
molecular characteristics (molecular wt., molecular wt. distribution,chain branching) of the polymer, and the film microstructure (e.g.crystallinity, orientation of the crystalline regions etc.). Themicrostructure is governed in part by the molecular parameters, and in
large measure by the processing conditions used in film production. Thedetails of the tubular film extrusion process (es) used in the productionof the films for the heavy-lift balloons are proprietary. Films mustmeet various acceptance criteria set by NASA. An important empiricalcriterion is that in uniaxial extension tests the extension to break in
the machine and in the transverse directions should not be less than250? at -70°C.
The purpose of the short-term exploratory study described below was to
examine various features of the molecular characteristics,microstructure, and mechanical properties of polyethylene filmsrepresentative of those produced and used in heavy-lift balloons priorto 1980 and from 1980 onwards. The primary goal was to determinewhether there are significant differences in any of the above mentionedfeatures, or combination of features, between the films. Such knowledgeis clearly a necessary first step towards determining whether there arecorrelations between film characteristics not covered by presentacceptance criteria, and balloon performance.

2
The five low density polyethylene films studied were selected by NASAand are identified as Category I to IV and B1 . Only the Category III
was representative of film produced prior to 1980.
B. Molecular Weight and Molecular Weight Distribution.
Two types of measurements which are related to the molecular weight and
molecular weight distribution of the polyethylene in the films have beencarried out, namely (i) the determination of the viscosity of dilutepolymer solutions, and (ii) size exclusion chromatographic measurements.
( i) Dilute Solution Viscosity.
These measurements consisted in determining the flow times in a capil-lary viscometer at several concentrations of the polymer in
1,2,4-trichlorobenzene at 130°C, and extrapolating to zero concentrationto obtain a "limiting viscosity number" or intrinsic viscosity [n]. Theresults for polymer taken from one sheet of film from each of the fivecategories submitted by NSBF, as well as the pellets used to produceCategory B1 film, are given in Table 1
.
The precision in [n] is ± .01 -.02 indicating a small difference betweenCategories I and IV on the one hand and Categories II and III on theother. A much larger difference is observed between these four catego-ries and the polymer of Category B1 both as film and pellets. Theselimiting viscosity numbers cannot be directly translated into a viscos-ity average molecular weight by means of the Mark-Houwink relation[n]=KM°^ (M=mol.wt., K and a are constants) because the polymer in thefilms is branched polyethylene for which such a relation is inapplica-ble.
Two types of branching are usually present, long chain and short chain.
A branched polymer molecule of a given molecular weight will have a
smaller hydrodynamic volume than a linear chain of the same molecularweight, and hence a lower viscosity. Hydrodynamicvolume also determines elution volume in size exclusion chromatography.Long chain branches are more effective in reducing hydrodynamic volumethan short chain branches. Hence, the extent and nature of the branch-ing determines the magnitude of the effect on viscosity and elution vol-ume.
( ii) Size Exclusion Chromatography (SEC):
In these experiments the polymer is separated into its constituents by
molecular size. For linear (unbranched) polymers this is equivalent toobtaining the molecular length or weight distribution. In the case ofbranched polymers such as the polyethylene in the films under study,size is determined by branching as well as molecular length, thus makinginterpretation of the chromatograms more complex.

3
The chromatograms were obtained with the Waters* Model 150C Liquid/Gel
Permeation Chromatograph containing five microstyrogel columns with
nominal pore size 10^, iq 3, 10^, 10^ and 10^ ^ , covering completely the
commercially available range of pore sizes. Runs were carried out at
135°C with purified 1,2,4 -trichlorobenzene as the eluant. Each solu-
tion contained about 0.255^ (w/v) of polymer to which 0.255 (w/v) Santonex*
antioxidant was added and was filtered through a 5utn Teflon* filter.
Calibration was carried out with Linear Polyethylene SRM 1475 as well as
with eleven narrow molecular weight distribution polystyrene standardsusing the universal calibration technique to give a calibration range of
850 to 4.6x10^ for linear polyethylene.
The chromatograms of the branched polyethylene in the five categories of
film indicated that the molecular size distributions are very broad and
extend beyond the accessible range of the columns. Since the polyethyl-ene is branched the molecular weights very likely extend to greater than
about 5 million, depending on the amount and type (long and/or short) of
branching.
Calculations of molecular weight were carried out for polymer onlywithin the calibration range, and assuming the polyethylene is linear .
These "apparent" molecular weights are given in Table 2. As already in-
dicated the correct molecular weights are likely to be higher becauseof the effect of branching and because extremely high molecular weightmaterial was excluded from fractionation by the columns; some of this
extremely high molecular weight material might include microgels, knownto occur in branched polyethylenes.
A method of calculating molecular weights of branched whole polymers,requiring several assumptions, has been given in the literature [l]. It
is assumed that the extent of branching is independent of the molecularweight of the species making up the distribution, an assumption whichwould not be expected to be generally true and which has been shown to
be incorrect for low density polyethylene [2]. In addition the rela-tionships used to derive the dependence of the number of branch pointson the radius of gyration [3] apply to a specific type of branchingwhich does not necessarily occur in low density polyethylene. For thisreason, and because the molecular weight range in the films extends be-yond the limits of commercial columns, no attempt was made to use thismethod to calculate "corrected" molecular weights or the extent ofbranching.
Two separate size exclusion chromatography runs were carried out, eachat different times, requiring two calibrations of the columns.In the first series of experiments (denoted A in Table 2) films of Cate-gory I through IV were compared. In the second series (B in Table 2)
designed to evaluate Category B1 film and the pellets from which it wasproduced, measurements on samples of Category I and III were repeated asa cross-check with the first series. The apparent molecular weight val-ues for both runs for the Category I and III films fall within the ex-pected error of the measurements. The chromatograms of all fiveCategories of film are similar to one another, showing evidence of a
Certain coimiercial materials and equipment are identified in thispaper in order to specify adequately the experimental procedure. In no
case does such identification imply recommendation or endorsement bythe National Bureau of Standards, nor does it imply necessarily the bestavailable for the purpose.

4
bimodal distribution with a hint of a third peak. These features arelikely the result of a blending of polymers. Upon comparing the normal-ized chromatograms, which have been superimposed in Figures 1-6, it is
evident that the Category III sample has a greater amount of high mo-lecular weight species than all the other samples. The sample of Cate-gory II also contains a greater amount of higher molecular weightmaterial than I, IV, and B1 , but less than category III. These differ-ences are reflected in the molecular weight averages given in Table 2,
and are consistent with the limiting viscosity numbers of Table 1 , whichare higher for Categories III and II than those of Categories I, IV, and
B1 .
The Category B1 film and the raw polymer from which it was produced havevery similar bimodal distributions as shown in Figure 4. No great sig-nificance can be attached to the small differences at the peak. Howeverthe size exclusion chromatography results, substantiating the viscositydata of Table 1 , demonstrate a substantial difference between CategoryB1 and the polymer from Categories I and III. Superposition of the nor-malized chromatograms in Figures 5 and 6 shows that Category B1 containsless of the high molecular weight polymer than any of the others. It is
possible that this would also result in a smaller microgel content in
film B1 . On examination of the low molecular weight ends of the
chromatograms, not shown in the figures, no differences among the filmswere observed below a molecular weight of 1 ,000.
C. Fourier Transform Infrared (FT-IR) Analysis of Methyl Group Content.
Infrared spectroscopy provides an indirect measure of the degree ofbranching in polyethylene chains through analysis of infrared bands at-tributable to methyl (-CH^) and methylene (-CH 2 -) groups. The presenceof methyl groups which occur at the ends of chains and at the ends of
the side branches attached to carbon atoms along the chains is di;^tin-
guished in IR spectra by an absorption band at 1 378 cm“"' . This bandwhich corresponds to the methyl deformation mode is assignable to methylgroup vibrations irrespective of the chemical bonding of the carbon atomto which the methyl group is attached. The method of analysis which wasused to compare the methyl group content of the films relative to oneanother is based on determining the ratio of the intensity of the re-solved 1378 “^ absorption band divided by the total integrated intensityin the frequency range 1400 cm"^ to 1328 cm~^ , which, in addition to the1378 cm~^ methyl band, includes bands that arise from wagging modes ofmethylene groups in the non-crystalline regions of the polymers (seelater)
.
Single thicknesses of the films were too thin to yield spectra whichcould be analyzed meaningfully for methyl group concentrations. Samplescomposed of several layers of film were also not suitable owing to spec-tral effects arising from multiple reflection from the thin films. Toovercome these limitations samples were prepared by melting three layersof each type of film in a press which was heated to 110°C and thencooled to room temperature. This preparation procedure destroys any

5
orientation present in the original films, it is known however from pre-
vious work that the methyl group vibrations are not sensitive to orien-
tation effects.
Spectra of the five categories of film in the frequency range 1400 cm~^
to 1328 cm“l are shown in Fig. 7. As indicated above the band at 1378
cm""* is assigned to the methyl group and the remaining bands in the fig-
ure arise from the methylene wagging mode in the non-crystalline regions
of the film. The complex band shapes exhibited by the spectra were
decomposed into individual components using the method of Rueda, Balta-
Calleja and Hidalgo [4], and the value of the intensity of the resolved
1378 cm""’ band divided by the total integrated intensity from 1 400 cm""'
to 1328 cm""' was determined for each film. The resulting ratios for the
five categories .of film are listed in Table 3 from which it can be seen
that they are approximately the same for all five films. In short thereis no appreciable difference in methyl group content between the films.
Using the following empirical relationship developed by Rueda et al [4]
E= ( 0 . 085 ) K-jg
— 0.09
(where E is the number of methyl groups per 100 carbon atoms in the
polyethylene, K.| is the resolved intensity of the 1 378 cm"^ methylband per unit thickness of the film in cms) and assuming that the moltenand pressed films were all approximately 2.4 mils (6.1xlO~3 cm) thick,
it is estimated from the data in the third column in Table 3 that the
methyl group content in the films is ^2.1 methyl groups/100 C atoms.
( D) Differences between Infrared Spectra of the Films.
Although the FT-IR room temperature spectra of the samples of the five
film categories taken after melting, pressing, and cooling (see previoussection) were essentially similar to one another in the frequency range1328-1400 cm~^ , differences between the spectra of these samples wereobserved at other frequencies in the mid-frequency range 400 cm~^ - I800cm"^ . Thus, the B1 film exhibited two prominent absorption peaks at 471cm~^ and 1085 cm“^ which were not observed in any of the Category I-IVfilms. The difference spectrum obtained by subtracting the spectrum ofthe Category I sample from that of Category B1 is shown in Fig. 8. In
addition to the two prominent bands mentioned above weak absorptionbands are found at 613 , 671, and 792 cm””' . No other significant differ-ences between these two films were observed in the frequency range400-4000 cm""' .
The spectral pattern exhibited by the difference spectrum in Fig. 8 doesnot correlate with any known absorption bands for polyethylene whichsuggests that the prominent absorption bands at 471 cm“^ and 1085 cm""'
as well as the three weaker bands mentioned above are due to the pres-ence of a rather high concentration of additive (or additives) in the B1
film. Although the differential scanning calorimetry experiments re-ported in Section (E) indicated the presence of an additive (or addi-tives) in the B1 as well as in the Category I-IV films nodistinguishable evidence of absorption bands at 471 cm"^ and 1085 cm"^
6
was detected in the spectra of the latter four films. The occurrence oftwo weak absorption bands at 1150 cm“^ and 1723 cm~^ in the spectra of
Cat. I-IV films may be attributed to another type of additive or addi-tives since these latter spectral features are also not characteristicof polyethylene.
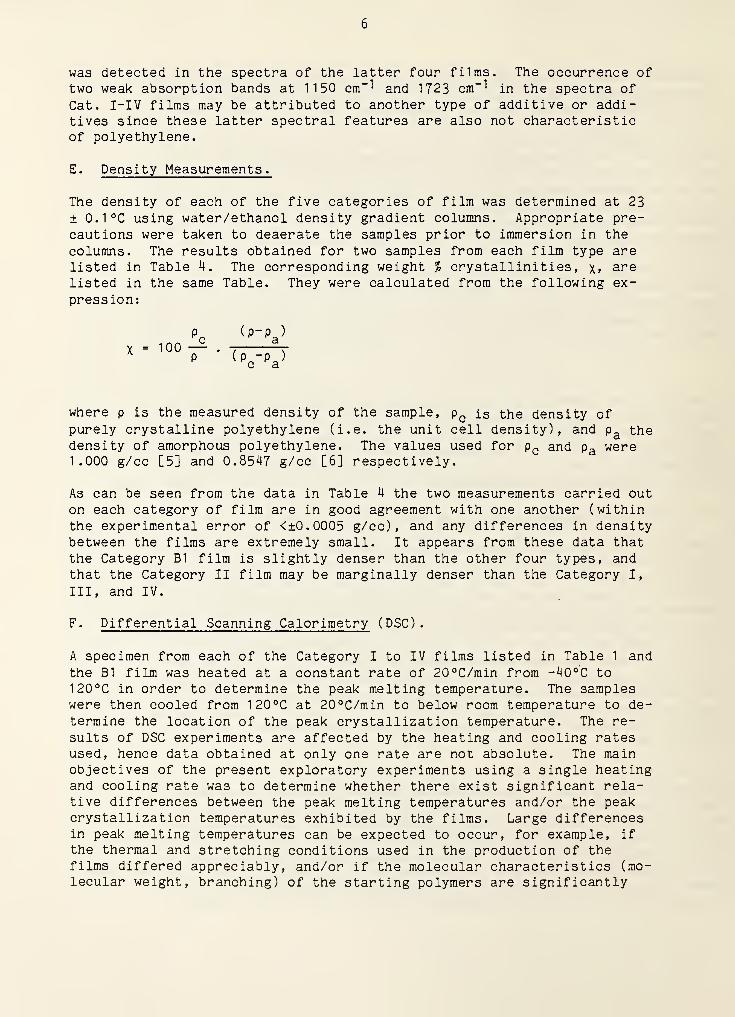
E. Density Measurements.
The density of each of the five categories of film was determined at 23
± 0.1 °C using water/ethanol density gradient columns. Appropriate pre-cautions were taken to deaerate the samples prior to immersion in the
columns. The results obtained for two samples from each film type arelisted in Table 4. The corresponding weight % crystallinities, x> arelisted in the same Table. They were calculated from the following ex-
pression:
(p-p^)
X = 100 — . 7 r
p (P^-P^)
where p is the measured density of the sample, p^ is the density ofpurely crystalline polyethylene (i.e. the unit cell density), and p^ thedensity of amorphous polyethylene. The values used for p^ and p^ were1.000 g/cc [5] and 0.85^7 g/cc [6] respectively.
As can be seen from the data in Table 4 the two measurements carried outon each category of film are in good agreement with one another (withinthe experimental error of <±0.0005 g/cc), and any differences in densitybetween the films are extremely small. It appears from these data thatthe Category B1 film is slightly denser than the other four types, andthat the Category II film may be marginally denser than the Category I,
III, and IV.
F. Differential Scanning Calorimetry (DSC).
A specimen from each of the Category I to IV films listed in Table 1 and
the B1 film was heated at a constant rate of 20°C/min from -40°C to
120°C in order to determine the peak melting temperature. The sampleswere then cooled from 120°C at 20°C/min to below room temperature to de-termine the location of the peak crystallization temperature. The re-sults of DSC experiments are affected by the heating and cooling ratesused, hence data obtained at only one rate are not absolute. The mainobjectives of the present exploratory experiments using a single heatingand cooling rate was to determine whether there exist significant rela-tive differences between the peak melting temperatures and/or the peakcrystallization temperatures exhibited by the films. Large differencesin peak melting temperatures can be expected to occur, for example, if
the thermal and stretching conditions used in the production of thefilms differed appreciably, and/or if the molecular characteristics (mo-lecular weight, branching) of the starting polymers are significantly

7
different from one another. Differences of the latter type might also
be reflected in differences in the location of the peak crystallization
temperature exhibited by the molten specimens upon cooling.
In the heating experiments, film of all five categories exhibited two
melting endotherms, namely a very weak one peaked at a temperature below
60°C, and a very pronounced one peaked in the narrow temperature range
106.2°C-107. 1 °C. The latter endotherm is due to the melting of the bulk
of the polymer in the films. The temperatures corresponding to the peaks
of the low and high temperature endotherms for each film are listed in
Table 5.
In the cooling experiments all the films exhibited two crystallizationexotherms. A very pronounced exotherm, due to the crystallization of
the bulk of the polyethylene, and having a peak temperature in the nar-row range 93.0°C to was observed in each case. In addition, a
very weak lower temperature exotherm peaked in the range 53.6°C-58.4°C,
was recorded in all the films. The temperatures corresponding to the
peaks of the high and low temperature exotherms for each film are listedin Table 5.
The normalized (to a specimen wt. of 1.0 mg) DSC curves exhibited by the
Category I-IV films upon heating and cooling are illustrated in Figs.
(9-1 2) a and (9-1 2) c respectively in which the low temperature meltingand crystallization peaks are barely if at all visible. The occurrenceof these peaks is evident however in Figs. (9-1 2)b and Figs (9-1 2)d in
which parts of the heating and cooling curves are respectively shownwith the vertical scale expanded by a factor of six. The heating andcooling DSC curves for the B1 film are shown in Fig. 13a and Fig. 13b
respectively.
The DSC experiments described above show that there are only slight dif-ferences between the main (high temperature) peak melting temperaturesand between the main peak crystallization temperatures exhibited by the
Category I-IV and Bl film specimens. The experiments also show that all fivefilms contain a small amount of material which melts and crystallizes at
much lower temperatures than the bulk of the polymer in the films. Thenature of this material(s) is not known, it is however reasonable to
speculate that it may be additive, the presence of which in these filmswas already suggested in Section D in which it was pointed out that in-
frared spectra of the five films exhibited absorption bands which arenot characteristic of polyethylene. The infrared spectroscopy observa-tions also suggested that the additive in the Bl film is different fromthat in the Category I-IV films.
As can be seen from Table 5 the weak peak melting and crystallizationtemperatures of the presumed "additive” material occur within the range47°C-59®C. It should be noted in this connection that there is consid-erable overlap between the temperature ranges spanned by the low tem-perature endotherm and the exotherm exhibited by each film. It is
nevertheless surprising at first glance that the low temperature meltingpeak manifests itself at a lower temperature (47.8 °C-54.4°C) than the

8
low temperature crystallization peak (53*6°C-58. 4°C) . Whether this is
due to a redistribution, during the heating cycle, of the additive in
the covered specimen chamber (pan) in the DSC apparatus remains an openquestion, as does the observation that when the samples were subjectedto a second heating cycle no evidence of the low temperature endothermwas observed in the Category I, III, IV and B1 films, however upon beingcooled again to below room temperature from 120°C all five films exhib-ited a low temperature exotherm.
( G) Fine Texture and Orientation.
( i) Fine Texture
All the films (Category I-IV and B1 ) appear hazy to the naked eye. Whenexamined in transmission with a light microscope using phase contrastoptics they all exhibit a mottled appearance on a fine lateral scale (a
few micrometers) as shown in Figures (14-1 8) a. This appearance may bedue to differences in internal fine structure and hence refractive indexbetween the brighter and darker regions seen in Figs. (1 4-l8)a and/or dueto differences in film thickness in these regions. In order to deter-mine whether this appearance of the films is associated with variationsin the thickness of the films on a small lateral scale_,replicas(imprints) were made of the two surfaces of a specimen of each of the
five types of film. The specimens were taken from the same rolls(gores) listed in Tables 4,5. The replicas were made by applying a con-centrated solution (10?) of nitrocellulose in amyl acetate to the sur-faces of the films and allowing it to dry at room temperature. Theresulting nitrocellulose replicas were stripped from the surfaces andexamined in transmission in a light microscope using phase contrast op-tics. If the surfaces of the polyethylene films were perfectly smooththe replicas would appear featureless. This was certainly not the case,
as illustrated in Figs. ( 14-l8)b and (14-l8)c in which it can be seenthat the replicas exhibit fine textural appearances akin to the actualfilms in Figs. ( 14-I3)a. This confirms the occurrence of variations in
film thickness on a small lateral scale (i.e. over distances of a few
urn) in all the films thus indicating that the haziness of the films is
due, in part at any rate, to the surface roughness of the films. Sur-face roughness in blown films is not an uncommon feature (e.g. seereferences [7,8]). A scanning electron micrograph of one of the sur-faces of the Category I film is shown in Fig. 19 in which the unevencharacter of the surface is directly evident.
The Category B1 film could be distinguished from the other four types offilm in the optical microscope (with either normal or phase contrast op-tics) by its high content of dispersed particles of different sizes andshapes. With phase contrast illumination they appear as very bright ob-jects. Several such objects can be seen in Fig.l8a (features denoted X)
.
The occurrence of the particles in the replicas (Figs. I8b,c) of bothsurfaces of the film indicates that many of the particles are situatedon these surfaces or are partially embedded in them and hence easily ex-cised. Whether these objects are particles of the additive detected byinfrared spectroscopy (see Section D) is not known. A consideration

9
which should be borne in mind is that embedded or partially embedded
particles can give rise to uneven stress distributions in a film under-
going deformation and could thus influence the mechanical characteris-
tics of the film.
Differences in haziness to the naked eye were observed between adjoining
regions in some portions of the Category I, II and IV films. The dif-
fuse demarcation "line” between the regions which appeared hazy and less
hazy was parallel or closely parallel to the machine direction and ex-
tended over the length of the samples submitted by NASA. The hazy and
less hazy regions exhibited similar appearances when examined under the
light microscope using phase contrast optics.
( ii ) Orientation
For the sake of brevity in describing the results of an examination of
the birefringent characteristics of the films as well as the results of
wide angle x-ray diffraction experiments and infrared spectroscopy weshall refer to the machine and transverse directions as M and T respec-
tively, and to the direction normal to the surface of the films (i.e.
normal to the MT plane) as N. In addition the refractive indices for
light travelling parallel to N and polarized with its plane of vibrationparallel to M or parallel to T will be denoted n(M) and n(T) respec-tively.
(a) Birefringence
The birefringent character of oriented polyethylene films is determinedby the distribution of the orientation of the crystalline regions in
them, by the film crystallinity, by any optical anisotropy (orientation)in the disordered ('amorphous’) regions, and by form birefringence [9].
As pointed out in Section E the crystallinities of the five films are
essentially equal. In the absence of any knowledge of the conditionsunder which the tubular films are extruded (rate of cooling, draw ratio,blow ratio), it can be reasonably presumed, as a starting premise, that
the birefringence in the films is due predominantly to crystalline ori-entation. The birefringence in the MT plane of the films was examinedto determine whether there are significant differences between them,i.e. in both the sign (±) of An=n(M)-n(T) relative to M and the magni-tude of An on a scale of 0-0.06 [10]. As background concerning the up-per limit of this scale the following may be noted. The unit cell ofpolyethylene is orthorhombic [5]. Its parameters are a=0.?4nm,b=0.493nm, c=0.254nm, a=B=Y=90°. The chain molecules are parallel tothe c-axis. It is commonly assumed, to a good approximation, that therefractive indices of the unit cell are the same as in single crystalsof orthorhombic normal-paraffins (e.g. n-C
25HYi|[ 1 0]) and that n^=1.5l4,n^j=1519, and n^,=1 .575 [11]. If one imagines a single crystal of poly-ethylene oriented relative to the film with the b-axis parallel to N andthe c and a axes parallel to M and T respectively, the crystal would ex-hibit maximum birefringence, n^-n^ =0.06, in the MT plane and be posi-tively birefringent with respect to M. In reality, of course, filmsconsist of microcrystalline regions interspersed with disordered regions
10
which in the case of the films under consideration amount to slightlymore than 50^ of the weight of the films (Section E). Furthermore the
preferred crystal orientation distributions commonly encountered in
blown films differ from the idealized example given above [see SectionG(ii)b]. Thus, the birefringence of the films in the MT plane would be
expected to be less than 0.06.
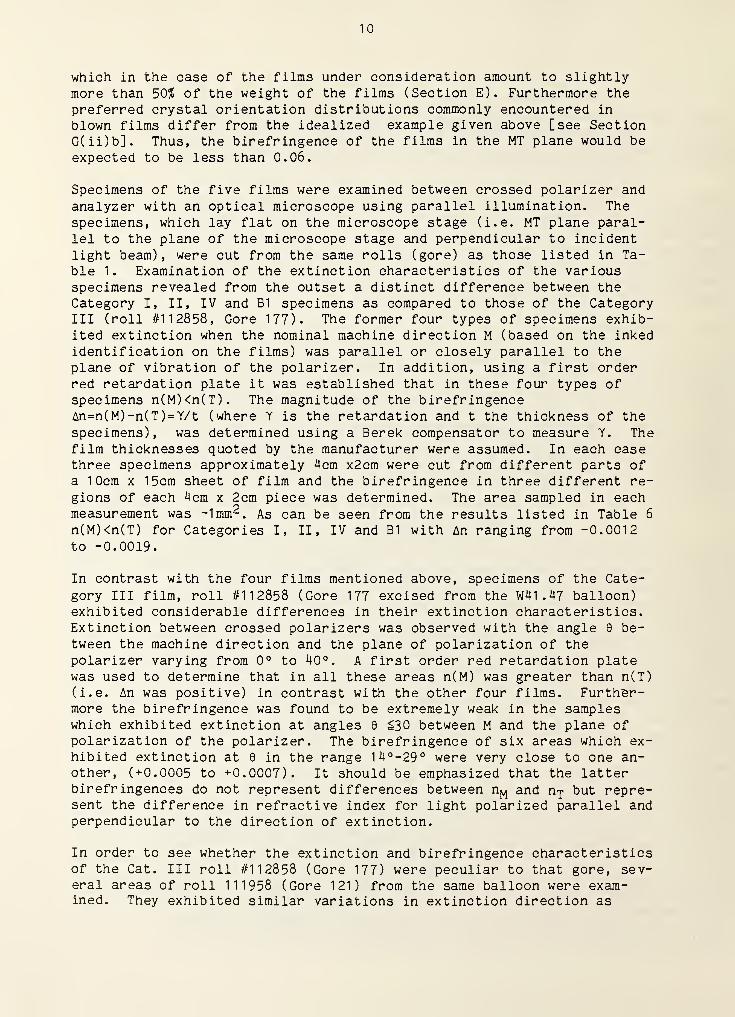
Specimens of the five films were examined between crossed polarizer andanalyzer with an optical microscope using parallel illumination. Thespecimens, which lay flat on the microscope stage (i.e. MT plane paral-lel to the plane of the microscope stage and perpendicular to incidentlight beam), were cut from the same rolls (gore) as those listed in Ta-ble 1. Examination of the extinction characteristics of the variousspecimens revealed from the outset a distinct difference between theCategory I, II, IV and B1 specimens as compared to those of the CategoryIII (roll #112858, Core 177). The former four types of specimens exhib-ited extinction when the nominal machine direction M (based on the inkedidentification on the films) was parallel or closely parallel to theplane of vibration of the polarizer. In addition, using a first orderred retardation plate it was established that in these four types ofspecimens n(M)<n(T). The magnitude of the birefringenceAn=n(M) -n(T)=Y/t (where Y is the retardation and t the thickness of thespecimens), was determined using a Berek compensator to measure Y. Thefilm thicknesses quoted by the manufacturer were assumed. In each casethree specimens approximately 4cm x2cm were cut from different parts ofa 10cm X 15cm sheet of film and the birefringence in three different re-gions of each 4cm x 2cm piece was determined. The area sampled in eachmeasurement was -Imm^. As can be seen from the results listed in Table 6
n(M)<n(T) for Categories I, II, IV and B1 with An ranging from -0.0012to -0.0019.
In contrast with the four films mentioned above, specimens of the Cate-gory III film, roll #112858 (Core 177 excised from the W41.47 balloon)exhibited considerable differences in their extinction characteristics.Extinction between crossed polarizers was observed with the angle 0 be-tween the machine direction and the plane of polarization of thepolarizer varying from 0° to 40°. A first order red retardation platewas used to determine that in all these areas n(M) was greater than n(T)
(i.e. An was positive) in contrast with the other four films. Further-more the birefringence was found to be extremely weak in the sampleswhich exhibited extinction at angles 0 ^30 between M and the plane ofpolarization of the polarizer. The birefringence of six areas which ex-hibited extinction at 0 in the range l4°-29° were very close to one an-other, (+0.0005 to +0.0007). It should be emphasized that the latterbirefringences do not represent differences between nj^^j and n-p but repre-sent the difference in refractive index for light polarized parallel andperpendicular to the direction of extinction.
In order to see whether the extinction and birefringence characteristicsof the Cat. Ill roll #112858 (Core 177) were peculiar to that gore, sev-eral areas of roll 111958 (Core 121) from the same balloon were exam-ined. They exhibited similar variations in extinction direction as
11
those described above. Similarly, n(M) was also greater n(T). The evi-
dent question which arose was whether the features described above,
which distinguished the type III specimens excised from gores 177 and121 from the specimens of the four other films, are characteristics of
the Type III film as made, or are a consequence of handling e.g. during
the manufacture of the balloon. The possibility that 'handling' might be
the reason is suggested by an examination of specimens of Type III (roll
#112877) film which had not been incorporated in a balloon. Film from
the same roll had been used in one of the gores (#146) of the balloon
from which specimens 112858 (Gore 177) and 111958 (Gore 121) originated.
The specimens of roll #112877 exhibited extinction when the nominal ma-
chine direction was parallel to the plane of polarization of the
polarizer. Furthermore n(M) was less than n(T) as is the case in the
other four Categories of film. Measurements of birefringence, as car-
ried out on the other films, yielded the result listed in Table 6
(An=-0.0011) which, although lower, seems to be more in keeping with the
optical character of the other four films.
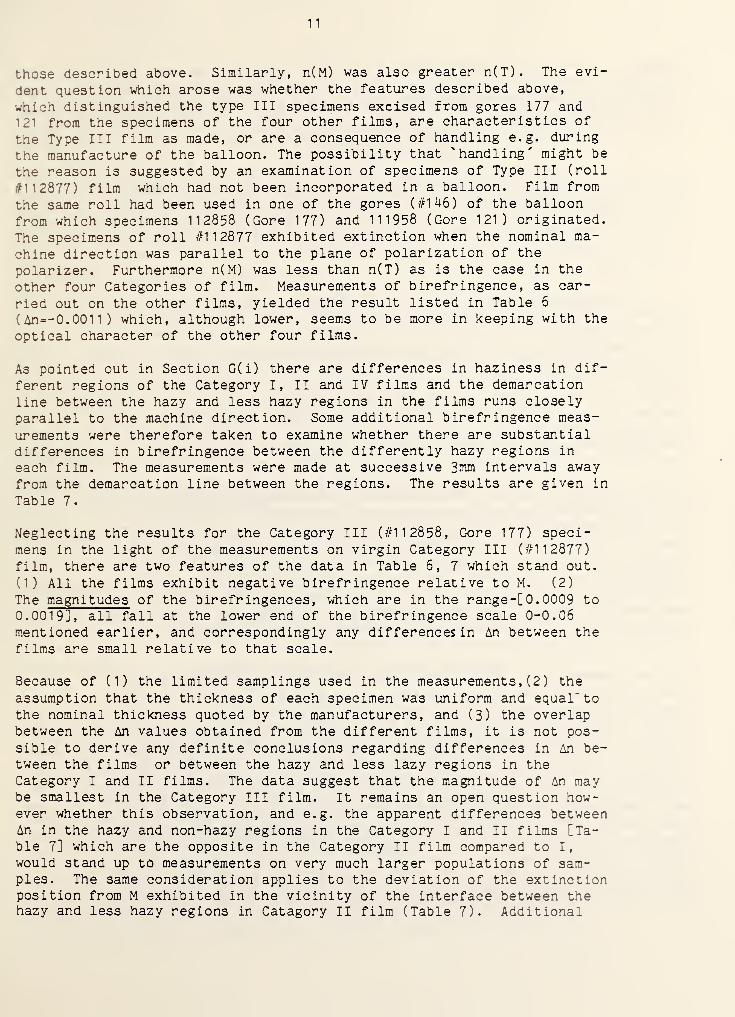
As pointed out in Section G(i) there are differences in haziness in dif-
ferent regions of the Category I, II and IV films and the demarcation
line between the hazy and less hazy regions in the films runs closelyparallel to the machine direction. Some additional birefringence meas-
urements were therefore taken to examine whether there are substantialdifferences in birefringence between the differently hazy regions in
each film. The measurements were made at successive 3nim intervals awayfrom the demarcation line between the regions. The results are given in
Table 7.
Neglecting the results for the Category III (#112858, Gore 177) speci-mens in the light of the measurements on virgin Category III (#112877)film, there are two features of the data in Table 6, 7 which stand out.
(1) All the films exhibit negative birefringence relative to M. (2)
The magnitudes of the birefringences, which are in the range-[0. 0009 to
0.0019], all fall at the lower end of the birefringence scale 0-0.06
mentioned earlier, and correspondingly any differences in An between the
films are small relative to that scale.
Because of (1) the limited samplings used in the measurements, (2) the
assumption that the thickness of each specimen was uniform and equal' to
the nominal thickness quoted by the manufacturers, and (3) the overlapbetween the An values obtained from the different films, it is not pos-sible to derive any definite conclusions regarding differences in An be-tween the films or between the hazy and less lazy regions in theCategory I and II films. The data suggest that the magnitude of An maybe smallest in the Category III film. It remains an open question how-ever whether this observation, and e.g. the apparent differences betweenAn in the hazy and non-hazy regions in the Category I and II films [Ta-ble 7] which are the opposite in the Category II film compared to I,
would stand up to measurements on very much larger populations of sam-ples. The same consideration applies to the deviation of the extinctionposition from M exhibited in the vicinity of the interface between thehazy and less hazy regions in Category II film (Table 7). Additional

12
comments on the birefringence exhibited by the films are included in
Section I in conjunction with the results of the wide angle x-ray dif-fraction and infrared spectroscopy on the orientation of the crystallineregions in the films.
(b) Wide Angle X-ray Diffraction and
Infrared Spectroscopy
As pointed out in the previous section blown films of polyethylene con-
sist of microcrystalline regions interspersed with disordered regions.The microcrystals adopt different preferred orientations relative to the
M, T, and N directions depending, inter alia, on the rate at which thetubular extrudate is cooled, and on the stretch and blow ratios imposedon it [see e.g. refs. 12-15].
As background to the wide angle x-ray diffraction (WAXD) experiments re-ported in this section it should be pointed out that the quantitativecharacterization of the crystalline orientation in films requires; (1)
The determination of the preferred orientation of the a,b, and c-axis ofthe microcrystals relative to the M, N and T axes in the films. A pos-sibility which may occur, and which should be borne in mind in this con-nection, is that a given set of processing conditions may yield a filmhaving e.g. two populations of microcrystals having distinctly differentpreferred orientations relative to M,T, and N; (2) The determination ofthe distributionC s) or deviations from the preferred orientation( s)
among the total population of microcrystals.
Tasks (1) and (2) outlined above require the determination of pole fig-ures [16] which involves the monitoring of the changes in intensitywhich key reflections undergo when the orientations of the M, T and N
axes in the film sample are changed systematically relative to the inci-dent x-ray beam by small angular increments over wide angular ranges.These tasks can be achieved with an automated counter x-raydiffractometer having a four circle goniometer sample holder andequipped with data collecting, processing and display facilities. Sucha system, which is currently being installed in the Polymers Division,was not available during the period covered in this report.
In the comparatively limited exploratory experiments described below, a
flat plate camera set-up was used to record photographically the dif-fraction patterns exhibited by each type of film when it was oriented in
three different ways relative to the collimated beam of monochromaticx-rays (Ni filtered CuKa radiation), A=0. 1 5^l8nm) . The three orienta-tions were with the T, the M and the N axis of the film set parallel tothe incident x-ray beam respectively. For the sake of brevity the cor-responding diffraction patterns will be referred to below as the T, Mand N patterns. The patterns obtained from the five films are shown in
Figs. 20-24. The orientations of the two orthogonal axes in the poly-ethylene film which lie in the plane normal to the x-ray beam are iden-tified in each pattern (e.g. the M and N axes in the T diffractionpatterns etc.). The most evident reflections exhibited in all the pat-terns are (in order of decreasing intrinsic as well as observed inten-sity) the 110 the 200 and the 020 reflections. The interplanar spacings

13
corresponding to these reflections are 0.4lnm, 0.37nm and 0.246nm [5].
These reflections which are identified in all the patterns (Figs. 20-24)
occur as arcs which in some cases (particularly the 110 reflections) ex-
hibit considerable azimuthal spread and appear ringlike in character.
An overall feature of the results of the experiments outlined in the
previous paragraph is the similarity in the dispositions of reflections
(relative to the film reference axes) between the T, between the M, and
between the N diffraction patterns of all the films. The following
characteristics may be listed in this connection:
T-diffraction patterns, Figs. (20-24)a
020 reflections: arcs spread preferentially about the axis parallel to
N
200 reflections: arcs spread preferentially about the axis parallel to
M.
110 reflections: two pairs of diametrically opposite arcs spread
about ± 30° from N
M-diffraction patterns, Figs. (20-24)b
020 reflections: arcs spread preferentially about the axisparallel to N
200 reflections: arcs spread preferentially about the axisparallel to T
N-diffraction patterns, Figs. (20-24)c
020 reflections: faint arcs spread preferentially about the axis
parallel to T
200 reflections: arcs spread preferentially about the axis
parallel to M
The arced or ringlike character of the various x-ray reflections exhib-ited by the films indicate that there are broad distributions in orien-tation about some preferred orientation or orientations. The preferreddispositions exhibited by the 200 reflections in the M, T, and N dif-fraction patterns indicate that the microcrystalline regions in thefilms are oriented with the a-axis preferentially parallel to the MTplane and with a preference parallel to M. The dispositions of the 020reflections suggest the b-axis is preferentially oriented parallel to
the NT plane and with a preference parallel to N.
A possible working model which suggests itself, and which would be con-sistent with the preferred a-axis and b-axis orientations indicatedabove, is one in which the film is envisaged as containing mainly twopopulations of microcrystals whose respective orientations are distrib-
14
uted preferentially about the two idealized orientations depicted in
Fig. 25. In Fig. 25a the tnicrocrystals are envisaged as being orientedwith the b-axis parallel to N and with the a-axis and the c-axis ran -
domly oriented in the MT plane. In the case of Fig. 25b themicrocrystals are oriented with the a-axis parallel to M, and with theb-axis and the c-axis randomly oriented in the NT plane. Preferred ori-entations corresponding to those in Fig. 25a and Fig. 25b would each ex-
hibit T-diffraction patterns in which the preferred dispositions of the
020, 200 and 110 reflections relative to the N and M directions are the
same and would correspond to the actually observed dispositions of thesereflections in the T diffraction patterns exhibited by the films whichwere described earlier.
While the qualitative observations described above have identified fea-
tures of the M, T, and N diffraction patterns which indicate that the
crystalline orientationC s) in the five films are similar or related in
type, more detailed studies using the automated counter-diffractometertechnique mentioned earlier will be necessary to compare their orienta-tion characteristics (preferred orientations and orientation distribu-tions) quantitatively, and to test the suggested working model.
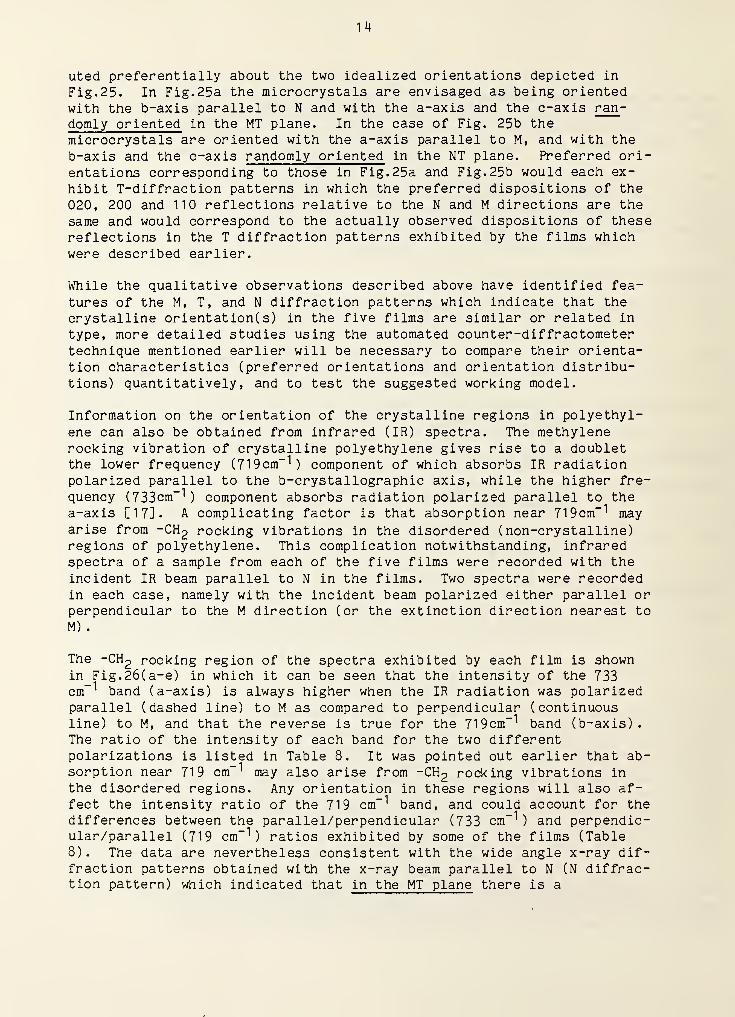
Information on the orientation of the crystalline regions in polyethyl-ene can also be obtained from infrared (IR) spectra. The methylenerocking vibration of crystalline polyethylene gives rise to a doubletthe lower frequency (719cm~^) component of which absorbs IR radiationpolarized parallel to the b-crystallographic axis, while the higher fre-
quency (733cm“^ ) component absorbs radiation polarized parallel to thea-axis [17]. A complicating factor is that absorption near 719cm~^ mayarise from -CH
2 rocking vibrations in the disordered (non-crystalline)regions of polyethylene. This complication notwithstanding, infraredspectra of a sample from each of the five films were recorded with theincident IR beam parallel to N in the films. Two spectra were recordedin each case, namely with the incident beam polarized either parallel orperpendicular to the M direction (or the extinction direction nearest to
M) .
The -CH2 rocking region of the spectra exhibited by each film is shown
in Fig.26(a-e) in which it can be seen that the intensity of the 733cm~^ band (a-axis) is always higher when the IR radiation was polarisedparallel (dashed line) to M as compared to perpendicular (continuousline) to M, and that the reverse is true for the 719cm“^ band (b-axis).The ratio of the intensity of each band for the two differentpolarizations is listed in Table 8. It was pointed out earlier that ab-sorption near 719 cm“^ may also arise from -CH
2 rocking vibrations in
the disordered regions. Any orientation in these regions will also af-fect the intensity ratio of the 719 cm~^ band, and could account for the
differences between the parallel/perpendicular (733 cm~^ ) and perpendic-ular/parallel (719 cm“^ ) ratios exhibited by some of the films (Table8). The data are nevertheless consistent with the wide angle x-ray dif-fraction patterns obtained with the x-ray beam parallel to N (N diffrac-tion pattern) which indicated that in the MT plane there is a

15
preferential orientation of the a-axis parallel to M and the b-axis par-
allel to T (the 200 and 020 arcs are centered about M and T respec-
tively, as pointed out earlier).
( H) Mechanical Properties
( i ) Creep Behavior (Categories I-IV)
As background to the investigation of the tensile elongation and tensile
strength at break of the films, the tensile creep behavior of the Cate-
gory I-IV films was examined at 23±0.5°C for specimens which were cut
both parallel and transverse to the machine direction. The specimenswere cut with a die which conformed closely with the type (II) tensilebar specified in ASTM 0638. In order to determine the strain as a func-
tion of time fiducial marks were placed approximately five centemetersapart on the straight gage section of each specimen and the separationof the marks was monitored with a cathetometer . The duration of each
creep experiment was generally about one hour.
In the first set of experiments the specimens were subjected to an ap-plied engineering stress of 2.5 MPa (363 PSI). This level of stresscorresponds to about one fourth of the yield stress for these films as
determined in uniaxial extension at a constant rate of strain (discussed
in a later section). The results are shown in Figure 27 plotted as logstrain versus log time. Under the conditions just described the maximumstrain after one hour was 2.2$ or less. No significant differences in
creep behavior occurred between the machine and transverse directions,nor was there any appreciable difference in behavior from film to film.
Most of the observed differences are probably within the experimental
errors which can arise from factors such as nonuniformity in the filmthickness and creases due to folds which can result in uncertainty in
determining the initial unloaded gage length 2,^.
A second set of creep experiments was done using a larger applied engi-neering stress of 10 MPa (1450 PSI) which is very close to the yieldstress for these films at 23° (see later, Table 12). From Figure 28- it
can be seen that at the higher level of stress, strains of from 30$ to
100$ were observed after about one hour. After one minute all of thefilm specimens except two exceeded the strain at the yield point whichis in the range from 18 to 22$ for these films at 23 °C. Beyond theyield point significant differences occurred between the machine andtransverse direction as well as from film to film. The Category I filmappears to be the most nearly balanced of the four films, and the Cate-gory IV film the least. Of the four films the Category II film exhib-ited the least amount of creep in the machine direction after one hour.
(ii ) Elongation to Break, Tensile Strength, Yield Stress(Categories I-IV, B1 )
The tensile elongation and tensile strength at break of the CategoryI-IV, and B1 films were investigated at 23±0.5°C and at -70±2°C. Due tothe limited amount of actuator travel available in our hydraulic test

16
machine fitted with a low temperature chamber, it was found necessary to
use specimens which had a gage length of no more than about 1 to 1 .5 cm.
Specimens were cut with a dumbbell shaped die specially designed so thatthe ends widened rather gradually in the first 0.1 -0.2 cm beyond the
straight portion of the dumbbell. The straight portion of the dumbbellwas 0.80 cm long and the width in that narrow section was 0.315 cm.
For the initial set of experiments, which were carried out at 23±0.5°C,the gage length was set at 1.0 cm so that at each grip about 0.1 cm ofthe exposed gage section was slightly wider than the 0.80 cm longstraight section. The results of tests carried out on the Category I
and II films are presented in Table 9. The values obtained were foundto be significantly smaller than those quoted by either the film manu-facturer or the NSBF. Therefore much effort was devoted to examine theeffect of different specimen geometries and clamping arrangements on themeasurements. This effort involved the testing of approximately 200specimens having geometries which varied from straight strips of differ-ent length to width ratios to the dumbbell shaped specimens describedabove in which the gage length was varied. Of the different geometriesexamined the one which consistently yielded in the greatest strain at
break was one using the original dumbbell shaped specimen gripped suchthat only the straight section of the dumbbell was exposed between thegrips. Accordingly, all subsequent tests at 23°C and -70°C were carriedout using specimens with a gage length of 0.60 cm so that the length tobreadth ratio was 1.9, which compares to a value of 2 used by the NSBF.The specimen grips were made of aluminum. They were covered with onelayer of a soft cloth electrical tape to prevent contact of the polyeth-ylene film with the metal. Use of the cloth tape results in greater val-ues of the strain at break. The rate of clamp separation, which waslimited by the number of positions available on the function generatorof our testing machine, was set so that the specimen was strained at a
rate of 991^ per minute as compared to a rate of 1000^ per minute usedby the NSBF.
Using the test procedures just described, the tensile properties of theCategory I-IV, and B1 films were examined at 23±0.5°C and the resultsare shown in Table 10. In the machine direction the average strain at
break does not differ greatly among the five films, whereas in thetransverse direction significant differences do occur. For the CategoryI and B1 films the average strain at break is slightly greater in themachine direction than in the transverse direction. The reverse is truefor the Category II, III, and IV films for which the transverse direc-tion exhibits significantly greater strain before failure. It should benoted that the Category I-IV films exhibited a distinct maximum in thestress-strain curve at low strains (range 18-2256) when stretched in thetransverse direction. A barely perceptible maximum occurred in the B1
film. None of the films exhibited a maximum in the stress at lowstrains when stretched in the machine direction. Based upon the tensiletests, the Category I-IV films are all consistent with the creep meas-urements described earlier where the specimens from these films sub-jected to a stress of 10 MPa (Fig. 28) were found to creep significantlymore in the transverse than in the machine direction, except for the

17
Category I film which exhibited more balanced behavior and also exhib-
ited slightly higher creep in the machine direction than in the trans-
verse direction.
The maximum and minimum values of the strain at break at 23°C are listed
in Table 11 for each of the five films. For stretching along the ma-
chine direction the smallest minimum values occurred in the Category III
and IV films, whereas for stretching along the transverse direction they
occurred in the Category I and B1 films.
A summary is presented in Table 12 of the yield stress data obtained
from the same tensile tests described above. In the present work the
yield stress was defined to be either the point at which the
stress-strain curve went through a maximum (transverse direction), or if
no maximum occurred (machine direction) it was taken to be the point at
which the stress-strain curve exhibited a sharp bend. The maximum aver-age yield stress occurred for the Category I film in the machine direc-tion and the minimum average value occurred for the Category III film in
the transverse direction. However, there did not appear any largevariation in yield stress among any of the five films at 23°C. For allfive films the strain at the yield point was in the range from 18 to
22 %.
Similar tests were carried out at -70°C on specimens cut from the samesheets of film used for the 23°C tests. The results are summarized in
Table 13- The temperature control of the low temperature chamber wassuch that the actual specimen temperature at the time the test wasstarted is estimated to be -70±2°C. To ensure that the specimen tem-perature was at least as low as -70°C, the chamber was initially cooledto between -75 °C and -80 °C. The chamber was then warmed up to about-71 °C and held at that temperature for several minutes. The test wasgenerally started when the temperature in the vicinity of the specimenwas between -71 °C and -70°C. The temperature in the vicinity of thespecimen was determined by both a copper-constantan thermocouple placedjust below the specimen and a solid state device placed just above thespecimen.
As was the case at 23°C the Category II, III, and IV films exhibitedsmaller average strains at break in the machine direction than in thetransverse direction, while the Category I film exhibited greater aver-age strain in the machine direction. In the case of the B1 film howeverthe strain to break was larger in the transverse than in the machine di-rection, whereas the reverse occurred at 23°C. The average strains tobreak in both directions are less for all five films at -70°C than theywere at 23°C, by about 33 percent overall. The standard deviations are,however, much larger at -70°C than at 23°C, particularly in the case ofthe Category II film. For the five sets of film samples examined, theaverage strain at break in each case did exceed the current minimum re-quirement of 250% stipulated by NSBF, although in several cases individ-ual specimens failed at elongations well below this value.

18
Table 14 shows the maximum and minimum values of the strain at break
corresponding to the data presented in Table 13- While in each case
the average strain at break exceeded 25055, each film, with exception for
the Category III film, exhibited at least one specimen which failed at a
strain less than 250/5. One specimen of the Category III film exhibitedthe largest elongation (60955) at -70°C of any of the specimens tested.
Table 15 presents a summary of the yield stress data obtained at ~70°C.
A comparison of the data in Tables 12 and 15 shows that at -70°C the
yield stress is from 4 to 5 times greater than it is at 23°C. Whereasat 23°C the variation in yield stress from film to film was less thanI 255, at -70°C it is as much as 3755 . On average, the Category I film ex-
hibits a higher yield stress than do the other three, while the CategoryII film in the transverse direction exhibits the smallest average yieldstress. At the same time the strain at the yield points exhibited by
the films decreases from the 18-22? range at 23°C to the 6-9? range at
-70°C. It should be noted that all the films exhibited a maximum in thestress strain curve at -70°C when stretched in the transverse as well as
in the machine direction. This contrasts with the deformation at 23°Cwhere the manifestation of a maximum occurred only upon stretching in
the transverse direction.
Using the data for the 64 specimens of Category I-IV and B1 filmswhoseproperties are summarized in Table 13, we have plotted in Figure 29 thestrain at break versus yield stress at -70°C. Of the eleven specimenswhich failed at a strain of less than 250?, 4 belong to Category II,
three to Category B1 , two to Category I, and two to Category IV. Thetwo smallest values obtained (46 and 72?) were from Category II. Ofthese eleven specimens which failed at less than 250? strain, all butone exhibited a yield stress of less than 50 MPa. However, the overallaverage yield stress for all 70 specimens tested was only 47.0 MPa (6831
PSD
.
(iii) Effect of Strain Rate.
Another aspect of the low temperature deformation of the films which is
of interest is the extent to which the ultimate tensile properties de-pend upon the rate of strain. The strain rate dependence was examinedat -70°C for the Category I, II, and B1 films and the results are pr-e-
sented in Table 16. The strain rate was varied by a factor of one hun-dred, the lowest rate being 99.1? per minute and the highest being 9910?per minute. It can be seen from Table 14 that in the range of strainrates examined there is little, if any, dependence of the strain tobreak on the strain rate. Except for the Category B1 film, at each rateof strain the trends are the same as those found earlier. The CategoryI film extends more in the machine direction than in the transverse di-rection while for the Category II film the opposite is true. The Cate-gory B1 film at the lowest and highest rate of strain shows the oppositebehavior to that at the rate of 991? per minute. At all three strainrates each of the three films meets the minimum requirement of 250?elongation, although Category I and B1 films do so marginally. Examina-tion of the results on tensile strength indicates that, if averaged over

19
all three films, the average stress at break is slightly higher at a
rate of 991$ per minute than at the other two rates, however the aver-
ages for the two extreme rates of strain are based upon the testing of
only three specimens cut along each direction.
( iv) Comparison of Tensile Properties of Different Rolls of CategoryI Film
Following the tensile tests described earlier in this report on roll
315477 of the Category I film, several additional pieces of Category I
film from roll 315421 were received from the NSBF which were cut fromareas very near those tested previously by them. The pieces were iden-
tified as Sample 2, areas 106-112. We have examined the tensile proper-ties of specimens cut from the two areas identified as 107 and 111 and
the results are presented in Table 17. For comparison the results fromthe earlier tests on roll 315477 are also included. The values quotedrepresent averages for only three specimens cut in each direction for
areas 107 and 111, whereas for roll 315477 the averages are for sixspecimens.
At both 23°C and -70°C the strain at break is greater for roll 315421than for roll 315477, while the yield stress is greater for roll 315477.Moreover, there appear to be differences in all three tensile propertiesbetween areas 107 and 111 from roll 315421. At -70°C one specimen fromarea 107 failed at a strain of less than 250$ (202$), whereas none fromarea 111 failed at less than 380$ elongation. Also, at -70°C the speci-mens from area 111 cut along the transverse direction exhibited thehighest tensile stress at break of any of the five film categoriestested in this study.
( v) Haziness
As pointed out in Sections G(i) and G(ii)a films of Category I, II andIV exhibit regions which to the eye appeared to vary in haziness. Theboundary separating the more hazy from less hazy material was in someinstances rather abrupt and it tended to run more or less parallel tothe machine direction in the film. One sheet of film in which this phe-nomenon was particularly evident was from roll 311071 of Category IV.
To investigate the possibility that differences in mechanical perform-ance might be associated with differences in haziness a set of twelvespecimens were cut initially from one 8 inch by 8 inch piece from roll311071 , six from the more hazy region and six from the less hazy region.All twelve were cut parallel to the transverse direction in the film andthe tensile tests were carried out at -70®C. The results are presentedin Table 18. The initial twelve specimens are identified as MH1 -MH6(more hazy) and LH1 -LH6 (less hazy). The result was that only one ofthe six specimens cut from the more hazy region extended more than 100$,whereas all six specimens cut from the less hazy region extended morethan 280$.

20
As a result of this observation, seven more specimens were cut from ar-eas surrounding the more hazy region from which the original six werecut. The latter seven specimens are identified in Table 18 as MH7-MH13-All seven of these extended at least 388?. The reason why five of the
first six specimens from the more hazy region failed at much smallerstrains remains unknown. All nineteen specimens were handled and testedunder identical conditions. Moreover the first twelve specimens weretested by alternating between specimens cut from the more hazy and less
hazy material. It is possible that, by chance, the first six specimenswere cut from a small but particularly weak area of the film.
Because of the above observations all the pieces of film from the tenrolls of the Category III film and at least six rolls from each of the
Category I, II, and IV films supplied by the NSBF were examined visuallyfor haziness. None of the ten rolls of Category III film were found toexhibit any significant variation in haziness. On the other hand, allthe film examined from Categories I, II, and IV did contain at least oneregion which exhibited more hazy and less hazy areas. The one piece offilm from Category B1 which we received did not show any variability in
haziness.
After the above mentioned inspection of the various films, it was de-
cided to examine the mechanical behavior of one of the more hazy regionsobserved in the Category II film. Eight specimens were cut along thetransverse direction from roll 313865, gore 53. The results of tensiletests done at -70°C are shown in Table 19. Although two specimensfailed at a strain of less than 250?, the strains, on average, are notgreatly different from those found earlier for the same roll of film(see Table 13). Both the average stress at break and average yieldstress are, however, significantly smaller (compare with data in Table13 and Table 15 respectively).
( vi) Wide Strip Geometry
In addition to the tensile tests just described, we have also examinedbriefly the mechanical properties of film specimens having differentgeometries or subjected to different deformation modes. The first ofthese to be discussed involves the extension of a wide strip of film.
In the work described above the ratio of the specimen width to the ,
length was 0.52. In the present case the width was set at 1 .87 cm andthe gage length set at 0.2cm, so that the width to gauge length ratio was9.35. A width of 1 .87cra corresponds to the maximum dimension which canbe accommodated in our present set of grips. Table 20 summarizes theresults of measurements made at 23°C on films from Categories I, II, andIII. All of the specimens were cut so that the transverse film direc-tion was parallel to the tension axis. In each case the average strainat break is significantly greater, from 18 to 31?. than for the narrowertensile specimens used earlier (see Table 10). One specimen from theCategory III film elongated by as much as 1030? before failing.

21
(vii) Bubble Inflation
Another technique which can be used to investigate the mechanical per-
formance of biaxially oriented films is one involving the inflation of a
diaphragm to form a bubble. This method is described in reference [18]
and is very similar to the ’’race track” test used by the NSBF. An exam-
ple is shown in Figure 30. The film is inflated from one side to form a
bubble. Provided the film is sufficiently thin and the deformations
small the bubble will approximate very closely a spherical shape. Near
the pole the deformation is ' equal -biaxial ' and the true stress in the
region is given by
where P is the inflation pressure, r is the radius of curvature, h is
the initial film thickness, and A is the stretch ratio given by X=1+e, e
being the strain determined along a given radius. If the deformation
becomes large enough that the yield point is exceeded, the bubble may
become distorted and no longer spherical in shape. Under a constant in-
flation pressure creep will occur. If either sufficient time is allowed
or the pressure is high enough, the material will eventually reach a
point of instability and necking followed by cold drawing may occur
prior to rupture.
Using this inflation method one sheet of Category III film was graduallyinflated by slowly increasing the pressure until yielding and ruptureoccurred. The area of our diaphragm tester was 46cm2 and the test wasconducted at 23°C. The example shown in Figure 30 is Category III justprior to rupture. A characteristic of the film was the formation of nu-
merous ”necks” or thinned down regions. In Figure 30 more than 10 dif-ferent necked down regions were observed over the central region of the
bubble. In each case the necking originated from one or more thin faintlyvisible lines which ran nearly parallel to the machine direction in thefilm. Upon formation of a neck, cold drawing then occurred with the deformationbeing greater in the transverse direction.
(viii) An Example of the Influence of Molecular Weight and MolecularWeight Distribution on the Tensile Properties of Polyethylene
In Section B of this report it was found that of the five categories of
film the Category III film had a somewhat greater proportion of high mo-lecular weight material than did the others, whereas the Category B-1
film had the lowest molecular weight. It is well known that factorssuch as molecular weight and molecular weight distribution play an im-portant role in determining the tensile properties of polymers, particu-larly semicrystalline polymers such as polyethylene. In this section weshall present one example of how molecular weight and molecular weightdistribution can influence the uniaxial creep behavior of initiallyunoriented linear polyethylenes [19] at 23 C.

22
Figures 31 » 32, and 33 present what we shall refer to as isochronalstress-strain surfaces obtained from creep experiments on three differ-ent samples of linear polyethylenes. Although the particular surfacesshown are for linear polyethylenes in uniaxial creep, a similar set ofsurfaces will exist for branched polyethylenes under uniaxial or biaxialdeformations. The surfaces were obtained in the following way. For
each of the three different samples a set of uniaxial creep experimentswas carried out at different levels of applied engineering stress. Each
creep experiment was continued until fracture occurred. In some casesthis meant conducting the experiment for a period of several months.
From each of the sets of creep curves a series of isochrones was deter-mined, as shown in the figures. All three samples were linearpolyethylenes having very nearly the same number average molecularweight (M^=i 5, 300-1 5,600) , but different weight average molecularweights (M^=99, 000-1 92,000) . In the present case a greater implies agreater proportion of higher molecular weight components.
The fracture behavior of linear polyethylene in uniaxial creep can bedescribed by two distinctly different mechanisms. For relatively largeapplied stresses the polymer creeps until a material instability occursbeyond which yielding, cold drawing, and eventually fracture occur. As
we shall see presently, the amount of cold drawing which occurs prior to
fracture depends strongly on the molecular weight distribution. At muchsmaller applied stresses, or very long failure times, fracture occurs as
a result of crack formation and growth. In this region fracture may oc-cur well before the macroscopic yield point is reached. This region is
not pertinent to the present discussion.
Figure 31 shows a series of isochrones from the sample having the small-est Line a represents for each value of applied stress the time andstrain (plotted as log strain) at which neck formation occurs. Line Y
corresponds to the same two measures at the point of fracture. Since in
this material the specimens all fractured immediately following neckformation, lines a and Y are the same line.
A similar plot is shown in Figure 32 for the polymer having an of160,000. In this case it can be seen that, depending upon the level ofapplied stress, a significant amount of cold drawing can occur and cor-respondingly a substantially greater lifetime. At the optimum stress,this material is capable of elongating as much as 25 times before frac-ture occurs. In Figure 32 the line B represents the strain at which theneck had propagated the entire gage length of the specimen.
By increasing the to 192,000 the diagram shown in Figure 33 is ob-tained. Although similar in shape to Figure 32, two distinct differ-ences appear. Firstly the maximum elongation which can be achieved is
somewhat less (18-20^6), and secondly the breadth of the region in stressin which a significant amount of cold drawing can occur is greater. A
third difference, and one which possibly may be of importance within thecontext of film behavior, is the following. At a given stress level thetime to fracture depends upon M^. For example, at a stress of 20MPa thepolymer having an of 1 60,000 fractured in a time of about one to two

23
hours. By increasing the to 192,000 the time to fracture has been
increased to nearly 10 hours. Therefore a small increase in the propor-
tion of higher molecular weight components can lead to a substantially
longer lifetime. The point to be made here is that the principle dif-
ference in behavior resulting from the small change in occurs in the
region beyond the yield point. Both materials exhibit yield and necking
at approximately the same strain and time under creep.
I . Summary
The following features of five polyethylene films (Categories I-IY and
B1 ) have been examined: molecular weight, molecular weight distribution^
branching, melting behavior, density (crystallinity), surface texture,
birefringence, crystalline orientation, uniaxial deformation in the
machine (M) and in the transverse (T) directions, and the effect of
sample geometry on deformation behavior. In addition, observationsconcerning additive(s) in the films have been obtained, and a
preliminary experiment on biaxial deformation of one of the films has
been performed.
Among the features enumerated above clear differences between the filmswere observed in their molecular weights-molecular weight distributions.
The intrinsic viscosity was highest (1.27 dl/g) for the Cat. Ill and
Cat. II films, lowest for the B1 film (1.13 dl/g), and was between these
extremes in the case of the Cat. I (1.23) and Cat. IV (1.22) films. The
size exclusion chromatograms of all the films showed evidence of a
bimodal distribution with a hint of a third peak. These features are
likely to be the result of a blending of polymers. Comparison of the
normalized chromatograms showed that within the calibration limits of
the separation columns used (M.Wts. 850-4.6x10^) the Cat. Ill filmcontained a larger proportion of high molecular weight species than the
other films and, on a relative basis, had the highest M^, followed in
decreasing order of molecular weight by the Cat. II, Categories I andIV, and B1 films.
In so far as branching is concerned, the methyl group content as
determined by Fourier Transform Infrared Spectroscopy was found to be
the same for all the films, i.e. ^^2.1 methyl groups/100 carbon atoms.The fact that the DSC (Differential Scanning Calorimetry) curves of allthe films exhibited a polymer melting endotherm whose peak was in thenarrow temperature range 1 05.5 °C-1 07°C, and that the crystallinities ofthe films (based on density measurements) were found to be close to oneanother (46. 256-48. 2^) , are consistent with the methyl group contentbeing the same for the various films. The DSC experiments revealed the
presence in all the films of a small quantity of a component which meltsat a much lower temperature than the bulk of the polymer. This low
melting component is most probably additive material . The presence ofadditive was also indicated in FTIR spectra which exhibited extraabsorption bands which are not known bands of polyethylene. The extrabands were however different for the B1 film than for the Cat. I-IVfilms.

2H
The crystalline orientation in the films was probed by taking wide anglex-ray diffraction patterns with the x-ray beam parallel to the T, M and
N (normal to the film) directions. The results indicate that there arequalitative similarities between the preferred orientations of themicrocrystalline regions in the various films. The indications are (1)
that the a-axis tends to be oriented preferentially parallel to the MTplane and preferentially parallel to M in that plane, and that (2) theb-axis tends to be preferentially oriented parallel to the NT plane andpreferentially parallel to N in that plane. Infrared spectroscopic datawere obtained which are consistent with these observations. An ideal-ized working model is suggested in which it is envisaged that crystal-line regions in the films consist mainly of two populations ofmicrocrystals having different preferred orientations (Fig. 25) relativeto T, M and N. This model must remain speculative pending
'quantitative
studies and comparisons of the orientation(s ) and orientation distribu-tions in the films using an automated counter-diffractometer systemequipped with a four circle goniometer sample holder.
When viewed along the N direction the Category I, II, IV and B1 films,as well as virgin Cat. Ill film, exhibited negative birefringence withrespect to M, i.e. n(M)<n(T) . The magnitudes of the birefringencesmeasured for all the films were collectively very small (in therange-[0.0009 to 0.0019 ] and, correspondingly, any differences betweenthe films were also small. This latter observation is consistent withthe similarity in the character of the crystalline orientations in thevarious films suggested by the WAXD and Infrared Spectroscopicexaminations of the films, provided it is assumed that the contributionof the disordered regions to the total birefringence in the MT plane is
the same for all the films.
In the area of mechanical properties it was established that in uniaxialconstant rate of strain experiments the extension to break is dependenton specimen geometry, i.e. on the sample length/breadth ratio. Decreas-ing the length/breadth ratio results in an increase in the extension tobreak at 23°C. A length/breadth ratio of 1.9 was used in the experi-ments which were carried out at 23 °C and -70 °C using a strain rate of991^/min. A summary of the tensile data in Tables 9-15 is given in ta-ble 21 .
Concerning the NSBF criterion that the strain to break should not be
less than 250^5 in either the M or T directions at -70°C, it was foundthat although the average strain to break of each of the five filmsmet that requirement, the Category III film was the only one for whichnone of the measurements fell below 250%.
The Cat. II, III and IV films exhibited higher average extensions tobreak parallel to T than to M at both 23°C and -70°C. In contrast, theaverage strains to break in both directions for the Cat. I film wereessentially the same at 23 °C, furthermore at -70 °C the extension to

25
break was higher in the M direction. The extension to break behavior of
the B1 film in the M relative to the T direction was similar to that of
the Cat. I at 23 °C and to that of the Cat. II, III and IV at -70 °C.
The overall haziness exhibited by all the films is due, in part at any
rate, to the roughness of both their surfaces at which variations in to-
pography occur on a lateral scale of a few pm. Differences in haziness
to the naked eye (under appropriate illumination) were observed in
adjoining regions in some portions of the Cat I, II and IV films. The
boundary between the hazy and less hazy regions was usually roughly par-
allel to M. A brief examination of whether there are differences in
birefringence and/or mechanical behavior between adjoining hazy and less
hazy regions was carried out. In view of the scatter in the relativelyfew measurements which were made, some of the results which might be
interpreted as evidencing differences in birefringence and/or mechanicalproperties between the differently hazy regions in the films must remaintentative at this juncture. The scatter in the measurements is not
unlike the scatter experienced in similar measurements made in regions
of apparently uniform haziness.
J. Concluding Remarks
This exploratory study has resulted in the identification of
similarities and differences between various features of the films.
Close similarities have been found in methyl group content,crystallinity, and peak melting temperature. The preferred orientationsin the crystalline regions (i.e. relative to the M, T, and N directions)appear to be qualitatively similar. However, due to the limited scopeof the orientation studies, the question of whether there are
differences in the orientation distributions of the microcrystalsbetween the films remains open pending the determination and comparisonof the pole figures of each film.
Differences between the films have been revealed in two features, namelybetween their molecular weights, and in the balance of the strain to
break behavior in the M relative to the T directions. These two typesof differences are particularly evident between the Cat. Ill, Cat. I' andB1 films.
Differences in response to tensile deformation in the M relative to theT directions point to underlying built-in differences in fine structuralanisotropies in the films with respect to these directions. One or bothof two possibilities suggest themselves in this connection: (1)
Differences in the distribution of the orientations of themicrocrystalline regions, hence the need for quantitative comparisons ofthe crystalline orientation characteristics of the films: (2)
differences in the nature of and degree of any chain orientation in thedisordered regions which are interspersed between the constituentmicrocrystals in the films. Differences of the latter type [i.e. type(2)] are difficult to determine. In any event determination of thecrystalline orientation characteristics of the films would be a
necessary first step in this latter connection. Added to these various
26
considerations are the differences in molecular weight between the
films, the effects of which remain unclear at this stage. The influencewhich differences in molecular weight can have on the mechanical behav-ior of initially unoriented polyethylene was illustrated in the examplediscussed in Section H(viii). However, in the case of the films inves-tigated in this study, determination of any effects of molecular weightper se on the mechanical properties of the films is complicated by the
fact that the films are not isotropic.
In addition to the determination of the pole figures of the films, it is
recommended that future studies include: (a) An examination of
the biaxial (bubble geometry) deformation characteristics of the filmsat 23 °C and -70 °C. Biaxial deformation experiments address themselvesmore directly than uniaxial ones to the question of the importance ofthe type of imbalance which exists between the mechanical properties in
the M and T directions, (b) As background to developing anunderstanding of the possible intrinsic influence of differences inmolecular weight between the films on their mechanical properties, creepto failure experiments of the type described in Section H(viii) shouldbe carried out on unoriented sheets of polymer from each film. Suchsheets can be prepared by melting and subsequently cooling severalcompacted layers of film.

27
K . References
1. Drott, E.E., and Mendelson, R. A., J. Polymer Sci., Part A-2, _8, 559
(1 973).
2. Wagner, H. L. and McCrackin, F. L. , J. Appl. Polymer Sci., 21 , 2833
(1977).
3. Zimm, B. H. , and Stockmayer, W. H. , J. Chem. Phys. 1
7
, 1301 (1949).
4. Rueda, D. R., Balta’-Calleja, F. J., and Hildalgo, A.,
Spectrochemica Acta 35A, 847 (1979).
5. Bunn, C. W., Trans. Faraday Soc. 39_, 482 (1939).
6. Davis, G. T. , Eby, R. K., J. Appl. Phys. 4274 (1973).
7. Stehling, F. C., Speed, C. S., and Westerman, L., Macromolecules,
U_, 698 (1981 )
.
8. Tabar , R. J., Murray, C. T. , and Stein, R. S., J. Polymer Sci.
Polym. Phys. Ed. 83T (1984).
9. Stein, R. S., and Wilkes, G. L., in Structure and Properties of
Oriented Polymers (I.M. Ward edit.) Chapt. 3» Wiley N.Y. (1975).
10. Mead, W. T., Desper, C. R. and Porter, R. S., J. Polymer Sci.,Polymer Phys. Ed. 17, 859 (1979).
- . .
11. Bunn, C. W., and Daubeny, R. De P.,
(1954).•
Trans
.
Faraday Soc
.
50 . 1173
12. Lindemeyer, P. H.
,
(1 965).
and Lustig, S. , J . Appl . Polymer Sci ., i, 227
13. Maddams, W. F. and(1978).
Preedy, J. E. , J. Appl
.
Polymer Sci
.
22, 2721
14. Maddams, W. F. and(1 978).
Preedy, J. E., J. Appl
.
Polymer Sci
.
22, 2739
15. Maddams, W. F. and(1 978).
PReddy, J. E., J. Appl
.
Polymer Sci
.
22, 2751
16. Alexander, L. E., X-Ray Diffraction Methods in Polymer Science,Wiley, N.Y. (1969).
17. Krimm, S. 'Infrared Spectra of Solids: Dichroism and Polymers’, in
Infrared Spectroscopy and Molecular Structure (Ed. M. Davies)Elsevier, Amsterdam (1963).

28
18. Webb, L. D., Engineering Services Final Report, prepared for NSBF,National Center for Atmospheric Research, Palestine, Texas.Contract #NCAR1-73, Project #TAMRF-921
.
19. Zapas, L. J. , and Crissman, J. M., ACS Symposium Series #95,
Durability Of Macromolecular Materials (R. K. Eby Ed.) 301 (1978).

29
List of Tables
1. Limiting Viscosity Number of Polyethylenes
2. 'Apparent' Molecular Weights (SEC)
3. Comparison of Methyl Group Content of Polyethylene Films from the
Analysis of the Infrared Spectral Region 1 328-1 400cm“^
4. Density of Polyethylene Films at 23.0±0.1°C
5. Differential Scanning Calorimetry of Films
6 . Birefringence of Films
7. Birefringence on Either Side of Boundary between Hazy and Less HazyRegions
8 . Intensity Ratios of -CH2 Rocking Bands
9. Summary of Ultimate Properties for the Category I and II Films at230
10. Tensile Properties of Ballon Films at 23°C.
11. Maximum and Minimum Values of Strain at Break at 23 °C
12. Summary of Yield Stress Data Obtained from Tensile Tests at 23°C
13 . Tensile Properties of Balloon Film at -70°C14. Maximum and Minimum Values of Strain at Break at -70°C15 . Summary of Yield Stress Data obtained from Tensile Tests at ~70°C16. Summary of Tensile Properties of Balloon Film as a Function of
Strain Rate at -70 °C
17 . Summary of Tensile Properties of Category I Film18 . Summary of Tensile Properties of Specimens Cut from both Hazy
and less Hazy Category IV Film at -70°C. (Transverse DirectionOnly).
19. Summary of Tensile Properties at -70°C for Specimens Cut From OneHazy Region of Category II Film. (Transverse Direction Only).
20. Ultimate Properties at 23°C for Specimens 1.87cm wide and a GageLength of 0.20 cm. (Transverse Direction Only).
21. Summary of Tensile Properties at 23°C and -70°C (from Tables10-15)

30
List of Figures
Fig. 1. Normalized Size Exclusion Chromatographs of the Category I andCategory II films (Table 2, Series A).
Fig. 2. Normalized Size Exclusion Chromatographs of the Category I and
Category III films (Table 2, Series A).
Fig. 3. Normalized Size Exclusion Chromatographs of the Category I and
Category IV films (Table 2, Series A).
Fig. 4. Normalized Size Exclusion Chromatographs of the B1 film, and the
raw polymer pellets from which it was produced (Table 2,
Series B).
Fig. 5. Normalized Size Exclusion Chromatographs of the B1 and CategoryI films (Table 2, Series B).
Fig. 6. Normalized Size Exclusion Chromatographs of the B1 and CategoryIII film (Table 2, Series B)
.
Fig. 7. Room temperature Infrared Spectra in the frequency range1 328cm~^ -l400cm“^ , obtained from the five categories of filmafter they had been melted and then cooled to room temperature(see text).
Fig. 8. Difference Spectrum B1 - Category I.
Fig. 9a. DSC heating curve
,
Category I film.
Fig. 9b. DSC heating curve
,
Category I film (expanded vertical scale).
Fig. 9c. DSC cooling curve
,
Category I film.
Fig. 9d. DSC cooling curve
,
Category I (expanded vertical scale) •
Fig. 10a. DSC heating curve
,
Category II film.
Fig. 10b. DSC heating curve
,
Category II film (expanded vertical scale )
.
Fig. 10c. DSC cooling curve
,
Category II film.
Fig. lOd. DSC cooling curve
,
Category II film (expanded vertical scale )
.
Fig. 11a. DSC heating curve
,
Category III film.
Fig. 11b. DSC heating curve
,
Category Ill film (expanded vertical scale )
.
Fig. 11c. DSC cooling curve
,
Category III film.
Fig. lid. DSC cooling curve
,
Category Ill film (expanded vertical scale )
.
Fig. 12a. DSC heating curve
,
Category IV film.

31
Fig.
Fig.
Fig.
Fig.
Fig.
Fig.
Fig.
Fig.
Fig.
Fig.
Fig.
Fig.
Fig.
Fig.
Fig.
Fig.
12b. DSC heating curve
,
Category IV film (expanded vertical scale )
.
12c. DSC cooling curve
,
Category IV film.
12d. DSC cooling curve
,
Category IV film (expanded vertical scale )
.
1 3a . DSC heating curve
,
B1 film.
13b. DSC cooling curve
,
B1 film.
14. Phase Contrast Micrographs of Category I film (#315477).
(a) Actual film, (b) and (c) are replicas of areas on oppositesurfaces
.
15. Phase Contrast Micrographs of Category II film (7#31 3865-53 ) •
(a) Actual film, (b) and (c) are replicas of areas on opposite
surfaces
.
16. Phase Contrast Micrographs of Category III film (#112858-177).
(a) Actual film, (b) and (c) are replicas of areas on opposite
surfaces
.
17. Phase Contrast Micrographs of Category IV film (#311071).
(a) Actual film, (b) and (c) are replicas of areas on oppositesurfaces
.
18. Phase Contrast Micrographs of Category B1 film (#367006).(a) Actual film, (b) and (c) are replicas of areas on oppositesurfaces. Particles marked X are discussed in the text.
19. Scanning Electro Micrograph of one of the surfaces of Category I
(#315420) film.
20. Wide angle x-ray diffraction patterns of Category I film
(#31 5420). (a) x-ray beam parallel to T, (b) x-ray beamparallel to M, (c) x-ray beam parallel to N.
21 . Wide angle x-ray diffraction patterns of Category II film(#313865, Gore 53). (a) x-ray beam parallel to T, (b) x-raybeam parallel to M, (c) x-ray beam parallel to N.
22. Wide angle x-ray diffraction patterns of Category III film(#112877). (a) x-ray beam parallel to T, (b) x-ray beamparallel to M, (c) x-ray beam parallel to N.
23. Wide angle x-ray diffraction patterns of Category IV film(#311071). (a) x-ray beam parallel to T, (b) x-ray beamparallel to M, (c) x-ray beam parallel to N.
24. Wide angle x-ray diffraction patterns of B1 film (#367006).(a) x-ray beam parallel to T, (b) x-ray beam parallel to M,
(c) x-ray beam parallel to N.

32
Fig.
Fig.
Fig.
Fig.
Fig.
Fig.
Fig.
Fig.
Fig.
25. Schematic representation of two idealized microcrystalorientations in a film, (a) The microcrystals are oriented withthe b-axis parallel to N, and the a-axis (and hence the c-axisalso) oriented randomly in the MT plane, (b) the microcrystalsare oriented with the a-axis parallel to M, and the b-axis (and
c-axis) oriented randomly in the NT plane (see text).
26. Polarized Infrared Spectra of films in the region 675cm“1-775cm“^
Dotted lines and full lines correspond to the plane of
polarization parallel and perpendicular to M respectively.(a) Category I, (b) Category II, (c) Category III, (d) CategoryIV, (e) B1 .
27. Creep strain {%) versus time for specimens of balloon film at23°C and an applied stress of 2.5 MPa (364 psi). Solid symbols- transverse direction, open symbols - machine direction;squares - Category I, inverted triangles - Category II, circles- Category III, triangles - Category IV.
28. Creep strain {%) versus time for specimens of balloon film at
23°C and an applied stress of 10 MPa (1450 psi). Solid symbols- transverse direction, open symbols - machine direction;squares - Category I, inverted triangles - Category II, circles- Category III, triangles - Category IV.
29. % strain at break versus yield stress for 64 specimens of
balloon film at -70°C. Strain rate 991^ per minute; circles -
Category I, inverted triangles - Category II, squares - CategoryIII, triangles - Category IV, crosses - Category B1
.
30. An example of biaxially oriented film under inflation.
31 . Failure envelope at 23°C for linear polyethylene with M^ =
15,300 and M^ = 99,000. Log percent elongation versusengineering stress for various isochrones obtained from uniaxialcreep data. Line a corresponds to necking and line T tofracture
.
32. Failure envelope at 23°C for linear polyethylene with M^ =
15,000 and M^ = 160,000. Log percent elongation versusengineering stress for various isochrones obtained from uniaxialcreep data. Line a corresponds to necking line 8 to the fullynecked condition, and Y to fracture.
33. Failure envelope at 23°C for linear polyethylene with M^ =
15,600 and M^ = 192,000. Symbols have the same meaning as inFig. 24.

33
Category
I (Set 13)
II (Set 15)
III (W^I.47-3)
IV (6/3/82)
B1 - film
B1 - pellets
Table 1
LIMITING VISCOSITY NUMBER OF POLYETHYLENES(TRICHLOROBENZENE AT 130 C)
Roll # (Gore)
315420
313865 (53)
112858 (177)
31 1071
367006 Series 03
Limiting Viscosity Number (
1 .23
1 .27
1 .27
1.22
1.13
1.13
) dl/g

mim\
fWM%,MS
VTWfc'^Ky ;,v
iff
y-’fls''.' i
iW” M'WaIv'W
'T^t‘>^'i0r~
W--
ia:y ftenn’-.; snn#.
i9̂ ¥7.m^iv}'-,5\
[T«f
» <4./* '/''
« *1*^!
'.."'I'm' ’€
i>«^.' Mi--„L i .j S'’&
' t Iffi' '•' *. J
pi'jiii
^.vti
iM'W'^ m r-:>vt
m
WnV:!
WifemiMtJi

34
Table 2
Category
'APPARENT' MOLECULAR WEIGHTS (SEC)
Roll (Gore) 'Apparent' Molecular Wt.*Mw Mn
I (Set 13) 315420 216000202000
2230023100
(Series(Series
A)
B)
II (Set 15) 313865(53) 243000 23200 (Series A)
III (W41.47-3) 112858(177) 253000 29000 (Series A)
• 255000 30100 (Series B)
IV (6/3/82) 311071 209000 21700 (Series A)
B1 film 367006 154600 22400 (Series B)
B1 pellets - 147800 21500 (Series B)
*The 'apparent* Mn and Mw values given in this table were derived from the
analysis of the size exclusion chromatograms (Figs. 1-6) using theassumption that the polyethylene chains are linear. Actual Mn and Mwvalues are likely to be higher than those listed here due to the effectsof branching and because material with molecular weight greater than-4.5X10^ is beyond the range of the separation capabilities of the SECcolumns used. Both these limitations are discussed in Section B(ii) ofthe report.

Wili-.'IW , r',^ ^» .M;"^uim^^^ .
'^tii
^ ie^QgfS
^^^Boi4?»ex:'^ oorog
" ^ouss
asiy^Z) POSTSllB
.
Ma.«,.
'•-'V.0^
" / -i*M^
t^U^laa .
-^'
(Et ^•^.1:'9
'J'
, -.S',
(nri«?Bsn tg-T<»,ftJM)-IIIii
rorre
op^sr 'S >ooT»c *T“
fS0\es.d)^: ^fjr''
'
.- - r|(|
jXigB.-
4*C B^^xia<i.f0
;(ofrr*"
noi*i/IfW» •pit imU «l8^ifiii|^)
'^ijwto «ii#l‘t<*^®tXoa «^«W no^lIqaB/ee^:'^
©K?' ^jto'yj^^^bttwx^b i?t»w ^vil^ 9%{^iM^ wH Jiot nMeif# <t** f noi*i/I(

35
Table 3
COMPARISON OF METHYL GROUP CONTENT OF POLYETHYLENT: FILMS
FROM THE ANALYSIS OF THE INFRARED SPECTRAL REGION 1 328-1 ^400 CM“^
Resolved MethylTotal Integrated Band Peak IntensityArea 1 328-1 ilOOcm"'' at 1378cn"''
Category Roll i (Gore) (A)cm“^ (P) Ratio P
I (Set 13) 315^120 5.376 0.15 0.0279
II (Set 15) 313865(53) 6.01 0.165•
0.0275
III (Win.i17-3) 112858(177) 5.65 0.155^ 0.C275
IV (6/3/82) 31 1071 6.11 0.171 0.0230
B1 (Film) 376006 6.38 0.184 0.0238

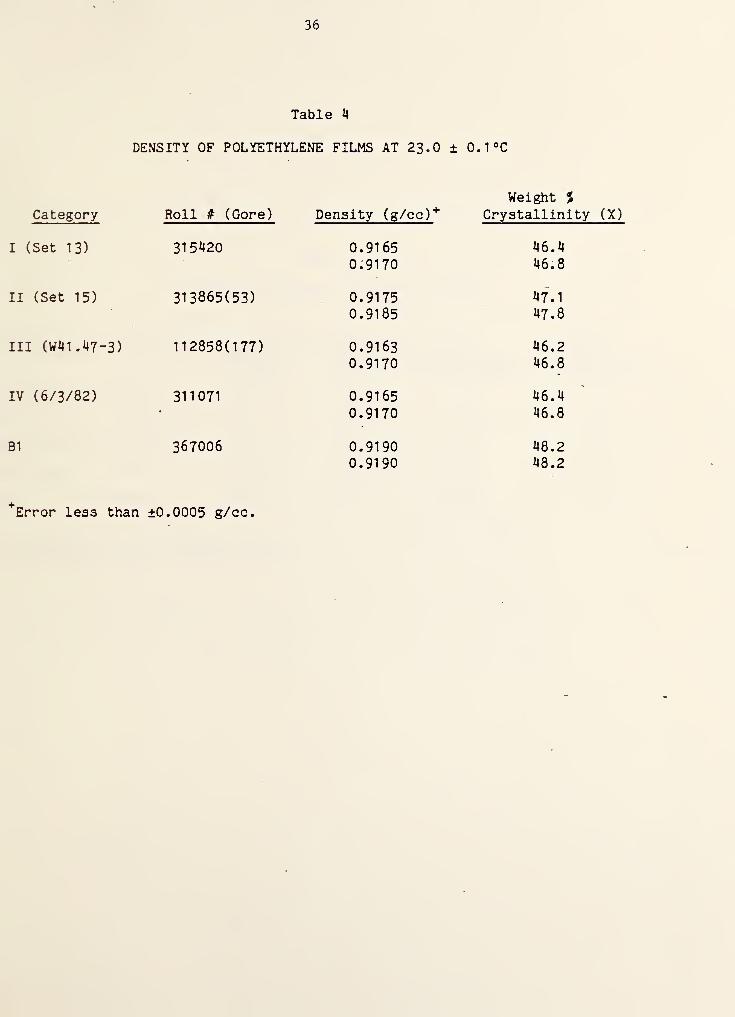
36
Table 4
DENSITY OF POLYETHYLENE FILMS AT 23-0 ± O.T’C
Category Roll # (Gore)
I (Set 13) 315420
II (Set 15) 313865(53)
III (W41.47-3) 112858(177)
IV (6/3/82) 311071
B1 367006
^Error less than ±0.0005 g/cc.
Weight %
Density (g/cc)'*' Crystallinity (X)
0.9165 46.4
0.9170 46.8
0.9175 47.1
0.9185 47.8
0.9163 46.20.9170 46.8
0.9165 46.4
0.9170 46.8
0.9190 48.20.9190 48.2


37
Film Category
I (Set 13)
II (Set 15)
III (Win.H7-3)
IV (6/3/32)
B1
Table 5
DIFFERENTIAL SCANNING CALORIMETRY OF FILMS
Roll if (Gore)
*
Main Melting
**
Main Crystn
*
Low Temp
.
*»
Low Temp.Peak , °C Peak, ®C Melting ?eak,°C Crystn Peak
315420 106.8 94.4 54.4 58.3
3113365(53) 107.1 94.1 51 .6 58.4
122858(177) 106.2 93.0 51 .8 57.2
311071 106.6 93.3 51 .5 56.7
367006 105.5 91.1 47.8 53.6
^^Heating cycle: Rate of heating 20°C/min.»*Cooling Cycle: Rate of cooling -20°C/min.

^1

38
Table 6
BIREFRINGENCE OF FILMS An
Average* An
(Film Thickness) Roll # (Gore) (range)
I (0.7 mil) 315420 -0.0018(-0.0016 to 0.0019)
II (0.8 mil) 313865(53) -0.0015(-0.0013 to -0.0018)
IV (6/3/82) (0.8 mil) 311071 -0.0013(-0.0012 to -0.0015)
B1 (0.8 mil)-
367006 -0.0017(-0.0015 to -0.0019)
III (0.8 mil) 112858(177) n (M) > (T)
See text
III (0.8 mil) 112877 -0.0011(-0.0009 to -0.0012)
*Average of nine measurementsAn = n(M) - n(T) = Y/t is the birefringence in the MT plane.Y = retardationt = nominal thickness of film (I, 0.7 mil = 17780 nm; II, III, IV,
B1 , 0.8 mil = 20320 nm)
Precision in measuring Y « ± 1 nm which for films 0.7-0. 8 mil thickcorresponds to a difference in birefringence of less than ± 0.0001
.

iaaaLi&JIsS
i-
‘‘ <|r0f(-,05.;.#fe^^^^^
Wk^»
(tp^/pfoirft, iaXit)A
(IJ«TvO>ig
'Sf' :
»(iiib^8!o>,:j
“J
'1^*"!“' rTorre
dOOTS?.
i,f.._..,.^^.%-«ig|?*|| js -'
^T) -<: ^ (TTOAeasry
-ffi,"
,," vsiS^’' '''vf
BSI." lyi-^
(s8\E\d):;y;- . . "3 ' -V«»r
B '
(XiJi^8iO)^il
<Xis 8.tt)f IE
f^Si f Ui«’b,o)“ii:
.,,,—— ,
i^nlfl la( 9|BnaY4'; a/ii; aX 4'Kt *'
^ 1X9 B,ty.
5tioXrt^^,’p» uc; f i • f ni,
6 4 t^-3' sEii?95nXi5dTi<< nt s WX R-iaoqrft'ioji'
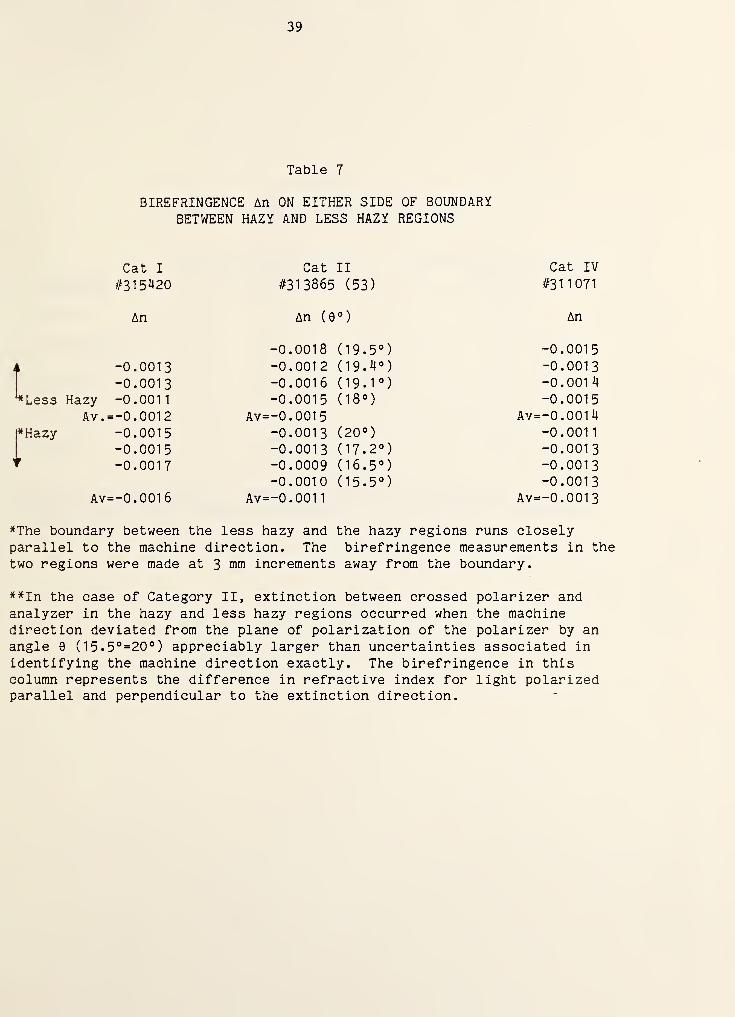
39
Table 7
BIREFRINGENCE An ON EITHER SIDE OF BOUNDARYBETWEEN HAZY AND LESS HAZY REGIONS
Cat I Cat II Cat IV
#315420 #313865 (53) #31 1071
An An (e An
-0.0018 (19. 5<’) -0.001
5
-0.0013 -0.0012 (19.4°) -0.001
3
-0.0013 -0.0016 (19.1°) -0.001
4
Less Hazy -0.001
1
-0.0015 (18°) -0.0015
Av. =-0.0012 Av=-0.0015 Av=-0.0014Hazy -0.0015 -0.001
3
(20°) -0.001
1
-0.0015 -0.0013 (17.2°) -0.0013-0.0017 -0.0009 (16.5°) -0.0013
-0.0010 (15.5°) -0.0013Av=-0.0016 Av=-0.0011 Av=-0.0013
*The boundary between the less hazy and the hazy regions runs closelyparallel to the machine direction. The birefringence measurements in the
two regions were made at 3 mm increments away from the boundary.
**In the case of Category II, extinction between crossed polarizer andanalyzer in the hazy and less hazy regions occurred when the machinedirection deviated from the plane of polarization of the polarizer by an
angle 9 (15.5°=20°) appreciably larger than uncertainties associated in
identifying the machine direction exactly. The birefringence in thiscolumn represents the difference in refractive index for light polarizedparallel and perpendicular to the extinction direction.

rfoOiO^£rOO.<H*».vA - - V. *
$t00,0- UftE“0- ' ’
troo.c^® " r i.
‘i jBLnwn “^tW n»0v^«id yneli^acKj
/cP ..-njo^sni^ «rtd oi. isIlAoeq"
tfdi' «|,
ei0'‘’ni gft-fttUrtar&l’*^
t3si’1k^6^?;‘4flgi^^’«*tp^ 9T(J itar*»*Ki»'f/;_nawj[oi).J

40
Table 8
INTENSITY RATIOS OF -CH2 ROCKING BANDS
Category
*
Parallel/Perpendicular
733 cm"''
*
Perpendicular/Parallel719 cm"''
I #315420 1 .37 1 .38
II #313865(53) 1.49 1 .51
III #112858(177) 1.17 1 .24
IV #311071 1 .60 1 .72
B1 #367006 1 .26 1 .25
^Parallel and perpendicular refer to polarization parallel andperpendicular to the machine direction M or to the extinction directionclosest to M.


41
Table 9
SUMMARY OF ULTIMATE PROPERTIES FOR THECATEGORY I AND II 'FILMS AT 23°C
CategoryStretchingDirection^^^
AverageStrain at
break^^) ^^)
(%) €
StandardDeviation
{%)
Tensile Stressat Break(MPa)
StandardDeviation
(MPa)
1(d) M 286 31 19.2(2800 PSD 1 .0
Kd) T 339 28 21 .5(3120 PSD 1 .9
iKe) M 250 17 18.0(2610 PSD 1 .8
Il(e) T 410 35 18.9(2740 PSD 1 .2
(a) M - Machine Direction, T - Transverse Direction(b) e = 100
(c) average for six specimens(d) Category I (Set 13), Roll #315^20(e) Category II (Set 15), Roll #313865 (Gore 53)


42
Table 10
TENSILE PROPERTIES OF BALLOON FILM AT 23 °C
CategoryRoll
NumberGoreNumber
CuttingDirection^^)
AverageStrain atBreak^^''^)
(%) e
AverageStandard StressDeviation at Break
{%) (MPa)(^)
StandardDeviation
(MPa)
I 315^77 M Jl62 33 25.4 1 .3
I 315^177 -1 H5l1 19 29.0 1 .6
II 313865 53 M 1182 39 22.5 0.7II 313865 53 T 559 27 25.6 1 .4
III 111958 121 M ilil5 50 26.7 1.4
III 111958 121 T 624 27 26.5 1 .3
IV 311071 - M 483 88 22.2 3.0IV 311071 - T 577 75 23.5 2.4
B1 367006 - M 491 40 27.7 1 .8
B1 3167006 T 470 33 34.0 2.8
Strain Rate 991%/min.
(a) M - machine direction, T - transverse direction
.
(b) Averages are for 6 specimens, gage length = 0.60 cm, width = 0.315 cm.(c) E = 100
(d) 1 MPa = I'i5.03 psi.

'^'^Sl'^" ,nVli*i>^ 't^^5y8£i>0' ^ ,
'v-:;. t It^'sr-'oB iloJ*
'T. 'i,'«‘^.r‘ ' ' ^ijrAlUiCife-U ' "‘ I
•' •• VWw • “ ^ J? :J«
JC$KSi52^
W^'t%i^.S^A
5? ,
•,
•s*
"’'
" ^
r".
.' S'* •. .,
’2‘yo '
,^.'
e'.t . .K
S«r4<
1k<fli
SO?Mt
1^90
6fi»'i
alBgHUp
t
MT*^
TT^efC X i^ 3
tmfe XX ^ jeo«|rc
'
< 8?#m II4 -M4e!8f»C jU•Toneftof fe
ww
V-A8»Is .'ja
’.'i
.Hl«\^f?e o?sU ni«n^^<|
.r«.i
• (i£j^rf&i?*i^l(i -« T »Hf..#JMnl& •oirtow --HjC*),!«3>
. 0t '-‘!»% ,6JJi)»lE%i;4» 0 lOl VVk a*l»'l#Vi*((jV
,^\{^t-X) (»0 r - a («)‘j
eo.|t^? • <bM

43
Table 11
MAXIMUM AND MINIMUM VALUES OF STRAIN AT BREAK AT 23 °c
Roll Gore Cutting £ (Max) e(Min)Category Number Number Direction i%) (%)
I 315477 M 498 408I 315477 - T 477 428
II 313865 53 M 516 418
II 313865 53 T 593 521
III 111958 121 M 500 371
III 111958 121 T 655 588
IV 311071 - M 568 325IV 31 1071 — T 671 495
B1 367006 - M 565 457B1 367006 - T 508 415

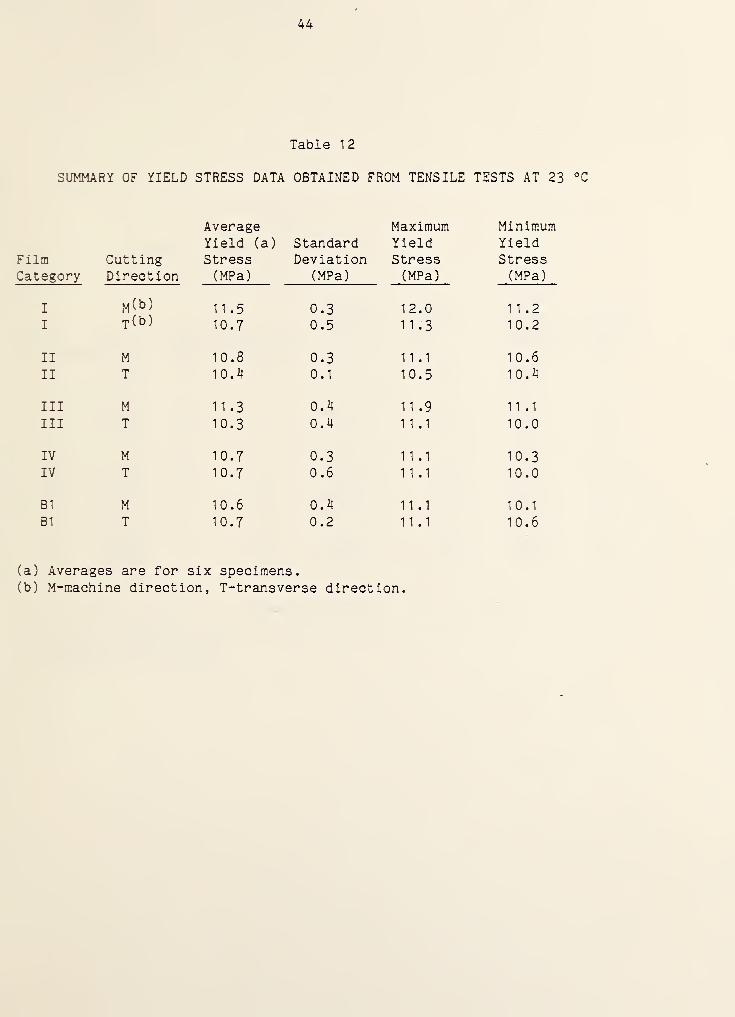
44
Table 12
SUMMARY OF YIELD STRESS DATA OBTAINED FROM TENSILE TESTS AT 23
Average Maximum MinimumYield (a) Standard Yield Yield
Film Cutting Stress Deviation Stress StressCategory Direction (MPa) (MPa) (MPa) (MPa)
I >l(b ) 11.5 0.3 1 2.0 1 1 .2
I 7(b) 10.7 0.5 11.3 10.2
II M 10.8 0.3 11.1 10.6
II T 10.4 0.1 10.5 10.4
III M 11.3 0.4 11.9 1 1 .1
III T 10.3 0.4 11.1 10.0
IV M 10.7 0.3 11.1 10.3IV T 10.7 0.6 11.1 10.0
B1 M 10.6 0.4 11.1 10.1
B1 T 10.7 0.2 11.1 10.6
(a) Averages are for six specimens.(b) M-machine direction, T-transverse direction.


45
Table 13
TENSILE PROPERTIES OF BALLOON FILM AT ~70 °C
CategoryRollNumber
GoreNumber
CuttingDirection^^^
AverageStrain at
Break^^^
(?) £
StandardDeviation(?)
AverageStressat Break(MPa)
StandardDeviation(MPa)
I 315477 _ M 319 (d) 59 60.0 3.4
I 315477 - T 259 (e) 75 56.0 5.3
II 313865 53 M 295 (e) 144 48.4 3.4
II 313865 53 T 3^6 (e) 143 48.7 6.4
III 112861 173 M 327 (d) 44 54.5 4.2
III 11 2861 173 T 434 (e) 135 54.7 3.4
IV 311071 - M 350 (d) 117 47.4 5.1
IV 31 1071 - T 428 (e) 29 53.9 2.1
B1 367006 - M 263 (d) 107 52.0 3.6B1 367006 - T 382 (d) 67 64.0 5.0
Strain rate 991^/min.
(a) M - machine direction, T - transverse direction.(b) E = 100 gage length = 0.60 cm, width = 0.315 cm.(c) 1 MPa - 145.03 psi.
(d) Average for 6 specimens.(e) Average for 8 specimens.

:'U
-i
•‘ -if;.
%*
/"Si;
.
-V'''
M’i1 f<>?l
'V >1
“:.V’ ;i M f'
""4 Vi; Mtk. f'-:<
m. i0^t .
/ ' •' ‘'1.-.5
V t' ( '
i:..:«
;* S*^^'V' .r
£?',
i t
ki; ’if"^1
£^',
„m/icti ’ ,4^r; " m:
'
'irOHf-:3| fUfk ttSfti u»<'!
mSit'• '
'**' '
-tfi
f’TOi tf>
: t&‘'
mvis:, fS
'^- S'i '4t>*J
-Uo ••* - ' ^
“''' ' \-' 'f' M
, icrtwii 1 0**1 * « iw»j(h«i»4 (* )V''"'
'="4:
''<ik.
.; V.. - i
.
'
:. W
V'-VVkII'
'fell"'
.J,lt.. ,1
.
'/' ':viv«
i.
.,' t ^- . ./
#5> A;iif‘'<:-
., . j . -'5t'^ ,
Jte ifo'* »-'m >
m

46
Table 14
MAXIMUM AND MINIMUM VALUES OF STRAIN AT BREAK AT -70 °C
Strain at Strain at
Roll Gore Cutting Break (max) Break (min)
Category Number Number Direction (%) e (%) e
I 315477 - M 41 3 248I 315477 - T 377 110
II 313865 53 M 449 46
II 313865 53 T 462 72
III 112861 173 M 369 255III 112861 173 T 609 258
IV 311071 - M 488 165IV 311071 - T 480 217
B1 367006 - M 426 114B1 367006 - T 470 304


47
Table 15
SUMMARY OF YIELD STRESS DATA OBTAINED FROM TENSILE TESTS AT -70 °C
FilmCategory
CuttingDirection
AverageYieldStress^^^(MPa)
StandardDeviation
(MPa)
MaximumYieldStress(MPa)
MinimumYieldStress(MPa)
(a)
(b)
I ) 57.8 4.0 61 .3 51 .8
I'p(b
)
51 .8 2.4 54.9 49.5
II M 42.9 3.0 48.9 39.4II T 42.2 3.4 48.3 38.4
III M 46.4 2.5 49.5 42.2III T 45.7 4.7 54.6 38.7
IV M 42.9 2.9 46.4 37.8IV T 47.3 4.2 50.5 39.1
B1 M 45.4 3.6 49.5 40.3B1 T 47.9 3.6 51 .8 42.9
Averages are for six or more specimens.M-machine direction, T-transverse direction.

yV-Nt
S»- *^^'y‘f"^''***f^ j jj-y»-'*»- «yi fug -"
^ t'f>ea<»T4je M i
-\
.• -v - i'w-«»'
.. ,v' .;:
.’IK:?' ..-
'C*f
M
,’’^S^ k ?iia
* ^-fe . i » •
’ ^ ,;V^ ^-? -•?*'
^t,"'
'’M ‘ \i 7
jj,,..; :fvs'e^^ H{l!M
e.Vii '#' T

48
Table 1
6
SUMMARY OF TENSILE PROPERTIES OF BALLOON FILMAS A FUNCTION OF STRAIN RATE AT -70 °C
Film Category-
Roll # (Gore)
Rate of
Strain(J/min.
)
CuttingDirection
AverageStrainat Break{%) £
AverageStressat Break(MPa)
1,3154177 9910 M 372 41.4
9910 T 260 44.3991 M 319 60.0991 T 259 56.0
99.1 M 301 39.999.1 T 296 48.1
11.313915 (22) 9910 M 358 42.39910 T 490 58.4991 M 295 48.4991 T 346 48.7
99.1 M 297 48.599.1 T 332 42.3
B1 ,367006 9910 M 363 52.99910 T 328 55.3991 M 263 52.0991 T 382 64.0
99.1 M 303 54.699.1 T 263 56.5
Averages are for three specimens with the exception of the specimenstested at a strain rate of 991 %/min for which the averages are for sixspecimens
.

.«
'mcsm-'.r nxisernt^^omx-r^ '4::^ '"'
"s
m
Kt
f ifj!' '
!
>( •**ft.
KT
OtWV<-;'“'S
(jp r' *' "

49
Table 17
SUMMARY OF TENSILE PROPERTIESOF CAT. I., FILM
RollNumberArea
Temperature(°C)
CuttingDirection
AverageStrain
at
Break($ )
£
AverageStress
atBreak(MPa)
Average:
YieldStress
(MPa)
315477 23 M 462 25.4 11.5
315477 23 T 454 29.0 10.7
315421 (107) 23 M 498 21 .0 9.3315421 (107) 23 T 546 23.1 8.9
315421 (111) 23 M 631 26.5 10.4
315421 (1 1 1 ) 23 T 568 27.5 10.6
315477 -70 M 319 60.0 57.8315477 -70 T 259 56.0 51 .8
315421 (107) -70 M 341 48.5 35.0315421 (107) -70 T 375 51 .5 42.1
315421 (1 1 1 ) -70 M 446 65.1 50.8315421 (111
)
-70 T 453 66.6 48.9
(a) Averages are for 3 specimens except for Roll 31 5477 from which 6
specimens were tested . Strain Rate = 991? per minute
.
-

. A TV?
"IJSl
Lw‘»WiA
Is#’
-. E' m
;'f
pg|%V^'•fe’.
ffi € &le-1=
''®0'
>''a,
'la'
-J!S
ia*) ;® //a'
nHSrff?!
f 'I
-frV;'
T CS' .'Tofirsi^Cf
m?.TS:
.M*" w'<t €5
<trf)-Hsu?ie-?^
't,: ^ '§'iu^,-" - iL 'i
w:m
*^ js*- ,v.
jSS. '.^ •* ' • »'
ei£
s«> '&4.
t,
.'<?
.w; ' s‘
:'
'
m;-" ^ 5 .^of-
'
( nil r sjt 5rg^
mf. 1
1 ^
.aS
M Os.'.
.Wi
'•M
M»

50
Table 18
SUMMARY OF TENSILE PROPERTIES OF SPECIMENS CUT
FROM BOTH HAZY AND LESS HAZY CATEGORY IV FILM*
TRANSVERSE DIRECTION ONLY-70°C
Strainat Stress at Yield
Specimen Break Break StressNumber (56)e (MPa) (MPa)
MH1 8 54.4 54.4MH2 99 46.5 49.4
MH3 74 44.5 52.4MH4 495 53.4 46.4MH5 37 34.6 39.5MH6 74 36.6 35.6MH7 392 43.5 42.5MH8 445 41 .5 39.5MH9 549 47.4 35.6MH10 487 46.5 43.5MH1
1
437 44.5 40.5MH12 388 42.5 41.5MH13 598 57.3 42.5
LH1 417 53.4 52.4LH2 524 51 .9 51 .9
LH3 412 55.4 55.4LH4 565 48.4 39.5LH5 594 49.4 36.6LH6 281 43.5 32.6
Hazy Clear
Average Strain at Break (%) 31 4 466
Average Stress at Break (MPa) 45.6 50.3
Average Yield Stress (MPa) 43.3 44.7
(a) MH = More Hazy , LH = Less Hazy
*Roll 311071

V
m'i' -
W S'i^.tn^ wW
^;=a=3li»4»l?
: & ':
9-
.«4T
i9
’^•'.14 ?;%: ..1, )/,;,i(
^imm ^
a-H
TT|l
4‘r^ ^‘-7'
§4<- tfnJ./'-., ,
.;•• V. -;. ' .'• >' •»
' ,.v#TW‘f ; ,‘
‘'{^1 ../’ "i W.'n
'. ^ ) mH9i '•'« ,.^i feTif;
f»i|f
.• i '>fc ^ ,.
:*4.il!':i':?!,fl*'
'I.- •
'
J * ;KJ *x*»M •tOI • i!M
'i^
rTOfJC'xio^ai

51
Table 19
SUMMARY OF TENSILE PROPERTIES FOR SPECIMENSCUT FROM ONE HAZY REGION OF THE CATEGORY II FILM*
TRANSVERSE DIRECTION ONLY-70°C
Strain
SpecimenNumber
at
Break(?)e
Stress atBreak(MPa)
YieldStress(MPa)
1 280 31 .6 29.6
2 66 31 .6 27.7
3 540 41 .5 29.7
561 40.5 24.7
5 487 39.5 27.7
6 507 42.5 30.6
7 429 31 .6 27.2
8 248 30.6 27.7
Average strain at break = 390?
Average stress at break = 36.2 MPa
Average yield stress = 28.0 MPa
*Roll 313865, Gore 53
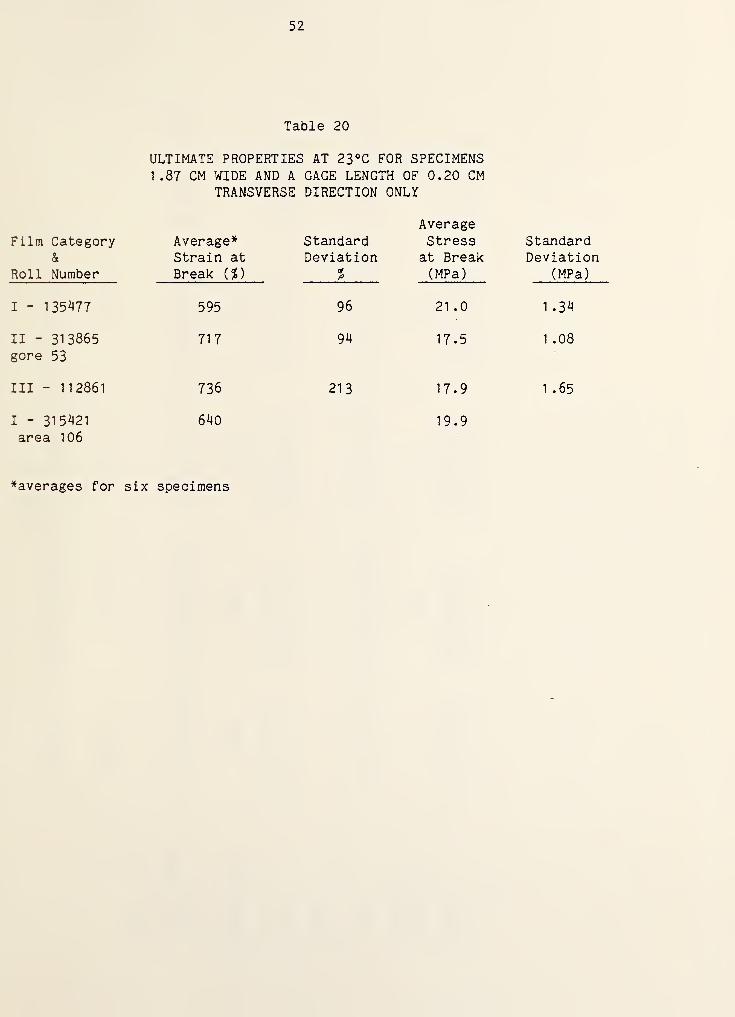
52
Table 20
ULTIMATE PROPERTIES AT 23®C FOR SPECIMENS
1.87 CM WIDE AND A GAGE LENGTH OF 0.20 CMTRANSVERSE DIRECTION ONLY
Film Category&
Roll Number
Average*Strain at
Break (%)
StandardDeviation
%
AverageStress
at Break(MPa)
I - 135477 595 96 21 .0
II - 313865 717 94 17.5gore 53
III - 112861 736 213 17.9
I - 315421 640 19.9area 106
StandardDeviation
(MPa)
1 .34
1 .08
1 .65
^averages for six specimens


SUMMARY
OF
TENSILE
PROPERTIES
AT
23°C
AND
-70°C
(FROM
TABLES
10-15)
53
N >—
s
in CO• • •
, ^ S y . as T-,
—
, in CO •=r in vO o1 1 o vD o 1 1 o o CM 0-1— VO • • n n on o^ • • ar •=r
CO • • t~- =T 1 1• • oj -a- 1 1
o o CM on 0- in O CM in so -=r arf— in <— =r =r o'w' 3- .=r '—^ m
t-- 'w' 'w'• ^ o • • on CM
o o cr» 0- in i>- V£> COr*“ r*“ =r .=r •=r .=r CM on
N
r— ar in• • •
T—
>
T*“* ^ V N so o y-—
S
> t • 00 t— =T in CO o»—
»
I , v£) 0~ 1 1 CO COro T— CM in in so CO T -=r as a- ar
• •1
• • 1 1• • • «
I 1
4-3 o O CM on in in 0- C7^ on in(fl t— ,— CM CM CM CT3 on on 43- in so .-
O N ^ on 33- ^
^
''—
^
r- CMc— ^ ^
^
as on• on c^ • • O CO
o o oo o~ CM t>- in CM<— =T in ar a" on ar
y—
N
y N
ON in VO• y—
s
• •
T~ ^ o> •a- ^—N y—
^
1—
1
t • o in jg- in as as1—
1
I r~ o in 1 1 so o1—
1
^ t— in in VO CM 0- in on MO•
1• •
1 1• • • •
1 1
• V— o vO vD r- CO CO :=r 43“ in 004-5 1 CM CM 00 43“ on m in in infO V y s«y on in Vw' V—
^
CM CMO on m s ^ ^ •' 0- y-—y V y
• • in ar • • >- ar1“ o ar CM VO in CM onT— ar VO 43* •a" on -a-
y—N y^ y S y
m as on• • • •
• 4— o y-^ y y CO COhH r*“ vO on ar ar y--N
1—
1
1 1 T— as 1 t as CMVO 43“ in VO in in ar ar .a- t- ar so
• • • • •1 1
• • • • ar ar4-5 o O CM in CO CM 0> CO CO 00 1 1
cd T— T—
•
CM CM 1
—
T on on ar ar vo CMO 'W' V—
y
ar n y—y y—' ar c^CO swy V y as CM y—y y—^
• • CM <JV • • in soO o CO in CM OO as ar
ar in ar ar CM on
cn on o^y—
N
• • •
CM y—
V
y-—
V
»— .ar y . y .
T— T— CO C^ vo in on 0-1 1 C7V 0- 1 1 T-
1—
I
CM CM ar ar CO in ar on• • ar o 1 1
• •1 i
• T— o • • CO CO T- CT> OO o4-5 r— T— in C73 o CM in ar O vo ar T—ct3 '
—
•w CM CM ar ar —
y
vo in CMO n C^ y-—
y
CO 00 y
• • CM ar • • as aso VO in i-t int— ar •a- in in on CM
S E- s E- s: E-< s: E-^ 2: E- 2: E-
CO 0CO y—
y
0 y—
y
0 0 0 0t, 4-3 CU 4-3 4-3 Qy. 4J4-3 0 S 0 4-3 0 2: 0CO y—
y
CO y—
.
y—
y
0 0 c 0 0 c•o Q- 0 •f-l yiC o o a, 0 •^ -iCo »—
1
s 0 0 0 0 o (—
1 s: 0 0 0 0o 0 y—y S- 0 s- 0 O 0 —' S- 0 t- 0on •pH 4-3 J- 4-3 S- C^ •pH 4-) t. 4-3 t-CM 5h CO co CO in 1 X CO m CO m


54
(sijun 9A!iB|au)(unoiuv
Fig.
1.
Normalized
Size
Exclusion
Chromatographs
of
the
Category
and
Category
II
films.
(Table.
2,
Series
A)


55
IS= 1O 3o
LU S.
T
I—
I
(SllUn 9A!»B|0U)lunoiuv
Fig.
2.
Normalized
Size
Exclusion
Chromatographs
of
the
Category
and
Category
III
films.
(Table
2,
Series
A)


56
(s»iun 9A!iB|ay)
tunouiv
Fig.
3.
Normalized
Size
Exclusion
Chromatographs
of
the
Category
and
Category
IV
films.
(Table
2,
Series
A)

jf.,uur^i».c,>
8T*t:
rir'rfri^
a?
C|»c
£'

Pellets
.
57
0)
Ql
i ^E
LL
OQ
0)
©OCL
•X
i^B
u.
GQ
in
CMrf
a>CO
t
CO >CO
E.?=1o >
(0
.2 3= -
??
)oCO
CM
CM
ac
CMi
00 <o ^o o o• •
CMo
(SHUn SA|i8|9U)tunouiv
Normalized
Size
I-lxcluslon
Chromatographs
of
the
B1
film,
and
the
raw
polymer
pellets
from
which
it
was
produced.
(Table
2,
Series
B)
&
nuiit)vujonui
r 1

58
00
03
oS
I—
I
OB
o
03
(0
O
uo
CV4
o,u) <u -CCO c O)
llo >® ^ (5” =1
.2 Si-
S '“I
IoCO
CN4
CM
CM 00 <0 ^ CMO O O O
(S^un 9A»B|9a)lunoluv
Fig.
5.
Normalized
Size
Exclusion
Chromatographs
of
the
B1
and
Category
I
films.
(Table
2,
Series
B)
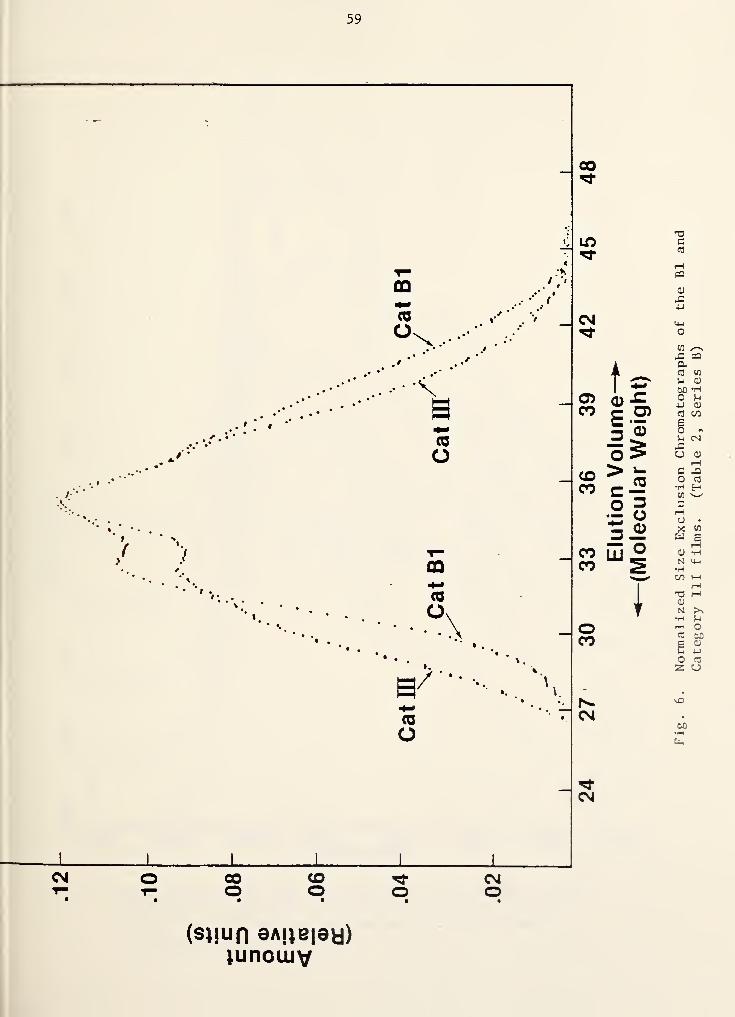
59
00
./••
A
/•
* \
CM 00o COo
GQ
c3
O
SISo
CQ
5^'"
"So
I
o
• .
CMo
(
;K$ »
\ .
uo
CM
oCO
<oCO
COCO
oCO
1^CM
CM
i.'i
-Io ^=1~ o3 ®LU 2
T
(Sliun 9A|»B|9a)}unouiv
Fig.
6.
Normalized
Size
Exclusion
Chromatographs
of
the
B1
and
Category
TIT
films.
(Table
2,
Series
B)


fteSORB.^NCL
60
Fig. 7. Room temperature Infrared Spectra in the frequency range1328 cm ^ - 1400 cm“l, obtained from the five categoriesof film after they had been melted and then cooled to
room temperature (see text)
.

imi> moS"*o eJEx
Um p^pii mLi^ io
liat'1 j*at),
diimw-^iOBj aoon

flBSaRBANCE
.00
.1
61
a(\j
Fig. 8. Difference Spectrum B1 - Category I,

3.03
62
<00N3 3S/1V3W
TEMPERATURE
(C)


0STJ
63
a
<u
53O
toc
aax:
oc/3
Q
Xas
COTHOi
TEMPERATURE
CQ
DSC

3.(]0
64
ca
<0QN3 33S/1V3W
TEMPERATURE
CC)
DSC


NORMALIZED
Cl
CSET
13)
R^y31b420
SCAN:
1C
WT»
1.
08
mg
SCAN
RATE:
-20.00
dag/m
In
65
UCOQ
u
LlI
q:IDl-<ccLUCLZLUH
ON
CO•H
<0QN3 33S/~1V3W
DSC
cooling
curve.
Category
I
film
(expanded
vertical
scale).


NORMALIZED
C2
<SET
15)
Rf^313865
SCAN:
IH
WTi
1.
14
tng
SCAN
RATE:
20.00
d«g/wln
66
<0QN3 33S/1V3W
TEMPERATURE
(C)
s;4*6<a

ei53
67
S3CJ
COc
aCJ
aCOo
o
CO
I
I
!
<0aN333S/1V3W
TEMPERATURE
CO
DSC

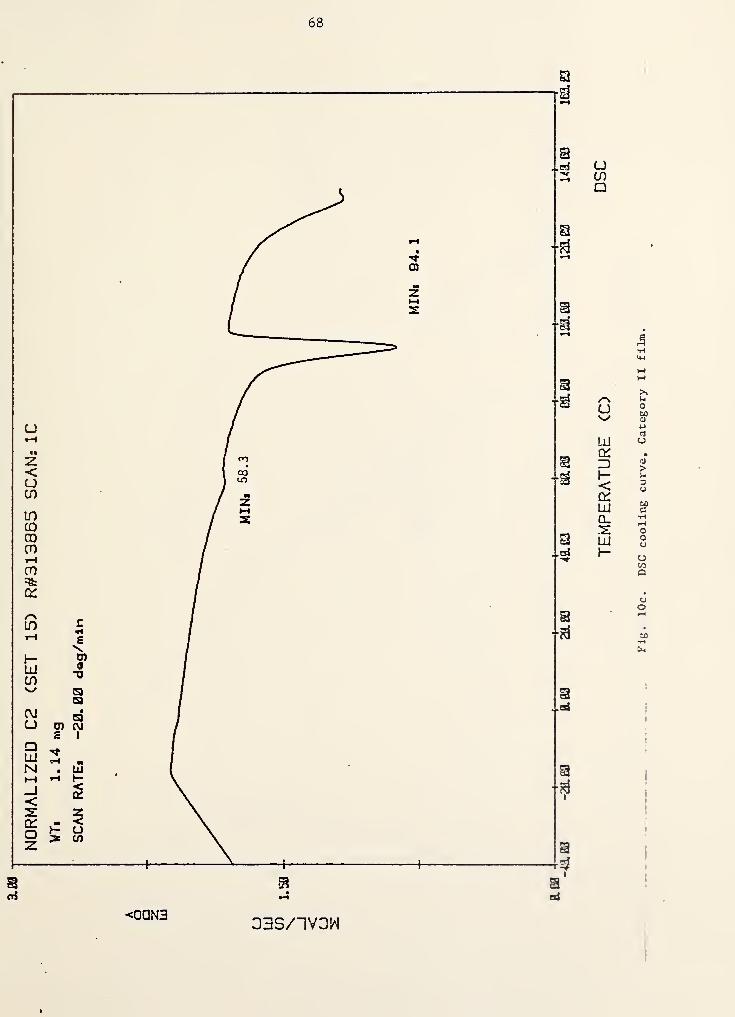
3.03
68
(JCOQ
u
UJq:ZDh-<a:UJQ-.•z
LU1-
Fig.
10c.
DSC
cooling
curve.
Category
II
film.


ESU
69
Ucna
u
LUq:IDH<q;LUCL2LUH-
I
Fig.
lOd.
DSC
cooling
curve.
Category
II
film
(expanded
vertical
scale


ra’E
70
UcnQ
U
LUa:3H<q:LlI
Q.
UJH
<0QN3 33S/Ivaw
Fig.
11a.
DSC
heating
curve.
Category
III
film.


as0
71
<00N333S/“1VGW
0)
>U3U
S’•H
rj
•y
uC/5
a
cc•Hu<
TEMPERATURE
CO
DSC

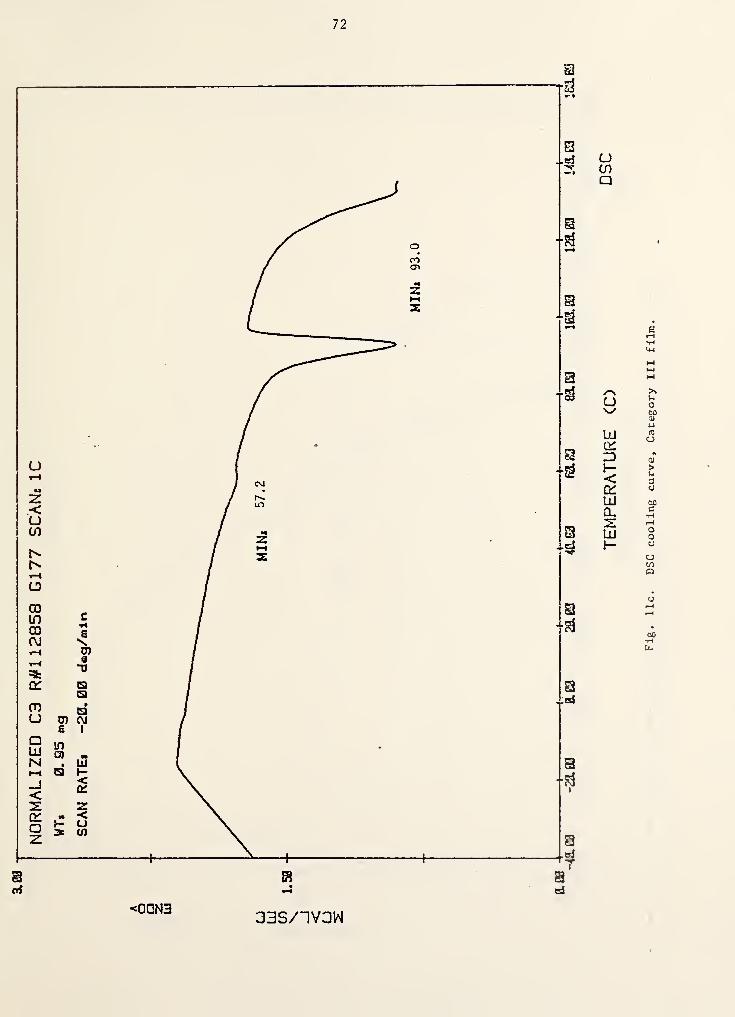
3L83
72
<0QN3 33S/1V3W
TEMPERATURE
CO

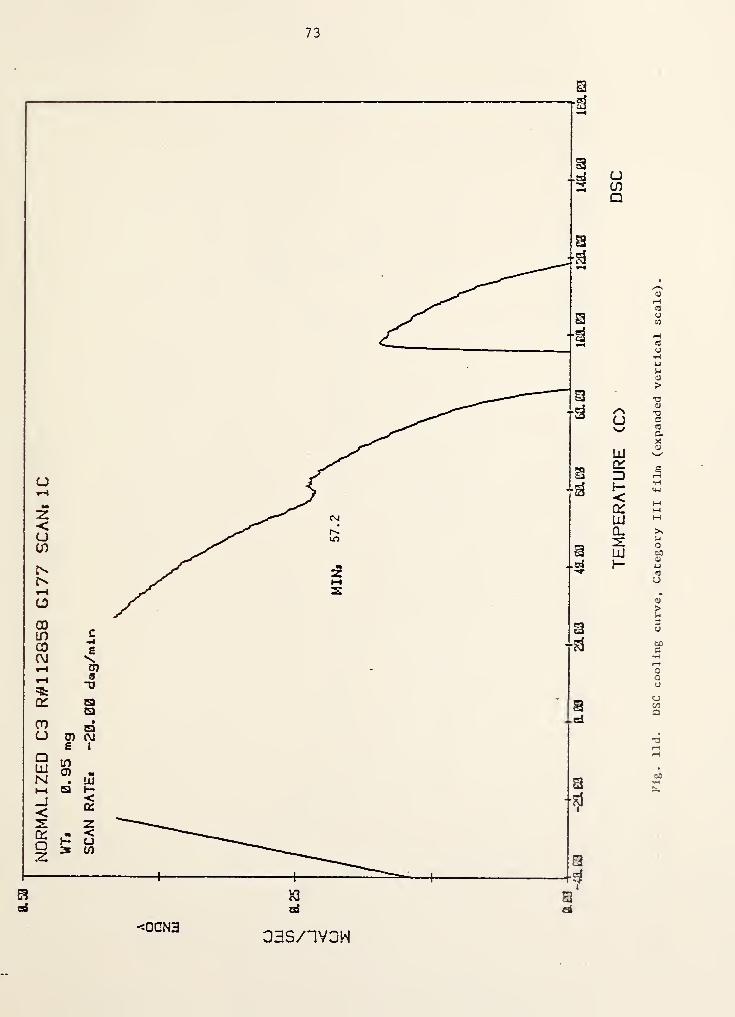
0.5B
73
CJ
o>u
u
COc
oou
CJc/3
o
<0aN333S/1VJW
TEMPERATURE
CC)
DSC


00•£
74
UCOQ
uV-/
uq:3h-<d:lij
Q-
uH-
<OON333S/1VGW
Fig.
12a.
DSC
heating
curve.
Category
IV
film.


0.50
75
csj
<0aN333S/1V3W
TEMPERATURE
CO
DSC


m'z
76
<00N33S/“1V3W
3d
TEMPERATURE
(C)
DSC


0.50
77
<0aN3 G3S/nV3W
TEMPERATURE
CO


78
U(nQ
u
txl
CKZ31—<q:LUO-2UJ
<0aN3G3S/iy3W
Fig.
13a.
DSC
heating
curve,
B1
film.

1
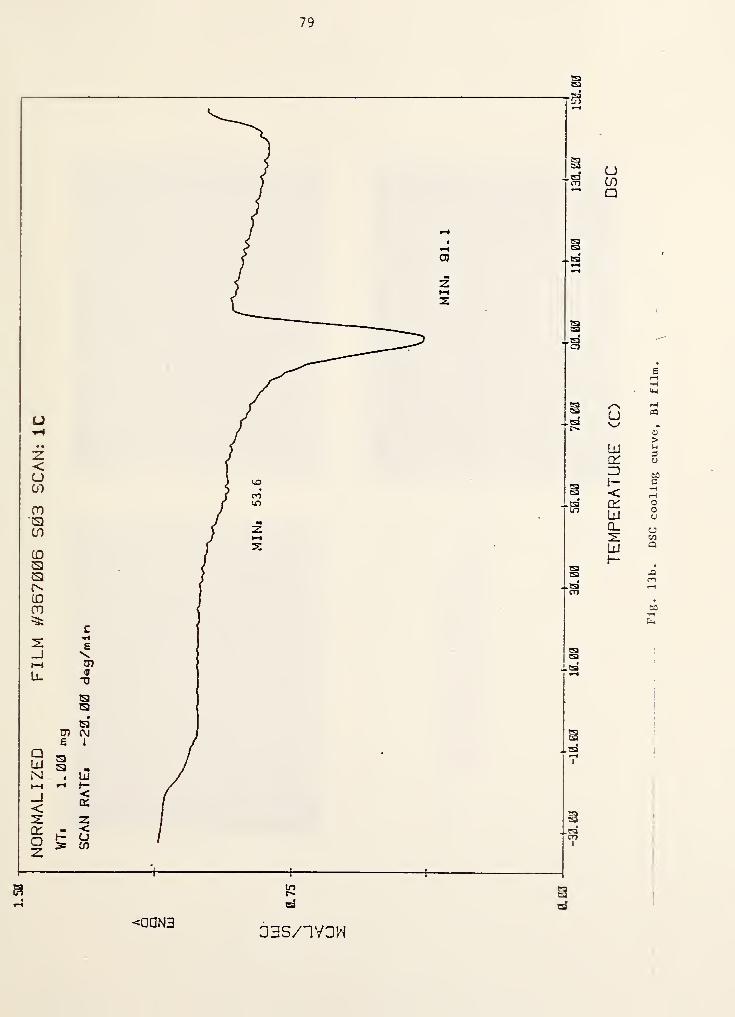
NORMALIZED
FILM
5^367006
S03
SCAN;
1C
V/Tt
1.
00
mg
SCAN
RATEi
-20.00
dag/mln
79
0
<oaN333S/"1V3H
FlC*
13b.
DSC
cooling
curve,
B1
film.


80
0)
n
o
£o
co
o n
ffi n u
’a. Zcc u Wiu < cCCC W EV- c c —u o *--
r>.
V- <r c>*-* in u cc ^ cOf-* «O =tS: ^ o
u o
V.- c v:
‘luH
'OS'

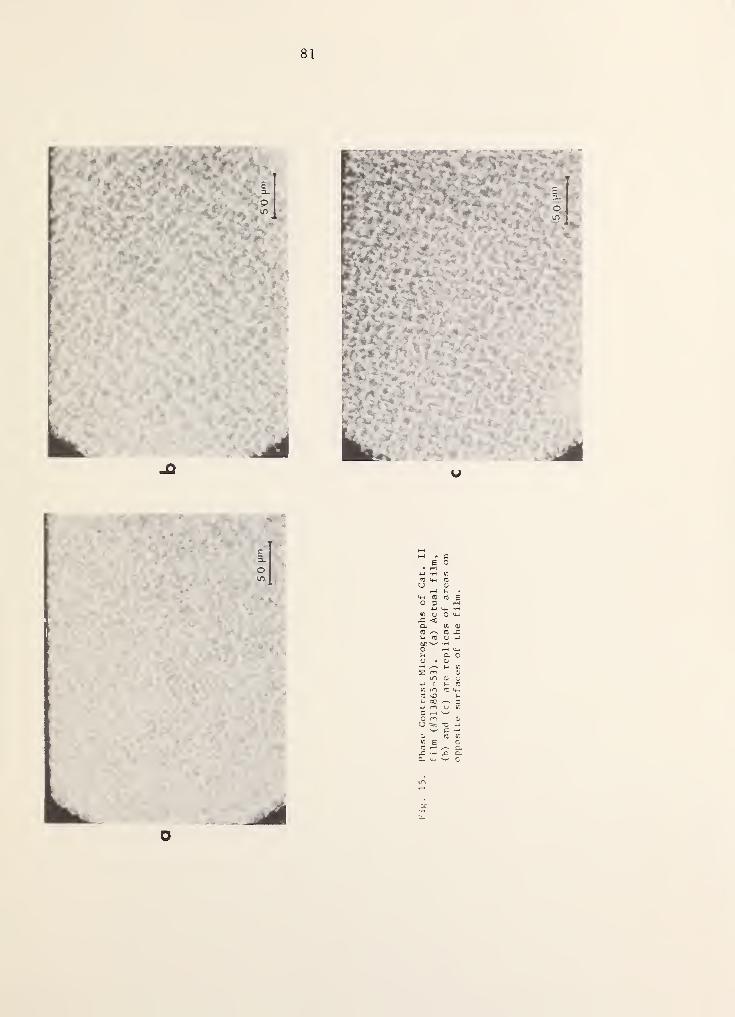
tt:
h
81
- CE O
• fH4-1 *H «fO *4-1 nj
u <u
*>H U •
U-. fo cu eO D f-H
^ *4-1 ‘Hw o o y-i
X <Cl W <U
(T3 ^ r3 J=V4 fg u i-J
J-. c. oU • OJ
•H ^ i- w2: r-1 Om c; cj
•u i ^ rj
w m c u-P3 vX u^ oc Di-* oC ^O OO =te 4-*w c —
•
o r (T,
v: E c^ ^ c.X X c.CL *4- w C
in
cc
o

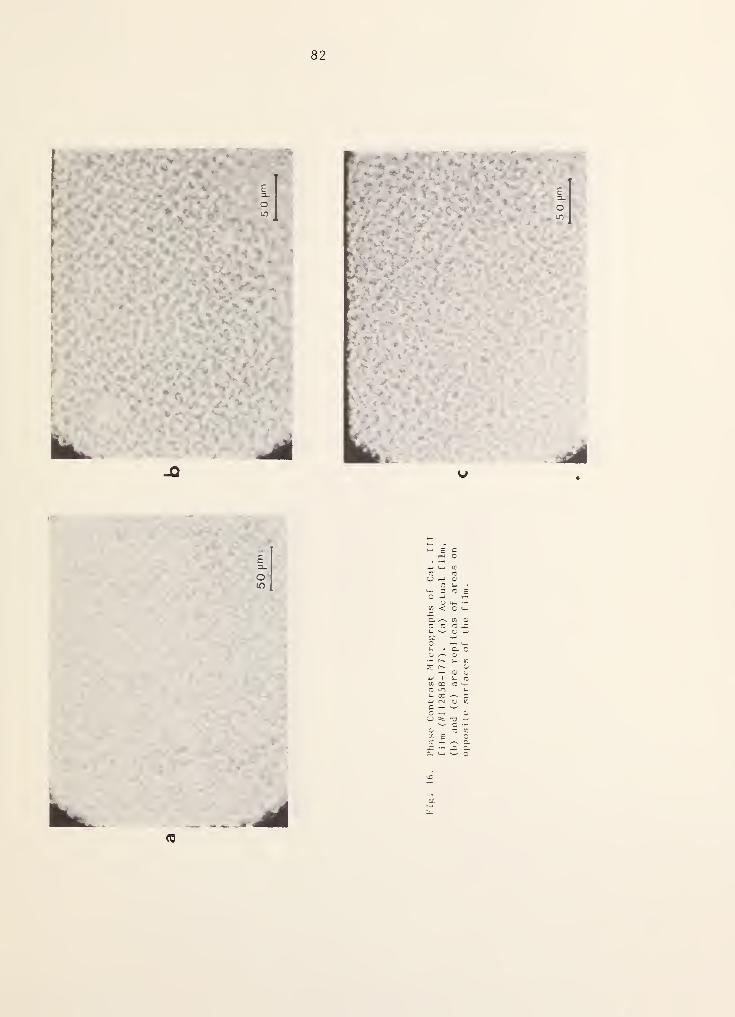
82
(D
50


83
a
film
("311071).
(a)
Actual
film,
(b)
and
(c)
are
replica.*;
of
areas
on
opposite
surfaces
of
the
film.

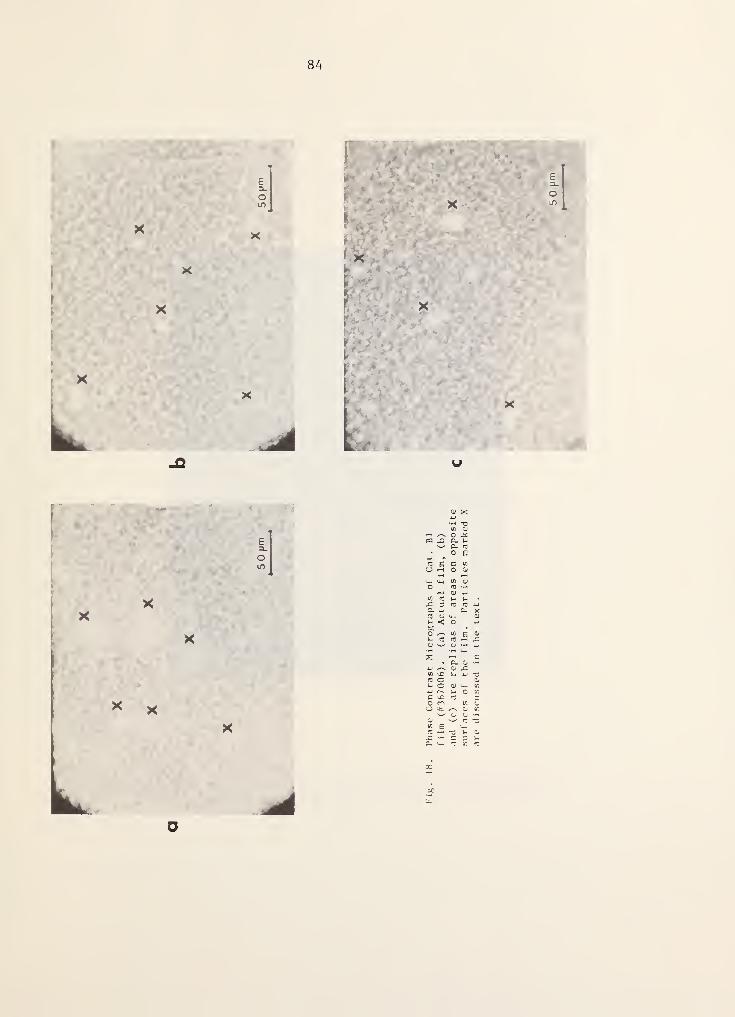
84
CQ XJ D. J-
w nj
JZ 3a. 4^
O W E GJ
^ a 03 ^ X
W kD03 Oi- o
r>- i- O XC nOO <*n
(J =?t ,
o: X r:
>
o


85
Fig. 19. Scanning Electron Micrograph of one of the
surfaces of Category I (#315420) film.


86
ANY
020
i
-<M>-
-<M>-
Fig. 20. Wide angle x-ray diffraction patterns of Categoryfilm (#315420). (a)' X-ray beam parallel to T.
(b) X-ray beam parallel to M. (c) X-ray beamparallel to N.
200


87ANY020
ATY
020
1
-<M>-
Fig. 21. Wide angle x-ray diffraction patterns of Category II
film (//313865, gore 53). (a) X-ray beam parallel to
T. (b) X-ray beam parallel to M. (c) X-ray beamparallel to N.

V
li '‘TTIIlllBiii ’
u ; • ' .' ft',
a
i’fe'S' !' V
'‘w.k'll
'S
-'Si?n
Ui
W>
'
iMm Wm * 'Is
I
:-'^1
m.w-<M>-
im
•y. • . , > .,' pp'l^' S S|. Ui*i
’
i 1 7ilK£7)l
,:W?:'k‘
ilM!,•', 1
|V <i
i>SiT'',
* f'1
•
‘.fV
IjVI ..V M 'f *^'
'
'• I" ' '*3
.
'
' tl
m
MfHB ' :.:[ ,,H' oi i»l]iwq' ,:, >K>'\
MK-<
m¥Wi.’cj:M kii
it 71

88
AT
020
-<M>-
Fig. 22. Wide angle x-ray diffraction patterns of Category IIIfilm (#112877). (a) X-ray beam parallel to T.
(b) X-ray beam parallel to M. (c) X-ray beamparallel to N.

'' .t e3 l^im^ irtil -
'F|fli43*^, tatiad {rf)
M o»
..AW?. .'..' v.'*?\i?fli
ii ' >‘11.4131
kii
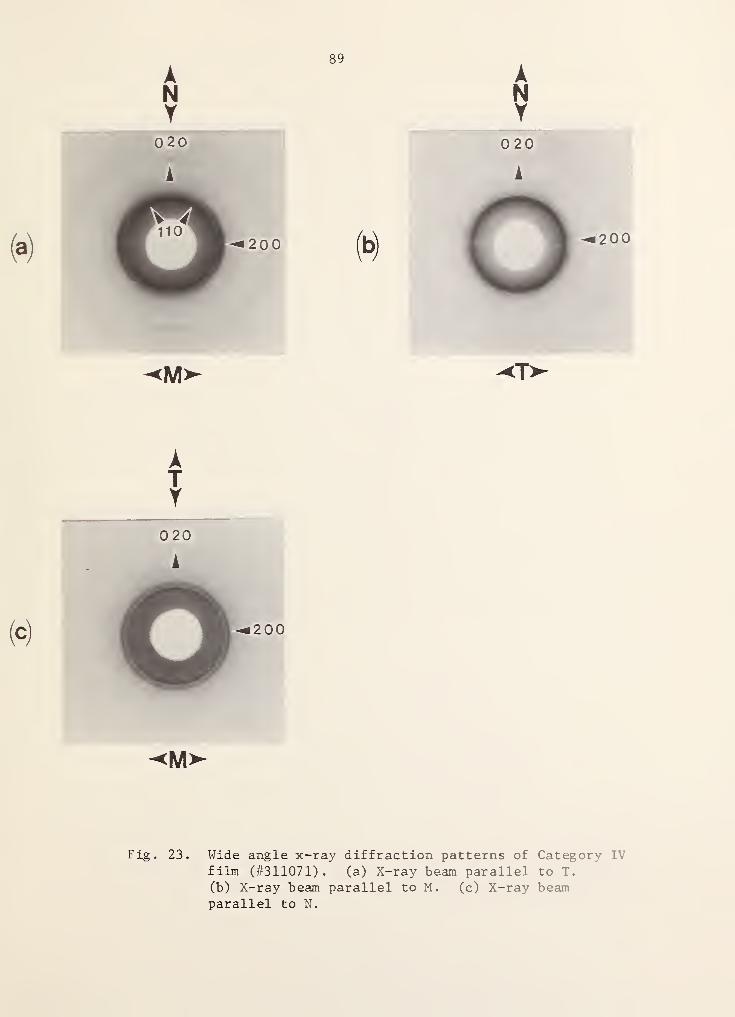
89
-<M>- -<T>-
AT
020
k
-<M>-
Fig. 23. Wide angle x-ray diffraction patterns of Category IV
film (#311071). (a) X-ray beam parallel to T.
(b) X-ray beam parallel to M. (c) X-ray beamparallel to N.

"v-r^
' ry ft
i:-
\%» ^»q, .
. cs^-
-
>'k'
'
'’tv^
i-jft

-<M>-
Fig. 24. Wide angle x-ray diffraction patterns of Bl film
(#367006). (a) X-ray beam parallel to T. (b) X-raybeam parallel to M. (c) X-ray beam parallel to N.


91
b
c
Fig. 25. Schematic representation of two idealized microcrystalorientations in a film. (a) The microcrystals areoriented with the b-axis parallel to N, and the a-axis(and hence the c-axis also) oriented randomly in theMT plane. (b) The microcrystals are oriented with thea-axis parallel to M, and the b-axis (and c-axis)oriented randomly in the NT plane, (see text)

N
4 i «.•
0V« 1«> »«' JigiJts#44 5ri*ii»rii>a
9ia 5(tr ktttJtS A nl
»tl!f Ik04 .a 09 {AXIamq jd7±W ilt:<3uAXlHI
Ad5 ill (o»Xa £issi«9 ecfa *9>o»4 fan#)
•da tfjlw *»• #tff (d) *#ti«X<] TM^•lxir~9 %li0k*4 s4a fao» •?! c3 IaIIataq «1x»hi
(i»i M# ) Tif sda oi hfBSmX^^
-.--4
^ * <'* m mt '
:4i
nr
..HI-
' H U

92
I
cCl
I 3<U
Oi-i CI *n iO
S c ^u u o- -a 5^ ^4J C ^ • Wu m (0 o> (6 OJ M<U r** 01 j; > M •a. sO c ->-1 <H >Vi *H O U •
c 1—
I
o f-* a 4-1
•no -u <-l 01 •
Cl -H - D. CJ J-i
^ CO 0) *13 l-t U3 (QaCJ 4JCego>>—scjU M 4^ o a. U«*4 O D. W ^C OJ Q W s S -3i-t ^ <y o • w
•u ^ i-t O H4
O S U -u MM 93 ? O U r-H
«3 S Ci Jd 3<—* tn c cj
Q *H -H O *HCL, 'i-j r*- I—t G. *n
>«CM
W>V£hLrti)LA3
kAVfN'jnbEhi


93
o
c
E
QJ
2
co
u 4-1
O03
B 34
•H•H 03 034.* •H
1—1 03
c o 3o CO •Ho
a1—1 . 03
03 /—
V
g43 •H
n 1
iw 3-O W
<r 1—
1
IQ vO oc on 430) 'w' BB•H «c wO Pm0) X cD. 03
m in a. o
CNo •>
44 4-1 co o
<D •Hg w 4-1
•H V3 a4-) <u 03
}-l 34
M 4J •H3 u 03(0
}-i T3 03
(U (U U3
> •H 341—1 03
D. >O. (0
03 C03
3 C 34
•H 03 4J
03
T3 1
4-1 CU3 3 CO
1—
t
o- u o0) 0 43(U m !>u CM (0
CM
GO•n
o
(%) NIVaiS d33aD
squares
-
Cat.
I,
inverted
triangles
-
Cat.
II,
Cat.
Ill,
triangles
-
Cat.
IV.


94
o
c
E
LJ
2
I I
(0 CO
iH 0)
o fa
u .fa CO
to e 3cr
£ (0 CO
rH•Hfa •H • M
t—
1
CS O oO w •Ho fatH CJ
tH . CU
CO / fa
Xi •H •H(0
fa fao CU
o 3u •Hc '0- rC0) rH Ue '
—
' 3•H eO CO
QJ fa 1
fa S(0 CO
o rHI—
1
oo 33fa fa G
oOJ CO
G (0
•H (0 3fa (U (U
fa fa(0 fa o3 CO
CO
fa X) 3OJ 0) O> •H •H
rH fa
fa OS'? fa CUV CO fa
fac c 33•H CO
CO <U
fa TD (0
fa 3 fa
10 CO (U
>fa u 10
(U
OJo 3
3fa CO fa
CJ CN fa
00<N
CO•Hfa
(%) NlVdiS d33yD
Cat4
I,
inverted
triangles
-
Cat.
II,
circles
-
Cat.
Ill
triangles
-
Cat.
IV.

oor

o o oCO TT CVJ
O
in
(O
in lOin^/)
LxJ
q:»-
vnO"q
-JllJ
in>
o
inm
>iV3da IV Nivais %
coo «s
fH M1
«3 .
XI 4) (0
3 04.1 CJo to
1 3« 3c n •Ho (U S-i
s 41•H 0a u(U •H MCu a M«) M
<u .
vO 41 41
3 3U 3 0O •H4.1 e 1
w }.! 3(0 OJ 30) CI- 4i
4i 341 S'S 3U r-i c*
<3i uT3 o^I—
1
(U (U M•H 41 M
34i .
U 41
3 C 3U •H CJ
30) 1
> 4)
ca W3
fO
<u . COu 3XJ 0 3
•H4J 0 33 r'-
1
41
c1
T3-.H 41 33 3 4J4i 341 E 3» >
•H 3S'? 4-1 •H
a^CN
CO
Cat.
TV,
crosses
-
Cat.
B1


95
Fig. 30. An example of biaxially oriented film under inflation.


96
COQ-
COCOUJor
CO
C\J
O%N0liV9l\l013
Fig.
31.
Failure
envelope
at
23°C
for
linear
polyethylene
with
=
15,300
and
=
99,000.
Log
percent
elongation
versus
engineering
stress
for
various
isochrones
obtained
from
uniaxial
creep
data.
Line
a
corresponds
to
necking
and
line
to
fracture.


ELONGATION
97
Fig. 32. Failure envelope at 23°C for linear polyethylene with -
15,000 and = 160,000. Log percent elongation versusengineering stress for various isochrones obtained fronuniaxial creep data. Line a corresponds to necking, line 6 tothe fully necked condition, and T to fracture.

,'S7
: ;/
•«rj» ti),
'M 'ifh:
K-e,
itf ->te-
'•a^‘
/tisl.lj 1 m.
<v.*C>.
:^:li w#: tI'M
!LS i"%
D
V .
s I VkfW.'
4»i.i
i.’i. .'ir
0/?'*-^'a
I:?;'!'
.T4...
[;;^
or
,. h{*(u\!?M> 223»T8 -ir ^ , ,
iw-
O
^.,: VS '’:p;u
-.*rwi^ ‘• *1^
•TBliil ,.St .sllS' ^ -4- £_•
:
'-
nm^ ids.V
.f! 3*c^ i$' •qoXttfw
i>oi«>*S3(tOil*f i'WOW<| :'»W' 4000,0d.r -
80^0'1'W' .‘3pT^M;«rtty,ft
«<
II'
ei'-i

ELONGATION
98
10 20 30
STRESS (MPa)
Fig. 33. Failure envelope at 23°C for linear polyethylene with -
15,600 and = 192,000. Symbols have the same meaning as in
Fig. 24.

1
wailtl0(v.),5:e{ * «ir‘
'
'
JO,'’! » nM1
%
t
/»
\
I
\
»
i
)
1
\
\
I

uws.lliA »^ev-
u S Of’T. 0^ COMM. 1. PUBLICATION OR 2. Performing Organ. Report No. 3. Publication Date
PIBLiOGRAPHIC DATAREPORT NO.NBSIR 84-2989 March 1985
SHEET iSee instructions!
. title and subtitle
The Structure and Properties of Polyethylene Films Using in
Heavy Lift Balloons
5. AuTHOR(S) Khoury, J. M. Crissman, B. M. Fanconi, H. L. Wagner, L. H. Bolz,
and C. A. Harding
6. PERFORMING ORGANIZATION (If joint or other than N BS, see instructions) 7. Contract/Grant No.
national bureau of standardsdepartment of commerceWASHINGTON. D.C. 20234
NASA Order 5Q1834D
8. Type of Report & Period Covered
NBSIR - Jan. - May 1984
9. SPONSORING ORGANIZATION NAME AND COMPLETE ADDRESS (Street, City, State, ZIP)
NASA Goddard Space Flight Center, Wallops Flight Center, Wallops Flight Facility,
Balloon Projects Branch, Wallops Island, VA 23337
10.
SUPPLEMENTARY NOTES
I
IDocument describes a computer program; SF-185, FIPS Software Summary, is attached.
11.
ABSTRACT (A 200-word or less factual summary of most si gnificant information. If document includes a si gnificant
bibliography or literature survey, mention it here)
The following features of five polyethylene films used by NASA in the constructionof heavy lift balloons have been examined: molecular weight, molecular weight
distribtuion, branching, melting behavior, density, surface texture, birefringence,
orientation of crystalline regions, uniaxial deformation in the machine and
transverse directions, and the effect of sample geometry and strain rate on
deformation behavior. The goal of this exploratory study was to determine whether
there are significant differences in any of the above mentioned features, or^
combination of features between the films. The acquisition of such information is
a first step towards determining whether there are any specific correlations
between film characteristics and the incidence of catastrophic failure of balloons
during ascent through the troposphere. This exploratory study has resulted in the
identification of similarities and differences between various features of the
films. Close similarities have been found in methyl group content, crystallinity,
and peak melting temperature. The preferred orientations in the crystalline regions
appear to be qualitatively similar or related. Differences among the films have
been revealed in two features, namely between their molecular weights, and in the
balance of the strain to break behavior in the machine direction relative to that
in the transverse direction.
12. KEY WORDS (Six to twelve entries; alphabetical order; capitalize only proper names; and separate key words tv iem.co on»-
Balloon film; branching; mechanical properties; molecular weightj
distribution; morphology; orientation; polyethylenei
13. AVAILABILITY 14. NO. OF I
prin'^e:. k- .
•
Unlimited
I IFor Official Distribution. Do Not Release to NTIS
(Lj] Order From Superintendent of Documents, U.S. Government Printing Office, Washington, D.C.^
20402.
[3] Order From National Technical Information Service (NTIS), Springfield, VA. 22161


Copyright © 2022 FDOKUMEN