The Strength of Biaxially Loaded Beam-Columns in Flexibly ...
468
The Strength of Biaxially Loaded Beam-Columns in Flexibly Connected Steel Frames. Volume I by Craig Gibbons. First volume of a thesis submitted to the Department of Civil and Structural Engineering in partial fulfilment of the requirements for the Degree of: Doctor of Philosophy University of Sheffield December 1990
-
Upload
khangminh22 -
Category
Documents
-
view
2 -
download
0
Transcript of The Strength of Biaxially Loaded Beam-Columns in Flexibly ...

The Strength of Biaxially Loaded
Beam-Columns in Flexibly Connected
Steel Frames.
Volume I
by
Craig Gibbons.
First volume of a thesis submitted to the Department of Civil
and Structural Engineering in partial fulfilment of the
requirements for the Degree of:
Doctor of Philosophy
University of Sheffield
December 1990

The Strength of Biaxially Loaded Beam-Columns
in Flexibly Connected Steel Frames.
Volume I
Please note that due to the physical restriction on the maximum thickness of 'soft bound' theses, the appendices to this volume have been temporarily located at the back of Volume II. Upon completion of the assessment of this work, and the inclusion of any modifications or revisions which may be deemed necessary, all copies of both Volumes I and II will be converted to 'hard bound' binding. The increased volume thickness permitted using this technique will enable these appendices to be located in their correct and proper position - at the back of Volume I. Apologies for any confusion this may have caused.
Craig Gibbons 27/1/91

To Janet
with all my love.
Contents
List of tables. . . . . . . . . . . . . . . . . . . . . . . . . . . . . . . . . . . x
List of figures .• · . . . . . . . . . . . . . . . . . . . . . . . . . . . . . . xiii
Acknowledgements. · . . . . . . . . . . . . . . . . . . • ••••••••••• xxx
Declaration. • • • • · . . . . . . . . . . . . . . . . . . . . . . . . . . . . . . Summary. . . . . . . . . . . . . . . . . . . . . . . . . . . . . . . . . . . . . Notation. . . . . . . . . . . . . . . . . . . . . . . . . . . . . . . . . . . . .
1 Introduction and Background Work.
1.1 Introduction. . . . . . . . . . . . . . . . . . . . . . . . . . . . . . . . . . .
xxxi
xxxii
xxxiii
1.1
1.1
1.2 Historical background. . . . . . . . . . . . . . . . . . . . . . . . . . . . .. 1.3
1.2.1
1.2.2
1.2.3
The pinned-end column. . . . . . . . . . . . . . . . . . . . . . . . . End-restrained columns. . . . . . . . . . . . . . . . . . . . . . . . . Frame tests · . . . . . . . . . . . . . . . . . . . . . . . . . . . . . .
1.4
1.6
1.9
References. · . . . . . . . . . . . . . . . . . . . . . . . . . . . . . . 1.12
2 The subassemblage tests.
2.1 Introd uction. . . . . . . . . . . . . . . . . . . . . . . . . . . . . . . . . . . 2.1
2.1
2.2 Conceptual design of the subassemblage tests specimens • • • • • • • • • • 2.2
2.2.1 Selection of subassemblage members .•••.•.. . . . . . . . . . . 2.2
i
2.2.2 Column base fixity. . . . . . . . . . . . . . . . . . . . . . . . . . . . 2.3
2.2.3
2.2.4
2.2.5
The influence of column length • • • • • • • • . • . • • • • • • • • • 2.5
The influence of beam length. • • • • • • • • • • • • • • • •
The influence ofthe 'column loading stub'. • •••••••
2.3 The series of experimental subassemblage tests .•••.••••••
· . . . . 2.6
2.8
2.9
2.3.1 Fabrication of the subassemblage specimens. • .••.••••••. 2.10
2.3.2 Construction of the subassemblage testing rig. . .••...•••• 2.12
2.3.3 Initial column deformations .••.••.•••......••..... 2.13
2.3.4
2.3.5
2.3.6
Subassemblage erection .•••••.••••
Experimental test set-up. • ••••••••
Sub assemblage test procedure. • •••••
· •... 2.16
• •••• 2.18
· •... 2.19
2.4 Subassemblage test observations and results. • •............•. 2.20
2.4.1 Subassemblage test Sl •.••••••••••.••.••.••••.• 2.20
2.4.2 Sub assemblage tests S2. • •••••••.•..••••.••.. i •• 2.22
2.4.3 Subassemblage test S3 .••.••.•••••••••••••.•.••• 2.23
2.4.4 Subassemblage test S4 .••••••••.••••••.•••.••.•• 2.24
2.4.5 Subassemblage test S5 .•••••••••...•..•..•....•. 2.25
2.4.6 Subassemblage test S6 .•••••.••••••.•.••.••..... 2.26
2.4.7 Subassemblage test S7.. • • • • • • • • • . • • . • . . • . . . ...• 2.27
2.4.8 Subassemblage test S8 .••••••••••••••••••••••..• 2.28
2.4.9 Subassemblage test S9 ..••••••••••••••.•..•••••• 2.29
2.4.10 Subassemblage test SID .•••••••••••••••••••••••• 2.30
2.5 Discussion of results from the experimental sub assemblage tests. • •••• 2.31
2.5.1 Mode of failure .............................. 2.31
ii

2.5.2 Distribution of moments around the sub assemblage. • • 2.32
2.5.3 Connection behaviour .••.•• · •. 2.34
2.5.4 Ultimate column capacity. • • • .2.34
2.5.5 Spread of yield across the column section. · • 2.36
References. .................... . • . 2.36
3 Subassemblage Instrumentation. 3.1
3.1 Introduction ••.•••••.• 3.1
3.2 Displacement measurement. 3.2
3.2.1 An overview of displacement measurement techniques. 3.2
3.2.2 . Principles of three-dimensional measurement. • • . • • 3.5
3.2.3 Construction and testing of a prototype measurement device. • •. 3.11
3.2.4 Development of the prototype for use in the subassemblage tests .. 3.13
3 .. 2.5 Deflection components measured in the sub assemblage tests. • .. 3.14
3.3 Force measurement. •••••••••••••• • . 3.15
3.3.1 Measurement of longitudinal strains. • . . . . . . • .• 3.15
3.3.2 Summation of the individual strain components. · •. 3.16
3.3.3 Derivation of the elastic-plastic stress distribution. • • 3.18
3.3.4 Derivation of the force components. ••••••..•••• • • 3.20
3.3.5 Overall subassemblage force instrumentation. . . •••. 3.22
3.4 Data aquisition .. . . . . . . . . . • •• 3.22
References. ••• . - . . . . . . . . . . • .. 3.23
4 Comparisons of Experimental and Analytically Predicted Subassem-blage Behaviour 4.1
4.1 Introduction. . . . . . . . . . . . . . . . . . . . . . . . . . . . . . • • 4.1
iii

4.2 The finite element analysis program. • ••••••.•••....•
4.2.1 Brief overview of computer program analysis techniques ..
4.3 Modelling of the experimental parameters .•.•.
4.3.1
4.3.2
Yield and residual stress. •••••••••
Initial deformations and geometric properties. • •
4.2
4.3
4.5
4.5
4.6
4.3.3 In-plane connection moment-rotation characteristics. • • . 4.6
4.3.4 Out-of-plane and torsional moment-rotation responses. . . 4.7
4.3.5 Beam to column connection position.. • • 4.8
4.3.6 Column end conditions. • •.••.••.•
4.4 Comparisons of experimental and analytical behaviour .•
4.4.1 Su bassemblage test S 1.. .
4.4.2 Subassemblage test S2 .•.
4.4.3 Subassemblage test S3.. . · . . . . 4.4.4 Subassemblage test S4 .•
4.4.5 Subassemblage test S5 .•. . . . . . 4.4.6 Subassemblage test S6 .•. · . . . . 4.4.1 Subassemblage test 81 .•. · . . . . . . . . . . 4.4.8 Subassemblage test S8 .••••••.•
4.4.9 Subassemblage test S9 and SID ....••.
4.4.10 Investigation of the sensitivity of the predicted behavio~r.
· • 4.11
• • 4.11
· . 4.12
• •. 4.12
· • 4.13
· . 4.14
· .. 4.14
• • 4.15
· • 4.16
.••. 4.17
.•.• 4.17
• •• 4.18
4.5 Conclusions on the comparisons of observed and predicted behaviour. •. 4.19
References. ................................... 4.20
5 The full-seale frame tests.
5.1 Introduction. • .•.•• . . . . . . . . . . . . . . . . . . . . . . . . . iv
5.1
5.1

5.2 General arrangement of the full-scale test frames. . . • •
5.2.1 Frame members and connection type. •.
5.2.2
5.2.3
Frame construction details.
Prevention of column sway.
5.3 Measurement of section properties.
5.4 Method of load application. • •
5.5 Test frame instrumentation.
5.5.1 Deformation measurement.
5.5.2 Force measurement. • •..
5.5.3 Data logging and experimental control. •
5.5.4 Processing of recorded data. • • • • • • • •
5.6 Test frame F1 - test parameters and experimental observations .•
5.6.1 Selection of the loading configuration. •. . • • .
5.6.2 Measurement of initial frame deformations. . ••
5.6.3 Experimental test procedure and observations.
5.7 Frame test F1 - Presentation and discussion of results.
5.7.1
5.7.2
5.7.3
The beam loading phase. ••.
Loading of column C5. • • • • • • . • • • •
Loading of column C6. • • • • . • • • • • .
. . . . . . . . .
5.8 Test frame F2 - test parameters and experimental observations. •
5.8.1 Selection of the loading configuration. • •••••.••
5.8.2 Measurement of initial column deformations. ••
5.8.3 Experimental test procedure and observations. .
5.9 Test Frame F2 - Presentation and discussion of results ..
v
5.2
5.4
5.5
5.5
5.6
5.7
5.8
5.8
5.9
5.9
· . 5.10
· •. 5.11
· .5.11
• .. 5.12
• . 5.12
• •. 5.14
• . 5.15
· •. 5.16
• • 5.18
· • 5.21
• •• 5.22
• •• 5.22
• •. 5.23
· .. 5.24
5.9.1 The beam loading phase. • •••.••••••.•••.••.•••. 5.25
5.9.2 The loading of column CS.
5.9.3 The loading of column C7.
. . . . . . . . . . . . . . . . . · •... 5.26
· •••. 5.27
5.10 Summary of the observed column failure loads. • •••••••••••••• 5.29
5.11 Concluding comments on the full-scale frame tests .•.
References. ..........•.............
6 Connection Moment-rotation Behaviour.
6.1 Introduction .................... .
6.2 The 'isolated' connection tests. . • . • • • • • . •
6.3 The subassemblage tests. • .•.••••.••••
6.4 Frame test Fl. . ................. .
6.5 The behaviour of semi-rigid connections in frames .•.
6.5.1 The influence of column web panel flexibility. •
• •••. 5.31
· ••.. 5.32
6.1
6.1
6.2
6.4
6.6
6.S
6.9
6.5.2 The influence of beam continuity .•••••••••••••...••. 6.10
6.5.3 The validity of isolated connection tests ..•..•...••.•... 6.12
6.5.4 A semi-empirical approach for determining M - 4> response ..••. 6.14
6.6 A summary of observations on connection M - 4> response. • •..•••. 6.18
References. . .................................. 6.19
7 A Parametric Study of Subassemblage Behavio.ur.
7.1 Introduction ........................... .
7.2 Formation of the study. ••••.••••••••.
7.3 Subassemblage configurations .•.•••••••••
7.1
· . . .. 7.1
· • • .. 7.2
· . . .. 7.3
1.4 Loading sequence. •••••.••••••.•••• . . . . . . .. 7.4
vi
7.5 Parameters investigated in the initial phase of the study. • • . • .
7.5.1 Discussion of the result from the first phase of the study.
7.5.2 Conclusions from the first phase of the study. • • • • .
7.6 Parameters investigated in the second phase of the study. ••
7.5
7.6
7.9
• •. 7.10
7.6.1
7.6.2
Discussion of the results from the second phase of the study. ••. 7.12
Conclusions from the second phase of the study.
7.7 Parameters investigated in the third phase of the study.
7.7.1 Discussion of the results from the third phase of the study.
7.7.2 Conclusions from the third phase of the study.
• •• 7.16
• .• 7.17
. • 7.18
• • 7.19
7.8 Concluding remarks on the parametric study. . . 7.20
References. .:................. . . . 7.21
8 The Design of Non-sway Frames with Semi-Rigid Connections. 8.1
8.1 Introduction.............................. 8.1
8.2 The deformation of semi-rigid frames under serviceability loads. • 8.2
8.2.1 Development of the deHection equations.. • . . . • • . . • • . • . . 8.3
8.2.2 Linear simplification of the connection moment-rotation response. 8.7
8.2.3 Validation of the semi-rigid frame deflection equations ..•
8.2.4 Summary of the serviceability design technique. . • • . • •
8.8
• .. 8.12
8.2.5 The potential benefits of predicting reduced deHections. • .•... 8.13
8.3 The ultimate design strength of beam-columns. •
8.3.1 The beam-column problem .••••••••
8.3.2 The development of interaction equations.
8.3.3 The interaction equations in BS 5950: Part 1. • •
vii
..••. 8.14
• • 8.15
· • 8.11
• • 8.20
8.3.4 The application of interaction equations to steel frame design in BS 5950: Part 1. . . • . . . . . . . . . . . . . . . . . . . . . . . . . 8.21
8.3.5 Beam-column design allowing for semi-rigid connection response. • 8.23
8.3.6 The 'variable stiffness' method. • • • • • • • • • • • • • • • • • • • • 8.30
8.3.7 Observations on the application of the BS 5950 simple design method.8.33
8.3.8 The assessment of effective lengths in simple frame design. • • • • • "8.34
8.3.9 The treatment of column disturbing moments in simple frame design.8.37 "
8.4 Conclusions.................................... 8.42
References. ................................... 8.43
9 Proposals for Future Work. 9.1
9.1 Introduction................................... 9.1
9.2 Connection moment-rotation. • • • • • • • • • • • • • • • • • • • • • • • • • 9.1
9.3 The parametric study. . . . . . . . . . . . . . . . . . . . . . . . . . . . . . 9.2
9.4 The full-scale frame tests. • • • • • • • • • • • • • • • • • • • • • • • • • • • 9.3
9.5 The design of semi-rigid frames. • • • • • • • • • • • • • • • • • . • • • • • • 9.4
9.6 Future experimental studies of semi-rigid frame behaviour.. • • • • • • • • 9.5
9.7 The strengthening of existing steel stanchions. • • • • • • • • • • • • • • • • 9.5
9.8 The use of tension control bolts. ••••••••••••••••••••.•• 9.6
References. . . . . . . . . . . . . . . . . . . . . '. . . . . . . . . . 9.7
10 Conclusions. 10.1
10.1 Experimentation techniques .••• " ••••••••••••••••••••••• 10.2
10.2 Connection behaviour. . ............................ 10.4
10.3 Frame and subassemblage response. • •••••••••••••••••••• 10.5
10.4 Frame design ................................... 10.7
viii

Appendix A • Subassemblage fabrication drawings .•
Appendix B • Frame fabrication drawings ..••...
Appendix C· Semi-rigid frame design calculations .••
ix
. .. A.I
B.I
C.I

List of tables.
Table 2.1: Predicted ultimate loads and mid-column deflections for different connection types and column lengths.
Table 2.2: Predicted ultimate loads for different connection types and beam lengths.
Table 2.3: Connection type, subassemblage type and column orientation for each of the ten subassemblage test.
Table 2.4: Initial column deformations and column head load eccentricities.
Table 2.5: Nominal applied beam loads and beam load locations.
Table 2.6: Measurements of column base movement during a re-test of subassemblage 81.
Table 2.7: A summary of ultimate column capacities and squash loads.
Table 4.1: Offsets from the column face to the effective centre of beam support assumed for each model of the sub assemblage tests.
Table 4.2: Comparison of the experimentally observed and analytically predicted ultimate column capacities.
Table 4.3: Analytically predicted ultimate capacities and minor axis moments for supplementary models S2A to S2E.
Table 5.1: Total loads applied to the beams in test Fl.
Table 5.2: Total loads applied to the beams in test F2.
Table 5.3: Summary of the column bending moments at the end of the beam loading phase and the ultimate capacities measured in frame tests F1 and F2.
Table 6.1: Summary of the 'cantilever' connection test series.
x
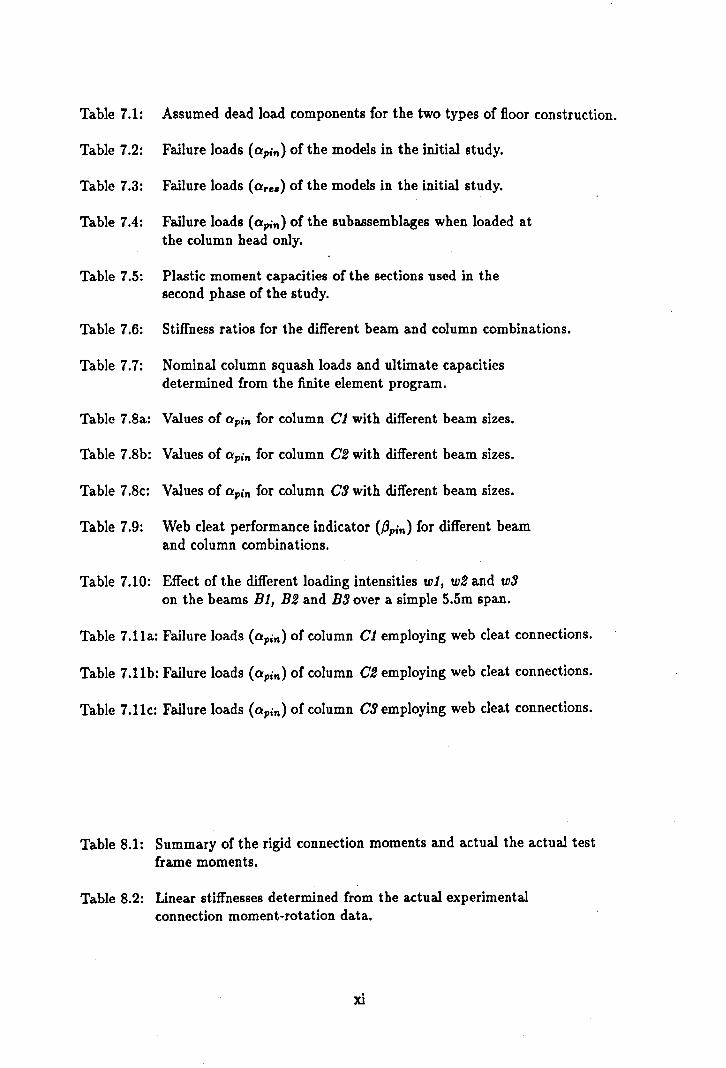
Table 7.1: Assumed dead load components for the two types of floor construction.
Table 7.2: Failure loads (apin) of the models in the initial study.
Table 7.3: Failure loads (are.) of the models in the initial study.
Table 7.4: Failure loads (apin) of the 8ubassemblages when loaded at the column head only.
Table 7.5: Plastic moment capacities of the sections used in the second phase of the study.
Table 7.6: Stiffness ratios for the different beam and column combinations.
Table 7.7: Nominal column squash loads and ultimate capacities determined from the finite element program.
Table 7.8a: Values of apin for column C1 with different beam sizes.
Table 7.8b: Values of apin for column C2 with different beam sizes.
Table 7.8c: Values of apin for column C3 with different beam sizes.
Table 7.9: Web cleat performance indicator (l3pin) for different beam and column combinations.
Table 7.10: Effect of the different loading intensities W1, w2 and w3 on the beams Bt, B2 and B3 over a simple 5.Sm span.
Table 7.11a: Failure loads (apin) of column C1 employing web cleat connections.
Table 7.11b: Failure loads (apin) of column C2 employing web cleat connections.
Table 7.11c: Failure loads (apin) of column C3 employing web cleat connections.
Table 8.1: Summary of the rigid connection moments and actual the actual test frame moments.
Table 8.2: Linear stiffnesses determined from the actual experimental connection moment-rotation data.
xi

Table 8.3: Summary of the calculated semi-rigid moments and p. factors for different linear connection stiffnesses.
Table 8.4: Average p. factors for the four primary beams.
Table 8.5: Comparison of the pinned, rigid, actual and predicted mid-beam deflections.
Table 8.6: Comparison of predicted deflections with actual.
Table 8.7: Comparison of predicted deflections with those of a simple beam span.
Table 8.8: Predicted ultimate loads of the subassemblage tests using the 'simple' design method.
Table 8.9: Predicted ultimate loads of subassemblages in the parametric study using the 'simple' design method.
Table 8.10: Predicted ultimate loads of column segments in frame test Fl using the 'simple' design method.
Table 8.11: Proposed modification to the standard effective length factors in BS 5950.
xii

List of figures
Figure 1.1: Moment-rotation response for a range of 'simple' connection types.
Figure 1.2: Influence of different 'simple' connection types on the strength of columns of different slenderness.
Figure 2.1: Basic analytical model used in the preliminary studies.
Figure 2.2: Plot of column base stiffness against predicted percentage increase in failure load.
Figure 2.3: Subassemblage from within a more extensive structure.
Figure 2.4: Predicted failure loads for analytical models employing different boundary conditions.
Figure 2.5: The 'edge' and 'corner' column subassemblage configurations considered in the experimental study.
Figure 2.6: General arrangement of the three beam subassemblage.
Figure 2.7: General arrangement of the two beam subassemblage.
Figure 2.8: Column base-plate arrangement used in each of the ten tests.
Figure 2.9: Sliding support bearing used at the end of each beam.
Figure 2.10: General arrangement of the sub assemblage testing rig.
Figure 2.11: The subassemblage testing rig with a specimen installed.
Figure 2.12: The sub assemblage testing rig with a. specimen installed.
Figure 2.13: End view of testing rig base arrangement.
Figure 2.14: Elevation of testing rig base arrangement.
Figure 2.15: Method of inducing the required initial column deformations.
Figure 2.16: Different beam to column connection bolt fixing sequences.
xiii
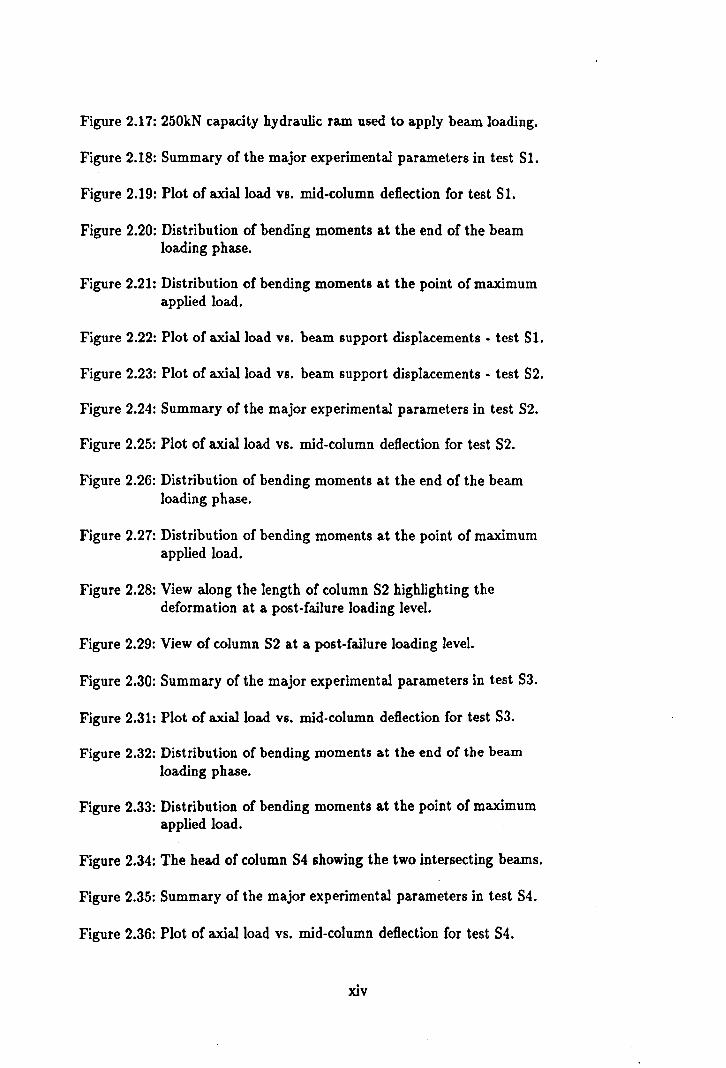
Figure 2.11: 250kN capacity hydraulic ram used to apply beam loading.
Figure 2.18: Summary of the major experimental parameters in test Sl.
Figure 2.19: Plot of axial load vs. mid-column deflection for test Sl.
Figure 2.20: Distribution of bending moments at the end of the beam loading phase.
Figure 2.21: Distribution of bending moments at the point of maximum applied load.
Figure 2.22: Plot of axial load vs. beam support displacements - test Sl.
Figure 2.23: Plot of axial load vs. beam support displacements - test S2.
Figure 2.24: Summary of the major experimental parameters in test S2.
Figure 2.25: Plot of axial load vs. mid-column deflection for test S2.
Figure 2.26: Distribution of bending moments at the end of the beam loading phase.
Figure 2.21: Distribution of bending moments at the point of maximum applied load.
Figure 2.28: View along the length of column S2 highlighting the deformation at a post-failure loading level.
Figure 2.29: View of column S2 at a post-failure loading level.
Figure 2.30: Summary of the major experimental parameters in test S3.
Figure 2.31: Plot of axial load vs. mid-column deflection for test S3.
Figure 2.32: Distribution of bending moments at the end of the beam loading phase.
Figure 2.33: Distribution of bending moments at the point of maximum applied load.
Figure 2.34: The head of column S4 showing the two intersecting beams.
Figure 2.35: Summary of the major experimental parameters in test S4.
Figure 2.36: Plot of axial load vs. mid-column deflection for test S4.
xiv

Figure 2.37: Distribution of bending moments at the end of the beam loading phase.
Figure 2.38: Distribution of bending moments at the point of maximum applied load.
Figure 2.39: A local deformation in the flange of column S5 prior to testing.
Figure 2.40: Summary of the major experimental parameters in test S5.
Figure 2.41: Plot of axial load vs. mid-column deflection for test S5.
Figure 2.42: Distribution of bending moments at the end of the beam loading phase.
Figure 2.43: Distribution of bending moments at the point of maximum applied load.
Figure 2.44: Column S5 at a post-failure level of load illustrating the reverse curve deflected shape of the column.
Figure 2.45: Diagrammatic view of column S5 showing the regions where plasticity of the steel caused the shedding of paint from the member surface.
Figure 2.46: Summary of the major experimental parameters in test S6.
Figure 2.47: Plot of axial load vs. mid-column deflection for test S6.
Figure 2.48: Plot of axial load vs. mid-column twist - test S6.
Figure 2.49: Distribution of bending moments at the end of the beam loading phase.
Figure 2.50: Distribution of bending moments at the point of maximum applied load.
Figure 2.51: Summary of the major experimental pa.rameters in test S7.
Figure 2.52: Plot ofaxialloa.d vs. ~d-column deflection for test S7.
Figure 2.53: Distribution of bending moments at the end of the beam loading phase.
xv
Figure 2.54: Distribution of bending moments at the point of maximum applied load.
Figure 2.55: Summary of the major experimental parameters in test S8.
Figure 2.56: Plot of axial load vs. mid-column deflection for test S8.
Figure 2.57: Distribution of bending moments at the end of the beam loading phase.
Figure 2.58: Distribution of bending moments at the point of maximum applied load.
Figure 2.59: Summary of the major experimental parameters in test S9.
Figure 2.60: Plot of axial load vs. mid-column deflection for test S9.
Figure 2.61: Distribution of bending moments at the end of the beam loading phase.
Figure 2.62: Distribution of bending moments at the point of maximum applied load.
Figure 2.63: Summary of the major experimental parameters in test SID.
Figure 2.64: Plot of axial load vs. mid-column deflection for test SID.
Figure 2.65: Distribution of bending moments at the end of the beam loading phase.
Figure 2.66: Distribution of bending moments at the point of maximum applied load.
Figure 2.67: Column S10 under a post-failure level of loading.
Figure 2.68: Direction of connection rotations at key stages in the sub assemblage loading sequence.
Figure 2.69: The spread of yield across the column section for test numbers S6 and S7.
Figure 3.1: Two dimensional measurement device using three L.V.D.T.'s.
xvi
Figure 3.2: The effect of out-of-plane movement on the measurement of in-plane displacement.
Figure 3.3: Three-dimensional co-ordinates of reference points P1, P2 and P3 from general point A.
Figure 3.4: Location of the three connection points around the specimen.
Figure 3.5: Co-ordinates of the rotation bar connecting reference points A and B.
Figure 3.6: Arrangement of the three-dimensional measurement system.
Figure 3.7: Experimental set-up used for testing a prototype of the 3-dimensional measurement system.
Figure 3.8: Plot of actual vs. measured major axis rotation.
Figure 3.9: Plot of actual vs. measured minor axis rotation.
Figure 3.10: Plot of actual vs. measured twist rotation.
Figure 3.11: Plot of actual vs. measured 'x' displacement.
Figure 3.12: Plot of actual vs. measured 'y' displacement.
Figure 3.13: Plot of actual vs. measured 'z' displacement.
Figure 3.14: Measurement system used at the base of the column.
Figure 3.15: View along the column illustrating the measurement device at the column centre.
Figure 3.16: Schematic diagram of the six L.V.D.~. device used at the column centre.
Figure 3.17: Schematic diagram of the five L.V.D.T. device used at the column head.
Figure 3.18: Location of three-dimensional measurement devices.
Figure 3.19: Deformation components measured in the subassemblage tests.
Figure 3.20: Member actions resulting from longitudinal strains.
Figure 3.21: Arrangement of 10 strain gauges used at the column centre.
xvii
Figure 3.22: Derivation of the 3-D stress distribution from the measured strains.
Figure 3.23: Typical output from the processing program showing the extent of material yield.
Figure 3.24: Plot of applied axial load against axial load measured from the strain gauges.
Figure 3.25: Plot of axial load vs. mid-column minor axis bending moment - test 55.
Figure 3.26: Plot of axial load vs. measured microstrain indicating the degree of correction made to different gauges.
Figure 3.27: Arrangement of four strain gauges used to derive the elastic beam forces.
Figure 3.28: Force components measured in the subassemblage tests.
Figure 4.1: Multi-linear approximation to the M - ¢ response of a web cleat connected to the minor column axis.
Figure 4.2: Multi-linear approximation to the M - ¢ response of a web and seat cleat connected to the major column axis.
Figure 4.3: Components of out-of-plane connection rotation.
Figure 4.4: The effect of beam torsional stiffness on column head restraint.
Figure 4.5: Comparison of the experimentally observed column head minor axis rota.tion and beam twist for a web cleat connection.
Figure 4.6: Comparison of the experimentally observed column head minor axis rotation and beam twist for a web and seat cleat connection.
Figure 4.7: Offset required in the analytical model to simulate column depth.
Figure 4.8: Typical connection showing the effect of 'strut action'.
Figure 4.9: Two similar structures illustrating the effect of permitting support displacement.
xviii
Figure 4.10: Possible shift in the effective centre of beam support for an 'opening' and a 'closing' connection.
Figure 4.11: Experimental and analytical mid-column deflections, S1.
Figure 4.12: Experimental and analytical mid-column twist rotations, S1.
Figure 4.13: Experimental and analytical bending moments at the column head, S1.
Figure 4.14: Experimental and analytical bending moments at the column centre, S1.
Figure 4.15: Experimental and analytical bending moments at the column base, S1.
Figure 4.16: Experimental and analytical mid-column deflections, S2.
Figure 4.17: Experimental and analytical mid-column twist rotations, S2.
Figure 4.18: Experimental and analytical bending moments at the column head, S2.
Figure 4.19: Experimental and analytical bending moments at the column centre, S2.
Figure 4.20: Experimental and analytical bending moments at the column base, S2.
Figure 4.21: Experimental and analytical major axis moments for beam 3, S2.
Figure 4.22: Experimental and analytical mid-column deflections, S3.
Figure 4.23: Experimental and analytical mid-column twist rotations, S3. It.
Figure 4.24: Experimental and analytical bending moments at the column head, S3.
Figure 4.25: Experimental and analytical bending moments at the column centre, S3.
Figure 4.26: Experimental and analytical bending moments at the column base, S3.
Figure 4.27: Experimental and analytical major axis moments for beam 1, S3.
Figure 4.28: Typically M - 4> response for a 'closing - closing' connection and a 'closing - opening' connection.
Figure 4.29: Experimental and analytical mid-column deflections, S4.
Figure 4.30: Experimental and analytical mid-column twist rotations, S4.
Figure 4.31: Experimental and analytical bending moments at the column head, S4.
Figure 4.32: Experimental and analytical bending moments at the column centre, S4.
xix

Figure 4.33: Experimental and analytical bending moments at the column base, S4.
Figure 4.34: Experimental and analytical mid-column deflections, S5.
Figure 4.35: Experimental and analytical mid-column twist rotations, 85.
Figure 4.36: Experimental and analytical bending moments at the column head, 85.
Figure 4.37: Experimental and analytical bending moments at the column 'centre, S5.
Figure 4.38: Experimental and analytical bending moments at the column base, S5.
Figure 4.39: Experimental and analytical mid-column deflections, S6.
Figure 4.40: Experimental and analytical mid-column twist rotations, S6.
Figure 4.41: Experimental and analytical bending moments at the column head, S6.
Figure 4.42: Experimental and analytical bending moments at the column centre, S6.
Figure 4.43: Experimental and analytical bending moments at the column base, S6.
Figure 4.44: Experimental and analytical mid-column deflections, 87.
Figure 4.45: Experimental and analytical mid-column twist rotations, 87.
Figure 4.46: Experimental and analytical bending moments at the column head, S7.
Figure 4.47: Experimental and analytical bending moments at the column centre, S7.
Figure 4.48: Experimental and analytical bending moments at the column base, S7.
Figure 4.49: Experimental and analytical mid-column deflections, S8.
Figure 4.50: Experimental and analytical mid-column twist rotations, S8.
Figure 4.51: Experimental and analytical bending moments at the column head, S8.
Figure 4.52: Experimental and analytical bending moments at the column centre, 88.
Figure 4.53: Experimental and analytical bending moments at the column base, S8.
Figure 4.54: Experimental and analytical mid-column deflections, S9.
Figure 4.55: Experimental and analytical mid-column twist rotations, S9.
xx
Figure 4.56: Experimental and analytical bending moments at the column head, S9.
Figure 4.57: Experimental and analytical bending moments at the column centre, S9.
Figure 4.58: Experimental and analytical bending moments at the column base, S9.
Figure 4.59: Experimental and analytical major axis moments for beam 1, S9.
Figure 4.60: Experimental and analytical mid-column deflections, SID.
Figure 4.61: Experimental and analytical mid-column twist rotations, SID.
Figure 4.62: Experimental and analytical bending moments at the column head, SlO.
Figure 4.63: Experimental and analytical bending moments at the column centre, SID.
Figure 4.64: Experimental and analytical bending moments at the column base, SlO.
Figure 4.65: Experimental and analytical major axis moments for beam 3, SID.
Figure 4.66: Adjustment to the M - 4> response of the connection characteristics in model 2DE.
Figure 5.1: Isometric view indicating the 'active' and 'static' parts of the test frame.
Figure 5.2: General arrangement of test frame FI, (F2 similar).
Figure 5.3: Plan views indicating the different column orientations adopted for frame test Fl and F2.
Figure 5.4: Photograph of test frame Fl prior to testing (active frame at rear).
Figure 5.5: Photograph of test frame F1 prior to testing.
Figure 5.6: Typical plan view of frame indicating the position of restraint bars.
Figure 5.7: Typical 'tie bar' used to prevent column sway.
Figure 5.8: Elevation and section through the frame illustrating the location of the beam loading points.
xxi
Figure 5.9 : View of the hydraulic loading rams housed in the basement beneath the test area.
Figure 5.10: Arrangement used to apply load at the column head.
Figure 5.11: Summary of the various force and deformation components which were measured.
Figure 5.12: System used to monitor beam deflection.
Figure 5.13: Three-dimensional measurement device used to monitor the deformations at the column centre.
Figure 5.14: The 'hanging dumb-bell' rotation measurement device.
Figure 5.15: Location of strain gauges on the column members.
Figure 5.16: Location of strain gauges on the beam members.
Figure 5.11: Schematic diagram showing the experimental set-up.
Figure 5.18: A plot of measured rotation against time for one of the 'hanging dumb-bell' rotation devices.
Figure 5.19: Elevation and section through test frame F1 indicating the member nomenclature.
Figure 5.20: Distribution of rigid frame bending moments resulting from a 'chequer-board' floor load distribution.
Figure 5.21: Initial column deformations for test Fl.
Figure 5.22: Computer generated frame bending moments at the end of the beam loading phase. test frame Fl.
Figure 5.23: Computer generated frame bending moments at the point of maximum load on column C5.
Figure 5.24: Axial load vs. mid-column moments for C5/0-1 and C5/1-2.
Figure 5.25: Applied column head load vs. mid-column moments for C5/0-1 and C5/1-2.
Figure 5.26: Axial load vs. mid-column deflections for C5/0-1 and C5/1-2.
Figure 5.21: Axial load vs. mid-column twist rotation for C5/0-1 and C5/1-2.
xxii
Figure 5.28: Axial load VS. minor aJcis moment at the top, mid-point and bottom of C5/1-2.
Figure 5.29: Axial load VS. major axis moment at the top, mid-point and bottom of C5/1-2.
Figure 5.30: Axial load VS. minor axis moment at the top, mid-point and bottom of C5/0-1.
Figure 5.31: Axial load VS. major axis moment at the top, mid-point and bottom of C5/0-1.
Figure 5.32: Axial load VS. moment at the connection of beam SB2 to column C5/1-2.
Figure 5.33: Axial load vs. moment at the connection of beams PB5 and PB6 to column C5/1-2.
Figure 5.34: Axial load vs. moment at the connection of beams PB7 and PB8 to column C5/0-1.
Figure 5.35: Computer generated frame bending moments at the point of maximum load on column C6.
Figure 5.36: Axial load vs. mid-column moments for columns C6/0-1 and C6/1-2.
Figure 5.37: Axial load VS. mid-column deflections for columns C6/0-1 and C6/1-2.
Figure 5.38: Axial load vs. mid-column twist rotation for columns C6/0-1 and C6/1-2.
Figure 5.39: Axial load vs. minor axis moment at the top, mid-point and bottom of column C6/1-2.
Figure 5.40: Axial load vs. major axis moment at ,the top, mid-point and bottom of C6/1-2.
Figure 5.41: Axial load VS. minor axis moment at the top, mid-point and bottom of column C6/0-1.
Figure 5.42: Axial load vs. major axis moment at the top~ mid-point and bottom of column C6/0-1.
Figure 5.43: Axial load VS. moment at the connection of beams SB3 and SB6 to column C6/1-2.
Figure 5.44: Axial load VS. moment at the connection of beams PB6 and PB8 to column C6/1-2. .
xxiii
Figure 5.45: Elevation and section through test frame F2 indicating the member nomenclature.
Figure 5.46: Initial column deformations for test F2.
Figure 5.47: Observed deformed shape of the minor axis of column CS.
Figure 5.48: Observed deformed shape of the minor axis of column C7.
Figure 5.49: Computer generated frame bending moments at the end of the beam loading phase - test frame F2.
Figure 5.50: Computer generated frame bending moments at the point of maximum load on column CS.
Figure 5.51: Axial load vs. mid-column moments for C8/0-1 and C8/1-2.
Figure 5.52: Axial load vs. mid-column deflections for C8/0-1 and C8/1-2.
Figure 5.53: Applied load vs. mid-column deflections for C8/0-1 and C8/1-2.
Figure 5.54: Axial load vs. mid-column twist rotation for C8/0-1 and C8/1-2.
Figure 5.55: Axial load vs. minor axis moment at the top, mid-point and bottom of C8/1-2.
Figure 5.56: Axial load vs. major axis moment at the top, mid-point and bottom of C8/1-2.
Figure 5.57: Axial load vs. minor axis moment at the top, mid-point and bottom of C8/0-1.
Figure 5.58: Axial load vs. major axis moment at the top, mid-point and bottom of C8/0-1.
Figure 5.59: Axial load vs. moment at the connection of beams SB8 and SHU to column C8/1-2.
Figure 5.60: Axial load vs. moment at the connection of beams PBll and PH12 to column C8/1-2.
Figure 5.61: Computer generated frame bending moments on column C7 at the penultimate increment before the ultimate load was achieved.
Figure 5.62: Axial load vs. mid-column moments for columns C7/0-1 and C7/1-2.
Figure 5.63: Axial load vs. mid-column deflections for columns C7/0-1 and C7/1-2.
xxiv
Figure 5.64: Axial load vs. mid-column twist rotation for columns C7/0-1 and C7/1-2.
Figure 5.65: Axial load vs. minor axis moment at the top, mid-point and bottom of column C7/1-2.
Figure 5.66: Axial load vs. major axis moment at the top, mid-point and bottom of column C7/1-2.
Figure 5.67: Axial load vs. minor axis moment at the top, mid-point and bottom of column C7/0-1.
Figure 5.68: Axial load vs. major axis moment at the top, mid-point and bottom of column C7/0-1.
Figure 6.1: Fabrication details of the connections used in the study.
Figure 6.2: Experimental set-up of the 'cantilever' connection test.
Figure 6.3: Experimental set-up of the 'cruciform' connection test.
Figure 6.4: Moment-rotation response of web cleat connections to the column flange.
Figure 6.5: Moment-rotation response of flange cleat connections to the column web.
Figure 6.6: Moment-rotation response of flange cleat connections to the column flange.
Figure 6.7: Moment-rotation response of web and seat cleat connections to the column flange.
Figure 6.8: Moment-rotation response of web and seat cleat connections to the column web.
Figure 6.9: Moment-rotation response of different connections to the column web illustrating the 'loading-unloading' response.
Figure 6.10 Moment-rotation response of flush end plate connections to the column flange.
Figure 6.11 Moment-rotation response of flush end plat~ connections to the web of a 'corner' column.
xxv
Figure 6.12 Moment-rotation response ('loading-unloading') of flush end plate connections to the web of the 'internal' column.
Figure 6.13 Moment-rotation response ('loading-loading') of flush end plate connections to the web of the 'internal' column.
Figure 6.14 Idealised connection moment-rotation response.
Figure 6.15 Frame test moment-rotation response illustrating the reduced unloading connection stiffness.
Figure 6.16 Deformation of a connection to the web of a 'corner' column.
Figure 6.17 Deformation of a connection to the web of an 'internal' column.
Figure 6.18: Small beams connected to a flexible web panel via stiff connections.
Figure 6.19: Column supporting a pair of beams using the connection shown in figure 6.18.
Figure 6.20: Moment-rotation plots from 'isolated' tests of the connection shown in figure 6.18.
Figure 6.21: Comparison of the unloading stiffness of a frame connection to the 'internal' column resulting from column deformation, and that from a 'corner' column connection when the loading is removed.
Figure 6.22: Internal column with a non-symmetrical arrangement of beams and . connection types.
Figure 6.23: Possible connection test arrangement which would permit connection rotations resulting from column deformation.
Figure 6.24: The individual stiffness components of a beam connection on one side of a column.
Figure 6.25: The individual stiffness components of connections to both sides of a column.
Figure 7.1: Arrangement of the subframe and subframe model used in the study.
Figure 7.2: Assumed pattern of column residual stresses.
xxvi

Figure 7.3: Moment-rotation characteristics assumed for the nominal web cleat connection.
Figure 7.4: Assumed distribution of beam loading for one-way and twoway spanning types of floor construction.
Figure 7.5: Arrangement of floor loading for load cases 1 to 9.
Figure 7.6: Load vs. mid-column deflection plot for the four beam sub assemblage when loaded at the column head only.
Figure 7.7: Load vs. mid-column minor axis deflection for load cases 1,2,3 and 6 and loading arrangement At.
Figure 7.8: Plot of the top and mid-column minor axis bending moments for load case 6A with beam Bl and a rigid connection.
Figure 7.9: Minor axis bending moments at the point of failure for load case 6A with beam Bl and a rigid connection.
Figure 7.10: Plot of load vs. minor column axis displacement for a pinned end column illustrating the adverse effect of the P-6 effect on initial disturbing moments.
Figure 7.11: Plot of failure load (apin) vs. beam stiffness for load intensity wl.
Figure 7.12: Plot offailure load (apin) vs. beam stiffness for load intensity w2.
Figure 7.13: Plot of failure load (apin) vs. beam load intensity for a type B3 beam.
Figure 7.14: Plot of failure load (a"in) vs. beam load intensity for a type B2 beam.
Figure 8.1: Comparison of the mid-span deflections for a beams with simple supports and fully rigid supports.
Figure 8.2: General equation for the rotation at the supports of beam flexibly connected beam.
Figure 8.3: Beam and column subframe with semi-rigid beam to column connections.
Figure 8.4: Plot of equation 8.4, the frame line, and a typical non-linear connection moment- rotation response.
xxvii
Figure 8.5: Plot illustrating the overestimation of the semi-rigid moment for a given rotation when using the linear initial tangent stiffness.
Figure 8.6: Plot showing the 'frame line', non-linear connection momentrotation response and the initial tangent stiffness approximation.
Figure 8.7: The different forms of linear secant stiffness considered in the study.
Figure 8.8 : Derivation of the modified initial tangent stiffness, C/co'
Figure 8.9 : Arrangement of test frame Fl illustrating the serviceability loadings.
Figure 8.10: Plot of permissible beam spans against applied load illustrating the zones where deflection considerations dominate the design.
Figure 8.11: The three cases for the design of open section beam-columns.
Figure 8.12: Three-dimensional interaction diagram.
Figure 8.13: The amplification of the maximum moment due to the deformation of slender columns.
Figure 8.14: Comparison of equation 8.20 with numerical studies.
Figure 8.15: Buckled shape of an internal column showing the direction of connection rotation.
Figure 8.16: Buckled shape of an external column showing the direction of connection rotation.
Figure 8.17: Moment-rotation response of the two connections at the same level but on either side of an internal column.
Figure 8.18: Comparison of column moments assumed in simple design and those at the point of collapse.
Figure 8.19: Effect of column head moment reversal on the maximum span moments of an end bay beam.
Figure 8.20: Deformed shape of an edge column when the column head moment reverses . to zero.
xxviii
Figure 9.1: Possible method of increasing the restraint to the head of an existing column.
Figure 9.2: Installation of a tension control bolt (T.e.B.).
Figure A.1: Subassemblage fabrication drawing 70688/20.
Figure A.2: Sub assemblage fabrication drawing 70688/22.
Figure A.3: Fabrication of pulley mechanisms used in the subassemblage tests.
Figure A.4: Fabrication of beam supports used in the subassemblage tests.
Figure B.1: Test frame fabrication drawing 70688/Fl
Figure B.2: Test frame fabrication drawing 70688/F2
Figure B.3: Test frame fabrication drawing 70688/F3A
Figure B.4: Test frame fabrication drawing 70688/F4A
Figure D.5: Test frame fabrication drawing 70688/F6A
Figure B.6: Test frame fabrication drawing 70688/F7B
Figure B. 7: Test frame fabrication drawing 70688/F8A
xxix

Acknowledgements
The work described in this volume was part of an experimental study into the behaviour
of semi-rigid steel frames with semi-rigid connections. The work was principally con-
ducted in the Civil and Structural Engineering Department at the University of Sheffield
over the period October 1987 to December 1990.
The success of the project is a measure of the high calibre, commitment and enthusiasm
of those who monitored and assisted me in the execution of the work. I would like to
thank my supervisors, Prof. David Nethercot and Dr. Pat Kirby, for their guidance and
support throughout the project, and also the technical staff in the Department for their
practical advice and assistance. Of particular note is my appreciation to Mr. John Surr
who was employed as the project technician. The large scale experimental tests were
performed at the Building Research Establishment (B.R.E.), near Watford. I would like
to thank the staff at B.R.E., notably Dr. David Moore, Mr. David White and Mr.
Derick Jenkins, for their co-operation and technical expertise.
Financial support of the project was provided by the Science and Engineering Research
Council (S.E.R.C.) and the Building Research Establishment. All the structural steel
sections used in the project were donated by British Steel. I am of course grateful to
these bodies, without whom this project would not have been possible.
a I would like thank Dr. Y.C. Wang for the use of a sophistited finite element computer
program which he developed at the University of Sheffield.' The predictions of this
analytical tool figure prominantly in this thesis. I would also like to thank Dr. M.
Celikag who conducted a series of isolated connection tests against which the connection
responses observed by the author in the subassemblage and frame tests was subsequently
compared.
Finally, a special thank you goes to all the staff and students in the Department of Civil
xxx
and Structural Engineering whose friendship and support have made my stay at the
University a thoroughly enjoyable and rewarding experience. Of particular note is my
appreciation to Jeff Peters and Kath Steer for providing my wife and I with a roof over
our heads whilst I was preparing the final sections of this thesis.
Declaration
Except where specific reference has been made to the work of others, this thesis is the
result of my own work. No part of this thesis has been submitted to any University or
other educational establishment for a Degree, Diploma or other qualification.
Chapter 7 of this thesis reports the findings of a detailed parametric study which was
undertaken to investigate the behaviour of steel column subassemblages. Dr. V.C.
Wang, who developed the analytical tool which was used, kindly assisted in the numerical
modelling of the various subassemblages which were studied. However, the concept and
planning of the study, the seletion of the appropriate subbasemblage models and the
complete appraisal of the results is solely the work of the author. The co-operation of
Dr. Wang on this aspect of the work is greatly appreciated.
~.
Craig Gibbons
xxxi

Summary
This thesis describes the experimental appraisal of a series of 10 'non-sway' steel column
subassemblages, each comprising a 6m long column with up to three 1.5m long beams,
together with two full-scale 3 storey, 2 bay, single span, non-sway steel frames (typical
overall dimensions 9m x 10m x 3.5m). The subassemblages tests were conducted in the
Department of Civil and Structural Engineering at the University of Sheffield whilst the
much larger frame tests were carried out at the Building Research Establishment. In
all cases, the beam and column elements were connected using 'simple' bolted steelwork
connections. The aim was to investigate the effect of the inherent rotational stiffness
(semi-rigid characteristics) ofsuch connections on the behaviour of steel frames in which
the columns were loaded biaxially and were not restricted to in-plane deformation. The
appraisal of the results from these experiments clearly shows that the stiffness of even the
most modest connection can have a significant influence on the distribution of bending
moments, the ultimate column capacity and deflection of frame members.
The experimental data were subsequently used to validate the predictions of a sophis
ticated finite-element computer program which was developed specifically to analyse
3-dimensional column subassemblages employing semi-rigid connections. This thesis doc
uments this validation and reports the findings of an extensive parametric study which
was then conducted to investigate the influence of semi-rigid connection behaviour on a
wide range of subassemblage configurations.
Comparisons with the experimentally observed and analytically predicted ultimate ca
pacities of the subassemblage and frame tests showed that 'commonly used' methods
of frame design are unduly conservative. The author has therefore proposed a number
of design approaches for both ultimate and serviceability limit state loading conditions
which take into account the inherent benfits of semi-rigid joint action.
xxxii

Notation.
This section summarises the general notations which have' been adopted throughout this thesis. Symbols which have been used once only and which are of a more specific nature have been explained at the appropriate place in the text.
A Cross-sectional area.
B Warping bi-moment.
C Connection stiffness.
C* Effective connection stiffness.
Ct Initial tangent connection stiffness.
Cko Initial tangent connection stiffness modified according to the ultimate moment capacity of the connection.
CM Secant stiffness corresponding to the design moment capacity of the connection.
Cu Unloading connection stiffness.
Cult Secant stiffness corresponding to the ultimate moment capacity of the connection.
CIO Secant stiffness corresponding with a 0.01 radian rotation of the connection.
E Young's modulus for steel.
Er Reduced modulus.
G,GA, Joint bending stiffness ratio (U.S.A. nomenclature). GB
G* Effective joint bending stiffness ratio (U.S.A. nomenclature).
16 Second moment of area of the beam.
Ie Second moment of area of the column.
Iz%,/"" Second moment of area about the x-x and y-y section axes.
xxxiii SHEFFIELD UNIVERSITY
lI'~'"' p~y
J Torsion constant.
k Effective length factor.
K Bending stiffness.
K" Bending stiffness of a. beam.
K"c Bending stiffness of a beam including the connection stiffness component.
Kc Bending stiffness of a. column.
Ktot Total rotational stiffness at a column node.
L Length.
Lb Beam length.
Lc Column length/height.
Le Effective length (Le = kL).
M Applied bending moment.
Mp Plastic moment.
M.r Bending moment at a semi-rigid connection.
Mr , M" Bending moments applied with respect to the x-x and y-y section axes.
P Applied axial load.
P crit Critical load.
P C1I' P c:r Ultimate axial resistance of a. section for buckling with respect to the x-x and y-y section axes.
Pde. Ultimate axial load predicted from design.
PE Euler buckling load.
P.qualh. Squash load of a section.
p te•t Ultimate axial load observed specifically in an experimental test.
p" Yield stress of steel.
xxxiv

w Uniformly distributed load.
Z:&:&, Z,//1I Elastic section modulus with respect to the x-x and y-y axes of a section.
apin Failure load of a column non-dimensionalised with respect to the failure load of the same column with pinned ends.
a,e. Failure load of a column non-dimensionalised with respect to the failure load of the same column when loaded at the column head only.
/3pin Connection performance indicator.
6pin Deflection at the centre of a simply supported beam.
6,igid Deflection at the centre of a beam rigidly connected to the columns.
6., Deflection at the centre of a beam semi-rigidly connected to the columns.
6:&,11,11 Deflections in the direction of the x,y and z Cartesian axes.
( Strain.
0:&,,//,11 Rotations with respect to the x, y and z Cartesean axes.
p Ratio of the semi-rigid moments (M.,) to the rigid moments (M,igid) in a frame.
#latJe Average of the #l factors at each end of a beam.
(f Direct stress.
tPb Rotation at the support of a beam.
tPc Rotation of a column at the node point.
tPpin Rotation at the support of a simply supported beam.
xxxv
Chapter 1
Introduction and Background
Work.
1.1 Introduction
It is widely appreciated that 'non-sway' steel frames designed with moment resisting
connections (i.e. connections which allow the transfer of bending moments between the
beams and column) will result in lighter structural frames. However, it is often argued
that any savings in the weight of such frames is offset by the increased fabrication cost
of potentially complex connection details. For this reason, the most common method of
design of 'non-sway' steel framed structures is the so ca.1led 'simple construction' design
method [1.1]. This method assumes that the beam to column connections behave like
simple 'pins', making the fabrication of such connections as simple as possible.
It is perhaps less widely appreciated that typical fabricated connections resulting from
a 'simple' frame design (e.g. web cleats, flange cleats and flush end-plates), do in fact
possess an inherent degree of rotational stiffness. Such simple connections may therefore
be considered as semi-rigid, i.e. they possess a rotational stiffness which is intermediate
1.1

between that of a true pinned connection (zero stiffness), and that of a fully fixed con
nection (infinite stiffness). Therefore, the inclusion of the semi-rigid characteristics of
simple connections into steel frame design has the potential of producing lighter, more
efficient structures - in which an increase of actual frame stiffness is realised - without
necessarily increasing the connection fabrication costs.
The aim of this research project was to address this latter point by performing both
experimental and analytical studies, in which the general condition of 'non-sway', three
dimensional behaviour was considered to illustrate, and ultimately quantify, the potential
benefits of semi-rigid connection response. Finally, the aim was to collate these observa
tions, together with those of other researchers, and formulate a convenient and coherent
method of semi-rigid, 'non-sway' frame design which could be utilised by practising steel
work designers.
The individual chapters in this thesis correspond with the major components of the
research project. Chapter 2 presents a detailed report on the testing of a series of 10
full-scale column subassemblage specimens which was performed at the University of
Sheffield. In addition to presenting and discussing the results, the findings of an initial
parametric study which was carried out to determine the optimum experimental test
conditions is also reported. In addition to the subassemblage tests, an experimental
investigation was performed on two full-scale, one bay, two span, two/three storey semi
rigid frames. These particular tests were performed in the Large Structures Testing
Laboratory at the Building Research Establishment near Watford. A description of the
tests, together with a discussion of the results, is presented in Chapter 5.
The three-dimensional nature of the experimental studies, introduced above, presented
a number of challenges when selecting appropriate means of instrumentation. Chapter
3 of the thesis is devoted to this problem and traces .the development of the three
dimensional force and displacement measurement systems which were devised specially
for this project.
1.2

One of the specific objectives of the sub assemblage tests was to provide the necessary
experimental data with which to validate the predictions of a sophisticated finite element
computer program [1.2]. Chapter 4 presents a 'one-to-one' comparison ofthe experimen
tal results and those predicted using this analytical tool. Having verified the ability of
the computer program to predict restrained beam-column behaviour, the author then
used the program to investigate the influence of a wide range of parameters on a large
number of sub assemblage models. The description and findings of this parametric study
are presented in chapter 7.
As discussed above, one of the principal aims of the study was to develop methods of
semi-rigid design which could be used by practising steelwork designers. This topic is
addressed in chapter 8 which presents a brief overview of design techniques, past and
present, and introduces those methods proposed by the author which appear to achieve
a reasonable compromise between accuracy of approach and ease of use.
At all stages in this project, a number of significant observations have been made which
warrant further investigation. For the benefit of fellow researchers, these aspects of the
work have been collated in chapter 9 as a series of recommendations for future study.
1.2 Historical background.
This section presents a relatively brief historical background to the subject and intro
duces some of the key developments tha.t have pla.yed a signHicant role in advancing the
understanding of column behaviour. For clarity, the historical review has concentrated
on the main subject areas of pinned-end columns, end- restrained columns and frame
tests. It should be noted that the historical appraisal of certain aspects of the work
have been reported in more detail in the appropriate chapters where the specific nature
of the review has more relevance (e.g. development of design equations, chapter 8, and
instrumentation techniques, chapter 3).
1.3
1.2.1 The pinned-end column.
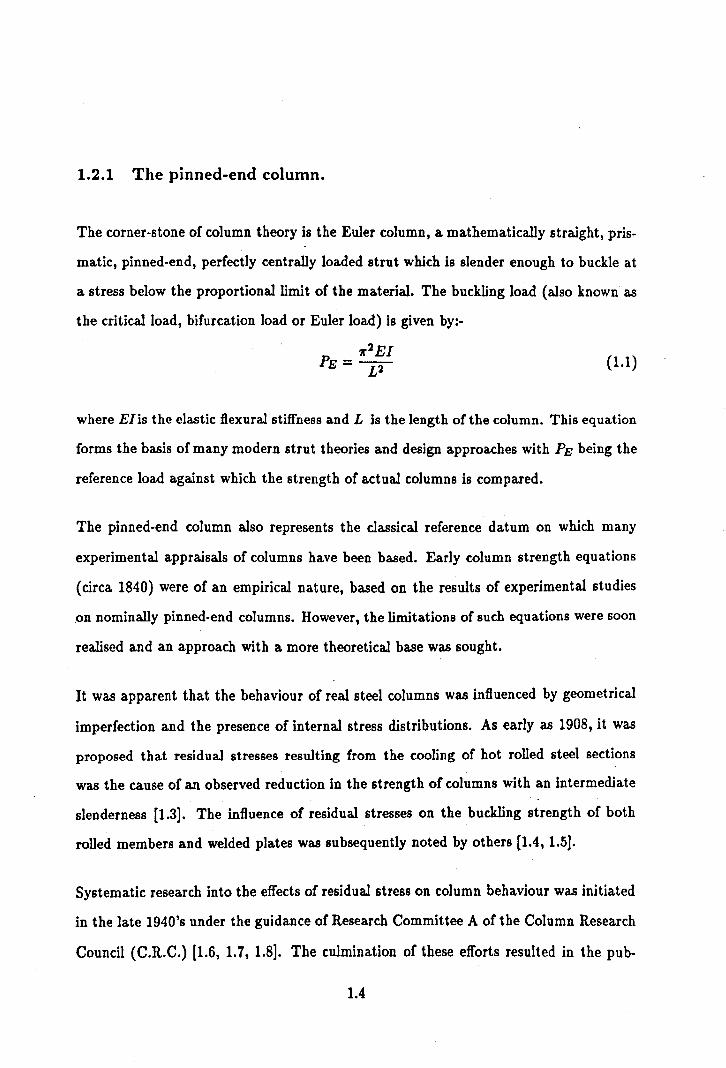
The corner-stone of column theory is the Euler column, a mathematically straight, pris
matic, pinned-end, perfectly centrally loaded strut which is slender enough to buckle at
a stress below the proportional limit of the material. The buckling load (also known as
the critical load, bifurcation load or Euler load) is given by:-
71'2EI PE=-V (1.1)
where EI is the elastic flexural stiffness and L is the length of the column. This equation
forms the basis of many modern strut theories and design approaches with PE being the
reference load against which the strength of actual columns is compared.
The pinned-end column also represents the classical reference datum on which many
experimental appraisals of columns have been based. Early column strength equations
(circa 1840) were of an empirical nature, based on the results of experimental studies
.on nominally pinned-end columns. However, the limitations of such equations were soon
realised and an approach with a more theoretical base was sought.
It was apparent that the behaviour of real steel columns was influenced by geometrical
imperfection and the presence of internal stress distributions. As early as 1908, it was
proposed that residual stresses resulting from the cooling of hot rolled steel sections
was the cause of an observed reduction in the strength of columns with an intermediate
slenderness [1.3]. The influence of residual stresses on the buckling strength of both
rolled members and welded plates was subsequently noted by others [1.4, 1.5].
Systematic research into the effects of residual stress on column behaviour was initiated
in the late 1940's under the guidance of Research Committee A of the Column Research
Council (C.R.C.) [1.6, 1.7, 1.8]. The culmination of these efforts resulted in the pub-
1.4
lication of Technical Memorandum No. 1 which proposed the basic 'C.R.C. Column
Strength Curve'. The formula was derived using the concept of an effective tangent
modulus which took into account the effects of residual stress and other material non
linearities, but which ignored the effect of initial deformations. A similar initiative had
been orchestrated by the Steel Structures Research Committee with a view to review
ing the then present methods of design and applying 'modern' theory to the design of
steel structures. The results of this particular Committees work formed the basis of the
British Standard, BS 449 'Specification for the use of structural steel in buildings' [1.9],
first published in 1932. The increasing use of higher grade steels prompted the publica
tion of a second edition of the C.R.C. guide (1966) which noted the importance of initial
deflections in the design of pinned-end columns.
Further research on the effects of residual stresses and initial deformations was brought
about by commercial demand for an ever increasing range of structural section types.
Investigations of column imperfections by Bjorhovde and Tall [1.10, 1.11], and in Europe
by Beer and Shultz [1.12], led to the computation of 112 different strength curves cover
ing a variety of column shapes and material strengths. Comparisons of the appropriate
curve with full scale test data had shown discrepancies, in terms of strength prediction,
of less than 5%. For the purposes of design, these 112 curves were categorised, pri
marily depending on the type of section, into a maximum of five distinct design curves.
This concept of 'multiple column curves' is much in evidence in a number of current
International steelwork design codes.
A more comprehensive historical review of the research into pinned-end columns can be
found in references 1.13 and 1.14, whilst a summary of the many pinned- end column
tests which have been performed is presented in reference 1.15.
1.5
1.2.2 End-restrained columns.
A review of experimental pinned-end column tests performed between 1880 and 1925
by the Special Committee on Steel Column Research of the American Society of Civil
Engineers, indicated that the columns had behaved almost as if their remote ends had
been fixed [1.16]. This was attributed to the frictional restraint present in the inadequate
spherical supports at the remote ends of the columns. Although unintentional, this
experimental error did alert researchers of the time to the beneficial effect of end-restraint.
The obvious disparity in the behaviour of columns with pinned and rigidly fixed support
conditions was addressed in the early C.R.C. and BS 449 design formulae, introduced in
section 1.2.1, by considering the concept of effective length. Here, the column is designed
as a pinned-end column of length KL, which has the same strength as the restrained
member of length L. For combinations of the extreme end conditions of pinned and
rigidly fixed, the values of the effective length factor, K, were well known.
Whilst the above simple method for assessing the effective length of columns is widely
used, and features in most of the present codes of practice for steelwork design, it does
have a number of accepted limitations. For a column with end conditions which fall
between the extremes of pinned and fully fixed, which applies to all columns in 'real'
frames, the selection of an appropriate effective length is usually left to the intuition of
the designer. However, it was realised that, in the case of rigid frames, the restraint
conditions at the end of the columns were directly related to the stiffness of the inter
connecting beams. This led to the publication of design nomographs, also known as
alignment charts, which enabled a more accurate prediCtion of the critical load, and
hence effective length, of columns in rigid frames.
In the early 1960's, Lay and Galambos [1.17] carried out experimental studies on a series
of seven column subassemblages in which the beams were rigidly connected to the column
(welded joints). The purpose of this study was to provide experimental verification of
1.6
restrained column theories proposed for use in the plastic design of multi-storey steel
frames [1.18]. Tests with similar objectives were recently performed on biaxially loaded
continuous columns by Cuk et al [1.19].
Arguably the most significant study of restrained columns with rigid connections was
that performed by Gent and Milner [1.20]. Using machined scale models of column
sub assemblages under biaxial loading conditions, they demonstrated the phenomenon of
column moment reversal (moment shedding). Here, the beams which initially applied the
disturbing moments, restrained the rotation at the column ends as failure was induced.
The results of the study had shown that columns with large initial disturbing moments
failed at a higher load than the same column with pinned-end supports. The inference
was that the effect of disturbing moments on columns in rigid frames was less than that
implied by the design methods of the time.
It had long been realised that the benefits, in terms of enhanced column restraint and ad
vantageous distributions of beam bending moments, which had been observed for rigidly
connected frames could be applied to frames with semi-rigid connections. It is evident
that strictly speaking all connections fall into this category as no real connection can
achieve the idealised performance of the extremes of pinned and fully rigid. To stimulate
research in the design and analysis of semi-rigid frames, the Structural Stability Re
search Council produced a comprehensive bibliography [1.21]. This document referenced
all the experimental connection tests that had been performed since the first recorded
test by by Wilson and Moore on riveted connections in 1917 [1.22]. Other compilations
of experimental connection data have been produced by Nethercot [1.23] and Goverdhan
[1.24].
The principal measure of connection response is the moment-rotation relationship, also
known as the M-t/> curve. Figure 1.1 shows the typical M-t/> curve for a range of simple
connections. It is evident that the relationship is non-linear, with the tangent to the
curve representing the connection stiffness at that loading level. The smaller slope of
1.7
the web-cleat curve compared to that of the extended end-plate therefore represents the
lower stiffness of this particular connection.
The increased interest into semi-rigid research prompted further experimental studies
on isolated connection response [1.25, 1.26, 1.27]. These included assessments of the
out-of-plane and torsional behaviour [1.28] and the possible detrimental effects of a 'lack
of fit' of connection components [1.29]. The recent advances in computer technology,
combined with the demand for large amounts of connection data, prompted a number
of researchers to formulate finite element analytical models to predict connection M-</>
behaviour [1.30, 1.3,1, 1.32]. However, the complexity of modelling the precise interaction
between connection components has meant that such analytical models are inaccurate,
and at best of limited application. Therefore, at present, experimental testing remains
the most accurate and reliable means of assessing the behaviour of connections.
One of the first experimental investigations of the effect of 'simple' semi- rigid connec
tions on column behaviour was performed by Bergquist [1.33]. He conducted tests on
a series of five 'I' shaped, two-dimensional, column sub assemblages in which the beams
were connected to the column by web cleat connections. Whilst the results from these
tests clearly showed the potential benefits of semi-rigid joint action, the particular 'self
contained' turnbuckle arrangement which was used to load the beams resulted in an
unrealistic pattern of loads. This deficiency was subsequently addressed by Davison
[1.34] who performed a series of tests on full scale, 2-dimensional, non-sway column
subassemblages and frames using a range of connection types and 'realistic' loading ar
rangements.
In recent years, researchers have developed sophisticated finite element analysis tech
niques to investigate the behaviour of columns restrained by semi-rigid connections,
notably Chen [1.35], Jones et al. [1.36], Razzaq and Chang [1.37] and rufai et aI. [1.38].
These analytical tools, which were restricted to in-plane response, enabled researchers
to perform parametric studies to examine the effects of column imperfections, slender-
1.8

ness and connection type. Figure 1.2, extracted from reference 1.34, shows the influence
of different 'simple' semi-rigid connections on columns of different slendernesses. It is
evident that the most marked increase in strength occurs where the columns have a
moderate to high slenderness.
A finite element computer program was recently developed by Wang [1.2] which was
capable of analysing 3-dimensional column subassemblages with semi-rigid connections.
This represented a significant advance in the appraisal of restrained columns. At the time
the program was developed (1989), experimental data on the behaviour of 3-dimensional
column subassemblages incorporating flexible joints, with which to verify the program,
was not available. However, the program had successfully predicted the behaviour of the
rigidly connected, biaxially loaded column subassemblages [1.39] investigated by Gent
and Milner [1.20]. One of the aims of the research project reported in this thesis was
to generate the necessary experimental data and to carry out a thorough verification of
this particular program.
1.2.3 Frame tests
One of the major aspects of this research study was the testing of two full scale, three
dimensional, non-sway frames. This section presents a brief review of some of the most
significant experimental studies of frame behaviour which have been conducted in the
past.
The first appraisals of steel frame behaviour were performed on existing buildings in the
United States in the 1920's. Specifically, measurements were made of the strains in the
columns of the Equitable Building, Des Moines, Iowa [1.40], and the American Insurance
Union Building, Columbus, Ohio [1.41]. The results of these investigations had shown
that the forces in the columns were considerably higher than expected. However, these
1.9
findings have since been questioned due to the manner in which the steel strains were
measured [1.42].
In Britain, members of the Steel Structures Research Committee were conscious of the
fact that the Code of Practice which they ha.d drafted [1.9], did not reflect the true
behaviour of real framed structures. Shortly after the draft had been published (1931),
they initiated the investigation of a series of existing 'real' steel structures and purpose
made large scale frames. The existing structure was the Geological Museum, South
Kensington, London [1.43]. The building was five storeys high and incorporated nominal
riveted beam to column connections. Strains, and hence forces, were measured with
considerable difficulty by monitoring the 'gap' between reference points over a 12 inch
gauge length at 54 different locations around the frame. The large scale model study
was conducted at the Building Research Station and comprised a three storey, two bay,
one span frame constructed throughout using 8" x 4" steel joists [1.44]. The connections
in this instance comprised a top and bottom angle cleat with bolt fasteners. Although
in both cases the connections were considered 'light', both the frames behaved almost as
if they were rigidly connected.
The advent of improved strain measurement techniques meant that 'real' steel frames
could be appraised during the construction stage with the minimum of disruption. Stud
ies were therefore extended to investigate the Cumberland Hotel at Marble Arch [1.45]
• a conservatively designed structure with heavy beam to column connections, the Eu
ston Offices [1.46] • a more orthodox structure, and a block of London fiats of very light
construction [1.47]. In each case, the frames were shown to behave almost as if the con
nections were fully rigid. This was at variance with the assumptions unde.rlying the BS
449 method of design.
In 1964, a Joint Committee of the Institute of Welding and the Institution of Structural
Engineers reported a simplified design method for fully rigid multi-storey welded steel
frames [1.48]. To verify the method, a full scale, three storey, two bay, one span rigid
1.10
frame was tested at the Building Research Station. The results of this test are presented
in reference 1.49. A further development of the design method permitted the use of
higher grade steels and accordingly a second more extensive test was performed [1.50].
A series of 19 tests on rigidly jointed, 3-dimensional, three storey scale model frames
were also performed at the Building Research Station by Taylor [1.51]. The aim of these
tests was to verify a simplified collapse criterion for continuous columns.
In the United States a series of four, two-dimensional, two storey, two bay rigidly con
nected braced frames was investigated by Yura and Lu [1.52]. The results of the tests
had shown that in each case the failure loads were greater than those predicted from
plastic theory with a discrepancy of less than 4%. One significant observation was that
it appeared that the sequence of plastic hinge formation had little or no effect on the
ultimate load. A comprehensive list of rigid frame tests which have been performed in
the United States between the 1940's and 1960's can be found in reference 1.53.
Experimental tests on the behaviour of semi-rigid steel frames are much less common
and have invariably been conducted in the recent past. Of note are tests by Stelmack
et al [1.54] in which the performance of two storey, one bay and one storey, two bay
frames was investigated. The frame connections comprised a flange and seat cleat and
in each case sway was permitted. The aim of the study was to investigate serviceability
behaviour, in which the frames remained totally elastic, and to determine whether frames
'shake down' under repeated cyclic load. The other notable experimental study is that by
Davison [1.34] in which the behaviour of two full-scale, three storey, two bay frames was
investigated. These particular frames were non-sway and incorporated 'simple' cleated
beam to column connections.
1.11

References.
1.1 British Standard: BS 5950 'The structural use of steelwork in buildings, Part 1, Code of practice for design in simple continuous construction: Hot Rolled Sections' , British Standards Institution, London, 1990.
1.2 Wang, Y.C., 'Ultimate strength analysis of three-dimensional structures with flexible restraints', Ph.D. Thesis, Department of Civil and Structural Engineering, University of Sheffield, U.K., June 1988.
1.3 Howard, J .E., 'Some results of the tests of steel columns in progress at the Watertown Arsenal', Proc. Am. Soc. Test. Mater., Vo1.8, 1908, p. 336.
1.4 Salmon, E.H., 'Columns', Oxford Technical Publishers, London, 1921.
1.5 Madsen, I., 'Report of crane girder tests', Iron Steel Eng., Vo1. 18, No. 11, 1941, p. 47.
1.6 Osgood, W.R., 'The effect of residual stress on column strength', Proc. 1st U.S. Natl. Congo Appl. Mech., June 1951, p. 415.
1.7 Yang, H., Beedle, L.S. and Johnston, B.G., 'Residual stress and the yield strength of steel beams,' Weld J., Res. Suppl., Vol. 31, 1952, pp. 224-225.
1.8 Beedle, L.S., and Tall, L., 'Basic column strength', Am. Soc. Civil Engrs., Journ. Struct. Div., Vol. 86, No. ST7, 1960, pp. 139-173.
1.9 British Standard BS 449, 'The use of structural steel in buildings', The British Standards Institution, London, 1932.
1.10 Bjorhovde, R., 'Deterministic and probabilistic approaches to the strength 0/ steel columns', Ph.D. Dissertation, Lehigh University, Bethlehem, Pa., May 1972.
1.11 Bjorhovde, R. and Tall, L., 'Maximum column strength and the multiple column cu",e concept', Rep. No. 337.29, Lehigh University, Fritz Eng. Lab., Bethlehem, Pa., October 1971.
1.12 Beer, H. and Schultz, G., 'Theoretical basis for the european column cu",es', Constr. Met., No.3, 1970, p. 58.
1.13 Ballio, G. and Mazzolani, F.M., 'Theory and design of steel structures', Chapman and Hall, London, 1983, pp. 371-378.
1.14 'Guide to stability design criteria lor metal structures', 4th Edition, Ed. T.V. Galambos, Wiley-Interscience, 1988.
1.12
1.15 Fukumoto, Y., Nethercot, D.A. and Galambos, T.V., 'Experimental data for the buckling of steel structures - NDSS stability of metal structures', 3rd. Int. Colloq. S.S.R.C., Toronto, May 1983, pp. 609-630.
1.16 Progress Report of the Special Committee on Steel Column Research, Trans., Am. Soc. Civil Engrs., Vol. 89, 1926, pp. 1526-1536.
1.11 Lay, M.G. and Galambos, T.V., 'The Experimental behaviour of restrained columns', Welding Research Council, Bulletin No. 110, November 1965, pp. 11-38.
1.18 Ojalvo, M. and Levi, V., 'Columns in planar continuous structures', Proc., Am. Soc. Civil Engrs., Journ. Struct. Div., 89, STI, Feb. 1963.
1.19 Cuk, P.E., Rogers, D.F. and Trahair, N.S., 'Inelastic buckling of continuous steel beam-columns', Journ. Construct. Steel Research, Vol. 6, No.1, 1986, pp. 21-50.
1.20 Gent, A.R. and Milner, H.R., 'The ultimate lood capacity of elastically restrained H-Columns under biaxial bending', Proc. Inst. Civil Engrs., No. 41, 1968, pp. 685-104.
1.21 Structural Stability Research Council, 'Connections bibliography', Task Group 25, Third Draft, March 1987.
1.22 Wilson, W.M. and Moore, H.F., 'Tests to determine the rigidity of riveted joints in steel structures', University of lllinois, Engineering Experimental Station, Bulletin No. 104, Urbana, USA, 1911.
1.23 Nethercot, D.A., 'Steel beam to column connections - A review of test data and their applicability to the evaluation of the joint behaviour of the performance of steel frames', C.I.R.I.A. Project Record, RP 338, 1985.
1.24 Goverdhan, A.V., 'A collection of experimental moment-rotation curves and evaluation of prediction equations for semi-rigid connections', Masters Thesis, University of Vanderbilt, Nashville, Tennessee, December 1983.
1.25 Davison, J.B., Kirby, P.A. and Nethercot, D.A., 'Rotational stiffness characteristics of steel beam-to-column connections', Journ. Construct. Steel Research, No.8, 1987, pp. 17-54.
1.26 Aggarwal, A.K. and Coates, R.C., 'Moment-rotation characteristics of bolted beam-to-column connections', Journ. Construct. Steel Research, Vo1.6, No.4, 1986, pp. 303-318.
1.13
1.27 Moore, D.B. and Sims, P.A.C., 'Preliminary investigation into the behaviour of extended end-plate 8teel connections with backing plates', Journ. Construct. Steel Research, No.6, 1986, pp. 95-122.
1.28 Celikag, M., 'Moment-rotation behaviour of steel beam-to-column connections.', Ph.D. Thesis, Department of Civil and Structural Engineering, University of Sheffield, U.K., Februrary 1990.
1.29 Davison, J .B., Kirby, P.A. and Nethercot, D.A., . 'Effect of lack of fit on connection restraint', Journ. Construct. Steel Research, Vol. 8, 1987, pp. 55-69.
1.30 Frye, M.J. and Morris, G.A., 'Analysis of flexibly connected steel frames', Canadian Journal of Civil Engineers, September 1975,2, No.3, pp. 280-291.
1.31 Lipson, S.L. and Hague, M.L, 'Elastic-plastic analysis of single-angle bolted-welded connections using the finite element method', Composites and Structures, December 1978, No.6, pp. 533-545.
1.32 Krishnamurthy, N., Huang, H., Jeffrey, P.K. and Avery, L.K., 'Analytical M - <P Curves for end-plate connections', Am. Soc. Civil Engrs., January 1979, p. 133.
1.33 Bergquist, D.J., 'Tests on columns restarined by beams with simple connections', Report No.1, American Iron and Steel Institute Project No. 189, Department of Civil Engineering, The University of Texas, Austin, Texas, January 1977.
1.34 Davison, J .B., 'Strength of beam-columns in flexibly connected steel frames', Ph.D. Thesis, Department of Civil and Structural Engineering, University of Sheffield, U.K., June 1987.
1.35 Chen, W.F., 'End restraint and column stability', Am. Soc. Civil Engrs., Journ. Struct. Div., Vol. 106, No. STH, November 1980, pp. 2279-2295.
1.36 Jones, S.W., Kirby, P.A. and Nethercot, D.A., 'Effect of semi-rigid connections on steel column strength', Journ. Construct. Steel Research, Vol. 1, No.1, 1980, pp. 38-46.
1.37 Razzaq, Z. and Chang, J.G., 'Partially restrained imperfect columns', additional papers, Conference on Joints in Structural Steelwork, Teesside, April 1981, Pentech Press Ltd., pp. 6.57-6.80.
1.38 llifai, A.M., 'Behaviour of columns in sub-frames with semi-rigid joints', Ph.D. Thesis, Department of Civil and Structural Engineering, University of Sheffield, U.K., June 1990.
1.14

1.39 Wang, Y.C. and Nethercot, D.A., 'Ultimate strength analysis of threedimensional column suoossemblages with Jlezible connections', Journ. Construct. Steel Research, Vol. 9, No.4, 1988, pp. 235-264.
1.40 Fuller, A.H., 'Measurements of stresses in four steel columns of the Equitable Building, Des Moines, Iowa', Iowa State College of Agriculture and Mechanic Arts, Engineering Experiment Station, Bulletin No. 72, Ames (Iowa), 1924.
1.41 Morris, C.T., 'Dead load stresses in the columns of a tall building', Ohio State University, Engineering Experimental Station, Bulletin No. 40, Columbus, 1928.
1.42 Baker, J.F., 'Early steelwork research', Journ. Construct. Steel Research, Vol.1, No.1, September 1980, pp. 3-9.
1.43 Faber, 0., 'Report on observed stresses in a steel frame structure at the Museum of Practical Geology, South Kensington', Second Report of the Steel Structures Research Committee, H.M.S.D., London 1934, p. 44-60.
1.44 Baker, J.F., 'An investigation of the stress distribution in a number of three-storey building frames', Second report of the Steel Structures Research Committee, H.M.S.O., London, 1934, pp. 241-318.
1.45 Baker, J.F., 'An investigation of the stress distribution in the steel framework of a modem hotel building', Final report of the Steel Structures Research Committee, H.M.S.D., London, 1936, pp. 8-139.
1.46 Baker, J.F., 'An investigation of the stress distribution in the steel framework of a modem office building', Final report of the Steel Structures Research Committee, H.M.S.O., London, 1936, pp. 140-227.
1.47 Baker, J.F., 'An investigation of the stress distribution in the steel framework of a modem residential flats building', Final report of the Steel Structures Research Committee, H.M.S.O., London, 1936, pp. 228-249.
1.48 Joint Committee Report on fully rigid, multi-storey, welded steel frames. The Inst. Struct. Engrs., December 1964.
1.49 Wood, R.H., Needham, F.H. and Smith, R.F., 'Tests on a multi-storey rigid steel frame', The Structural Engineer, Vol. 46, No.4, April 1968, pp. 107-120.
1.50 Smith, R.F. and Roberts, E.H., 'Test of a full-scale rigid-jointed multi-storey frame in high-yield steel (BS ~960, Grade 50) " B.I.S.R.A. Open Report, Report No. EG/A/17/71.
1.15
1.51 Taylor, D.A., 'An ezperimental study of continuous columns', Proc. Inst. of Civil Engrs., Vol. 53, 1972, pp. 1-17.
1.52 Yura, J.A. and Lu, L.W., 'Ultimate load tests on braced multi-storey fmmes', Am. Soc. Civil Engrs., Journ. Struct. Div., Vol. 95, No. STI0, October 1969, pp. 2243-2264.
1.53 Yarimci, E., Yura, J.A. and Lu, L.W., 'Techniques for testing structures pe~itted to sway', Experimental Mechanics, August 1967, pp. 321-331.
1.54 Stelmack, T.W., Marley, M.J. and Gerstle, K.H., 'Analysis and tests of Jlezibly connected steel frames', Journ. of Struct. Enging., Vol.112, No.7, July 1986, pp. 1573-1588.
l.16

P -Py
60 extended end-plate
50
~ 40 z ,:,t;
.... 30 c ~ flush end-plate seat and 0 web cleats ~ 20
10 web cleats ~--+-~~-
10 20 30 40 50 60 70 Rotation radians/lOOO
Figure 1.1: Moment-rotation response for a range of 'simple' connection types.
0·2
Double web angle connection
Single web angle connection
Header plate connection
oL---~--~----~--~----~--~----~--~--~ o 0·25 0-5 - 0·75 1-0 1-25 1-5 ~75 2-0 2·25
~=A~ 1;1 Figure 1.2: Influence of different 'simple' connection types on the strength
of columns of different slenderness.

Chapter 2
The subassemblage tests.
2.1 Introduction
A sub assemblage may be considered as a limited isolated frame, or a collection of mem
bers taken from a more extensive structure. The analysis of appropriate subassemblages
represents a convenient way of simplifying the complex analysis of complete structures
whilst maintaining a reasonable approximation to the 'in-frame' behaviour. In terms
of experimental studies, the testing of subassemblage specimens has the advantage over
individual isolated elements in that it permits the effects of member interaction to be
investigated without the expense associated with the full-scale testing of the complete
structure. For this reason, sub assemblage specimens have been incorporated into many
experimental studies of structural frame behaviour [2.1,2.2,2.3].
This section of the thesis reports on the experimental investigation of a series of 10 such
subassemblage specimens. As well as documenting the experimental observations, the
extensive initial parametric studies which were undertaken to assess and minimise poten
tial errors in the complex experimental test set-up are also reported. The final sections
of the chapter present an in-depth appraisal of the results obtained and discusses the
2.1
most important findings from the tests.
2.2 Conceptual design of the subassemblage tests speci-
mens
In addition to providing a direct comparison against the results from tests on isolated
connections (chapter 6) and complete frames (chapter 5), the aim of the sub assemblage
tests was to validate the predictions of a sophisticated finite element computer program
developed specifically for analysing 3- dimensional restrained beam columns [2.4] (chap
ter 4). The availability of the program at the planning stage provided an opportunity to
conduct a parametric study which investigated the predicted behaviour of the proposed
subassemblage specimens prior to fabrication. Specifically, the program was used to
develop a general sub assemblage configuration which failed at manageable loads, which
deformed within the limits of the available instrumentation devices and which was rela- .
tively insensitive to possible variations in the performance of the experimental boundary
conditions.
2.2.1 Selection of subassemblage members.
It had been decided that the section sizes used to fabricate the subassemblages specimens
should be similar to those used in other recent studies of flexibly connected steel struc- .
tures [2.5,2.6]. This maintained a common theme of study and enabled close comparisons
to be made between various aspects of work carried out by independent researchers. A
152 x 152 x 23 UC section was used to fabricate the column and 254 x 102 x 22 UB
2.2

sections were used for the beams. The nominal geometric properties of these sections
were incorporated into the basic analytical model which was used to carry out the initial
parametric studies (figure 2.1). To allow the relative effect of various parameters to be
observed, the same beam loading arrangement, initial column out-of-straightness and
material properties were incorporated into all the preliminary finite element models.
2.2.2 Column base fixity.
Initially, it was presumed that the sub assemblage columns would be supported at their
base by a 'pin' type connection. Such a support condition would correspond to the base
condition assumed by many designers of non-sway steel framed structures.
The behaviour of structural steel columns with 'pinned' support conditions has been in
vestigated by many experimental researchers. A report on the findings from experiments
on pinned-end columns performed prior to 1925 [2.7], concluded that the frictional re
straint present in the spherical seat supports had a profound effect on column behaviour.
In some instances, the rotational restraint at the simple supports caused the columns to
behave almost as if they were fully fixed at their ends. Since the time of these early stud
ies experimental researchers have developed support arrangements and test procedures
which restrict the potential support restraint to a minimum. Support details which have
been used include crossed knife-edge joints [2.8], multiple bearings [2.9] and hydraulically
pressurised bearing systems [2.10, 2.11]. These complex, and often expensive, devices
reflect the difficulty of producing connections which closely represent the ideal of true
zero rotational stiffness. It was hoped that the use of such complex and expensive 'fric
tionless' base supports could be avoided. A parametric study was therefore carried out
specifically to assess the influence on column behaviour of any rotational restraint which
may be present in a more modest base connection.
2.3

In total, 12 analytical models were studied with linear major and minor axis base stiff
nesses ranging from that of a true pin (zero stiffness) to a fully fixed condition (infinite
stiffness). In this particular instance, the column length was 6.0m and the characteristics
of a web cleat were assumed for the beam to column connections.
Figure 2.2 shows the resulting plot of predicted percentage increase in failure load for
different linear base stiffnesses over that for a pinned base column. As expected, the plot
shows that small variations in base stiffness have a significant effect on the failure load
of columns with relatively flexible base connections. Any small restraint which may be
present in the experimental simulation of a true pin connection would, therefore, have a
significant effect on the performance of the sub assemblage. From an experimental point
of view, the plateau region of the plot is of greater interest. This represents a region for
which the failure load is relatively insensitive to modest variations in the stiffness of the
base connection. The lower limit of the plateau corresponds to a base bending stiffness
of approximately 3000 kNm/radian. Experimental studies by Picard et al. [2.12, 2.13]
have shown that under the influence of axial load, modest base-plate connections possess
a comparable degree of rotational restraint. The rotational stiffness of a four bolt base
plate connection, connected to a 200mm x 200mm column section, studied by Picard is
shown on the plot in figure 2.2 for axial loads of 100 kN and 450 kN. It is evident that
the predicted failure load is relatively insensitive to variations in the bending stiffness of
such a connection.
On the basis of this parametric study a fixed, or near fixed, base connection was adopted
for the base support in the series of subassemblage tests. Any deviation in the true,
or measured, characteristics of the connection would ther~fore not be expected to have
an appreciable effect on either the subassemblage performance or the accuracy of the
subsequent detailed analytical modelling of the test.
2.4

2.2.3 The influence of column length
Obviously, the length of the column would have a profound effect on the ultimate sub
assemblage carrying capacity. As it was intended that all the columns in the experimental
study would be the same length, initial studies were carried out to determine the most
appropriate column length which could be adopted throughout.
The basic analytical model described above was analysed with column lengths of 3.0m,
4.0m and 6.0m. using the moment-rotation characteristics of a range of different con
nection types. These included the four connection types which were ultimately to be
included in the experimental study - web cleat, flange cleat, web and seat cleat and flush
end plate - plus the hypothetical extremes of a true pin (zero stiffness) and fully fixed
(infinite stiffness). The model used in this particular study had a fully fixed column
base condition as recommended from the results of the study described in the previous
section. The predicted ultimate loads, Pu, and the mid-column major axis deflection at
failure, dc, for the above cases are presented in table 2.1. As predicted from classical
strut theory, the ultimate load carrying capacities decrease for increasing column lengths.
The range of failure loads for each particular column,Pu(jixed) - Pu(pin), increases as the
length of the column is increased. This latter point is significant. Experimental tests
could be carried out to identify the influence of each particular connection type on a
column 6.0m long, where the range of failure loads is relatively large. However, exper
imental studies of a 3.0m long column, where the range of failure loads is small, would
yield little information on the relative performance of the individual connections types.
A similar argument could be extended to the observed deformations at the centre of the
column.
This apparent increased connection restraint offered to slender columns, or more appro
priately to columns where the Put P,quluh ratio is significantly less than 1, is fundamental
to semi-rigid theory and has been investigated by a number of researchers [2.14, 2.15].
The implications of this phenomenon have been discussed in greater detail in chapter 8
2.5

of the thesis which deals with semi-rigid design considerations. However, for the purpose
of the initial conceptual design of the sub assemblage tests, these results suggested that
a 6.0m long column should be adopted for the experimental test specimens. At this
length, the column slenderness, L/rlnl , would be at the upper end of the range which
would be usual in real column design. However, due to the fixed base condition and the
rotational restraint from the interconnecting beams, the effective slenderness LE/r"" was
significantly less, typically in the range 85 to 120 depending on the type of connection
employed.
It is interesting to note from the data presented in table 2.1 that the predicted failure
of the subassemblage employing flush end-plate connections was indistinguishable from
that employing fully rigid connections. It would appear therefore that there is a limit
on the stiffness/strength of a connection for which a benefit can be observed it terms
of column capacity. On the basis of this result, it was decided that the flush end-plate
would be the stiffest connection considered in the experimental subassemblage study.
2.2.4 The influence of beam length.
The magnitude of the rotational restraint offered to the column by the connecting beams
is dependent on the magnitude of both the stiffness of the beam, K beQm, and the stiffness
of the beam to column connection, Kcon. The total effective rotational stiffness, ](bc, due
to the combination of these individual stiffness components, as proposed by Galambos
[2.16], can be written in the form:
(2.1)
It is evident from the above equation that for a low beam stiffness, the flexibility of
the beam dominates. As a result, varying the stiffness of the connection of a relatively
flexible beam has little effect on the total rotational restraint. A study was therefore
2.6

carried out to ensure that the beam lengths proposed for the subassemblage tests resulted
in sufficient variations to enable the effect of the different semi-rigid connection types to
be observed experimenta.lly.
Analytical studies were carried out on a range of beam to column connection types
in subassemblages with beam lengths of 1.5m, 2.0m, 3.0m and 4.0m. The boundary
condition envisaged at the remote end of each of the beams permitted displacement in
the direction of the column axis, whilst preventing both in-plane and twist rotations. A
beam with such a support condition will possess an in-plane bending stiffness equivalent
to that of a beam spanning twice the length. The vertical axis through the support
therefore effectively represented the line of symmetry between adjacent subassemblages
in a complete, regular, non-sway frame (figure 2.3). The stiffnesses of the beams used
in the analytical study were therefore equivalent to beams spanning between columns
at 3.0m, 4.0m, 6.0m and 8.0m centres respectively. The predicted failure loads of the
analytical models are presented in table 2.2.
Due to the restricted space available in the subassemblage test area, the maximum beam
length which could be conveniently accommodated in the experimental study was approx
imately 1.5m, equivalent to an actual beam span of 3.0m. At that length, the difference
in the predicted failure load for a subassemblage with web cleat connections, compared
with that employing flush end plate connections, was 40kN. As expected, this difference
in failure load decreased as the length of the beam increased. For a beam length of 4.0m,
the difference was reduced to 24kN. It was considered that at a beam length of 1.5m, the
40kN range of failure loads was sufficiently large to allow the influence of the different
types of connection to be observed experimenta.lly.
2.7
2.2.5 The influence of the 'column loading stub'.
In the experimental study a 'loading stub' was provided to ensure that the column head
load was evenly dispersed across the section at beam connection level. The 'loading stub'
effectively comprised of a short 210mm extension of the column above the centreline of
the beams. A limited analytical study was carried out to assess the likely effect, if any,
of such a stub on sub assemblage behaviour.
Figure 2.4 shows the boundary conditions and predicted failure loads for the finite ele
ment models lA, lB, 2A, 2B, 3A and 3B. In the type A models the beam to column
connections were modelled on the moment rotation characteristics of a simple web cleat
connection. In the type B tests, the connection was modelled as a true pin with zero
rotational stiffness.
Model type 1 investigated the effect of permitting vertical displacements only at the
column head and at the remote end of each of the beams. Comparison of models lA
and 1 B shows that with such boundary conditions, variations in the rotational stiffness
of the beam to column connection had little effect on the column failure load. This was
because the rotational restraint at the head of the column was effectively equal to the
large bending stiffness of the short, positionally restrained loading stub. Any rotational
restraint which was provided by the beam to column connection was effectively insignif
icant in comparison. Obviously, an experimental investigation using similar boundary
conditions would yield very little information on the effects of semi-rigid connections on
the behaviour of the 8ubassemblage.
A study was carried out on models which relieved the positional restraint on the loading
stub. Firstly, model type 2 in which movement was permitted along the axis of the
beams, and secondly, model type 3 in which positional restraint was relieved from the
column head. As expected, these models predicted lower failure loads than the corre
sponding values of model 1. In models 2 and 3, the rotational restraint at the column
2.8

head was provided solely by the beam to column connections. Unlike model type 1, it is
evident from the predicted failure loads of the A and B type models that varying the mo
ment rotation characteristics of the connection had a significant effect on the behaviour
of the sub assemblage. Obviously, experimental studies employing support conditions
similar to those used in model type 2 or type 3 would provide better information on the
relative effects of various semi-rigid connections.
In the experimental testing, it was inevitable that some degree of positional restraint
would be provided both at the head of the column by the loading jack, and at the re
mote ends of the beams by the testing rig. It would therefore have been difficult to truly
represent the support conditions of either models 2 or 3. However, results of the analysis
show that only very small displacements, typically less than O.5mm, are necessary to
fully relieve the clamping action of the loading stub observed in model 1. The restraint
provided by the loading jack, testing rig and the beam to column connections was suf
ficiently flexible to accommodate such small movement. The column could therefore be
expected to behave in a manner intermediate between that predicted by the type 2 and
type 3 models. As the two models behaved in a similar fashion, in terms of failure load
and deformation, the behaviour ofthe subassemblage could be predicted with confidence
without the need to quantify the actual loading stub restraint provided by either the
loading jack or the test rig.
2.3 The series of experimental subassemblage tests.
A total of ten subassemblage tests, designated Sl to SIO, have been carried out. Figure
2.5 shows the two types of subassemblage configuration which were considered in the
study. The subassemblage containing three beams represents an edge column arrange
ment from a more extensive structure, whilst that with just two beams represents a corner
2.9

column. A summary of the connection type, column orientation and sub assemblage type
adopted for each test is presented in table 2.3.
At an early stage, it was proposed that the test programme should include an edge
column arrangement which incorporated a positional restraint to the minor axis at the
column centre. The aim was to create a test specimen in which the effective slender
ness of both the major and minor column axes were approximately equal. However, the
practical difficulties of constructing a minor axis positional restraint which did not ap
ply an unquantifiable out-of-plane restraint to the major axis was soon realised. It was
inevitable that the results from such a test would be unreliable and, as a consequence,
it was not incorporated into the final test programme.
2.3.1 Fabrication or the subassemblage specimens.
The general arrangement of the two types of subassemblage considered in the study
are shown in figures 2.6 and 2.7. All the subassemblages in the study comprised a
6.24m long 152x152x23UC column section (6.03m base plate to beam centreline plus a
O.21m loading stub) with up to three 254x102x22UB beam sections measuring 1.542m
(or 1.459m) between the the column and suppott centrelines. All the steel used to
fabricate the sub assemblage members was nominally grade 43A to BS4360 [2.17]. The
four connection types used in the study - web cleat, web ·and seat cleat, flange cleat,
flush end plate - were fabricated and detailed in exactly the same way as the connections
used in the isolated joint performance study discussed in chapter 6 and those used in
other recent experimental studies [2.5,2.6]. As in the joint tests, 16mm diameter grade
8.8 bolts were used throughout complying with BS4320 [2.18] with bright steel form A
washers beneath each nut and bolt head. The sub assemblage fabrication drawings are
presented in Appendix A.
2.10
For certain subassemblage tests, the members were fabricated from the same steel stock
lengths used to fabricate the elements in the isolated joint tests. This maintained a
continuity of material properties between the tests and thus permitted close comparison
between various aspects of the experimental behaviour. A comprehensive appraisal of
the physical and geometric properties of the steel used in the joint, subassemblage and
frame tests together with details of stock steel locations is presented in a separate volume
to this thesis [2.19].
The fixed base condition was achieved by welding a 700 x 100 x 20mm thick steel base
plate to each of the column sections. The plate was bolted to the spreader beams of the
testing rig by 28 No. 20mm diameter H.S.F.G. bolts on a 200mm x 100mm grid across
the plate. Figure 2.8 shows a photograph of the base-plate from one of the su bas sembI age
tests. The base-plate was very large when compared to those which may be encountered
in practice. However, such a large un stiffened base-plate was necessary to facilitate the
method devised for inducing the prescribed initial column deformations, described in
section 2.3.3., and to provide the necessary high base stiffness discussed in section 2.2.2.
As discussed in section 2.2.4, the bending stiffness of the relatively short beams was in
creased by adopting a support condition at the remote ends which permitted movement
in a direction parallel to the column axis, but which prevented in-plane rotation and
twisting. The 'sliding' support devices were modified versions of those used in a recent
study of 2-dimensional subassemblage behaviour [2.5]. The beams were connected to
the support via a substantial end-plate, extended both top and bottom, to effect a rota
tionally stiff connection. Fabrication details of the beam support detail are presented in
Appendix A whilst figure 2.9 shows a photograph of the support with a beam installed.
2.11

2.3.2 Construction of the subassemblage testing rig.
The rig used to test the su bassemblage specimens was constructed from over seven tonnes
of 305 x 102 RSC steel sections pre-drilled on a 100mm x 100mm grid, and was bolted
together using over 300 No. 20mm diameter High Strength Friction Grip (H.S.F.G.)
bolts. At intersections between principal vertical and horizontal members, nine bolts
were used in a 3 x 3 grid to effect stiff connections capable oC resisting any tendency Cor
the structure to 'rack'. The testing rig was 'self-straining', that is to say that all reactive
forces were contained within, and resisted by, the rig. However, as a saCety precaution
and to maximise overall stiffness, the rig was securely fixed to the floor of the testing
hall at regular intervals. Figure 2.10 shows the general arrangement of the test rig on
plan and elevation, whilst figures 2.11 to 2.12 show photographs oC the rig viewed from
various angles with a specimen installed.
Ideally, the subassemblages would have been tested with the axis of the columns vertical,
thus simulating the orientation of a column in a 'real' structure. However, the restricted
headroom available in the test area, the access requirements and the potential difficulties
of constructing a 'vertical test rig' dictated that the sub assemblages were tested in the
horizontal position. Although in this orientation the disturbing effect of the column self
weight would influence the initial deformation of the specimen, the effect was taken into
account in the subsequent analytical modelling of the tests.
The initial parametric studies of subassemblage behaviour (section 2.2) had illustrated
the benefit of adopting a. very stiff column base support condition. In the testing rig a
series oC vertical and horizontal 305 x 102 RSC spreader beams, fixed to the four main
longitudinal tie members, were used to obtain a very stiff column base support (figure
2.13 and 2.14). During one of the subassemblage tests, deflection measurements were
taken at locations on the column base to assess the rigidity of the supporting frame. The
significance of these results is discussed in section 2.4.1.
2.12
I

2.3.3 Initial column deformations.
Prior to fabrication, the column sections were found to be almost straight with typically
only 1.0mm to 1.5mm deformation at the centre of a 6.2m length of column. The testing
of such near straight column sections can cause sudden bifurcation type failures which
can result in the loss of experimental data at the point of collapse. A preferred approach
was adopted in which the columns were tested with a more significant initial out-of
straightness, typically of the order of L/1000. This has the advantage of:-
1. Producing a much more controllable, progressive collapse allowing the char
acteristics of the column at the point of maximum load to be accurately
monitored.
2. It predetermines the direction of column failure. This is important when max
. imising the available travel of deflection measurement systems at the centre
of the column.
3. It reflects the more onerous lack of straightness limit of practical members.
In the presence of initial deformations the detrimental effect of residual stresses on the
column capacity can be increased. That is to say that the initial deformation and residual
stress pattern have a synergistic effect in which their combined effect is greater than the
sum of the individual parts [2.20]. However, this usually applies to heavy column sections
of relatively small slenderness with large residual stresses. In this instance, where light
sections have been used and the column is of a moderate to high slenderness, the reverse
is true with the effects of residual stresses being reduced [2.21].
Initially it was considered that the columns would have to be bent plastically to attain
the required initial deformation. However, this approach was considered unsatisfactory
2.13

as the plastic strains induced at the column centre could have had a significant influence
on column behaviour. A secondary problem was the difficulty of physically installing
the 6.24m long column in the available testing machines to induce plastic flexure. An
alternative approach considered was the application of a small lateral load to the centre
of the column during the initial stages of the test, thus ensuring a specific direction of
failure. This method was adopted in a recent experimental study of two-dimensional
subassemblage behaviour [2.5]. However, it was considered that the presence of such a
loading devices could cause the following problems:-
1. Additional congestion around the mid point of the column resulting in insuf
ficient room to install the displacement measurement devices.
2. Possible variation in lateral loading during the course of a test.
3. Although the presence of a lateral load could be taken into account in the
subsequent analytical modelling of the tests, in a three-dimensional situation
it would be difficult to quantify the in-plane and out-of-plane column restraint
offered by the loading device.
The method for inducing initial deflections which was ultimately used, and which was
developed specifically for this series of tests, permits the column to be deformed elasti
cally into the shape of an arc of prescribed amplitude without applying lateral load. The
process of operations is best illustrated by considering figure 2.15.
1. The end of the column which was to be welded to the base-plate was cut with
a slight chamfer (2mm across the depth of the section). The large base-plate
was bolted into position in the test rig. With the column in· the position it
would occupy when the complete subassemblage was installed, the displace
ment controlled screw jack was advanced to apply a 'nipping load' to hold the
column firmly in position.
2. The column head load was then increased causing the chamfered gap at the
column base to close. This effectively changed the angle between the column
2.14

centreline and the base-plate thereby deforming the column into an arc.
3. The screw jack was advanced until the required bow was observed at the
column centre. With the column held fixed in the required deformed shape,
the column was welded to the base-plate thus fixing the base angle.
4. The load was then backed off and the column, complete with base- plate,
removed ready to be reinserted during the subassemblage erection (section
2.3.4). Because the base angle was now fixed, reinserting the column into the
testing rig caused the column to adopt the prescribed deformed shape without
the assistance of an applied column load.
Due to the eccentric pressures beneath, the chamfered base combined with the relatively
high column slenderness, the axial load required to induce the deformed shape in the
first instance was relatively small, typically less than 60kN.
As the angle between the column and the base-plate was fixed to a small critical value,
it was important that during the final erection stage the base-plate was relocated in
exactly the same position it had occupied when the initial column deformations were
induced. This was facilitated by using a large base-plate in which the potential for
angular variation during re-bolting was reduced. To effect a stiff base-plate connection,
it is common practice to provide a series of stiffeners at the base of the column. However,
stiffeners were not used as the differential heating effects due to the welding process would
have irreversibly changed the induced base angle.
As a direct result of adopting the above procedure, the use of the often erratic 'as de
livered' out-of-straightness of rolled column sections was avoided. With the exception
of test 86, in which the column minor axis was almost perfectly straight, a similar ini
tial shape of column was used throughout, thus ensuring a. high degree of compatibility
between tests. By avoiding the use of column sections in which the initial deformations
form a reverse or double curve, the subsequent analytical modelling of the tests was much
simplified.
2.15
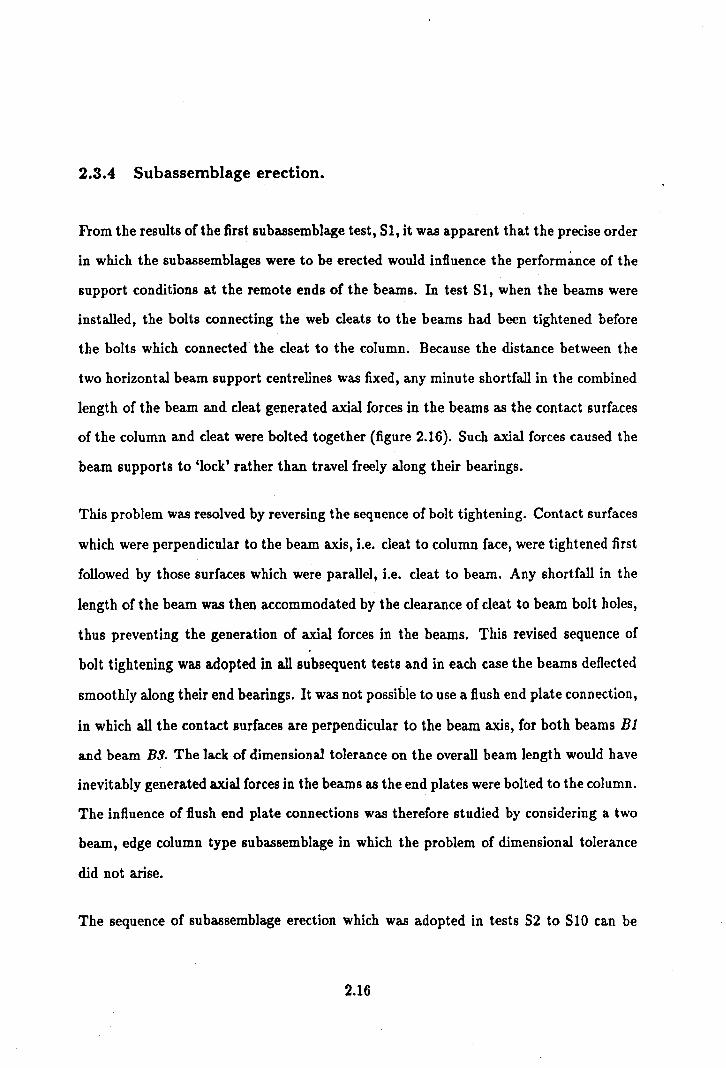
2.3.4 Subassemblage erection.
From the results of the first subassemblage test, Sl, it was apparent that the precise order
in which the subassemblages were to be erected would influence the perform~nce of the
support conditions at the remote ends of the beams. In test Sl, when the beams were
installed, the bolts connecting the web cleats to the beams had been tightened before
the bolts which connected the cleat to the column. Because the distance between the
two horizontal beam support centrelines was fixed, any minute shortfall in the combined
length of the beam and cleat generated axial forces in the beams as the contact surfaces
of the column and cleat were bolted together (figure 2.16). Such axial forces caused the
beam supports to 'lock' rather than travel freely along their bearings.
This problem was resolved by reversing the sequence of bolt tightening. Contact surfaces
which were perpendicular to the beam axis, i.e. cleat to column face, were tightened first
followed by those surfaces which were parallel, i.e. cleat to beam. Any shortfall in the
length of the beam was then accommodated by the clearance of cleat to beam bolt holes,
thus preventing the generation of axial forces in the beams. This revised sequence of
bolt tightening was adopted in a.ll subsequent tests and in each case the beams deflected
smoothly along their end bearings. It was not possible to use a flush end plate connection,
in which a.ll the contact surfaces are perpendicular to the beam axis, for both beams Bl
and beam B9. The lack of dimensional tolerance on the overall beam length would have
inevitably generated axial forces in the beams as the end plates were bolted to the column.
The influence of flush end plate connections was therefore studied by considering a two
beam, edge column type subassemblage in which the problem of dimensional tolerance
did not arise.
The sequence of subassemblage erection which was adopted in tests S2 to S10 can be
2.16

summarised as follows:-
1. The vertical beam B2 was installed and bolted to the support bearing.
2. The column was then positioned and the base-plate bolted to the testing rig,
the process to set the initial angle between the base-plate and the column
having previously been carried out.
3. Beams Bl and B3 were installed and bolted to their respective support bear
ings.
4. Beam B2 was then bolted to the column head to position the column in its
correct vertical alignment.
5. The column was then located in the correct horizontal alignment and a small
'nip' load was applied by the screw jack to firmly hold the column in position.
6. The horizontal beams, Bl and B3, were then bolted to the column observing
the correct tightening sequence as discussed above.
All the bolts were tightened to the same torque, 160Nm, as those connections in the cor
responding joint tests [2.6) and the recent experimental two- dimensional subassemblage
study [2.5).
Prior to erection, the main elements of the subassemblage were painted with a coat of
white matt emulsion paint. Although during subassemblage tests the flaking of the paint
did give an indication of the extent of yielded material, its principal function was to
highlight the suba.ssemblage members on subsequent photographic records.
2.17

2.3.5 Experimental test set-up.
Each beam was loaded by a single 250kN capacity hydraulic ram via a hardened steel
ball acting at a distance of between 400mm and 845mm from the column centreline
(figure 2.17). In the figure the ram has been backed away from the face of the beam.
The retractable steel strip which connects the upper and lower ball seats was a means
of preventing the ball bearing from falling off the jack when the beam was unloaded.
The jacks were load controlled and, once a required limiting value had been attained,
applied a constant beam load to the sub assemblage irrespective of the resulting member
deformations. Two separate electric pumps were used to energise the hydraulic beam
rams. In instances where three beams were loaded, at least two of the beams had to be
supplied by the same pump and hence applied the same load. The load was monitored
by calibrated pressure transducers situated in the oil supply housing of each ram.
A 500kN capacity screw jack, positioned eccentric to both the major and minor column
axes, applied load to the head of the column. This jack was displacement controlled and
enabled the subframe to be deformed beyond the ultimate load in a safe and controlled
manner. A 500kN capacity load cell, which incorporated a spherical seat, measured the
applied column head load.
The three-dimensional nature of both the subassemblage deformations and member
forces, combined with the need to accurately monitor the behaviour of the column in the
elastic-plastic range, required careful consideration as to the methods adopted for force
and displacement measurement. In the early stages of the research programme, much
effort was expended in the development of measurement systems which were capable of
accurately deciphering the individual components of three-dimensional behaviour. For
clarity, the development and appraisal of these measurement systems together with the
overall force and displacement instrumentation and the data acquisition techniques has
been presented separately in chapter 3 of the thesis.
2.18

2.3.6 Sub assemblage test procedure.
Prior to carrying out a test, precise measurements were made of the initial column defor
mations and the beam and column head load eccentricities. These values are summarised
in table 2.4. In addition, the initial geometry of the three-dimensional displacement mon
itoring systems was recorded (see chapter 3).
An initial 'nip load' was present in the subassemblage columns at the start of each
test. This load was relatively small, typically less than lOkN, and had been applied to
facilitate the subassemblage erection (see section 2.3.4). For the purpose of carrying out
the test, the load instrumentation devices were configured to read zero under this nip
load. The magnitude of the initial column load was added to the overall loading when
the experimental data were processed after completion of the test.
The basic loading sequence, which was used for all the sub assemblage tests, was as
follows:- .
1. The beam loads were applied first in increments up to a prescribed limiting
value.
2. With the beam loads held constant, the column head load was increased to
fail the column.
3. After failure and the required column deformation had been attained, the
beam loading was reduced in increments to zero.
4. With the beam loading reduced to zero, the column head load was reversed
back to the initial 'nip load'.
Typically, the beam loads were applied in a minimum of ten equal increments up to their
prescribed limiting value, with data being scanned at every increment. The magnitude
2.19

and position of the beam loadings are summarised in table 2.5 for each of the subassem
blage tests. During the beam loading phase of the test the screw jack, which applied
load to the head of the column, was continuously advanced to maintain the initial 'nip
loading'.
During the column head loading phase of the test the screw jack was advanced at a
constant rate corresponding to an increase in column axial stress of between 5 and 1
N/mm2 per minute. During this phase of the test, data scans were taken at every 20kN
of applied load, but as failure approached the scan increment was reduced to record
the deterioration of column stiffness in more detail. The column head screw jack was
continually advanced beyond the ultimate column capacity until a significant amplitude
of deformation was observed at the column centre.
2.4 Subassemblage test observations and results.
This section explains the progressive development of the loading arrangements and ex
perimental parameters selected for each of the individual sub assemblage tests Sl to S10,
and reports aspects of the observed experimental behaviour.
2.4.1 8ubassemblage test 81
This first subassemblage test employed web deat connections to connect each of the three
beams to the column. To avoid excessive beam deformation, the beam load points were
positioned relatively close to the column with an eccentricity of only 400mm from the
2.20

column centreline. It had been the intention to apply a 50kN load to each of the beams.
However, due to a calibration factor error in the data logging equipment - detected after
completion of the test· the load applied to beam 1 was only 5kN. Figure 2.18 shows
a schematic summary of the major experimental parameters which were present in this
test.
The test was conducted in the manner described in section 2.3.6. The measured ultimate
load carrying capacity of the column was 468.1 kN. Figure 2.19 shows a plot of the
observed load-deflection response at the centre of the column whilst figures 2.20 and
2.21 show the distribution of bending moments around the subassemblage at the end of
the beam loading phase and at the point of maximum load capacity.
Figure 2.22 shows a plot of the support displacements for each of the three beams during
the course of the test. The vertical portions of the plot for beam 1 clearly show that
the support had locked solid rather than travelled smoothly along the sliding bearings.
During the unloading phase ofthe test, a load bang was heard as the locked beam reverted
back to its correct position. This phenomenon was attributed to the precise order in
which the specimen had been erected in the testing rig (see section 2.3.4) and also due
to the small load inadvertently applied to beam 1. As a comparison, figure 2.23 shows
a plot of the travel of the beam support bearings for test S2 in which a revised erection
sequence was adopted. It is evident that in this second test, the bearings performed as
required travelling smoothly along the bearings. This set a precedent for the erection
sequence which was used in all the remaining tests in the series.
The failed specimen S1 was re-tested to check the deflections of the rig at the base of the
column and ensure that a stiff base condition was being achieved. The location of the
four dial gauges used to monitor the base-plate deformation, together with the recorded
deflections, are presented in table 2.6. As expected, the deflections at gauges 1 and 3 were
larger than those of 2 and 4 due to the direction of the minor axis bending moment at the
column base. The magnitude of the differences between these deflections shows that at
2.21

a column load of 450kN, the absolute base rotation was approximately 0.00035 radians.
The corresponding minor axis bending moment at the base was 18.0 kNm giving a base
stiffness of 51400 kNm/rad. This compares favourably with the minimum base stiffness
(3000 kNm/rad) required to closely simulate a fully fixed base condition as discussed in
the initial analytical appraisal of section 2.2.2.
It is interesting to note however that the maximum load carrying capacity of the re
tested specimen with the corrected arrangement of beam loads was 450kN, relatively
close to the' ultimate load capacity observed in test S1. As test SIA was a re-test of a
failed specimen, the results obtained are of limited value and as a consequence will not
be presented nor discussed further.
2.4.2 Subassemblage tests S2.
This particular test used flange cleats to connect each of the beams to the column. As
a precautionary measure, the beam loads in test SI were positioned quite close to the
column and as a result, very little beam deformation was observed. In an attempt to
induce greater beam deformation, the beam point loads in test 82 were positioned further
away from the column centreline (beam 1 and bearil3 at 630mm and beam 2 at 700mm).
The initial minor axis deflection at the centre of the column was 9mm (L/670), larger
than had been adopted in test Sl. Figure 2.24 shows a schematic summary of the major
experimental parameters of this test.
As in test SIA, each beam was loaded with a single load of approximately 50kN. At the
end of the beam loading phase, load was applied to the column head until the ultimate
column capacity of 503.0 kN was achieved. The screw jack at the column head was
allowed to travel beyond the ultimate capacity condition until the minor axis deflection
at the centre of the column was in excess of 100mm. Figure 2.25 shows the resulting load-
2.22
deflection plot for the column centre whilst figures 2.26 and 2.27 show the distribution
of bending moments around the sub assemblage at the end of the beam loa.ding phase
and at the point of failure. Figures 2.28 and 2.29 highlight the post failure deformation
of the sub assemblage.
Due to the problem of the friction in the beam support bearings encountered during test
SI, their performance was closely monitored during test S2. The bearings behaved as .
required throughout the full duration of this and all subsequent tests.
It was during this particular test that a slight modification was made to the subassem
blage loading sequence. The axial shortening of the column during the beam loading
phase had caused the nip load, initially applied to the column head by the screw jack, to
reduce to zero. It was considered that such a situation could permit the position of the
column head to shift slightly under the influence of applied beam moments and therefore
change the measured column head eccentricities. For all subsequent tests, the screw jack
was therefore advanced during the beam loading phase to maintain the initial column
head load.
2.4.3 Subassemblage test S3.
Web and seat cleats were used to connect each of the three beams to the column. The
position and magnitude of the beam loads together with the minor axis bow at the
column centre remained the same as those used in test S2. Figure 2.30 shows a summary
of the principal experimental parameters present in this test.
Figure 2.31 shows a plot of the deflections at the centre of the column during the test.
The maximum applied load was 542.6 kN corresponding with a minor axis central deflec
tion of 33 mm. Figures 2.32 and 2.33 show the distribution of bending moments around
2.23

the subassemblage at the end of the beam loading phase and at the point offailure. As in
the previous tests, the load carrying capacity decreased progressively once the maximum
load had been attained. The test was terminated when the minor axis deflection of the
column was 89 mm.
2.4.4 Subassemblage test S4.
Section 2.3.4 discussed the importance of adopting a specific method of subassemblage
erection which prevented the generation of axial erection forces in the beams. The
method utilised the clearance in the bolt holes of cleated connections to overcome the zero
dimensional tolerance between the end supports of beams 1 and 3. In this particular test,
the flush-end plate connection was investigated, a joint type which itself possesses zero
longitudinal dimensional tolerance. To overcome this problem, a two beam corner column
type subassemblage was studied in which beam 1, and hence the overall dimensional
restriction, was omitted. Figure 2.34 shows a close up of the intersection of the two
beams at the head of the column.
A schematic summary of the major experimental parameters present in this test is shown
in figure 2.35. The test was conducted in the manner discussed previously and was ter
minated when the observed minor axis deflection at the column centre was 96.5 mm.
The maximum load applied to the column was 494.7 kN. Figure 2.36 shows a plot of
the load-deflection characteristics of the column whilst figures 2.37 and 2.38 show the
subassemblage bending moment distribution at the end of the be~m loading stage and
at the point of maximum load.
2.24
2.4.5 Subassemblage test S5.
This test was the first of a series of three which investigated the performance of the
subassemblage with the vertical beam, beam 2, connected to the minor axis of the column
(see table 2.3). Test S5 used web cleats to connect the beams to the columns and was
therefore a companion to test S1.
Only modest beam loads had been applied in tests S1 to S4 and as a result, the maximum
induced beam stresses were only 70% of yield. To save time and to introduce an element
of material continuity, the beams in tests S1 to S3 were re-used in test S5 to S7. Because
the column was now in a different orientation, the re-used beams occupied different
positions to those in the first four tests [2.19].
Figure 2.39 shows a photograph of a local deformation which was present in the steel
column before the test was carried out. The bow in the flange, which probably occurred
as a result of handling during transportation, had an amplitude of 3 mm and was situated
on the top face 710mm down from the under- side of beam 1.
The schematic summary of the test parameters presented in figure 2.40 shows that only
30kN was applied to the vertical beam, beam 2. This limited the moment applied to the
minor axis of the column in an attempt to generate greater major axis column action.
Unequal loads were applied to the horizontal beams, beam 1 and beam 3, to induce a
significant disturbing moment about the major a.xis of the column. This was assisted
by the column head screw jack which was positioned eccentric to the major a.xis but
coincident with the minor a.xis.
As on previous occasions, the beam loads were applied in a fixed ratio in ten equal
increments up to their prescribed ma.ximum values followed by the column head load
to failure. The load deflection plot at the centre of the column is presented in figure
2.41 whilst figures 2.42 and 2.43 show the distribution of bending moments around the
subassemblage at the end of the beam loading phase and at the point of failure. The
2.25
maximum applied loading was 479.0 kN. Figure 2.44 is a photograph of the specimen in
a post failure condition in which the reverse curvature of the minor axis in the region of
the column base can be detected.
During the final stages of the test in which the column was being deformed beyond its
ultimate capacity, zones of flaking paint appeared at particular points on the column (fig
ure 2.45). These zones provided an indication of those regions which had been strained
beyond the yield point of the material. As expected, there appeared to be no plastic
straining around the head of the column. This was because the moment capacity of
the restraining web cleat connections was significantly less than the minor axis plastic
moment capacity of the column section.
2.4.6 Subassemblage test S6.
In all the previous tests, a significant initial deformation had been induced at the centre
of the columns. As discussed in section 2.3.3, this resulted in tests which failed in a
progressive and controlled manner. The aim of test S6 was to investigate the behaviour
ofthe subassemblage when such initial deforma.tions were reduced. Ultimately such a test
would be used to assess the ability of the finite element models to predict the bifurcation \
type failure associated with near straight columns. Figure 2.46, which illustrates the
experimental parameters present in this particular test, shows that the initial minor
axis deflection at the column centre was only O.5mm whilst that for the major axis was
1.5mm. The arrangement of beam loads was simila.r to that adopted for the previous
test, S5.
Figure 2.47 shows the load-deflection plot for the centre of the column. As expected the
'near-straight' column deflected significantly less than any previous column for a given
level of pre-failure load and as a result attained a higher ultimate carrying capacity of
2.26
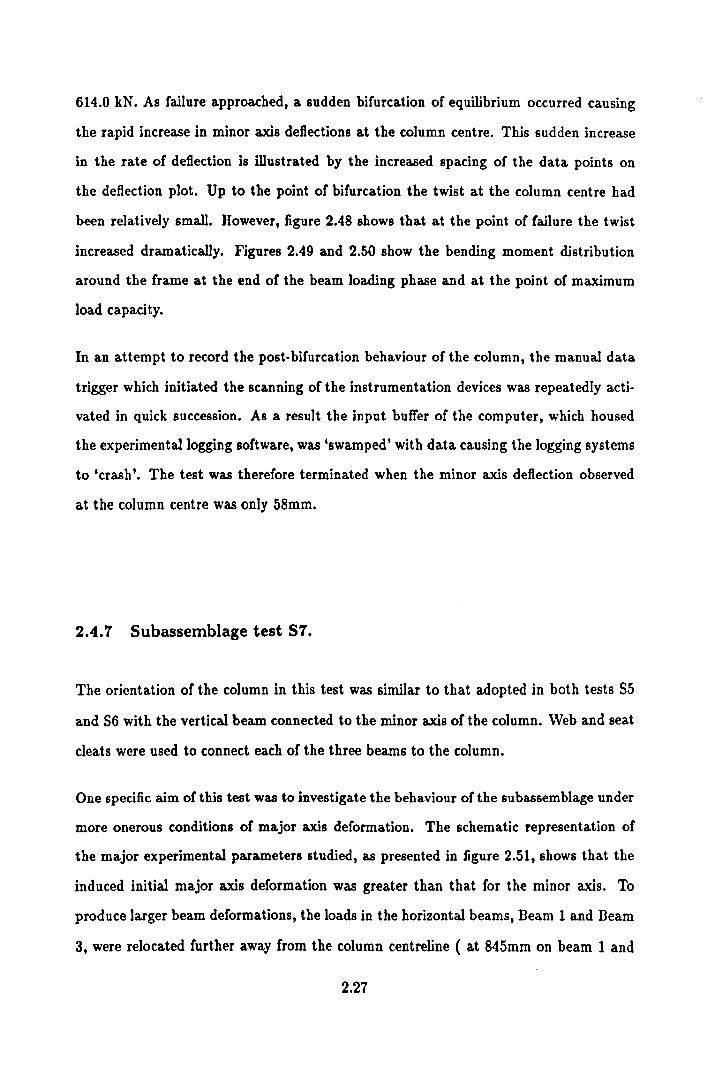
614.0 kN. As fallure approached, a sudden bifurcation of equilibrium occurred causing
the rapid increase in minor axis deflections at the column centre. This sudden increase
in the rate of deflection is illustrated by the increased spacing of the data points on
the deflection plot. Up to the point of bifurcation the twist at the column centre had
been relatively small. However, figure 2.48 shows that at the point of failure the twist
increased dramatically. Figures 2.49 and 2.50 show the bending moment distribution
around the frame at the end of the beam loading phase and at the point of maximum
load capacity.
In an attempt to record the post-bifurcation behaviour of the column, the manual data
trigger which initiated the scanning of the instrumentation devices was repeatedly acti
vated in quick succession. As a result the input buffer of the computer, which housed
the experimental logging software, was 'swamped' with data causing the logging systems
to 'crash'. The test was therefore terminated when the minor axis deflection observed
at the column centre was only 58mm.
2.4.7 Subassemblage test S7.
The orientation of the column in this test was similar to that adopted in both tests S5
and S6 with the vertical beam connected to the minor axis of the column. \Veb and seat
cleats were used to connect each of the three beams to the column.
One specific aim of this test was to investigate the behaviour of the subassemblage under
more onerous conditions of major axis deformation. The schematic representation of
the major experimental parameters studied, as presented in figure 2.51, shows that the
induced initial major axis deformation was greater than that for the minor axis. To
produce larger beam deformations, the loads in the horizontal beams, Beam 1 and Beam
3, were relocated further away from the column centreline ( at 845mm on beam 1 and
2.27

at 830mm on beam 3). In addition, the magnitude of the loads was increased to create
a relatively large imbalance of applied moment about the major axis of the column.
The test was carried out in a similar manner to previous tests as described in section
2.3.6. The sub assemblage was continually deformed beyond the ultimate capacity of
490.0 kN until the observed minor axis deflection at the column centre was 85mm. The
resulting load-deflection plot is shown in figure 2.52. As expected, the observed major
axis deflections were significantly greater than those which had been observed in either
tests S5 or S6. Figure 2.53 shows the distribution of bending moments around the sub
assemblage at the end of the beam loading phase whilst figure 2.54 shows the distribution
of moments at the point of failure.
2.4.8 Subassemblage test S8.
In tests S5, S6 and S7, the vulnerability of the column to minor axis deformation limited
the amount of load which could be applied to the vertical beam, beam 2. In the final
tests of the series, S8, S9 and S10, the orientation of the column reverted back to that
used initially, in which beams 1 and 3 were connected to the minor axis of the column.
This enabled larger total beam loads to be applied to the sub assemblage and provided
the potential to produce larger major axis column moments. The beams used in the final
three tests were fabricated from new lengths of steel unlike tests S5, S6 and S7, in which
the beams had been re-used from previous tests
In test S8, web cleats were used to connect the beams to the column. The subassemblage
was therefore similar to the first specimen S1. Equal loads were applied to each of the
three beams in increments of 10kN until the maximum beam strain was 1200 microstrain
(approximately 250N/mm2), corresponding to a nominal maximum applied beam loading
of 85kN. The other principal test parameters present are summarised in figure 2.55.
2.28

The maximum column capacity was 482.0 kN. Figure 2.56 shows the load- deflection plot
for the column centre. Figure 2.51 shows the resulting distribution of bending moments
around the sub assemblage at the end of the beam loading phase, whilst figure 2.58 shows
the distribution of moments at the point of failure.
2.4.9 Subassemblage test S9.
Flange cleats were used to connect each of the beams to the column. The test was there
fore of a similar arrangement to test S2. Figure 2.59 shows the principal experimental
parameters which were present in this particular test. As in test S8, the same load was
applied to each of the three beams but in this instance the nominal maximum beam load
was higher at 95kN. The test was carried out in the manner described previously and
attained a maximum load capacity of 526.0 kN. The test was terminated when the minor
axis deflection at the column centre was 58mm. As expected, the increased connection
stiffness combined with the increased beam loading produced significantly greater major
axis column deformation and bending moments than had been observed in test S8.
The plot of deflections against applied load for the column centre is presented in figure
2.60. Figure 2.61 shows the resulting distribution of bending moments around the sub
assemblage at the end oUhe beam loading phase whilst figure 2.62 shows the distribution
of moments at the point of failure.
2.29
2.4.10 Subassemblage test S10.
The final subassemblage test incorporated two different connection types. Web and
seat cleats were used on the horizontal beams (beams 1 and 3) and a flush end plate
connected the vertical beam (beam 2) to the major axis of the column. Figure 2.63
shows a summary of the principal experimental parameters. The high load applied to
beam 2 combined with the relatively stiff flush end plate connection had the potential
to transmit a large bending moment to the major axis of the column and thus promote
a high degree of major/minor column axis interaction.
The subassemblage was tested using the procedure discussed in section 2.3.6 with the
beam loads applied in ten equal increments in a 2:3:2 ratio to beams 1,2 and 3 respec
tively. The column failed when the total applied load was 520.1 kN. Figure 2.64 shows a
plot of the measured deflections at the column centre against the total applied load. The
plot shows that the major axis deflections were significantly larger than those for the mi
nor axis during the initial stages of the test and thus illustrates the degree of major / minor
axis interaction which had been achieved. This is also apparent from the large major
axis column moment shown on the bending moment distribution plots in figures 2.65
and 2.66. One outcome of the increased major/minor axis interaction was the increased
twist induced at the centre of the column (see chapter 4). Figure 2.67 shows the col
umn under a post-failure load condition and illustrates the large twist rotation observed.
2.30
2.5 Discussion of results from the experimental subassem-
blage tests.
A discussion on the general observations and conclusions from the experimental sub
assemblage study is reported in this section. It should be noted that a discussion on
the detailed aspects of subassemblage behaviour is presented in chapter 4 where the ex
perimental results are compared with those predicted from the finite element computer
program [2.4].
2.5.1 Mode of failure.
In all ten of the subassemblages studied, the column failed as a result of excessive mi-
nor axis deformation. This occurred despite efforts to induce predominately major axis
deformation, particularly in the later tests. In test SIO (see section 2.4.10 ), a loading
arrangement was used which, at the end of the beam loading phase, induced a major
axis moment at the column head of 23.2kNm (45.0kNm nominal M,z) and a major axis
deflection at the column centre of 14.6mm (n.6mm absolute). The corresponding mo
ment and deformation about the minor axis was 0.5kNm (14.0kNm nominal MplI) and
6.1mm (15.1mm absolute) respectively. A situation therefore existed which was expected
to promote a high degree of major/minor column axis interaction. However, the near
vertical nature of the mid-column major axis deflection plot during the second phase
of the test, shown in figure 2.64, illustrates the resistance of the column to major axis
failure. The difficulties of inducing significant major axis action in the experimental ha~
appraisal of pinned-end steel columns -has previously been reported by Birnstiel [2.22].
2.31
2.5.2 Distribution of moments around the subassemblage.
The plots of the bending moment distributions for ea.ch of the ten tests are presented
under section 2.4. They show the bending moments at both the end of the beam loading
phase and on reaching the maximum column load. It should be noted that the plots
were generated from the measurement of bending moments at only a limited number
of locations and, as a result, they represent only simple 'straight line' approximations
to the actual moment distributions. An examination of the plots shows that, in some
instances, there is an apparent imbalance of bending moments at the intersection of the
beams with the column. This is principally due to the effect of the column head load
acting eccentrically to the column centreline and the torsional resistance effects from the
beam, or beams, perpendicular to the plane of the moment diagrams.
In tests where an appreciable disturbing moment was applied to the minor axis of the
column (i.e. tests numbers 51,54,55,56 and 57) a reversal of the moment occurred at
the column head as the failure load was approached. In the remaining tests, in which
the column head minor axis moment at the end of the beam loading phase was negligible
(i.e. test numbers 52,53,58,9 and 510), the moment increased as the column approached
failure but without reversing sign. In all cases, the induced minor axis column head
moment at the point of ultimate load was of the opposite sign to that induced at the
column centre. As a result, the minor axis of all the columns in the study deformed in
the shape of a double reverse curve (figure 2.45).
The column head minor axis moment at the point of failure was a direct result of the
restraint, both in-plane and torsional, from the intersecting beams. The. beams resisted
the head rotation of the column as it deformed laterally at the mid-point under the
influence of increased compressive load. In instances where a beam framed into each
side of the column minor axis, one of the connections continued to 'close' with increasing
beam moment (loading- loading), whilst the other beam 'opened' exhibiting moment
reduction (loading- unloading). In some instances, the 'closing' connection attained the
2.32

full moment capacity of the connection whilst the 'opening' connection experienced a full
reversal of the beam moment. This redistribution of moments around the column head
at the point of failure is clearly evident from the bending moment plots. Figure 2.68
shows a diagrammatic summary of the direction of connection rotation at key stages in
the loading sequence.
Comparing the 'end of beam loading' and the 'point offailure' bending moment diagrams
for each of the individual tests, the difference between the major and the minor axis
moment distributions is quite apparent. Unlike the minor column axis, there appears to
be only a small change in the major axis moments from the end of the beam loading up
to the point of failure. As discussed in section 2.5.1, this is verified by the lack of major
axis deflection observed after completion of the beam loading phase of the test. Although
sometimes small, all test specimens exhibited a reduction of the major axis moment at
the column head as the failure load was reached. This phenomenon was similar to the
moment reversal discussed above for the minor axis but is evident to a much less extent.
Such a moment reduction only occurred when failure was imminent and the column had
almost zero stiffness. Only then could the major axis of the column deform appreciably,
causing the connection with the major axis beam to 'open' and thus reduce the applied
moment.
The concept of moment reversal is a fundamental aspect of restrained beam column be
haviour and has been observed in rigidly connected frames, both model and full scale, by
a number of experimental researchers [2.23, 2.24]. As far as the author is aware, these
subassemblage tests are the first to illustrate moment reversal in a flexibly connected
3-dimensional steel structure using full-scale components.
2.33

2.5.3 Connection behaviour.
Significantly, there was very little evidence of permanent connection distress in any of
the subassemblage tests. Inspection of flange and web cleats following testing revealed
negligible deviation from their original 'L' shaped section. This was despite the moment
capacity of the connections being attained in a number of instances. This can be ex
plained by the relatively small maximum connection rotations observed - typically in the
range 0.012 to 0.025 radians. These are significantly less than the maximum rotations
induced during many isolated experimental joint tests [2.25, 2.26] in which the maxi
mum induced rotation often exceeded 0.13 radians resulting in substantial permanent
connection deformation.
As discussed in section 2.5.2, it is clearly evident from the distributions of bending
moments that connections in the tests exhibited the 'loading-loading' and 'loading
unloading' behaviour characteristic of connections in restrained beam-columns. This
is substantiated by the nature of the measured moment- rotation response of the indi
vidual connections. For clarity a full appraisal of connection behaviour, together with
comparisons of their behaviour when tested in isolation, is presented separately in chap
ter 6 of the thesis.
2.5.4 Ultimate column capacity.
Table 2.7 shows a summary of the ultimate applied loads,P"u and the non- dimensional
load ratio P",lt/ P.q"'luh for each of the subassemblage tests. P.'l",o.h was determined from
the stub column tests reported in reference 2.19. Due to variations in the experimental
parameters studied, detailed quantitative comparisons between the capacity of different
subassemblage specimens is not possible. However, the failure loads do indicate general
2.34

trends which can be commented upon:-
As expected those tests (81, 85 and 88) employing web cleat connections, the least stiff
of the connections studied, produced the lowest column capacities; all had a Pult/ P.qua,h
ratio of 0.51. With the exception of test 86, in which a bifurcation type failure gave an
artificially high ultimate capacity, all those tests with only a single beam connection to
the column minor axis (84, 85 and 87) produced a relatively low Pult/ P.qu(uh ratio (less
than 0.53), irrespective of the connection type employed.
Tests 82 and 89 both employed flange cleat connection types, had a symmetrical ar
rangement of beam loading about the minor axis and had a similar initial minor axis
deflection at the column centre. It is interesting to note that each test produced the
same Pult/ P.qua.h ratio of 0.56 despite the greatly increased major axis moment applied
to test 89. A similar effect can be illustrated when comparing the results of tests 89 and
810. The web and seat cleat connections used in test 810 possess a moment-rotation
behaviour similar to that of the flange cleat connection used in test 89. Although the
major axis moment applied to column 810 was significantly greater, both tests produced
the same Pult! P.qua,h ratio of 0.56. This apparent inability of the major axis moment to
significantly reduce the ultimate capacity of the column is the subject of an analytical
parametric study presented in chapter 7.
The author has compared the ultimate capacities measured in the experimental study
with those predicted using conventional design techniques. For clarity however, this ap- .
praisal has been included in chapter 8 of the thesis which deals with semi-rigid frame
design.
2.35

2.5.5 Spread of yield across the column section.
Chapter 3 reports in detail the methods developed for measuring the strain, and hence
stress, distribution at the base, mid-point and top of the column. Computer processing
of the measured strains enabled the spread of material yield to be traced across the
section. Figure 2.69 shows these traces at both the base and centre of the column for
each of the test specimens S6 and S7 as the failure load was approached.
The spread of yield shown for the test specimen 57 is typical of that observed in most of
the sub assemblage tests. Yield was detected at a relatively early stage, in this instance
83% of the ultimate failure load, occurring first at the extremities of the flanges at the
mid-point of the column. From the point of first yield up to the failure load the yield
spread in a slow and progressive manner. The extent of yield observed on the upper
and lower flanges of the section reflected the relative magnitudes of the major and minor
axis bending moments acting at that location on the column. The one test in which the
spread of yield was significantly different was test S6. This test specimen was initially
very straight and failed as a result of a bifurcation of equilibrium. The lack of pre
failure minor axis deformation is evident from the spread of yield plots shown in figure
2.69. Due to the much reduced minor axis deflection and minor axis moments, the first
yield was detected at a much higher level of load, 94% of failure load. Once yield had
occurred it spread rapidly under the influence of the relatively high axial stress and coin
cided with the accelerated mid-column minor axis deformation discussed in section 2.4.6.
References.
2.1 Bergquist, D.J., 'Tests on columns restrained by beams with simple connections. " American Iron and Steel Institute, Project No. 189, Report No.1, Dept. of Civil Eng., University of Texas, 1977.
2.36
2.2 Lay, M.G. and Galambos, T.V., 'Tests on beam and column subassemblages. " Fritz Engineering Laboratories, Report No. 278.4 and 278.10.
2.3 Kirby, P.A., Davison, J.B. and Nethercot, D.A., 'Large scale tests on column subassemblages and fmmes. 't published in 'Connections in Steel Structures: Behaviour Strength and Design. ',ed. R. Bjorhovde, J. Brozzetti and A. Colson, Elsevier Applied Science, 1988, pp. 291-299.
2.4 Wang, Y.C., 'Ultimate strength analysis of three-dimensional structures with flexible restraints', Ph.D. Thesis, Department of Civil and Structural Engineering, University of Sheffield, U.K., June 1988.
2.5 Davison, J.B., 'Strength of beam-columns in flexibly connected steel frames', Ph.D. Thesis, Department of Civil and Structural Engineering, University of Sheffield, U.K., June 1987.
2.6 Celikag, M., 'Moment-rotation behaviour of steel beam-to-column connections.', Ph.D. Thesis, Department of Civil and Structural Engineering, University of Sheffield, U.K., Februrary 1990.
2.7 Progress Report of the special committee on steel column research, Trans., Am. Soc. Civil Engrs., Vol. 89, 1926,pp. 1526-1536
2.8 May, I.M., 'Crossed knife edge joints for testing columns.', Proc. Inst. Civil Engrs., Part 2, No. 65, Dec. 1978, pp. 917-919.
2.9 Estuar, F.R. and Tall, L., 'Testing of pinned end steel columns.', Test methods for compression members, Am. Soc. Testing Mats., STP 419, 1967, pp. 80-96.
2.10 Kato, B., 'Column buckling curves of welded steel tubes. " Proc., International Colloquium on Column Strength, Paris, 23-24 November 1972, pp. 225-235.
2.11 Templin, R.L., 'Hydraulically supported spherically seated compression testing machine platens. " Proc. Am. Soc. Testing Mats., Vol. 42, 1942, pp. 968-976.
2.12 Picard, A. and Beaulieu, D., 'Rotational restraint of a simple column base connection. " Canadian Journ. Civil Eng., No. 12, 1985, pp. 126-136.
2.13 Picard, A. and Beaulieu, D. and Perusse, B., 'Rotational restraint of a simple column base connection.', Canadian Journ. Civil Eng., No. 14, 1987, pp. 49-57.
2.14 Lui, E.M. and Chen, W.F., 'Strength of columns with small end restraint.', The Structural Engineer, Vol. 61B, No.1, Part B, 1983, London, pp. 17-26.
2.37

2.15 Jones, S.W., Kirby, P.A. and Nethercot, D.A., 'Effect of semi-rigid connections on steel column strength', Journ. Construct. Steel Research, Vol. 1, No.1, 1980, pp. 38-46.
2.16 Galambos, T.V., 'Discussion of small end restraint effects on the strength of H-columns.', Journ. Struct. Div., Am. Soc. Civil Engrs., Vol 109, ST4, April 1982, pp. 1067-1077.
2.17 British Standard BS 4360, 'Specification for weldable structural steels', The British Standards Institution, London, 1990.
2.18 British Standard BS 4190, 'Specification for ISO metric black hexagon bolts, screws and nuts', The British Standards Institution, 1967.
2.19 Gibbons, C., 'The strength of biaxially loaded beam-columns in flexibly connected steel frames - Volume 2: A survey of the mechanical and geometric properties of structural steel sections', Ph.D. thesis, Department of Civil and Structural Engineering, University of Sheffield, Dec. 1990.
2.20 Bjorhovde, R., 'Effect of end restraint on column strength - practical applications.', Am. Inst. Steel Const., Vol. 21, No.1, 1984, pp. 1-13.
2.21 'Guide to stability design criteria for metal structures', 4th Edition, Ed. T.V. Galambos, Wiley-Interscience, 1988.
2.22 Birnstiel, C., 'Experiments on H-columns under biaxial bending', Journ. Struct. Div., Am. Soc. Civil Engrs., Vol. 94, No. ST10, Oct. 1968, pp. 2424-2449.
2.23 Gent, A.R. and Milner, H.R., 'The ultimate capacity of elastically restrained H-columns under biaxial bending.', Proc. Inst. Civil Engrs., Vol. 41, Dec. 1968, pp. 685-704.
2.24 Wood, R.H., Needham, F.H. and Smith, R.F., 'Tests on a multi-storey rigid steel frame', The Structural Engineer, Vol. 46, No.4, April 1968, pp. 107-120.
2.25 Aggarwal, A.K. and Coates, R.C., 'Moment-rotation characteristics 01 bolted beam to column connections. " Journ. Construct. Steel Research, yol. 6, No.4, 1986, pp. 303-318.
2.26 Davison, J .B., Kirby, P.A. and Nethercot, D.A., 'Rotational stiffness characteristics of steel beam to column connections', Journ. Construct. Steel Research, Vol. 8,1987, pp. 17-54.
2.38
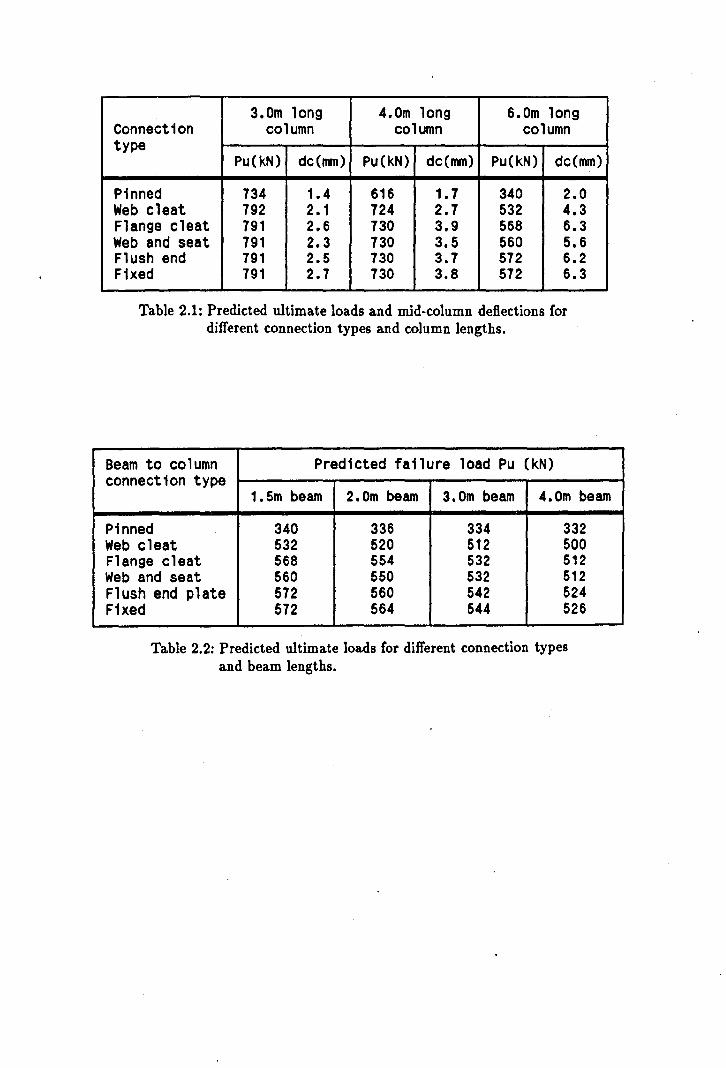
3.0m long 4.0m long 6.0m long Connection column column column type
Pu(kN) dc(mm) Pu(kN) dc(mm) Pu(kN) dc(mm)
Pinned 734 1.4 616 1.7 340 2.0 Web cleat 792 2.1 724 2.7 532 4.3 Flange cleat 791 2.6 730 3.9 568 6.3 Web and seat 791 2.3 730 3.5 560 5.6 Flush end 791 2.5 730 3.7 572 6.2 Fixed 791 2.7 730 3.8 572 6.3
Table 2.1: Predicted ultimate loads and mid-column deflections for different connection types and column lengths.
Beam to column Predicted failure load Pu (kN) connection type
1.5m beam 2.0m beam 3.0m beam 4.0m beam
Pinned 340 336 334 332 Web cleat 532 520 512 500 Flange cleat 568 554 532 512 Web and seat 560 550 532 512 Flush end plate 572 560 542 524 Fixed 572 564 544 526
Table 2.2: Predicted ultimate loads for different connection types and beam lengths.
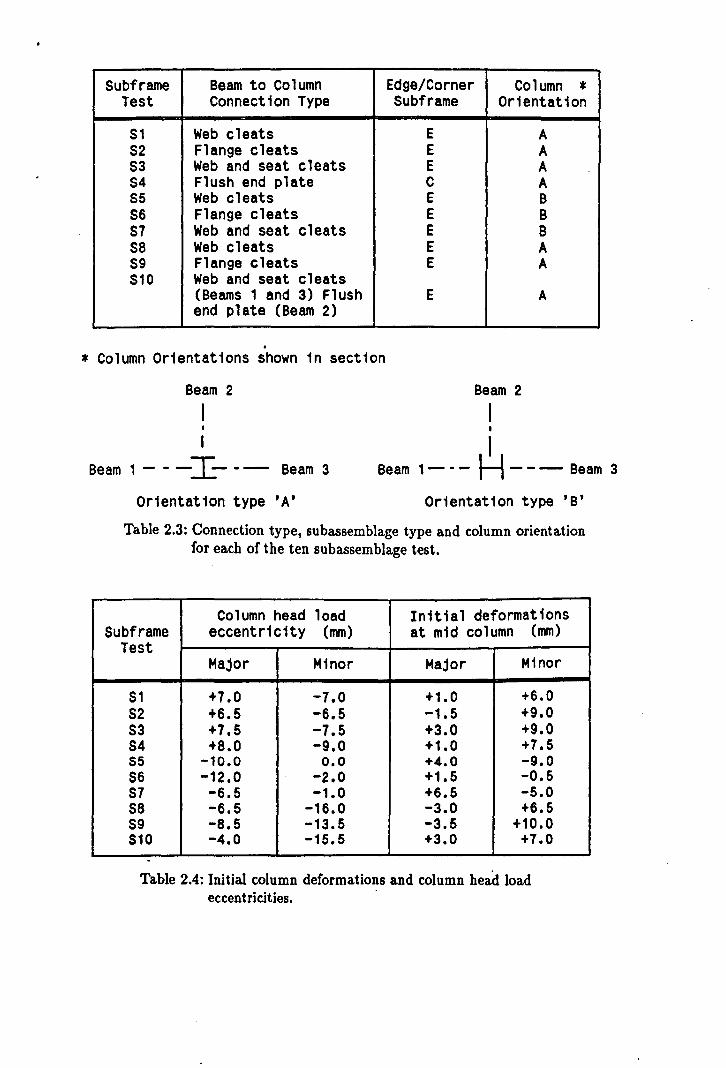
Subframe Beam to Column Edge/Corner Column * Test Connect1on Type Subframe Or1entat1on
S1 Web cleats E A S2 Flange cleats E A S3 Web and seat cleats E A S4 Flush end plate C A S5 Web cleats E B S6 Flange cleats E B S1 Web and seat cleats E B S8 Web cleats E A S9 Flange cleats E A S10 Web and seat cleats
(Beams 1 and 3) Flush E A end plate (Beam 2)
• * Column Orientat1ons shown in section
Beam 2 Beam 2
I
Beam 1 - - - I- -- Beam 3 I
Beam 1-· - H --- Beam 3
Or1entation type 'A' Orientation type 'B'
Table 2.3: Connection type, suba.ssemblage type and column orientation for each of the ten suba.ssemblage test.
Column head load Initial deformations Subframe eccentricity (nvn) at mid column (rnm)
Test Major Minor Major Minor
S1 +1.0 -1.0 +1.0 +6.0 S2 +6.5 -6.5 -1.5 +9.0 S3 +1.5 -1.5 +3.0 +9.0 S4 +8.0 -9.0 +1.0 +7.5 S5 -10.0 0.0 +4.0 -9.0 S6 -12.0 -2.0 +1.5 -0.5 S7 -6.5 -1.0 +6.5 -5.0 S8 -6.5 -16.0 -3.0 +6.5 S9 -8.5 -13.5 -3.5 +10.0 810 -4.0 -15.5 +3.0 +7.0
-Table 2.4: Initial column deformations and column head load
eccentricities.

Beam load offset Nominal Maximum Subframe (nvn) Beam Load (kN)
Test Beam1 Beam2 Beam3 Beam1 Beam2 Beam3
Sl 400 400 400 5 50 50 S2 630 700 633 50 50 50 S3 630 700 633 50 50 50 S4 - 695 625 - 50 50 S5 617 708 637 30 30 60 S6 615 713 635 30 30 60 S7 845 709 830 45 45 90 S8 843 700 838 10 85 85 S9 840 697 840 95 95 95 S10 840 698 840 88 132 88
Table 2.5: Nominal applied beam loads and beam load locations.
80 540 80 I I I I
80
1 2
I 540
3 4
80
Column Displacement at locations on column base (nvn) Load (kN) 1 2 3 4
250 0.48 0.41 0.38 0.33 290 0.56 0.51 0.48 0.43 330 0.66 0.61 0.61 0.53 380 0.79 0.67 0.75 0.62 450 0.97 0.80 0.95 0.77
Table 2.6: Measurements of column base movement during a re-test of sub assemblage S1.

Test Ultimate column Column squash load ratio capacity (Pult) kN load (Psquash) kN Pult/Psquash .
S1 468.1 913.1 0.51 S2 503.0 892.0 0.56 S3 542.6 982.1 0.55 S4 494.7 934.7 0.53 S5 479.0 938.5 0.51 S6 614.0 941.5 0.65 S7 490.0 953.6 0.51 S8 482.2 954.8 0.51 S9 526.0 935.1 0.56 S10 520.1 925.1 0.56
Table 2.7: A summary of ultimate column capacities and squash loads.

50kN
50kN
Py = 325N/mm 2
0ix,y = L/1000
Column: 152x152x23 UC
Beams: 254xl02x22 UB
Figure 2.1: Basic analytical model used in the preliminary studies.
60 "0 0 0 .
50 Q) c
~ E :J :J
r ailure load for a fully fixed bose condition.
=0 .E v 40 .S Q)
(I)
Q) 0 (1)..0 0"0 30 ~ Q) v c .= .= Q)
a..
0'0 20 0 ..... ~ c Q) Q) ~ v ~
10 Q)
a..
..... ..... (5 z
(5 .D .D Z ..,. "" ..,. "" 0 0
"0 0 "0 I() ..,. c: II c:
II 'E D- 'E D-o h
0 h c: c
- - 0 "-0 c - c: - 0 0 0 :oJ 0 :oJ
III V WI V I/)
., 1/1 .,
Q) c Il c: C c c: c: - 0 - 0 :: v :: v ii) ii)
o I I
o 2 4- 6 8
Base connection stiffness (kNm/radian ,x 1000)
Figure 2.2: Plot of column base stiffness against predicted percentage increase in failure load.
10
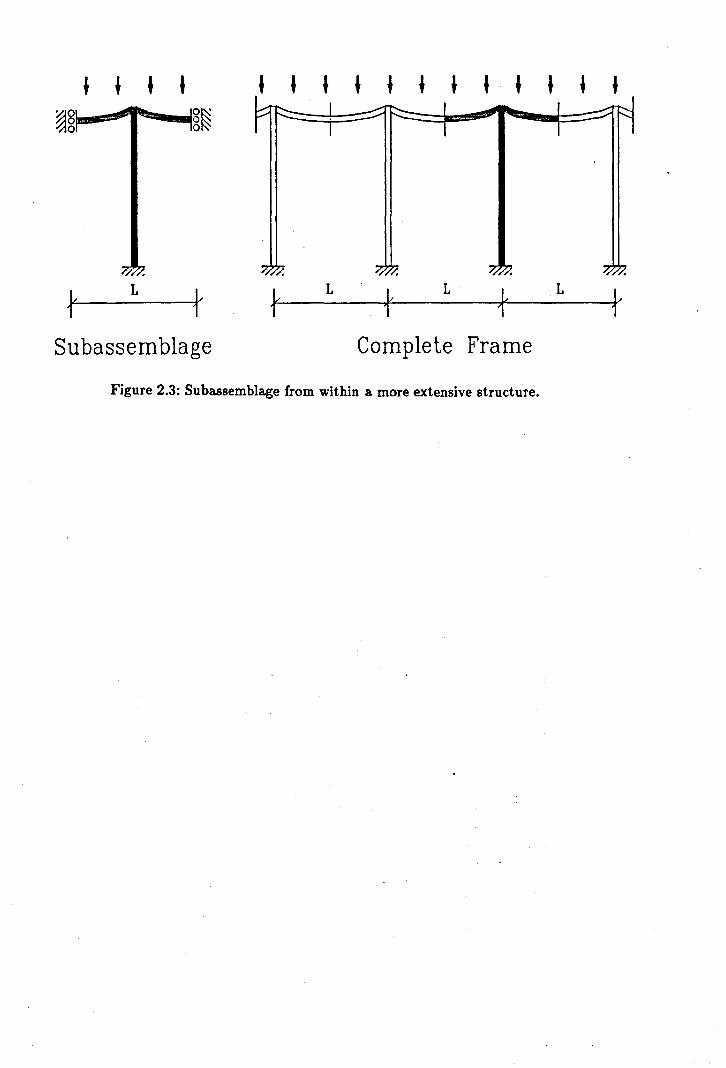
• • • •
;%
L
Subassemblage
• • • • • • • • • • • •
k L L L k 1 1
Complete Frame
Figure 2.3: Subassemblage from within a more extensive structure.

Yodel Type
1A
1B
Yodel Type
2A
2B
Yodel Type
3A
3B
Connection Type
Web cleal
Pinned
Connection Type
Web cleat
Pinned
Connection Type
Web cleal
Pinned
Failure Load (kN)
558.0
554.0
Failure Load (kN)
508.0
31B.O
Failure Load (kN)
502.0
316.0
Figure 2.4: Predicted failure loads for analytical models ~mploying different boundary conditions.
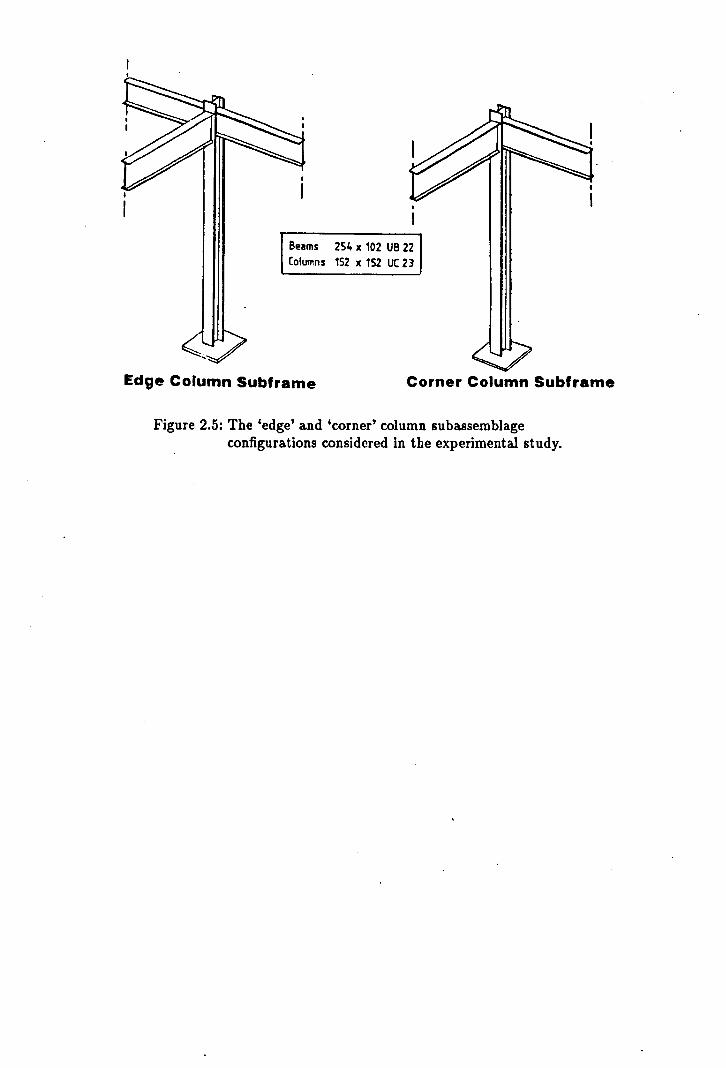
Beams 254 x 102 US 22 (olumns 152 x 152 UC 23
Edge Column Subframe Corner Column Sub frame
Figure 2.5: The 'edge' and 'corner' column subassemblage configurations considered in the experimental study.

I-r __ l_54_2 __ -+-+..-__ 15_42 __ -I-i r 1459 ,
~II I ~: ~' 254. 102 VB 22 ~ i:l 254 :I 102 UB 22
1----------1 Beam 3
z
X ...
t":I N
g N 10 -... N 10 -
~ 254 :I 102 UB 22
h---------I
I Beam 1 I
/ Centreline of beft m support bearings.
I
I I
y
t---------l~r-
Beam 2
1 Z
N 10 -
I I
I
Figure 2.6: General arrangement of the three beam subassemblage.
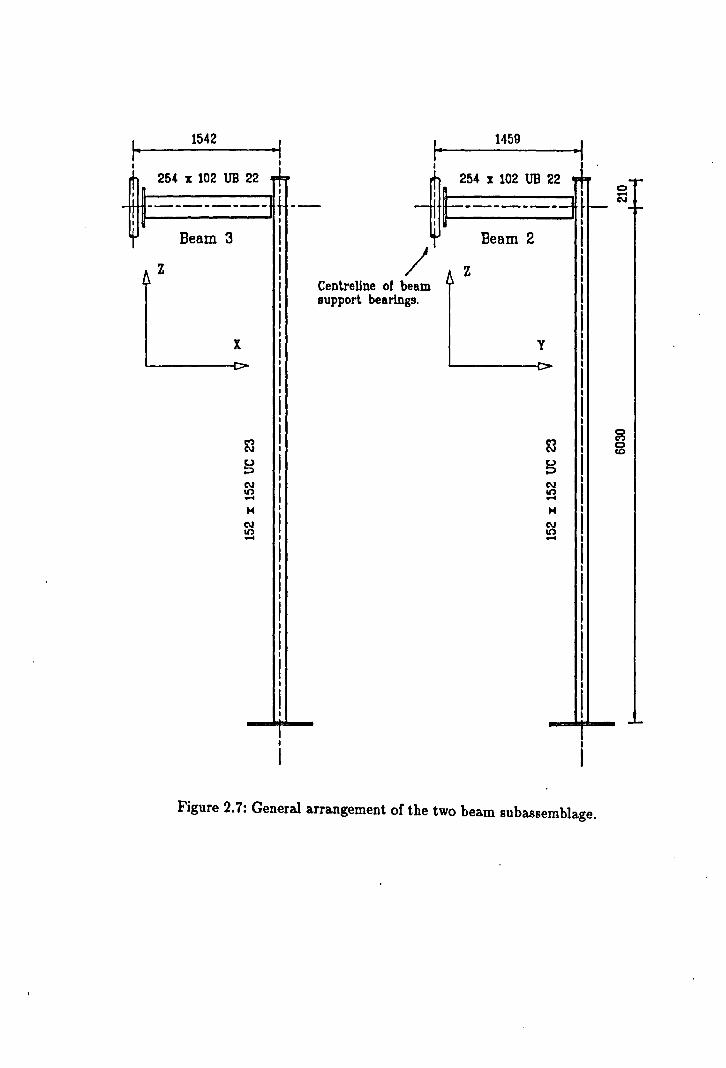
I.. 1542 .1 I_ 1459 _I I .
254 x 102 UB 22 ~ -I; ---------It--~ Beam 3 ! l
' 254 x 102 UB 22 m 0
I I .....
t----------l ~f- N
I I
j Z
x ...
I I
I I
I , I , I , I ,
~ ! g I N 10 .....
N 10 .....
I
Beam 2 I / i
J Z I Centreline of beam I support bearings.
y
~ u ~ N 10 ..... H
I N It) ..... I
1 I
I I
I , I I
1 I
I I
I I
I
Figure 2.7: General arrangement of the two beam subassemblage.
~ ~
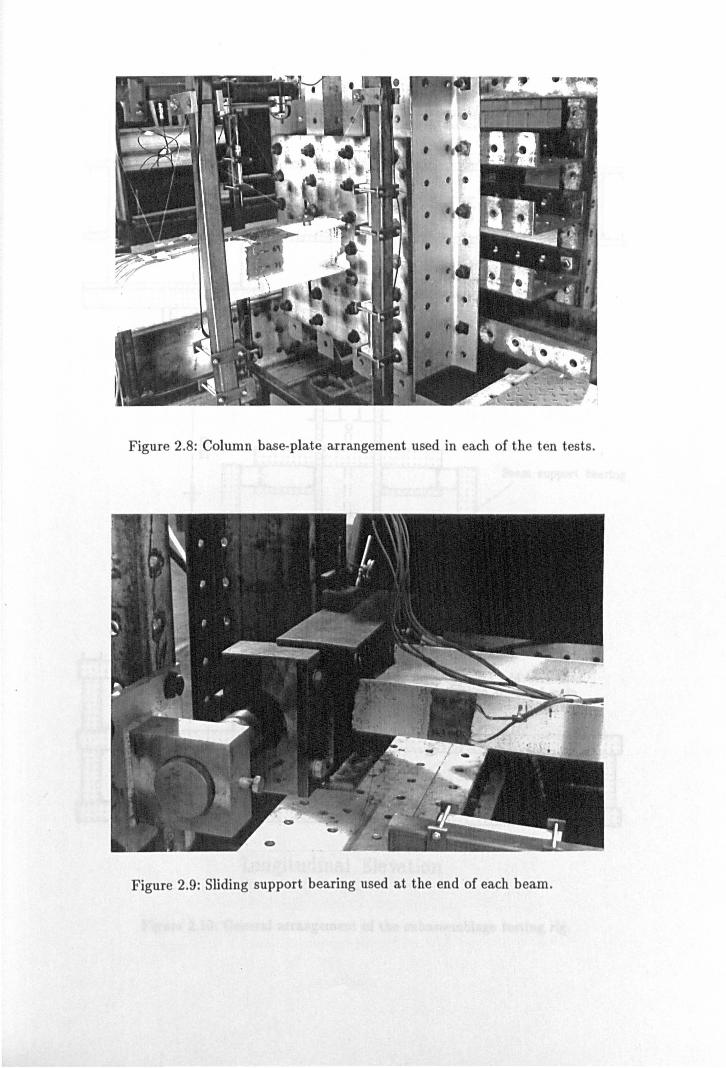
Figure 2.8: Column base-plate arrangement used in each of the ten tests.
Figure 2.9: Sliding support bearing used at the end of each beam.

I I
A
I
9000
Subassemblage profile shown dashed .
••• It' to. tt ••••••••• ,. t •• 0 •• I •••••• It •• O. t •••••• to' •••• I ••
~------------------~-------------------I I
~ All members 305 I 102 RSC bolted together uslng 20mm diameter High Strength Friction Grip bolts.
A Plan at 900mm level
o
".., •• ~ •• :-::-.,:",,:, •• ~ •• -:-I.: •••••••• : •••••••••• . . . . . . . . ". ....... .., ....... . • • t •••••••• It ••••• '0 Of. II ., ••• · . · . Beam support bearing
· II . ~~~ .......... .
~
1450 + 1000 "r 1450
Section A-A
L ..1
"
t •• , •• II •• II •••• It ••••••• , t. 'I • •••••••••••••••••••.•.•••••. ~ I Nine bolls in a 9x3 grid were used
at the intersection points of main vertical and horizontal members.
rl :::- ~ II ~Hj~
... .J ................. 1··1 .......... · .. • .. • ........ ·.. ..... ................ .. •.• ~ I· .. . . . . . . . . . . . . . .. .. . ....................................... , .......................... .
• It'''' ••••• t •• II. I, •• I •• , .1 •• II ••••• I •••••••••••••••••••••••••• , ••••• " ••••••••• I •••• I •••
::: I I :r:. ~ :: : ::: ... ~ LJ ... . .. ~ ... ... ... ... . .. . ,. c-- ~ -----------------.., ... ~ ... ::: __ ;..:~--------------___ ..J:::~::: ... ::: :.;'..1 ::: :::
{
: • • • • • • • • • • • •• • ••••••••• I ••• I •••••••••• I • •• ••• •• • • • • • • • • • • • • • • • • • • •• • •••• , ••••• :1 · ........................................................................................ . • ••••••••••••• I. ,., •••••••••••••••••••••••••••••••••••••••••••••••••••••••••••••••••••••• I
Longitudinal Elevation
Figure 2.10: General arrangement of the subassemblage testing rig.
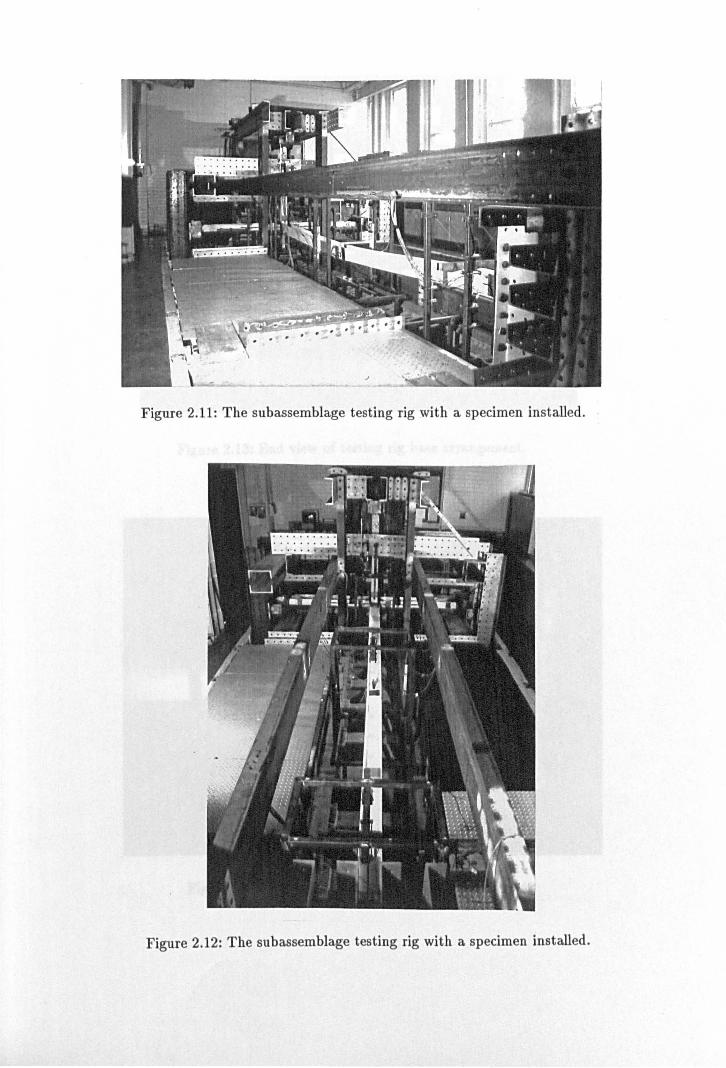
Figure 2.11: The sub assemblage testing rig with a specimen installed.
Figure 2.12: The sub assemblage testing rig with a specimen installed.
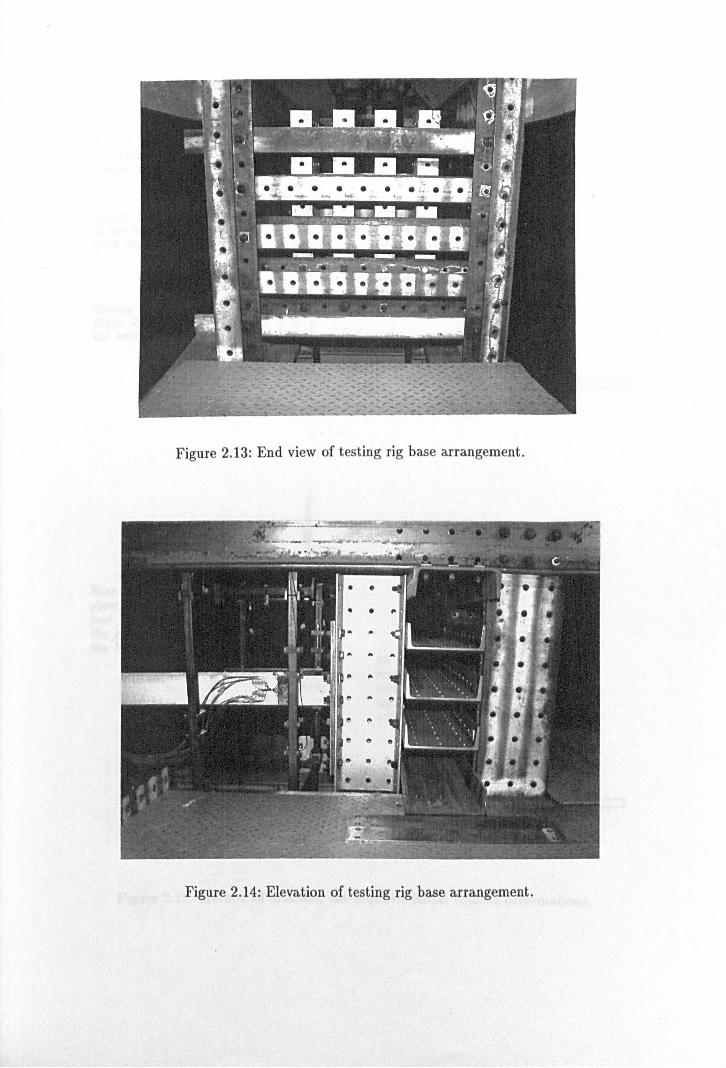
Figure 2.13: End view of testing rig base arrangement.
Figure 2.14: Elevation of testing rig base arrangement.

A small eccenlric 'nip' load WIlS applied to hold lhe colwnn firmly in position.
Column specimen WIlS placed . in the lesl rig wilh the base
plale boIled in position.
Column section cul with a slighl (2mm) chamfer al the base.
Stage 1
lfhen lhe required bow WIlS
observed at the centre, the load W8.S held constant and the column WllS welded to the base-plate
Stage 3
Increasing the column head load caused the chamfer at the base to close and deformed the column in lhe shape of an arc.
Stage 2
On removing the specimen from the lesl rig. the induced base angle Is clearly evidenl
stage 4
Figure 2.15: Method of inducing the required initial column deformations.
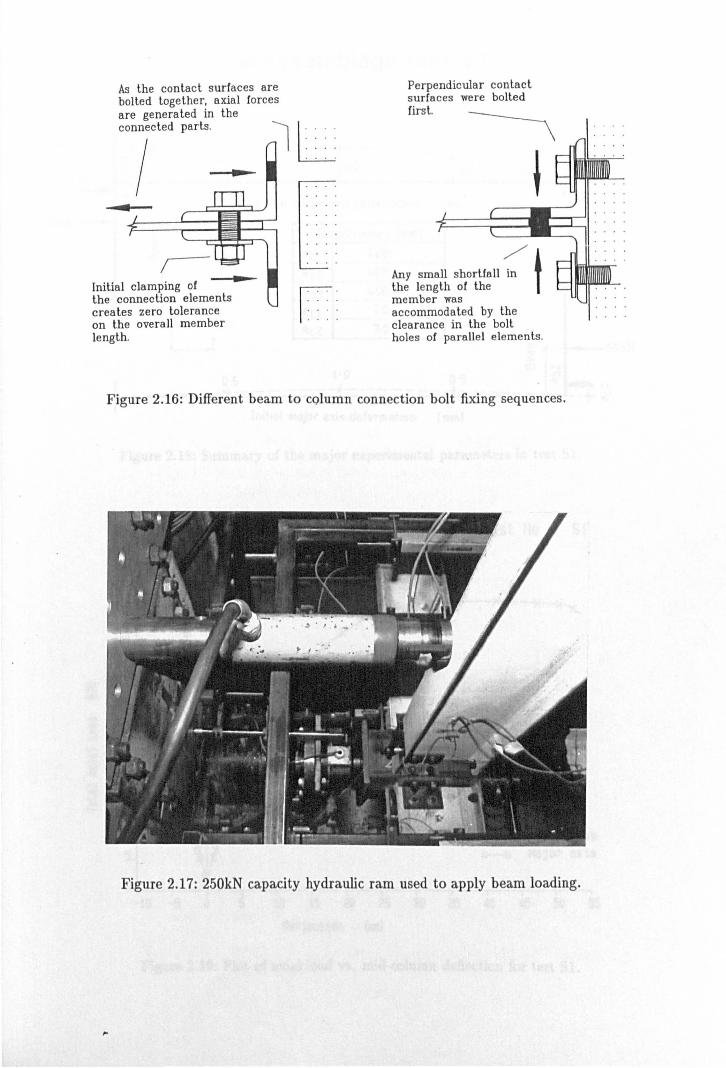
As the contact surfaces are bolted together, axial forces are generated in the connected parts.
r Initial clamping of lhe connection elements creates zero tolerance on the overall member length.
I I : : :: l i e
r: ' I:: : .
Perpendicular contact surfaces were boIled firsL
Any small shortfall :. t lhe length of the member was accommodated by the clearance in the boll holes of parallel elements.
Figure 2.16: Different beam to column connection bolt fixing sequences.
Figure 2.17: 250kN capacity hydraulic ram used to apply beam loading.
,.

5 kN - ..... ---,r-E IU CI.I
co
5ubassemblage test 51
~' ------..... ---------
~ --~ 60 --~ CI.I _--- 4·0 . 4·0 ---CI.I~~~ ______ ~ ________ ~ ________ ~ ______ -~-~
~ CI.I
Initia.1 minor axis deformation (mm) SO kN -.-t---.t- ,."
E Eccentricities (mm) :E co
eb2 400
ee2 7·0 N
fij ~.-- SOkN
z ~
'CI
"' c:o -oJ -fa ..... w ca: -"' ....... co .....
0·5 1'0 0·5 ------ -------
Initial major axis deformation (mm)
CI.I co N
.0 QI
Figure 2.18: Summary of the major experimental parameters in test Sl.
Deflection at the cQlumn centre
X10 1 50
45
40
35
30
25
20
15
10
5
0 -10 -5 0 5 10 15 20 25
Deflection (mm)
Test tJo: Sl
~ Minor axis B--£I Major axis
30 35 40 45 50 55
Figure 2.19: Plot of axial load vs. mid-column deflection for test S1.
N v
QI
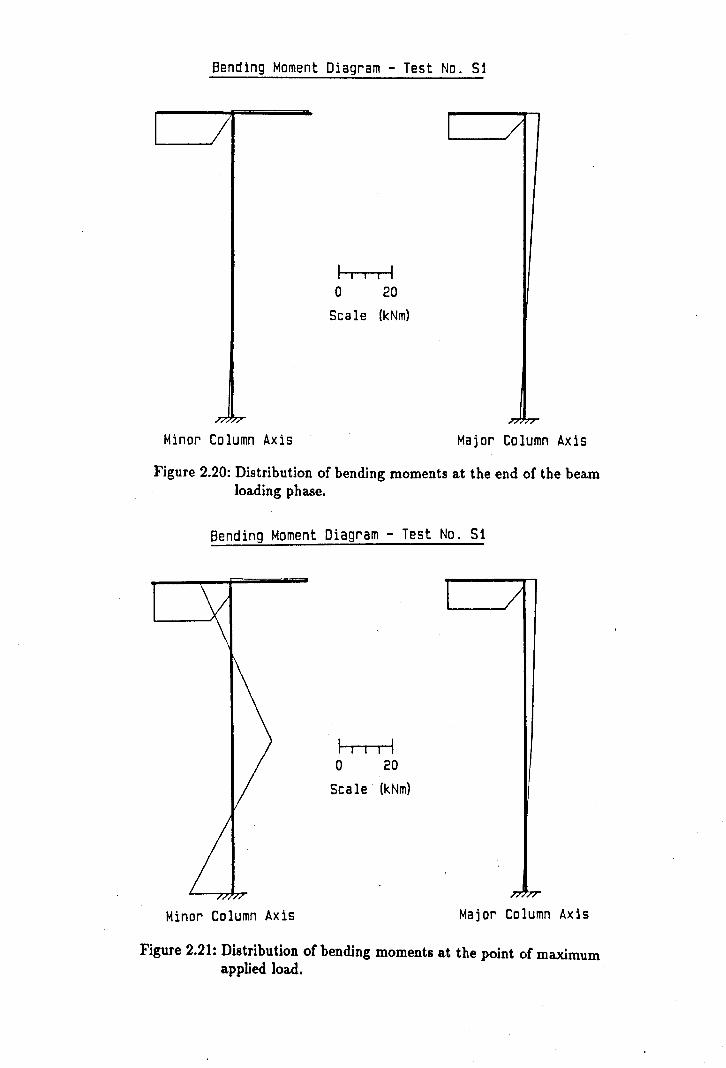
Bending Moment Diagram - Test No. 51
I I I I I o 20
Scale (kNm)
Minor Column Axis Major Column Axis
Figure 2.20: Distribution of bending moments at the end of the beam loading phase.
Bending Moment Diagram - Test No. 51
I I I I I o 20
Scale· (kNm)
Minor Column Axis Major Column Axis
Figure 2.21: Distribution of bending moments at the point of maximum applied load.
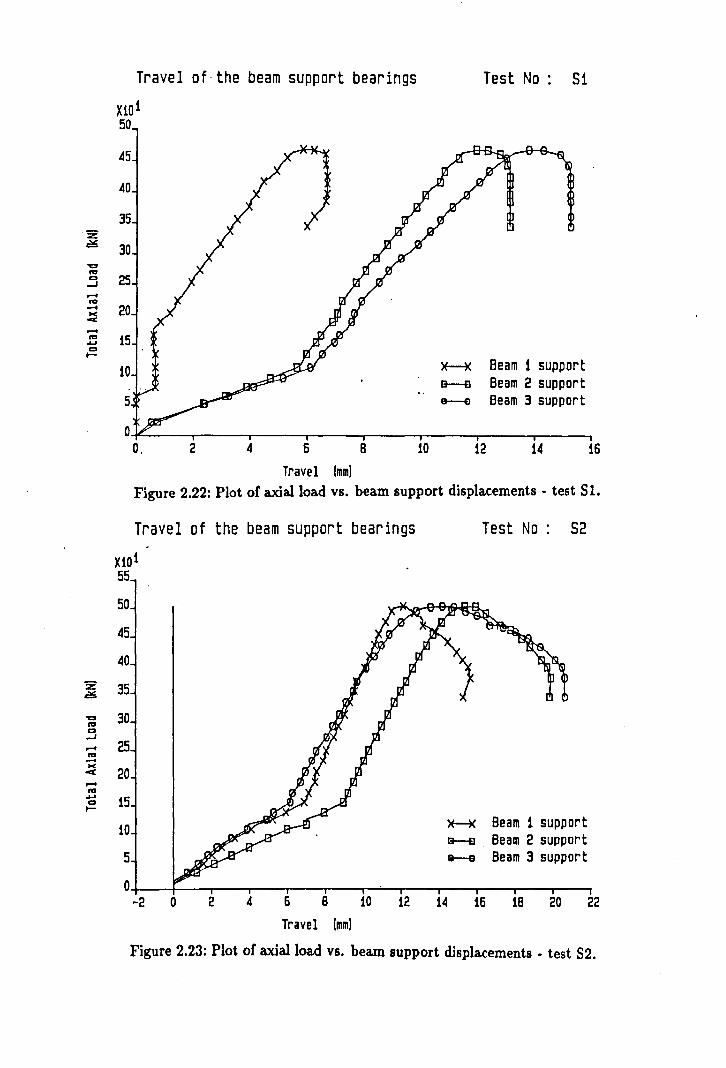
z ~
'C 1'0 D
-' -1'0 .... ~ --1'0 ....... D t-
Travel of· the beam support bearings
X101 50
45
40
35
30
25
20
15
10
5
0 0, 2 4 6 8
Travel Imml
10
Test No: 51
~ Beam 1 support 9--B Beam 2 support e--e Beam 3 support
12 14 16
Figure 2.22: Plot of axial load vs. beam support displacements. test 81.
Travel of the beam support bearings
X10 1 55
50
45
40
35
30
25
20
15
10
5
Test No: 52
~ Beam 1 support ~ Beam 2 support ca--e Beam 3 support
O+---+---r---r-~---'--~~~---r---r--'---'---' -2 0 2 4 6 8 10 12 14 16 18 20 22
Travel Imml
Figure 2.23: Plot of axial load vs. beam support displacements • test 52.
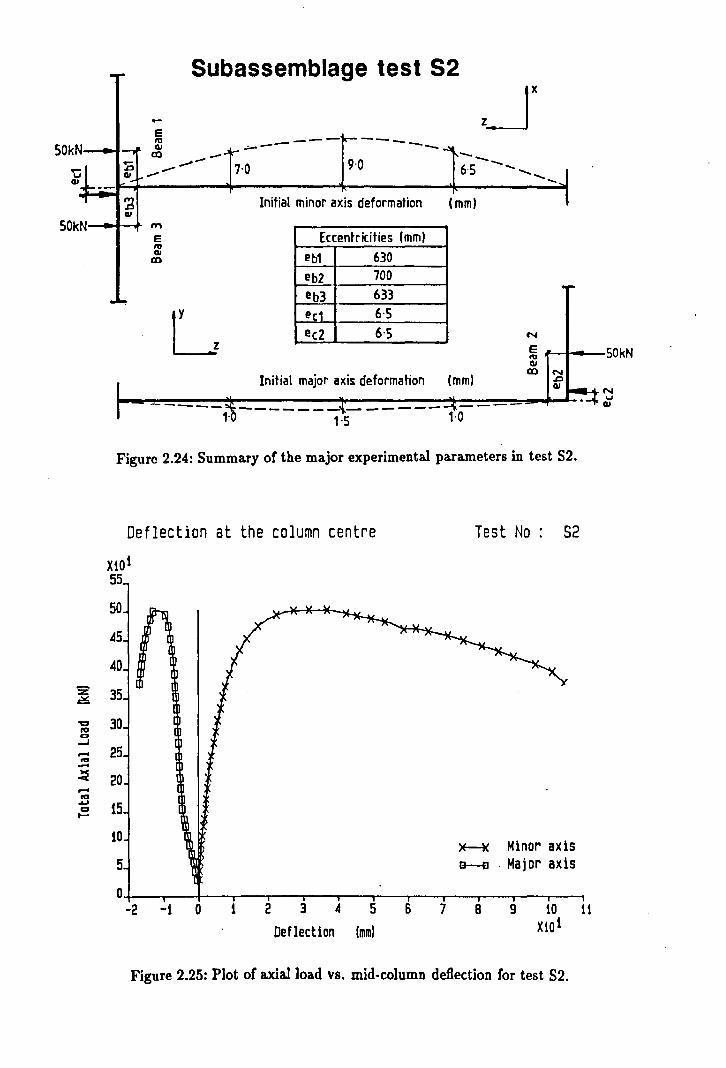
SOkN---4~-#
E IU ~
In
Subassemblage test S2
--- ----.:.- ---- -- --.
~~ ~~
"U C _-~ 7-0 9-0 6-5 --_
~~~~r-------~~~~~--~----------~-----------~ ~ Initial minor axis deformation (mm) GI
SOkN ~ E IU ~ In
Eccentricities (mml I!b1 630 eb2 700 I!b3 633 I!c 6-5 ee2 6-5 N
~ *-~-50kN
z ~
'C 1'0 c -J -"" ..... ~ -1'0 .. co t-
GI
Initial major axis deformation (mm) In
----- ------- - ----- ----1- 1-5 1-0
Figure 2.24: Summary of the major experimental parameters in test S2.
Deflection at the
X101 55
50
~5
40
35
30
25
20
15
10
5
column centre Test No S2
~ Minor axis B--e - Major axis
O+---~~--~---r--'---T---~~--~--~--~--~ __ -2 -1 0 1 234 5
Deflection (mm) 6 7 8 9 10 11
X10 1
Figure 2.25: Plot of axial load VB. mid-column deflection for test S2.
N ..., ~

Bending Moment Diagram - Test No. 52
Minor Column Axis
I I I
o Scale
I I 20
(kNm)
Major Column Axis
Figure 2.26: Distribution of bending moments at the end of the beam loading phase.
Diagram - Test No. S2
I I I I I o 20
Scale (kNm)
Minor Column Axis Major Column Axis
Figure 2.27: Distribution of bending moments at the point of maximum applied load.
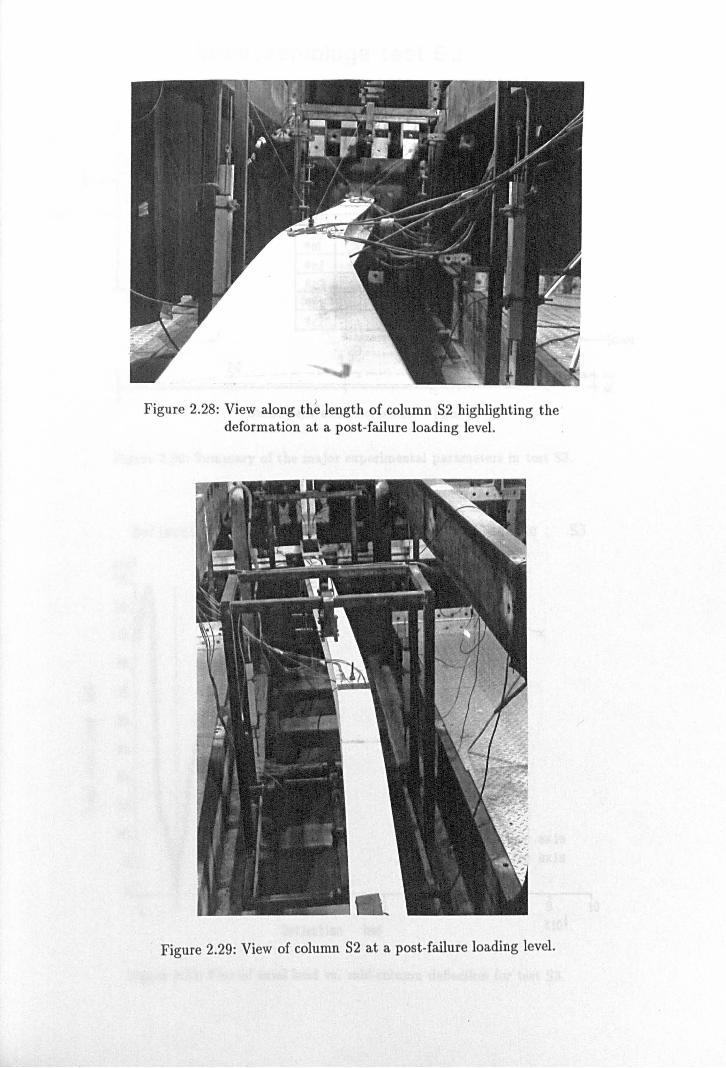
Figure 2.28: View along th~ length of column S2 highlighting the ' deformation at a post-failure loading level.
Figure 2.29: View of column S2 at a post-failure loading level.
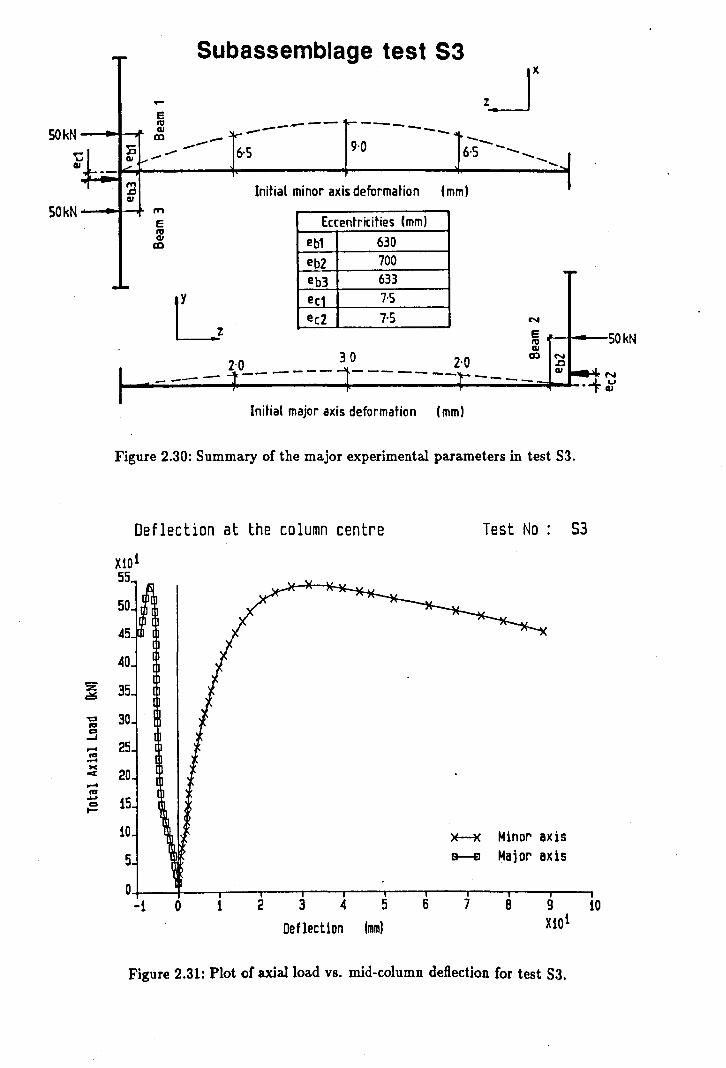
.~ Subassemblage test S3
.- Z.-JX e IV --- ~----QI -- ---m -- I.-- --E - 6·5 9·0
6·5 ----.... J -QI ~ ...... " '.-~ I ~ Initial minor axis deformation (mm) QI
SOkN
SOkN ,.., e Eccentricities (mm) IV QI eb1 630 m
eb2 700 . eb3 633 . ..
7·5 N
e SOkN IV L 7·5
QI m N
.0 QI
N ----- u
30 2.0 2·0_----- ______ _ ---QI
Initial major axis deformation (mm)
Figure 2.30: Summary of the major experimental parameters in test S3.
Deflection at the column centre Test No S3
XlO i 55
50
45
40
z 35 ~
"CO 30 I'D co
...J .... 25 ... ..... ~
20 ...: .... I'D ~ 15 c::I t-
iO ~ Minor axis 5 G--£J Major axis
0 -i 0 1 2 3 4 5 6 7 B 9 10
Deflection Imml Xi01
Figure 2.31: Plot of axial load vs. mid-column deflection for test S3.

Bending Moment Diagram - Test No. 53
I I I I I o 20
Scale (kNm)
Minor Column Axis Maior Column Axis
Figure 2.32: Distribution of bending moments at the end of the beam loading phase.
Bending Moment Diagram - Test No. S3
I I I I I o 20
Scale (kNm)
Minor Column Axis Major Column Axis
Figure 2.33: Distribution of bending moments at the point of maximum applied load.

- - . Figure 2.34: The head of column S4 showing the two intersecting beams.
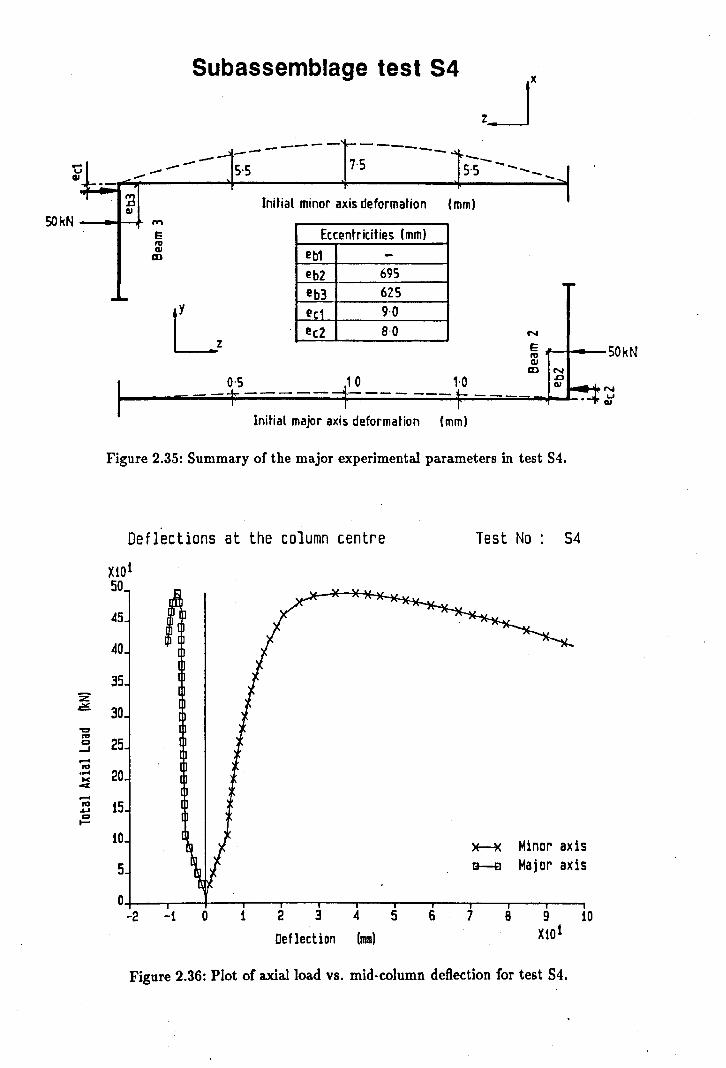
5ubassemblage test 54
----- r-------- --.--....=.. ---~1- -- 5·5 7·5 5·5 ----_ J --'. ~ Initial minor axis deformation (mm) I
III
SOkN ,.,... E Eccentricities (mm) tV GI eb1 CD -
eb2 695 . . - eb3 625 ec 9·0 ee2 8·0 N
E 50kN tV GI
CD N .0 GI
N u
0'5 10 1·0 ----- ---- ---
GI
Initial major axis deformation (mm)
Figure 2.35: Summary of the major experimental parameters in test S4.
Deflections at the column centre Test No S4
Xl01 50
45
40
35 z ~ 30 'C reo c 25 ...J ..... reo ..... 20 w -< ..... '" 15 .... co t-
10 ~ Minor axis
5 a--e Major axis
0 -2 -1 0 1 2 3 4 5 6 7 8 9 10
Deflection Imml X1Ql
Figure 2.36: Plot of axial load vs. mid-column deflection for test S4.
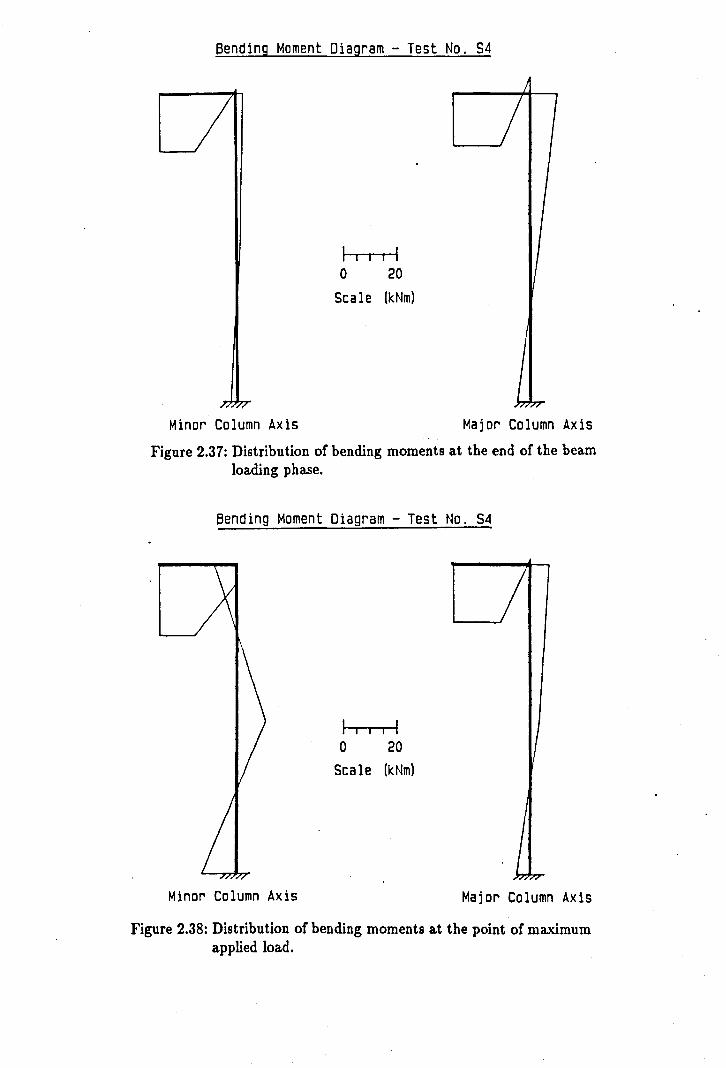
Bending Moment Diagram - Test No. S4
Minor Column Axis
I I I
o Scale
I I 20
(kNm)
Major Column Axis
Figure 2.37: Distribution of bending moments at the end of the beam loading phase.
Bending Moment Diagram - Test No. S4
Minor Column Axis
I I I
o Scale
I I 20
(kNm)
Major Column Axis
Figure 2.38: Distribution of bending moments at the point of maximum applied load.
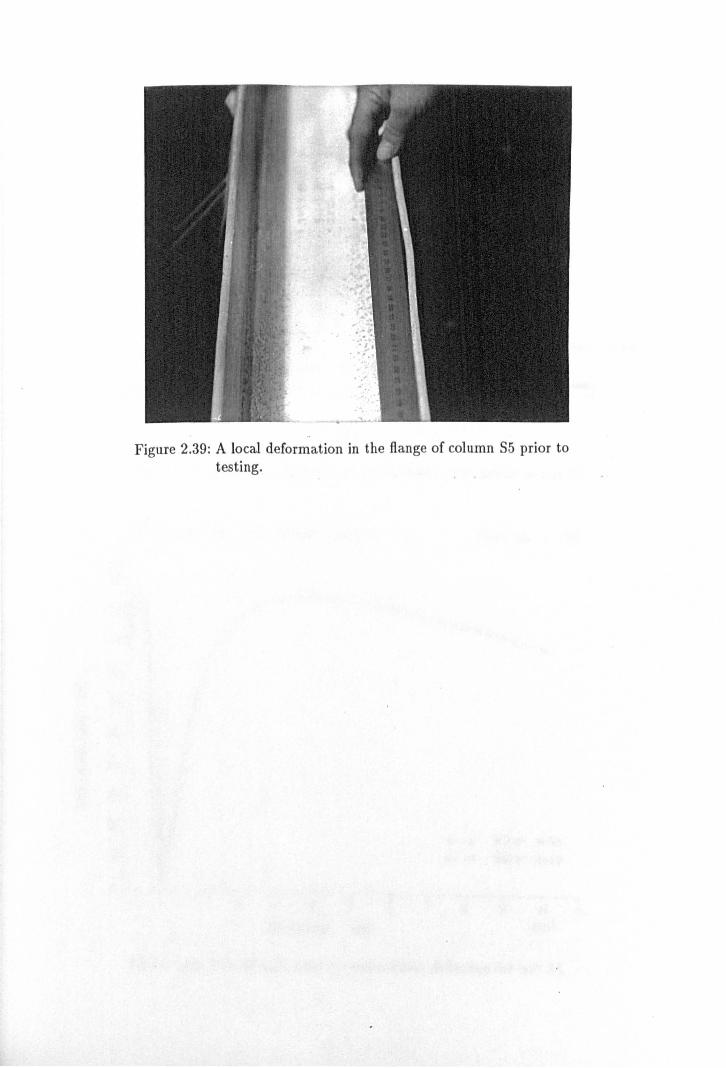
Figure 2.39: A local deformation in the flange of column S5 prior to testing.

Subassemblage test S5 ~' - !
30kN - ..... -7f-
E ttl ~
en lO 30
60kN
'C
"' co -' ..... '"
----- 4-<l - - - - - -- -----__ -----~ Initial major axis deformation (mm) cu
,."
e Eccentricities (mm) a: eb1 617 en
eb2 708 eb3 637
ec 10'0 ec2 0·0 N L e
ttl 1--~-30kN ~
Initial minor axis deformation (mml co
-------- 9-0 6·S ---,"'" ----7-0
------ - ---------Figure 2.40: Summary of the major experimental parameters in test S5.
Defiectlon at the column centre
Xl0l 50
45
40
35
30
25
Test No S5
...... 20 ~ ..... '" .... CI ....
15
10
5 ~ Minor axis a--e Major axis
O+---r--.---.--.---~--r-~--~--~--~--__ __ -1 0 1 2 3 4 5 6 7 B 9 10 11
Deflection (mm) Xl0 1
Figure 2.41: Plot of axial load VB. mid-column deflection for test S5.
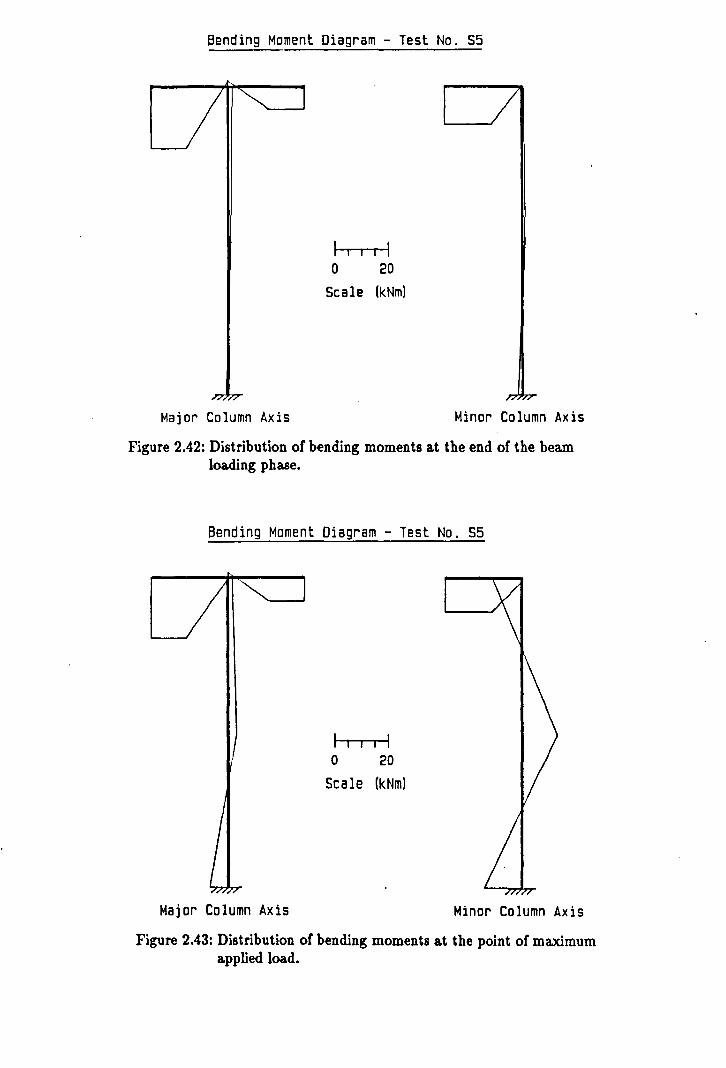
Bending Moment Diagram - Test No. S5
I I I I I o 20
Scale (kNm)
Major Column Axis Minor Column Axis
Figure 2.42: Distribution of bending moments at the end of the beam loading phase.
Bending Moment Diagram - Test No. S5
Major Column Axis
I I I
o Scale
I I 20
(kNm)
Minor Column Axis
Figure 2.43: Distribution of bending moments a.t the point of maximum a.pplied load.

Mtop
Figure 2.44: Column S5 at a post-failure level of load illustrating the reverse curve deflected shape of the column.
Effective Length
Zones where paint was displaced due lo compression yielding of the sleel.
1000 800
-600
3000
Figure 2.45: Diagrammatic view of column S5 showing the regions were plasticity of the steel caused the shedding of paint from the member surface.
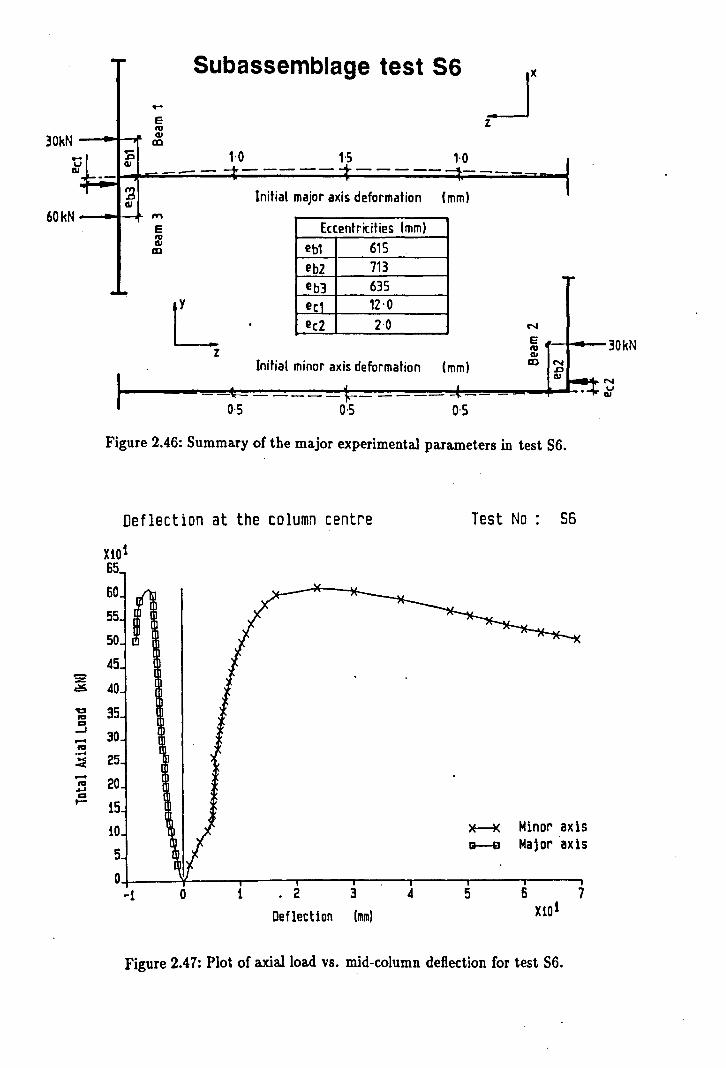
30kN
~I'- -
60kN
z .::t=.
~ .., CI -' ..... .., .... .... -< ..... .., ..... CI t-
.~ u assem age es ~' ....
E Z IV
S b bl t t S6
C1I CD
E 1·0 1·5 1·0 J C1I -- -+-----+-----~--I ~ Initial major axis deformation (mm)
C1I ,."
E Eccentricities Imm) IV C1I eb1 615 CD
eb2 713 . -.. eb3 635
ec 12·0 ee2 2·0 N L
z ~ l-t--30kN
Initial minor axis deformation
0·5 0·5
(mm)
0·5
C1I CD
Figure 2.46: Summary of the major experimental parameters in test S6.
Deflection at the column centre Test No 56
HOl 65
60
55
50
45
40
35
30
25
20
15
10 ~ Minor axis
5 Ir-EI Major axis
0 -1 0 1 . 2 3 4 5 6 7
Deflection (mm) Xl0l
Figure 2.47: Plot of axial load vs. mid-column deflection for test S6.
N u
C1I

Twist rotation at the column centre. Test No:' 56
Xl01 65
60
55
50
45 ·z
=: 40
"" 35 ... g
-oJ 30 --' ... . - 25 0< -:c
--' 20 ... .... co t-
15
10
5 )f-4( Twist
0 0 .. 1 2 3 4 5 6 7 B 9
Twist (radiansl Xl0-2
Figure 2.48: Plot of axial load VS. mid-column twist - test S6.

Bending Moment Diagram - Test No. S6
I I I I I o 20
Scale (kNm)
Major Column Axis Minor Column Axis
Figure 2.49: Distribution of bending moments at the end of the beam loading phase.
Bending Moment Diagram - Test No. 56
Major Column Axis
I I I
o Scale
I I 20
(kNm)
Minor Column Axis
" , Figure 2.50: Distribution of bending moments at the point of maximum applied load.
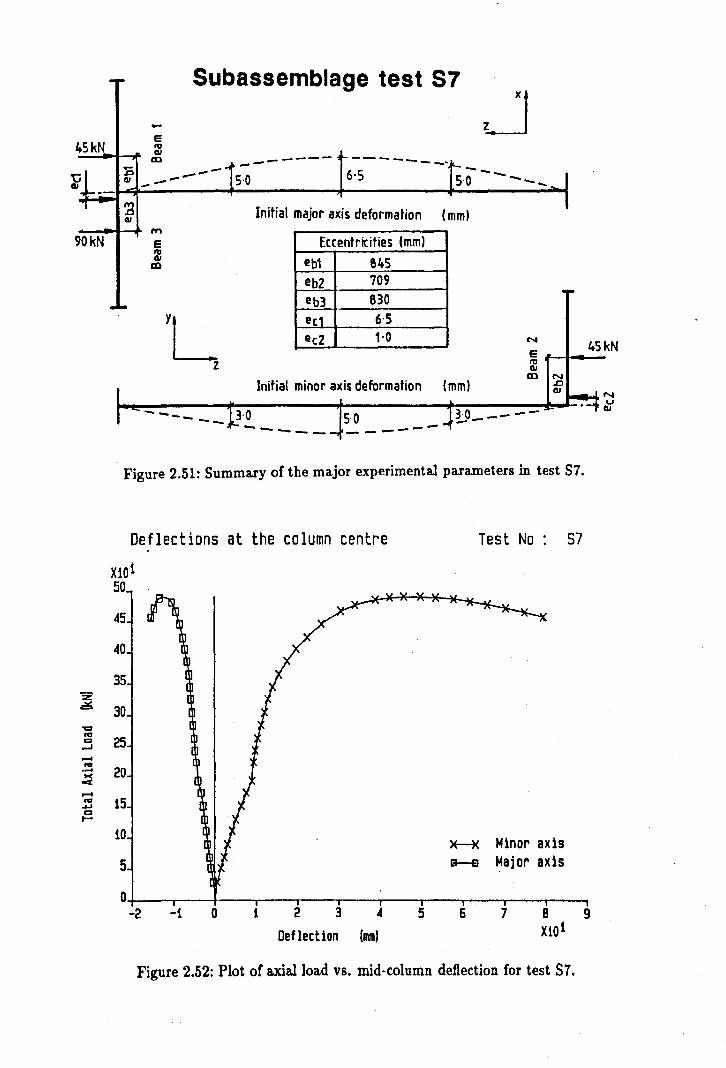
4SkN
90kN
Z Ii!!i
'CI
"' CI -' ..... ftI .-w
cC
..... ftI
.&.I CI t-
Subassemblage test S7
~ ... E IV GI
CD -------- -------' E GI ---- -- 5·0 6'5 ---~ Initial major axis deformation (mm) CII
,."
e Eccentricities (mm) IV GI eb1 645 CD
eb2 709 eb3 830
YL ec 6·5 ee2 1·0 N
e z IV
GI CD
Initial minor axis deformation (mm)
------ 3·0 S·O LO---- ------ ----_ ....
Figure 2.51: Summary of the major experimental parameters in test S7.
25
20
15
10
5
0
Deflections at the column centre
-2 -1 0 1 2 3
Deflection
.t
(mml
5
Test No
>+---K Minor axis &-EI Major axis
6 7
57
Figure 2.52: Plot of a.xialload VB. mid-column deflection for test S7.
4SkN
N u
GI
9
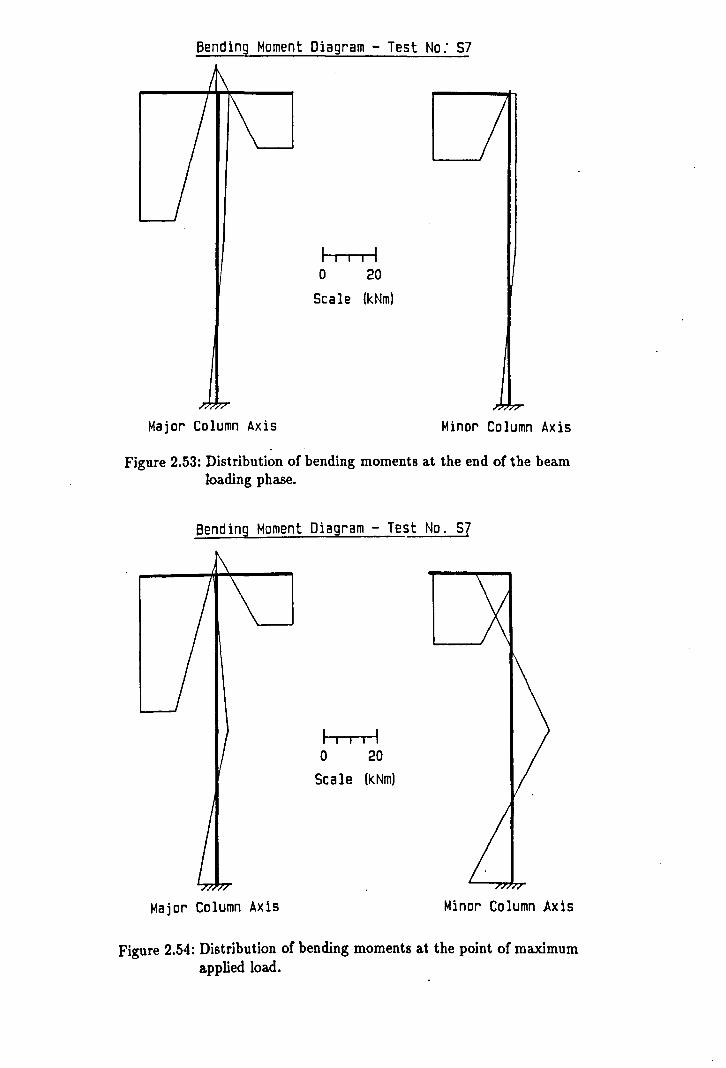
Bending Moment Diagram - Test No: S7
I I I I I o 20
Scale (kNm)
Major Column Axis Minor Column Axis
Figure 2.53: Distribution of bending moments at the end of the beam loading phase.
Bending Moment Diagram - Test No. S7
I I I I I o 20
Scale (kNm)
Major Column Axis Minor Column Axis
Figure 2.54: Distribution of bending moments at the point of maximum applied load.
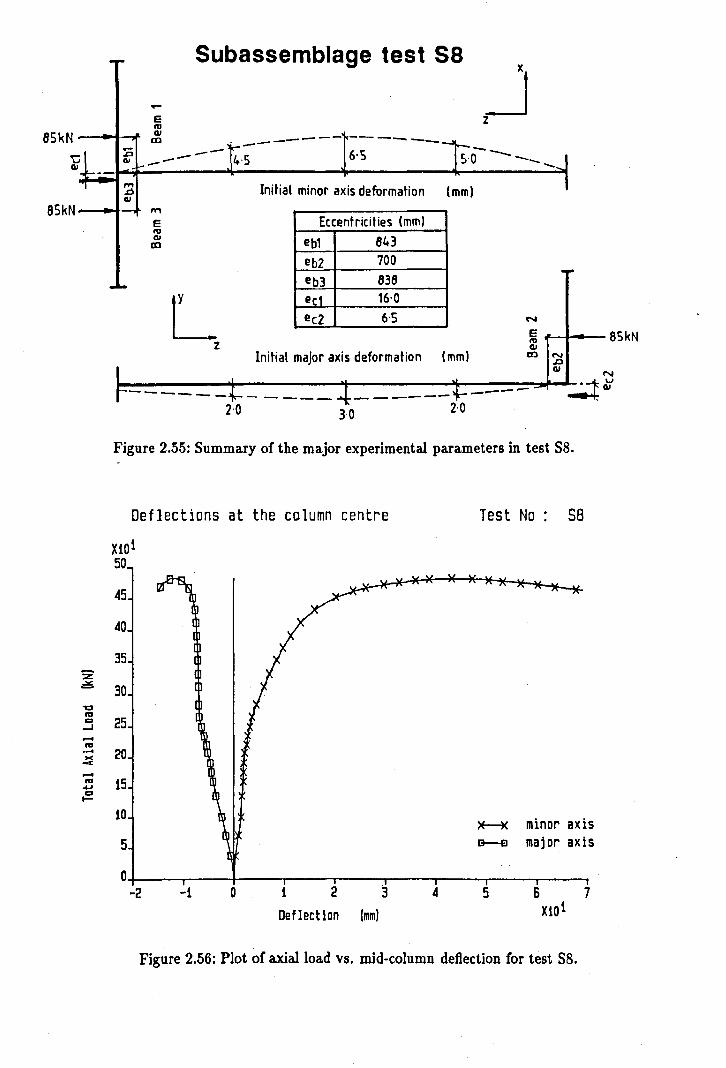
85kN-"-"~
e 10 CII m
Subassemblage test S8
----- - -- - --- ---E ----
tj CII _-- 4-5 --_ CII~~~ ______ ~~ _______ +-______ ~~ ______ ~ 6-S
~ Initial minor axis deformation (mm) GI
85kN -.-t-.t- ,., e 10 GI
!Xl
Eccentricities (mm)
eb2 700
eb3 838
ec 16-0
eel 6-S N L e IV ~'--8SkN
'2 .= "CI IV co -I -IV ..... ~ -z: -IV ..... co t-
z CII
Initial major axis deformation (mml m
N
~----------------~----------~----------~-------~-~~~~.~~ ----- ------ ~ 2-0 lO 2-0
Figure 2.55: Summary of the major experimental parameters in test S8.
Deflections at the column centre
Xl01 50
45
40
35
30
25
20
15
10
5
0 -2 -1 0 1 2 3
Deflection (mm)
4
Test No' 58
~ minor axis G--e major axis
5 6 7 Xl0 1
Figure 2.56: Plot of axial load vs. mid-column deflection for test S8.

Bending Moment Diagram - Test No. 58
Minor Column Axis
I I I
o Stale
I I 20
(kNm)
Major Column Axis
Figure 2.57: Distribution of bending moments at the end of the beam loading phase.
Bending Moment Diagram - Test No. 58
Minor Column Axis
I I I
o Stale
I I 20
(kNm)
Major Column Axis
Figure 2.58: Distribution of bending moments at the point of maximum applied load.

~' e _--------_ z
-,.. 5ubassemblage test 59
.-to __ -- __
95kN -..-t----tf- QJ 1<"-- ~-CD _- 100 - ..... _
Xi -- 6·0 . 8·0....... J QJ~-- '~
(mm) ,
~ Initial minor axis deformation QJ
95kN --r""" ,."
z ~
'C
"' 0 ....I -"' .... ~ -"' ...... 0 I-
e Eccentricities (mm) 10 QJ eb1 840 CD
eb2 697 -.~ eb3 840
L E!c 13·5
eel 8·5
z
N
~ tI---t-e- 95kN QJ
CD N .D Initial major axis deformation (mm) QJ
~~----~--------~--------~--..... ---~-~~.~~ --- -------~------ --- ~ 2·0 3-0 ·0
Figure 2.59: Summary of the major experimental parameters in test S9.
Deflections at the column centre
X101 55
50
45
40
35
30
25
20
15
10
5
0 -3 -2 -1 0 1 2
Deflection Imml
Test No' S9
)E--)( Minor axis B-£J Major ads
3 4 5 6 Xl01
Figure 2.60: Plot of axial load V8. mid·column deflection for test S9.
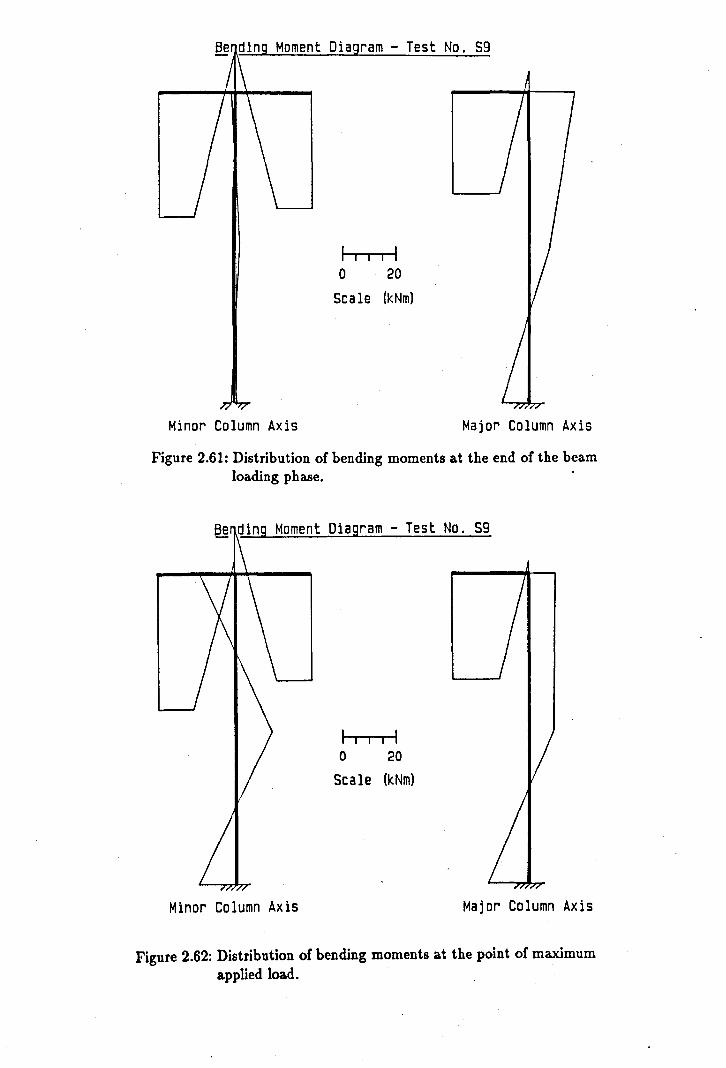
Moment Diagram - Test No. S9
Minor Column Axis
I I I
o Scale
I I 20
(kNm)
Major Column Axis
Figure 2.61: Distribution of bending moments at the end of the beam loading phase.
Moment Diagram - Test No. S9
Minor Column Axis
I I I
o Scale
I I 20
(kNm)
Major Column Axis
Figure 2.62: Distribution of bending moments at the point of maximum applied load.

z ~
-= "' C -J ..... "' .-~ ..... "' ..... c ~
.... e IU QI en
-,."
e IU QI
en
, Subassemblage test S10
-----.-----.------_--~ 4·0 7·0
Initial minor axis deformation (mm)
Eccentricities (mm)
eb1 840 eb2 696 eb3 840
'L ec 15'0 ee2 4'0
z 2·0 3'0 2·0 -------------- -
z.J -----
N 132kN e
IU GI en N
.D GI
N ----- -- ;..taY Initial major axis deformation. I (mm)
Figure 2.63: Summary of the major experimental parameters in test 510.
Deflections at the column centre Test No . S10
Xl01 55
50
45
040
35
30
25
20
15
10 ~ MinD,.. axis
5 B-£J Major aXis
0 -3 -2 -1 0 1 2 3 5 6 7
Deflection Imml XlOI
Figure 2.64: Plot of axial load VB. mid-column deflection for test 510.

Bending Moment Diagram - Test No. 510
I I I I I o 20
Scale (kNm)
Minor Column Axis Major Column Axis
Figure 2.65: Distribution of bending moments at the end of the beam loading phase.
Bending Moment Diagram - Test No. 510
I II I I o 20
Scale (kNm)
Minor Column Axis Major'Column Axis
Figure 2.66: Distribution of bending moments at the point of maximum applied load.

Figure 2.67: Column S10 under a post-failure level of loading.
stage 1
Beam Loading
Direction of column head rotallon as the axial load Is Increased.
Stage 2
Beam and Column Loading
As failure epproaches the connection rotation reduces and can reverse sign.
Stage 3
Column Failure
Figure 2.68: Direction of connection rotations at key stages in the subassemblage loading sequence.
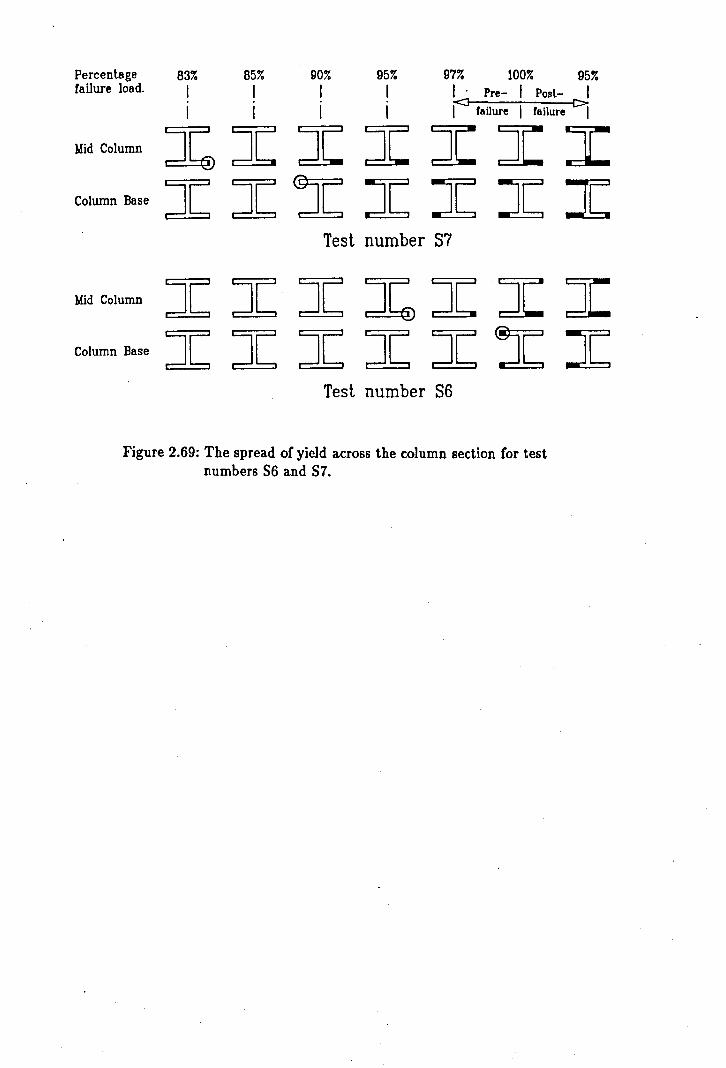
Percentage 83% 85% 90% 95% 97% 100% 95% failure load. I I I I I· Pre- I Posl- I
<I [>. I I I I I failure I failure I
~dColumn Jb I I JC I I I Column Base I I :JC I I I I
Test number S7
~dColumn I :r:. I Jb I I I Column Base I :r: I JC: JC: l: I
Test number S6
Figure 2.69: The spread of yield across the column section for test numbers S6 and S7.

Chapter 3
Subassemblage Instrumentation.
3.1 Introduction
Accurate measurement of the response of test specimens to controlled actions is funda
mental to all experimental study. The majority of the response monitoring used in the
subassemblage tests was devoted to recording the deformed shape of the sub assemblage
and assessing the forces within individual components. Due to the 3-dimensional na
ture of the experimental tests, and the relatively high level of accuracy required, careful
consideration had to be given to the way in which such responses were morutored. The
following sections report the development of the 3-dimensional force and displacement
measurement systems used in the study together with the overall subassemblage instru
mentation and data acquisition techniques employed. The specialised instrumentation
devices developed specifically for the study formed the basis of two papers [3.1,3.2].
3.1

3.2 Displacement measurement.
One of the principal objectives of the experimental study was to verify the predictions
of the sophisticated finite element computer program developed specifically to analyse
flexibly connected 3-dimensional columns [3.3]. To permit close comparison between
the experimentally observed and the analytically predicted data, it was essential that
the three-dimensional deformation of the test specimens could be monitored accurately.
However, the numerous instrumentation devices and measurement procedures which have
been developed over the years are invariably restricted to one or two-dimensional, in
plane, operation. Used on their own, such devices would be of only limited use when
monitoring full three-dimensional displacement. Therefore, before commencing any of
the sub assemblage tests, a measurement system had to be developed which was ca
pable of accurately monitoring all six possible degrees of three-dimensional movement
(6z , 6t1 , 6%, 9z , Btl, B%), and which also satisfied the operational requirements of low cost,
ease of use and relative compactness.
3.2.1 An overview of displacement measurement techniques.
It was immediately apparent that in order to satisfy the low cost requirement, the three
dimensional measurement system would have to incorporate readily available instru
mentation devices. A thorough study was therefore made of measurement devices and
measurement techniques which have been used successfully by experimental researchers
in the past.
One of the most fundamental measurement devices used in experimental studies is the
dial gauge. This simple, but relatively accurate device has been used by a number of
researchers to monitor the mid height deflections of steel columns [3.4]. In experimental
3.2
work carried out by Birnstiel on the biaxial behaviour of 'H' columns [3.5], nine dial
gauges were used to monitor both the in-plane and out-of-plane displacements of each of
the four flange tips at the mid-height of the column. By applying geometric principles
the twist rotation could be determined in addition to the overall major and minor axis I
deflections.
A number of researchers have used surveying techniques to determine the deformation
of test specimens. In experimental studies on the moment-rotation characteristics of
bolted end-plate connections [3.6], plane mirrors were used in conjunction with surveying
theodolites to amplify the observed connection rotations. A similar method was used by
Gent and Milner [3.7] to monitor the very small end rotations of a series of model test
columns.
Devices which have been used to give a direct measure of rotation include the level gauge.
This device is basically a spirit level mounted on an adjustable bracket which is rigidly
clamped to the test specimen. After a rotation has occurred, a micrometer screw is
adjusted to re-align the 'spirit bubble' back to its level starting position. A measure of
the absolute rotation which has occurred can then be read directly from a calibrated
scale. This simple but effective device was used in a study of the performance of a series
of pinned-end steel columns [3.4].
The one major disadvantage of the above devices is that data had to be recorded man
ually. The manual collection of large amounts of data is not only labour intensive, but
can be prone to human error. The development of micro electronics and computers since
the time of these experiments has meant that large amounts of experimental data are
now invariably recorded electronically and automatically.
Electolytic level gauges were used by Wood et al [3.8] to measure rotations in an exper
imental investigation into the behaviour of multi-storey, multi-bay, rigidly jointed steel
frames. Using this device, the change in the electrical resistance caused by a bubble of
3.3
air travelling through an electrolytic solution could be monitored automatically. The
position of the bubble, and hence the measured resistance, were directly related to the
magnitude of rotation which had occurred. A complete appraisal of the operating char
acteristics of the electrolytic level gauge, also known as the 'Electrolevel', are presented
in reference 3.9.
Recent studies at the Building Research Establishment on the behaviour of two dimen
sional steel frames [3.10], used a hanging dumb-bell rotation device. The dumb-bell was
connected to the test specimen via a thin strip of spring metal. Rotations were calculated
from measurements of the flexural strains in the metal strip as the specimen rotated rel
ative to the dumb-bell. Although accurate, both this device and the electrolytic level
gauge each use gravity as a reference datum. Obviously, in a situation were the principal
rotations occur in a plane normal to the direction of gravity, such measuring devices are
inappropriate.
An interesting displacement measurement system was used in a full-scale study of the in
situ performance of 'Z' purlin roofing systems [3.11]. Remotely controlled video cameras
monitored the shifts of two target markers on a transparent armature which was fixed
to the face of a 'Z' purlin. The change in position of the markers relative to a fixed
reference background enabled the displacements and twist rotations of the purlin to be
calculated. This elaborate method of remote monitoring was a safety precaution as the
roof tests were potentially dangerous.
In experimental studies ofthe performance of plate girders [3.12], three L.V.D.T.'s (Lin
ear Voltage Displacement Transducer) were combined to provide a single device capable
of measuring displacements 6z and 611 , and rotation 0,. The L.V.D.T.'s which monitored
the change in length of three strings, Ll, Lt and L9, were connected to two points on
a 'rotation bar' which was rigidly fixed to the specimen (figure 3.1). Movements of the
specimen caused corresponding movements of the 'rotation bar'. By applying simple 2-
dimensional geometric principles to the changes in string lengths, the shifts 6z and 6"
3.4
could be determined for each of the points A and B. Although the device was only capa
ble of measuring in one plane, it did have the advantage that unlike many commercially
available rotation devices, its operation was totally independent of gravity. In a recent
study of the behaviour of continuous beam-columns [3.13], five L.V.D.T.s were used in
combination to enable five components of 3-dimensional movement to be monitored. It
was considered that these particular methods of measurement using L. V.D. T. 's could be
extended to develop a measurement system capable of deciphering all six components of
full 3-dimensional deformation.
The L.V.D.T. measurement devices discussed above may be described as 'zero redun
dant' as the number of L.V.D.T.'s used equalled the number of deformation components
which could be determined. A device capable of monitoring all six components of de
formation would require a minimum six L.V.D.T.'s. However, the precise number of
L.V.D.T.'s and the manner in which they were deployed would not only affect the sensi
tivity of the device, but would also influence physical access around the specimen. The
aim was therefore to determine the optimum L.V.D.T. configuration which best suited
the experimental set-up and the required accuracy of measurement.
3.2.2 Principles of three-dimensional measurement.
There are two possible approaches to monitoring the 3-dimensional movements of an
object using L.V.D.T.'s. Firstly, measurements can be made of the 2- dimensional, in
plane, movements of an object in a manner which is not sensitive to movements in the
third dimension. This can usually be achieved by providing large distances between the'
specimen and fixed reference points. This is perhaps best illustrated by considering the
hypothetical example shown in figure 3.2 in which an L.V.D.T. is monitoring the change
in length of a. cord of length L connecting specimen object A to fixed reference point
3.5

B. If the initial distance between points A and B is relatively small then for movement
6~ and 6, of point A , the new cord length, L' , will be larger than L + 8~. The out
of plane movement, 6" is therefore significant and it is not possible to determine either
the 6~ or 6" components of movement from this single length measurement. If however,
the initial distance between points A and B is increased, the effect of the out of plane
shift, 6", is reduced. For large values of L, the out of plane effect becomes insignificant
and the revised chord length will be approximately equal to L + 6~. Measurement of the
change in length of the chord will therefore provide a close approximation of the shift in
the x-direction at point A •
Although this principle could be extended to derive all the degrees of movement associ
ated with three-dimensional deformation, the large lengths required between the speci
men and reference points would have severely restricted access in and around the test rig.
An alternative principle was therefore sought which could determine the 3-dimensional
movements of the specimen in a more direct manner.
The general formula for the distance L between two points, Al and A2 , defined with
respect to Cartesean axes Z,y and z, is given by [3.14]:-
(3.1)
It can be shown that if the distance of a general point A (z,y,z) is known from three
different fixed points, then the z, 11 and z co-ordinates of point A can be determined.
If the distance of the three fixed reference points PI, P2 and P3, from the general point
A (z,y,z), are LI,L2 and L3 respectively, then:-
L~ = (z - ZI)2 + (y - YI)2 + (z - ZI)2
L~ = (z - Z2)2 + (y - Y2)2 + (z - Z2)2
3.6
(3.2)
(3.3)

(3.4)
If the points, P},P, and P3 , are given the co-ordinates (0,0, b), (-a, 0, 0) and (a,O,O)
respectively, as shown in figure 3.3, then the above equations can be simplified to:-
L~ = z2 + y' + (z - b)2
L~ = (z + a)2 + y2 + z2
L~ = (z - a)2 + y2 + z2
(3.5)
(3.6)
(3.7)
The unknown z,y and z, co-ordinates of a point A can be easily derived by simultane
ously solving the above equations.
L~ -L~ Za = -=---=
4a (3.8)
1 (L~ 2 L~ 2 2 ) Za = 2b -2 - Ll + -2 - (a - b ) (3.9)
the 11 co-ordinates can be determined by back substituting the known z and z co-ordinates
into eqn. 3.7
(3.10)
It is therefore possible to determine the position, and hence the shift, in three dimensions
of a point by monitoring its distance from three fixed locations. Experimentally this can
easily be achieved by using three L.V.D.T.'s to monitor the length of three cords which
connect a single point on a specimen to the three reference points Ph P3 and P3 •
To monitor all three possible rotations Oz, OJ! and 0" the z, 11 and z co- ordinates of
a minimum of three non co-linear points must be known. Figure 3.4 shows how these
three connection points A , Band C were located around the measurement point on the
specimen. Points A and B were principally required to monitor the in-plane and out-of
plane rotations, whilst point C was required to monitor the twist. The distances h, " and
3.7

1 were maximised to increase the relative displacement between the connection points,
and hence improve the sensitivity of the device. The two rotation bars were fixed in the
centre of the upper and lower flanges and as a result, their movement was less affected
by any local flange distortions which may occur. This compares with the method used
by Birnstiel, described previously, where the displacement of the section was monitored
at the flange tips in which the presence of local flange distortions could be significant.
At first sight, it would appear that a total of nine L.V.D.T.'s would be required to derive
the x, 11 and z co-ordinates of the three attachment points A , Band C, and hence the full
3-dimensional movement of point X. However, the distances between attachment points,
h, I' and 1 and the subtended angles remain fixed. This constant geometric relationship
effectively reduces the number of unknown co-ordinates, the number of equations to be
solved and hence the number of L.V.D.T.'s required. This can be illustrated by consid
ering figure 3.5 which shows a diagrammatic representation of the horizontal rotation
bar. For a fixed armature length, I, the z offset of point B can be expressed as:-
(3.11)
If the co-ordinates of point A are known, i.e. by adopting a three L.V.D.T. measurement
device as discussed above, then the z co-ordinate at B can be determined directly from
co-ordinates XB and 1IB. There are therefore only two unknown co-ordinates at B, and
as a result only two further L.V.D.T.'s are required. A similar principle can be used
to show that for a known in-plane member rotation, co-ordinates XA,1IA and ZA and
depth h', it is theoretically possible to determine the twist of the member from a single
L.V.D.T. reading at point 'C. It was evident however that by using just one L.V.D.T.,
the measurement of twist would be relatively insensitive and the resolution of the mea
surement device significant. The author therefore elected to use two L.V.D.T.'s at this
particular location to provide a more accurate measurement of the co-ordinate Xc. This
gave a total of seven L.V.D.T.'s for the measurement system as a whole, one more than
3.8
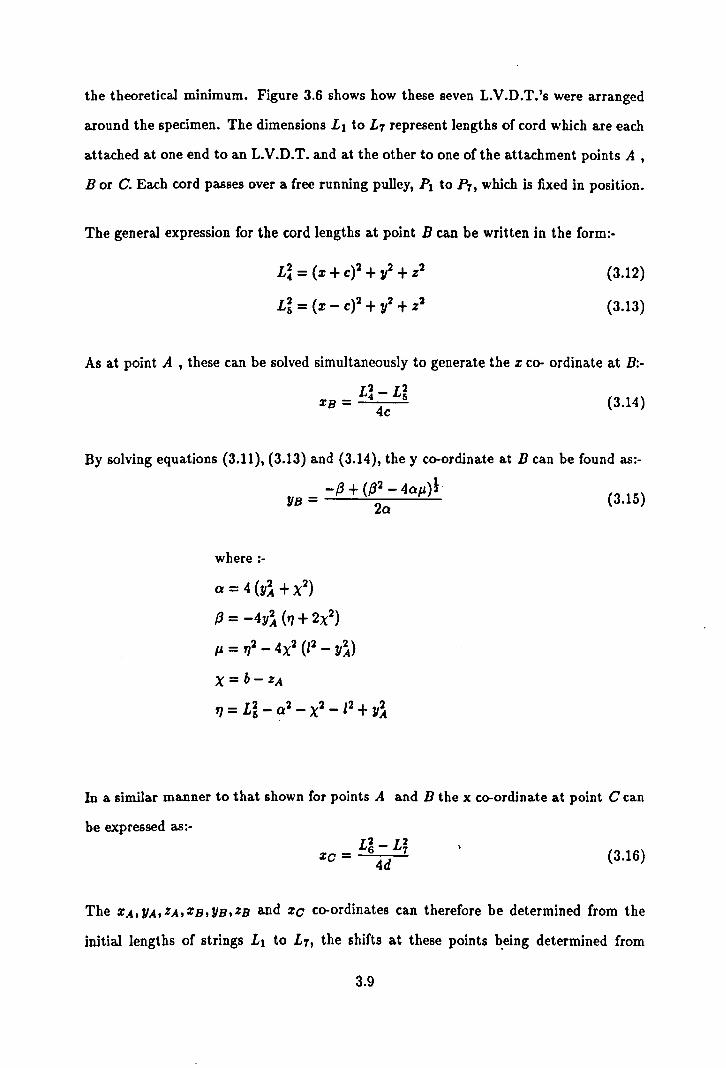
the theoretical minimum. Figure 3.6 shows how these seven L.V.D.T.'s were arranged
around the specimen. The dimensions Ll to L7 represent lengths of cord which are each
attached at one end to an L.V.D.T. and at the other to one of the attachment points A ,
B or C. Each cord passes over a free running pulley, PI to P7, which is fixed in position.
The general expression for the cord lengths at point B can be written in the form:-
L~ = (x + c)2 + y2 + z2
L~ = (x - c)2 + y2 + Z2
(3.12)
(3.13)
As at point A , these can be solved simultaneously to generate the x co- ordinate at B:-
L~ - L~ XB = --=--..::.
4c (3.14)
By solving equations (3.11), (3.13) and (3.14), the y co-ordinate at B can be found as:
-13 + (132 - 4oJl)1 YB = (3.15)
where :-
0= 4 (Y~ + X2)
13 = -4y~ ('1 + 2X2)
Jl = '12 - 4X2 (12 - y~)
X = b- ZA
20
1] = Li - ~2 - X2 _12 + y~
In a similar manner to that shown for points A and B the x co-ordinate at point C can
be expressed as:-L~- L~
xc = 4d (3.16)
The XA, YA, ZA, XB, YB, ZB and Xc co-ordinates can therefore be determined from the
initial lengths of strings Ll to L7 , the shifts at these points being determined from
3.9
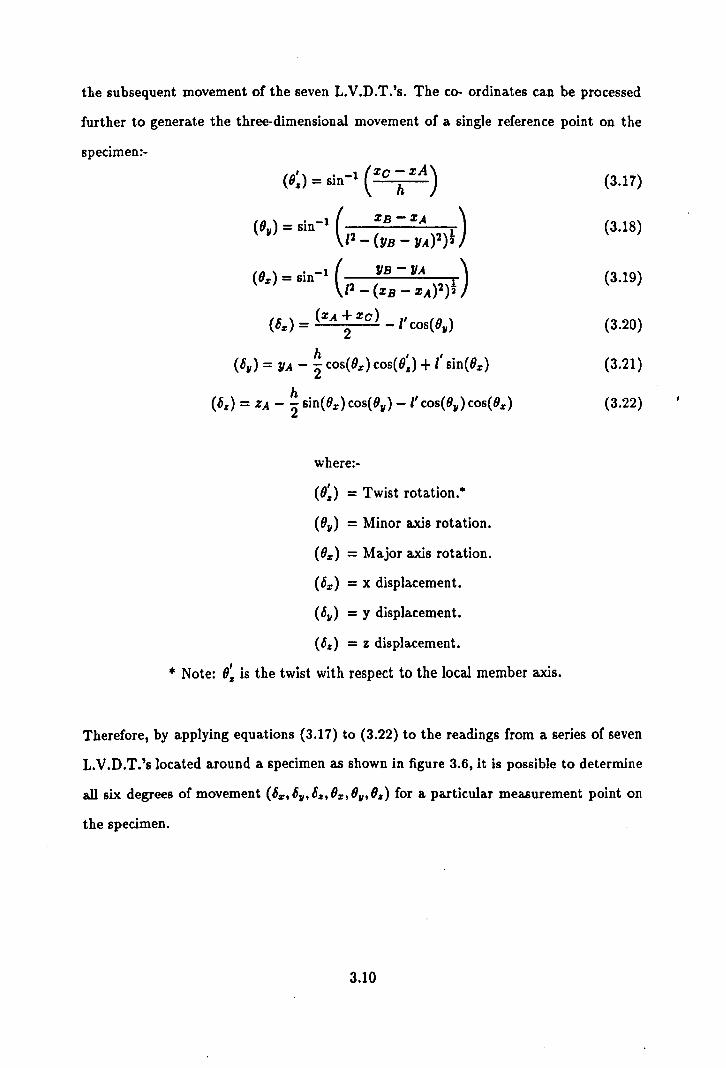
the subsequent movement of the seven L.V.D.T.'s. The co- ordinates can be processed
further to generate the three-dimensional movement of a single reference point on the
specimen:-
where:-
(0:) = Twist rotation.
(01/) = Minor axis rotation.
(Oz) = Major axis rotation.
(6z ) = x displacement.
(61/) = y displacement.
(6%) = z displacement.
• Note: 0: is the twist with respect to the local member axis.
(3.17)
(3.18)
(3.19)
(3.20)
(3.21)
(3.22)
Therefore, by applying equations (3.17) to (3.22) to the readings from a series of seven
L.V.D.T.'s located around a specimen as shown in figure 3.6. it is possible to determine
all six degrees of movement (6z• 61/' 6%. Oz. 81/' 8%) for a particular measurement point on
the specimen.
3.10

3.2.3 Construction and testing of a prototype measurement device.
At an early stage in the research programme, a full size prototype of the proposed
3-dimensional measuring system was constructed. An investigation of the accuracy,
sensitivity and repeatability of the prototype under controlled conditions, provided useful
information on the feasibility and ease of operation of the system.
A frame constructed in 'Dexion' bolted framing angle, supported the L.V.D.T.'s and
pulley mechanisms at the required points around the specimen, as indicated in figure
3.7. The test specimen was a 3.8m long 70 x 70 square hollow steel section. Threaded
bolts 200mm long were passed through the section to form the attachment points on
the upper and lower section surfaces. At one end, the specimen was supported on a
lubricated ball joint (figure 3.7), point Y, and at the other end on a micrometer screw
which displaced the specimen by a controlled distance, point X. A conventional dial gauge
was used to give a direct measure of the displacement of the micrometer screw. The 3-
dimensional measuring device was situated adjacent to the ball support, and monitored
subseque~t rotations of the specimen.
The L.V.D.T.'s used in the prototype tests had operating ranges of 25mm and 50mm.
Data from the measuring device was recorded using an Orion Solatron Data Logging
system, with data processing facilities, connected to an IBM PC compatible Opus com
puter. A computer program was written to process the output from the L.V.D.T.'s using
the equations discussed above. This program was installed in the data logging system
to provide continuous output of processed measurement data throughout the test.
From the outset, it was apparent that the device would have to be capable of measuring
very small displacements and rotations. It was therefore essential that the cord which
was used to connect the L.V.D.T.'s to points on the specimen was as near inextensible
as possible. The cord which was used in the preliminary prototype tests was of a heavy
gauge and was therefore relatively stiff. The tension in the cord produced by the return
3.11

spring mechanisms in the L.V.D.T.'s was ofinsufficient strength to fully remove any small
kinks and deformations within the cord. Such kinks caused the cord to behave as though
it were extensible and as a result, the data collected from the initial prototype tests
tended to be inaccur~te and of poor repeatability. When a low frequency vibrating source
was attached to the measuring device frame, significant improvements were observed in
the accuracy of measurement. It is assumed that such dynamic effects helped to remove
the adverse effects of cord deformations. The use of a lighter gauge cord in subsequent
tests resulted in a vast improvement in both the accuracy and the repeatability of the
data.
The processing computer program automatically set all the initial offsets and rotations
of the specimen to zero. Subsequent movements of the specimen were therefore mea
sured relative to a zero datum irrespective of the initial specimen orientation. To carry
out a rotation calibration of the device, scans were taken of the L.V.D.T. readings for
1mm increments of lateral displacement at point X on the specimen. These movements,
actuated by the mechanical screw device, resulted in a rotation of the specimen about
the ball support at Y. The magnitude of applied movement was measured using a dial
gauge indicator with an accuracy of 0.01mm. As the distance between the point of move
ment, and the position of the ball support was 3505mm, a 1mm displacement movement
produced an actual rotation of 0.000285 radians. An error in the measurement of the
lateral movement of point X of O.Olmm would therefore result in an apparent error in
the actual rotation of the specimen of only 0.000003 radians. Point X was moved in a
lateral direction by up to 20mm, and then reversed back to its initial starting position.
Calibration tests were also carried out for vertical movements of point X , resulting in
in-plane rotation of the specimen and also for lateral movement of a vertical armature
fixed to the specimen which induced twist rotations. The plots of the actual specimen
rotations against the measured rotations are shown in figures 3.8 to 3.10.
To check the ability of the device to measure displacements, the ball joint at support
X was replaced by a sliding roller bearing. The specimen was displaced laterally and
3.12
longitudinally by a specially adapted screw device in a similar manner to that described
above. The magnitudes of the resulting displacements were measured directly by a
dial gauge indicator. It was considered however that the rated accuracy of the gauge,
O.Olmm, was sufficient for the purpose of deflection monitoring of the subassemblage.
The resulting plots of actual against measured displacement are shown in figures 3.11 to
3.13.
It is evident from the calibration plots that the prototype device provided a very accurate
measure of both displacement and rotation. The maximum apparent error for rotation
measurement was 0.00005 radians whilst that for displacement was 0.05mm. The device
was therefore developed further for use in the series of subframe tests.
3.2.4 Development of the prototype for use in the subassemblage tests.
The prototype testing of the measurement device used a temporary support frame con
structed from proprietary 'Dexion' framing angle. For the actual subframe tests, the
measuring device support frames were fabricated from 40 x 40 mm mild steel square
hollow section. The frames were principally of welded construction; however a limited
number of bolted connections were necessary to facilitate installation of the test speci
men. The base-plates of the instrumentation frames were bedded in Plaster of Paris to
eliminate any tendency for the frame to wobble during the course of a test. Figures 3.14
and 3.15 show photographs of the 3-dimensional measurement devices and supporting
frames used in the subassemblage study.
Due to rolling tolerances, the opposite faces of the hollow section instrumentation frames
were never truly parallel. The bearings used in the pulley mechanisms therefore had to be
self aligning to prevent the shaft locking as a result of non-alignment. A total of 39 pulley
mechanisms were fabricated, one for each of the L. V.D. T. '8 used in the three-dimensional
3.13
measurement devices. A diagram of the pulley mechanisms is shown in Appendix A.
The L.V.D.T. cords were permanently connected to the measurement device rotation
bars. To facilitate installation, the bars were temporarily bolted to the specimen and
could therefore be connected to successive test subassemblages with relative ease.
3.2.5 Deflection components measured in the subassemblage tests.
Section 3.2.2 described the development of a measurement device comprising seven
L.V.D.T.'s capable of measuring all six degrees of three dimensional movement. This
particular device was used at the column base and at the column end of each of the
three beams. Simplified devices requiring a smaller number of L.V.D.T.'s were used at
the remaining measurement locations. A six string measurement device was used at the
mid-point of the column (figure 3.16). This particular device was capable of accurately
monitoring the x, y and z displacements and twist rotations of the column. It was con
sidered that values of the minor and major axis rotations at the column mid-point were
not essential. A five string device was used at the head ofthe column (figure 3.17) which
was capable of monitoring all displacements and rotations with the exception of column
twist. The location of the various types of 3-dimensional measuring device around the
subassemblage test specimen is shown in figure 3.1S.
In addition to recording three-dimensional deformation, linear measurements were made
using single L.V.D.T.'s of the displacement at the column head and at the remote end
of each beam. A comprehensive summary of the deformation components which were
monitored during a test are shown on the plan and elevation of the subassemblage in
figure 3.19.
Before commencing a test, the initial lengths of the 39 strings forming the six 3-dimensional
3.14
measuring devices, were recorded. This data was used in the post processing to deter
mine the initial absolute positions of the specimens, and hence the subsequent relative
displacements.
3.3 Force measurement.
As the columns used in the experimental sub assemblage tests were to be deformed beyond
their ultimate load capacity, it was inevitable that significant areas of material yielding
would occur within the column section. The force measurement system therefore had to
be capable of tracing the resulting complex 3-dimensional elastic-plastic stress distribu
tions and of coping with the difficulties associated with experimental strain measurement
in elastic-plastic material.
3.3.1 Measurement of longitudinal strains.
The column actions which were of particular interest produced longitudinal strains in the
column. In principle, these strains could be measured easily using electrically energised,
foil strain gauges. This particular type of gauge has been used by many experimental
researchers in studies of the behaviour of structural steelwork. The thin construction of
such gauges allows rapid heat dissipation thus limiting the effect of electrical energisation
on the resistivity of the gauge. The specific type of gauge used in the subassemblage
tests had a gauge length of 10mm and was of a form which was particularly insensi
tive to transverse strains [3.15]. The gauges were fixed using a cyanoacrylate adhesive
which could be applied in a very thin layer and thus reduced to an absolute minimum the
3.15

residual stresses and post- cure shrinkage associated with certain types of adhesive [3.16].
3.3.2 Summation of the individual strain components.
The magnitude of longitudinal strains induced at any point on the column section
equalled the sum of the individual strain components due to axial load, (0, major axis
bending moment, £b, minor axis bending moment, (e, and warping, (d. The warping
strains result from a bi-moment, which is a self- equilibrating system of moments that
develop as a result of torsional deformations in flanged members [3.17] • A diagrammatic
representation of the individual longitudinal strain components is shown in figure 3.20
[3.18].
In theory, only four measurements of strain are required at anyone cross section to
determine the four unknown force components. Four strain gauges could therefore have
been used, one positioned close to the edge of each of the flange tips. For levels of load at ~/1JSt;cally
which the section behaves wholly ~, tIle force components of axial load (P), major
axis moment (Mu ), minor axis moment (Ml'l') and warping bi-moment (B) could be
derived using the following simple expressions:-
EA (P) = T(£l + (2 + (3 + (4)
(M~~) = E!~r (£1 + (2 - £3 - (4)
( ) EZlIlI ( MlIlI = -4- -(1 + £2 + (3 - (4)
(B) = EZw (-£1 + E2 - £3 + (.c)
4
(3.23)
(3.24)
(3.25)
(3.26)
where EIt E2, E3 and (4 represent the total strains at the four corners due to the individual
load components:-
3.16
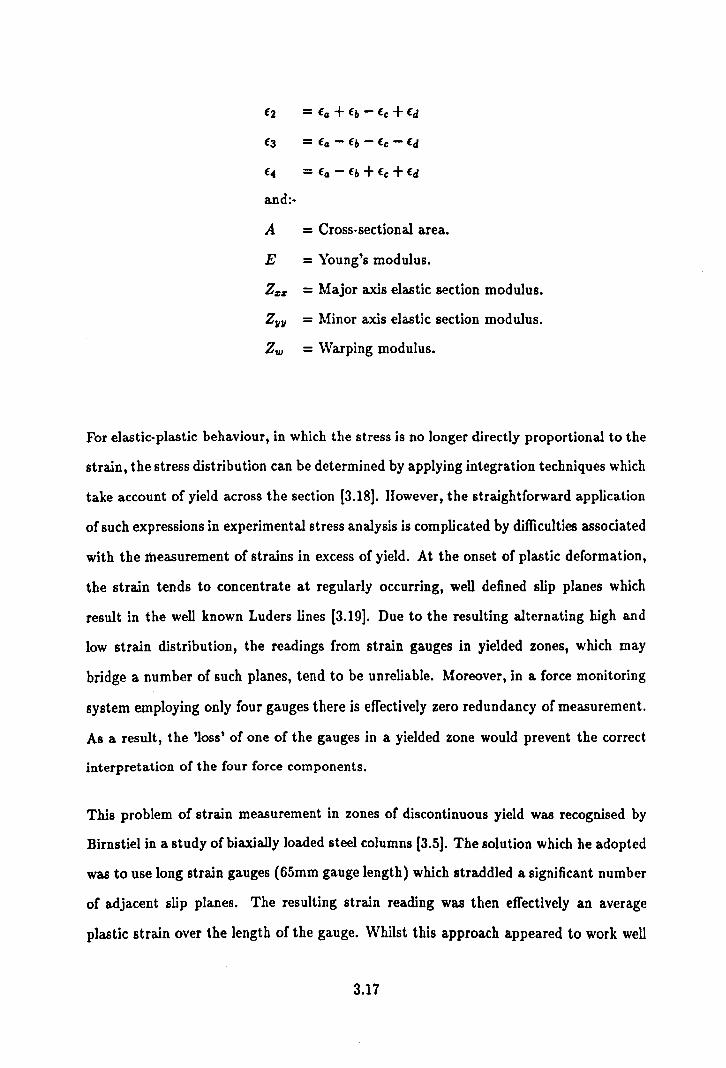
l2 = la + lb - lc + ld
l3 = la - lb - lc - ld
l4 = la - lb + lc + ld
and:-
A = Cross-sectional area.
E = Young's modulus.
Zzz = Major axis elastic section modulus.
ZIIII = Minor axis elastic section modulus.
Zw = Warping modulus.
For elastic-plastic behaviour, in which the stress is no longer directly proportional to the
strain, the stress distribution can be determined by applying integration techniques which
take account of yield across the section [3.18]. However, the straightforward application
of such expressions in experimental stress analysis is complicated by difficulties associated
with the measurement of strains in excess of yield. At the onset of plastic deformation,
the strain tends to concentrate at regularly occurring, well defined slip planes which
result in the well known Luders lines [3.19]. Due to the resulting alternating high and
low strain distribution, the readings from strain gauges in yielded zones, which may
bridge a number of such planes, tend to be unreliable. Moreover, in a force monitoring
system employing only four gauges there is effectively zero redundancy of measurement.
As a result, the 'loss' of one of the gauges in a yielded zone would prevent the correct
interpretation of the four force components.
This problem of strain measurement in zones of discontinuous yield was recognised by
Birnstiel in a study of biaxially loaded steel columns [3.5]. The solution which he adopted
was to use long strain gauges (65mm gauge length) which straddled a significant number
of adjacent slip planes. The resulting strain reading was then effectively an average
plastic strain over the length of the gauge. Whilst this approach appeared to work well
3.17
in Birnstiel's studies, it was decided that an alternative method should be developed
which utilised standard length gauges.
Due to the unreliable performance of strain gauges in yielded zones, it was evident that
more than the absolute minimum of four gauges would be required. Work carried out
by Lightfoot [3.20] has shown how so called 'redundant' gauges can be incorporated into
strain data analysis to generate the strain profile in structural steel sections more ac
curately. Small experimental variations in the performance of strain gauges, principally
due to variations in the material and the fixing procedure, were rationalised by applying
a least squares error approximation to produce the linear strain profile. Although the
procedure used by Lightfoot was restricted to strain measurement in the elastic region, it
was considered that this approach could be extended to cover strain measurement in the
elastic-plastic range. Spurious readings from gauges situated in yielded zones, towards
the extremities of the section, were to be replaced by extrapolating the linear strain
profile deduced from those gauges in the remaining elastic regions situated closer to the
centroid.
3.3.3 Derivation of the elastic-plastic stress distribution.
During a subassemblage test, the readings from the 10 strain gauges at each of the
measurement locations, positioned as shown in figure 3.21, were recorded. Only upon
completion of the test was the data processed to generate the force components acting at
the measurement loca.tions. This was done using a. purpose written suite of FORTRAN
programs on a PRIME mainframe computer. The method, developed to evaluate the
elastic and the elastic-plastic actions of the section, is best illustrated by considering the
principal sequence of program operations as outlined below.
3.18

1: Initially, a check was made of the four strain gauges on the upper flange of the
section (gauges 1 to 4 on figure 3.22a) to determine if all strain readings were
within the elastic limit of the material, thereby indicating that the gauges were
situated within an 'elastic zone'. The readings and positions ofthe four gauges
were then passed to a standard FORTRAN statistical utility module which
generated the least squares error approximation to the linear strain profile
through the gauge points. Readings from strain gauges which exceeded the
strain at yield were ignored, the strain profile being determined only from
those gauges which remain in elastic zones.
2. The above procedure was then repeated for the four gauges on the lower flange
of the section (gauges 7 to 10).
3. The value of strain at the centre of the upper and lower flanges was then
determined from the two flange strain profiles (figure 3.22b). The values
at these two 'virtual' strain gauge positions were then combined with the
measured values from the two gauges on the web (gauges 5 and 6), thus
providing a total of four data points over the depth of the section. The strain
gradient was then determined along the web in a similar manner to that
described above for the flanges.
4. A mesh was constructed over the entire cross section resulting in an 80 x 2
element array for each of the flanges and an 80 x 1 array for the web. From
the 3-dimensional strain gradients, a specific value of strain was assigned to
each element in the mesh.
5. From these strains, the corresponding values of stress were determined for
each mesh element across the whole section assuming a bi-linear stress strain
distribution. In instances where the strain exceeded the yield strain, the
resulting stress was limited to the yield stress of the material (figure 3.22c).
The effect of post yield strain hardening was not taken into account.
3.19
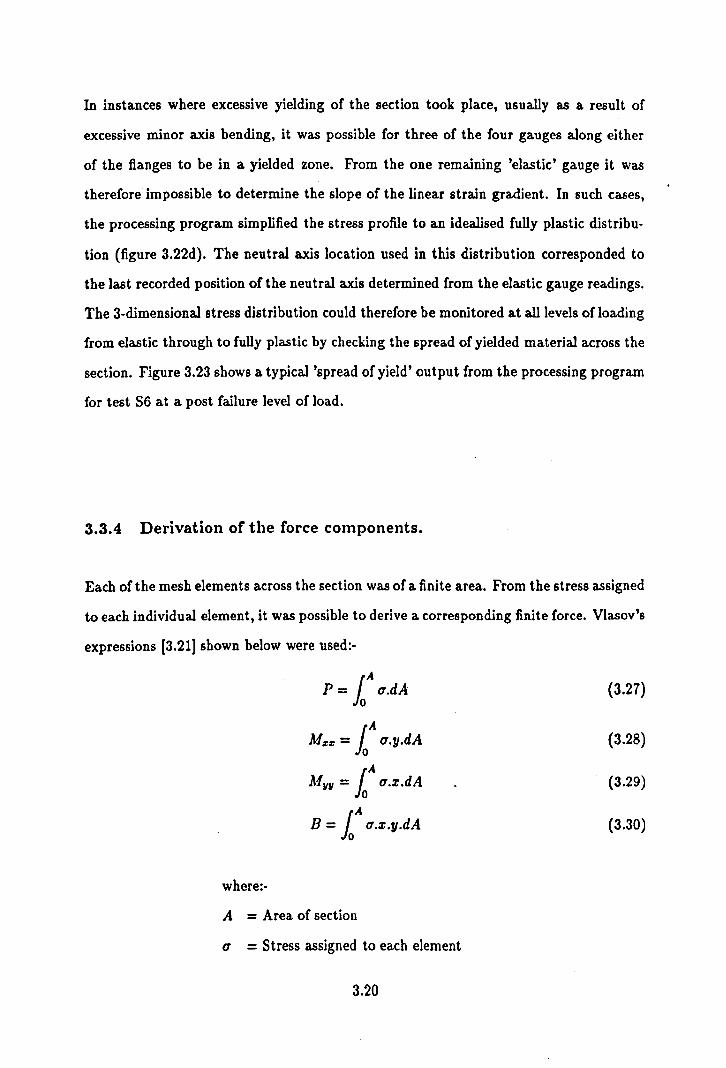
In instances where excessive yielding of the section took place, usually as a result of
excessive minor axis bending, it was possible for three of the four gauges along either
of the flanges to be in a yielded zone. From the one remaining 'elastic' gauge it was
therefore impossible to determine the slope of the linear strain gradient. In such cases,
the processing program simplified the stress profile to an idealised fully plastic distribu
tion (figure 3.22d). The neutral axis location used in this distribution corresponded to
the last recorded position of the neutral axis determined from the elastic gauge readings.
The 3-dimensional stress distribution could therefore be monitored at all levels of loading
from elastic through to fully plastic by checking the spread of yielded material across the
section. Figure 3.23 shows a typical 'spread of yield' output from the processing program
for test 56 at a post failure level of load.
3.3.4 Derivation of the force components.
Each of the mesh elements across the section was of a finite area. From the stress assigned
to each individual element, it was possible to derive a corresponding finite force. Vlasov's
expressions [3.21] shown below were used:-
where:-
P = loA IT.dA
Mzz = loA IT.lI.dA
MJIJI = loA IT.x.dA
B = loA CT.X.lI.dA
A = Area of section
IT = Stress assigned to each element
3.20
(3.27)
(3.28)
(3.29)
(3.30)
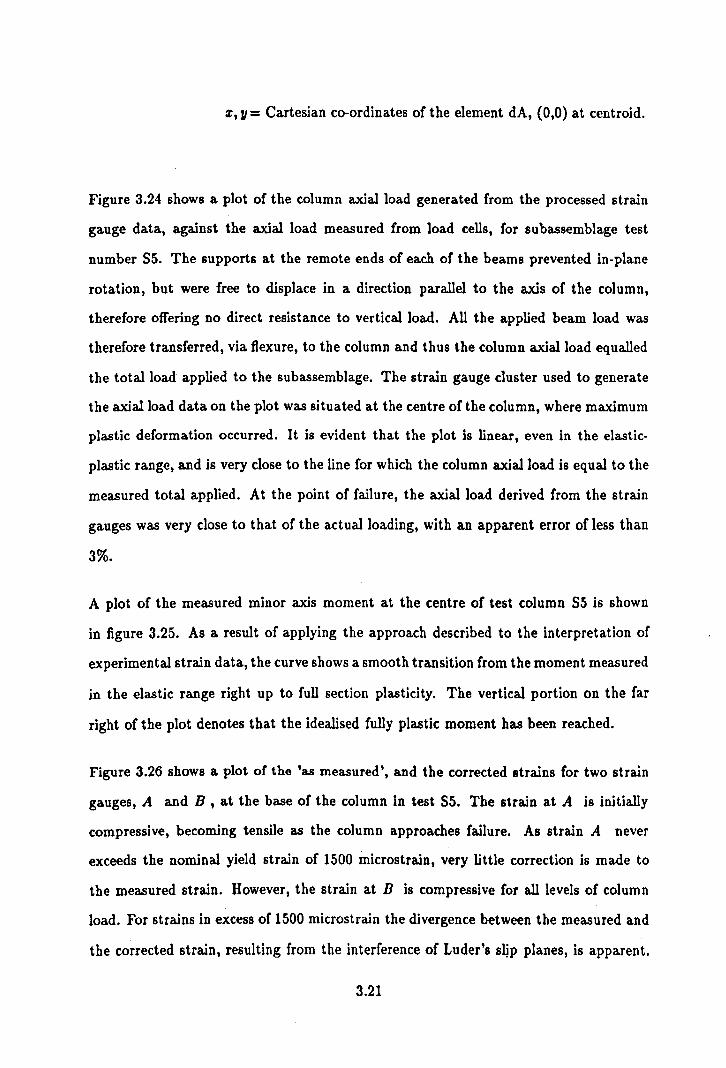
z, 11 = Cartesian co-ordinates of the element dA, (0,0) at centroid.
Figure 3.24 shows a plot of the column axial load generated from the processed strain
gauge data, against the axial load measured from load cells, for subassemblage test
number S5. The supports at the remote ends of each of the beams prevented in-plane
rotation, but were free to displace in a direction parallel to the axis of the column,
therefore offering no direct resistance to vertical load. All the applied beam load was
therefore transferred, via flexure, to the column and thus the column axial load equalled
the total load applied to the sub assemblage. The strain gauge cluster used to generate
the axial load data on the plot was situated at the centre of the column, where maximum
plastic deformation occurred. It is evident that the plot is linear, even in the elastic
plastic range, and is very close to the line for which the column axial load is equal to the
measured total applied. At the point of failure, the axial load derived from the strain
gauges was very close to that of the actual loading, with an apparent error of less than
3%.
A plot of the measured minor axis moment at the centre of test column S5 is shown
in figure 3.25. As a result of applying the approach described to the interpretation of
experimental strain data, the curve shows a smooth transition from the moment measured
in the elastic range right up to full section plasticity. The vertical portion on the far
right of the plot denotes that the idealised fully plastic moment has been reached.
Figure 3.26 shows a plot or the 'as measured', and the corrected strains for two strain
gauges, A and B , at the base of the column in test 55. The strain at A is initially
compressive, becoming tensile as the column approaches failure. As strain A never
exceeds the nominal yield strain of 1500 microstrain, very little correction is made to
the measured strain. However, the strain at B is compressive for all levels of column
load. For strains in excess of 1500 microstrain the divergence between the measured and
the corrected strain, resulting from the interference of Luder's sqp planes, is apparent.
3.21
It is interesting to note that although the degree of correction to each of the gauges is
very different, the same linear strain gradient was used to correct each of the measured
strains.
3.3.5 Overall subassemblage force instrumentation.
The sophisticated 10 gauge elastic-plastic force monitoring system described in the pre
ceding sections was adopted at the base, mid point and top of each column in the
sub assemblage test series. Throughout the subassemblage test series, load arrangements
were specifically selected to prevent the stresses within the beam sections exceeding the
yield stress of the material. As these particular sections remained wholly elastic, a more
modest four gauge system (figure 3.27), which employed the principles previously de
scribed in section 3.3.2, was used to monitor the forces at each end of the beams. For a
typical three beam subassemblage, a total of 54 strain gauges was used for each test (30
fixed to the column and 8 fixed to each of the beams). The plan and elevation of the
subassemblage shown in figure 3.28 indicates the location of the different strain gauge
clusters and summarises the force components which were recorded.
C 3.4 Data fuisition.
An Orion data logging system, linked to an I.B.M. P.C. compatible computer, was used
to record the readings from the electrical instrumentation devices. A total of 154 log
ging channels was used, 108 for strain gauges (54 energising and 54 recording), 42 for
the L.V.D.T.'s, 3 for monitoring the pressure in the hydraulic beam rams and a single
3.22
channel to monitor the column head load cell. The logging system was triggered manu
ally and recorded the data at a rate of 100 channels/second. A computer program was
incorporated into the logging system which processed the data from the 3-dimensional
displacement device at the column centre. This enabled the load against minor axis
deflection plot to be displayed continuosly on the monitor as the test progressed. Due to
the large amount of data recorded and the complex processing procedures, the majority
of the data was processed after completion of the tests using a suite of purpose written
FORTRAN programs on a PRIME mainframe computer.
References.
3.1 Gibbons, C., Kirby P.A. and Nethercot D.A., 'The development of a device for measuring the 9-dimensional deformation of steel columns. ',Journ. Strain Analysis. (to be published)
3.2 Gibbons, C., Kirby P.A. and Nethercot D.A., 'The experimental assessment of force components within thin walled structural steel members', Journ. Strain Analysis. (to be published)
3.3 Wang, Y.W. and Nethercot, D.A., 'Ultimate strength analysis of threedimensional column subassemblages with flexible connections', Journ. Construct. Steel Res., No.9, 1988, pp. 235-264.
3.4 Estuar, F.R. and Tall, L., 'Testing of pinned-end steel columns', Test Methods for Compression Members, Am. Soc. Testing Mats., STP 419, 1967, pp. 80-96.
3.5 Birnstiel, C., 'Experiments on H-Columns under biaxial bending', Journ. Struct. Div., Proc. Am. Soc. Civil Engrs., No. ST10, October 1968, pp. 2429-2449.
3.6 Aggarwal, A.K., Coates, R.C., 'Moment-rotation characteristics of bolted beam to column connections', Journ. Const. Steel Res., Vol. 6, No.4, 1986, pp. 303-318.
3.7 Gent, A.R. and Milner, H.R., 'The ultimate load capacity of elastically restrained H-Columns under biaxial bending', Proc. Inst. Civil Engrs., No. 41, 1968, pp. 685-704.
3.23
3.8 Wood, R.H., Needham, F.H. and Smith, R.F., 'Test of a multi-storey rigid steel frame', The Structural Engineer, Vol. 46(4), April 1968, pp. 107-119.
3.9 MacLachlan, D.F.A., Squire, A.M. and Planer, G.V., 'Remote indication of angular displacement', The Engineer, Vol. 214, No. 559,10 August 1962, pp. 235.
3.10 Davison, J.B., Kirby, P.A. and Nethercot, D.A. 'Column behaviour in PR construction: Ezperimental studies', Journ. Struct. Div., Am. Soc. Civil Engrs., Vol.113, No.9, Sept. 1987, pp. 2032-2050.
3.11 Johnson, D.L., 'A method for the full-scale testing of roof systems', Full-Scale Load Testing oC Structures, Am. Soc. Testing Mats., STP 702, Ed. W.R. Shriever, 1980, pp. 78-87.
3.12 O'Heachteirn, P., 'An ezperimental investigation into the lateral buckling strength of plate girders', Ph.D. Thesis, University of Sheffield, England, 1983.
3.13 Cuk, P.E., Rogers, D.F. and Trahair, N.S., 'Inelastic buckling of continuous steel beam-columns', Journ. Const. Steel Res., Vol. 6, No.1, 1986, pp. 21-50.
3.14 Eisenhart, L.P., 'Co-ordinate geometery', Dower Publications Inc., 1939.
3.15 Holister, G.S., 'Ezperimental stress analysis - principles and methods', Cambridge University Press, 1967.
3.16 Dally, J.W. and Riley, W.F., 'Ezperimental stress analysis. second edition', McGraw-Hill, 1978
3.17 Randolph M.F. and Lightfoot, E., 'Analysis of strain gauge data from thin walled structural steel members subjected to eccentric longitudinal loading', Proc. Inst. Mech. Engrs., Journal of Strain Analysis, Vol. 10, No.2, 1975.
3.18 Chen, W.F. and Atsuta, T., 'Theory of beam-columns· Volume 2 space behaviour and design', McGraw-Hill, 1977.
3.19 Nadai, A., 'Theory of flow and fracture of solids', Vol. 1,2nd. edition, McGraw-Hill, 1950.
3.20 Lightfoot, E., 'The statistical interpretation of strain gauge readings', Proc. !nst. Mech Engrs., Journal of Strain Analysis, Vol. 1, No.1, 1965, pp. 27-30.
3.21 Zbirohowski-Koscia, K., 'Thin walled beams· from theory to practice', Crosby Lockwood &. Son Ltd., London, 1967.
3.24

'T'- Bar welded to specimen
-- ... - I -------.... 1 ------- ... -.
--- --- I -- 3 --L3 --_ -
Transducers to measure change in Length L- t
Figure 3.1: Two dimensional measurement device using three L.V.D.T.'s.
L) L + dx L.' ~ L + dx
dx
n dy T ~tf'--_-_-____ .fL'~ ____ =---.
ALB ALB
Figure 3.2: The effect of out-of-plane movement on the measurement of in-plane displacement. .
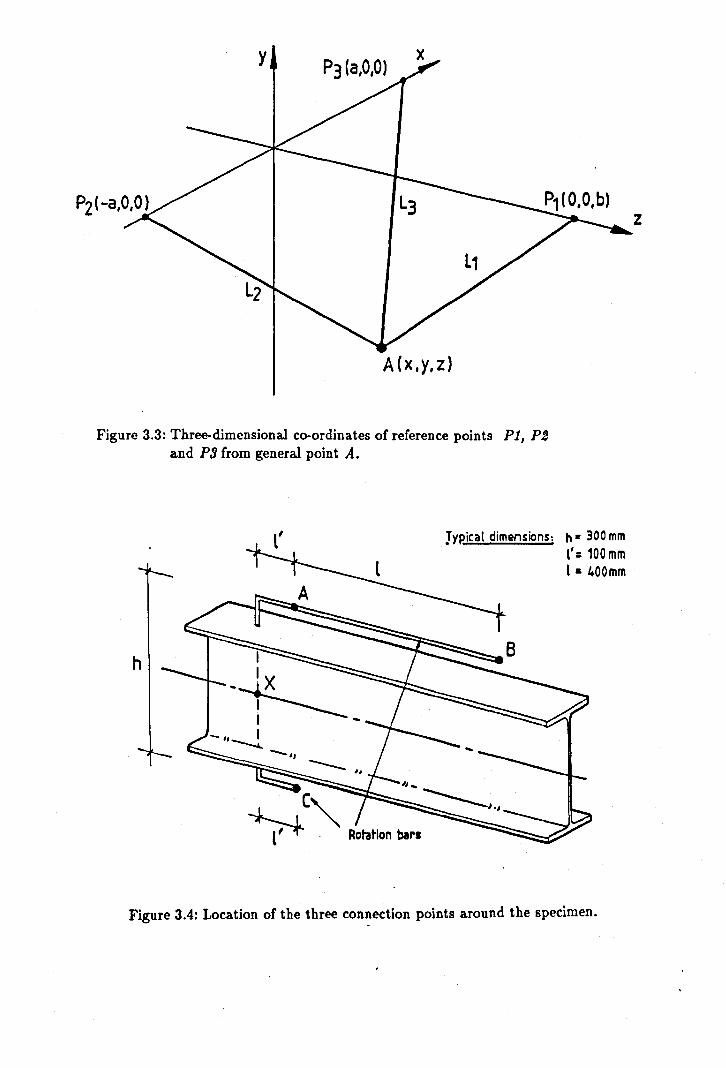
A(x,y,z)
Figure 3.3: Three-dimensional co-ordinates of reference points P 1, P2 and P9 from general point A.
h I I --f---I -
J YP'icat dimensions: h· 300 mm l': 100 mm l & 400mm
Figure 3.4: Location of the three connection points around the specimen.
Z
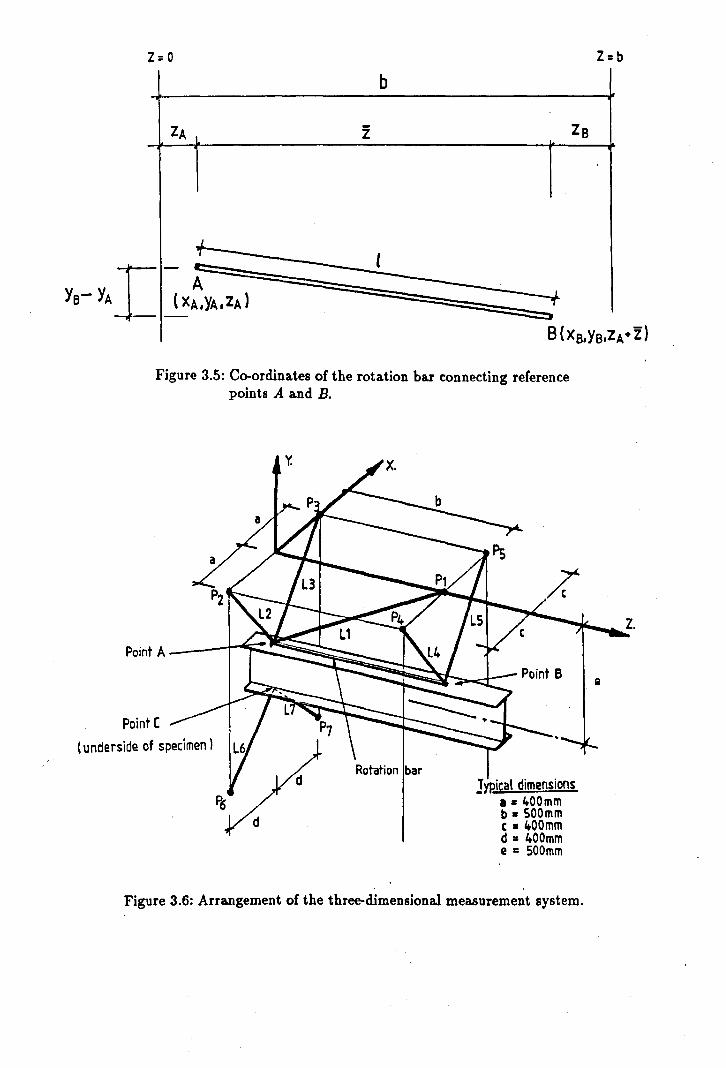
z=O b
Zs
Figure 3.5: Co-ordinates of the rotation bar connecting reference points A and B.
Point A __ -t--;:;::;
Point (
(underside of specimen)
y.
lYRical dimensions I. ltOOmm b. SOOmm c • ItOOmm d = 400mm e = SOOmm
Figure 3.6: Arrangement of the three-dimensional measurement system.
Z=b
iii
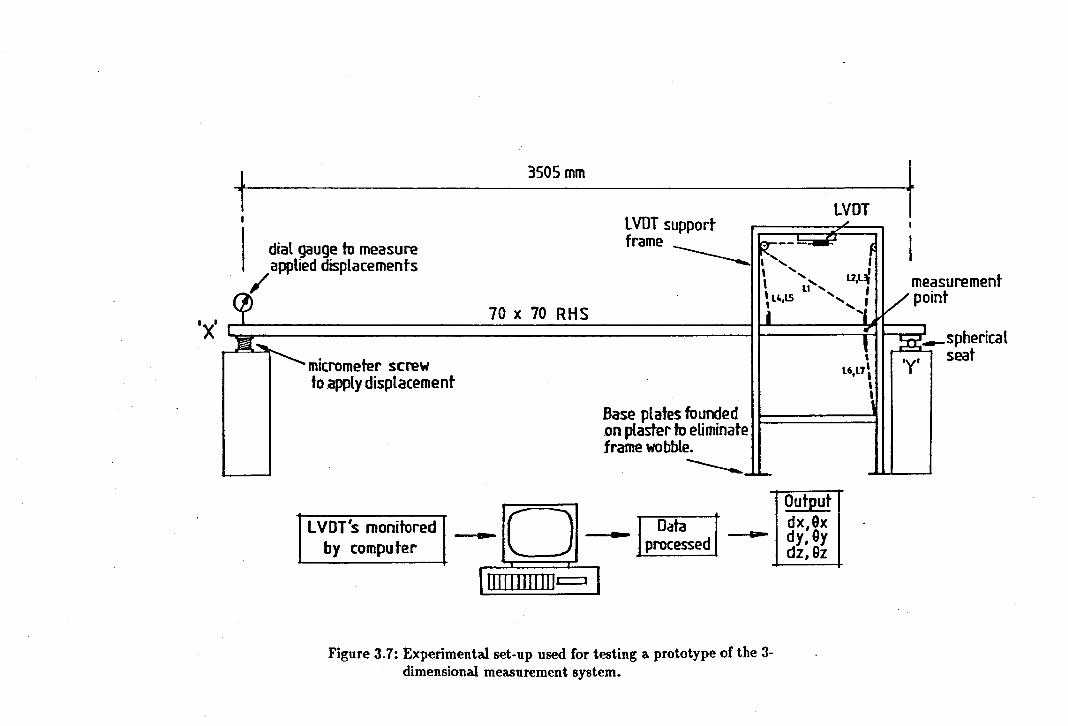
• t
X
~~~ t t ~m , l VOl support L
I ~~ ~--- f dial gauge to measure ------..... ,', , applied displacements " ',..... 12,L~ measurement
/ U .... , 0t ,L4,l5 .... ,,' ./ pOin
70 x 70 RHS 1 1
micrometer screw to .apply displacement
l VOT's monitored by computer ----- 0
Base plates founded .on plaster to eliminate frame wobble.
-----Data
processed ---Figure 3.7: Experimental set-up used for testing a prototype of the 3-
dimensional measurement system.
Output dx,9x dy,9y dz,9z
, , L6,L7, , ,
r-=l-- spherica l I 'Y' I seat
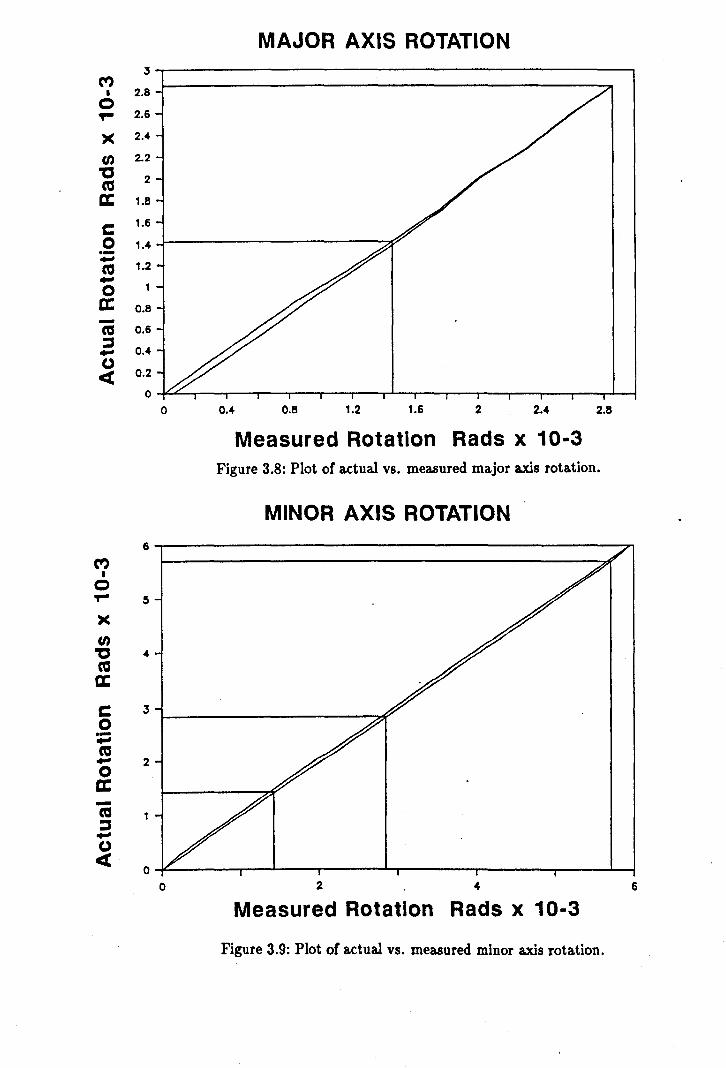
MAJOR AXIS ROTATION 3~-------------------------------------------'
M I 2.8
o ~ 2.6
>< 2.4
tn 2.2
'C 2 ta a: c o .-.... ta .... o a: -CO ::s .... (.)
<C
1.8
1.6
1.4 .J--------------------:>'J7
1.2
0.8
0.6
0.4
0.2
O~~--~~--~~--~~~~~--~~--~~--~~
M I
o ~
>< tn 'C CO a: C o .-.... CO .... o a: -CO ::s .... (.)
<C
o 0.4 0.8 1.2 1.6 2 2.4 2.8
Measured Rotation Rads x 10-3 Figure 3.8: Plot of actual vs. measured ma.jor axis rota.tion.
MINOR AXIS ROTATION
6--------------------------------------------~
O~------r_~--~----~~------~------~--~~ o 2 4 6
Measured Rotation Rads x 10-3
Figure 3.9: Plot of a.ctual vs. measured minor axis rota.tion.
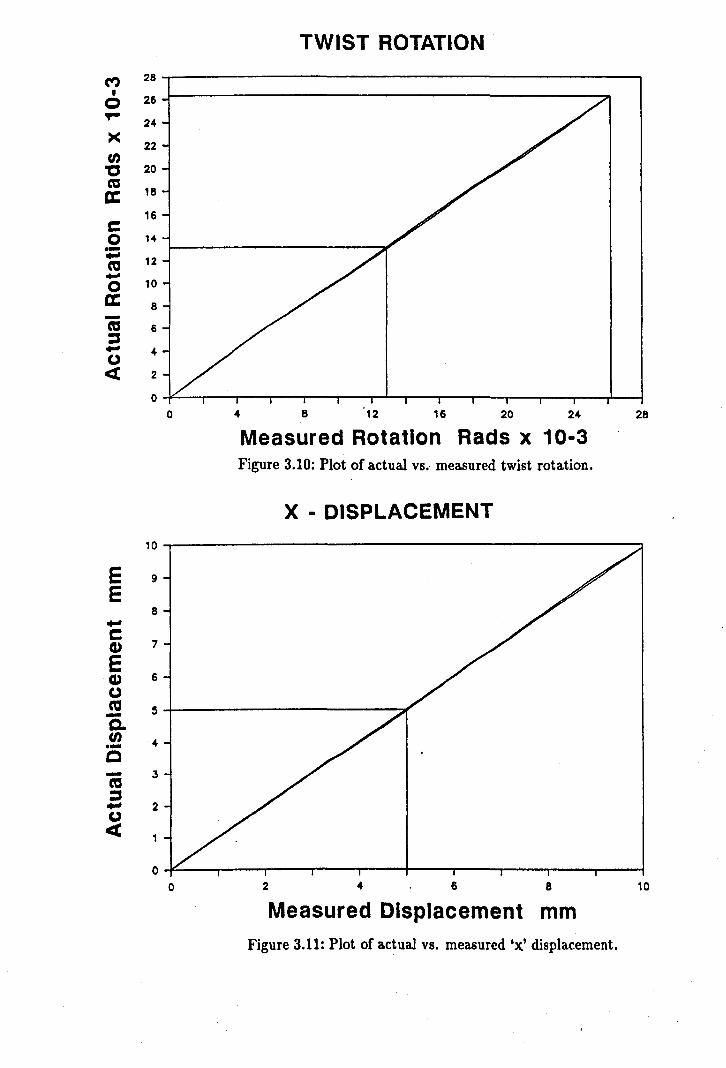
M • Q ,..
>< tJ)
"C C'CS a: c o .-.., ca .., o a: -C'CS :;, .., (.)
«
TWIST ROTATION
28~------------------------------------------~
26
24
22
20
18
16
14
12
10
8
6
4
2
O~~~-r--~-.--'--.~-r--~-.--'-~~-r--+-~
o 4 8 12 16 20 24 28
Measured Rotation Rads x 10-3 Figure 3.10: Plot of actual vs. measured twist rotation.
x - DISPLACEMENT 10~------------------------------------------~
E 9
E .., C (1)
E (1) (.) ca a tJ) .-o -ca :;, .., (.)
«
8
7
6
~+-------------------~~
4
3
2
O~---r--~----r---~--~--~----r---~--~--~ o 2 4 6 8 10
Measured Displacement mm Figure 3.11: Plot of actual vs. measured 'x' displacement.

Y - DISPLACEMENT 12
E 11
E 10
~ 9 C CD
6 E CD 7 U ca 6 -Q. tJ) 5 .-0 4 -ca
:5 :J ~
U 2 « 0
0 2 4 , 8 10 12
Measured Displacement mm Figure 3.12: Plot of actual vs. measured 'y' displacement.
Z - DISPLACEMENT 12
E 11
E 10
~ 9 C CD
8 E CD 7 U ca 6 -Q. tJ) 5 .-0
4 -ca :5 :J
~
U 2 « 0
0 2 4 6. 8 10 12
Measured Displacement mm Figure 3.13: Plot of actual vs. measured 'z' displacement.
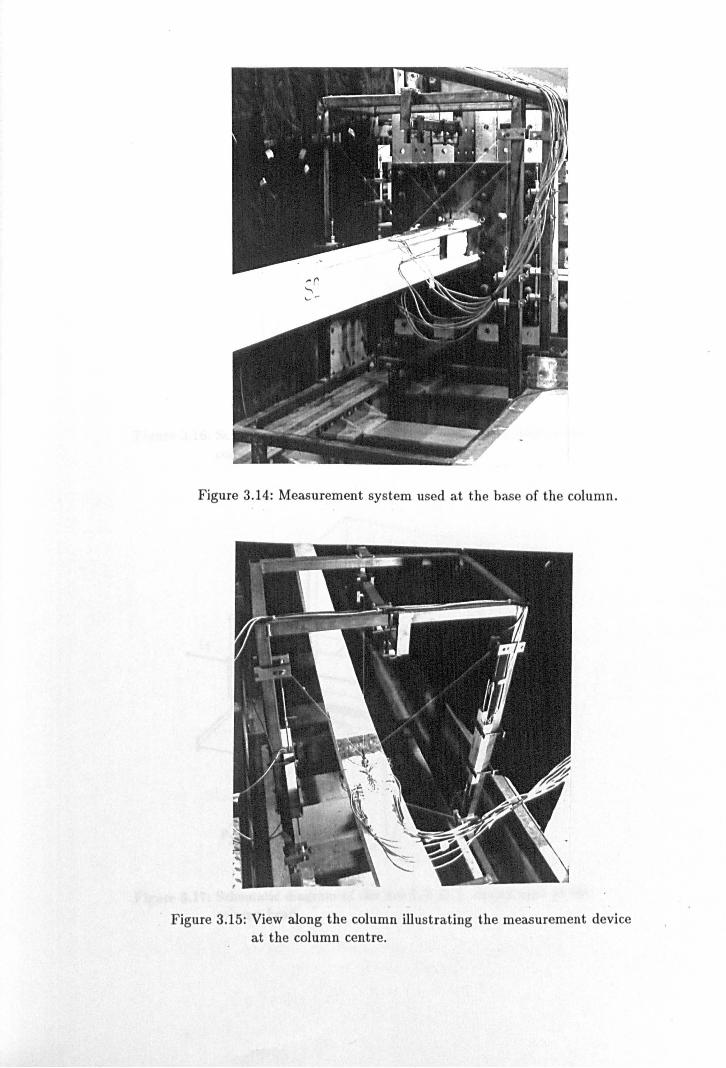
Figure 3.14: Measurement system used at the base of the column.
Figure 3.15: View along the column illustrating the measurement device at the column centre.
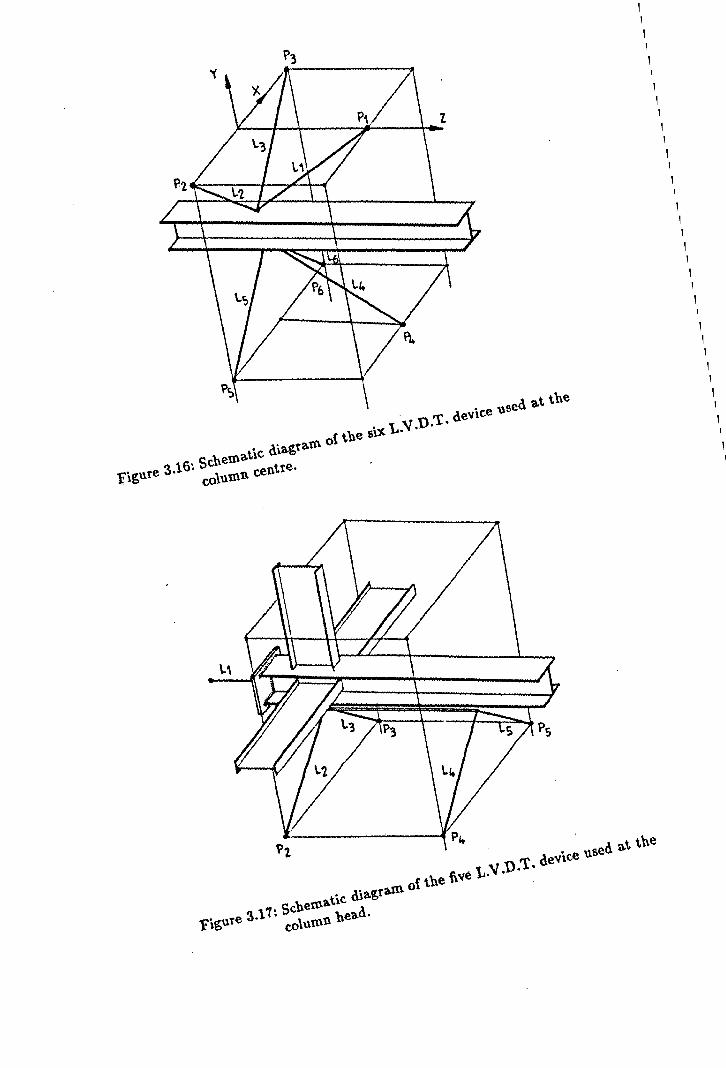
1 1 1 1 1 1 1 1 1 1 1 1 1 1 1 1 1 1 1 1 1 1 1 1 1 1 1 1 1 1 1 1 1 1 1 1 1 1 1 1 1 1 1 1 1 1 1 1 1 1 1 1 1 1 1 1 1 1 1 1 1 1 1 1 1 1 1 1 1 1 1 1 1 1 1 1 1

--~ ---c:> .. ,. r0-
t
7~-f-~-1 I I I • t I
l .1 ! c::- ... 0- -
f. "T 1 I : I • I •
7 '.,J-- "I~J t
---C:>~~ -- -1
7" r----1
6 "r----,
La r----(" I I I I L ____ J L ____ J
, --<> Single 1. V.D.T. monitoring 1lnear displacement.
r---l 3-dimensional measurement device with L ___ J the number ot L V.D. r:. indicated.
I
Figure 3.18: Location of three-dimensional measurement devices.
l~O(lOO)
L liz 11 RotaUolll with mpect to the co-onlinate axes.
dlJ• Displacement. 1I'1th mpect to the co-ordinate axes.
• Location ot the point or meuuremenL (dimensions in brackets refer to teats S7,S8,S9 and SI0).
Figure 3.19: Deformation components measured in the subassemblage tests.

) fa 1\ Eb " II I 1 I I 4 I ~
I 1 , I I 1- - ---------r I I
,..., I I " ,
1 ...... , I
I ' ...... { I " ,"'" 1 ,
3 ,
I I , v
Axial Load Major Axis Moment
~ /14 EC 1 Ed
I I ,
l
3
Minor Axis Moment Warping Torque
E1 =Ea+Eb+Ec-Ed E 2 = E a ... E b- E c .... £ d
E3 = Ea - Eb- Ec- Ed E4 =Ea- Eb+ Ec+Ed
p = EA (£1 + E2 + E3 + E4 ) 4
Mx =Ux(E1 + E2 - E3 - E4) 4
My =E1.i-E1+ E2 + E3 "'E4) 4
strain Compatibility
Equations
Force
Equations
Mw =rWns (-E1 +E2 -E3 +E4) 4
Figure 3.20: Member actions resulting from longitudinal strains.
A II
/1 , 1 I ,
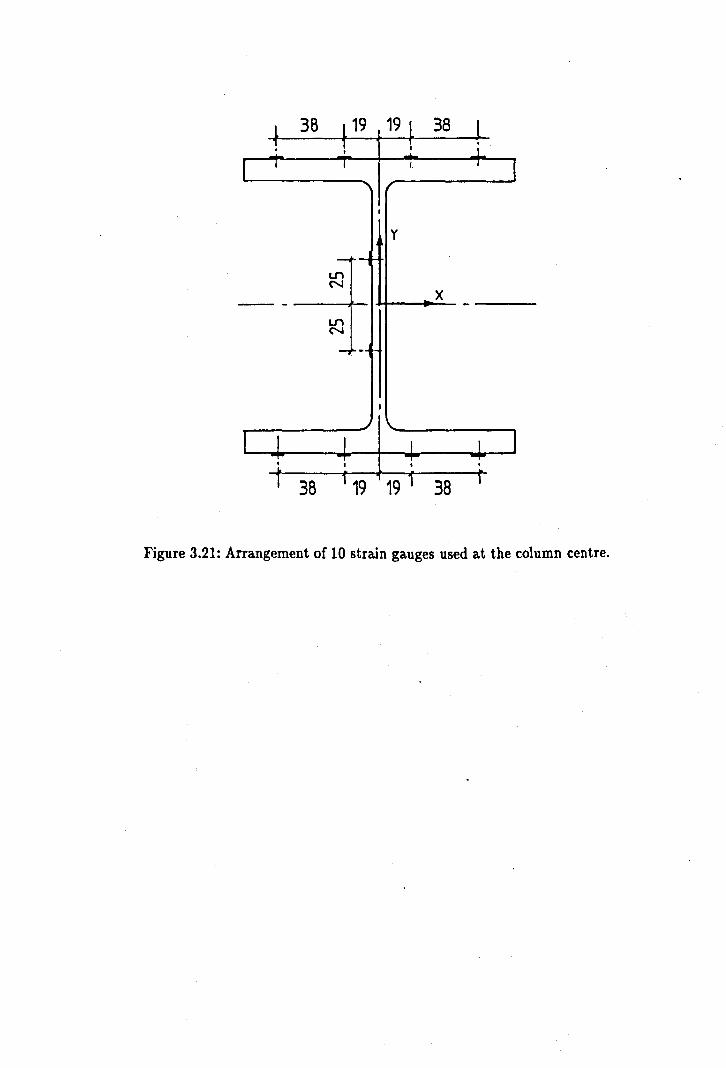
Lon N
y
x -- - ---+- .... I----.~-
Lon N
Figure 3.21: Arrangement of 10 strain gauges used at the column centre.

least square linear approximation of drain gradient.
\
Reading from gauge in / a yielded zone is ! Ignored.
I
7
extent of yielded zone
~
. ~
I ~
Vc!lue of stress assigned to each mesh element.
Figure 3.22: Derivation of the 3-D stress distribution from the measured strains.
Virtual gauges at the web/flange Intersection.
Idealised fully plastic stress distribution resulting from excessive column deformation •
•
"

~ -.. co -' -lit -~ -!: -J
Distribution of Yield Stresses in Column Subassemblage Test 56
Mesh density
P • 555.9 kN Mxx • 2.0 kNm Myy· 14.2 kNm
Extent of yield B • 9.2 kNm
Mid Column Figure 3.23: Typical output from the processing program showing the
extent of material yield.
Comparison of A~~lied and Measured Column Load Test No : S5
Xl0 1 50
45
AO
35
30
2S
20
15
10
5
0 0
\
~\(. ~"li
1#r"t. ~\(.,~,()~
~~ t.\."li ~\O
~~ ~,~
I:>\~ ~t."li
~~~ <,~~
~,~~ ~'$1'
'Qq'JI ~"li4-~
....... Mid Coluan
5 10 15 20 25 30 35 .0 .5
Measured Axial Load kN xto f
Figure 3.24: Plot of applied a.xialload against a.xialload measured from the strain gauges.
50
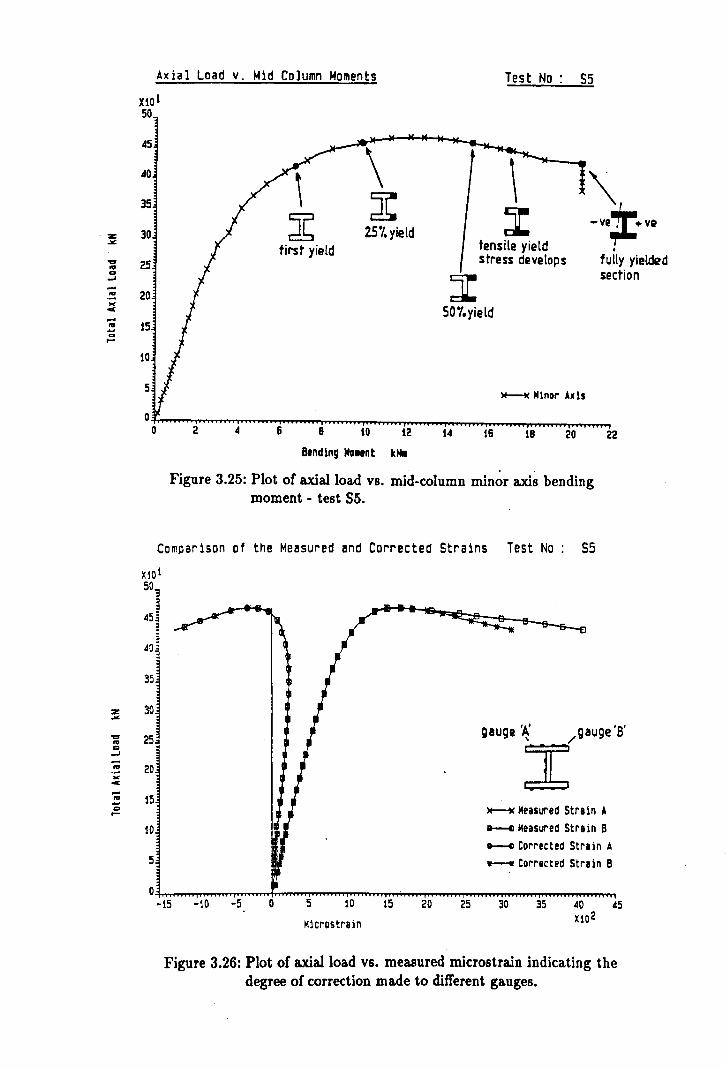
. z: ~
'CO
'" co ...J -.. ... c -.. .... co ~
z ~
'CO
"' .. ..j -"' .. c -'" .... .. ~
Axial Load v. ~id Column Moments
X101 50
45
40
35
30 2S'l.yield first yield
25
20
15
10
5
0 0 2 6 8 10 12
Bending Maunt kNII
Test No: 55
dI: tensile yield stress develops
SOi'.yield
~ Minor Axis
14 16 18 20
\ -.. ;tov. •
fully yielded section
22
Figure 3.25: Plot of axial load vs. mid-column minor axis bending moment - test S5.
Comparison of the Measured and Corrected Strains Test No 55
X101 50'3
451 3
40~
351 ~l 25
20
15
10
5
0
gauge 'Jr:' gauge 'B'
)fo-i( Measured Strain It
a----m Measured Strain B
a---Q Corrected Strain It
----- Corrected Strain B
-15 -10 -5 0 5 10 15 20 25 30 35
MlcrostrBin
Figure 3.26: Plot of axial load vs. measured microstrain indicating the degree of correction made to different gauges.
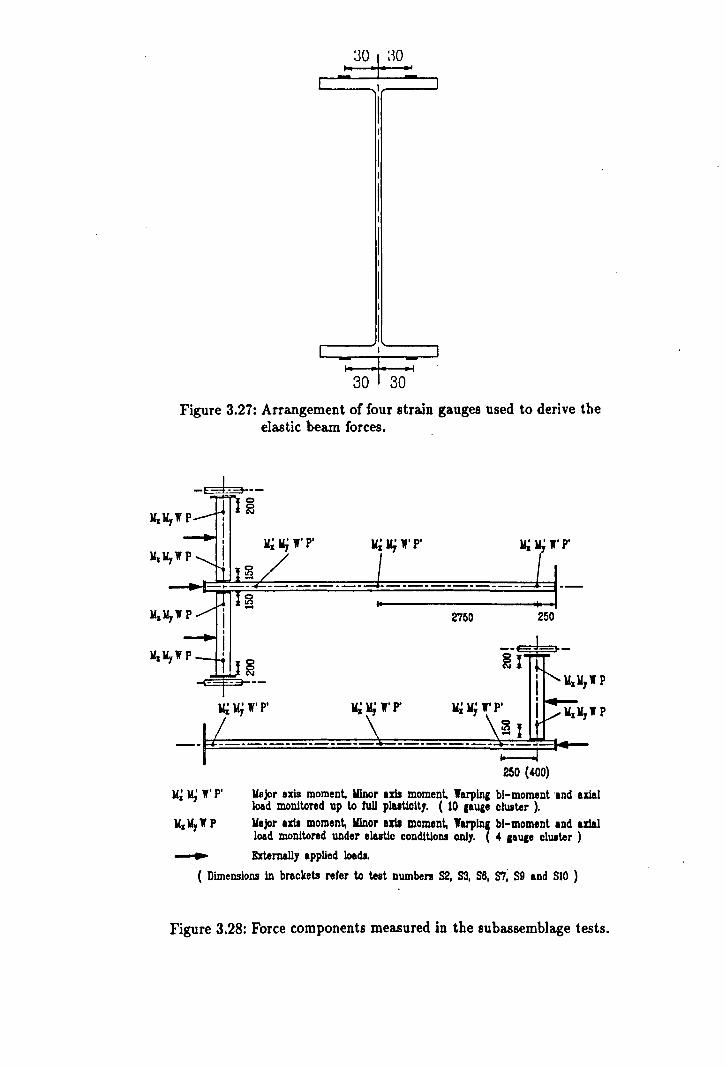
'3~ '~O , I \
I I J
I I
I I
I I
I I
I I
I L I J
1'30 "I- 30' I
Figure 3.27: Arrangement of four strain gauges used to derive the elastic beam forces.
U~ llj" P' w~ u;,' P'
2750 250
M~ w; W' P'
250 (400)
w; llj 1f' P' llajor axis moment. Ulnor am moment. Jarplng bl-moment -and axial load monitored up to tull pluUclty. (10 ,auge cluster ).
Id. V, If P Uajor am moment, Ilinor al1l moment, Jarpln. bl-moment and axial load monitored under elutlc condltloDi only. (4 lauee cluster )
_____ Externally appUed loads.
( Dimensions In brackets refer to test numbers 82, sa. S6, 8'1; S9 and S10 )
Figure 3.28: Force components measured in the subassemblage tests.

Chapter 4
Comparisons of Experimental
and Analytically Predicted
Subassemblage Behaviour
4.1 Introduction
One of the specific aims of the experimental subassemblage study was to validate the pre
dictions of a sophisticated finite element analysis computer program capable of analysing
3-dimensional subassemblages. This section of the thesis describes how the computer
program was used to model each of the ten sub assemblage tests, and presents detailed
comparisons of various aspects of the experimentally observed and analytically predicted
behaviour.
4.1
4.2 The finite element analysis program.
The present version of the finite element computer program is the latest in a series of suc
cessively more complex enhancements to a program originally developed by Jones [4.1].
This original version of the program investigated the behaviour of isolated 2-dimensional
beam-columns restrained by non-linear end conditions. The program was modified in
the first instance by rufai [4.2] to include the effect of beams framing into the column.
This permitted the analysis of 2-dimensional beam column 'I' shaped subassemblages
which incorporated the characteristics of semi-rigid connections.
In parallel, the original column program was reformulated by EI-Kenfas [4.3]. Here, the
restriction of the program to in-plane response was removed, thus pernutting the analysis
of isolated 3-dimensional beam-columns with non-linear end restraints. The latest major
modification was carried out by Wang [4.4] who extended the work carried out by both
llifai and EI-Kenfas to develop a program capable of analysing 3-dimensional beam
column subassemblages which incorporated semi-rigid beam to column connections. This
latest version of the program, which was ultimately used to model the experimental
subassemblage tests reported herein, was recently used to predict the behaviour of the
small scale rigidly connected sub assemblages [4.5] investigated experimentally by Gent
and Milner [4.6].
The reader should refer to reference 4.4 for a comprehensive description of the program
operation and the analysis techniques employed. However, as a means of introduction,
a brief overview of the program is presented herein, the details of which have been ex
tracted from the program user manual [4.7].
4.2

4.2.1 Brief overview of computer program analysis techniques.
The analysis program divides the beam-column member into a number of discrete el
ements, the stiffness of which is calculated in accordance with the formulation by Ra
jasekaran [4.8]. To save computer storage without sacrificing accuracy, the internal de
grees of freedom are reduced using a static condensation technique. The overall stiffness
matrix, the applied load vector and the resulting displacement vector are partitioned in
the following form:
(4.1)
in which {d, } and {F, } are terms to be retained whilst {de} and {Fe} are those
terms to be condensed out. In the analysis, the terms to be retained are those degrees
of freedom at the ends of the member. A system of 7 degrees of freedom was adopted
and as a result,[K,] is a matrix of order 14.
From equation 4.1, the following relationship is obtained:
(4.2)
To incorporate various degrees of member restraint, the end reactions of each member
must be known. This is achieved by considering the expression:
(4.3)
in which [K,,-l ] and {6d,,-tl are the member stiffness matrix and the incremental
displacement vector at the preceding step respectively.
Having obtained the end reactions of the member I the diagonal stiffness matrix of the
non-linear semi-rigid connection attached to the member is calculated from the tangent
of the connection's user defined multi-linear moment-rotation curve.
Having assembled the stiffness matrices of all the members in the subassembJage and ap-
4.3

plied the appropriate boundary conditions, load is then applied. The program considers
a two stage loading sequence similar to that adopted in the experimental studies. Firstly, J
load is applied to the beam elements up to a pre-defined limit in pre-defined increments.
This is followed by column head loading, again applied in pre-defined increments. Gaus
sian elimination methods are used to solve the linear equations and the Newton-Raphson
iteration technique is used to follow the response ofthe subassemblage up to failure.
The principal features of the program are summarised below:-
1. The program uses a finite element technique to trace the full three dimensional
deformation response of the column.
2. The spread of yield across the section is taken into account by considering an
elastic-perfectly plastic stress·strain distribution.
3. In order to consider the spread of yield along the member as well as the
non-uniform distribution of internal forces within, the member is divided into
several longitudinal sections.
4. The beam to column connection is treated as a separate element. In instances
where a beam frames into the column flange, the connection can be located
at an offset from the column centreline to simulate column depth.
5. In the incremental analysis, the stiffness of the semi-rigid connection for the
current beam end moment is taken from a simplified multi-linear M-</> rela-
tionship defined by the user.
6. The effects of residual stress distributions, initial column deformations and
eccentricity of applied loading are all considered in the program.
4.4

4.3 Modelling of the experimental parameters.
A basic computer model of the subassemblage specimens was used to perform the pre
test parametric study discussed in section 2.2. The aim of that study was to quantify the
effect on the subassemblage of applying various experimental boundary restraints and
ultimately to develop an appropriate experimental test set-up. The basic model incor
porated only nominal values for member size, strength and initial deformation. In the
post-test verification of the program however, it was important that the actual properties
of the experimental subassemblage specimens were used.
4.3.1 Yield and residual stress.
It is evident from the data presented in the supplementary volume to this thesis [4.9]
that the measured residual stresses in the column sections were highly irregular and did
not conform with the idealised residual stress pattern for hot rolled 'H' sections [4.10].
This was attributed to the effect of roller straightening and the relatively light sections
used. From these measured stresses, it was impossible to apply a single residual stress
pattern which would be valid along the entire length of the column. As a result, all the
subassemblages were modelled assuming zero residual stress across the section.
The values of yield stress and Young's modulus, E, used for each column were those
measured from stub column tests performed on the column sections [4.9]. It was consid
ered that, in the case of the column, the yield stress derived from tensile coupon tests
would be less representative. In addition, the stub column tests tended to rationalise
the effect of the erratic residual stress distributions present in the sections. However, the
yield stress and Young's modulus used for the beam elements were derived from tests on
tensile coupons.
4.5

4.3.2 Initial deformations and geometric properties.
The actual dimensions and geometric properties of each of the subassemblage members
were used in the analytical modelling. The sizes and properties were extracted from the
dimensional survey of steel sections presented under reference 4.9. The program allows
the user to define the initial major and minor axis deformations and twists at five points
along the length of the column: The measured values which were used in the analysis
are summarised under section 2.4.
4.3.3 In-plane connection moment-rotation characteristics.
A full appraisal of the moment-rotation characteristics measured in the experimental
subassemblage tests is presented in chapter 6.
Ideally, the analytical model of a subassemblage specimen should have incorporated the
moment-rotation characteristics of each of the connecting beams observed from that par
ticular test. However, this was not always possible. Due to the very small connection
rotations induced in the earlier tests, the resolution of the measurement devices became
significant and hence the assessment of connection stiffness became very subjective. In
the analytical modelling, this problem was overcome by considering the moment- rotation
response of a similar connection, connected to the same column face but from another
test in which the net connection rotations were larger. Figures 4.1 and 4.2 show typical
multi-linear approximations to the true moment-rotation behaviour which were used in
the analytical models.
4.6

4.3.4 Out-of-plane and torsional moment-rotation responses.
Figure 4.3 shows that the net out-of-plane connection rotation is dependent on the mag
nitude of the absolute out-of-plane beam rotation relative to the twist of the head of the
column. In the experimental tests however, the measured absolute out-of-plane beam
rotation was almost negligible, typically less than 0.0015 radians .. This was principally
due to the short lengths of beam used, and the inevitable positional restraint from the
beam loading jacks. In addition, the column head was effectively restrained against twist
rotation due to the head load being applied eccentric to the column centreline. This was
confirmed by the very small column head twist rotations which were observed in the tests.
A situation therefore existed in which there was little potential for the development of
significant out-of-plane connection rotations. Consequently, changing the out-of-plane
connection characteristics in the analytical model had negligible effect on the predicted
subassemDlage behaviour. The out-of-plane flexibility of the connection was therefore
not considered in this analytical appraisal.
More important was the relationship between the major and minor axis column head
rotations with respect to the twist rotations of the connecting beams (figure 4.4). Al
though the torsional constant (J) of the beam section (254x102x22 UB) was relatively
small, the torsional restraint from the beam was significant due to the short beam length
and the warping restraint present at the beam support bearings. Depending on the pre
cise restraint to beam twist offered by the beam loading ram, the calculated torsional
stiffness of the beam at the connection was in the range 8.0 to 21.0 kNm/radian. The
total restraint to the column head from a pair of beams would therefore be in the range
16.0 to 42.0 kNm/radian. It is evident that this restraint stiffness is significantly less
~ than the in-plane initial stiffness, C. of even the most flexible semi-rigid connection.
However, as the torsional stiffness is a linear relationship at relatively large rotations,
4.7
the component of torsional restraint will become significant when the in-plane connection
stiffness tends to zero.
Figure 4.5 shows a comparison of the experimentally observed column head rotation
and beam twist rotation, measured adjacent to the connection, for test S8 in which web
cleats were used. The same data is also presented in figure 4.6 for the web and seat cleat
connections of test S7. It is evident from the plots that the magnitude of beam twist
was approximately equal to the rotation of the column and suggests therefore that the
connections possessed a high torsional stiffness capable of transferring the full torsional
action between the beams and the column. As a result, all the subassemblages were
modelled assuming that the connections had infinite torsional stiffness. This apparent
high connection torsional stiffness, also observed by Celikag [4.11], has formed the basis
of possible areas of further investigation proposed by the author (chapter 9).
4.3.5 Beam to column connection position.
In the computer model, beam elements are assumed to be connected to the column at
the point of intersection of the member centrelines. The effect of column depth can be
simulated by introducing a stiff panel zone to offset the position of the connections. For a
beam connected to the flange of the column, as shown in figure 4.7, it would appear that
the connection offset would need to be half the depth of the column section. However, it
is proposed by the author that for certain types of connection the offset to the effective
centre of beam support is significantly larger.
In the connection shown in figure 4.8, a large proportion of the vertical end reaction
from the beam is transferred to the column via the angle cleat on the lower flange of
the beam. In the region of the connection, the high in- plane stiffness of the beam's
web effectively acts as a stiff shear panel. As a result, shear forces in zone 'A' resulting
4.8

from an applied beam load will tend to be resisted by diagonal strut action within the
web of the beam. The component of the diagonal strut force to the lower cleat will be
resisted by a diagonal tension force to the cleat on the upper flange and, in instances
where the beam supports are fixed in position, by an axial compression in the beam. As
a result, a point load applied close to the connection will tend to be resisted solely by
strut action without necessarily inducing beam flexure. It is evident therefore that in a
simplified 'centreline simulation' of such a connection, in which the beam is supported
directly at the column face, larger beam span moments would be predicted than those
observed experimentally. For this reason, the author proposes that the 'effective point of
beam support' for a centreline simplified model is situated on the centreline of the beam
at a point corresponding with the limit of diagonal strut action.
The magnitude and inclination of the diagonal strut force, and hence the position of
effective beam support, is influenced by the stiffness of the 'tension cleat' on the upper
flange, and the restraint to longitudinal translation of the beam ends. This is illustrated
in figure 4.9 where structure type '1', in which both supports provide rigid positional
restraint, resists the applied load solely by strut action. However in structure '2', where
the right hand support permits longitudinal displacement, the diagonal strut force is
zero and the load is resisted by flexure of the cranked member spanning over the full
distance between the supports. For types of end support intermediate between those for
structures '1' and '2', it is expected that the load will be resisted partly by strut action
and partly by flexure.
In terms of the experimental tests, the nature of the positional restraint at the ends of the
beams was influenced by the rotation of the column head. For a connection which was
'opening' as a result of column head rotation there was a corresponding small horizontal
shift of the cleat on the bottom flange, equivalent to the supports of the structure shown
in figure 4.9 moving apart. This reduced the capacity for generating axial beam forces
to resist the diagonal strut force and thus increased the tendency for applied loads to be
resisted solely by beam flexure. Conversely, for a closing'connection in which a horizontal
4.9
shift of the cleat simulated the supports shown in figure 4.9 moving closer together, there
was a tendency to enhance the development of 'strut action'.
A secondary effect is the possible shift in the centre of beam support reaction acting on
the bottom flange cleat (figure 4.10) and hence the precise location of any diagonal strut
force. In a 'closing connection', the centre of force acting will tend to move away from
the root of the angle as a hogging moment is induced into the cleat. It is anticipated
that the opposite effect will be observed for an 'opening connection'. It is appreciated
however, that this secondary effect would only be apparent in a connection employing a
stiff supporting cleat subjected to large rotations.
To summarise, it is proposed that the effective centre of beam support for a 'centreline
simplified model' acts at a distance away from the face of a supporting member. The
offset distance is expected to be larger for a connection which is 'closing' as opposed to
'opening' and can therefore vary during the course of a test. However, in the present
version of the computer program it is not possible to accurately model this phenomenon.
The author has therefore made some reasoned assumptions to derive a consistent effective
connection 'offset' for different connection types and different beam locations.
Typically, for a connection with a direct bearing support to the lower flange of the beam,
the effective centre was considered to act at a distance of half the beam depth (125mm)
away from the face of the support. This effectively assumed a 45 degree inclination
for any strut force which may develop. For a web cleat connection, where there is no
direct bearing support to the flange and consequently a reduced tendency for strut ac
tion, a nominal offset of SOmm was assumed. As shown in table 4.1, these offsets were
modified in the case of a predominantly 'opening' or 'closing' connection to take into
account the effects described above. For example, beam 2 in tests SS, S6 and S7 was
a 'non-paired' beam connected to the minor axis of the column. In this arrangement
there was the potential for large column head rotations resulting in a predominantly
'opening' connection. The offset to the connection with beam 2 was therefore specifi-
4.10
cally chosen to be less than that of the same connection type to either beam 1 or beam 3.
4.3.6 Column end conditions.
All the subassemblage test specimens incorporated a base support arrangement which
prevented both major and minor axis column rotations. The adopted base- plate detail
prevented any twist rotation at the base and was of a sufficient thickness to resist warping
deformations. Warping ofthe section was also resisted at the head where load was applied
to the column through a 25mm thick cap-plate fully welded to the member. These column
boundary conditions were incorporated into the finite element models of the tests.
It has been shown in previous studies of biaxially loaded columns [4.12] that the presence
of warping restraint at the ends of a column, and the resulting increase in the torsional
stiffness, can increase the ultimate capacity by as much as 10%. This is confirmed in the
following sections which show that only relatively small amounts of mid-column twist
rotation occurred prior to column failure.
4.4 Comparisons of experimental and analytical behaviour.
Table 4.2 presents a summary of the comparisons between experimental and analytically
predicted ultimate capacities. It is evident that with the exception of test S5, the max
imum error between the actual and predicted ultimate capacities is 7% and in the case
of eight of the tests, the maximum error reduces to 4%. The following sections present
graphical comparisons of more detailed aspects of the sub assemblage behaviour for each
4.11

of the 10 tests. Salient features of the one-to-one comparisons are highlighted and pos
sible explanations are proposed for any discrepancies which have been observed.
4.4.1 5ubassemblage test 51.
Figures 4.11 and 4.12 show the predicted and observed deformation at the centre of
column SI, whilst figures 4.13 to 4.15 show comparisons of the column bending moments.
As reported in section 2.3.1, the sliding support bearings to beam 1 locked part way
through the test. In addition, it would appear from the dramatic change in slope of ma
jor axis moment shown in figure 4.13 that there was a shift in the major axis eccentricity
of the column head load during the second phase of the test. This was partly attributed
to not maintaining the initial 'nip load' at the head of the column during the beam
loading phase of the test - a situation which was rectified in subsequent tests. It was not
possible to model exactly these changes in the experimental boundary conditions and as
a result, there are small discrepancies between the observed and predicted subassemblage
behaviour.
4.4.2 Subassemblage test 82.
Figures 4.16 and 4.17 show comparisons of the predicted and observed deformation at
the centre of column 82, whilst figures 4.18 to 4.20 show comparisons of the column
bending moments. Figure 4.21 compares the span and connection major axis bending
moments for subassemblage beam number 3.
4.12

It is evident that in this instance, the analytical model closely simulated all aspects of
experimental behaviour. Of particular interest was the ability to predict the shedding of
major axis moment at the column top illustrated in figure 4.18. Also of interest was the
moment shedding at the connection of beam 3 illustrated in figure 4.21. As expected,
the reduction in connection moment as failure approached resulted in an equal increase
in the beam span moment, thus maintaining the 'depth' of the free bending moment.
4.4.3 Subassemblage test S3.
Figures 4.22 to 4.26 show comparisons of the main components of column deformation
and bending moment for subassemblage test S3. Figure 4.27 compares the predicted
and observed major axis span and connection bending moments for sub assemblage beam
number 1.
As with test S2, the analytical model appeared to closely simulate all aspects of the
observed experimental behaviour. Unlike the 'opening' connection of beam 3 discussed
above for test 52, the 'closing' connection of beam 1 for test 53 shows a negligible change
in bending moment after the application of the column loads. This can be explained by
considering figure 4.28 which shows that the stiffness of an initially 'closed' connection
which then 'opens', as in the case of beam 3 test S2, is significantly larger than the
stiffness of a connection which continues to 'close', as in the case of beam 1 tests 53. For
a given column head rotation, an 'opening' connection on one side of the column can
therefore be expected to show a greater reduction in applied moment than the increase
in moment experienced by the 'closing' connection on the opposite side of the column.
4.13
4.4.4 5ubassemblage test 54.
Figures 4.29 to 4.33 show comparisons of the main components of column deformation
and bending moment for subassemblage test S4. This was the only subassemblage in
the test series which was constructed with just two beams, thus representing a 'corner'
column. It is evident from the plots that the analytically predicted data shows a good
correlation with that measured in the experiment.
It is interesting to note that despite the high stiffness of the flush-end plate connection
it is evident from the plots that only a very small minor axis moment was transferred
to the head of the column. This was due to the relatively high flexibility of the column
and the limited rotational capacity at the end of the short, stiff beams.
4.4.5 5ubassemblage test 55.
Figures 4.34 to 4.38 show comparisons of the main components of column deformation
and bending for subassemblage test S5. In this particular test there appears to be a
discrepancy between the observed and predicted ultimate capacity of the column.
Test S5 used web cleat connections throughout and was the first of a series of three tests
in which Beam 2 framed into the web of the column. A situation therefore existed in
which the minor axis of the column was restrained at the head by a single web cleat
connection - the least stiff minor axis column restraint condition considered in the series
of experimental tests. In hindsight, this was an unsatisfactory test arrangement. The
parametric study reported in section 2.2.2, which investigated the effect of rotational
restraint at the column base, had shown that small variations in the rotational stiffness
of relatively flexible restraints had a considerable effect on column behaviour.
4.14

This particular subassemblage test was therefore very sensitive to possible experimental
error in the rotational restraint provided to the column head. It is suggested that due
to the relatively small restraint from the connections, the inevitable restraint from the
spherical loading seat at the column head could have become significant and thus en
hanced the performance of the experimental specimen.
4.4.6 Subassemblage test S6.
Figures 4.39 to 4.43 show comparisons of the main components of column deformation
and bending for subassemblage test S6.
This particular sub assemblage specimen was deliberately arranged with only a very small
initial minor axis deformation at the column centre. The aim was to assess the ability
of the program to predict the behaviour of a restrained column with a bifurcation type
failure mode. It is evident from the plots that the computer has given a very close pre
diction of the ultimate column capacity. However, the comparisons of deformation at the
column centre indicate a discrepancy which was attributed to malfunction of a particular
displacement transducer. This is highlighted by two curious 'spikes' in the experimental
data plot of twist rotation shown in figure 4.40. It is evident that without these 'data
spikes', notably the one at the origin, the predicted and observed twist rotations would
be very similar.
4.15
4.4.7 Subassemblage test S7.
Figures 4.44 to 4.48 show comparisons of the main components of column deformation
and bending for subassemblage test S7.
Again, the computer program gives a very close prediction of the ultimate capacity
of the column. However, it is clear from the plots that there is a marked difference
in both moment and deformation characteristics at loading levels greater than 65% of
the failure load. This is characterised by the rapid increase in the experimental twist
rotation observed at the column centre at a total applied load of 325kN (figure 4.45).
This phenomenon coincided with an unusual distribution of bending moments at the
column centre. Figure 4.46 shows that at a corresponding level of load, the minor axis
moment at the column centre increased rapidly, deviating from the usual smooth curve.
In addition, the major axis moment at the column centre increased rapidly, deviating
from the expected 'nearly linear' path, only to revert to an expected value as failure
approached. The behaviour was also accompanied by an unexpected large decrease in
the major axis moment at the column head (figure 4.47).
The fact that this behaviour was monitored in terms of both force and deformation sug
gested that, rather than being the result of an instrumentation malfunction, the column
did experience a sudden loss of stiffness. As mentioned in reference 4.9, measurements
of residual stress had indicated that the column sections had been excessively 'roller
straightened'. It is possible therefore that at some point along the length of the column
there was a high concentration of residual stress which caused a rapid spread of mate
rial yield across the section at an applied load of 325kN: This would have the effect of
reducing the column stiffness and causing the 'kink' in the minor axis moment plot of
figure 4.46.
4.16
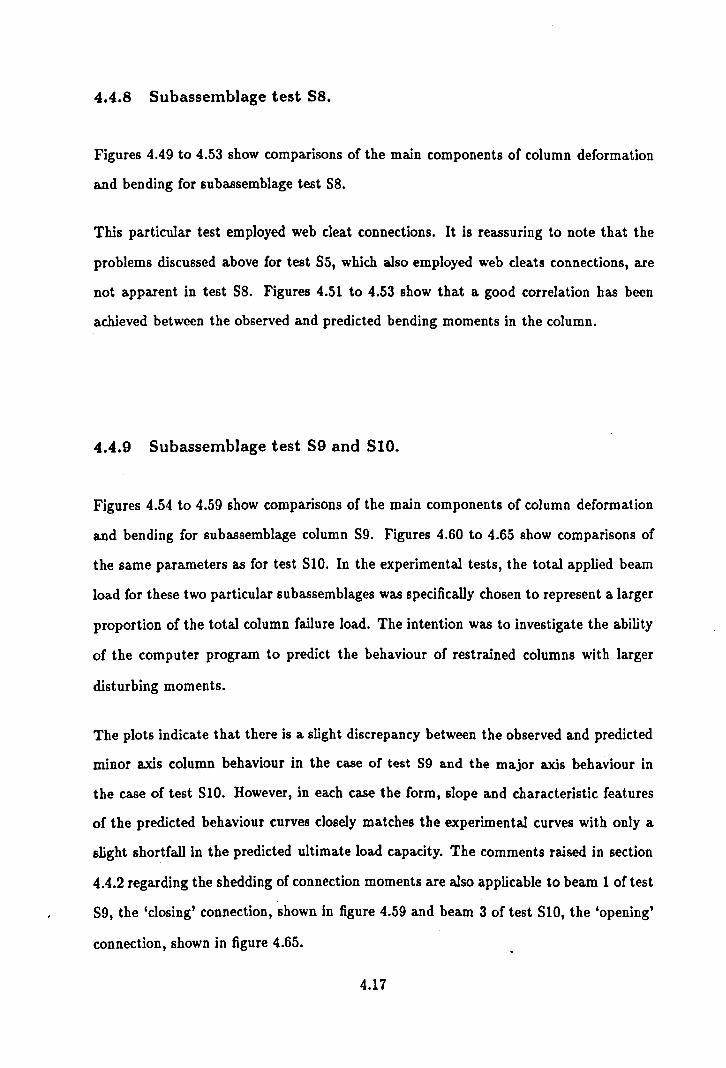
4.4.8 5ubassemblage test 58.
Figures 4.49 to 4.53 show comparisons of the main components of column deformation
and bending for subassemblage test S8.
This particular test employed web cleat connections. It is reassuring to note that the
problems discussed above for test S5, which also employed web cleats connections, are
not apparent in test S8. Figures 4.51 to 4.53 show that a good correlation has been
achieved between the observed and predicted bending moments in the column.
4.4.9 Subassemblage test S9 and S10.
Figures 4.54 to 4.59 show comparisons of the main components of column deformation
and bending for subassemblage column S9. Figures 4.60 to 4.65 show comparisons of
the same parameters as for test SlO. In the experimental tests, the total applied beam
load for these two particular sub assemblages was specifically chosen to represent a larger
proportion of the total column failure load. The intention was to investigate the ability
of the computer program to predict the behaviour of restrained columns with larger
disturbing moments.
The plots indicate that there is a slight discrepancy between the observed and predicted
minor axis column behaviour in the case of test S9 and the major axis behaviour in
the case of test S10. However, in each case the form, slope and characteristic features
of the predicted behaviour curves closely matches the experimental curves with only a
slight shortfall in the predicted ultimate load capacity. The comments raised in section
4.4.2 regarding the shedding of connection moments are also applicable to beam 1 of test
S9, the 'closing' connection, shown in figure 4.59 and beam 3 of test S10, the 'opening'
connection, shown in figure 4.65.
4.17
4.4.10 Investigation of the sensitivity of the predicted behaviour.
It is evident from the preceding section that a close correlation has been achieved between
the experimental and the analytical behaviour. However, it was considered prudent
to carry out a further study which investigated the effect of small variations in the
magnitude of the 'input parameters' used in the analytical model. The accuracy of these
input parameters, e.g. yield stress, initial deflection, section area and moment rotation
response, were themselves subject to possible experimental measurement errors. The
aim was to assess whether the sub assemblage models were 'over-sensitive' to 'acceptable'
deviations in the measured parameters.
The analytical model for subassemblage test S2 was used in the study. this particular
model gave the closest correlation with the experimental behaviour (section 4.4.2). This
particular model was denoted S2A and was used as the datum for the study. The other
models considered were as follows:-
• Model S2B • The initial minor axis central deflection was reduced from 9.0mm
to 8.5mm. (The resolution of the method of initial deformation measurement was
considered to be O.5mm).
• Model S2C -The yield stress and Young's modulus were increased by 5% to
327N/mm2 and 217000 N/mm2 respectively.
• Model S2D • The sectional area of the column was increased by 5% to 28.97cm2 •
This was effected by increasing the flange thickness in the model from 6.45mm to
6.77mm.
• Model 2DE - The moment, and hence the loading and unloading stiffness, of the
multi-linear moment rotation response used in the model was increased by 10%
4.18

(see figure 4.66).
Table 4.3 shows the predicted ultimate capacities and the minor axis bending moments
at a load of 400kN for each of the above models. The table also gives an indication of
the performance of the models with respect to the 'datum model' S2A.
It can be seen from the table that, as expected, experimental errors in the measurement
of the column section area and material yield stress have a comparable effect on the
ultimate capacity (models S2C and S2D). However, these particular parameters can be
measured to a reasonable degree of accuracy, typically better than 3%, by following
well established experimental procedures [4.13]. It was anticipated that the variation in
thickness of the column material could affect the measurement of small initial deflections
by up to 8% whilst the anticipated error in the measurement, and subsequent multi
linear simplification, of the connection moment rotation response could be as high as
10%. However, it is pleasing to note that models S2B and S2E show that variations
in these particular parameters had only a very small effect on the performance of the
subassemblage.
It can be concluded therefore that the subassemblage models do not appear unduly
sensitive to inevitable errors in the experimentally measured input parameters which
were studied.
4.5 Conclusions on the comparisons of observed and pre
dicted behaviour.
In the previous section, the graphical comparison of subassemblage parameters shows
that, in most cases, there is a very close agreement between the experimental and an
alytical data. In instances where there are numerical discrepancies between the sets of
data, it is reassuring to note that the form and characteristic shape of the data plots are
4.19

very similar.
The principal objective of the experimental study has been achieved by verifying that
the computer program can indeed predict the behaviour of flexibly connected subassem-
blages. The degree of correlation which has been achieved justifies the initial time and
effort which was expended in the development of the experimental set-up. This included
the extensive parametric study used to determine the optimum subassemblage configu
ration (section 2.2); a means ofinducing predefined single curvature initial deformations
(section 2.3.3); the development of a device for measuring 3- dimensional deformation
(section 3.2) and also the development of a technique which improved the ability of strain
gauges to monitor elastic-plastic behaviour (section 3.3).
References.
4.1 Jones, S.W., 'Semi-rigid connections and their influence on steel column behaviour', Ph.D. Thesis, Department of Civil and Structural Engineering, University of Sheffield, U.K., 1980.
4.2 Hifai, A.M., 'Behaviour of column subassemblages with semi-rigid connections', Ph.D. Thesis, Department of Civil and Structural Engineering, University of Sheffield, U.K., June 1981.
4.3 EI-Khenfas, M.A., 'Analysis 01 biaxial bending and torsion of open section beam columns', Ph.D. Thesis, Department of Civil and Structural Engineering, University of Sheffield, U.K., 1987.
4.4 Wang, V.C., 'Ultimate strength analysis of three-dimensional structures with flexible restraints', Department of Civil and Structural Engineering, University of Sheffield, U.K., 1988.
4.5 Wang, Y.C. and Nethercot, D.A., 'Ultimate strength analysis of threedimensional column subassemblages with flexible connections', Journ. Construct. Steel Research, Vol. 9, No.4, 1988, pp. 235-264.
4.20
4.6 Gent, A.R. and Milner, H.R., 'Ultimate load capacity of elastically restrained H-columns under biaxial bending', Proc. Inst. Civil Engrs., Vol 43, December 1968, pp. 1685-1704.
4.7 Wang, Y.C., 'Ultimate strength analysis of three-dimensional structures with flexible restraints. Computer program', User manual, Department of Civil and Structural Engineering, University of Sheffield, U.K., 1989.
4.8 Chen, W.F and Atsuta, T., 'Theory of beam-columns', Chapter 12, Vol. 2, McGraw-Hill International Book Company, 1980.
4.9 Gibbons, C., 'The strength of biaxially loaded beam-columns in flexibly connected steel frames. Volume 2: A survey of the mechanical and geometric properties of structural steel sections', Ph.D. thesis, Department of Civil and Structural Engineering, University of Sheffield, Dec. 1990.
4.10 Lay, M.G. and Ward, R., 'Residual stresses in steel sections', Aust. Inst. Steel Construct., Steel Construction, 3 (3), 1969, pp. 2-20.
4.11 Celikag, M., 'Moment-rotation behaviour of steel beam-to-column connections.', Ph.D. Thesis, Department of Civil and Structural Engineering, University of Sheffield, U.K., Februrary 1990.
4.12 Birnstiel, C., 'Experiments on H-columns under biaxial bending', Journ. Struct. Div., Am. Soc. Civil Engrs., Vol. 94, No. STIO, Oct. 1968, pp. 2424-2449.
4.13 'Guide to stability design criteria for metal structures', 4th Edition, Ed. T.V. Galambos, 'Technical Memorandum No.2: Notes on the compression testing of metals', Wiley-Interscience, 1988, pp. 703-717.
4.21
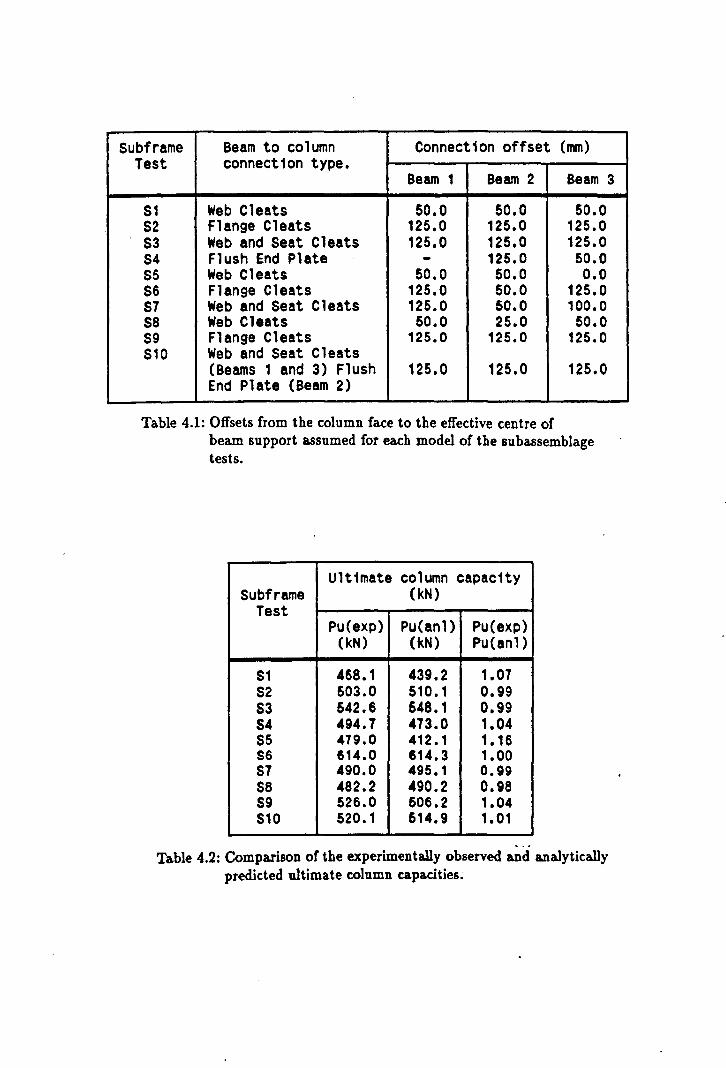
Subframe Beam to column Connection offset (IIITI ) Test connection type.
Beam 1 Beam 2 Beam 3
S1 Web Cleats 50.0 50.0 50.0 S2 Flange Cleats 125.0 125.0 12S.0 S3 Web and Seat Cleats 125.0 125.0 125.0 S4 Flush End Plate - 125.0 50.0 SS Web Cleats 50.0 50.0 0.0 S6 Flange Cleats 125.0 50.0 12S.0 S7 Web and Seat Cleats 125.0 50.0 100.0 sa Web Cleats 50.0 2S.0 50.0 S9 Flange Cleats 12S.0 125.0 12S.0 S10 Web and Seat Cleats
(Beams 1 and 3) Flush 125.0 125.0 125.0 End Plate (Beam 2)
Table 4.1: Offsets from the column face to the effective centre of beam support assumed for each model of the sub assemblage tests.
Ultimate column capacity Subframe (kN)
Test Pu(exp) Pu(an1) Pu(exp)
(kN) (kN) Pu(anl)
S1 468.1 439.2 1.07 S2 503.0 510.1 0.99 S3 542.6 648.1 0.99 S4 494.7 473.0 1.04 S5 419.0 412.1 1.16 S6 614.0 614.3 1.00 S7 490.0 495.1 0.99 sa 482.2 490.2 0.98 S9 526.0 506.2 1.04 S10 520.1 514.9 1.01
Table 4.2: Comparison of the experimentally observed and analytically predicted ultimate column capacities.

Minor axis moment at the Ultimate column capacity Subframe column centre - P = 400kN
Test Myy Myy Pu Pu
(kNm) Myy(S2A) (kN) Pu(S2A)
S2A 3.51 1.000 510.1 1.000 S28 3.35 0.954 513.3 1.006 S2C 3.36 0.957 534.4 1.047 S2D 3.37 0.960 530.9 1.041 S2E 3.41 0.972 514.3 1.008
. Table 4.3: Analytically predicted ultimate capacities and minor axis moments for supplementary models S2A to S2E.

II! z -66
i i .., oS -c c!
XiO-1 LOCATION: Beam 3 10
5
o :5
-10
NODE: In plane
o 0 Experimental data. -15
-20 Multi-linear fit
-25
-30
-35
-40
scanslTotal: 501 92 SUBASSEMBLASE 1
• • • • • •
. ! : II
° 0/
-45+-----~----~----r-----r-~~~----~---~----_T---~---_r---~ -10 -9 -8 -7 -6 -5 -4 -3 -2 -1 0 2
RotatiDn rldians I 1000
Figure 4.1: Multi-linear approximation to the M - 4> response of a web cleat connected to the minor column axis.
LOCATION: Beam 3 MODE: In plane SUBASSEMBLAGE 7 11
10 .!-- ---0
-....- .....-9 .~
'" B /
~ 7 ;/ z .:.0:
6 .... c I Experimental data I 5 0 0 .., .4 / Multi-linear fit. S ...
I ! 3
2
1 /
1 2 3 .4 5 6 7 B 9 10 11 12 13 14 RotltiDn radians I 1000
Figure 4.2: Multi-linear approximation to the M - 4> response of a web and seat cleat connected to the major column axis.
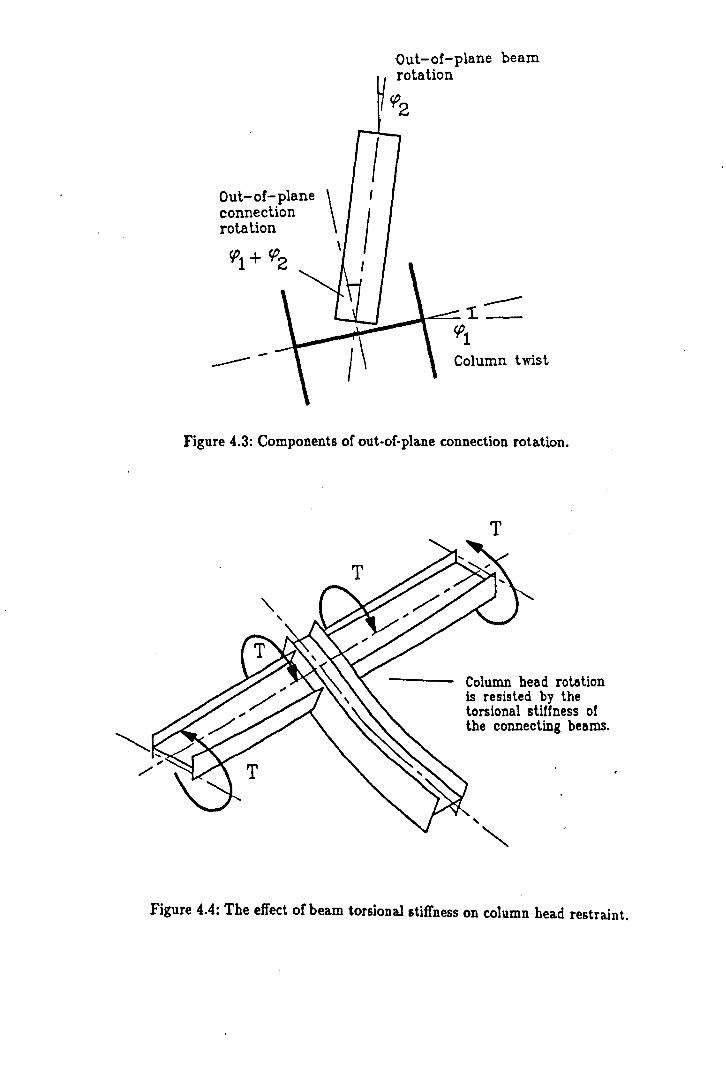
Out-of-plane connection rotation
---
Out-of-plane beam rotation
---a--=::;.- 1:. -rf>1 Column twist
Figure 4.3: Components of out-of-plane connection rotation.
T
Column head rotation is resisted by the torsional stiffness of the connecting beams.
Figure 4.4: The effect of beam torsional stiffness on column head restraint.
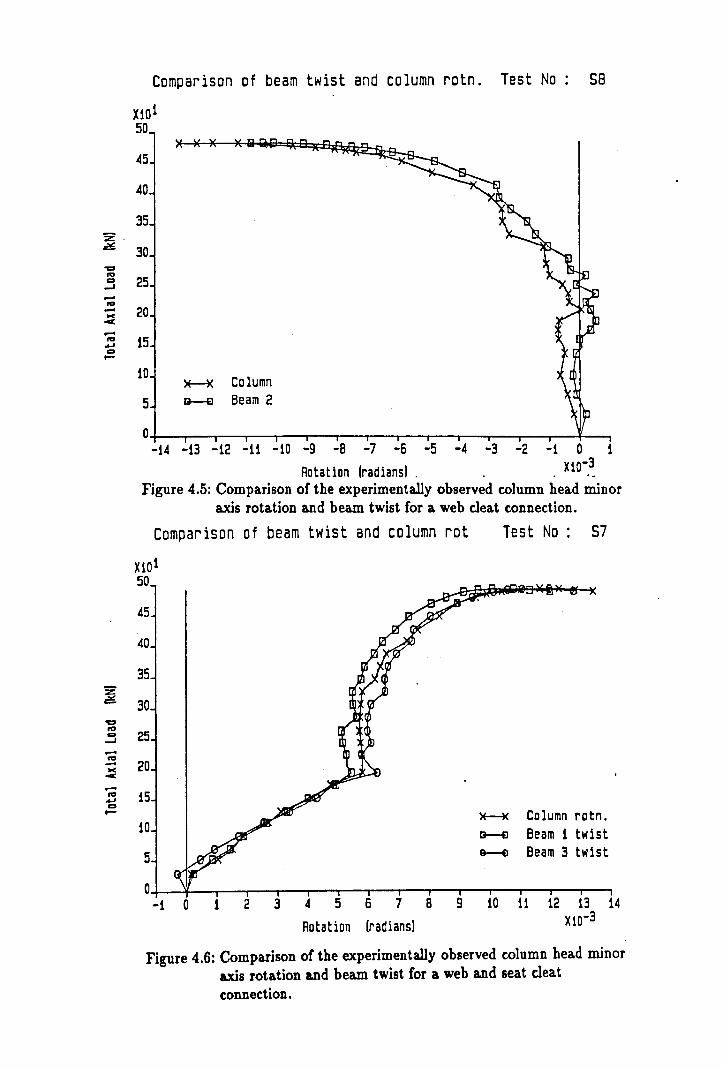
-.::0 ... 0 -' ..-... -K cr: ..-... ..... 0 ......
z = -.::0 I'D c:o -' ..-co --= cr: .-co ..... c:o ......
Comparison of beam twist and column rotn. Test No 58
Xl0l 50
45
40
35
30
25
20
15
10
5 ~ Column G--e Beam 2
O+--.--,--.--.---r--r--r--r--r--r--~~--~-4~ -14 -13 -12 -11 -10 -9 -8 -7 -6 -5 -4 -3 -2 -1 0 1
Rotation Iradiansl . . . X10-.~ Figure 4.5: Comparison of the experimentally observed column head minor
axis rotation and beam twist for a web cleat connection.
Comparison of beam twist and column rot
Xl01 50
45
40
35
30
25
20
15
10
5
0 -1 0 1 2 3 4 5 6 7 B 9
Rotation Iradiansl
Test No: 57
Column rotn. Beam 1 twist Beam 3 twist
10 11 12 13 14 X10-3
Figure 4.6: Comparison of the experimentally observed column head minor axis rotation and beam twist for a web and seat cleat connection.

Typical beam to· column connection
Stiff panel zone to offset the connection from the column centreline.
Analytical model of the connection.
Figure 4.7: Offset required in the analytical model to simulate column depth.
No column rotation due to symmetrical loading of beams.
I I
I I
I I -I-I
I I
I I
I
A Beam end restraint prevents longitudinal translation of the beam.
\ --~~
Effective centre ot beam supporl
Centre of beam reaction acting on the supporting cleal
Figure 4.8: Typical connection showing the effect of 'strut action'.

Structure type '1'
i---.---~' ---/--- ----/' ----- 000 (jj~ w
structure type '2'
Figure 4.9: Two similar structures illustrating the effect of permitting support displacement.
d'
Effective centre of the vertical reaction on the cleal
Connection 'closing'
d'
Reduced offset to the effective centre of beam supporl
Connection 'opening'
Figure 4.10: Possible shift in the effective centre of beam support for an 'opening' and a 'closing' connection.

z ~
"1:2
'" c::> -J -'" -..c -c -'" .... c::> t-
Deflections at the column centre. Test No: S1
X10 1 50
45
40
35
30
25
20
15 Expmt - Minor >E---i(
10 B--fI Expmt - Maior G---i) Analy - Minor
5 11--11 Analy - Major
0 -5 0 5 10 15 20 25 30
Deflection (mm)
Figure 4.11: Experimental and analytical mid-column deflections, S1.
Twist rotations at the column centre.
Xl0i" 50
45
40
35
30
25
20
15
10
5
Test No: S1
~ Experimental IJ-f] Analyt1cal
O+-----~~----~-----.,---_.--------r_----_.--------._--~----__, -2 o 2 468
Twist (radians) 10 12 14 16
XlO-3
Figure 4.12: Experimental and analytical mid-column twist rotations, 51.
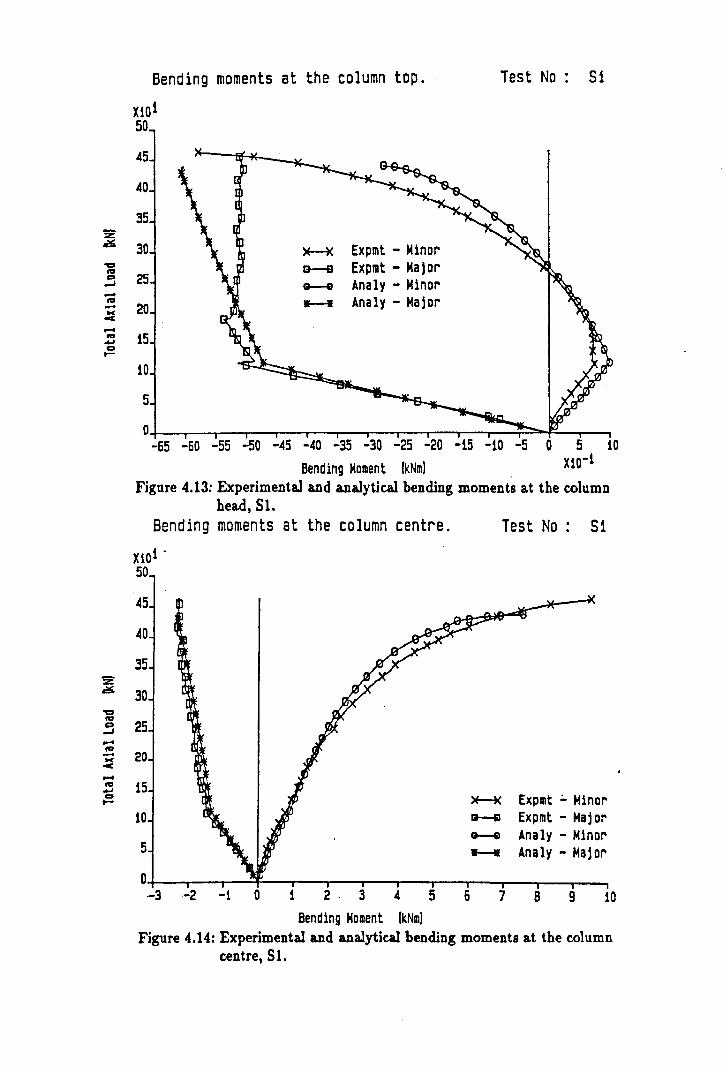
z .:os. 'a
"' co ...J -"' -w: < -"' 4J C)
t-
z .:os. 'a
"' c::I ...J -~ >< < -"' 4J co t-
Bending moments at the column top. Test No
Xi01 50
45
40
35
30
25
20
15
10
5
0 -65
~ Expmt - Minor G--B Expmt - Major G--e Analy - Minor ____ Analy - Major
-60 -55 -50 -45 -40 -35 -30 -25 -20 -15 -10 -5 Bending Moment (kNm) .
o
51
10
Figure 4.13: Experimental and analytical bending moments at the column head, 51.
Bending moments at the column centre. Test No : S1
Xi01 . 50
45
40
35
30
25
20
15 )f-i( Expmt ;.. Minor
10 IJ--i] Expmt - Major
5 c.--e Analy - Minor If-tI Analy - Major
0 ·-3 ·-2 -1 0 1 2 . 3 4 5 6 7 8 9 10
Bending Moment (kNm) Figure 4.14: Experimental and analytical bending moments at the column
centre, 51.

·z ~
'= '" co
...J
.-fa .... >< -c .-'" ~ co I-
Xi01 50
~5
~o
35
30
25
20
15
iO
5
0 -6
Bending moments at the column base.
-4 -2 0 2 Bending Moment
~
(kNm!
6
Test No 51
~ Expmt - M1nor B-£I Expmt - Ma j or G-iI Analy - M1nor ___ Analy - Major
8 iO 12
Figure 4.15: Experimental and analytical bending moments at the column base, Sl.

Deflections at the column centre.
u0 1 55
50
45
40
Z 35 ~.
". 30 I'D C>
-oJ - 25 I'D .-J<
20 --I'D ~ 15 C> t-
10
5
0 -15 -10 -5 0 5 10 15
Deflection (mm)
Test No' S2
~ Expmt - minor B--e Expmt - major G--() Analy - Minor
---- Analy - Major
20 25 30 35
Figure 4.16: Experimental and analytical mid-column deflections, S2.
Twist rotations at the column centre.
X10 1 55
50
45
40
Z 35 ~
~ 30 C> -oJ
- 25 I'D .-J<
- 20 -... ~ 15
10
5
Test No: S2
)f--K Experimental G-EI Analytical
40
O+-~---r--~~---r--r-~--~--~~--~~~~~ -5 0 5 10 15 20 25 30 35 40 45 50 55 60 65
Twist Iradians) X10-3
Figure 4.17: Experimental and analytical mid-column twist rotations, S2.
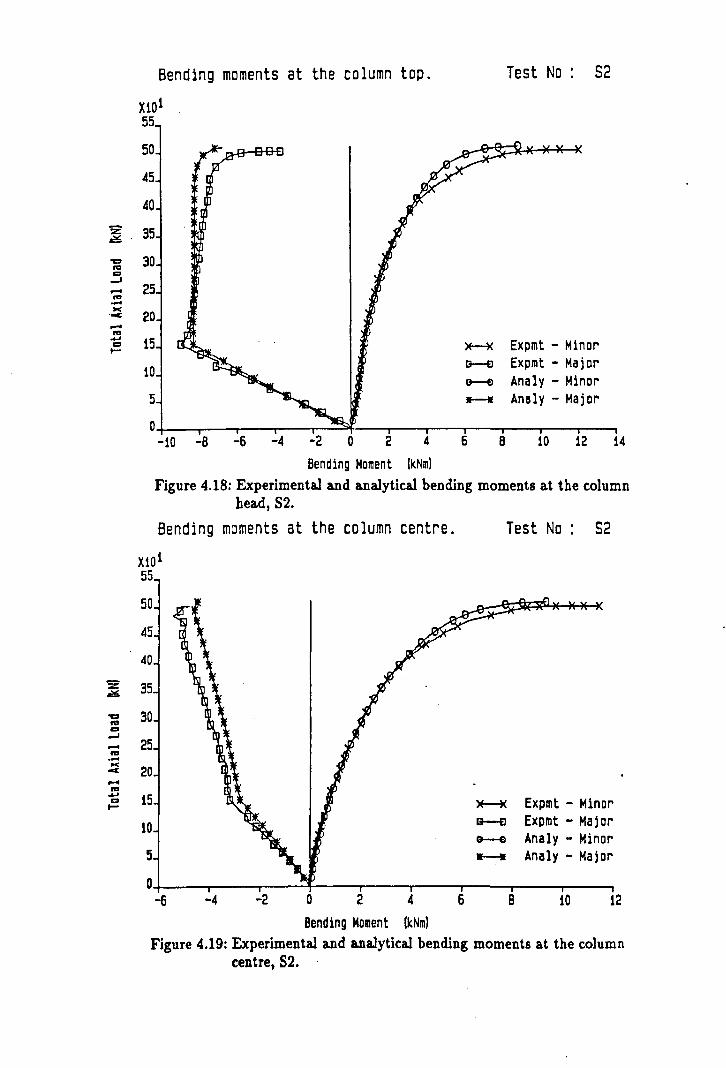
Bending moments at the column top.
Xi01 55
50
45
40
Test No· S2
Z 35 ~
'CI I'D co
-oJ -I'D .->< .--I'D ..... co .....
z ~
'CI I'CI co
-oJ -I'CI .-K c -I'D ..... co .....
30
25
20
15 ~ Expmt - Minor
10 a--£I Expmt - Major e---il Analy - Minor
5 w--t! Analy - Major
0 -10 -8 -6 -4 -2 0 2 4 6 8 10 12 14
Bending Moment. (kNm)
Figure 4.18: Experimental and analytical bending moments at the column head, 82.
Bending moments at the column centre. Test No: S2
X101 55
50
45
40
35
30
25
20
15 ~ Expmt - Minor
10 a--£J Expmt - Major G--f) Analy - Minor
5 It--I! Analy - Major
0 -6 -4 -2 0 2 4 6 8 10 12
Bending Moment (kNmJ Figure 4.19: Experimental and analytical bending moments at the column
centre, 52.
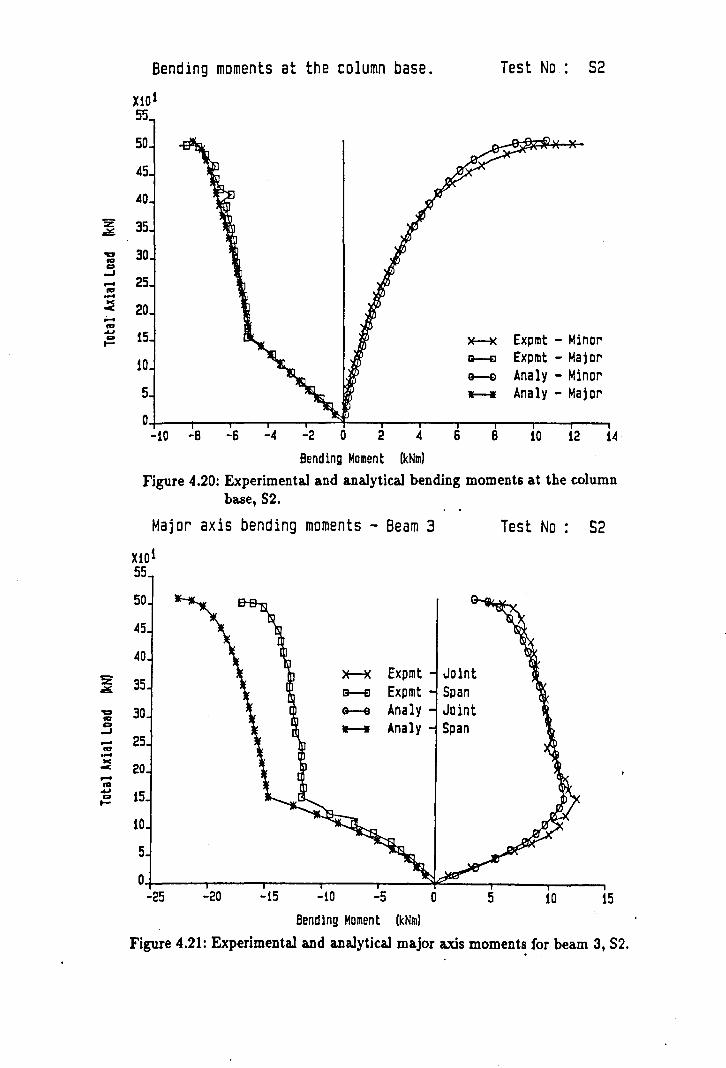
z C6.
'"ell to co ..J -to ..... ~ ..... to ~ CI t-
z C6.
'"ell to co ..J -to ..... to< --to ~ CI t-
Bending moments at the column base.
Xl0l 55
50
45
40
35
30
25
20
15
10
5
0 -10 -8 -6 -4 -2 0 2 4
Bending Moment (kNm)
Test No' 52
)f-+( Expmt - Minor G--£I Expmt - Major 9--E) Analy - Minor JIo-.4 Analy - Major
6 8 10 12 14
Figure 4.20: Experimental and analytical bending moments at the column base, 82.
Major axis bending moments - Beam 3
Xioi 55
50
45
40
35
30
25
20
15
ID
5
0 -25 -20 -15 -10
)f--i( Expmt Joint B-£I Expmt Span G-El Analy Joint 1-4 Analy Span
-5 o Bending Moment (kNm)
Test No: S2
5 10 15
Figure 4.21: Experimental and analytica.1 major axis moments for beam 3, S2.

Deflections at the column centre. Test No: 53
Xi01 55
50
45
40
z 35 Iii!£
..., 30 "' co
...J - 25 ... .... >< 20 --... Expmt - Minor ..... 15 ~ co t-
G--£I Expmt - Major 10 e-e Analy - Minor 5 11--4 Analy - Major
0 -10 -5 0 5 10 15 20 25 30 35 40 45 50 55
Deflection (mm)
Figure 4.22: Experimental and analytical mid-column deflections, S3.
Twist rotations at the column centre. Test No : 53
XiOi 55
50
45
40
z 35 Iii!£
..., 30 "' co ...J - 25 ... .-~ 20 -"' ..... 15 co t-
10 ~ Experimental
5 G-£J Analytical
0 -5 0 5 10 i5 20 25 30 35 40
Twist (radiansl X10-3
Figure 4.23: Experimental and analytical mid-column twist rotations, S3.

z ~
-= co CI
...J -to .-~ ...: -ftI ... CI t-
z ~
-= to CI
...J -ftI ..... ~ -to ... CI t-
Bending moments at the column top.
Xt01 55
50
45
40
35
30
25
20
15
10
5
C -12 -10 -8 -6 -4 -2 0 2 4
Test No: S3
~ Expmt - Minor 9--£1 Expmt - Major G--EI Analy - Minor II--I! Analy - Major
6 8 10 12 14 16 18
Bending Moment [kNm)
Figure 4.24: Experimental and analytical bending moments at the column head, S3.
Bending moments at the column centre. Test No: S3
X101 55
50
45
40
35
30
25
20
15 ~ Expmt - -Minor
10 G-El Expmt - Major e--E) Analy - Minor
5 II--W Analy - Major
0 -6 -4 -2 0 2 4 6 8 10 12 14 16 18
Bending Moment [kNm)
Figure 4.25: Experimental and analytical bending moments at the column centre, S3.

z i!5.
'1:2 co 0 -J -co .... w --co ...
'0 t-
Z ~
"C co 0
...J
--co -K --co ... 0 t-
Bending moments at the column base.
X101 55
50
45
40
35
30
25
20
15
10
5
0 -8 -6 -4 "2 0 2 4 6 8
• . ._. Benalng Moment tkNmJ
Test No 53
~ Expmt - Minor G--£l Expmt - Major G--il Analy - Minor
---- Analy - Major
10 12 14 16 18 20
Figure 4.26: Experimental and analytical bending moments at the column base, 53.
Major axis bending moments - Beam 1 Test No : 53
XiOl 55
50
45
40
35 ~ Expmt - Joint
30 a---e Expmt - Span G--e Analy - Joint
25 .-.. Analy - Span 20
15
10
5
0 -20 -18 -16 -14 -12 -10 -8 -6 -4 -2 0 2 4 6 8 10 12
Bending Moment (kNm) Figure 4.21: Experimental and analytical major axis moments for beam 1,
53. .

..... c: GI e c e c: c ~ .... ~ c: c ...
end of the beam loading phase. \
connection 'opens' under column head load.
rotation l.el
connection 'closes' under column head load.
Figure 4.28: Typically M - 4> response for a 'closing - closing' connection and a 'closing - opening' connection.
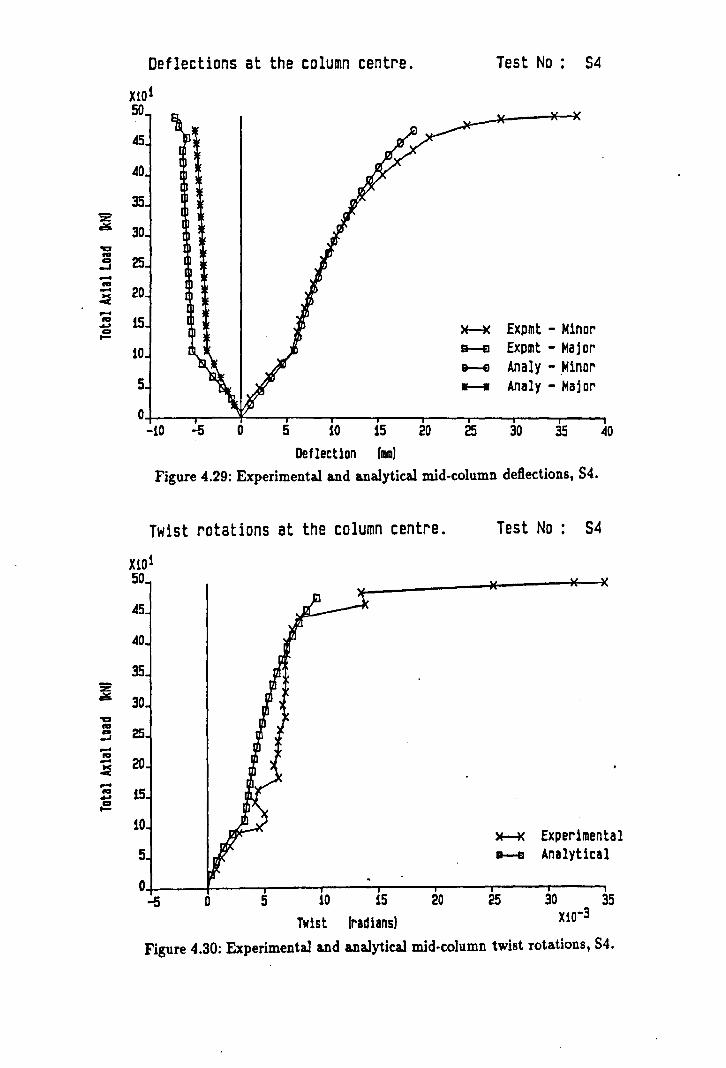
z C!S
"CI ... c::o -' -... --~ -lOll .u c::o t-
Z &Ii
"CI .. c::o -' -no -~ -lOll .u CI t-
Deflections at the column centre.
X10 1 50
45
AO
35
30
25
20
15
10
5
Test No: 54
Expmt - Minor Expmt - Major Analy - ,Minor Analy - Major
O+----r--~--_,,---.---~--_r--~----r_--~--_ -10 -5 0 5 10 15 20 25 30 35 40
Deflect10n (IBID)
Figure 4.29: Experimental and analytical mid-column deflections, S4.
Twist rotations at the column centre.
X10l 50
45
40
30
25
20
15
10
5
0 -5 0 5 10 15 20
Twist (radians)
Test No: 54
)f--K Experimental a--e Analytical
25 30 35 Xl0-3
Figure 4.30: Experimental and analytical mid-column twist rotations, 84.

Z .--fa a ~ -fa -~ -fa ..u a ~
z .-'D fa
~ -fa -K ..: -III ..u a ~
Bending moments at the column top.
Xl01 50
45
40
35
30
25
20
15
10
5
0
~ Explllt - Ninor B-liI Expmt - Major e-EI Analy - Ninor II-iI Analy - Major
Test No: S4
-11 -10 -9 -8 -7 -6 -5 -4 -3 -2 -1 0 1 2 3 .
Bending Moment IkNmJ Figure 4.31: Experimental and analytical bending moments at the column
head, 84.
Bending moments at the column centre. Test No: S4
Xl01 50
45
40
35
30
25
20
15 >f-K Expmt - Minor
10 II-fl Expmt - Major ~ Analy - Minor
5 II--W Analy - Major
0 -6 -4 -2 0 2 4 6 8 10 12
Bending Moment IkNmJ
Figure 4.32: Experimental and analytical bending moment.s at the column centre, S4.

z ~
-.., CI -J -.., -~ -.., .... co ~
Bending moments at the column base.
):101 50
45
AO
35
30
25
20
15
10
5
0 -6 -4 -2 0 2 A 6
Bending Moment IkNm)
Test No: S4
>E--K Expmt - Minor B--£l Expmt - Major a--Q Analy - Minor
---- Analy - Major
8 10 12 14
Figure 4.33: Experimental and analytical bending moments at the column base, S4.

z c 'C ... ICI -oJ -... .. -..: 00( -... 4J ICI ~
z ~
'C to IC> -oJ -to ->< 00( -to .... co ~
Deflections at the column centre.
Xi01 50
45
40
35
30
25
20
15
10
5
0 -10 -5 0 5 10 15
Deflection Imml
Test No 55
Expmt - Minor Expmt - Major Analy - Minor Analy - Major
20 25 30 35 40
Figure 4.34: Experimental and analytical mid-column deflections, 55.
Twist rotations at the column centre.
X10 1 50
45
40
35
30
25
20
15
10
5
0 -5 0 5 10 15 20 25 30
Twist Iradiansl
Test No: 55
>E-i( Experimental Ii--EI Analytical
35 40 45 50 55 XlO-3
Figure 4.35: Experimental and analytical mid-column twist rotations, 55.

z c 'C ta co
...J -ta -~ c -ta ...... co t-
z c
'C ta co
...J -ta -~ c -ta ..... co t-
Bending moments at the column top. Test No: S5
X101 50
45
40
35
30
25
20
15
10
5
0 -11 -10
~ Expmt - Minor ~ Expmt - Major e--e Analy - Minor ____ Analy - Major
-9 -8 -7 -6 -5 -4 -3 -2 -1 0 1
Bending Moment (kNm! Figure 4.36: Experimental and analytical bending moments at the column
head, S5 ..
Bending moments at the column centre.
Xl01 50
40
35
30
25
20
15
10
5
0 -4 -2 0
>t-K
B--El
~
----2 4 6 8
Bending /!Ioment (kNmJ
Test No S5
Expmt - Minor Expmt - Major Analy - Minor Analy - Major
10 12 14
Figure 4.37: Experimental and analytical bending moments at the column centre, S5. .
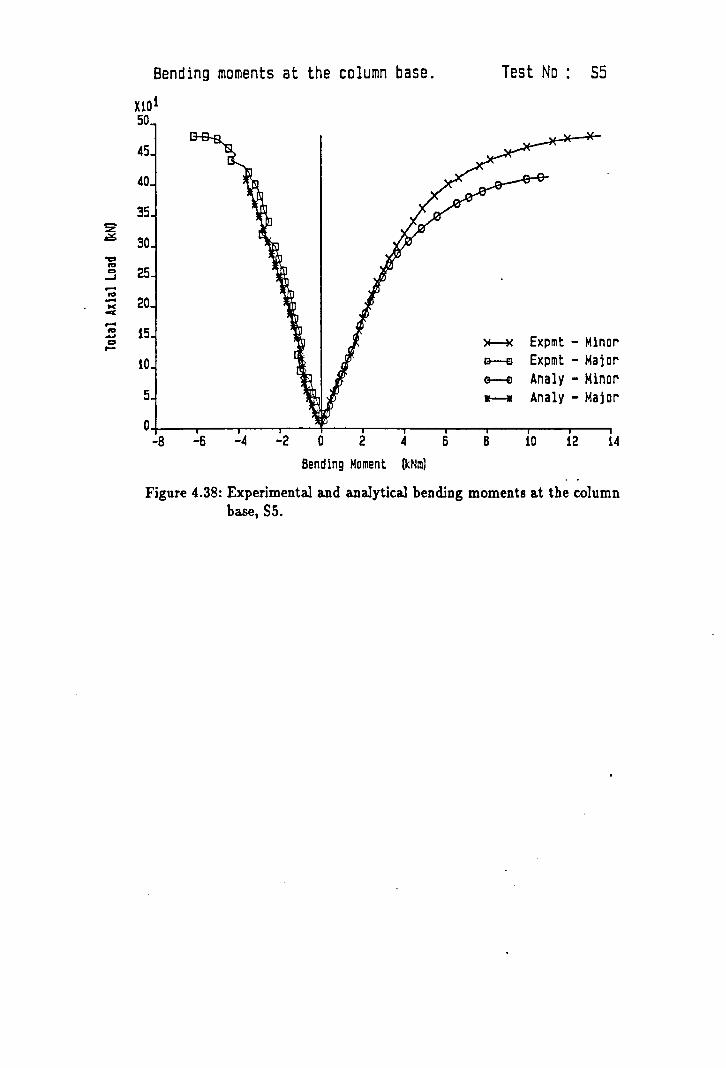
z c "Ct no C>
-oJ
--no -to( ---no .6J a t-
Bending moments at the column base.
HOi 50
4S
40
3S
30
25
20
15
10
5
0 -8 -6 -4 -2 0 2 4
Bending Moment (kNm)
Test No· S5
~ Expmt - Minor B--EI Expmt - Major ~ Analy - Minor If-.I! Analy - Major
6 B 10 12 14
Figure 4.38: Experimental and analytical bending moments at the column base, SS.

Deflections at the column centre. Test No 56
Xl01 65
60
55
50
45 z c 40 'a 35 .... c ~
30 -.... - 25 ... -c .....
20 .... ..... c ~ Expmt - Minor ~ 15
G-€I Expmt - Major 10 G--Q Analy - Minor 5 If-W Analy - Major
0 -10 -5 0 5 10 15 20 25 30 35
Deflection (mm)
Figure 4.39: Experimental and analytical mid-column deflections, S6.
Twist rotations at the column centre. Test No: 56
X101 65
60
55
50
45 -:z:: C 40 'a 35 .... c ~ 30 -"' -~ 25 - 20 "' ...... c ~ 15
10 )f--K Experimental 5 B--El Analytical
0 0 5 10 15 20 25 30 35 40 45 50 55
Twist (radians) X10-3
Figure 4.40: Experimental and 8llalytical mid-col~mn twist rotations, S6.
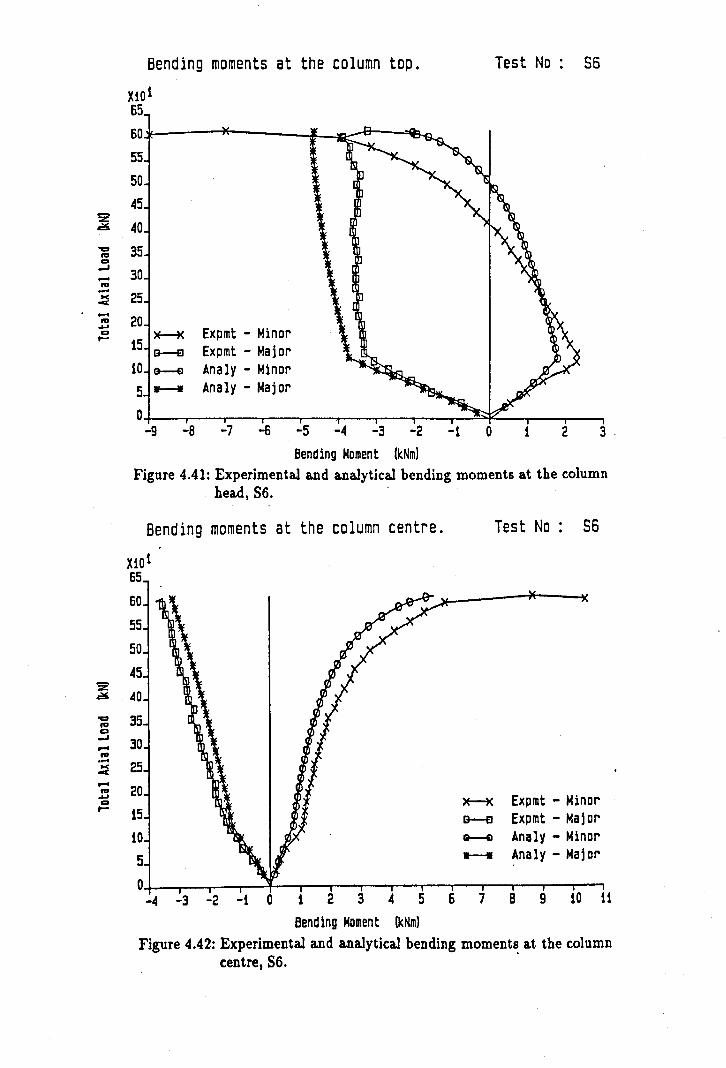
z
Bending moments at the column top.
Xi01 65
60~---*----I~~.e--~
55
50
45
40
35
30
25
20 ~
15 B--£I
10 G---El
5 ..-.
Expmt - Minor Expmt - Major Analy - Minor Analy - Major
Test No 56
O+---~--~--~--~--T---T---T---r-~~--~--~~ -9 -8 -7 -6 -5 -4 -3 -2 -1 0 1 2 3 .
Bending Moment (kNm! Figure 4.41: Experimental and analytical bending moments a.t the column
head, S6.
Bending moments at the column centre.
Xi01 65
60
55
50
45
Test No: 56
~ 40
-= 35 CI -J -... -~ -... .... CI t-
10
5
~ Expmt - Minor a---e Expmt - Major 8--Q Analy - Minor ..-. Analy - Major
0+-~--~-r-4~~-'--~-.--.--r--.--r-'r-'-~ -4 -3 -2 -1 0 1 2 3 4 5 6 7 B 9 10 11
Bending Moment (kNm!
Figure 4.42: Experimental and analytical bending moments at the column centre, S6. .
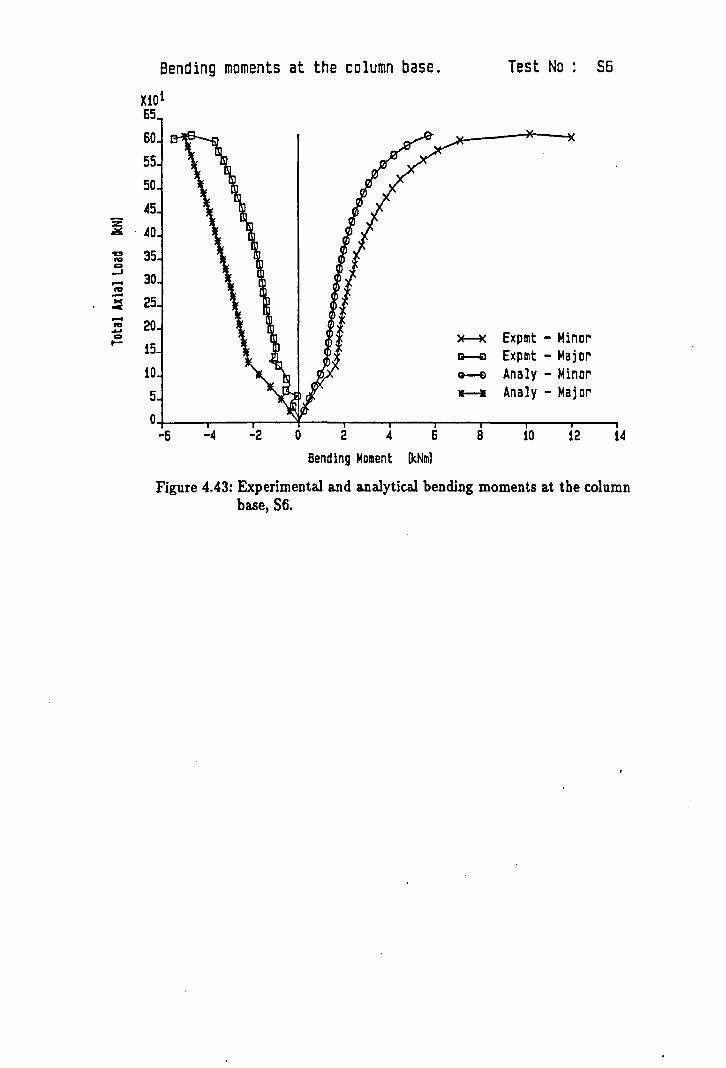
Bending moments at the column base.
Xl0l 65
60
55
50
~5
Test No: 56
~ . ~o 35 'ICI
I'CI co --'
-I'CI .t.J co to-
30
25
20
15
10
5
~
G--£I
G--E)
11--1
Expmt - Minor Expmt - Major Analy - Minor Analy - Major
O+---_T----r---~--~----~--_r--~~--~--_T--~ -6 -4 -2 o 2 ~ 6 8 10 12 14
Bending Moment IkNmJ
Figure 4.43: Experimental and analytical bending moments at the column base, S6.
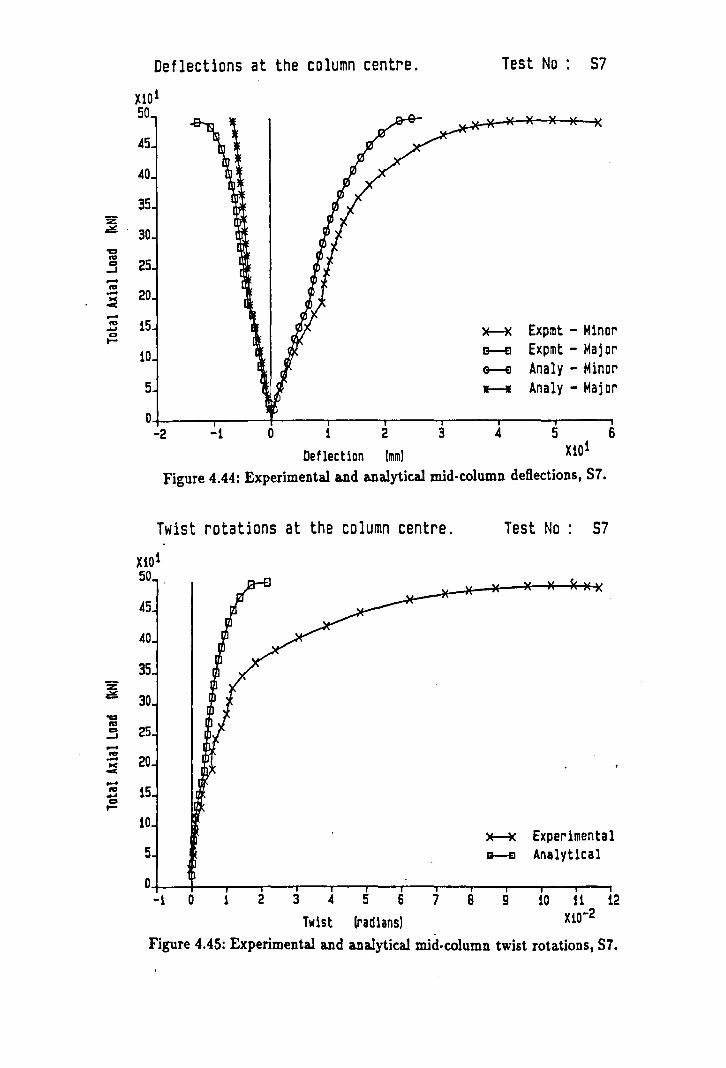
Deflections at the column centre. Test No: 57
Xl01 50
45
40
35 z ~ . 30 ~ ... IC)
-oJ -... -..: oC -... .... CI t-
~ IV c:a -' -"' -..: oC -"' .... c:a t-
25
20
15 ~ Expmt - Minor
10 B--£I Expmt - Major G-fl Analy - Minor
5 1--1 Analy - Major
0 -2 -1 0 1 2 3 4 5 6
Deflection Imml Xi01
Figure 4.44: Experimental and analytical mid-column deflections, S7.
Twist rotations at the column centre.
Xi01 50
45
40
35
30
25
20
15
10
5
Test No: 57
~ Experimental a-£I Analytical
O+-~~-r--~~---r--~~---r--~ __ --~--~~ -1 o 1 2 3 4
Twist 5 6 7
(radiansl 8 9 10 11 12
Xl0-2
Figure 4.45: Experimental and analytical mid-column twist rotations, S7.

z .rl!!i:
"a
"' c -' -I'D -... ...: -"' .... CI .....
Bending moments at the column centre.
XI01 50
45
40
35
30
25
20
15
10
5
Test No: 57
Expmt - Minor Expmt - Major Analy - Minor Analy - Major
O+---r-~--~--+--.---r--.---r--.--~--~~--~ -B -6 -4 -2 0 2 4 6 8 10 12 14 16 18
Bending ~oment (kNm) Figure 4.47: Experimental and analytical bending moments at the column
centre, 57.
Bending moments at the column top.
XiOl 50
45
40
35
30
25
20
15
10
5
0 -16
~ Expmt - Minor a---e Expmt - Major 0---9 Analy - Minor .--. Analy - Major
-14 -12 -10 -8 -6
Bending Moment (kNm)
Test No: 57
-4 -2 o 2
Figure 4.46: Experimental and analytical bending moments at the column head, S7.

z
Bending moments at the column base.
li01 50
~5
410
35
Test No -: 57
~ ·30 .., ,..
25 co -' -,.. - 20 w < -,.. 15 ... co ......
10
5
0
~ Expmt - Minor B--€I Expmt - Major e--e Analy - Minor ..-... Analy - Major
-10 -a -6 -4 -2 0 2 A 6 8 10 12 U 16 18 20
Bending Moment (kNm1
Figure 4.48: Experimental and analytical bending moments at the column base, 57.

'S2 ~
-11:1 D
-oJ -11:1 -0< cc -I'D ..... D I-
-ftI -~ -
Deflections a the column centre. Test No 58
XiOI 50
A5
AO
35
30
25
20
10
~ Expmt - Minor B--Q Expmt - Major &--E) Analy - Minor ____ Analy - Major
O+---~-.r-~---r--~--~--.--.---.---r--'---~~ -15 -10 -5 0 5 10 15 20 25 30 35 AO A5 50
Deflection (mm) Figure 4.49: Experimental and analytical mid-column deflections, 58.
Twist rotations at the column centre. Test No: 58
Xl0l 50
A5
40
35
30
25
20
.:: . 15 D I-
10
5 ~ Experimental &-£I. Analytical
O+---r-~---r--'---.--'---.--'---.-~r--.---r--' o 5 10 15 20 25 30 35 AO 45 50
Twist (radians]
55 60 65 Xl0-3
Figure 4.50: Experimental and analytical mid-column twist rotations, 58.

z Ii!6.
'D to co
-oJ -to -K --to .oJ co t-
'D to ... -' -... -~ -I'D ~ ... t-
Bending moments at the column top. Test No: 58
Xl01 50
.. 5
.. 0
35
30
25
20
15 )E-K Expmt - Minor 10 B-EI Expmt - Major
&-El Analy - Minor 5 ---- Analy - Major
0 -12 -10 -8 -6 -4 -2 0 2 .. 6 8 10 12
Bending Moment (kNm)
Figure 4.51: Experimental and analytical bending moments at the column head, S8.
Bending moments at tne column centre.
X101 50
45
40
35
30
25
20
is
10
5
0 -6 -4 -2 0 2 6
Bending Moment (kNm)
B
Test No: 58
~ Expmt - Minor a---e Expmt - Major e--e Analy - Minor ____ Analy - Major
10 12 14
Figure 4.52: Experimental and analytical bending moments at the column centre, 88.
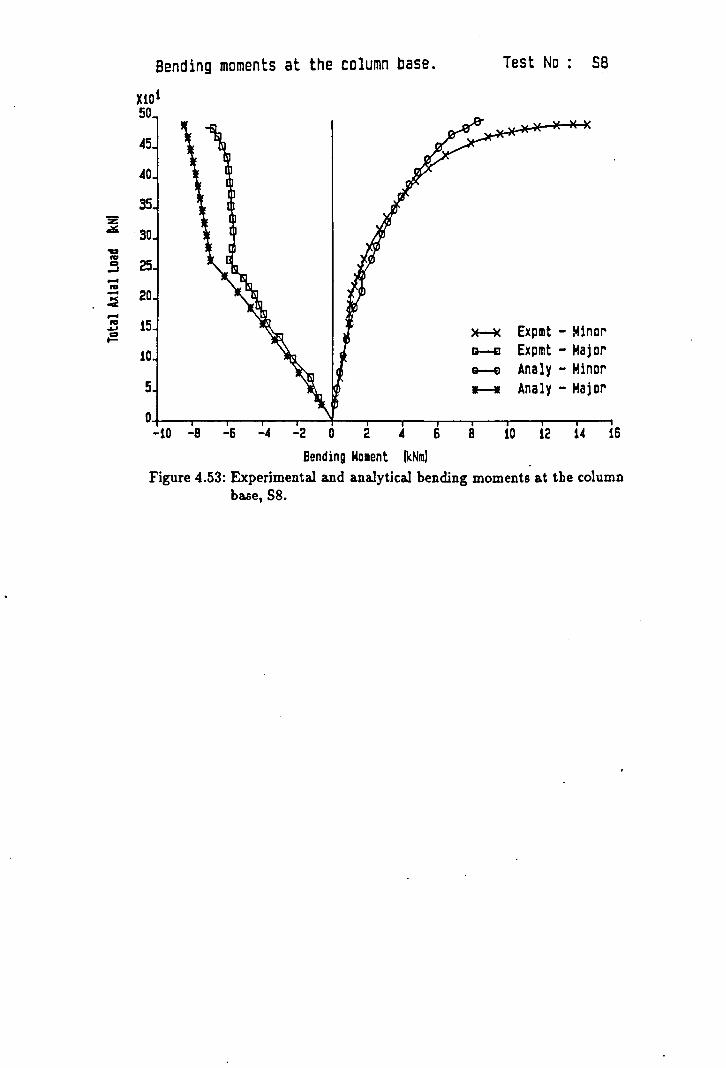
Bending moments at the column base. Test No S8
Xlo1 50
-15
-10
35 z c&. .30 "at IV ca
...J -IV -~ -'" 4.J co t-
25
20
15 )f--K Expmt - Minor 10 G-£I Expmt - Major
e--e Analy - Minor 5 It-W Analy - Major
0 -10 -8 -6 -4 -2 0 2 -1 6 8 10 12 101 16
Bending MOllent (kNm!
Figure 4.53: Experimental and analytical bending moments at the column base, SS.
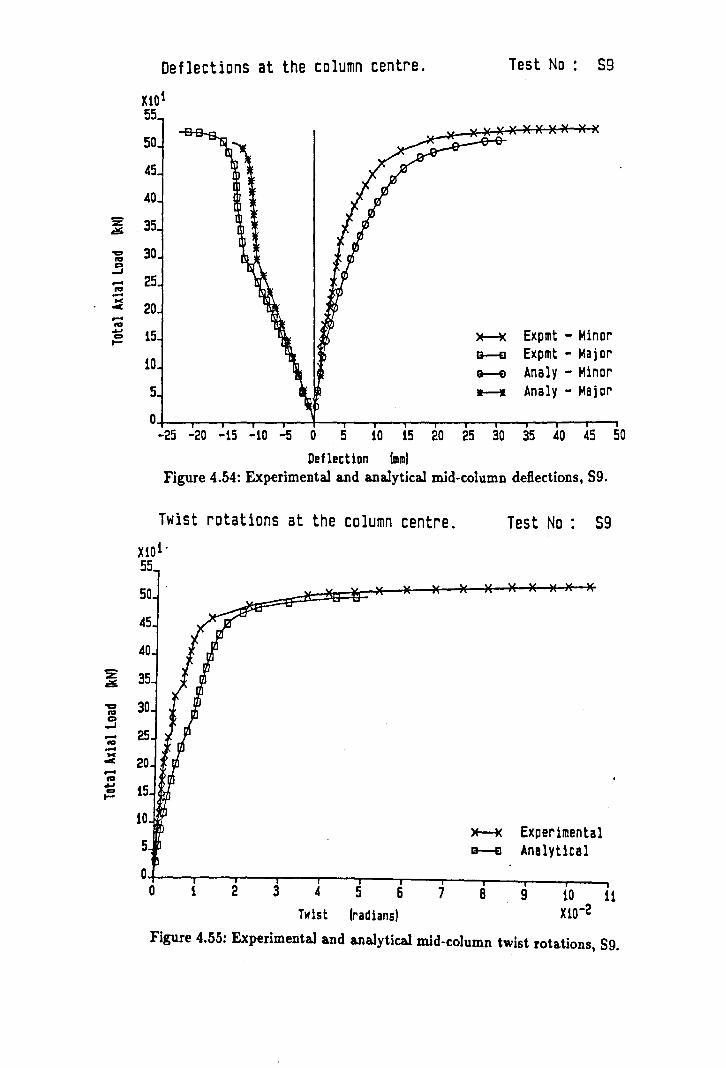
Deflections at the column centre.
XtOl 55
50
45
40
~ 35
~ 30 !j
- 25 II' -.c C 20 -II' ~ 15 ~
10
5
Test No S9
~ Expmt - Minor G--£I Expmt - Major ~ Analy - Minor If---W Analy - Major
O+--'--~--r--r--+-~--'-~r--r--r-~--.--'--~~ -25 -20 -15 -10 -5 0 5 10 15 20 25 30 35 40 45 50
Deflection Imm) Figure 4.54: Experimental and analytical mid-column deflections, S9.
Twist rotations at the column centre.
Xl01-55
50
45
40
~ 35
~ 30 !3 -II' -.c C -II' .... co ~
25
20
15
10
5
0 0 1 2 3 4 5 6 7
Twist Iradians)
Test No: S9
~ Experimental B--EI Analytical
B 9 10 11 Xto-2
Figure 4.55: Experimental and analytical mid-column twist rotations, S9.

Bending moments at the column top.
XiOl 55
50
45
40
Test No 59
.~ . 35
-to IC> ...J .... to .... ~ -c .... .., .oJ IC> t-
z 0
"II:' to C
...J .... to .... .:c .... ... .oJ c t-
30
25
20
15
10
5
0 -20 -15 -10 -5 0
Bending Moment /kNmJ
5
~ Expmt - Minor G-£J Expmt - Maj Dr ~ Analy - Minor ____ Analy - Major
10 15 20
Figure 4.56: Experimental and analytical bending moments at the column head, 89.
Bending moments at the column centre. Test No: 59
XiOl 55
50
45
40
35
30
25
20
i5
iD
5
0 -12 -10 -8 -6 -4 -2 0 2
Bending Moment
)f-K Expmt . - MinDr B-£I Expmt - Ma j Dr e--e Analy - Minor ____ . Analy - Major
4 6 B iO 12 14 16 IkNmJ
Figure 4.57: Experimental and analytical bending moments at the column centre, S9.
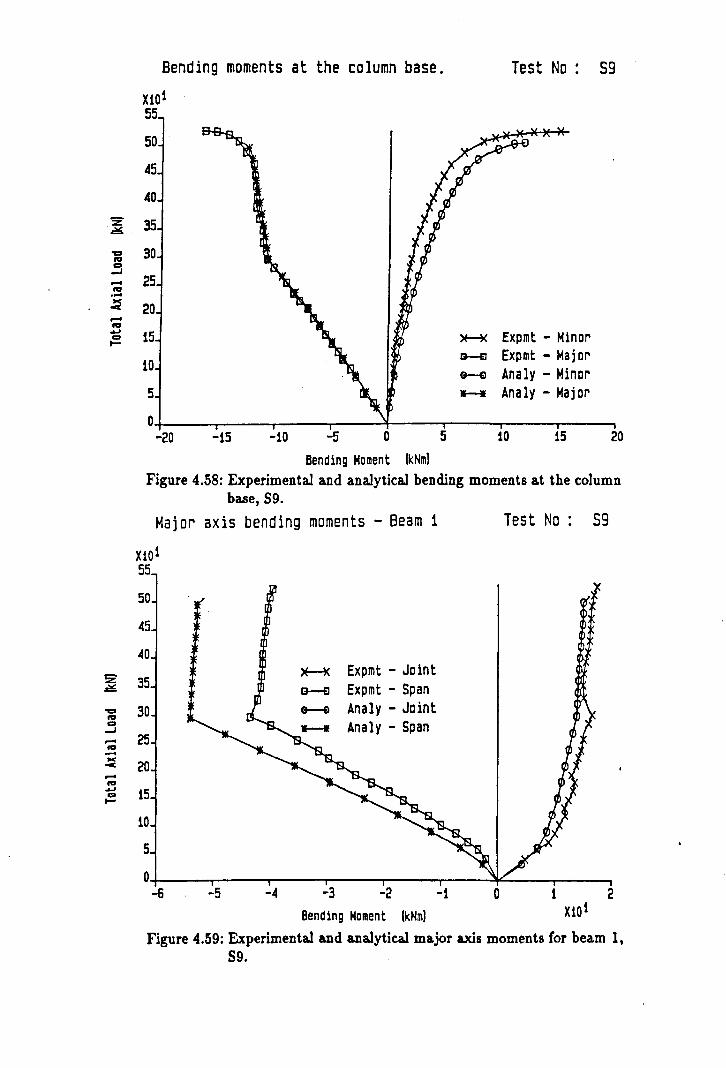
z ~
'a IV co -J -IV .-~ -IV ~ co ....
z ~
'a IV co -J -IV -M --IV ~ co ....
Bending moments at the column base. Test No : S9
Xl0l 55
50
-15
-10
35
30
25
20
15 ~ Expmt - Minor
10 B-e Expmt - Major &-;) Analy - Minor
5 11---* Analy - Major
0 -20 -15 -10 -5 0 5 10 15 20
Bending Moment (kNm)
Figure 4.58: Experimental and analytical bending moments at the column base, S9.
Ma j or ax is bend ing moments - Seam 1 Test No: S9
Xl0l 55
50
45
40
35
30
25
20
15
10
5
0 -6 -5 -4
~ Expmt - Joint e--e Expmt - Span e--e Analy - Joint
Analy - Span
-3 -2
Bending Moment (kNm)
-1 o 1 2 XiOl
Figure 4.59: Experimental a.nd a.nalytical major axis moments for beam 1, 59.

-= ... -J -ta -~ -I'D
Deflections at the column centre.
X101 55
50
45
40
35
30
25
20
Test No: 510
~ 15 t- ~ Expmt - Minor
a--e Expmt - Major G--Q Analy - Minor w--w Analy - Major
z ~
"Cit ta a -J .-ta -w: -.-ta ~ ... t-
10
5
O~~--~--~~--~~r-~--~--r--.--'---r-~~ -25 -20 -15 -10 -5 0 5 10 15 20 25 30 35 40 45
DeflectiDn Imml Figure 4.60: Experimental and analytical mid-column deflections, S10.
Twist rotations at the column centre.
Xl01 55
50
45
40
35
30
25
20
15
ID
5
0 -1 0 1 2 3 4 5 6 7 8
Twist lradians)
Test No: 510
~ Experimental G-EI Analytical
9 10 11 12 13 14 X10-2
Figure 4.61: Experimental and analytical mid-column twist rotations, S10.
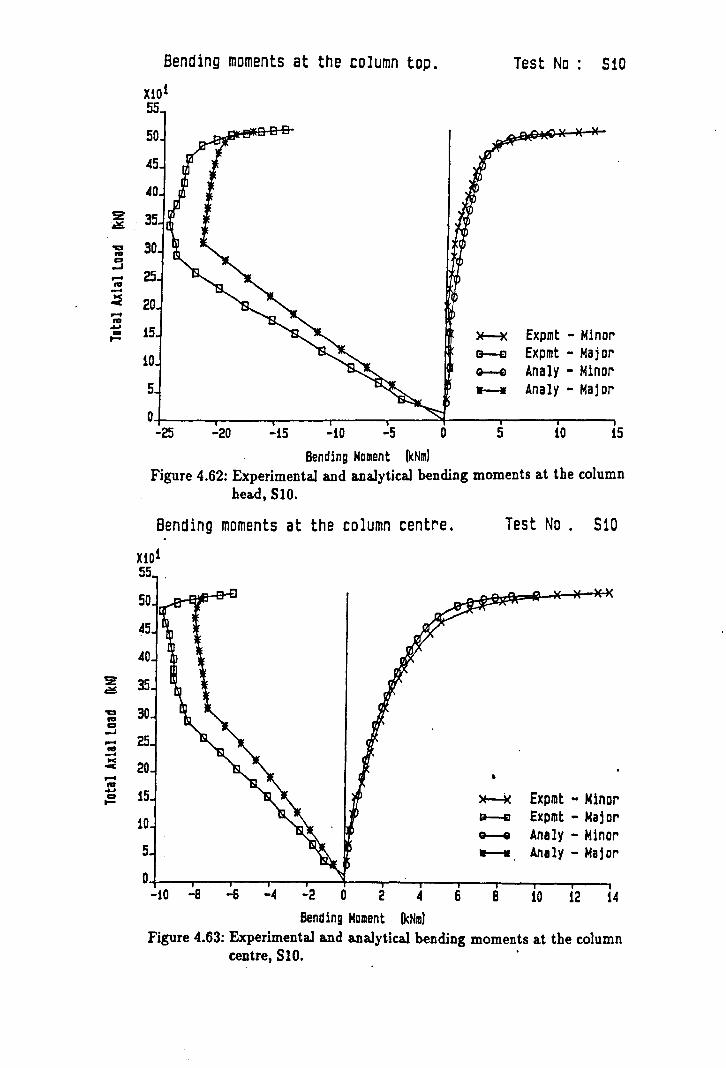
z C!i
'a to a ..J .... to -~ .... to ~ ... ....
Bending moments at the column top.
XlOI 55
50
~5
40
35
30
25
20
15
10
5
0 -25 -20 -15 -10 -5
Bending Moment (kNml
Test No: S10
>E--K Expmt - Minor B-iI Expmt - Major G--e Analy - Minor
---- Analy - Major
o 5 10 15
Figure 4.62: Experimental and analytical bending moments at the column head, SIO.
Bending moments at the column centre.
Xl01 55
50
~5
~o
Test No. S10
-= 30 a -oJ .... to .-~ 20 .... to ~ a ....
10
5
• *-4< &i--iI
G--e
----
Expmt - Minor Expmt - Major Analy - Minor Analy - Major
O+-----r_-.-----r----~--+_--r_~--_r--~--~--~~ -10 -e -6 -4 -2 0 2 4 6 B 10 12 14
Bending Moment (KNml Figure 4.63: Experimental and analytical bending moments at the column
centre, SlOt .

Bending moments at the column base.
X10 1 55
50
~S
.to Z 35 G
~ 30 o -'
- 25 .. -~ 20 -.. ~ 15 ~
10
5
O+-~--~-r--r-~~~~ -16 -14 -12 -10 -8 -6 --4 -2 0 2
Test No: S10
)f--)( Expmt - Minor G--£J Expmt - Major ca--e Analy - Minor w--t! Analy - Major
~ 6 8 10 12 14 16
Bending Moment. (kNm) .
z .= 'CO ro 0
-oJ -'" .-K < -ro .oj co ~
Figure 4.64: Experimental and analytical bending moments at the column base, SIO.
Major axis bending moments - Beam 3
X10 1 S5
50
45
40
35
30
25
20
15
10
5
0 -7 -6 -5 --4
~ Expmt - Joint a--e Expmt - Span G--a Analy - JOint If-I Ana 1 y - Span
-3 -2 -1
Bending Moment (kNm)
Test No: 510
o . 1
X101 2
. Figure 4.65: Experimental and analytical major axis moments for beam 3, S10.

.... c ~ o
:E:
M= f (¢ I
M=1·1.f(¢1 --e- -- -- -- 1
.,.-- /
M-~ for model S2A 'I M-¢ for mode! S2E If
f
'I
/ I'
Rotation rJ
Figure 4.66: Adjustment to the M - <I> response of the connection characteristics in model 2DE.
Chapter 5
The full-scale frame tests.
5.1 Introduction.
The final phase of the research programme was devoted to the experimental investiga
tion of two full-scale, 3-dimensional, non-sway, multi-storey frames. These frame tests
formed an essential part of the experimental study. Firstly they enabled the effect of
column continuity through a loading level to be investigated - a parameter not present
in the subassemblage tests. Secondly they were undertaken to determine whether the
experimentally observed behaviour of isolated joints and sub assemblages was indeed rep
resentative of their 'in-frame' behaviour. This latter point is of particular importance if
the extensive work on isolated elements carried out by the author and other researchers
is to be incorporated into universally accepted methods of semi- rigid frame design.
There have been a number of previous experimental investigations of the performance of
full scale, 3-dimensional, rectilinear steel frames. These include studies of both purpose
made frames [5.1] and in-situ testing of existing structures [5.2]. However, as far as the
author is aware, the frame tests described herein represent the first experimental study of
a purpose made 3-dimensional, multi-storey, non-sway steel frame incorporating 'simple'
5.1

semi-rigid connections.
The frame tests were carried out in the large structures testing hall at the Building Re
search Establishment near Watford, England. A brief summary of the large scale testing
facilities at the Building Research Establishment is presented in reference 5.3.
5.2 General arrangement of the full-scale test frames.
For the purpose of description, each frame may be considered as comprising two parallel
2-dimensional frames each consisting of three columns and four primary beams, with
six secondary beams connecting the two frames at the panel points. The two plane
frames within the 3-dimensional structure have been termed the 'active' frame and the
'static' frame (figure 5.1 clarifies the terminology). Only the 'active' frame and the
secondary beams were subjected to direct load and response monitoring, the 'static'
frame simply provided the required 3-dimensional restraint. There were a number of
reasons for considering the test frames in this manner:-
1. Testing only part of a large 3-dimensional frame to failure is significantly less
hazardous than simultaneously testing the whole of the frame.
2. It reduced the amount of loading and instrumentation equipment required in
anyone test to an acceptable level.
3. As the 'static' frame from the first test was not loaded directly it did not
sustain any permanent damage. The 'static' frame could therefore be re- used
for the second test, thereby reducing both the time and the cost of fabrication.
5.2
Figure 5.2 shows the general arrangement of the first of these frames, Flo The con
figuration and overall dimensions of the second test frame, F2, were similar. The only
difference between tests Fl and F2 was the orientation of the columns on the active frame
and the detailing of the beam to column connection. In the case of the first frame test, (
the primary beams framed into the minor axis of the column whereas in test F2, the pri-
mary beams framed into the major axis. Figure 5.3 shows a typical plan highlighting the
differences between the two tests. Prior to fabricating the subassemblage specimens, an
in depth analytical study was carried out to ascertain the most appropriate dimensions
for the test specimens. In the case of the frame tests however, the overall dimensions of
the frames were dictated by the availability of loading and displacement measurement
devices which were specially fabricated for a previous study of full-scale 2-dimensional
frames [5.4].
Initially, it had been assumed that the frames would be limited to a two storey height.
However, it was considered that the potential rotational restraint from the loading block
acting directly at the head of the column would have had an unquantifiable effect on
the behaviour of the second storey column segment. This problem was averted by intro
ducing a third storey to the 'active' frame which effectively isolated the second storey
column from any undesirable restraint effects. The height of the third storey (1.8m) was
chosen as half that of the lower storeys (3.6m). As the positional bracing at the column
head provided only a very small degree of rotational restraint (single bolt connection),
the stiffness and distribution of moments within the third storey column were similar to
that of a column of twice the length bending in double curvature. Edge columns in multi·
storey structures with full floor loading, and internal columns with a non-symmetric floor
loading arrangements often deform in this manner. Therefore, in terms of stiffness and
moment distribution, the proposed arrangement for the third storey was representative
of a full height storey in a more extensive multi-storey frame. The precise effect of the
third storey column was evaluated by using appropriate instrumentation to determine
the bending moments acting at the head of the second storey columns.
5.3
5.2.1 Frame members and connection type.
Both test frames were constructed using 152 x 152 UC 23 sections for the columns and
254 x 102 UB 22 sections for the beams. This maintained the common theme of similar
section sizes which had been adopted throughout the research programme.
Flush end plate connections were used for all the beam to column connections in both
test frames F1 and F2. There were a number of reasons for selecting this particular
connection type in preference to other forms of simple connection. Firstly, recent surveys
of British design and fabrication practice [5.5], have shown the flush end-plate to be the
most popular. Secondly, connections which employ cleats are very often susceptible to
bolt slip at relatively low moment levels. Once bolt slip has occurred, the moment
rotation characteristics of the connection are usually irreversibly changed. The flush end
plate connection however is not affected by bolt slip to the same degree and therefore
exhibits similar moment-rotation' behaviour under repeated moderate loading. Using
such a connection, small levels of load could be applied to the frame without irreversibly
deforming either the connections or the frame members. This was an important facility
which allowed the loading devices and load control systems to be fully commissioned
prior to carrying out a test to failure.
The particular flush endplate connection used in test Fl comprised a 12mm endplate
and was fabricated in exactly the same manner as the flush end plate connections used
in both the joint and subassemblage studies (Chapter 6). The flush end plate connection
used in test F2 was of a similar construction, but in this instance an 8mm end plate was
used to increase the flexibility of the joint. In both cases, the end-plates were fixed to
the beam with an 'all round' fillet weld. Although proposed initially, it was considered
that using a partially welded end-plate connection would have increased the possibility
5.4

of an undesirable premature joint failure.
5.2.2 Frame construction details
The test frames were fabricated and erected by the workshop at the Building Research
Establishment. The fabrication drawings for each of the test frames are presented in
Appendix B. Figures 5.4 and 5.5 show general views of the erected test frame Fl prior
to testing, complete with instrumentation and loading devices.
Analytical studies of the effect of column base fixity reported in section 2.2.2 had shown
that modest deviation in the actual, or as measured, stiffness characteristics of a fixed,
or near fixed, base connection had a negligible effect on column behaviour. For this
reason, and the much simplified erection procedure, all the columns in each of the two
test frames were fabricated with a fixed base condition. It should be noted that in this
instance the pre- compression method for inducing predefined initi~ column deforma
tions, as described in section 2.3.3, was not used. Thus it was feas~ble to add welded
stiffening plates to the column base to enhance the rigidity of the connection.
5.2.3 Prevention of column sway.
The frame was prevented from swaying by a number of purpose made 'tie bars' which
fixed the position of the structure with respect to the rigid concrete viewing balconies
surrounding the test area. The principal ties were located at the node points of the
columns to provide effective restraint in the two orthogonal directions. In addition,
several restraints were provided to the compression flange of each of the four primary
5.5

beams to prevent premature failure by lateral torsional buckling of the beam. Although
not necessary for member stability considerations, a single 'tie bar' was also provided at
each level to the secondary beams adjacent to the viewing balcony. This was a safety
precaution which fixed the position of the upper flange on the secondary beams at the
points of applied load. Figure 5.6 shows a plan at a typical loading level illustrating the
'tie bar' arrangement. The restraints comprised a single length of threaded bar with
a dowel pin connection at each end. This arrangement provided horizontal positional
restraint, but permitted the small vertical movement arising from beam deflections and
axial shortening of the columns to occur freely (figure 5.7).
5.3 Measurement of section properties.
As in the subassemblage tests, measurements were made of the actual cross sectional
dimensions of the all the principal beam and column elements to determine their true
engineering properties. The material properties of the sections, yield stress and Young's
modulus, were determined by performing tensile coupon tests and, in the case of the
columns, by stub column tests. Tests were also carried out to determine the distribution
of residual stresses within the column members. The results of these tests, together with
a discussion of the test procedures, are presented in the supplementary volume to this
thesis [5.6].
5.6

5.4 Method of load application.
Loads were applied to the frames by a series of hydraulic rams situated underneath the
reinforced concrete floor slab of the test hall. High strength steel tendons and Macalloy
bars, which passed through a regular grid of vertical ducts in the floor slab, transferred
load from the rams to the frame via substantial 'saddle' and spreader beams. Each frame
beam member was loaded by a pair of tendons tensioned by a pair of rams operating at
the same pressure, thus providing a balanced arrangement of load to the saddle beams.
The columns were loaded using a similar arrangement but Macalloy bars were used
rather than tendons to enable large loads to be applied. Figure 5.8 clarifies the loading
arrangement and shows the precise location of the loading points on the frame, whilst
figure 5.9 shows a photograph of the hydraulic rams housed in the basement of the test
hall.
As in the subassemblage tests, the beams were loaded first to a particular limiting value
followed by loading of the column head to failure. Beam loading was 'load controlled'
and therefore not influenced by the frame deformation resulting from column loading. /'
As a safety precaution, and also to observe the 'post-failure' behaviour of the frame, the
column head jacks were displacement controlled. Figure 5.10 shows a photograph of a
typical column head load arrangement illustrating the cluster of three L.V.D.T.'s used
to monitor the applied column head displacements.
The actual applied loads were measured by tension load cells which were coupled into the
tendons and Macalloy bars. In the case of the beam loads, two cells were connected in
series into each length of tendon. One cell was used to monitor the applied load and the
second cell was used as a direct feedback signal to prevent the inadvertent application
of excessive loads. In the case of the Macalloy bars, which applied load to the column
head, a single cell was located in each bar to provide a direct measure of the applied load
with the measurement of column shortening from the cluster of L.V.D.Ts. providing the
necessary safety feedback signal.
5.7

5.5 Test frame instrumentation.
Figure 5.11 summarises the various force and deformation components which were mon
itored during each of the frame tests.
5.5.1 Deformation measurement.
Both primary and secondary beam deflections were measured at the quarter, mid, and
three-quarter points relative to an aluminium box section supported at both ends of the
beam. Deflections were therefore measured relative to any vertical displacements which
may have occurred at the supports. This method of beam deformation measurement had
been successfully used in a previous study of two-dimensional frame behaviour [5.4]. A
photograph of the deflection monitoring system as used on the secondary beam SBt of
frame test Ft is shown in figure 5.12.
Column deformations were measured using a three-dimensional monitoring system com
prising six L.V.D.T.'s, similar to that developed for the subassemblage tests (section 3.2)
[5.7]. Using this device, the column deflections dx, dy and dz were measured together
with twist rotation. In total six such systems were used, one situated at the mid-point
of each of the column segments on the active frame. Figure 5.13 shows a photograph of
the 'free-standing' version of the device used to measure the deformation of the ground
Hoor columns.
Rotations were measured by 'hanging dumb-bell' devices. This measurement system had
also been used successfully in the previous study of 2-dimensional frame behaviour [5.4].
5.8

The dumb-bells were connected to the frame via a thin strip of spring metal. Measure
ment of the flexural strains in the spring metal as the frame rotated with respect to the
dumb-bell (which maintained its orientation due to gravity), gave a precise and direct
measure of the applied rotation. These rotation devices were located at each end of the
four primary beams, at the active frame end of the secondary beams and on the major
and minor axis of the column at the node points on the active frame • a total of 26
devices. Figure 5.14 shows a photograph of one of the secondary beam rotation devices
fixed to the test frame.
5.5.2 Force measurement.
A total of 244 adhesive fixed foil strain gauges was used in each of the frame tests to
monitor the longitudinal strains, from which the member forces could be determined. As
in the subassemblage tests, a cluster of ten gauges was provided at the mid height of the
columns to enable the elastic-plastic response of the frames to be monitored. The merits
of this particular strain gauge arrangement are discussed in section 3.3 and reference
5.8. Elsewhere, conventional four gauge clusters, capable of monitoring forces in the
elastic range, were used. The precise location of strain gauges on the column and beam
members are shown in figures 5.15 and 5.16 respectively.
5.5.3 Data logging and experimental control.
Two Solatron Orion Data Loggers were used to provide the 667 data channels necessary
to monitor the frame instrumentation. This comprised 488 channels to energise and
record the 244 strain gauges; 26 for monitoring the rotation devices, 24 for monitoring
5.9
the applied loadsj 63 for measuring bolt forces and 66 devoted to monitoring the displace
ments measured from the L.V.D.T.'s. Load was applied to the frame via two electric
hydraulic pumps. A pair of dedicated servo-control amplifier units controlled the pres
sures, and hence loads, applied to the individual loading rams and monitored the safety
feedback signals. Both the data loggers and the amplifier units were controlled directly
from a remote minicomputer. Via the computer, it was therefore possible to specify an
applied loading, initiate scanning of the instrumentation and view the recorded data.
Figure 5.17 shows a schematic arrangement of the experimental set-up.
After a load increment had been applied to the frame, it was probable that the hanging
dumb-bell rotation devices described in section 5.5.1, would tend to oscillate about the
vertical gravity reference datum. To improve the accuracy of measurement, 50 consecu
tive scans were taken for each rotation device and the average value used. The interval
between scans was specifically chosen as 0.4 seconds being approximately one half of
the 0.8 seconds natural period of dumb-bell oscillation. At this interval, the alternating
positive and negative errors in the measurement of the true rotation were approximately
equal and therefore tended to cancel out when the readings were averaged, as indicated
in figure 5.18.
5.5.4 Processing of recorded data.
The 'raw' data recorded in the test was processed on a Prime mainframe computer using
a. suite of purpose written FORTRAN programs. The processing software essentially
converted the measured strains and gross displacements into member forces and net de
flections. One important feature of the software was the calculation of the column axial
forces from the applied loads and elastic shears resulting from the distribution of beam
bending moments. This supplemented the direct measurement of axial force from the
5.10
column strain gauges which tended to become rather erratic as the column approached
failure.
5.6 Test frame Fl - test parameters and experimental
observations.
Figure 5.19 shows an elevation and sections through the test frame indicating the nomen
clature adopted for the members of frame Fl. It should be noted that the different
column segments have been identified with reference to the grid labels at the different
frame levels. For example, C5/0-1 is the segment of column C5 between levels 0 and 1 -
i.e. the ground floor column.
5.6.1 Selection of the loading configuration.
As discussed previously, the basic sequence of loading was to apply the beam loads in
increments up to a predefined limit and then, with the beam loads held constant, the
columns were loaded to failure individua.lly. It is evident therefore that the selected
pattern of beam loading would have a significant effect on the behaviour of the columns
during the second stage of the test.
One feature of particular interest was the behaviour of the second storey segment of
column C5 as failure approached. A 'chequer-board' pattern of beam loads, representing
an extreme distribution of minimum dead and maximum dead plus live loading, was
therefore adopted, as shown in figure 5.20. It was intended that the more onerous
5.11

distribution of moments would cause the second storey segment to become more critical
than the first storey despite the reduced axial loading. The proposed arrangement of
beam loads would induce a positive disturbing moment at both the upper and lower
ends of the second storey column. This was intended to clarify whether the reversal of
moment associated with columns disturbed by end moments would occur at the upper
end of the column, at the lower end or at both locations simultaneously.
Relatively large loads were applied to the secondary beams to induce significant major
axis moments into the columns. The exceptions were beam SBl, which would remain
unloaded due to the limited number ofloading devices available, and beam SB5, in which
a reduced load was necessary to limit the axial load applied to the first storey segment
of column C5.
5.6.2 Measurement of initial frame deformations.
The congestion of instrumentation and loading devices around the frame prevented the
direct measurement of the initial column deformations. The major and minor axis col
umn alignments were therefore measured by carrying out a detailed 'offset survey' using
a theodolite. A summary of the measured initial' column deformations of frame Fl is
presented in figure 5.21.
5.6.3 Experimental test procedure and observations.
Frame test Fl was carried out on 12 April 1990 in the Structures Test Hall at the Building
Research Establishment.
5.12

Before applying any load to the frame, a series of four 'zero scans' were taken. The first
zero scan was taken with the loading pumps switched off; the second with the pumps
switched oni the third was with loading jacks advanced al!d the fourth was with the
jacks taking up the slack in the loading cables. The beams were loaded first in 14 equal
increments. However, after the first increment ofloading, it became apparent that there
was a malfunction with the loading rams to the secondary beam SB5. It should be noted
that it had been the intention to limit the load applied to this particular beam to reduce
the total axial load in the lower column segment CS/O-l. It was decided therefore that
the application of this load was not crucial and that the test should proceed with the load
to this beam removed. Table 5.1 summarises the total beam loads which were applied.
Load increment 14 represented the end of the beam loading phase. At this stage however
the oscillation of applied load to secondary beam SB4, which had been evident through
out the test, began to worsen. In an attempt to correct the oscillation by modifying the
input signal, a large instantaneous load was inadvertently applied to the beam. This
resulted in a dramatic lateral- torsional failure of the beam with a large vertical defor
mation and twist rotation at the loading point. The load to this particular beam was
immediately removed. An initial appraisal of the situation revealed that the effect of
this localised member failure had not significantly affected the remainder of the frame.
This was later confirmed in the subsequent analysis of the recorded data.
With the applied load on all four of the primary beams and three of the secondary beams
held constant, the test continued to fail the columns. The columns were to be failed in
sequence, rather than simultaneously, commencing with the centre column C5. The
column loading was displacement controlled and was applied by specifying a required
column shortening, typically in increments of O.Smm. At the end of loading increment
number 30, the column had been shortened by a total of 9.5mm, equivalent to an applied
column head loading of 485.4 kN.
It was evident from the on-line processed force and deformation data that, at this incre-
5.13

ment, the centre segment of column C5 had very little residual stiffness and was therefore
very close to failure. This was verified by the prominent bow observed in the column. On
applying the next increment of column shortening, the hydraulic pumps, which main
tained the applied load to both beams and columns, 'tripped out'. This caused all the
applied loading to revert to zero and effectively brought a premature end to the testing of
column C5. Subsequent analysis of the results showed that, as expected, the column was
indeed very close to failure and that it was unlikely that further increments of shortening
would have resulted in an appreciable increase in the supported load.
Having isolated the problem with the feedback signal to the hydraulic pumps, the beams
were re-Ioaded to their pre-failure load configuration. Increments of axial shortening
were then applied to column C6. The maximum applied column head load of 548.0 kN
was achieved when the total applied column shortening was 9.5mm. The loading stage of
the test was terminated when the total applied shortening was 10.0mm. It was evident
from the large outward bow that in this instance, the lower section of column C6 had
failed. The frame was unloaded by removing the column head load first, in two large
increments, followed by the beam loads, again in two large increments. The frame test
had commenced at 09.00 hrs. and was concluded at 23.15 hrs., a duration in excess of
14 hours.
5.7 Frame test Fl - Presentation and discussion of results.
The results of the first frame test are presented and appraised in the following sections.
For clarity, the frame behaviour at the three main stages in the test, i.e. at the end of
beam loading, at the failure of column C5 and at the failure of column C6, are described
separately. The reader should also refer to chapter 6, where the measured moment
rotation responses of the connections in the frame test are compared with the behaviour
5.14

measured from isolated connection tests, and also to chapter 8 in which the capacity of
the frame is compared to various design predictions.
5.7.1 The beam loading phase.
Figure 5.22 shows the computer generated bending moment diagrams for the frame at
the end of the beam loading phase. It should be noted that the beam support moments
are the values computed at the face of the column. Throughout this appraisal of frame
data a consistent bending moment sign convention has been adopted with the moment
drawn on the tension side of the member. Examination of the diagrams show that
they are markedly different from those which correspond to moment distributions for
simply supported beams. It can be concluded therefore that the stiffness characteristics
of the connection had a significant influence on the distribution of bending moments and
consequently on the member deflections.
At the centre column, C5, the primary beams were connected to both sides of the column
web. Recent studies of isolated connection behaviour have shown that this particular
arrangement produces the stiffest moment rotation response for a given connection type
[5.9]. This was confirmed by the relatively large maximum moment (48.9 kNm) attracted
to the connection (M"z beam = 72 kNm).
It would appear from the bending moment diagram that the columns in the upper storey,
C5/2-3, behaved as expected with zero moment at the juncture between the horizontal
bracing member and the column hea4s. The approximately equal proportions with which
the out of balance end moments from beams PB5 and PB6 were distributed between the
upper and lower columns suggests that the stiffness of the third storey column segment
was indeed representative of a full height column in double curvature.
5.15

A complete appraisal of the frame deflections observed during the beam loading phase is
presented in chapter 8 in which frame test data is used to validate a deflection prediction
technique developed by the author.
5.7.2 Loading of column C5.
Figure 5.23 shows the computer generated bending moment diagrams for the frame at
the point of maximum load on column C5. It should be noted that there was zero load
applied to beam SB4. However, due to the accidental failure of this particular beam and
the resulting high plastic strains, the gauges on the member still recorded a net strain,
thereby indicating a 'non-existent' moment.
Figure 5.24 shows the major and minor axis moments at the centre of column segments
C5/0-1 and C5/1-2 plotted against the respective axial loads. It is evident from this plot
that the minor axis of the second storey segment, C5/l- 2, shows the characteristic pro
gressive loss of stiffness associated with columns subjected to initial disturbing moments.
However, as the second storey segment reached the failure load the lower segment, C5/0-
1, failed exhibiting a sudden loss of stiffness. This is illustrated more clearly in figure
5.25 which shows the same column bending moments plotted against the applied column
loa.d • which is common to both column segments. Prior to failure, the bending moments
in the lower segment remained relatively constant during head loading phase. This sug
gested that the applied axial load was being resisted by direct axial compression and
was not inducing member flexure associated with buckling. Figures 5.26 a.nd 5.27 show
plots of the mid- column deflections and twist rotations for the two column segments.
The bifurcation type failure of the lower segment, which resulted from the lack of initial
column deformation, a negligible major axis disturbing moment and the high degree of
rotational restraint at head and base, explains the very high axial load capacity which
5.16

was observed.
It is considered that the simultaneous failure of the two column segments was not co
incidental, but that the excessive deformation of the segment C5/1-2 as the ultimate
capacity was approached initiated the failure of the lower segment. Such interaction
between column segments at the point of failure has been observed in previous frame
tests [5.1].
Figures 5.28 and 5.29 show plots of the minor and major axis moments at the top, mid
point and bottom of column segment C5/1-2. The corresponding data is presented in
figures 5.30 and 5.31 for the lower column segment, C5/0-1. The minor axis plots for
column C5/1-2 show that the moments at the top and bottom of the column segment
were of the opposite sign (adopting the sign convention introduced in section 5.7.1) and
therefore differed from the single curvature bending predicted for this particular column
from consideration of the primary bending moments (figure 5.20). This discrepancy
was due to the observed frame moments being a combination a small single curvature
primary moment combined and a larger double curvature secondary moment resulting
from column deformations.
It is evident from the plots of minor axis moment that the failure of the column caused
the bending moment at the bottom of segment C5/1-2 to reverse whilst those at the
top continued to increase in the same direction as the initial disturbing moment. The
plots in figure 5.29 show that, unlike the minor axis, the major axis column moments
remain relatively constant after application of the beam loads. Only when the failure
load has been reached, at which point the column has negligible stiffness and therefore
experiences large deformations, are there significant changes in the magnitude of the
major axis moments.
The minor axis moments at the top, middle and bottom of column segment C5/0-1
(figure 5.30), show the sudden failure of the segment as discussed above. It would appear
5.17

however that at a load in this column of approximately 650kN, the minor axis moment at
the base of the column segment begins to increase rapidly. This level of load corresponds
with the large increase in the major axis moment at the base shown in figure 5.31. Up
to the point of failure, the moments about both major and minor axes at the mid point
of the column are relatively small. This would therefore suggest that the local capacity
of the section at the base dictated the ultimate capacity of column segment C5/0-1. It
is quite probable that this local failure was initiated by the increased residual stresses
resulting from the welded fabrication of the fixed column base detail.
Figure 5.32 shows a plot of the in-plane connection moment of the secondary beam SB2,
which was connected to the major axis of column C5, plotted against the axial load
in column segment C5/1-2. The plot shows that a large proportion of the disturbing
connection moment diminishes during the second phase of the loading sequence. This
compares with figures 5.33 and 5.34 which show plots of axial load against the primary
beam major axis moments at the connection with the minor axis of the centre column,
C5. It is evident that in this instance, there is only a very small redistribution of the
connection bending moments, particularly in the case of beams PB5 and PB6. The
significance of this reduced beam to column interaction resulting from beam continuity,
the surprising effect on the moment rotation characteristics of the connection and the
implications for semi-rigid design are considered in detail in chapter 6 of the thesis.
5.7.3 Loading of column C6.
It should be noted that all the data plots presented in this section have been edited
to remove the re-Ioading of the beams resulting from the hydraulic pump failure which
followed the test of column C5 (section 5.6.3). As a result, some of the plots indicate a
slight discontinuity in the data at the end of the beam loading phase.
5.18
Figure 5.35 shows the computer generated bending moment diagrams for the frame at
the point of maximum load on column C6. Figure 5.36 shows the major and minor
axis bending moments at the centre of column segments C6/0-1 and C6/1-2 plotted
against the corresponding axial column loadings. It is evident that unlike column C5,
the minor axis of the lower column segment C6/0-1 experiences the progressive loss
of stiffness associated with initially deformed columns. This is despite the anticipated
increased capacity ofthis segment due to the close proximity ofthe rotation and warping
restraint at the column base. The minor axis moment at the centre of the upper column,
C6/1-2, remained relatively constant during the second stage of the test diminishing as
the ultimate capacity of the lower segment was approached. However, the plateau on
the plot of minor axis moment at the centre of segment C6/1-2 is not an indication
of failure. Clearly, the summation of the co- existent components of axial load, minor
and major axis moments is not sufficiently large to cause excessive yielding across the
section. The plateau is a result of the continuing transfer of moment and node rotation
from the lower column C6/0-1 in conjunction with the 'cut-off' in applied load due to
the limited capacity of the lower column segment. This is similar to the inter-action /
between column segments at the point of failure observed in column C5 (section 5.7.2).
The rather dramatic shift in the magnitudes of bending moments at the point of failure
is attributed to strain gauge failure at high levels of strain and is not, therefore, of any
great significance.
Figure 5.37 shows the mid-column deflections for segments C6/0-1 and C6/1-2. It is
interesting to note that these plots closely follow those of bending moment presented
in figure 5.36 thus emphasising the relationship between deflected shape and column
bending moment distribution. Despite the significantly reduced mid-column deflections,
figure 5.38 shows that the twist rotation at the centre of column segment C6/1-2 was
larger than that of the lower segment. Obviously, the small twist rotation of the lower
column segment C6/0-1 was influenced by the high torsional restraint from the 'fixed'
column base connection.
5.19

The minor and major axis bending moments at the top, middle and base of column seg
ment C6/1-2 are shown in figures 5.39 and 5.40 respectively. The same data is presented
for segment C6/0-1 in figures 5.41 and 5.42. It is evident that in the case of segment
C6/1-2, the bending moment distribution is typical of that of a member in double cur
vature with the end moments approximately equal but of opposite sign, and with a very
small moment at the column centre. The lack of redistribution of moment within this
particular column segment during the second phase of loading is to be expected in view
of the negligible column deformations which were observed (figure 5.37).
Surprisingly, the plot of minor axis moments for segment C6/0-1 in figure 5.41 shows that
at the end of the beam loading phase, the column was in single curvature bending with
positive moments at the top, mid-point and base of the column. Due to the relatively
small disturbing moment from primary beam PBS, the minor axis column moments were
very small. However, it is interesting to note that a simultaneous reversal of moment
occurred at both the top and base of the column segment whilst the mid-point moment
continually increased. As was observed in the test of column C5, the minor axis base
moment increased rapidly, following reversal, during the later stages of the test. This
tends to substantiate the explanation presented previously for column C5 regarding the
effect of the increased residual stresses in the region of the base-plate connection on the
local capacity of the column.
The major axis connection moments for secondary beams SB3 and SB6 are plotted
against the axialloa.d in column segment C6/1-2 in figure 5.43. The reduction in the
initial disturbing moment during the second phase of the test is similar to that observed
for beam SB2 during the test of column C5 (figure 5.32). Figure 5.44 shows the ma
jor axis moments at the connections of primary beams PB6 and PBS plotted against
the axialloa.d in column C6/1-2. Unlike the primary beam connections to the internal
column C5 (figure 5.33), here there is an appreciable change in the applied minor axis
moment during the second stage of the test. This is principally due to the absence of
beam continuity effects in the case of column C6 and hence a more direct relationship
5.20

between column deformation/head rotation and beam connection moment (see section
6.5). As expected, the largest reduction in the disturbing connection moment occurs
at beam PBS which is connected directly to the critical column segment C6/1-2. As
expected from the reversal of moment observed at the head of column C6/0-1 (figure
5.41), the moment at the connection of beam PBB to the same column segment is also
seen to reverse.
5.S Test frame F2 - test parameters and experimental
observations.
As discussed previously, the overall dimensions of test frame F2 were similar to those of
frame Flo However, in terms of general arrangement and detailing there were two major
differences between the two tests:-
1.. The columns on the active frame of test F2 (C7, CB and C9) were orientated
such that the primary beams framed into the column flanges and the sec
ondary beams framed into the column web.
2. In view of the very high connection stiffnesses observed in test FI, the thick
ness of the connection end plate was reduced in test F2 from 12mm to Bmm.
However, all other aspects of the connection detail remained the same.
The member and joint nomenclature adopted for frame test F2 is detailed in figure 5.45.
It should be noted that the referencing of the members follows a sequence similar to that
of frame Flo
5.21

5.8.1 Selection of the loading configuration.
Table 5.2 summarises the maximum total beam loads which were applied to frame F2.
As in frame test FI, the primary beam loads were applied in a chequer- board pattern
to give the most onerous distribution of primary column bending moments. Due to the
reduced stiffness of the flush end plate connection and the revised column orientation,
the maximum applied beam loads were purposelly chosen to be less than those applied
in test Flo This was particularly apparent in the case of the secondary beams where
the support moments at the connection to the minor axis of the columns on the 'active'
frame were expected to be relatively small.
5.8.2 Measurement of initial column deformations.
As in the case of frame FI, an offset theodolite survey was performed to determine the
initial major and minor axis deflections of the columns on the 'active' frame. The mea
sured column deformations are summarised in figure 5.46. In view of the large initial
deformations which were observed in test FI, particular care was exercised when align
ing frame F2 to ensure that the deformations of columns C7 and C8, the columns which
would subsequently be tested to failure, were not excessive.
5.22

5.8.3 Experimental test procedure and observations.
In the first instance, frame test F2 commenced on 12 October 1990. As previously, the
beam loads were applied first in equal increments of fixed proportion up to the maximum
loads summarised in table 5.2. At the end of the beam loading phase, columns C7 and C8
were to be failed in sequence commencing with the internal column CS. However, when
the applied displacement to the head of column CS was 3.5mm, equivalent to an applied U
load of 306 kN, a 10\<1 bang was heard and all the applied loads were automatically
released. It was immediately apparent that one of the Macalloy bars, which was used to
apply load to column C8, had failed at a coupling joint. Further investigation revealed
that the threaded end of the bar had not been screwed far enough into the female coupler.
As a result, the few threads which had engaged 'stripped' at a relatively low bar tension.
Although it appeared that the frame had been unaffected by the failure, a number of
instrumentation devices were disabled and the loading block at the head of column C8
had sheared its restraining bolts and was precariously balanced on the column head.
It was clear that the test could not continue and that the adequacy of all the tendon
couplers would have to be checked before any further load could be applied. The test
was therefore temporarily postponed.
The re-test of the frame commenced at 09.00 hrs. on 17 October 1990. As in the initial
test, the beam loads were applied in equal increments of fixed proportion up to the total
loads presented in table 5.2. With the beam loads held constant, displacements were
applied to column C8 in 0.5mm increments. When the applied column head displacement
was 6.0mm, corresponding to the maximum applied load of 517 kN, a prominent minor
axis bow was observed in column segments C8/0-1 and C8/1-2 in the directions shown
in figure 5.47. At this increment it was noticed that the applied column head load
was slowly decreasing with time ( the column head loading was displacement controlled
rather than load controlled). A further two increments were applied, making the total
displacement 7.0mm. Over a twelve minute period, the applied 'post- failure' load at
5.23
this increment decreased under a constant head displacement from 440 kN to 434 kN.
The testing of this column was terminated at this increment of displacement.
With the beam loads held constant and the load applied to column C8 removed, displace
ments were applied to column C7 in O.5mm increments. The maximum load applied to
the column was 563 kN corresponding to an applied head displacement of 7.5mm. At the
point of maximum load a prominent minor axis bow was observed in segments C1/0-1
and C1/1-2 but in this instance, the deformations were in the opposite directions to
those observed for column C8 (figure 5.48). Closer examination of the lower column seg
ment, C1/0-1, revealed that a large twist rotation had occurred being most pronounced
at mid-height. The test continued until the total applied displacement was 8.0mm, cor
responding to a post-failure applied load of 549 kN.
At the end of column loading, the applied displacement to column C1 was removed in four
large increments. The beam loads were then removed in fixed proportion in three incre
ments. The test was completed at I6.00hrs. and had therefore lasted almost nine hours.
5.9 Test Frame F2 - Presentation and discussion of re
sults.
This section presents and discusses the measured data obtained from the second frame
test. As in the case of frame FI, the behaviour of the frame during the three key stages
of the test, i.e. beam loading, loading of column C8 and loading of column C7, have
been discussed separately.
5.24
5.9.1 The beam loading phase.
Figure 5.49 shows the distribution of frame bending moments present at the end of the
beam loading stage. It should be noted that in the case of primary beam PBll an error
in the calibration of the feedback load cells resulted in an actual applied load of 76.4 kN
-less than the intended nominal load of 83 kN. This is the reason for the slightly reduced
depth of the free bending moment diagram for beam PBll when compared with that of
PBIO in which the correct beam loading had been applied.
It is evident that, as in the case of test FI, the stiffness characteristics of the connection
had a significant influence on the distribution of moments. However, unlike test FI, the
primary beam support moments were similar irrespective of whether the connection was
to an external or an internal column. The reactant bending moment diagram for the
primary beams was therefore almost horizontal. This can be explained by the increased
major axis stiffness of the columns which resulted in a significantly reduced relaxation
of the disturbing moment to the external column. In addition, the performance of all of
the connections to column major axis was influenced by the deformation of the column
flanges irrespective of whether the column was internal or external. This compares with
test F 1 in which the continuity of the beams connected to the web of the internal column
cancelled out the effect of web panel flexibility and thereby produced a very large support
moment. The distribution of moments presented in figure 5.49 therefore substantiates
the observations discussed in chapter 6 in which the moment-rotation response of a col
umn flange connection was similar for both an isolated cruciform (internal column) and
cantilever (external column) test arrangement.
5.25

5.9.2 The loading of column CS.
Figure 5.50 shows the distribution of bending moments at the point of maximum applied
load (517 kN) on column CS. It is clear that whilst the distribution of minor axis bending
moments on column CS confirms the direction of minor axis deflection observed during
the test (figure 5.47) the major axis column moments show negligible change from those
present at the end of the beam loading phase.
Figure 5.51 shows the major and minor axis bending moments at the centre of column
segments CS/0-1 and CS/1-2 plotted against the respective axial loads. The dramatic
shift in the major axis moment in segment CS/0-1 is not an indication of major axis
failure, but is in fact due to the 'loss' of a number of strain gauges resulting from very
high plastic strains as the column deformed about its minor axis. This is illustrated in
figure 5.52 which shows the mid-column major and minor axis deflections for the two
column segments. The large distance between the data points on the minor axis plot
for column CS/0-1 at the point of maximum load clearly shows the negligible minor axis
axial stiffness of the lower column segment and the dominance of the minor axis failure.
Conversely, the 'near vertical' nature of the major axis deflection plot and the very small
deflection at the point of maximum load clearly demonstrate the high resistance of the
column to major axis failure.
The mid-column minor axis deflections for the two column segments, CS/0-1 and CS/1-
2, have been plotted against the applied column head load (figure 5.53) which, unlike
the axial column load used in figure 5.52, is the same for the two segments at any load
increment. This particular diagram shows that whilst the load deflection characteristics
for the two segments are similar below an applied load of 420 kN, above this load level
the axial stiffness of the lower segment, C8/0-1, decreases rapidly. It is clear that it is
this lower segment which fails and therefore controls the capacity of the column. As
was discussed in section 5.7.3, the peak load and subsequent load reduction observed for
the upper column CS/1-2 is not necessarily an indication of the failure of that column
5.26

segment, but is simply a characteristic of the 'cut- off' load and interaction between
column segments tested in series. The twist rotations observed at the centre of the two
column segments are plotted against the axial column loads in figure 5.54.
Figures 5.55 and 5.56 show the minor and major axis moments at the top, mid- point
and bottom of column segment C8/1-2. It is interesting to note that in this instance
there is a reversal of both the major and minor axis moments at the top of the column
segment. Corresponding data is presented in figures 5.57 and 5.58 for the lower column
segment C8/0-1.
The secondary and primary beam support moments at the connection with column C8
are plotted against axial load in figures 5.59 and 5.60 respectively. In the case of fig
ure 5.59, it is clear that when the column head loading is applied, the connection to
beam BSll continues to 'close' causing an increase in the connection moment whilst
that to beam BS8 starts to 'open' resulting in a reversal of moment. This response is
commensurate with the observed shape of the minor axis of the column shown in figure
5.47 in which the mid-height ofthe two column segments deflected in opposite directions.
5.9.3 The loading of column CT.
The distribution of bending moments on column C7 at a load just below the ultimate
capacity is shown in figure 5.61. The diagram clearly shows the minor axis failure of the
lower column segment C7/0-1 and is in agreement with the observed deformed shape of
the column shown in figure 5.48.
Figure 5.62 shows the major and minor axis bending moments at the centre of the two
column segments plotted against their respective axial loads. As before, the dramatic
shift in the major axis moment at the point of ultimate load is due to the inability of
5.27
the system to measure and convert the large strains from the limited number of gauges
at mid-height and is not therefore representative of the actual column response. The
fa.i1ure criteria of the column is better illustrated in figure 5.63 which shows a plot of the
mid-column major and minor axis deflections. It is clear from this diagram that, as in
the case of column C8, it is the minor axis response of the lower segment, C7/0-1, which
dictated the maximum applied load. The rapid increase in the minor axis deflection at
a load of 475kN suggests that there was a corresponding reduction in the axial stiffness
of the column a.t this load increment. In addition figure 5.64 shows that at this stage in
the test, the twist rotation at the centre of the lower segment increased rapidly. Without
doubt, these sudden changes in the load- deflection response are a result of the spread
of plasticity across the column section. Depending on the nature of the initial residual
stresses, this spread of yield can be rapid and relatively erratic.
Figures 5.65 and 5.66 show the minor and major axis moments at the top, mid- point
and bottom of column segment C7/1-2. As discussed above, the plateaux portions of the
minor axis plots are not necessarily an indication offa.i1ure ofthe segment. The increased
minor axis moments in the latter stages of the test are a result of the moments, and
deformation, induced by the fa.i1ure of the lower column segment. The corresponding
data for the lower column segment, C7/0-1, is plotted in figures 5.67 and 5.68. Here
it is evident that during the initial stages of the column head loading phase, the minor
axis moments at the top and bottom of the column segment reverse sign. However,
when the axialloa.d in the column was 475kN - the load at which twist rotation at the
centre increased rapidly - the minor axis moment at the base changes sign once more.
This corresponds with the load increment at which the column base major axis moment
begins to reverse sign.
At first sight the double reversal of moment at the base of column C7/0-1 appears to
be rather an unusual response. However it is simply an illustration of the relative domi
nance of primary disturbing moments from the beam connection and secondary moments
arising from column deformation. In the initial stages of column head loading, the base
5.28

moment reduces at a similar rate to the disturbing moment applied at the head of the
column segment. Due to the combination of the net column deflection with the initial
column deformation, which was in the opposite direction to the direction of failure, the
absolute displacement of the column is negligible. Consequently, the secondary moments
arising from the axial load acting through a column eccentricity are also negligible - the
primary moments therefore dominated. However, when the axial load was 475kN the
observed increase in the lateral deformations caused a. corresponding increase in the size
of the secondary column moments. These effectively 'swamped' the reductions in the
primary moments and changed the direction of base moment to one which was com
patible with a large deformation at the mid-height of the column. It is clear that the
non-symmetric loading and restraint conditions on this 'corner' column had a signifi
cant effect on the behaviour. Unlike the 'internal' column C8, it appears that, in this
instance, the presence of relatively large disturbing moments has resulted in a lateral
torsional plastic failure of the column segment.
5.10 Summary of the observed column failure loads.
Table 5.3 presents a summary of the column moments at the end of the beam loading
stages and the measured ultimate capacities of columns from both the frame tests. Due
to the different loading arrangements and connection types which were used, it is difficult
to make a direct comparison between the behaviour of columns in test Fl (C5 and C6)
with those from test F2 (C7 and C8). However, there are a number of interesting
features which can be identified. Firstly, the non-dimensiona.lised failure loads show
that despite the relatively large minor axis slendernesses, the columns failed at loads
reasonably close to the squash load. The lowest failure load occurred in segment C5/1-2
in which the total column restraint was less than that of the other 'failed' columns, all of
5.29

which had fixed bas~ connections. Despite the significant difference between the bending
moment patterns in frame F1 and F2, it is interesting to note that the failure loads of
the corresponding columns in the two tests were reasonably similar.
As expected, the lower column segment C1/0-1 failed at a lower load than the other
frame test F2 column, C8/0-1, due to the increased minor axis disturbing moments from
the beams. It must be remembered that each of these columns had the same single beam
minor axis restraint at the first floor leve1. However, although column segment C5/0-1
was subjected to significantly larger minor axis disturbing moments than the other frame
Fl column, C6/0-1, in this instance the column failed at a larger load. This is of course
due to the increased minor axis restraint to the 'internal' column (C5) of frame test
F1 from a pair of primary beam connections as opposed to the single beam minor axis
restraint to the 'external' column (C6).
A significant part of the research project was devoted to the preparation of the two
complex full scale frame tests and the subsequent acquisition of a large amount of ex
perimental data. Unfortunately, this meant that the time available for analysing and
appraising the data was limited, particularly in the case of the second frame test F2.
The experimental data which has been presented in this chapter, chapter 6 (moment
rotation behaviour) and that in chapter 8 (frame deflection) considers only the basic
response parameters. It is clear however that in vi~w of the large amount of data which
was collected, there remain a number of other more detailed aspects of frame response
which need to be investigated. There are at present plans for others at the University of
Sheffield to extend the appraisal which has been conducted by the author.
5.30
5.11 Concluding comments on the full-scale frame tests.
1. Two full-scale frame tests have been conducted at the Building Research Es
tablishment. Analysis of the recorded data has shown that the moment
rotation characteristics of the connections used had a significant influence on
the distribution of frame forces and deflections.
2. The high column failure loads and the minor axis moment reversal which has
been observed clearly illustrate the benefit of connection restraint on column
capacity.
3. The significant difference between the distributions of bending moments ob
served in test Fl and F2 clearly substantiates the differences which have been
observed in 'isolated' connection tests on the behaviour of connections to a
column flange and those to a column web.
4. It is evident that at the point of ultimate load there is interaction between
adjacent segments in a series of columns.
5. In one particular instance, it has been shown how the large thermal residual
stresses present at a substantial welded base plate connection influenced the
failure of a column segment.
5.31

References.
5.1 Wood, R.H., Needham, F.H. and Smith, R.F., 'Tests on a multi-storey rigid steel frame', The Structural Engineer, Vol. 46, No.4, April 1968, pp. 107-120.
5.2 Baker, J.F., 'An investigation of the stress distribution in the steel framework of a modem hotel building', Final report of the Steel Structures Research Committee, H.M.S.D., London, 1936, pp. 8-139.
5.3 Weeks, G., 'Laboratory testing of large structures', I.A.T.R.L.M.S., Methodology and testing of structures No.3- Tests on full-scale structures, International Colloquium, Rilem, Bucharest, 1969, pp. 204-222.
5.4 Davison, J.B., 'Strength of beam-columns in flexibly connected steel frames', Ph.D. Thesis, Department of Civil and Structural Engineering, University of Sheffield, U.K., June 1987.
5.5 Jenkins, W.M., 'Local failures in steelwork structures.', research report F3/2/256 No.2, Division of Civil Engineering, Hatfield Polytechnic, U.K., March 1984, pp.I-60.
5.6 Gibbons, C., 'The strength of biaxially looded beam-columns in flexibly connected steel frames - Volume !: A survey of the mechanical and geometric properties of structural steel sections', Ph.D. thesis, Department of Civil and Structural Engineering, University of Sheffield, Dec. 1990.
5.7 Gibbons, C., Kirby P.A. and Nethercot D.A., 'The development of a device for measuring the 9-dimensional deformation of steel columns. ',Journ. Strain Analysis. (to be published)
5.8 Gibbons, C., Kirby P.A. and Nethercot D.A., 'The experimental assessment of force components within thin walled structural steel members', Journ. Strain Analysis. (to be published)
5.9 Davison, J.B., Kirby, P.A. and Nethercot, D.A., 'Rotational stiffness characteristics of steel beam-to-column connections', Journ. Construct. Steel Research, No.8, 1987, pp. 17-54.
5.32

Primary Total Secondary Total beam beam load beam beam load
reference (kN) reference (kN)
PB5 69 SB1 -PB6 139 SB2 101 PB7 138 SB3 96 PB8 70 SB4 98
SB5 0 SB6 101
Table 5.1: Total loads applied to the beams in test Flo
Primary Total Secondary Total beam beam load beam beam load
reference (kN) reference (kN)
PB9 131 SB7 -PB10 84 SB8 62 PB11 76 SB9 69 PB12 132 S810 63
S811 20 SB12 65
Table 5.2: Total loads applied to the beams in test F2.
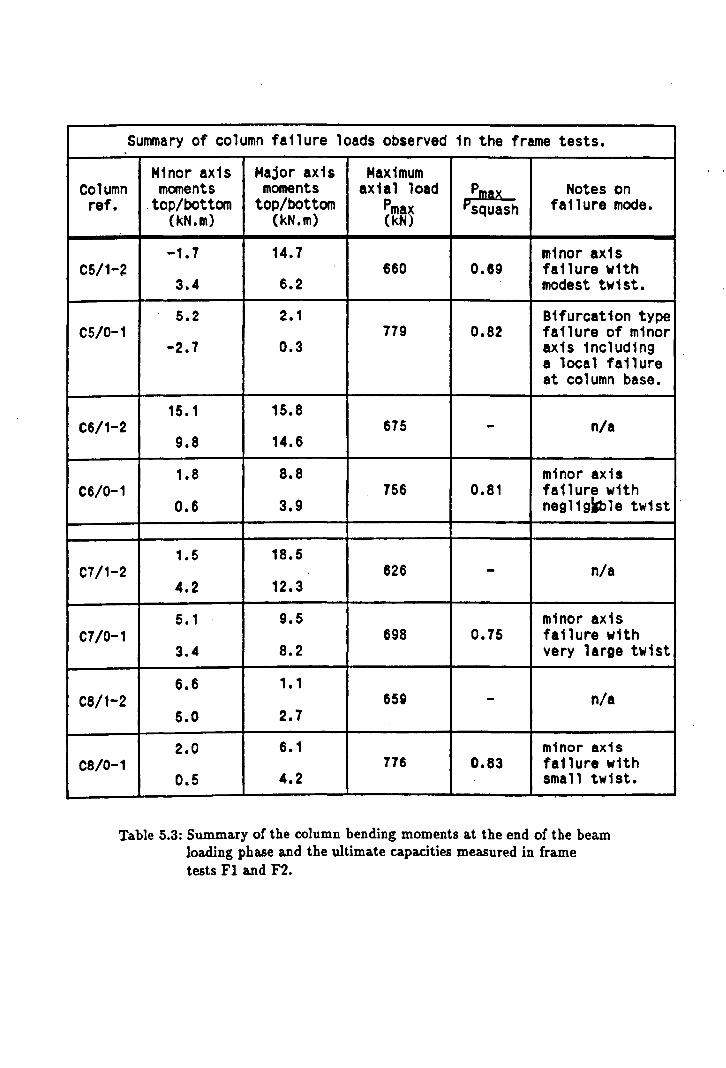
Summary of column failure loads observed in the frame tests.
M1nor axis Major axis Max1mum Column moments moments axial load Pml2S Notes on ref. . top/bottom top/bottom Pmax PsqUaSh fal1ure mode.
(kN.m) (kN.m) (kN)
-1.7 14.7 minor axis C5/1-~ 660 0.89 fa11ure with
3.4 6.2 modest twist.
5.2 2.1 Bifurcation type C5/0-1 779 0.82 failure of minor
-2.7 0.3 axis including a local failure at column base.
15.1 15.8 C6/1-2 675 - n/a
9.8 14.6
1.8 8.8 minor axis C6/o-1 756 0.81 failure with
0.6 3.9 ne9119~le twist
1.5 18.5 C7/1-2 826 - n/a
4.2 12.3
5.1 9.5 minor axis C7/0-1 698 0.75 failure w1th
3.4 8.2 very large twist
6.6 1.1 C8/1-2 659 - n/a
5.0 2.7
2.0 6.1 minor axis C8/0-1 776 0.83 fa1lure with
0.5 4.2 small twist.
Ta.ble 5.3: Summary of the column bending moments a.t the end of the beam loading phase and the ultima.te capacities measured in frame tests Fl a.nd F2.

'Static frame'
Secondary beam
Primary beam
'Active frame' members shown in bold.
C4
C5
C6 Figure 5.1: Isometric view indicating the 'active' and 'static' parts of the
test frame.
4953 4953 3429
@-. 1397%50 CHS 1397%50 ClIS
®-. 254%102%22 UB 254xl02:l22' UB 254%102%22 UB
g t) g :>
~ to)
~ ~ C\I C\I C\I II'> I/) ttl ';l H ';l N N C\I I/) \I) ~ ... ...
(D-. 254:0:102.22 VB 264%102:0:22 UB . 254xl02%22 UB
@-. ... . ~ . .. Elevation Section
Figure 5.2: General arrangement of test frame Fl, (F2 ~im.ilar).
. ..

C4 C5
-- - - -
- - - -Frame F1
CoIUDlIlJ on the acUve frame rolated through
I 90 degrees. .
/ "" 7 ~, Frame F2
C6
---~ AcUve I frame
Figure 5.3: Plan views indicating the different column orientations adopted for frame test Fl and F2.
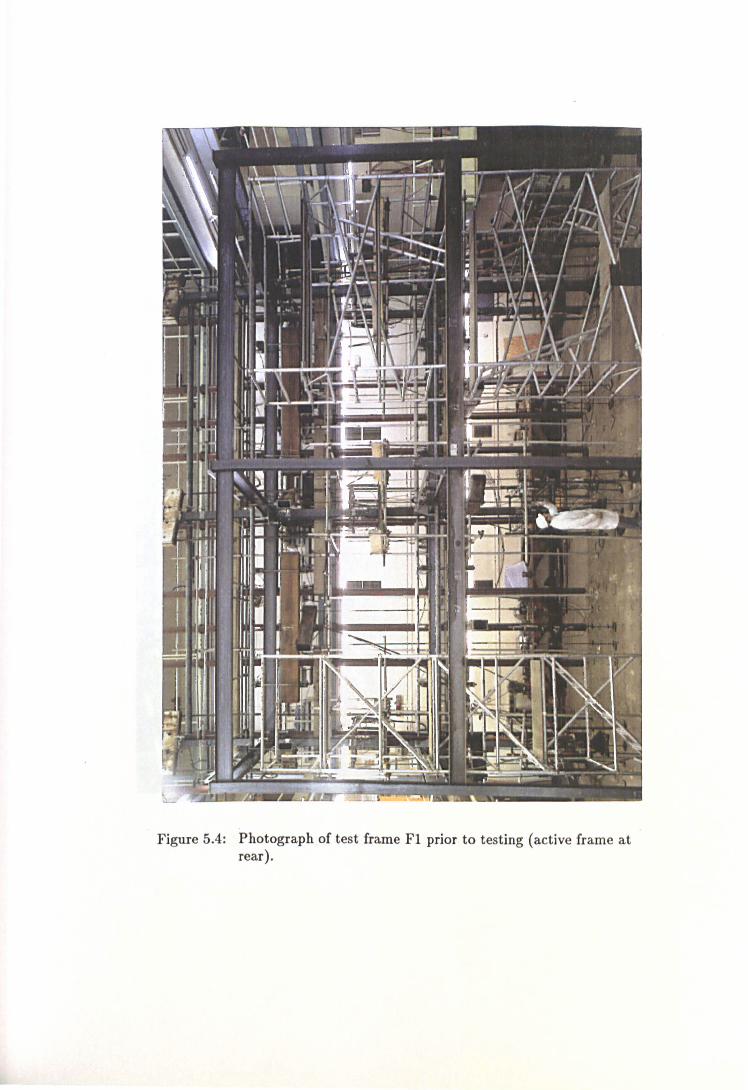
Figure 5.4: Photograph of test frame Fl prior to testing (active frame at rear).

Figure 5.5: Photograph of test frame Fl prior to testing.
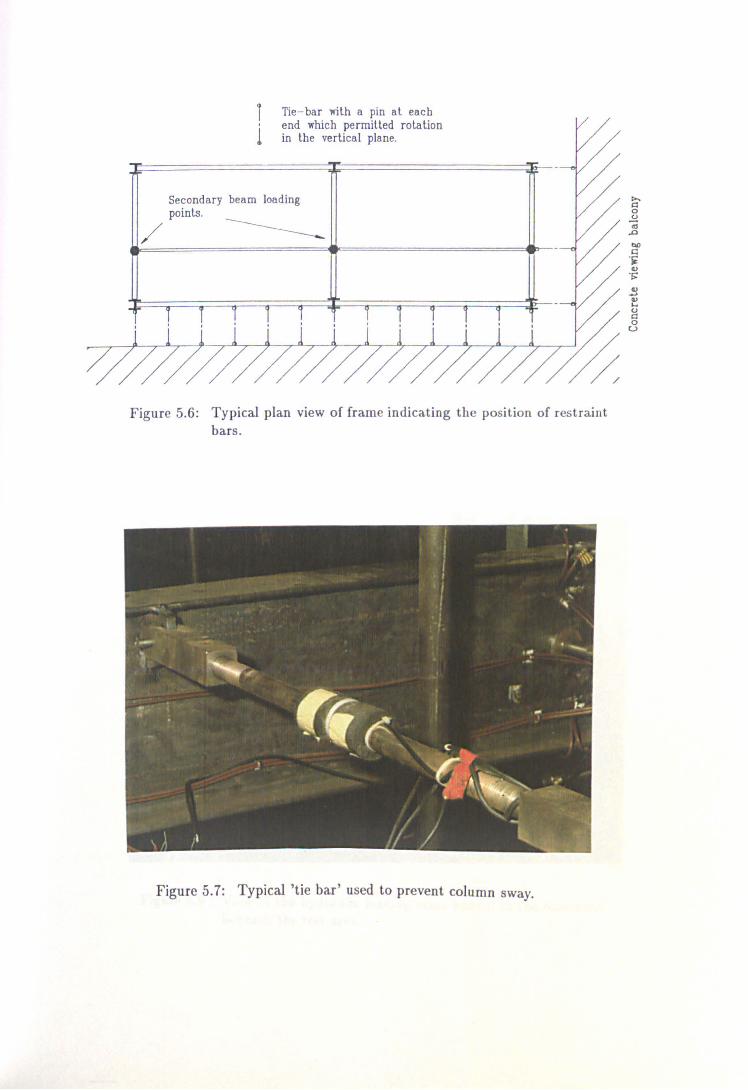
/
i Tie- bar with a pin at each
l' end which permitted rolation
in the vertical plane.
Secondary beam loading points.
i T 1 1 1 1 1 1 1 1
Figure 5.6: Typical plan view of frame indicating the position of restraint bars.
Figure 5.7: Typical 'tie bar' used to prevent column sway.
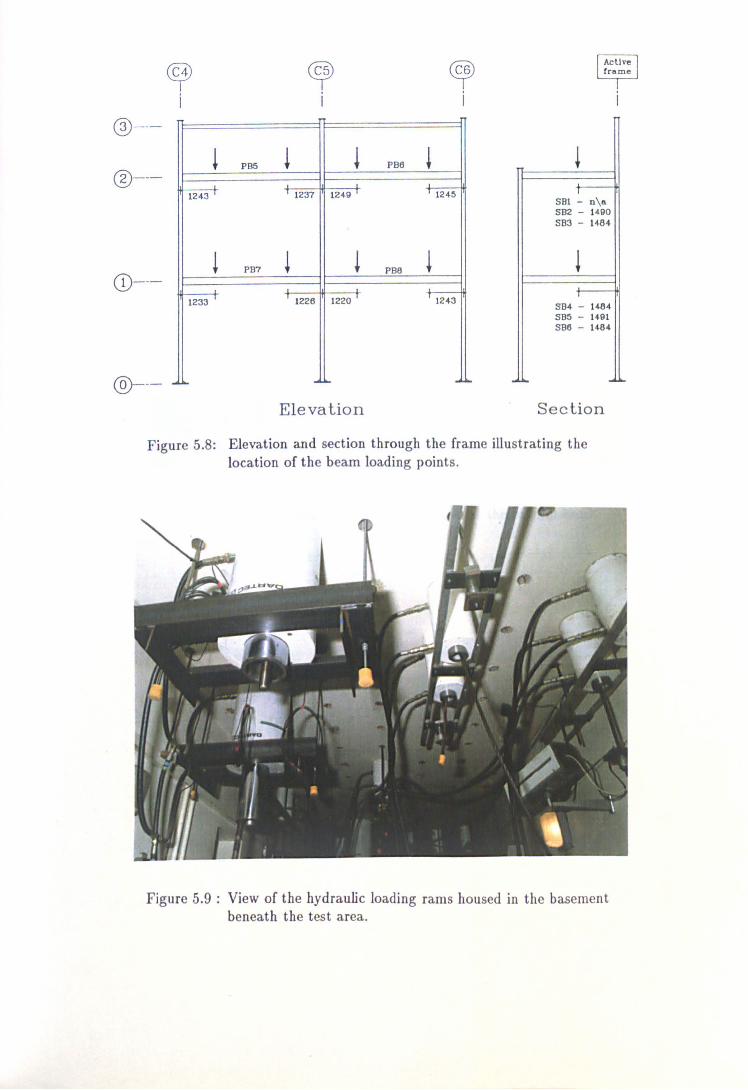
~ ~ i i
@---
@---~ PBS ~ ~
1243 1237 1249
CD- --~ PB7 ~ ~
1233 1226 1220
@--- ~ .. ~ .. Elevation
~ i
PB6 ~ 124:1
PB8 ~ 1243
~ .. ~ ..
r SBl - n\a SB2 - 1490 SB3 - 1484
SB4 - 1484 SBS - 1491 SS6 - 1464
~ ..
Section
Figure 5.8: Elevation and section through the frame illustrating the location of the beam loading points .
Figure 5.9 : View of the hydraulic loading rams housed in the basement beneath the test area.

Figure 5.10: Arrangement used to apply load at the column head .

'"rj oq" = .... It)
(.1' .... .... ~ tI)
It) = .... a It) !3 a e: E'< = 0 .... -It) " Q.t:r' • It)
~ -" o = 01
0' .... ~ r; Q.
Q. It)
0' 8 ~ g' 8 !3
't:1 o t:S It) t:S .... 0>
~ e: g.
p.dy P,dy
J
\. ' .! PyJ1xJ1z P P PY,Hx,t1z
V ,t dy \ dl ,
• • • • •
Measured parameters as.
lower- storey
P P
/~Oz drl dy i
dy f ~x,~z,
.. ....... .-A , ---~
Mz.&z -----Hz ,..-/ Hz ~ \
\~HXJ'1Z Py.MX.~/ Hz.&z
...-Py,Hx,Hz Py.Mx,Mz-dX,dy.dz,&y dX,dY,dz.&y
/' Py.Mx, Hz Py,Mx,Mz,
::. c ~
P,dy P. dy
~ •
/ p p Py,HXJ1,
dlt dy dy 4 f
P
dy 1Y dy J f •
• • • ,. ~ .
/ / . Hx Mx,9x
Measured parameters as
lower storey
•
P P
dd dy ~y 9x,9z, •
P
dy dy l ~y i , • ..... ...... "
----- Hz ,..-/ H~ z.~/ Py,Mx,Hz
" 1f • / (.
HlC MlC,9x
L Py,Mx,Hz-
dX,dy,dz.&y
PY,Mlf,Mz .......
y
z
0: a •

Figure 5.12: System used to monitor beam deflection.
Figure 5.13: Three-dimensional measurement device used to monitor the deformations at the column centre.

Figure 5.14: The 'hanging dumb-bell' rotation measurement device.

J --~ -- r- 4 9 auge
~
~f- .- 4g auge -
§ 4 ga -f- -- uge
,
8 $
co -- 1--- .-1-10 co gauge -D ,....
--' I- --r--4 co
gauge S -§
-4 ..• r-- -- gauge
co 0 co ......
co .... .-1-.-r-10 0 -D
gauge rn
- --1--- o . !=- 4 gauge
§
Columns on the Active Frame
Frame 1 and Frame 2
t 57 57 1
4 Strain gauge
Arrangement
__ 2~ __ 10 Strain gauge
25 +- ' i Arrangement
I J ~ 38 l19 "19~ 38 ~
Beam strain gauge
Arrangement
Figure 5.15: Location of strain gauges on the column members.

t,.
, 1030
I · I q, I~o I 955
4953
D
1030 I Main Beams Frame 1 I
I o ·
, 1~ I r 955 I
Main Beams Frame 2
I . •
Frame 1
Secondary Beams Frame 2 :
Figure 5.16: Location of stra.in gauges on the beam members.

Part proce •• ed data
,,---.----! 'ra,..' frame data
r----+----
t ~_r.~1 I 'L De. ta Lossers -- Orion 'A'
Orion 'B'
1111111111 == --, ,
r LoacSinI ' Control
Hydraulic Pump Servo-Control
Ampl1!iers
.................. LoacSlq rama
Pre •• ura 'UfP111 to lndh1clua t Joadq rami I i
Hydraulic Pumps
Figure 5.17: Schematic diagram showing the experimental set-up.
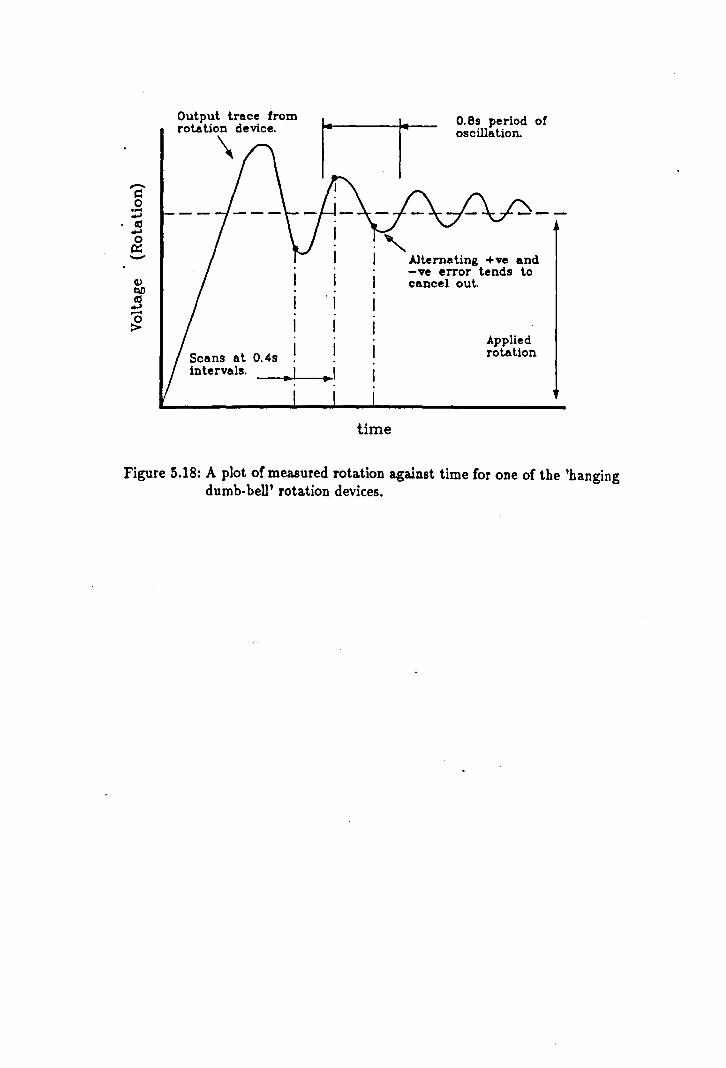
'2' o .... ~
• «l ~ o p:: -
Output trace from rota tion device.
\
Scans at O.4s intervals. ..
time
O. Bs period of oscillation.
Alternating +ve and -ve error tends to cancel out.
Applied rotation
Figure 5.18: A plot of measured rota.tion a.gainst time for one of the 'hanging dumb-bell' rotation devices.

a b g F=====::a:::f
h
C4/2-3 C5/2-3 C6/2-3
c PB5 d i PB6 j
'14/1-2 C5/1-2 C6/1-2
e PB7 f k PBS 1
C4/0~1 C5/0-1 C6/0-1
Elevation of the 'active' frame
n SBl m P SB2 0 r SB3 q
t SB4 s v SB5 u x SB6 'W
. ~ . . - . - . .. C4 C5 C6
Sections at secondary beam locations
Figure 5.19: Elevation and section through test frame F1 indicating the member nomenclature.

P~
Q,
Figure 5.20: Distribution of rigid frame bending moments resulting from a 'chequer-board' floor load distribution.
C4 C5 C6 C4 C5
Minor column axes Major column axes
Initial column deformations (mm)
Figure 5.21: Initial column deformations for test Fl.
C6

C4 C5 C6
C4 C5
SS1
SB5
App. load (kNJ C4 • -.4 C5· -.5 C6 • -.3
PBS· 69.1 PB6 • 139.1 PB7 • 138.6 PBB· 70.1
581 • .0 582 • 101.4 SB3· 96.1 SB4· 9B.5 SB5· -.0 SB6 • iOO.6
Seal e (KNm) i , i , j
o 50 C6
Bending.Moment Diagram - Test Frame 1
Figure 5.22: Computer generated frame bending moments a.t the end of the beam loading phase· test frame Fl. .
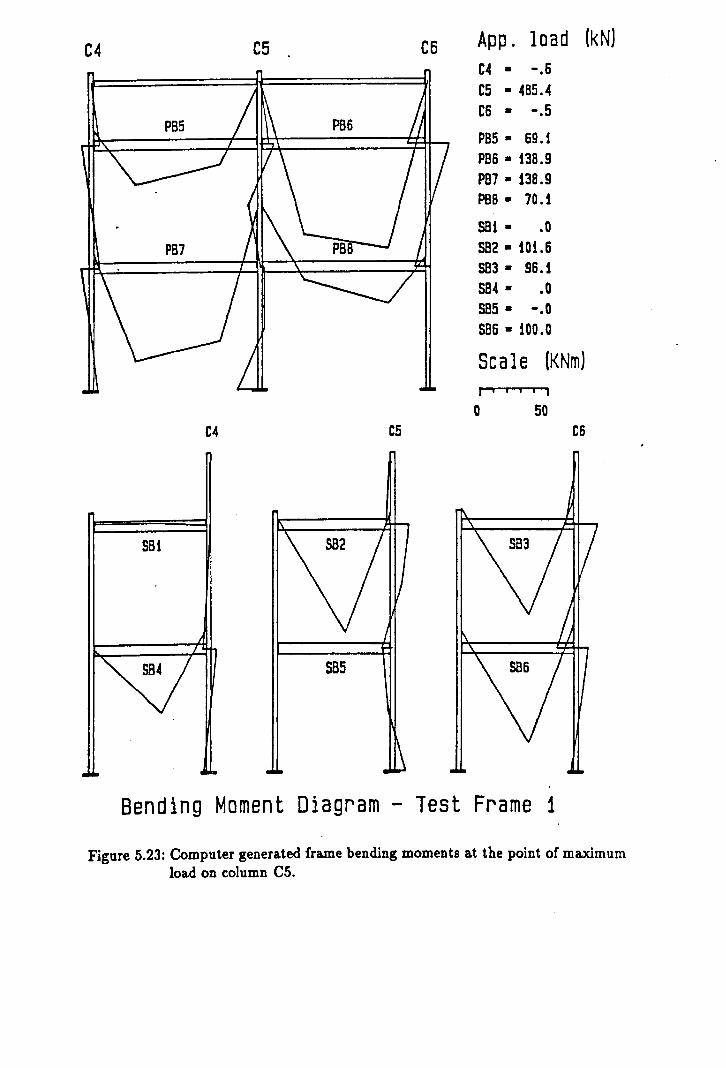
C4 C5 C6
C4 C5
sst
585
App. load (kN) C4 • -.6 C5 • 485.4 C6 • -.5
PBS· 69.1 PB6 • 138.9 PB7 • 138.9 PB8· 70.1
581 • .0 SB2 • 101.6 583· 96.1 SB4 • .0 585· -.0 SB6 • 100.0
Scale (KNm) , iii i
o 50 C6
Bending Moment Diagram - Test Frame 1
Figure 5.23: Computer generated frame bending moments a.t the point of maximum load on column C5.

Mid-column bending moments. Frame test F1
X102 B
7
6
z 5 ~
.... ... 4 C>
-J -.~ I< 3 cC -... Minor - C5/1-2 .....
~ C>
2 I-
Major - C5/1-2 G-£I
1 G--t) Minor - C5/0-1 If--!I Major - C5/0-i
0 -e -6 -4 -2 0 2 4 6 B 10
Bending Moment (kNm)
Figure 5.24: Axial load VS. mid-column moments for C5/0-1 and C5/l-2.
Mid-column bending moments. Frame test F1
X101 50
45
40
z 35
"'" 30 .... 10 CI 25 -i 20 -co y .. 15
~ Minor - [;5/1-2 .. -- B-.£I Major - C5/1-2 J 10 G-C) Minor - C5/0-1
5 If--!I Major - c:5/0-1 0
-5 ----, i i i i i i , , -8 -6 -4 -2 0 2 .4 6 B 10
Bending Moment IkNmJ
Figure 5.25: Applied column head load VS. mid-column moments for C5/0-1 and C5/1-2.

z ~
,.. ... co
-oJ -.!!: ><
cC -... ..... co ~
-III .....
Mid-column deflections. Frame test F1
X102 e
7
6
5
~
3
2 ~ Minor - C5/i-2 G-£l Major - CS/1-2
1 G-E) Minor - C5/0-1
--- Major - C5/0-1
0 -6 -4 -2 0 2 ~ 6 8 10 12 14 16
Deflection (mm)
Figure 5.26: Axial load vs. mid-column deflections for C5/0-1 and C5/1-2.
Mid-column twist rotations.
X1Q2 B
7
6
Frame test F1
~ 2
1 ~ Twist - C5/1-2 a--e Twist - C5/0-1
O+----~ ___ ~~----T---_r---_.---,_---~---r_ ___ ~~---_, -20 -15 -10 -5 0 5 10 15 20 25
Twist (radians)
30 35 40 X10-3
Figure 5.27: Axial load vs. mid-column twist rotation for C5/0-1 and C5/1-2.

z ~
"CI to co
-oJ -~ >< -c -to ~
"" ....
z ~
"CI ... "" -oJ -.. -~ -to ..... "" t-
Minor column axis bending moments. Frame test F1
Xl01 70 65 60 55
. 50
~5
40 35 30 25
20 15 Top - C5/1-2 10 Mid - C5/1-2
5 Bot - C5/1-2
0 -10 -8 -6 -4 -2 0 2 4 6 8 10 12
Bending Moment (kNm)
Figure 5.28: Axial load vs. minor axis moment at the top, mid-point and bottom of C5/1-2.
Major column axis bending moments. Frame test F1
XiOl 70 65 60 55 50 45 40 Top - C5/1-2 35 ~ Mid - [:5/1-2 30 G-E) Bot - C5/1-2
25 20 15 10 5 0
-10 -S -6 -4 -2 0 2 4 6 B 10 12 14 16 Bending Moment OcNml
Figure 5.29: Axial load vs. major axis moment at the top, mid-point and bottom of C5/1-2.

z cs
~ I'D co ...I -I'D -K c -I'D .... co t-
Z &5.
~ I'D c ...I -I'D -~ -I'D .... co t-
Minor column axis bending moments.
X102 B
7
6
5
.. 3
2
1
0
~ Top - CS/O-i ~ Mid - CS/O-i G-il Bot - CS/O-1
Frame test F1
-18 -16 -1~ -12 -10 -a -6 -01· -2 0 2 A 6 8
Bending Moment IkNm)
Figure 5.30: Axial load vs. minor axis moment at the top, mid· point and bottom of C5/0·1.
Major column axis bending moments.
X102 B
7
6
5
.. 3
1
0 -B -6 -4 -2 0 2 01
Bending .wlent IkNmJ
Frame test F1
~ Top - C5/0-1 ~ Mid - CS/O-1 ~ Bot - CS/O-i
6 B 10 12
Figure 5.31: Axial load vs. major axis moment at the top, mid·point and bottom of C5/0-1.

.... to C>
-'
.-
Secondary beam connection moment.
X101 70
65 60 55
50 -15
-10
35 30 25
~ . 20 t-
15 10
5 0
Frame test F1
0 2 4 6 B 10 12 14 16 18
Bending Moment (kNmI
Figure 5.32: Axial load vs. moment at the connection of beam SB2 to column C5/1-2.
z ~
.." to co -' .-to -~ ..... ...
,oj ... t-
Primary beam connection moments.
X101 70
65
60 55
50 -is 40 35
30 25 20 IS
10 5 0
0
>f---+(
a--El
5
PB5 PBS
10 15 20 25 30
Bending Moment IkNml
Frame test F1
35 -10 .. 5 50
Figure 5.33: Axial load vs. moment a.t the connection of beainsPB5 and PB6 to column C5/1-2.

Primary beam connection moments.
X102 8
~ PB7 7 G-£l PBB
6
..:0
.5 4 -fa -.:: 3 -fa .... :=. 2
1
Frame test F1
Ol+-~~---.---.----r---~--'----r---.--~--~ o 5 10 15 20 25 30 35 40 45 50
Bending Moment (kNm)
Figure 5.34: Axial load VB. moment at the connection of beams PB7 and PB8 to column C5/0-1.
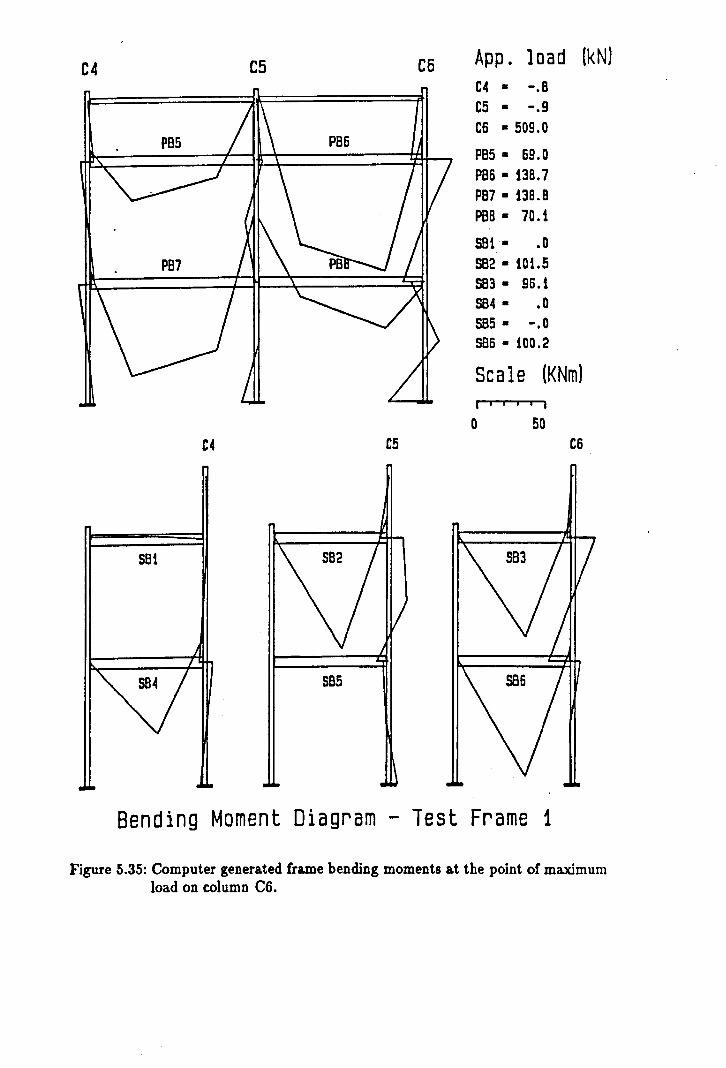
C4 C5 C6 App. load (kN)
C4 - -.8
C5 - -.9 C6 - 509.0
PB5 - 69.0 PB6 - 138.7 PB7 - 138.8 PBS - 70.1
S81 - .0 S82 - 101.5 583- 96.1 SB4- .0 585- -.0 SB6 - 100.2
Scale (KNm) , , . , i
0 50 C4 C5 C6
581
SB5
Bending Moment Diagram - 1est Frame 1
Figure 5.35: Computer generated frame bending moments at the point of maximum load on column C6.
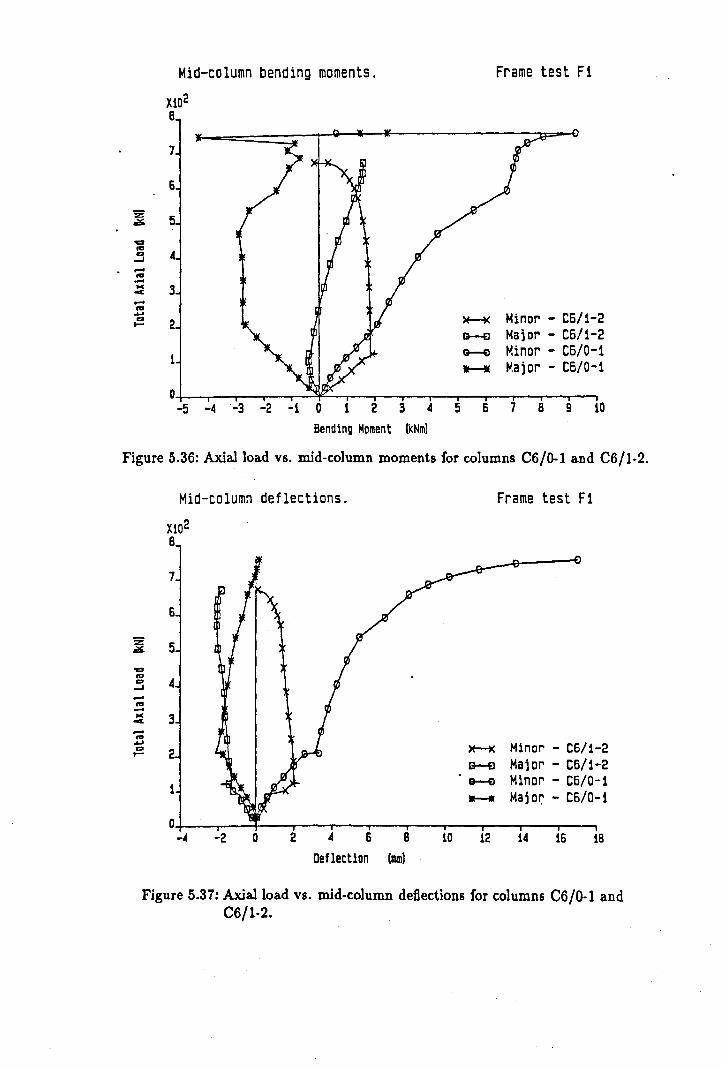
% Iii&.
'o::t ... ... ..J -... -... oC -... ..... ... .....
Mid-column bending moments.
X102 B
7
6
5
4
3
2
i
Frame test F1
~ Minor - CS/1-2 G--e Major - CS/1-2 ~ Minor - C6/0-1 I--W Major - C6/0-1
Ol+-~ __ ,-~ __ ,-~~,-~ __ ,-~ __ ,-~ __ ,-~ __ ~-, ·5 -4·3 -2 ·1 0 1 2 3 4 5 6 7 B 9 10
Bending Moment (kNm]
Figure 5.36: Axial load vs. mid-column moments for columns C6/0-1 and C6/1-2.
Mid-column deflections.
Xi02 B
7
6
.... : 4 ..J -... -~ 3 -... .6J
:= 2
1
Frame test F1
~ Minor - C6/1-2 B-fl Major - C6/1-2 G--El Minor - C6/0-1
--- Majo~ - C6/0-1
O~--~---4---~--~---~---r---r----r---~--~--~ -4 -2 0 2 of 6 8 10 12 14 16 18
Deflection (ram]
Figure 5.37: Axial load VS. mid-column deflections for columns C6/0-1 and C6/1-2.
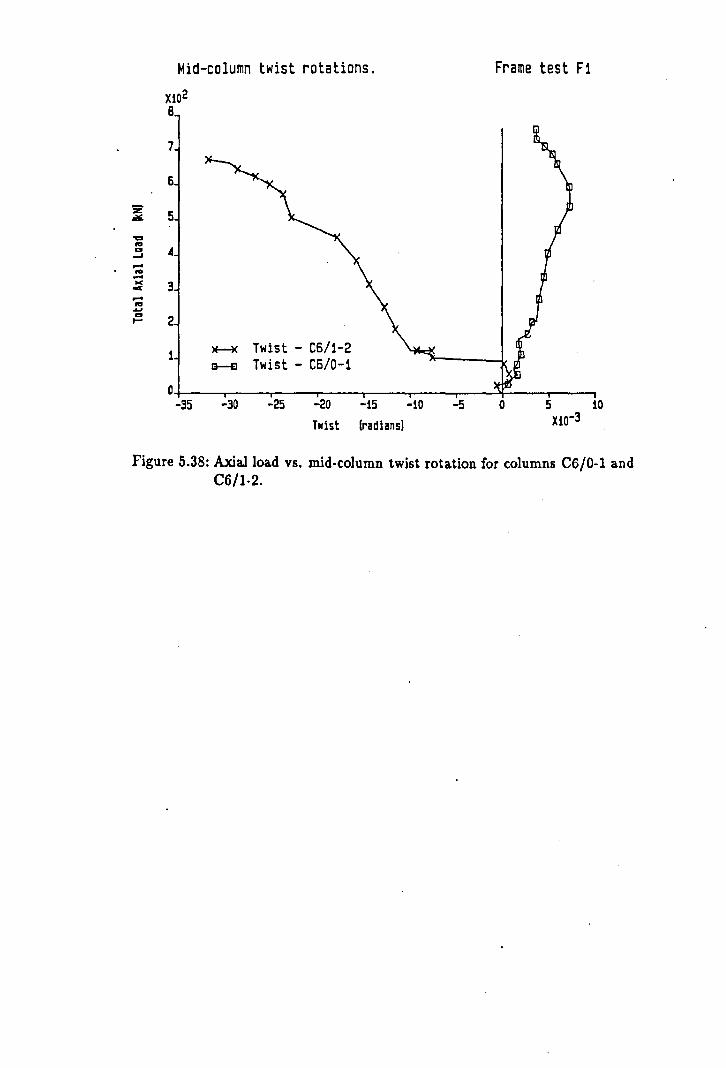
-... .....
Mid-column twist rotations.
X102 B
7
6
~ 2
1 ~ Twist - C6/1-2 G--S Twist - C6/0-1
Frame test F1
O+----~------~---~------T_---~------~---~------~---_, -35 -30 -25 -20 -15 -10 -5 o 5 10
Twist (radians) XlO-3
Figure 5.38: Axial load vs. mid-column twist rotation for columns C6/0-1 and C6/1-2.
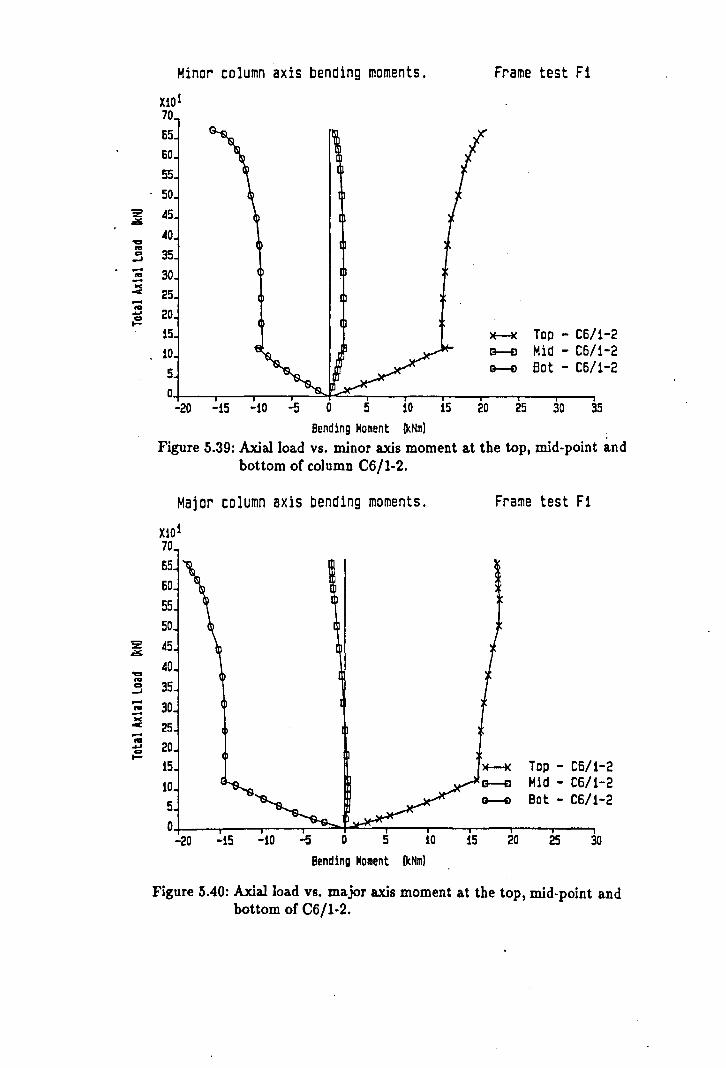
z ~
'a ... co ~
..... ... ->< oC ..... ... ..... CI ~
z ..:!!>
'a ... CI -' ..... ... ->< c ..... .. ..... co t-
Minor column axis bending moments. Frame test F1
XiOl 70 65 60 55
50 ~5
~O
35 30 25 20 15 >E--K Top - C6/1-2 10 I3--£l Mid - C6/1-2
5 ~ Bot - C6/1-2
0 -20 -15 -10 -5 0 5 10 15 20 25 30 35
Bending Moment (kNm)
Figure 5.39: Axial load vs. minor axis moment at the top, mid-point and bottom of coJumn C6/1-2.
Major column axis bending moments.
X1Q1 70 65 60 55 50 45 40 35
30 25 20 15 10 5
0 -20 -15 -10 -5 0 5
Bending Moment
10 (kNm)
15
Frame test F1
~ Top - CS/1-2
20
Mid - CS/1-2 Bot - C6/1-2
25 30
Figure 5.40: Axial load vs. major axis moment at the top, mid-point and bottom of C6/1-2.

Minor column axis bending moments.
X102 B
7
6
Frame test F1
~ 5
.... -:: 3
.... ... -
1
~ Top - C6/0-1 G-El Mid - C6/0-i G-El Bot - C6/0-1
O~~~~~~---~~~---~-r~---+--r-.---~-.~ -22 -20 -16 -16 -14 -12 -10 -8 -6 -4 -2 0 2 4 6 B 10
Bending Moment (kNID)
Figure 5.41: Axial load vs. minor axis moment at the top, mid-point and bottom of column C6/0-1.
Major column axis bending moments.
X102 B
7
6
Frame test F1
~ 3 .... ... .... := 2
)t-K Top - C6/0-1 G--EI Mid - C6/0-1 G-€) Bot - C6/0-1
1
O~---~---r-~~-.----.----.----r-----.----~----,-~ -6 -4 -2 0 ·2 4 6 8 10 12 14 16
Bending Moment ~NID)
Figure 5.42: Axial load vs. major axis moment at the top, mid-point and bottom of column C6/0-1.

Z -.... ... co -' -... ->< -< -... .... co t-
Secondary beam connection moments.
X101 70 55
50
55 .50
-is -i0
35 30 25
20 15 10
5
0 0 2
)f-K SB3 B-tI SB6
6 8 10 Bending Moment (kNm)
Frame test F1
12 14 16 18
Figure 5.43: Axial load vs. moment at the connection of beams SB3 and SB6 to column C6/1·2.
Primary -beam connection moments~- Frame test F1
Xi01 70 65 60 55
50 z 45 -.... 40 I'D
35 co ~ -' - 30 Ir-iI I'D .->< c 2S -I'D
20 ..... co t-
19 10 5 0
-4 -2 0 2 4 . 6 8 10 12 U 16 18 20 22 24 Bending Mcment (kNm)
Figure 5.44: Axial load vs. moment at the connection of beams PB6 and PBS to column C6/1-2.
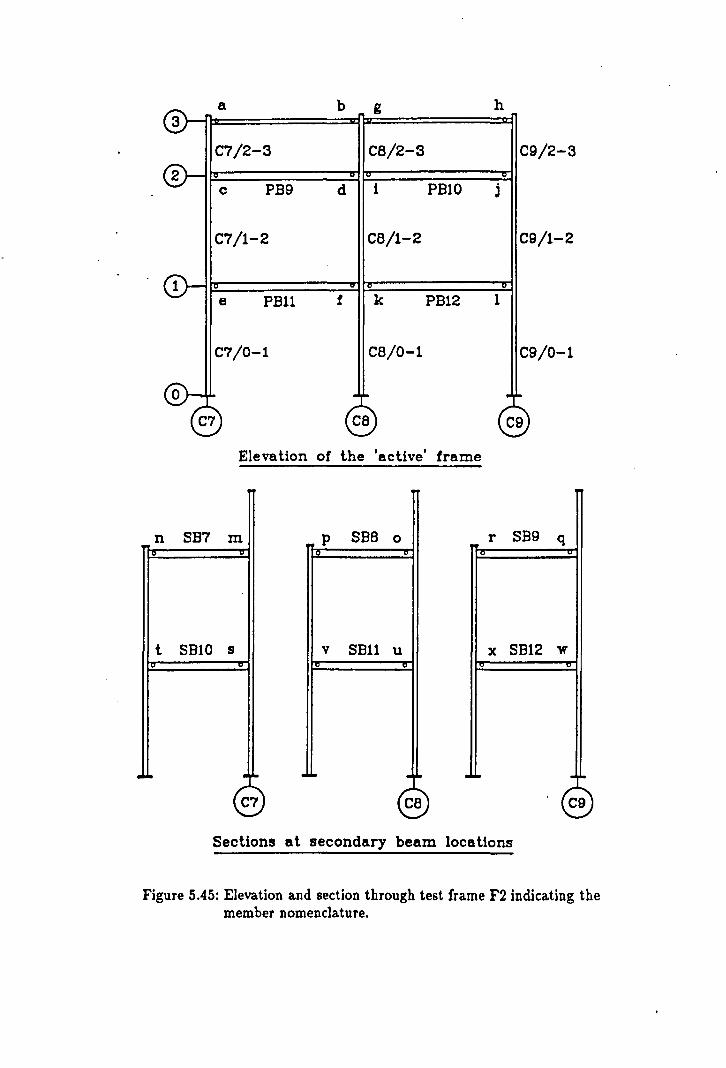
a b g h
C7/2-3 CB/2-3 C9/2-3
c PB9 d 1 PBI0 j
C7/1-2 CB/1-2 C9/1-2
e PBll f k PB12 1
C7/0-1 CB/O-l C9/0-1
Elevation of the 'active' frame
n SB7 m P SBB 0 r SB9 q
t SBI0 s v SBll u x SB12 'W
. . . .. . . • I. . .. . . C7 CB C9
Sections at secondary beam locations
Figure 5.45: Elevation and section through test frame F2 indicating the member nomenclature.
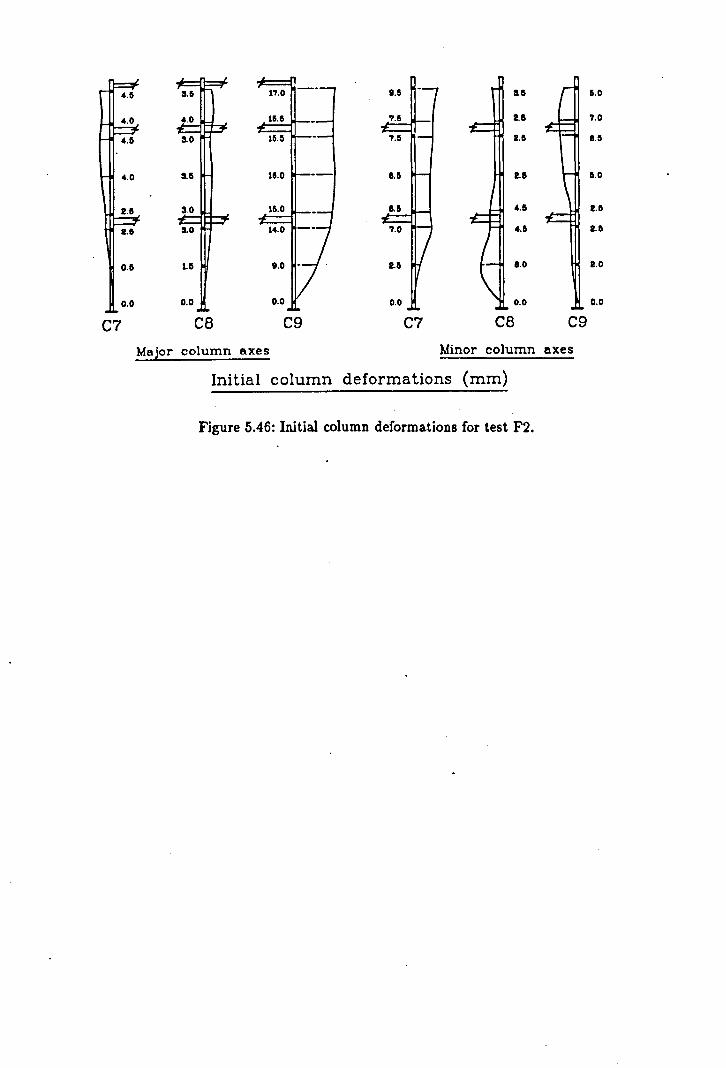
:u 1'7.0 3.11 5.0
115.11 1.11 '.0
4.11 3.0 15.11 1.& &.11
4.0 3.& 1.& 11.0
2.& 3.0 4.& 2.&
IU 3.0 4.& 2.&
0.& La 1.0 2.0
0.0 0.0 0.0 0.0
C7 C8 C9 C7 C8 C9
Major column axes Minor column axes
Initial column deformations (mm)
Figure 5.46: Initial column deformations for test F2.

-deformation of v t--------/-I minor axis
-\
-'- -(8
Figure 5.47: Observed deformed shape of the minor axis of column CS.
/ --
\ deformation of
~ minor axis
- I
1/ -I.. -I..
(7
Figure 5.4S: Observed deformed Iha.pe of the minor axis of column C1.

C7 CB
PB9 PBIO
PBB PBl2
C7 CB
SB7
C9 App. load (kN) C7 - -.3 C8 - -.3 C9 - -.2 PB9 - 131.2 PB10- 83.B PBU- 76.4 PB12- 131.B
SB7 - .0 SBB - 61.6 SSg - 69.2 SB10- 63.0 SB11- {9.7 SS12- 64.6
Scale (KNm) iii i , »
o 50 C9
Bending Moment Diagram - Test Frame 2
Figure 5.49: Computer generated frame bending moments at the end of the beam loading phase· test frame F2.
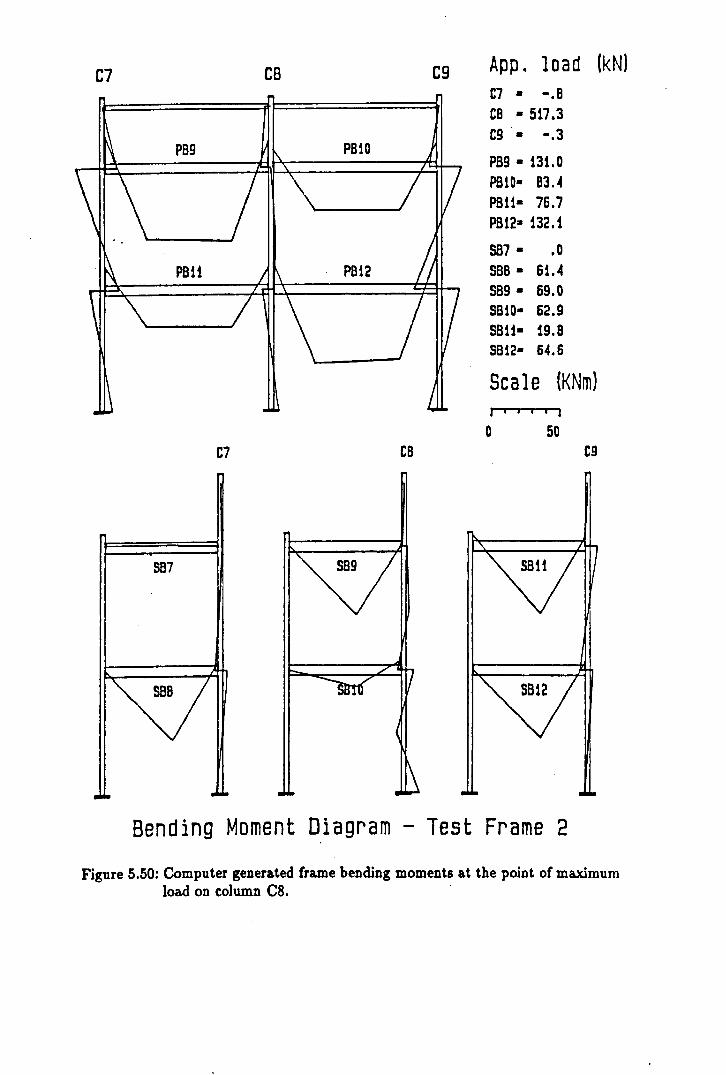
C7 CB
PB9 PB10
PBH PB12
C7 CB
S87
C9 App. load (kN) C7 - -.B CB • 517.3 Cg· -.3
PB9 • 131.0 PBiO- B3.~
PBU- 76.7 PB12- 132.1
587 • .0 seB· 61.4 sag· 69.0 saiD- 62.9 sau- 19.B 5812- 64.6
Sea le (KNm) J i » iii
o 50 C9
Bending Moment Diagram - Test Frame 2
Figure 5.50: Computer genera.ted frame bending moments a.t the point of maximum load on column CS. .
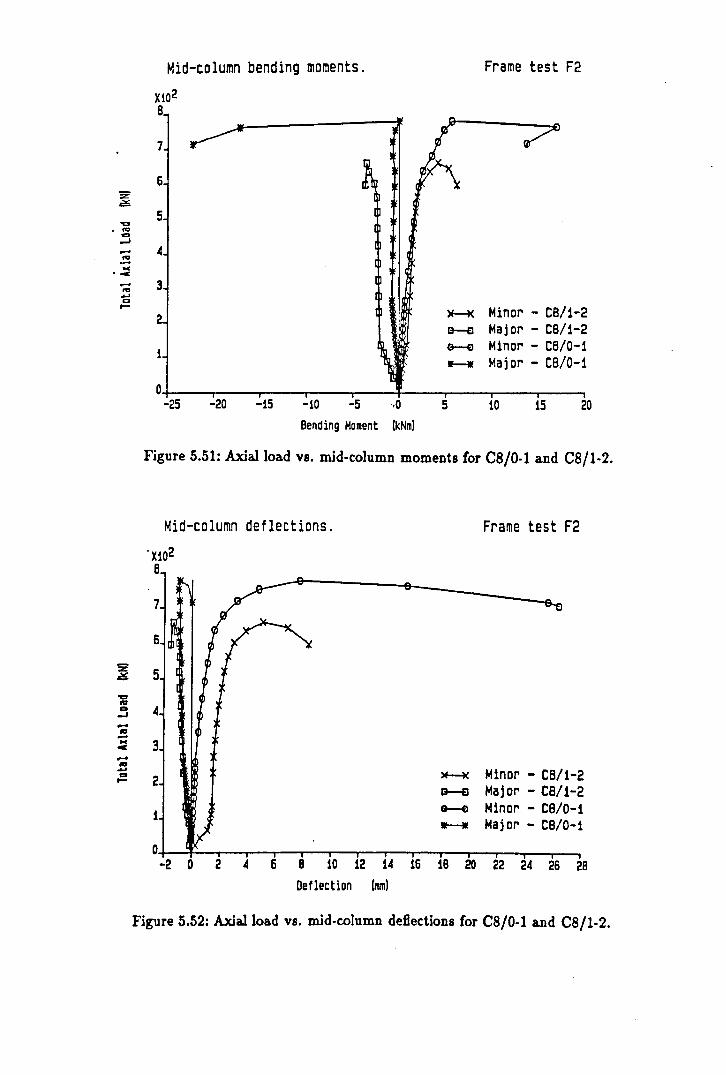
"a .... co ...I
Mid-column bending moments.
X102 B
7
6
5
Frame test F2
- ~ .= .., • oC
0;; 3 .... g t-
1
~ Minor - C8/1-2 e--e Major - C8/1-2 ~ Minor - C8/0-1 ____ Major - CB/O-1
O+-----.------r-----r---~------1_---_.------._---_r---~ -25 -20 -15 -10 -5 ·,0 5 10 15 20
Bending Moment (kNm)
Figure 5.51: Axial load vs. mid-column moments for C8/0-1 and C8/1-2.
Mid-column deflections.
'X102 B
1
Frame test F2
~ Minor - C8/1-2 a-EJ Major - C8/1-2 G--Q Minor - ce/o-! ---- Major - C8/0-1
O'+-~~T--r---~_r---r--r~~'--'---~_.---.--r~ -2 0 2 .01 6 8 10 12 1.01 16 18 20 22 2.01 26 28
Deflection (mm)
Figure 5.52: Axial load vs. mid-column deflections for C8/0-1 and C8/1-2.
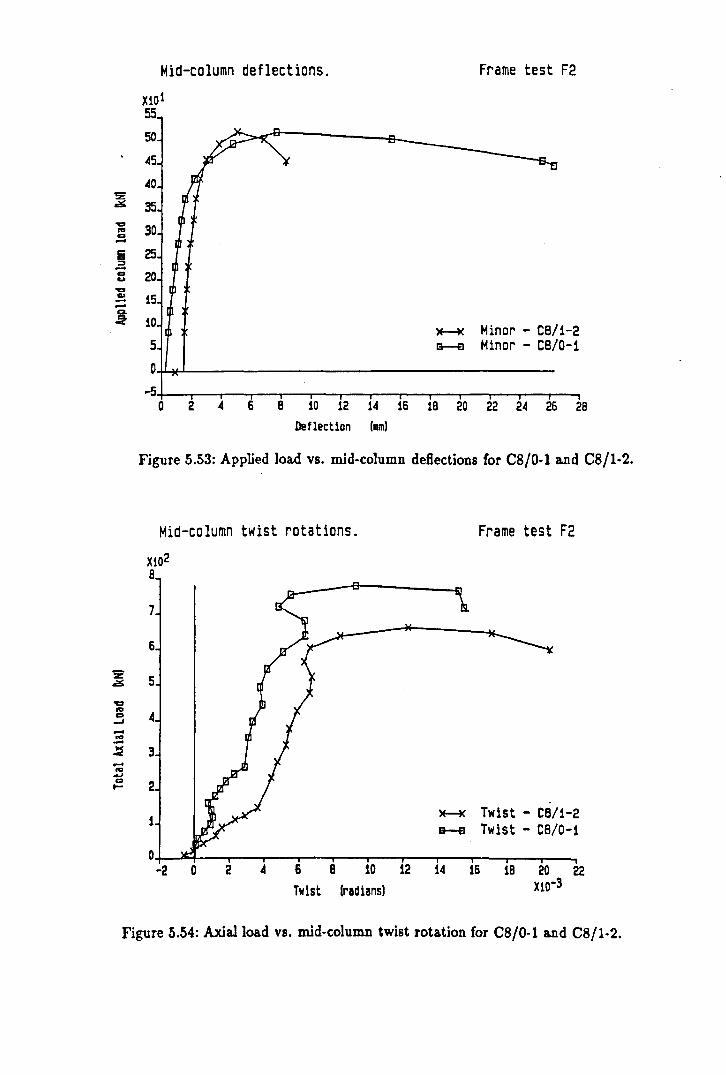
z CiS.
'D
"' 0. --i -0 ... 'D
~ -~ Jl
-... -
Mid-column deflections. Frame test F2
X101 55
50
.45
.40
35
30
25
20
15
10
5
0 ... 5
0 2 .4
)f---K Minor - C8/1-2 a-e Minor - C8/0-1
6 8 10 12 1.4 16 18 20 22 2.4 26 28 Deflection (mm)
Figure 5.53: Applied load vs. mid-column deflections for C8/0-1 and C8/1-2.
Mid-column twist rotations.
X102 8
7
6
Frame test F2
~ 3
-"' ..... :=. 2
1
2
~ Twist - C8/1-2 e--e Twist - C8/0-1
~ 6 8 10 12 14 16 18 20 22 Twist (radians) XiO-3
Figure 5.54: Axial load vs. mid-column twist rotation for C8/0-1 and C8/1-2.
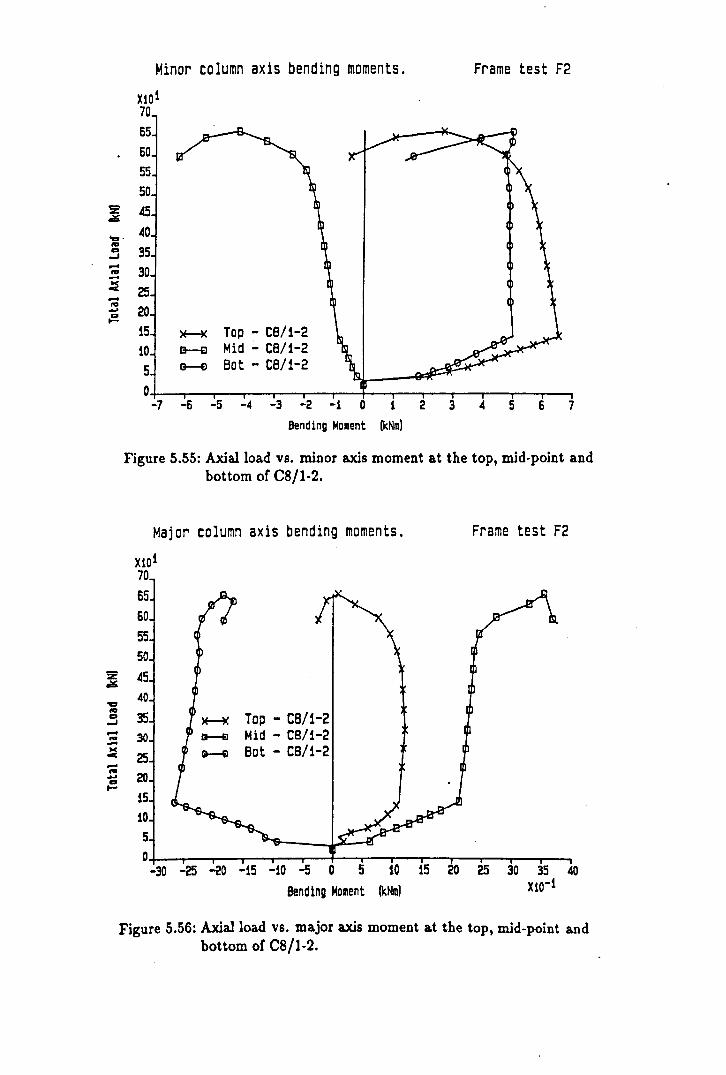
Minor column axis bending moments. Frame test F2
X10 1 70
65 60 55
50 z .45 -..... .40 ... co -' -... -~ -... .... co t-
35 30 25
20 15 ~ Top - C8/1-2 10 G-EI Mid ;.. C8/1-2
5 G-€) Bot - C8/1-2
0 -7 -6 -5 -4 -3 -2 -1 0 1 2 3 4 5 6 7
Bending Moment (kNm)
Figure 5.55: Axial load vs. minor axis moment at the top, mid-point and bottom of C8/1-2.
Major column axis bending moments.
Xiol 70
65 60 55 50
Frame test F2
z .45 --fa co ..J ---w c -ow .... co .....
40
35 30
25
10 5
Top - CB/1-2 Mid - C8/1-2 Bot - C8/1-2
O+-~----.---r-~---'-~~-.---~~---'-~r--r---~~ -30 -25 -20 -15 -10 -5 0 5 10 15 20 25 30 35 .0
Bending MDment (kNm) X10-1
Figure 5.56: Axial load vs. major axis moment a.t the top, mid-point and bottom of C8/1-2.
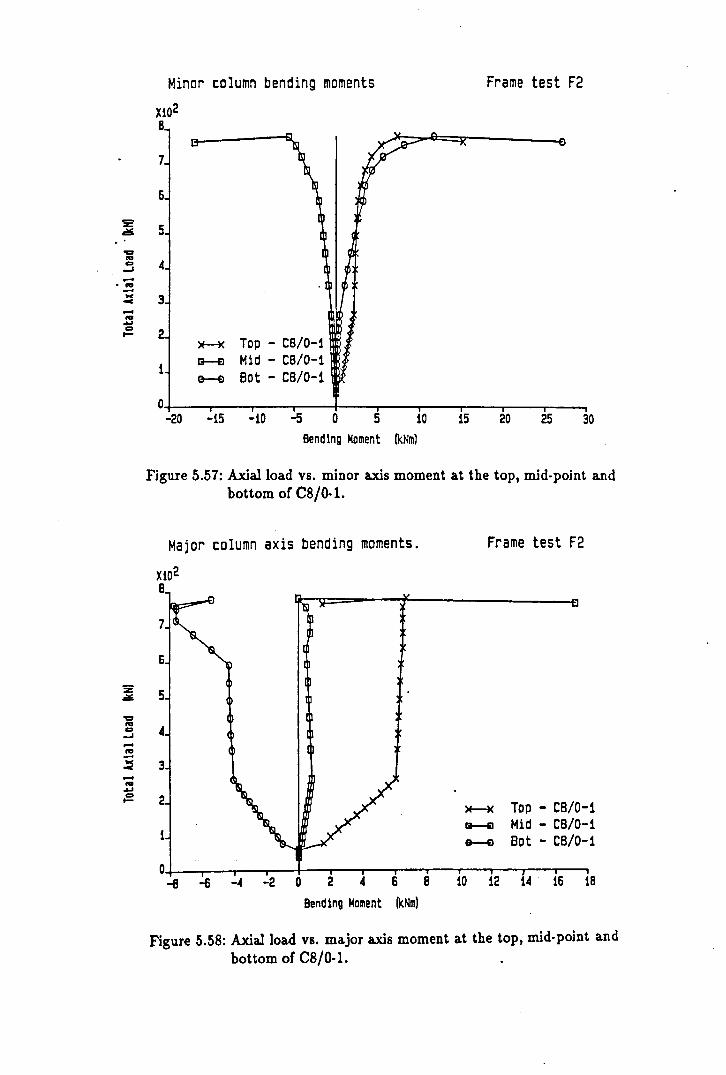
.... . ... -
Minor column bending moments
X102 B
7
6
Frame test F2
~ 3 .... ... ~
"" t-
Z i5
"CI ... "" -I .... ~ I< -.... ... ~
"" t-
1
~ Top - CB/O-i a--e Mid - CS/O-i e--e Bot - C8/0-1
Ol+---.----r---r---+--~--~r_--~--~--~~ -20 -is -10 -S 0 5 10 15 20 25 30
Bending filament O<Nm)
Figure 5.57: Axial load vs. minor axis moment at the top, mid-point and bottom of C8/0-1.
Major column axis bending moments.
Xl02 s
6
5
4
3
2
1
0 -B -6 --4 -2 0 2 4 6
Bending Moment (kNm)
B
Frame test F2
)E-K Top - CB/O-1 li-£J Mid - CB/O-1 li-£J Bo t - C8/0-1
10 12 14 16 18
Figure 5.58: Axial load vs. major axis moment at the top, mid-point and bottom of C8/0-1.
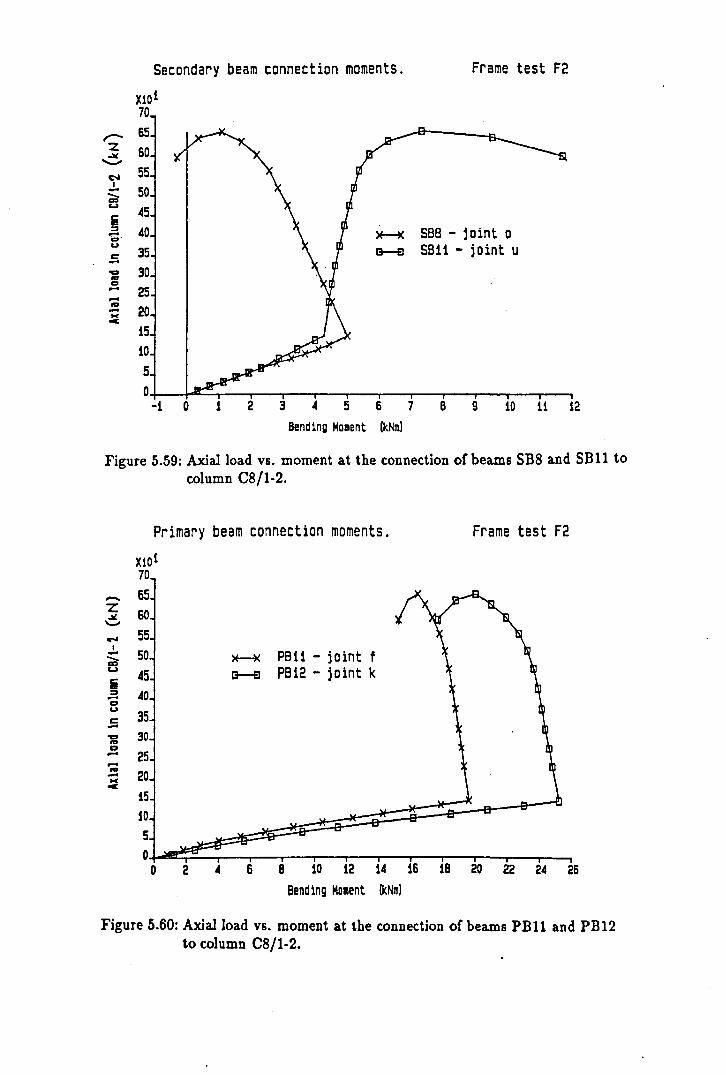
,-. '2 ~ ........... C'l
I --GO u
i :::I ~ . ... c --... ." .... -I'D -w
oC
Secondary beam connection moments. Frame test F2
X10 1 70 65
60 55 50 ~5
~o
35 30 25 20 15 10 5 0
-1 0
SBa - joint 0 SB11 - jOint u
123 ~ 567 B 9 10 11 12
Bending Moment (kNm)
Figure 5.59: Axial load vs. moment at the connection of beams SB8 and SBll to column C8/1-2.
Primary beam connection moments. Frame test F2
X101 70
- 65 'Z 60 .x '-' c-I 55
I - 50 ~ PB11 - joint f -a::I IU 45 a-e PB12 - joint k i :::I ~o -co ...
35 c -- 30 I'D co - 25 -ow
20 -~ 15 10 5
2 4 6 B W ~ ~ ~ ~ ~ ~ ~ ~
Bending Moment IkNm)
Figure 5.60: Axial load vs. moment at the connection of beams PBll and PB12 to column C8/1-2.
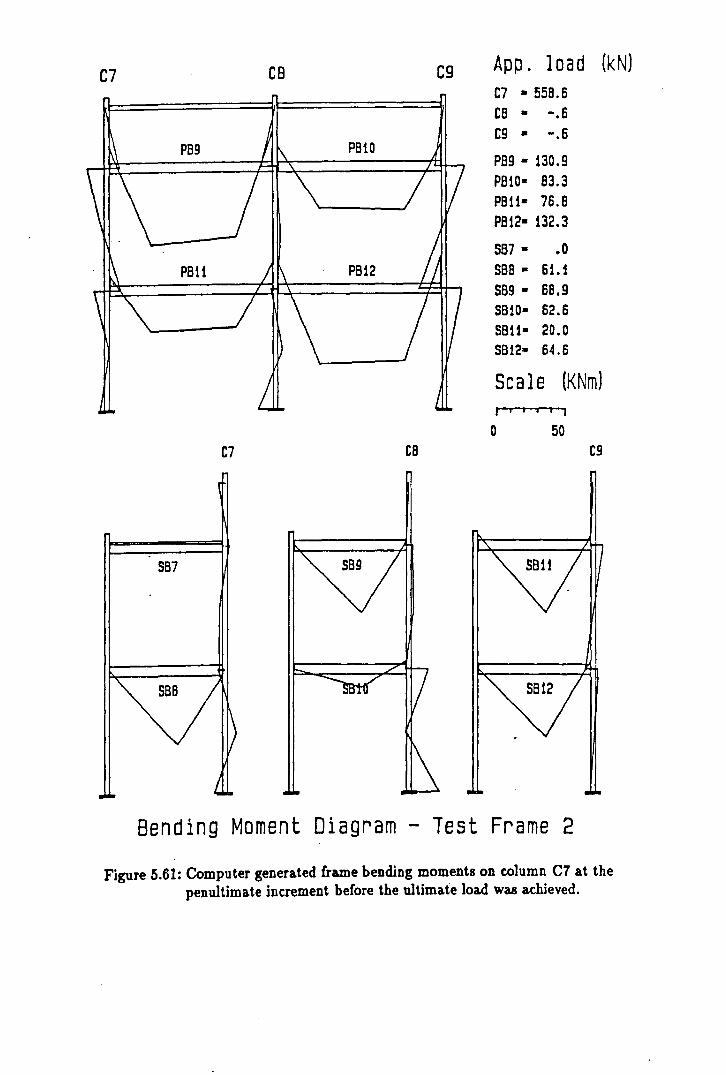
C7 C8
PB9 PB1D
P811 P812
C7 CB
SB7
C9 App. load (kN) C7 • 55B.S CB • -.S C9 • -.6
P89 • 130.9 PBiO- 83.3 P8U- 7S.B PB12- 132.3
S87 • .0 SBB· 61.1 S89· 6B.9 SB10- 62.6 S811- 20.0 SB12- 64.6
Scale (KNm) J iii' I
o 50 C9
Bending Moment Diagram - Test Frame 2
Figure 5.61: Computer generated frame bending moments on column C7 at the penultimate increment before the ultima.te load was achieved.
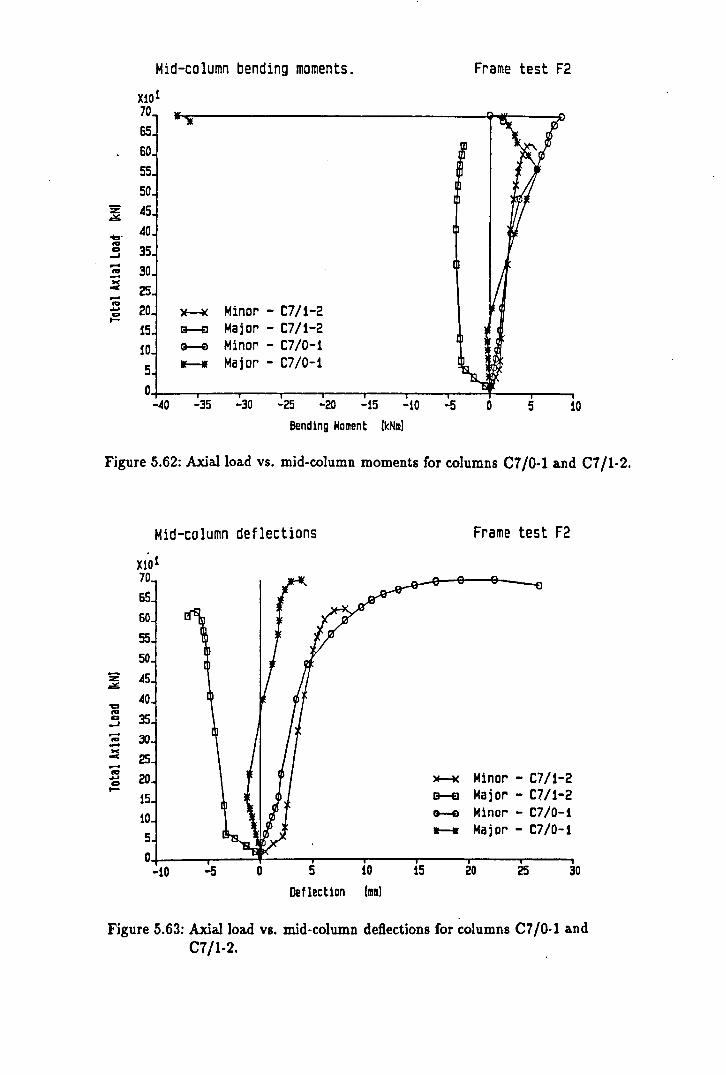
z ~
;,,-.., COl ..J -.., -0< oC -... .... co t-
Mid-column bending moments.
X10 1 70 65
60 55 50 45 40 35 30 25
20 15 10 5 0
-40
~ Minor - C7/i-2 B--e Major - C7/1-2 G--Q Minor - C7/0-1 ____ Major - C7/0-1
-35 -30 -25 -20 -15 -10 -5
Bending Moment (kNm)
Frame test F2
o 5 10
Figure 5.62: Axial load vs. mid-column moments for columns C7/0-1 and C7/1-2.
Z Ci6.
't::I ... co -oJ -... -0< oC -.., .... co t-
Mid-column deflections Frame test F2
Xiol 70
65 60
55 50
AS
40 35
30
25 20 15 10 5
0 -10 -5 0 5 10 15
Deflection (mm)
~ Minor - C7/1-2 a--a Major - C7/1-2 e--e Minor - C7/0-1 ____ Major - C7/0-1
20 25 30
Figure 5.63: Axial load vs. mid-column deflections for columns C7/0-1 and C7/1-2.

z ~
..... ... ...
....I
~ "' c -... ~ ... t-
Mid-column twist rotations.
Xi01 70 65 60 55 SO 45 40 35 30 2S 20 15 10 )f--)( Twist - C7/1-2
5 G-fl Twist - C7/0-1
0 -e -7 -6 -5 -4 -3 -2.
Twist (radians)
-1 0
Frame test F2
1 2 3 XiO-2
Figure 5.64: Axial load vs. mid-column twist rotation for columns C7/0-1 and C7/1-2.

Z ~
..,,-... c:> -l -!!! ... c -... .-J c:> t-
Minor column axis bending moments.
Xl0 1 65
60
55
50
45
40
35
30
25,
20
i5
10
5 0
-6 -5 -4 -3 -2 -i 0 1
Bending Moment (I<Nm)
2
Frame test F2
>f---+( Top - C7/1-2 G-£I Mid - C7/1-2 G-f) Bot - C7/1-2
3 4 567
Figure 5.65: Axial load vs. minor axis moment at the top, mid-point and bottom of column C7/1-2.
Major column axis bending moments. Frame test F2
Xl01 65
60
55
50 A5
40
35
30
25 20
15
10
5
0 -15 -10 -5 o
~ Top - C7/1-2 B--Q Mid - C7/1-2 a--e Bot - C7/1-2
5 10 15 Bending Moment (kNm)
20
Figure 5.66: Axial load vs. major axis moment at the top, mid-point and bottom of C7/1-2.

" .. ': • .... ----.: ....
frl~e tnt f2
J!:' 7= 0 e -i t5
to: C,I\
)t--t( TC;) - C1I0-1 .-
s: ..... ~ld - C7/0-1 is ~ B:t - C7/0-1 4:
l5
" 23 2':
l' l' 5' 01 ,
, ~/", ...------.-_...._. -...,..-_. -'I . . • • ·1~ ·t ~ ~ ~ 0 2 • , •
n,uu' ~.67: Axl&J load '" •. minor .. xl. moment a' 'he lOp. mId, p<aiOI lAd bottom or col" m D C7/0· I.
.. ... I .... -.. --= -.. .. ... .-
J ,. t . ., 1:
1 ,~
" t, •. _. ~
I!I
fC )IS
~
25
lC s~
to 5 0 .. .~
. , . -15 ·10 -5 0
--. 1,~ - C'/O-I 0--0 ~lO - '7/C-S ..... kt .. ClIO-S
• , • _______ , I ... • T. •
so " ~ ~ ): J'l ,:
f"urt 5.68: Ad ... load '" •. major uit mom .. ' al u,. lop. mid pc~nt and bottom of coI.IDa ClIO-I.

Chapter 6
Connection Moment-rotation
Behaviour.
6.1 Introduction
The moment rotation characteristic of a connection is one of the most fundamental
parameters used in the study of semi-rigid frame behaviour. The diversity of the M - 4>
response for different connection types, and the equally diverse effect on the behaviour
of the connected elements, means that a measure. of the connection stiffness will be an
important feature in any design or analysis technique developed for semi-rigid frames.
As a consequence, there has been much research activity in recent years devoted to
quantifying the M - 4> behaviour by experimentation, an~ by analytical means. As was
discussed in chapter 1, analytically predicted moment-rotation behaviour tends to be
unreliable and the various analysis programs which have been developed have a limited
range of application. For this reason, the experimental assessment of connections remains
the most reliable means of determining connection response.
This chapter presents a brief overview of a series of isolated connection tests which were
6.1
performed at the University of Sheffield. The tests, performed by others, considered
nominally identical connection details to those adopted in the subassemblage test series
and frame test Fl. Throughout this chapter, the behaviour of these 'isolated' connec
tions has been compared to the response of the corresponding subassemblage and frame
connections. The chapter concludes by investigating an apparent anomaly which was
observed in some of the frame test connections and highlights the possible ramifications
for design and future experimental connection studies.
6.2 The 'isolated' connection tests.
At the time of this research project, a study was being conducted at the University of
Sheffield into the in-plane and out-of-plane response characteristics of 'simple' isolated
bolted steelwork connections under slow cyclic loading [6.1]. It was proposed that a series
of additional connection specimens should be appended to this test programme which
were nominally similar to those subsequently used by the author in the subassemblage
tests and frame test F1. The aim was to provide a direct correlation between isolated
connection response and connection behaviour in extensive three- dimensional structures.
The details of the four different connection types studiedj namely web cleats, flange
deats, web and seat cleats and flush end plates, are presented in figure 6.1. Figure 6.2
shows the basic experimental set-up used for the connection tests and illustrates the
principal components. It is evident that the test was a 'cantilever' arrangement in which
one beam only was connected to the column. This compares with the commonly used
alternative 'cruciform' arrangement in which two beams are connected one on each side
of the column. The merits of these two types of connection test are discussed in section
6.5.
6.2

The specimens comprised a 650mm length of beam, 254x102x22 UB, connected to a
650mm long 152x152x23UC column. The column section was clamped .along Its length
to a stiff mounting plate bolted to the test rig. Two one-way acting hydraulic rams
applied a moment, and hence rotation, to the connection in an alternating clockwise
and anti-clockwise direction, with progressively increasing magnitude, to develop the
full cyclic M - tP envelop~.
To achieve maximum similarity between the isolated connection tests and the subsequent
sub assemblage tests, the beam, column and cleat angle sections were cut from the same
stock lengths of steel used to fabricate the subassemblage specimens. The assumption
was that there would be only a marginal variation in the steel properties used in the two
types of test. A summary of the location of the connection test offcuts, together with
measured material properties, is presented in the supplementary volume to this thesis
[6.2].
Each of the four different connection types was tested to determine the in-plane and the
out-of-plane response when connected to either the column web or the column flange.
This resulted in a total of 16 tests, a summary of which is presented in table 6.1. Those
tests with a suffix 'a' (see table), denote secondary tests which were performed to inves
tigate the out-of-plane connection response when the beam was connected to the column
flange and 'redundant' cleats were connected to the column web. These 'redundant'
cleats simulated the stiffening effect of the column web panel due to the presence of an
adjacent interconnecting beam.
For a comprehensive description of these tests and a discussion of the results, the reader
should refer to reference 6.1. However, a number of the measured in-plane connection
responses are presented in the following sections and compared with the observed con
nection behaviour in the subassemblage tests and frame test F1.
6.3
6.3 The subassemblage tests.
Although four different connection types were studied in the subassemblage tests (chapter
2), only the web cleat, flange cleat and the web and seat cleat connections will be
discussed in this section. The behaviour of the flush-end plate connection is discussed
at length in section 6.4 which concentrates on the experimental frame test data.
A selection of the moment-rotation responses observed in the sub assemblage tests is
presented in figures 6.4 to 6.8. A consistent plot scale has been adopted throughout
to enable a direct comparison between the relative performances of the different con
nection types. The moment-rotation data derived from 'isolated' connection tests have
been shown on the plots. This includes the 'cantilever' connection data from the tests
described in section 6.2, together with that from 'cruciform' connection tests performed
by Davison [6.3]. As the name suggests, the 'cruciform' test comprises two beams con
nected to either side of a single length of column. A symmetrical beam loading is applied
and the moment-rotation response of the two connections is measured simultaneously.
Figure 6.3, extracted from reference 6.3, shows the experimental set-up used for the 'cru
ciform' connection tests. The particular 'cruciform' specimens investigated by Davison
were fabricated using similar member sizes and connection details to those studied in
the 'cantilever' tests and the subsequent subassemblage tests. It should be noted that to
improve the clarity, all of the 'isolated' connection test data has been shown as smooth
fitted curves.
The M - 4> response of the web cleat connection to the column flange, shown in figure
6.4, illustrates the relatively small stiffness and moment capacity of this particular con
nection. It is evident that the behaviour of the subassemblage connection is similar to
that from the 'isolated' tests at small rotations. Figure 6.5 shows the M - 4> curves for
a flange cleat connection to the column web. Again, the behaviour of the subassemblage
connections corresponds quite closely with that observed in the 'isolated' connection
tests. However, the negative slope of the moment-rotation curve observed for two of the
6.4
three sub assemblage joints in the early stages of loading does suggest a small degree of
experimental error.
The M - <p response for flange cleat and web and seat cleat connections to the column
flange are shown in figures 6.6 and 6.7 respectively. It is evident that in the case of figure
6.6, the subassemblage connection behaviour closely resembles that ofthe 'isolated' tests
if the initial experimental data offset is ignored.
Figure 6.8 shows the M -<P response for web and seat cleat connections to the column web.
It is noticeable that in this instance there is a significant difference in the behaviour of the
two 'isolated' test connections. This is due to the effects of column web flexibility which
are included in a 'cantilever' connection test but which are nullified in a 'cruciform' test
due to the symmetrical arrangement of beam loads (see section 6.5). This explains the
reduced stiffness and moment capacity observed for the 'cantilever' test connection. Due
to the relatively small lever arm between the cleats in a web and seat cleat connection,
the tension and compressive forces acting on the cleats will, for a given moment, be
significantly larger than those in a flange cleat connection where the lever arm between
cleats is significantly larger. Consequently, the behaviour of the web and seat cleat
connection is very much more susceptible to the effects of column web flexibility. This is
verified in figure 6.5 in which the behaviour of a flange cleat connected to the column web
in the 'cantilever' test is almost identical to that from the 'cruciform' test. It is evident
from figure 6.8 that the behaviour of the three subassemblage connections are similar
and tha.t they are intermedia.te between the behaviour of the 'cantilever' and 'cruciform'
test specimens.
For clarity, only those subassemblage connections which exhibited a continual 'closing'
throughout both the beam loading and column loading phases of the test, a 'loading
loading' response, have been presented in figures 6.4 to 6.8. However, there were a number
of instances in which connections applied a disturbing moment to the column during the
beam loading phase which was subsequently reduced, or in some cases reversed, when the
6.5

column head load was applied. This is often referred to as 'loading-unloading' connec
tion behaviour. Figure 6.9 shows the moment-rotation response for three sub assemblage
connections, a web cleat, flange cleat and a web and seat cleat, where this phenomenon
was observed.
6.4 Frame test Fl.
A 12mm thick flush end plate connection, similar to that shown in figure 6.1, was used
for all the connections in the first full scale frame test, F1. There were three different
arrangements of beam to column connection to be considered, namely:-
1. A secondary beam connected to column flange on one side only. joints '0',
'q' and's'.
2. A primary beam connected to one side only of the column web (i.e. primary
beam/'corner' column) • joints 'j', 'e' and 'c'.
3. A primary beam connected to both sides of the column web (i.e. primary
beam/internal column) • joints cd', 'f', 'i' and 'k'.
The multiple moment-rotation plots for these three structural arrangements are shown in
figures 6.10 (case 1), 6.11 (case 2), 6.12 (case 3· joints 'f' and 'i') and 6.13 (case 3 - joints
Cd' and 'k'). The moment-rotation characteristics of the same flush-end plate connection
observed in isolated joint tests by Davison (cruciform tests) [6.3] are shown on the plots
for comparison together with those observed in the 'cantilever' tests described in section
6.2.
6.6

It is quite apparent from figure 6.10 that the M - ¢ response of the secondary beam
connections '0' and 'q' is very similar to that observed in both the isolated connection
tests, whereas that for connection's' is markedly different. It should be noted however,
that this connection was at the 'active' frame end of beam SB4 which experienced a
loading malfunction during the course of the frame test (see chapter 5). The inadvertent
premature failure of this particular beam corresponds with the large distance between
the penultimate data points on the plot for joint's' shown in the figure.
Figure 6.11 shows the M - ¢ response of the primary beam connections with the web
of the 'corner' columns. The unusual 'shift' in the data points at the end of the beam
loading phase for joint 'e' was a result of the accidental failure of the adjacent beam, SB4,
described above. The large discrepancy between the behaviour of the 'cruciform' and
'cantilever' tests data is a result of the effects of web flexibility described in the previous
section. Not surprisingly, the observed M - ¢ behaviour of the frame connections was
very much closer to that observed in the isolated 'cantilever' joint test when compared
to that from the 'cruciform' test. This is of course due to the similarity of structural
configuration between the 'cantilever' specimens and these particular frame connections.
It is interesting to note that whilst there appears to be a discrepancy between the mea
sured initial stiffness and moment capacity of the three frame connections, the unloading
stiffness of the connections are approximately equal.
Figure 6.12 shows the m0II,lent-rotation plots for the primary beam connections to the
internal column at joints 'f' and 'i', which exhibited a 'loading- unloading' response,
whilst those for joints 'd' and 'k', which exhibited a 'loading-loading' response, are shown
in figure 6.13. It is evident that the behaviour of all four connections is similar during the
beam loading phase and, unlike the connection to the 'corner' columns discussed above,
has a similar stiffness and ultimate capacity to that observed in the isolated 'cruciform'
test. The high stiffnesses which have been observed explain the large primary beam
moments which were attracted to the centre column support.
6.7
The most interesting feature of the plots shown in figure 6.12 is the unexpected response
of the connections during the column head loading phase in which both connections 'f'
and 'i' exhibited a significantly reduced unloading stiffness. This implied that modest
rotations at the head of the column had a negligible effect on the beam connection mo
ments. However, when the applied loads were instantaneously removed at the point of
maximum load on the centre column, CS, the connections exhlbited an unloading stiff
ness comparable with the initial tangent stiffness, Ci. The magnitude of the unloading
stiffness therefore depended on whether the rotations induced at the connection were
induced as a result of column deformation or due to a reduction in the applied connec
tion moment. It is the author's opinion that this particular phenomenon was one of the
most important observations from the entire research study. The following section has
therefore been devoted to proposing an explanation for this behaviour as well as high
lighting the possible ramifications for semi-rigid frame design and future experimental
connection tests.
6.5 The behaviour of semi-rigid connections in frames.
The generally accepted moment rotation response of a semi-rigid connection is shown
in figure 6.14 [6.4]. The plot comprises a non-linear loading phase followed by a linear
unloading phase of equivalent slope to the initial tangent stiffness Ci. The usefulness
of this correlation between the loading and unloading phases of connection response has
been realised by many researchers and has formed the basis of a number of semi-rigid
design techniques [6.5].
The previous section presented some observations of connection moment-rotation re
sponse from frame test F1 and showed that in some instances the unloading stiffness of
the connection can be significantly less than Ci thus representing a deviation from the ac-
6.8
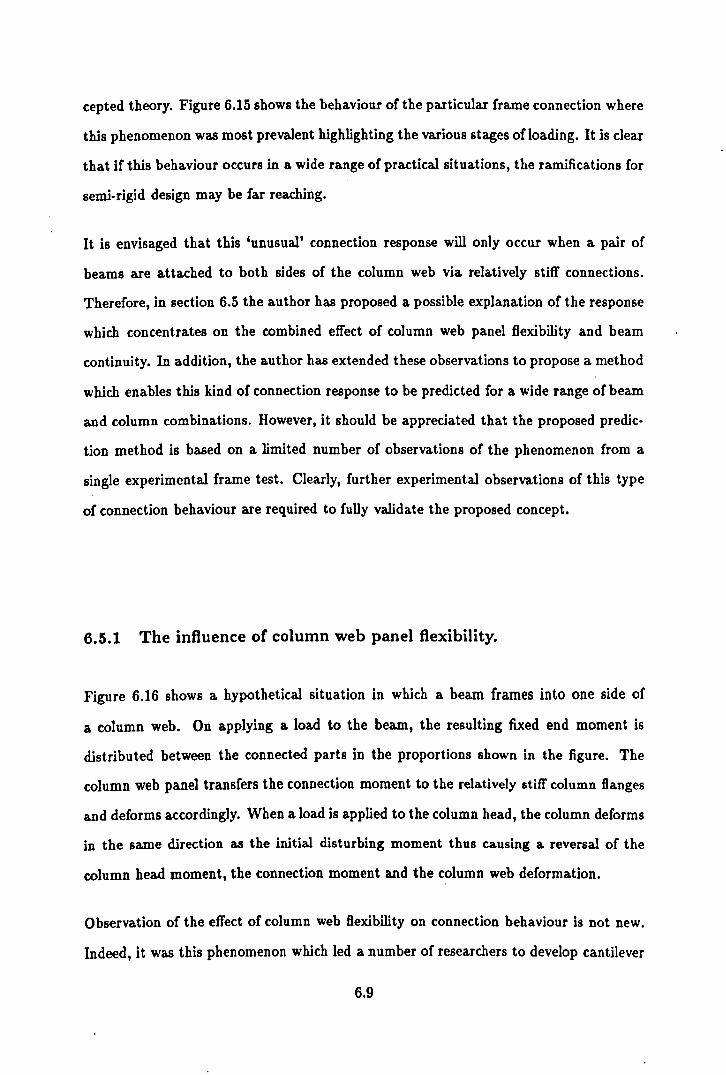
cepted theory. Figure 6.15 shows the behaviour of the particular frame connection where
this phenomenon was most prevalent highlighting the various stages of loading. It is clear
that if this behaviour occurs in a wide range of practical situations, the ramifications for
semi-rigid design may be far reaching.
It is envisaged that this 'unusual' connection response will only occur when a pair of
beams are attached to both sides of the column web via relatively stiff connections.
Therefore, in section 6.5 the author has proposed a possible explanation of the response
which concentrates on the combined effect of column web panel flexibility and beam
continuity. In addition, the author has extended these observations to propose a method
which enables this kind of connection response to be predicted for a wide range of beam
and column combinations. However, it should be appreciated that the proposed predic
tion method is based on a limited number of observations of the phenomenon from a
single experimental frame test. Clearly, further experimental observations of this type
of connection behaviour are required to fully validate the proposed concept.
6.5.1 The influence of column web panel flexibility.
Figure 6.16 shows a hypothetical situation in which a beam frames into one side of
a column web. On applying a load to the beam, the resulting fixed end moment is
distributed between the connected parts in the proportions shown in the figure. The
column web panel transfers the connection moment to the rela.tively stiff column flanges
and deforms accordingly. When a load is applied to the column head, the column deforms
in the same direction as the initial disturbing moment thus causing a reversal of the
column head moment, the connection moment and the column web deformation.
Observation of the effect of column web flexibility on connection behaviour is not new.
Indeed, it was this phenomenon which led a number of researchers to develop cantilever
6.9
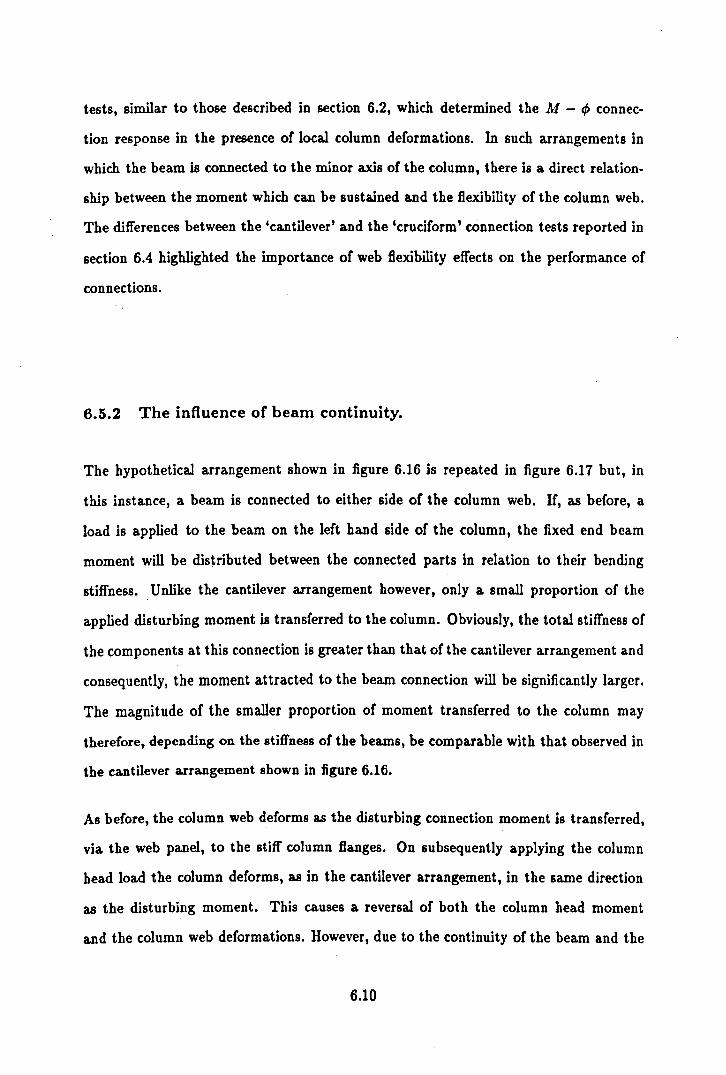
tests, similar to those described in section 6.2, which determined the M - q, connec
tion response in the presence of local column deformations. In such arrangements in
which the beam is connected to the minor axis of the column, there is a direct relation
ship between the moment which can be sustained and the flexibility of the column web.
The differences between the 'cantilever' and the 'cruciform' connection tests reported in
section 6.4 highlighted the importance of web flexibility effects on the performance of
connections.
6.5.2 The influence of beam continuity.
The hypothetical arrangement shown in figure 6.16 is repeated in figure 6.17 but, in
this instance, a beam is connected to either side of the column web. If, as before, a
load is applied to the beam on the left hand side of the column, the fixed end beam
moment will be distributed between the connected parts in relation to their bending
stiffness. Unlike the cantilever arrangement however, only a small proportion of the
applied disturbing moment is transferred to the column. Obviously, the total stiffness of
the components at this connection is greater than that of the cantilever arrangement and
consequently, the moment attracted to the beam connection will be significantly larger.
The magnitude of the smaller proportion of moment transferred to the column may
therefore, depending on the stiffness of the beams, be comparable with that observed in
the cantilever arrangement shown in figure 6.16.
As before, the column web deforms as the disturbing connection moment is transferred,
via the web panel, to the stiff column flanges. On subsequently applying the column
head load the column deforms, as in the cantilever arrangement, in the same direction
as the disturbing moment. This causes a reversal of both the column head moment
and the column web deformations. However, due to the continuity ofthe beam and the
6.10

relatively low stiffness of the column, rotation at the column head will have only a very
small effect on the moment at the beam to column connections. The connection moment
will therefore remain approximately constant despite the possibility of a complete reversal
of moment at the column head.
This effect of beam continuity on the moment-rotation response of a connection is illus
trated by considering an extreme example. Figure 6.18 shows a pair of small, compact
beams connected to either side of a large, thin column web panel via stiff semi-rigid
connections. If the web panel is assumed to be sufficiently flexible and its ability to
resist rotation ignored, then the column may be treated as a simple pinned prop to a
continuous beam. This structural arrangement is shown in figure 6.19. If the beams are
loaded symmetrically, a pattern of beam bending moments will result and a conventional
non-linear 'loading' moment-rotation response will be observed at the connections. If at
the end of the beam loading phase load is applied directly to the column head, the col
umn will deform laterally inducing a rotation at the head of the column. Due to the
negligible bending stiffness of the column web panel, the column head rotation will not
have any effect on the distribution of beam bending moments. The unloading stiffness
of the arrangement at the column head will therefore be zero producing a horizontal line
on the moment-rotation plot. The resulting 'loading-loading' and 'loading-unloading'
moment-rotation plots for the connections on either side of the column are shown in the
figure.
It is evident that these moment-rotation plots are hybrids of the expected moment
rotation response measured from a 'cruciform' test and that from a 'cantilever' test,
as shown in figure 6.20. The 'cruciform' test is representative of the beam loading
phase, whilst the unloading 'cantilever' test response is representative of the connection
behaviour when 'unloading' due to column deformation. This is verified in figure 6.21
which compares the response of frame test joint 'f', a minor axis connection to the
internal column (similar arrangement to a cruciform test), with that of joint 'j', a minor
axis connection to a 'corner' column (similar arrangement to a cantilever test). As
6.11

discussed previously, these two structural arrangements exhibit a significantly different
stiffness during the loading phase. However, it is evident that the unloading stiffness
at joint 'f', resulting from column deformation, is approximately equal to that of the
cantilever arrangement at joint 'j' when the beam loads are removed.
It is clear therefore that situations can arise in which the unloading stiffness of a beam
to column web connection in a frame is not equal to the initial tangent loading stiffness.
6.5.3 The validity of isolated connection tests.
As discussed in the previous section, the total loading-unloading response of some of
the frame test connections appears to be a combination of the response expected from
a cruciform joint test and that from a cantilever test. This would suggest therefore that
the data from these two types of test could be used to 'construct' the total response of
a connection in a frame with the 'loading' cruciform data representing the non-linear
'loading' stiffness and the 'unloading' cantilever response representing the 'unloading'
stiffness. It is clear however that the arrangement of the isolated connection tests must
accurately simulate the boundary conditions which are present in the frame. In the case
of the cantilever test, the column length must be supported at its ends and be of sufficient
length to enable local web and flange deformations to fully develop at the location of
the beam connection. It should be noted that this was not the case in the cantilever
tests reported in section 6.2 in which the column flanges were rigidly clamped to a stiff
backing plate along the full length of the section.
It would appear from the arguments presented above that the unloading stiffness derived
from the numerous cruciform tests on beam connections to the column web is ofllttle use.
The exception would of course be cruciform tests on very flexible connections connected
6.12
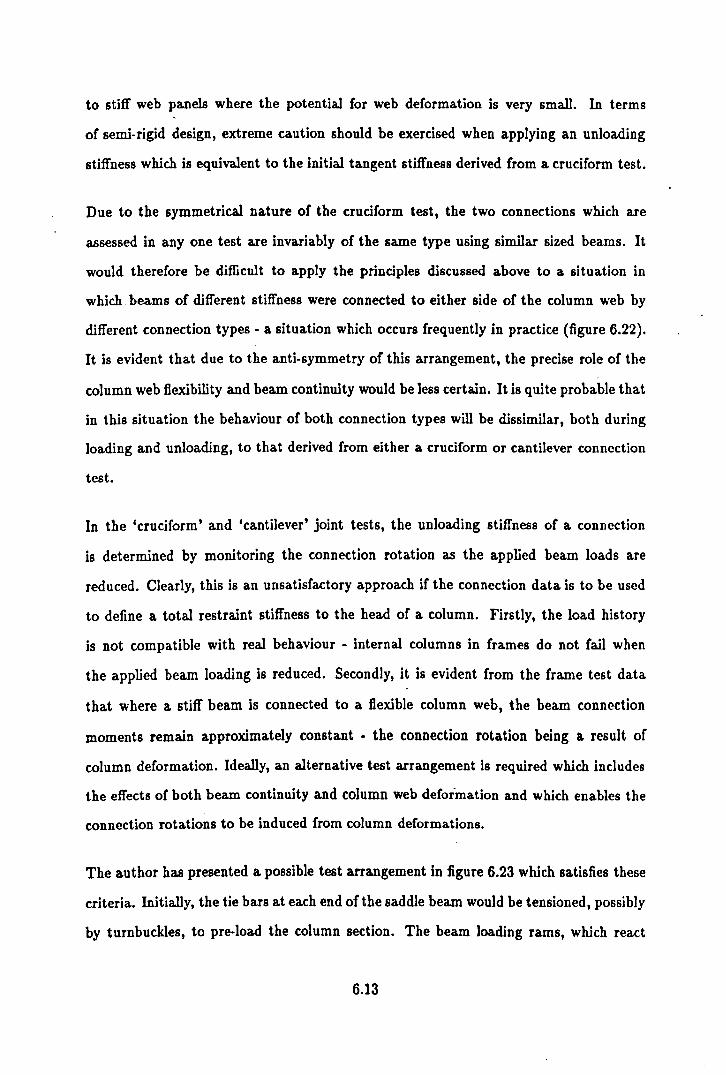
to stiff web panels where the potential for web deformation is very small. In terms
of semi-rigid design, extreme caution should be exercised when applying an unloading
stiffness which is equivalent to the initial tangent stiffness derived from a cruciform test.
Due to the symmetrical nature of the cruciform test, the two connections which are
assessed in anyone test are invariably of the same type using similar sized beams. It
would therefore be difficult to apply the principles discussed above to a situation in
which beams of different stiffness were connected to either side of the column web by
different connection types - a situation which occurs frequently in practice (figure 6.22).
It is evident that due to the anti-symmetry of this arrangement, the precise role of the
column web flexibility and beam continuity would be less certain. It is quite probable that
in this situation the behaviour of both connection types will be dissimilar, both during
loading and unloading, to that derived from either a cruciform or cantilever connection
test.
In the 'cruciform' and 'cantilever' joint tests, the unloading stiffness of a connection
is determined by monitoring the connection rotation as the applied beam loads are
reduced. Clearly, this is an unsatisfactory approach if the connection data is to be used
to define a total restraint stiffness to the head of a column. Firstly, the load history
is not compatible with real behaviour - internal columns in frames do not fail when
the applied beam loading is reduced. Secondly, it is evident from the frame test data
that where a stiff beam is connected to a flexible column web, the beam connection
moments remain approximately constant - the connection rotation being a. result of
column deformation. Ideally, an alternative test arrangement is required which includes
the effects of both beam continuity and column web deformation and which enables the
connection rotations to be induced from column deformations.
The author has presented a. possible test arrangement in figure 6.23 which satisfies these
criteria. Initially, the tie bars at each end of the saddle beam would be tensioned, possibly
by turnbuckles, to pre-load the column section. The beam loading rams, which react
6.13
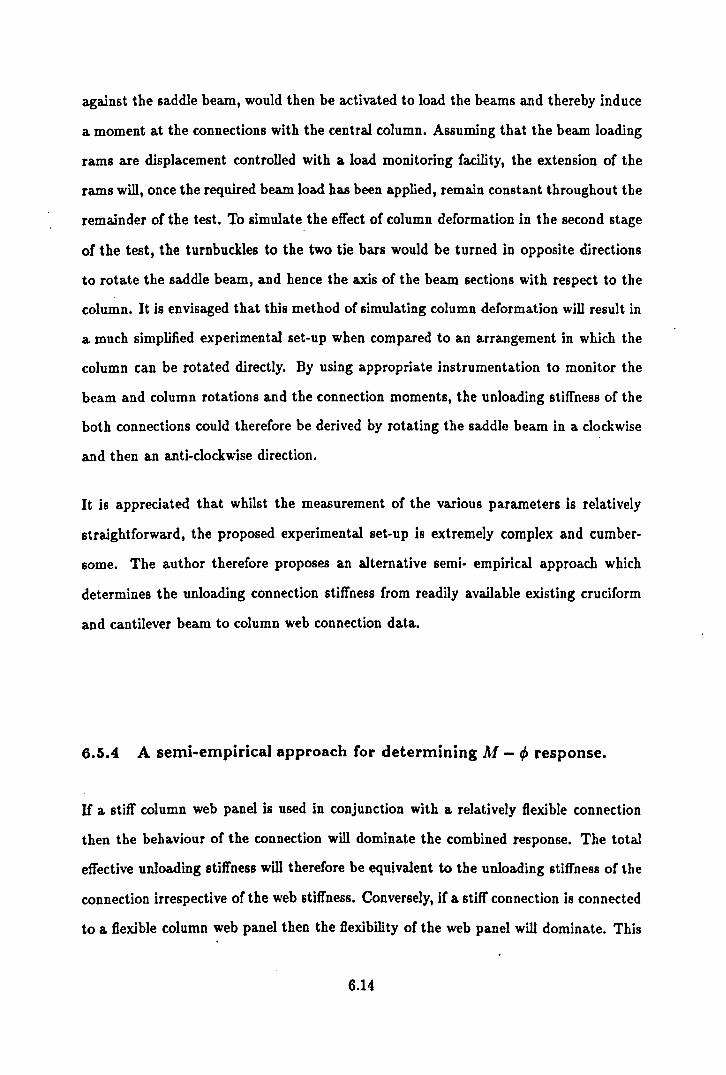
against the saddle beam, would then be activated to load the beams and thereby induce
a moment at the connections with the central column. Assuming that the beam loading
rams are displacement controlled with a load monitoring facility, the extension of the
rams will, once the required beam load has been applied, remain constant throughout the
remainder of the test. To simulate the effect of column deformation in the second stage
of the test, the turnbuckles to the two tie bars would be turned in opposite directions
to rotate the saddle beam, and hence the axis of the beam sections with respect to the
column. It is envisaged that this method of simulating column deformation will result in
a much simplified experimental set-up when compared to an arrangement in which the
column can be rotated directly. By using appropriate instrumentation to monitor the
beam and column rotations and the connection moments, the unloading stiffness of the
both connections could therefore be derived by rotating the saddle beam in a clockwise
and then an anti-clockwise direction.
It is appreciated that whilst the measurement of the various parameters is relatively
straightforward, the proposed experimental set-up is extremely complex and cumber
some. The author therefore proposes an alternative semi- empirical approach which
determines the unloading connection stiffness from readily available existing cruciform
and cantilever beam to column web connection data.
6.5.4 A semi-empirical approach for determining M - tP response.
If a stiff column web panel is used in conjunction with a relatively flexible connection
then the behaviour of the connection will dominate the combined response. The total
effective unloading stiffness will therefore be equivalent to the unloading stiffness of the
connection irrespective of the web stiffness. Conversely, if a stiff connection is connected
to a flexible column web panel then the flexibility of the web panel will dominate. This
6.14

appraisal of the combined effects of different actions is similar to that between beam
stiffness and connection stiffness discussed in chapter 2. Galambos [6.6], proposed the
following equation for the combined column restraint (K,o') due to these effects:-
where:
K _ KbeamKjoint
'0' - K beam + Kjoint
K beam = bending stiffness of the beam.
Kjoin' = stiffness of the joint.
(6.1)
The value Kjoint is the total beam to column joint stiffness and therefore includes the
components of connection stiffness and local column deformation. From the appraisal
presented above, the author proposes that the total joint stiffness can be expressed as
follows:-
K KconKweb
joint = K K con + web
where:
Kcon = actual stiffness of the connection.
K web = stiffness of the web panel.
(6.2)
The total column restraint can therefore be expressed in terms of the individual compo
nents of beam stiffness, connection response and column web flexibility:-
K - KbeamKconKweb tot - Kbeam(kcon + Kweb) + KconKweb
(6.3)
It is expected therefore that by using this equation, the loading restraint to a column
with a single beam connection (as in figure 6.24) could be derived using the unloading
6.15
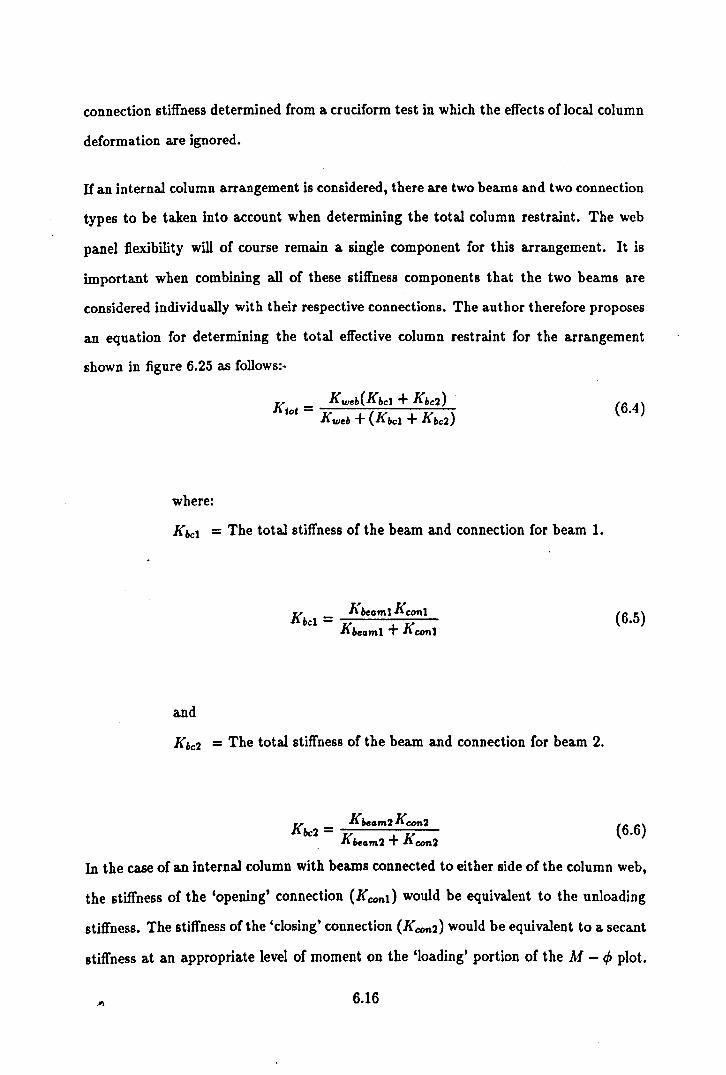
connection stiffness determined from a cruciform test in which the effects of local column
deformation are ignored.
If an internal column arrangement is considered, there are two beams and two connection
types to be taken into account when determining the total column restraint. The web
panel flexibility will of course remain a single component for this arrangement. It is
important when combining all of these stiffness components that the two beams are
considered individually with their respective connections. The author therefore proposes
an equation for determining the total effective column restraint for the arrangement
shown in figure 6.25 as follows:-
(6.4)
where:
Kbcl = The total stiffness of the beam and connection for beam 1.
K KbeamlKconl
bel = Kbeaml + Kconl
(6.5)
and
Kbc2 = The total stiffness of the beam and connection for beam 2.
(6.6)
In the case of an internal column with beams connected to either side of the column web,
the stiffness of the 'opening' connection {Kcontl would be equivalent to the unloading
stiffness. The stiffness ofthe 'closing' connection (Kcon2 ) would be equivalent to a secant
stiffness at an appropriate level of moment on the 'loading' portion of the M - 4> plot.
6.16

Depending on the level of accuracy required, the contribution of the smaller stiffness
contribution from the 'closing' connection (Kcon2) could be ignored. It is clear that this
simplification implies that the total column head restraint is similar to that of a column
with a single beam connection.
The web panel stiffness K",eII is prominent in the above equations. It is this particular
component which, at present, would be difficult to quantify. However, the author hopes
that future research could be conducted to quantify the web panel stiffness for a range
of column sections. It is envisaged that by creating a relatively simple linear elastic
finite element model a direct relationship could be derived between the aspect ratio of
the bolt group compared to the web panel dimensions and the bending stiffness Kweb of
the panel. The author expects that such a numerical model would be significantly less
complicated, and possibly more reliable, than those which have been created to study
the full semi-rigid response of connections.
Assuming that the finite element study of web flexibility was successful, equation 6.4
would comprise terms derived from standard experimental cruciform connection tests
(Kcon), conventional stiffness considerations (Kbe/lm) and numerically modelled linear
elastic relationships (Kweb). Using the equation, the large amount of existing moment
rotation data derived from cruciform tests could be modified to include web flexibility
effects and thereby predict the effective restraint to wide range of columns used in multi
storey semi-rigid frames.
A convenient means of checking the reliability of the approach would be to predict the
unloading stiffness of a cantilever connection arrangement from the measured response
of a cruciform connection test which used the same beam section and connection type.
If found reliable, the use of equations 6.3 and 6.4 would effectively fulfil the function of
the alternative connection test method proposed by the author in figure 6.23.
6.17

An in-depth appraisal of the proposals discussed above is outside the scope of this thesis.
However, it is hoped that the thoughts and proposals presented herein by the author
will be pursued by others to ultimately develop a more complete understanding of the
complex behaviour of semi-rigid beam to column connections.
6.6 A summary of observations on connection M - 4> re
sponse.
1. Due to the effects of column web flexibility, there is a significant difference in
the performance of stiffer connections, e.g. flush end plate and web and seat
cleat, in the two types of 'isolated' connection tests.
2. The 'loading-loading' connection behaviour observed in both the subassem
blage and frame tests appears to be similar to that observed in the corre
sponding 'isolated' connection test.
3. It was concluded that due to the combined effects of beam continuity and web
panel flexibility that the unloading stiffness of beam connections to either side
of the minor column axis is not necessarily equal to the initial tangent stiffness.
4. The author has proposed a method by which the effects of column web flex
ibility can be taken into account. The method can be applied to predict the
performance of connections in which the beam loading, beam sizes and con
nection type are dissimilar on each of the opposite column faces.
6.18

References.
6.1 Celikag, M., 'Moment-rotation behaviour o/steel beam-to-column connections.', Ph.D. Thesis, Department of Civil and Structural Engineering, University of Sheffield, U.K., Februrary 1990.
6.2 Gibbons, C., 'The strength 0/ biazially loaded beam-columns in flexibly connected steel frames. Volume 2: A survey of the mechanical and geometric properties 0/ structural steel sections', Ph.D. thesis, Department of Civil and Structural Engineering, University of Sheffield, Dec. 1990.
6.3 Davison, J.B., 'Strength 0/ beam-columns in flexibly connected steel/rames', Ph.D. Thesis, Department of Civil and Structural Engineering, University of Sheffield, U.K., June 1981.
6.4 Davison, J .B., Kirby, P.A. and Nethercot, D.A., 'Rotational stiffness characteristics of steel beam-to-column connections', Journ. Construct. Steel Research, No.8, 1987, pp. 11-54.
6.5 Bjorhovde, R., 'Effect 0/ end restraint on column strength. practical applications.', A.I.S.C. Engineering Journal, Vol. 20, No.1, First quarter, 1984, pp. 1-13.
6.6 Galambos, T.V., 'Discussion o/small end restraint effects on the strength of H-columns.', Journ. Struct. Div., Am. Soc. ~ivil Engrs., Vol 109, ST4, April 1982, pp. 1067-1011.
6.19

Joint Beam to Column Beam connected Test type Test Connection Type to Web/Flange
JT1 Web cleat Web In-plane JT2 Web cleat Web Out-of-plane JT3 Web cleat Flange In-plane JT4 Web cleat Flange Out-of-plane JT5 Flange cleat Web In-plane JT6 Flange cleat Web Out-of-plane JT7 Flange cleat Flange In-plane JT7A - JT7 with added cleats JT8 Flange cleat Flange Out-of-plane JT8A - JT6 with added cleats JT9 Web and seat cleat Web In-plane JT10 Web and seat cleat Web Out-of-plane JT11 Web and seat cleat Flange In-plane JT11A - JT11 with added cleats JT12 Web and seat cleat Flange Out-of-plane JT12A - JT12 with added cleats JT13 Flush end plate . Web In-plane JT14 Flush end plate Web Out-of-plane JT15 Flush end plate Flange In-plane JT15A - JT15 with added plates JT16 Flush end plate Flange Out-of-plane JT16A - JT16 with added plates
Table 6.1: Summary of the 'cantilever' connection test series.

nOI} Web
o .. 0 I Qeat -'
~ 76
111
11 76 J
o 0
o 0
~ 16 ..
57
Aang~
Cleat,
~~ h,~
_-6Jd! o ~ 01
Web ~ Seat
o 1m 0 J Oeat, 76
51
~ 0 0
0 0 I I
~ 121 r
0 0 j;
/5_ fillet wId - ~ nlUnd
0 0 ~
Rush End Ptaf'!, §
0 0
" 265x12Sx 12 !IIild SMI pl.'"
An holes are 18mm dia for 16mm grade 8.8 bolts.
Figure 6.1: Fabrication details of the connections used in the study.

I Front FISC omitted for
c:larity I
.. .ctiYI
,--,... I I I I
I I I
I I I I
ram --t----+--'!o.1
redundant ram
.. I', \ I .. '. . ,
\-;; .'\. .'-
moment
_-M--- testing rig
Iti rhned mounting plate
column section toe cl.mped to mounting plata.
rot.tion measuring dlvice.
Figure 6.2: Experimental set-up of the 'cantilever' connection test.
1000 mm
Test. specimen
254&102. 22 US and 152.152
.23UC
1000mm
t Vertic:al load supplied
by SOO kN c:apac:ity sc:rew jac:k
1OO0mm
Tnt rig built wit" 305.102 RSC and bolted down to laboratory floor
Strong floor beoml
Figure 6.3: Experimental set-up of the 'cruciform' connection test.

E :Z ~
.u c .., E CI iii
c ;: .u u ... C c CI IU
Subassemblage test moment-rotation data Neb cleat to column flange.
35
30 ~ 55 - beam1 Cruciform
25 Cantilever
20
15
10
5 ----------------------- ------------- ---~
0 -2 0 2 4 6 B 10 12 14 16 1B 20
Rotation (radians) X10-3
Figure 6.4: Moment-rotation response of web cleat connections to the column flange.
Subassemblage test moment-rotation data Flange cleat to column web.
35 )t--K 52 - beam1
30 a--El 59 - beam1 ~ S9 - beam3 .. Cruciform
:z: 25 Cantilever ~
.u 20 c .., e c:> E
c 15 ---c:> .-::::.- .. -..... ~ ... .., ~ 10 B
5
0 -2 0 2 4 6 8 10 12 14 16 18 20
Rotation (radians) X10-3
Figure 6.5: Moment-rotation response of flange cleat connections to the column web.
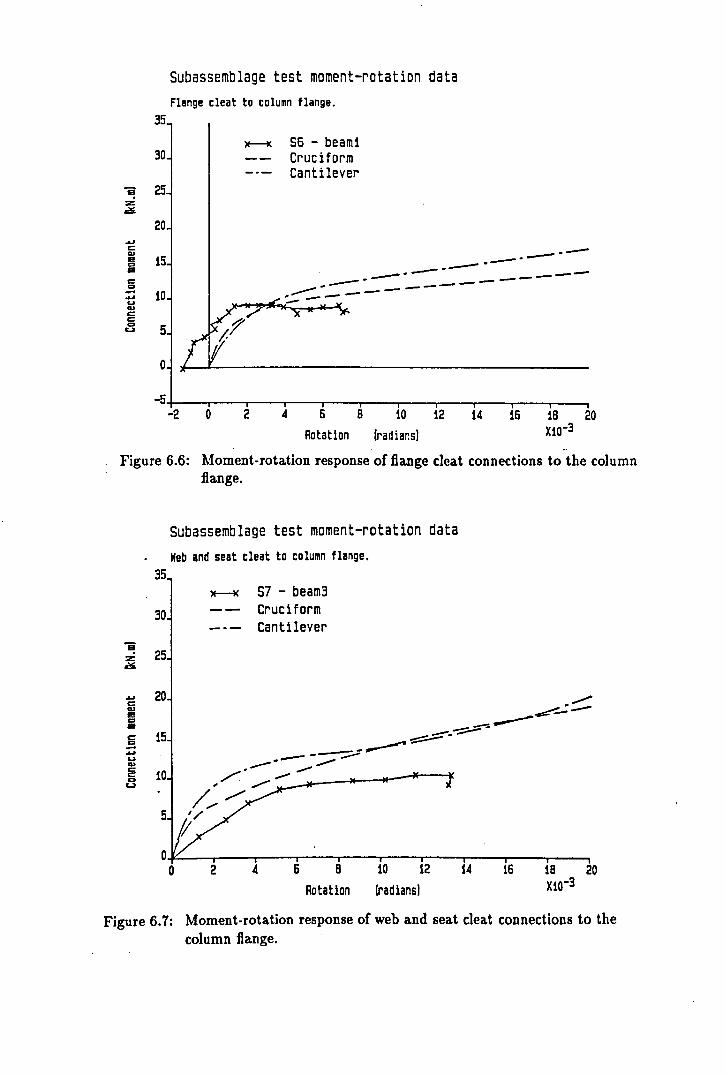
5! :z: =.
.u c Q)
e co .. C co -.u u Q)
C C co u
Subassemblage test moment-rotation data Flange cleat to column flange.
35
30
25
20
15
)f-i( 56 - beam1 Cruciform Cantilever
--------" ------ . -- --- -- ----- ".....---- - -- -- ----10 til' __ ------5
0
-5 -2 0 2 4 6 8 10 12 14 16 18 20
Rotation (ra~iar:s) XlO-3 .'
Figure 6.6: Moment-rotation response of flange cleat connections to the column
35
30
ii 25 :z: =
~ 20 c: .., e CI • c 15 !:! ~ u Q) c: 10 c: CI u
5
0
flange.
Subassemblage test moment-rotation data Neb In~ seat cleat to column flange.
0
)f---i( 57 - beam3 Cruciform Cantilever
2 6 B
Rotation
10 12
(radians)
14 16 18 20 Xl0-3
Figure 6.7: Moment-rotation response of web and seat cleat connections to the column flange.
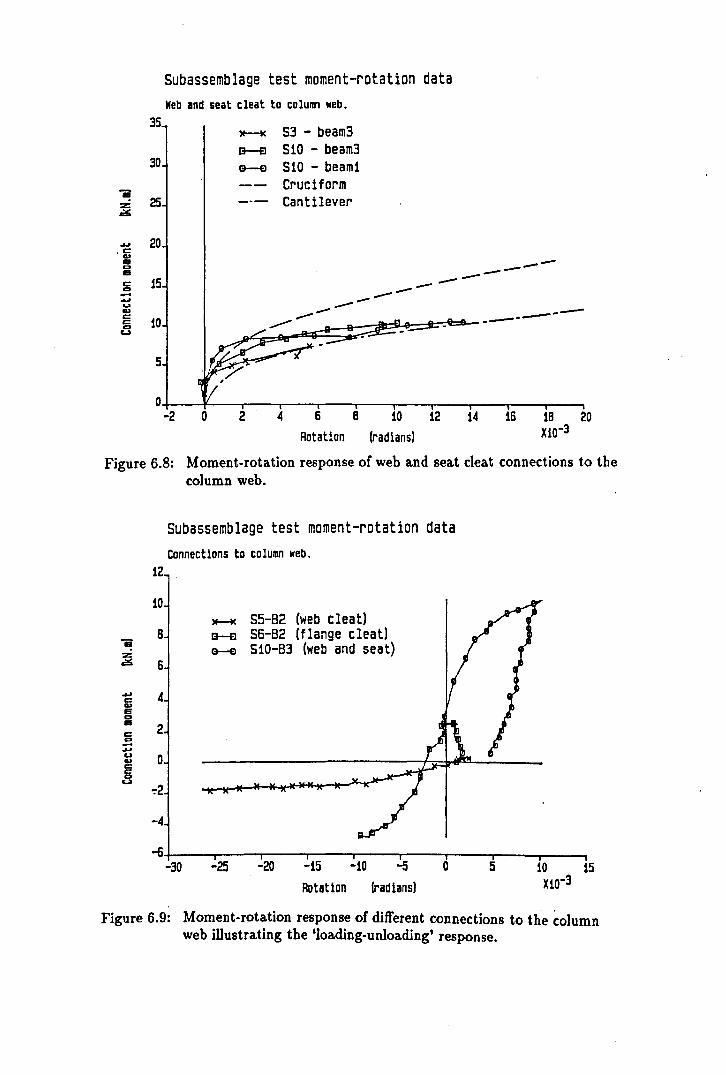
Subassemblage test moment-rotation data Neb and seat cleat to column web.
35 53 - beam3 )t--tC
G-EI 510 - beam3 30
~ 510 - beam1
Ii :z: 25
Cruciform Cantilever
~
.oJ 20 ·ii • --CI • --c 15 ----CI - --~ ... ---II> .-----------c 10 --c --CI ~
5
0 -2 0 2 4 6 B 10 12 14 16 18 20
Rotation (radiansl XiO-3
Figure 6.8: Moment-rotation response of web and seat cleat connections to the column web.
1
10
B
6
2
o
-=-2
-4
Subassemblage test moment-rotation data Connections to column web.
~ 55-82 (web cleat) a--e 56-82 (flange cleat) a--e 510-83 (web and seat)
~'+-----r---~r----.-----r--~r---.----r-----~~ -30 -25 -20 -15 -10 -5 o 5 10 15
Rotation (radiansl X10-3
Figure 6.9: Moment-rotation response of different connections to th'e column web illustrating the 'loading-unloading' response.

Connection Moment Rotation Frame test F1
45
40 +-+ Joint 0 e Joint G ~ z 35 Joint 5 ~ ~
30 Cruciform Cantilever
~ 25 c OJ e 20 0 ~-=..-e ~;....-Cl 15 . ,./ c ~/ .~
'C C 10 '1 OJ /1 CD
5 '/
0
~'+----r--~----r---~---r--~----r---~--~--~ o 2 4 6 8 10 12 14 16 18 20
Rotation (Radians) XiO-3
Figure 6.10 Moment-rotation response of flush end plate connections to the column flange.
Connection Moment Rotation Frame test F1
45 -- -+-+ Joint C ..-"- )f---K Joint E
40 ,./ a-E) Joint J e ./ . 35 / Cruciform z 2!6. / Cantilever .
30 I 25 I
~
I c 20 OJ E I 0 E 15 Cl I c 10 I .~
'C C I OJ ·5
CD
0
-5
-10 -2 0 2 4 6 B 10 12 14 16 18 20
Rotation (Radians) Xl0-3
Figure 6.11 Moment-rotation response of flush end plate connections to the web of a 'corner' column.

50
45 E 40 :z: i6. 35
30 ..... 2s c Q.l e 20 0 e CI 15 c ..... "C 10 C Q.l co 5
0
-5
-10
Connection Moment Rotation Frame test F1
0 2 4
+-+ Joint F -- ~ Joint I
Cruciform Cantilever
6 8 10 12 14 16 Rotation (Radians)
18 20 X10-3
Figure 6.12 Moment-rotation response ('loading-unloading') of flush end plate connections to the web of the 'internal' column.
45
40 E :z 35 i6.
30
25 ..... c 20 Q.l e 0 e 15 CI c: 10 .-
"t:I c: Q.l 5 OJ
0
-5
-10
Connection Moment Rotation
.-----
Frame test F1
t-+ Joint 0 ~ Joint K
Cruciform Cantilever
0 2 4 6 8 10 12 14 16 18 20
Rotation (Radians) X10-3
Figure 6.13 Moment-rotation response ('loa.ding-Ioa.ding') of flush end plate connections to the web of the 'internal' column.
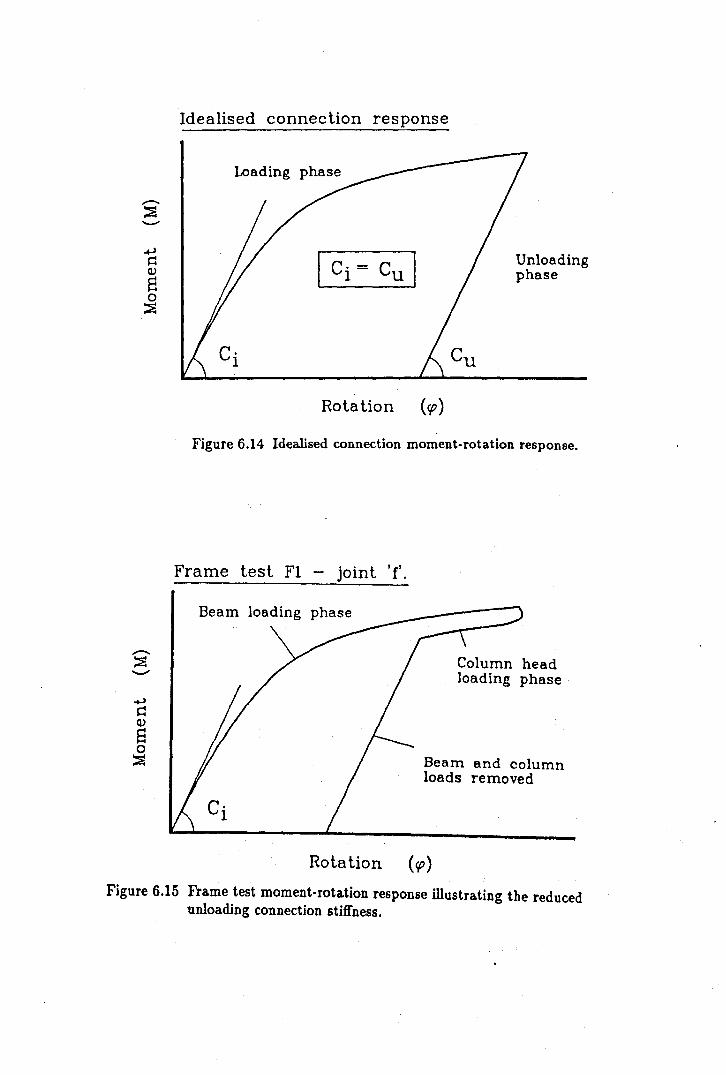
Idealised connection response
Loading phase
c· 1
Rotation (~)
Unloading phase
Figure 6.14 Idealised connection moment-rotation response.
Frame test Fl - joint 'f'.
Beam loading phase
c· 1
Column head loading phase .
Beam and column loads removed
Rotation (~)
Figure 6.15 Frame test moment-rotation response illustrating the reduced unloading connection stiffness.

Beam connected to the web of an external column
J I [ I
Elevation
Beam loading applied.
i + + ~ l
.1 ( r .
e connection 'closes ,
Th d ue to the applied beam load.
Column load applied
Column head rotates as the fallure load is approached caustog the connection to open.
I I
.- ...
+2[ Plan
Bending moment distribution
Column web deforms locally due to the positive connection momenl
Connection moment reverset!l sign.
~
Bendtog moment distribution
Web deformations reverse as the moment at the column bead reverses.
Figure 6.16 Deformation of a connection to the web of a 'corner' column.
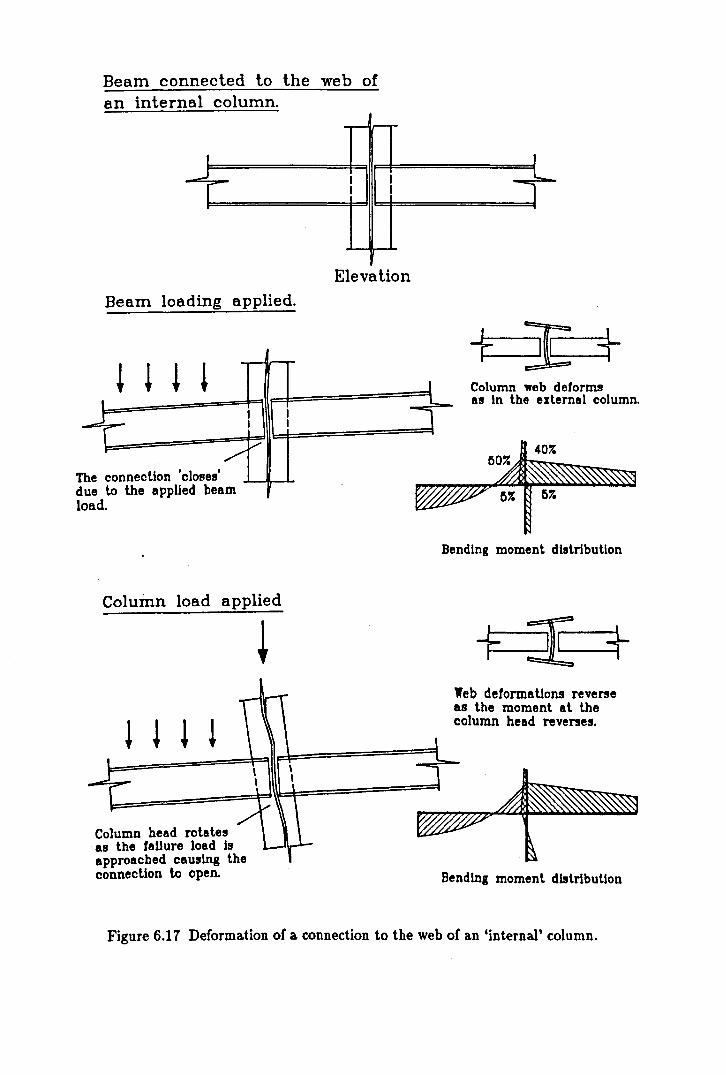
Beam connected to the web of an internal column.
I .J I r I
I I
Elevation
Beam loading applied.
The connection 'closes' due to the appUed beam load.
Column load applied
Column head rotates as the failure load Is approacbed caus~ the connection to open.
J L..
1
+~+ Column 'Web deforms as In the external column.
Bending moment distribution
Web deformations reverse as the moment at the column head reverses.
Bending moment distribution
Figure 6.17 Deformation of a connection to the web of an 'internal' column.
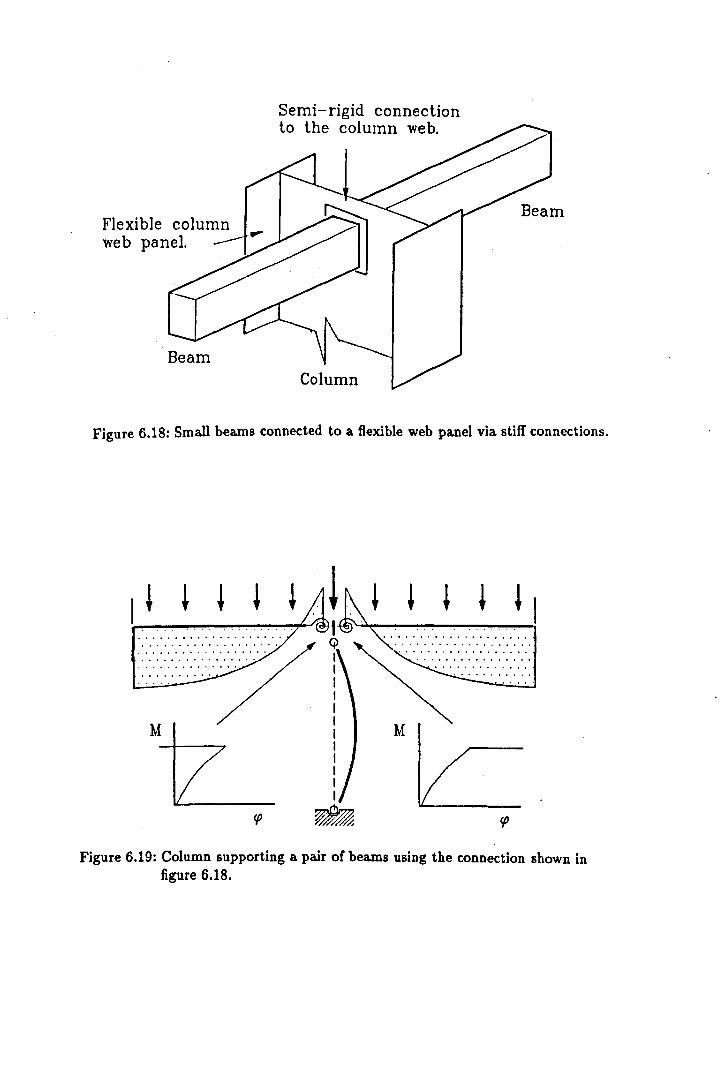
Flexible column web panel.
Beam
Semi-rigid connection to the column web.
Column
Figure 6.18: Small beams connected to a flexible web panel via stiff connections.
I ~
M
~ ..... .. ... ... .. . . . , .. . . . . . .. . . . . .. . . .. .. . " ... . . . , ..
M
Figure 6.19: Column supporting a pair of beams using the connection shown in figure 6.18.
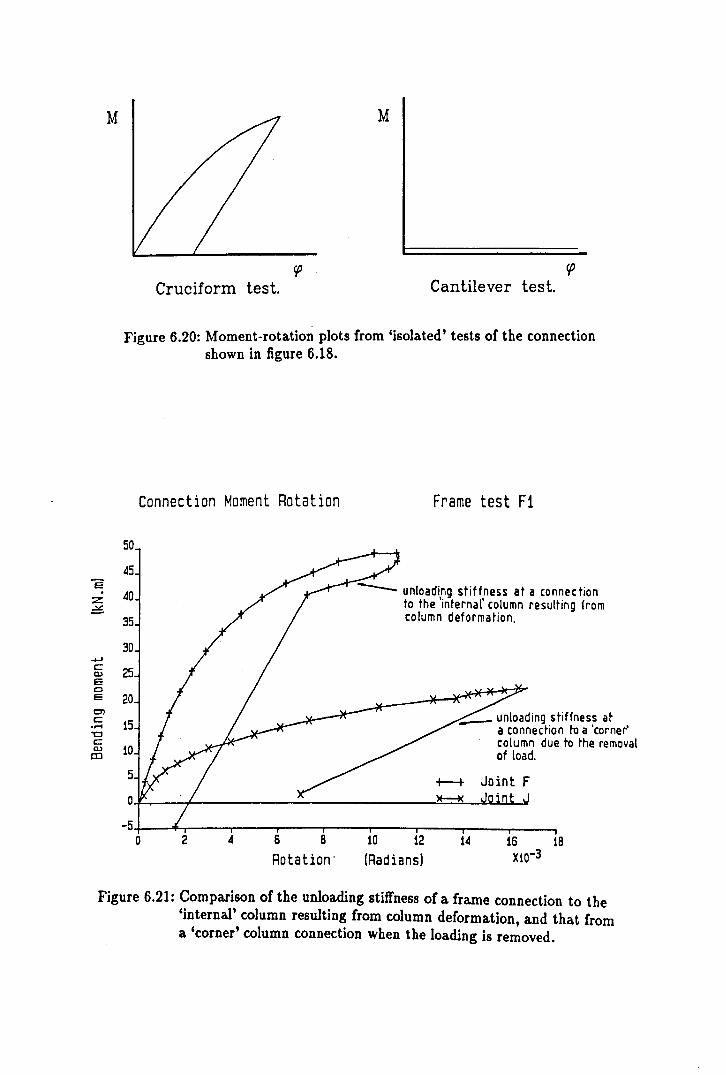
M
e z :2!£
...... c: QJ E c E
01 c: .~
't:I c: QJ
CD
M
Cruciform test. Cantilever test.
Figure 6.20: Moment-rotatiOIi plots from 'isolated' tests of the connection shown in figure 6.18.
Connection Moment Rotation
50
45
40
35
30
25
20
15
10
5
0
-5 0 2 4 6 8
Rotation'
Frame test F1
--- unloading stiffness at a connection to the 'internal' column resulting {rom column deformation.
10 12 (Radians)
__ unloading stiffness at a connection to a 'corner' column due to the removal of load.
+-+ Joint F
14 16 18 Xl0-3
Figure 6.21: Comparison of the unloading stiffness of a frame connection to the 'internal' column resulting from column deformation, and that from a 'corner' column connection when the loading is removed.
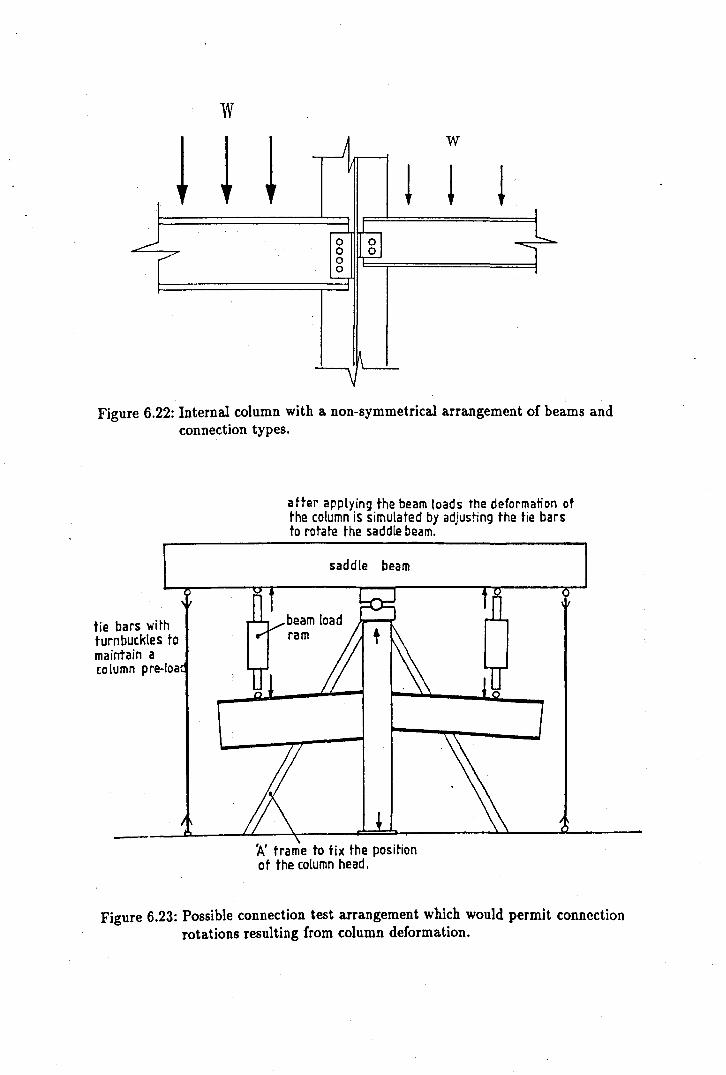
w w
Figure 6.22: Internal column with a non-symmetrical arrangement of beams and connection types.
tie bars with turnbuckles to maintain a co lumn pre-loa
after applying the beam loads the deformation of the column is simulated by adjusting the tie bars to rotate the saddle beam.
saddle beam
'A' frame fo fix the position of the column head.
Figure 6.23: Possible connection test arrangement which would permit connection rotations resulting from column deformation.
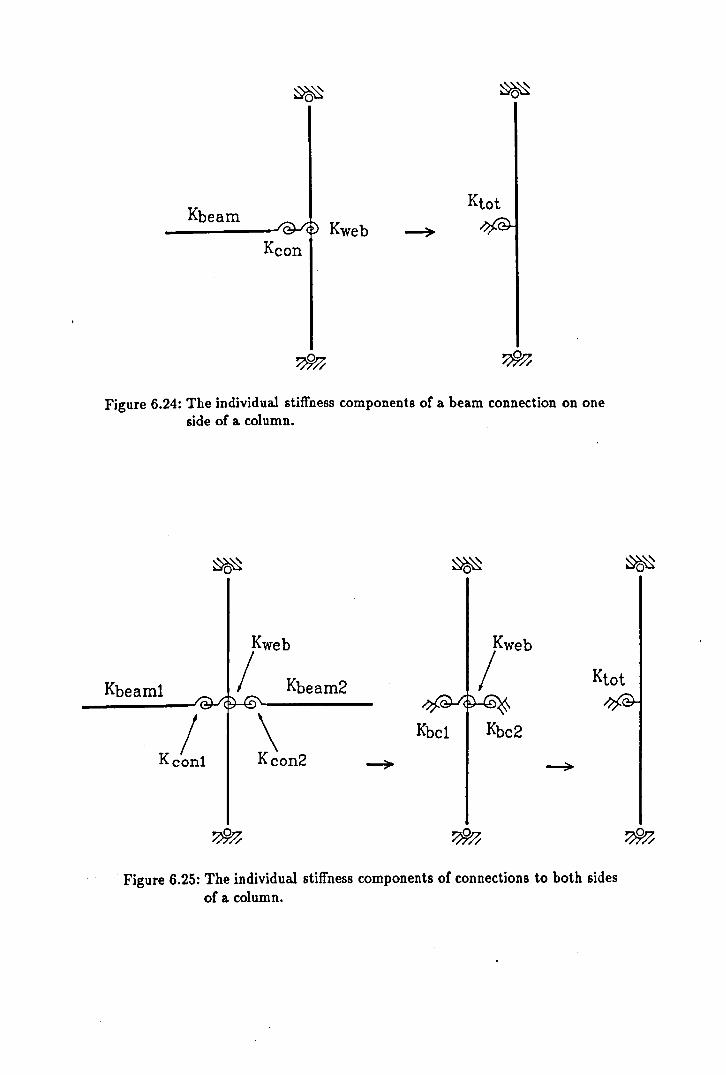
Kbeam Kweb
Ktot
Kcon
Figure 6.24: The individual stiffness components of a beam connection on one side of a column.
Kbeaml
Kweb
/ Kbeam2
Kweb
/ Ktot
/ Kconl
\ Kcon2
Kbcl Kbc2
Figure 6.25: The individual stiffness components of connections to both sides of a column.
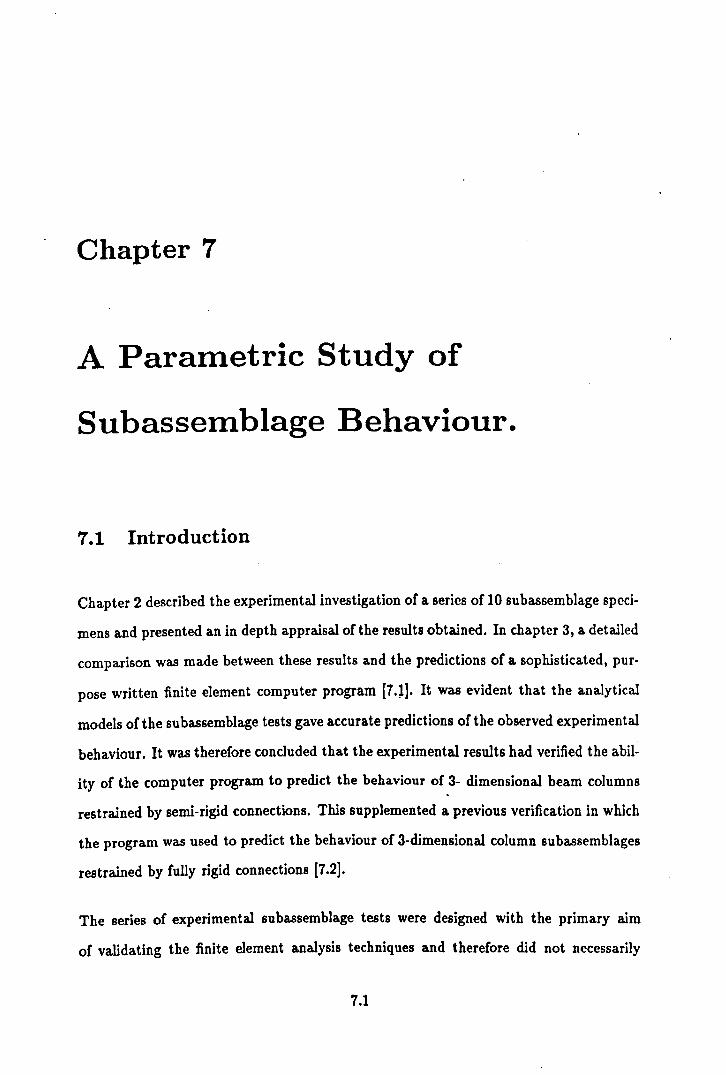
Chapter 7
A Parametric Study of
Subassemblage Behaviour.
7.1 Introduction
Chapter 2 described the experimental investigation of a series of 10 subassemblage speci
mens and presented an in depth appraisal of the results obtained. In chapter 3, a detailed
comparison was made between these results and the predictions of a sophisticated, pur
pose written finite element computer program [7.1]. It was evident that the analytical
models of the subassemblage tests gave accurate predictions of the observed experimental
behaviour. It was therefore concluded that the experimental results had verified the abil
ity of the computer program to predict the behaviour of 3- dimensional beam columns
restrained by semi-rigid connections. This supplemented a previous verification in which
the program was used to predict the behaviour of 3-dimensional column subassemblages
restrained by fully rigid connections [7.2].
The series of experimental subassemblage tests were designed with the primary aim
of validating the finite element analysis techniques and therefore did not necessarily
7.1

conform, in terms of member size and loading, with subassemblages encountered in
general steelwork practice. The purpose of the parametric studies described herein was to
use the validated analysis software to examine subassemblage configurations and loading
arrangements which are of a more direct practical significance. The studies were designed
with the following objectives in mind:-
1. To investigate the influence of semi-rigid connections on the performance of
subassemblages with a range of beam and column stiffness ratios comparable
with those encountered in practice.
2. To investigate how the different distributions of beam loading resulting from
different types of floor construction could affect subassemblage behaviour.
3. To investigate the potential benefits of adopting a 'preferred column orienta
tion'.
4. To quantify the adverse effect, if any, of the transferred moment from a semi
rigid connection to an edge or corner column subassemblage.
5. To accumulate a body of data on the behaviour of a range of sub assemblages
under different loading conditions from which comparisons could be made
with present methods of design.
The results of the first stages of this study were presented at an international conference
[7.3] and have been published in a technical journal [7.4].
7.2 Formation of the study.
The study was conducted in three stages. Firstly, a large number of models were analysed
.to investigate the effect ofload distribution, column orientation and floor construction for
7.2

three different subassemblage types which employed the same beam and column member
sizes. This was followed by a second series of tests in which a limited number of load
cases from the initial study were repeated on a range of subassemblages which employed
different beam and column stiffness ratios. The final stage of the study examined the
effect of increasing the floor loading on larger, stiffer beams. For clarity, the discussion of
these three related studies, and the resulting conclusions, have been reported separately
in sections 7.5, 7.6 and 7.7 respectively.
7.3 Subassemblage configurations.
The parametric study involved the analysis of a. series of isolated subassemblages which
represented parts of a rectilinea.r, non-sway steel framed structure. Subassemblages in
corporating two, three and four beams were considered representing corner, edge and
interior columns respectively. Figure 7.1 shows the arrangement of the four beam sub
assemblage modelled in the study indicating the sections used in the initial phase.
The effect of column continuity through the floor level was not investigated in this
particular study. It is clear that such continuity would tend to distribute the applied
connection moments, thereby reducing the maximum disturbing moment on the column.
As one of the aims of this study was to investigate the extent of the adverse effects of
moment transfer associated with semi-rigid design, only the more onerous non-continuous
case has been considered.
A column height of 3.8m was adopted throughout. Whilst this is a fairly typical di
mension, the primary and secondary beam spans of 5.5m and 4.0m are slightly smaJler
than would be encountered in practice. However, this restriction on floor span enabled
the smaller British Standard beam sections to be considered so that direct use could be
7.3

made of connection performance data from previous studies [7.5J.
All the subassemblage models included an initial sinusoidal column deformation with a
maximum amplitude L/JOOO (3.8mm) about both the major and minor axes. The yield
stress of the steel was assumed to be 215 N/mm2 and the analytical modeJ of the column
incorporated a pattern of residual stress similar to that shown in figure 1.2.
To determine the response range for a particular subassemblage, the performance of each
subassemblage model was investigated using two types of connection, one from each end
of the connection stiffness range. The flexible connection was taken as a web cleat whilst
the very stiff connection was taken as fully rigid (i.e. infinite rotational stiffness). Fig
ure 7.3 shows the assumed multi-linear moment rotation characteristics of the web-cleat
connection, non-dimensionalised with respect to the fully plastic moment M"z capacity
of the primary beam. In this particular study, the same connection type was used on
all the beams of anyone subassemblage, the effect of 'mixed connections types' on the
behaviour of the column was not considered.
7.4 Loading sequence.
In all cases, beam loads were applied proportionally in 10 equal increments up to the
prescribed limiting values. This was followed by a concentric loading at the column
head applied in small increments until the maximum supported load, and hence column
failure, was achieved. The loading sequence was therefore similar to that adopted in the
experimental subassemblage study reported in chapter 2.
1.4
7.5 Parameters investigated in the initial phase of the
study.
The initial phase of the study investigated the influence of moment transfer on the perfor
mance of the subassemblages by considering various load arrangements for both one-way
and two-way spanning floor systems. The former is analogous to precast concrete floor
planks spanning between primary beams, whilst the latter corresponds to an in-situ re
inforced concrete slab supported on both the primary and secondary beams. Figure 7.4
shows the assumed distribution of floor loading on each ofthe supporting beams for both
types of floor construction. To allow an effective comparison between the moment trans
fer effects of the two floor systems, each was considered to have the same characteristic
dead weight of 3.8 kN/m2 • Table 7.1 shoes how this value was derived.
Figure 7.5 shows the distribution of floor loading for each of the nine load cases which
were considered in the study. A typical office floor live loading of 4.0 kN/m2 was used
[7.6]. The design loads on the beams were derived by applying factors to the dead
and live loads in accordance with the current British Steelwork Design Code [7.7]. In
instances where there was an imbalance of beam loads on either side of the column, the
load factors were proportioned to accentuate the effect of the imbalance. In a number
of instances, the imbalance was maximised by considering zero load acting over parts of
the floor area. Whilst it is appreciated that this not a likely design consideration, except
for construction conditions in which a reduced live load would be considered, it does
represent an 'upper bound' to the effect of the disturbing moment.
The effect of the column orientation on the behaviour of the subassemblage was also in
vestigated in the initial study. In orientation type A the primary beams framed into the
web of the column whilst for orientation B the primary beams framed into the column
flanges.
7.5

7.5.1 Discussion of the result from the first phase of the study.
The non-bracketed values in table 7.2 presents the total column load at failure, for the 9
load cases, 2 forms of connection, 2 column orientations and 2 floor systems considered
in the initial study - a total of 72 different analytical models. The tabulated failure loads
are presented in terms of a non-dimensionalised factor 0pin where:-
Ultimate load of the subassemblage column (Pul t )
Opin = Ultimate load of the column pin connected at each end (Ppin) (7.1)
The non-dimensionalised factor, Opin , therefore gives an indication of the benefit of
the restraint from the beam to column connections after incorporating the potentially
disadvantageous influence of moment transferred through the joint. The value of the
lower bound failure load, P"in, was calculated using the program, and had a value of 409
kN for a 3.8m long 152x152x23UC section.
The failure loads presented in table 7.2 are repeated in table 7.3, but in this instance
the values are presented in terms of an Oret factor in which the ultimate load is non
dimensionalised with respect to an upper bound failure load Pret • Pres is the failure
load of the restrained column, in the four possible column arrangements when loaded at
the column head only (table 7.4). The factor Clret is therefore expressed as:-
o = Ultimate load of the subassemblage column (Pule) ( ) ret Ultimate load of subassemblage when loaded at the head only (Pre.) 7.2
The extent to which the factor Ore. fa.lls below unity thus quantifies the amount by which
the moment transferred from the beams erodes the benefit of column end restraint.
The results shown bracketed in tables 7.2 and 7.3 represent additional solutions in which
the sign of the initial column deflections has been reversed. For type B arrangements,
the reversed deflections are in the same direction as the dominant column bending,
7.6

thus resulting in a reduced fa.ilure load. In arrangement type A however, the reverse
deflections are in the opposite sense to the dominant bending, therefore resulting in a
higher fa.ilure load. The difference between these results and the corresponding original
Q ru values provides an indication of the variation in fa.ilure load which may be expected
depending on the direction of the initial column deformations. Since it is not, of course,
reasonable to expect any design method to be a.ble to cater for such inherent variability,
the magnitude of these differences provides a guide to the level of accuracy for which
design methods should aim.
Figure 7.6 presents the load-deflection curves Cor one oC the axially loaded columns with
out disturbing moments shown in table 7.4. As expected, the plots show that the dom
inant column deformation is minor axis bending. A similar response was observed Cor
all the 72 cases considered, with minor axis deCormation becoming even more dominant
with increased applied minor axis moment. This is illustrated in figure 7.7 which shows
the mid-column minor axis deflection Cor a number oC cases with column orientation A
and a one-way spanning floor system.
The general pattern of results presented in tables 7.2 and 7.3 is very similar for both web
cleat and rigid connection types. The smaller failure loads for the web cleat condition
reflect the smaller degree of column end restraint provided by the connection. However,
in certain cases oC predominantly major axis bending (cases 6, 7 and 8B), a slightly
higher Cailure load is observed Cor the web cleat connection. This is explained by the
reduced major axis moment transferred into the column by the relatively flexible web
cleat connection, permitting a greater capacity for axial load. Considera.tion of the
type B arrangement, where the primary beams frame into the column flange under one
way spanning floor conditions (category Bl), show that the Q ru values in table 7.3 are
a.pproximately equal to 1.0 for the web cleats in all load cases, i.e. are virtually unaffected
by the applied moment from the beams, whilst those for the rigid connection vary by up
to 14%.
7.7
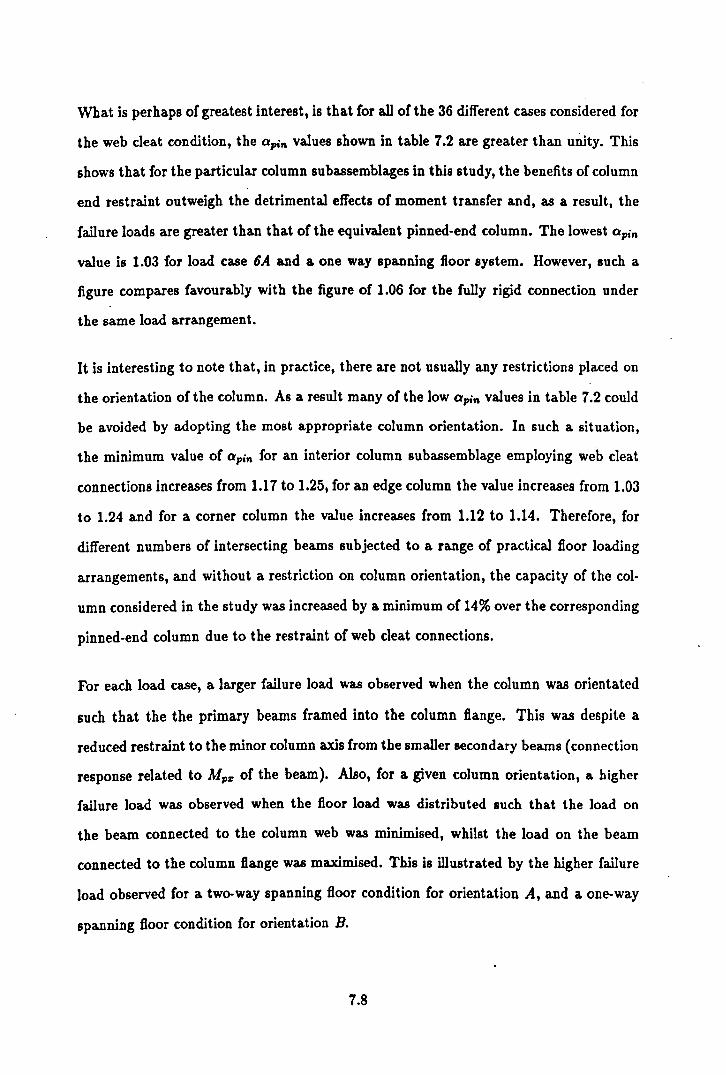
What is perhaps of greatest interest, is that for all of the 36 different cases considered for
the web cleat condition, the apin values shown in table 7.2 are greater than Uliity. This
shows that for the particular column subassemblages in this study, the benefits of column
end restraint outweigh the detrimental effects of moment transfer and, as a result, the
failure loads are greater than that of the equivalent pinned-end column. The lowest Qpin
value is 1.03 for load case 6A and a one way spanning floor system. However, such a
figure compares favourably with the figure of 1.06 for the fully rigid connection under
the same load arrangement.
It is interesting to note that, in practice, there are not usually any restrictions placed on
the orientation of the column. As a result many of the low apin values in table 7.2 could
be avoided by adopting the most appropriate column orientation. In such a situation,
the minimum value of apin for an interior column sub assemblage employing web cleat
connections increases from 1.17 to 1.25, for an edge column the value increases from 1.03
to 1.24 and for a corner column the value increases from 1.12 to 1.14. Therefore, for
different numbers of intersecting beams subjected to a range of practical floor loading
arrangements, and without a restriction on column orientation, the capacity of the col
umn considered in the study was increased by a minimum of 14 % over the corresponding
pinned-end column due to the restraint of web cleat connections.
For each load case, a larger failure load was observed when the column was orientated
such that the the primary beams framed into the column flange. This was despite a
reduced restraint to the minor column axis from the smaller secondary beams (connection
response related to Mpz of the beam). Also, for a given column orientation, a higher
failure load was observed when the floor load was distributed such that the load on
the beam connected to the column web was minimised, whilst the load on the beam
connected to the column flange was maximised. This is illustrated by the higher failure
load observed for a two-way spanning floor condition for orientation A, and a one-way
spanning floor condition for orientation B.
7.8

When the above appraisal is repeated, retaining the freedom of column orientation but
with the restrictions on floor construction removed, an even greater improvement in the
failure loads is observed. The value of Qpin now increases from 1.17 to 1.38 for an in
terior column, from 1.03 to 1.35 for an edge column and from 1.12 to 1.28 for a corner
column. The minimum increase in the capacity of the column for all loading conditions
is therefore doubled from 14% to 28%. These enhanced Qpin values for the web cleat
connected sub assemblage approach the corresponding values for the rigidly connected
subassemblage. Indeed, in the case of the edge column arrangement, the 'unrestricted'
Qpin value of 1.35 for the web cleat connection is exactly the same as the 'unrestricted'
Qpin value for the rigid condition.
7.5.2 Conclusions (rom 'the first phase of the study.
For the particular subassemblage studied above it can be concluded that:-
1. In all of the 36 cases studied for the subassemblage employing web cleat con
nections, the failure load was greater than the failure load of the pinned end
column.
2. All the subassemblages in the study failed as a result of excessive minor axis
bending.
3. It was evident that higher failure loads were observed when the loa.d applied
to beams connected to the column flange was maximised whilst the load on
the beams connected to the column web was minimised.
4. By adopting a preferred column orientation, the minimum Qpin factor was
increased from 1.03 to 1.14. If, in addition, a preferred distribution of beam
loads was adopted, the Qpin factor was increased to 1.28.
7.9

7.6 Parameters investigated in the second phase of the
study.
The second phase of the study concentrated on investigating the ultimate load capacities
and distribution of moments for subassemblages with different connection stiffnesses and
beam/ column stiffness ratios. The initial study had shown that for a large range of
different load cases, Opin was always greater than unity. This implied that the benefit of
connection restraint was greater than the detrimental effect of the transferred disturbing
moment. One of the principal objectives of this second phase of the study was to examine
the range of application of this particular aspect of semi-rigid behaviour in greater detail.
It was evident from the first study that the most onerous configuration was a one-way
spanning floor construction in which the primary beams framed into the web of the
column (arrangement A1). The second phase of the study therefore concentrated solely
on this particular arrangement and, to optimise the use of computer processing time,
only load cases 1, 2 (interior column), 6 (edge column) and 9 (corner column) were
considered.
A total of three different primary beam sections was investigated in conjunction with
three different column sections, giving a total of nine different beam to column stiffness
ratios. The sections used are presented in table 7.5 whilst table 7.6 summarises the
stiffness ratios for each primary beam and column combination. The values presented
in these two tables were computed using the minor axis values for the column extracted
from published tabulated data [7.8]. In all cases, the secondary beam section was the
sa.me as that used in the initial study. Table 7.7 shows the squash load (A X PII) a.nd the
7.10
pinned-end failure load, P pin, determined from the finite element program, for each of the
three different column sections. All the parameters relating to beam loading, material
properties, initial deflection and residual stress remained the same as those which had
been used in the previous study as described in section 7.5.
In the first instance, the web cleat connection characteristics remained exactly the same
as those used in the initial study 80 that a direct appraisal could be made of the influence
of beam stiffness. For completeness however, a series of supplementary models was also
studied in which the stiffness's of the web cleat connections were directly related to the
size of the primary beam, thus representing a more realistic arrangement. The connection
characteristics used in the initial study, which have been termed the 'nominal web cleat
connections' and which remained constant irrespective of the primary beam type, have
been treated as a reference datum. The moment and stiffness characteristics of the
connections in the supplementary tests were derived by multiplying the stiffness and
capacity, both loading and unloading, of the nominal web cleat connection by;-
Mpz2 /Mpzl • in the case of beam 2
and Mpz3/Mpzl • in the case of beam 3.
Connections with these particular moment-rotation characteristics will be referred to as
'enhanced web cleat' connections. As in the initial study, models were also studied with a
fully rigid, infinitely stiff, connection - making a total of three different connection types.
7.11
7.6.1 Discussion o( the results (rom the second phase of the study.
The non-dimensionalised failure loads, apin , for the four load cases, three beam sizes,
nominal web cleat and rigid connection types are presented respectively in tables 7.8a,
7.8b and 7.8c for the three different column types Cl, C2 and C3. The corresponding
results from the models employing enhanced web cleat connection characteristics are
shown in parentheses.
As before (table 7.2), the Qpin factors presented in table 7.8 for the web cleat con
nected subassemblages exhibit a similar pattern to those which are rigidly connected.
As expected, increasing the stiffness of the beam resulted in an increase in the column
failure load. In the case of the nominal web cleat and rigid connections, this can be
explained by the reduced rotations subtended at the support of the stiffer beam. As
the moment-rotation characteristics of these two particular types of connection remains
constant irrespective of beam type, the reduced rotation results in a reduced disturbing
moment being applied to the column, thereby increasing the capacity for axial loading. A
similar effect also explains the increase in the failure loads of the columns with enhanced
web cleat connections. However, as the moment-rotation response of these particular
connections is related to the Mpz of the primary beam, there is of course the additional
effect of increased column restraint from the stiffer connections.
The other obvious feature of the results is that the percentage increase in the failure
loads of both the web cleat and rigidly connected subassemblages decrease as the size of
the column is increased. This is a direct consequence of the decreased slenderness of the
progressively larger columns and the resulting increase in the Ppin/ P.qu(uh ratio, thereby
reducing the potential for enhanced failure loads. If the nominal web cleat data in tables
7.8a to 7.8c is repeated in table 7.9 in the form of a non-dimensionalised parameter
{ipin , the 'swamping effect' of the different buckling criteria of the columns tends to be
7.12

negated.
where:-
~. _ P nUlc - Ppin tJpm-
Prg4 - Ppin (7.3)
Pnwc = Ultimate 10M of the nominal web cleat connected subassemblage.
Prg4 = Ultimate 10M of the rigidly connected subassemblage.
P pin = Capacity of the pinned-end column.
It is evident from the above equation that {Jpin will equal 0.0 for a column restrained by
beams with pin connections and will equal 1.0 when fully rigid connections are used. The
factor {Jpin therefore gives an indication of the enhanced column capacity when using a
nominal web cleat connection compared to that achieved using a fully rigid connection,
irrespective of the column Pule I p.qU(uh. ratio. The results presented in table 7.9 clearly
show that the effect of the restraint from the web cleat connection, when compared to
that of a fully rigid connection, diminishes as the slenderness of the column is reduced -
the connection may be considered as acting less efficiently.
Comparing the values in parentheses in table 7.8, which are the failure loads of the sub
assemblages using enhanced web cleat connections, 'with the corresponding non· bracketed
values shows a slight improvement in the failure 10Ms compared with those obtained us
ing columns employing the constant nominal web cleat characteristics. This is primarily
due to the increased connection restraint offered to the column. However, it is interesting
to note that when the enhanced web cleat characteristics are used in conjunction with
beam BS, the improvement in failure load is similar to that achieved with fully rigid
connections.
Unlike the initial study, there are a few instances where the Qpin factor for subassemblages
employing nominal web cleat connections is marginally less than unity - load case 6, for
7.13
combinations BIC2 and BIC3 of tables 7.8(b) and 7.8(c). This implies that the onerous
effect of the disturbing moments from the connection is marginally greater "than the
enhancing restraint effect as the column fails. This is particularly apparent in the case
of the rigidly connected subassemblage where the disturbing moment from the beams is
significantly larger than for the equivalent subassemblage employing nominal web cleats.
It is interesting to note however that this behaviour has been observed in instances where
the column size has been increased (Cl to C3) and the beam size held constant (Bl).
This suggests a conflict with the generally accepted view that the disturbing moments
from deep beams has a more onerous effect on smaller, more slender edge columns.
The apparent vulnerability of stocky columns to disturbing moments can be explained
by considering figure 7.8 which shows a non-dimensionalised plot of axial load verses
minor axis bending moment for columns Cl, C2 and C3 under load case 6 when rigidly
connected to beam type Bl. The 'near vertical' slope of the mid-column moment plot
for C3 during the head loading phase indicates that the applied load is resisted almost
entirely by compression with only a small amount of member flexure. This behaviour is
typical of a stocky member with a high Puld P.qua,h ratio and a high minor axis bending
stiffness. One ramification of this is that there is a reduced tendency for rotation at
the upper end of the column as the column head load is applied. Consequently, the
column is unable to fully benefit from the potential restraint available from the connecting
beams. This is illustrated by the inability of the column head moment for column C3
to reverse sign. The axial capacity of the column is therefore dictated by the yield
strength of steel, or more precisely the net stress in the presence of the small disturbing
moment, as opposed to overall buckling considerations. This compares with the rela.tively
slender column Cl in which the increased minor axis flexibility promoted larger column
deformations, increased flexural action and consequently increased column head rotation
• thus causing an appreciable reversal of head moment.
Figure 7.9 shows the distribution of minor axis moments on the columns Cl, C2 and C3
at the point of failure for the same load case discussed above. O~vious]y, in the case of
7.14

column C9 in which the head moment is of the same sign as the mid column moment, due
to the incomplete reversal of the initial disturbing moment, a more onerous distribution
of moments occurs when compared to the pinned-end column at failure. As a result, the
opin value for this particular 'stocky' column will be less than unity. Conversely, column
Cl exhibits an appreciable reversal of moment at the column head, thereby producing a
more advantageous distribution of minor axis moment. As a result, the Opin factor for
this particular column is, as expected, greater than unity.
Of particular interest is the distribution of moments for column C2. Although there was
a small reversal of moment at the column head, the Opin factor was less than unity - i.e.
the fallure load of the column was less than that of the pinned-end column. However, the
predicted apin value of 0.97 was only marginally less than 1.0. It is quite possible therrore
that this surprising result was due to a convergence error in the computer program as
the failure load was approached. If, on the other hand, the predicted Opin value is
correct, then a possible explanation could be the second-order nature of the P - 6 effect
on the increased mid column deflection, 6b, arising from the initial disturbing moment
when zones of plasticity are present in the column. This phenomenon is best illustrated
by considering figure 7.10 which shows plots of load verses mid-height deflection for a
pinned-end column and a similar column subjected 'tG an initial disturbing moment.
Applying a disturbing moment to the head of the column results in a deflection at the
column centre of 60 + 66, where 60 is initial column deformation. Due to the increased
bow of the column. the slope of the load- deflection plot is leas than that of the undis
turbed column. If at a subsequent stage of loading the combination of axial load and
moment (both primary and secondary) causes partial plasticity of the column section.
then removal of the moment results in a total deflection at the column centre, 6~, which
is greater than that of the undisturbed column at the same loading level. Although at
this stage the load applied to both the undisturbed and initially disturbed columns is
similar, the increased deflection at the centre ofthe initially disturbed column represents
a more onerous condition and consequently fails at a lower load. It is evident therefore
7.15

that where plasticity of the column section occurs, the principles of superposition do not
apply and the behaviour is dependent on the loading history. In such a situation, a small
reversal of moment at the column head, as observed in column ef, may not be sufficient
to counteract the effect, resulting in an QpiR value less than unity. It is appreciated that
in the column subassemblages the reduction in the column head moment was gradual and
commenced at the instant the column head loading was applied. However, the principles
illustrated in figure 7.10 will still apply but to a lesser extent.
7.6.2 Conclusions (rom the second phase o( the stUdy.
1. The reduced support rotations of stiffer beams subjected to the same load
increases the axial load capacity of the column.
2. In instances where an 'enhanced web cleat' connection is used, i.e. the stiffness
. of the connection is related to the moment capacity of the beam, the increase
in the column failure load is greater than that observed using 'nominal web
cleats', but less than or equal to that obtained when the beams are rigidly
connected.
3. The enhancing effect of a web cleat connection on the ultimate capacity of a
column decreases as the size and stiffness of the column increases.
4. It would appear that stocky columns, in which strength rather than buckling
criteria dictates the ultimate capacity, are more susceptible to the detrimental
effect of small disturbing moments from semi-rigid beam connections.
5. Moment reversal at the ~olumn head does not necessarily result in an Opin
factor which is greater than unity.
7.16

7.7 Parameters investigated in the third phase of the
study.
The conclusions which can be drawn from the above study regarding the effect of the
larger beams B2 and B9 are limited. A particular arrangement of floor loading was
assumed throughout which produced a maximum 'safe' bending moment on primary
beam Bl. Obviously, applying the same loading to stronger, stiffer beams will produce a
reduced beam support rotation thereby reducing the disturbing effect on the column. It
was proposed therefore that further models were studied in which the primary beams B2
and B9 were subjected to significantly greater loading, thereby increasing the induced
rotation at the beam support.
It is appreciated that these additional studies represent a departure from the practical
considerations of load and member sizes which the study aimed to investigate initially.
However, the results of these models will help to discriminate between the separate effects
of load, beam flexibility and connection response which are undoubtedly interrelated.
A maximum beam loading of 46.8 kN 1m (wl) was applied to the primary beam in load
case 6A of the sub assemblages reported under sections 7.3 and 7.4. Increased loadings
of 90.0kN 1m (w2) and 160.0 kN 1m (w9) were considered in this phase ofthe study. The
w9 load was specifically limited to 160kN 1m to prevent a failure of column Cl during
the beam loading phase of the analysis. The effect of these load intensities on beams Bl,
B2 and B9 over a simply supported span of 5.5m are summarised in table 7.10.
From the results of the second phase of the study, it was evident that the column failure
loads achieved using an 'enhanced' web cleat connection were, not surprisingly, inter
mediate between those using a 'nominal' web cleat connection and a rigid connection.
7.17
Therefore, to save computation, only the extremes of the 'nominal' web cleat and the
rigid connection types have been considered in this stage of the study.
7.7.1 Discussion of the results from the third phase of the study.
Tables 7.1180, 7.11b and 7.11c show the failure loads in the form of Qpin factors for the
different combinations of loading, connection type, beam and column size. Part of the
data in these tables has been presented in a series of graphical plots which illustrate a
number of distinct trends despite the limited number of data points which are available.
Figure 7.11 shows a plot of non-dimensionalised failure load against beam stiffness when
a beam load wl is applied. As discussed in section 7.6.1, the plot illustrates that the
effect of a disturbing beam moment on a more stocky column can result in an O"in factor
slightly less than unity. In addition, it highlights the difference between the behaviour
of the rigidly connected sub assemblage and that using web cleats, particularly where a
beam of low stiffness is used. As discussed previously, this is a result of the increased
potential for rotation at the beam support. In the case of the rigid connection, this
translates to a corresponding increase in the disturbing moment applied to the column
and hence a decrease in the ultimate capacity. In the case of the web cleat connection
however, the non-linear nature of the M - fjJ response results in a decreasing increase in
the disturbing moment and hence a less onerous effect on column capacity.
The same effect is illustrated in figure 7.12 which shows a plot of non- dimensiona.lised
failure load against beam stiffness when a beam load wf is applied. There are only two
data points on this plot as the intensity of the w2 loading exceeded the capacity of beam
Bl. As expected, the increased loading, and hence beam support rotation, results in a
reduction in the failure load for a given beam stiffness. The characteristic 'cross-over'
of the rigid and web cleat plots for column C3 therefore occurs at a slightly lower
7.18

beam stiffness. In both cases, the 'near horizontal' nature of the plots for the web cleat
connection to column C3 demonstrates the apparent difficulty of producing an Qpin value
less than unity, irrespective of the beam stiffness. This is particularly reassuring as it
was concluded from the second phase of the study that the stocky C3 column was the
most sensitive to the detrimental effect of an initial disturbing moment from the beams.
It must be remembered however that the use of a stiffer nominal semi-rigid connection
would result in failure loads closer to those obtained from the rigid connection with the
possibility of achieving a Qpin value as low as 0.94 in extreme cases.
Figures 7.13 and 7.14 show plots of the failure load against the applied beam load when
using beams B3 and B2 respectively. The gradient of the plots illustrate the potentially
onerous effect of increased beam loading on the capacity of the column. The steeper gra
dient in the case of beam B2 is a direct consequence of the increased beam flexibility and
the larger rotations induced at the support for a given beam load. The convergence, and
in some instances intersection, of the plots for the rigid and web-cleat beam connections
clearly illustrate the less onerous effect of the reduced moment transferred from nominal
semi-rigid connection.
7.7.2 Conclusions from the third phase 'of the study.
1. Increasing the applied beam load reduces the axial ca.rrying capacity of the
column. The effect is more pronounced in the case of rigidly connected su b
assemblages.
2. For the particular subassemblage parameters which have been considered, the
gradients of the plots of beam load against failure load decrease as the size
and stiffness of the column increases.
7.19
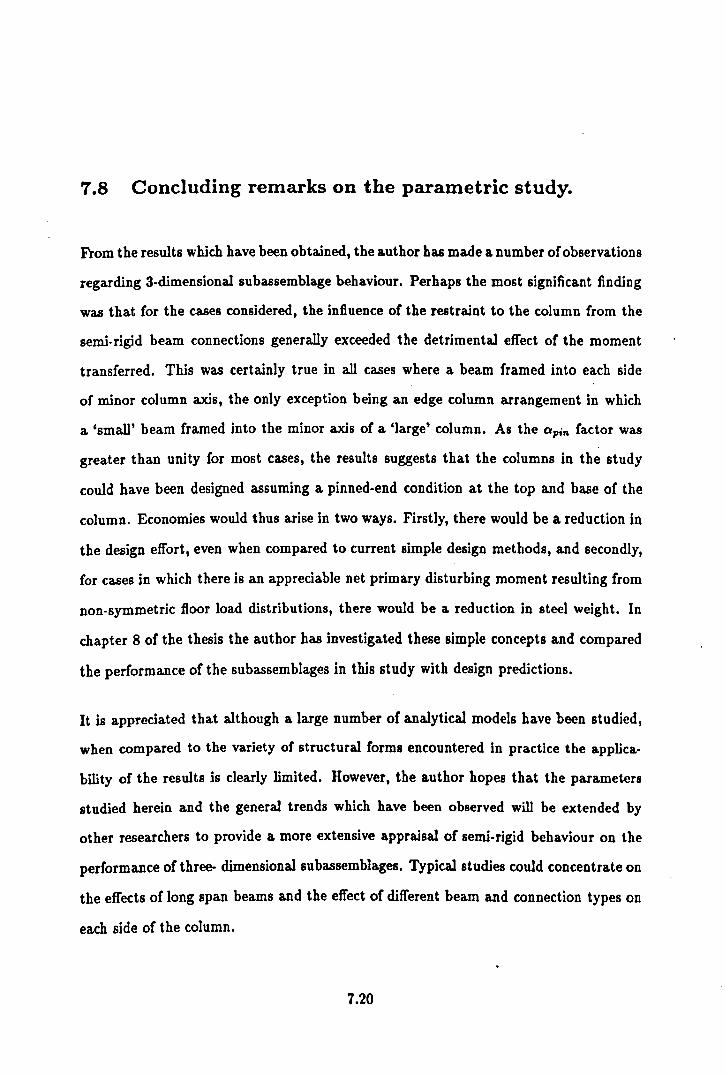
7.8 Concluding remarks on the parametric study.
From the results which have been obtained, the author has made a number of observations
regarding 3-dimensional subassemblage behaviour. Perhaps the most significant finding
was that for the cases considered, the influence of the restraint to the column from the
semi-rigid beam connections generally exceeded the detrimental effect of the moment
transferred. This was certainly true in all cases where a beam framed into each side
of minor column axis, the only exception being an edge column arrangement in which
a 'small' beam framed into the minor axis of a 'large' column. As the Qpin factor was
greater than unity for most cases, the results suggests that the columns in the study
could have been designed assuming a pinned-end condition at the top and base of the
column. Economies would thus arise in two ways. Firstly, there would be a reduction in
the design effort, even when compared to current simple design methods, and secondly,
for cases in which there is an appreciable net primary disturbing moment resulting from
non-symmetric floor load distributions, there would be a reduction in steel weight. In
chapter 8 of the thesis the author has investigated these simple concepts and compared
the performance of the subassemblages in this study with design predictions.
It is appreciated that although a large number of analytical models have been studied,
when compared to the variety of structural forms encountered in practice the applica
bility of the results is clearly limited. However, the author hopes that the parameters
studied herein and the general trends which have been observed will be extended by
other researchers to provide a more extensive a.ppraisal of semi-rigid behaviour on the
performance of three- dimensional subassemblages. Typical studies could concentrate on
the effects of long span beams and the effect of different beam and connection types on
each side of the column.
7.20
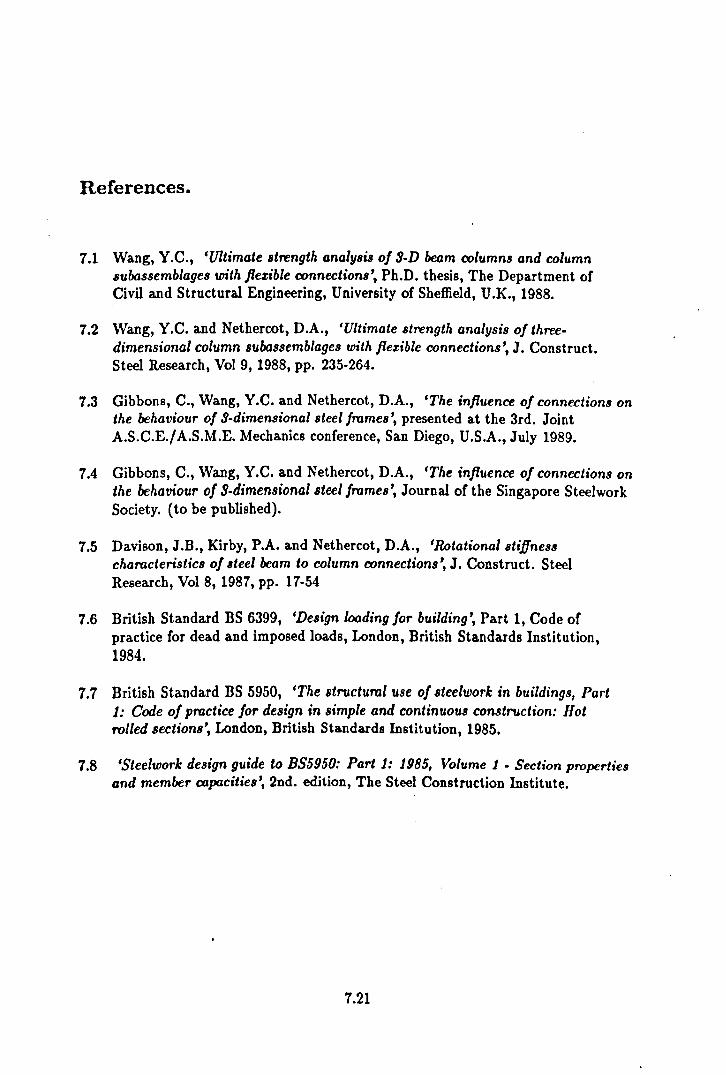
References.
7.1 Wang, Y.C., 'Ultimate strength analysis of 3-D beam columns and column subassemblages with jlezible connections', Ph.D. thesis, The Department of Civil and Structural Engineering, University of Sheffield, U.K., 1988.
7.2 Wang, Y.C. and Nethercot, D.A., 'Ultimate strength analysis of threedimensional column subassemblages with jlezible connections', J. Construct. Steel Research, Vol 9, 1988, pp. 235-264.
7.3 Gibbons, C., Wang, V.C. and Nethercot, D.A., 'The influence of connections on the behaviour of 3-dimensional steel frames', presented at the 3rd. Joint A.S.C.E./A.S.M.E. Mechanics conference, San Diego, U.S.A., July 1989.
7.4 Gibbons, C., Wang, Y.C. and Nethercot, D.A., 'The influence of connections on the behaviour of 9-dimensional 8teel frames', Journal of the Singapore Steelwork Society. (to be published).
7.5 Davison, J.B., Kirby, P.A. and Nethercot, D.A., 'Rotational stiffness characteristics of steel beam to column connections', J. Construct. Steel Research, Vol 8, 1987, pp. 17-54
7.6 British Standard BS 6399, 'Design loading for building', Part 1, Code of practice for dead and imposed loads, London, British Standards Institution, 1984.
7.7 British Standard BS 5950, 'The 8tructuml use of steelwork in buildings, Part 1: Code of practice for design in 8imple and continuous construction: 1Iot rolled sections', London, British Standards Institution, 1985.
7.8 'Steelwork design guide to BS5950: Part 1: 1985, Volume 1 - Section properties and member CXlpacities', 2nd. edition, The Steel Construction Institute.
7.21

Floor construction Dead load components kN/m2
One way spanning Cement screed 0.80 Precast floor planks 2.70 Battens 0.05 Ceiling board 0.15
Total 3.80
Two way spann1ng Non-cement screed 0.05 150mm R.C. slab 3.55 Battens 0.05 Ceiling board 0.15
Total 3.80
Table 7.1: Assumed dea.d load components for the two types of floor construction.

Connection Type WEB CLEAT RIGID
Column Or1entation A B A B
Slab Span 1 2 1 2 1 2 1 2
1 1.28 1.29 1.38 1.27 1.44 1.44 1.42 1.42
2 1.17 1.20 1.37 1.30 1.26 1.29 1.34 1.37 (1. 35) (1.28) (1.33) (1.36)
3 1.22 1.24 1.38 1.30 1.31 1.34 1.38 1.40 (1.40) (1.39)
4 1.24 1.25 1.38 1.25 1.34 1.35 1.40 1.33 (1.36) (1.24) (1.39) (1.33)
5 1.26 1.27 1.38 1.35 1.37 1.38 1.41 1.47 (1.36) (1.35) (1.37) (1.26) (1. 40) (1.36)
- - - - - - - - - - - - - - - - - - - - -6 1.03 1.06 1.35 1.29 1.06 1.18 1.23 1.28
(1.23)
7 1.14 1.16 1.37 1.24 1.25 1.27 1.35 1.31
8 - 1.08 1.12 1.37 1.25 1.21 1.24 1.31 1.30
- - - - - - - - - - - - - - - - - - - - -9 1.12 1.14 1.28 1.·14 1.25 1.25 1.33 1.22
Table 7.2: Failure loads (apin) of the models in the initial study.
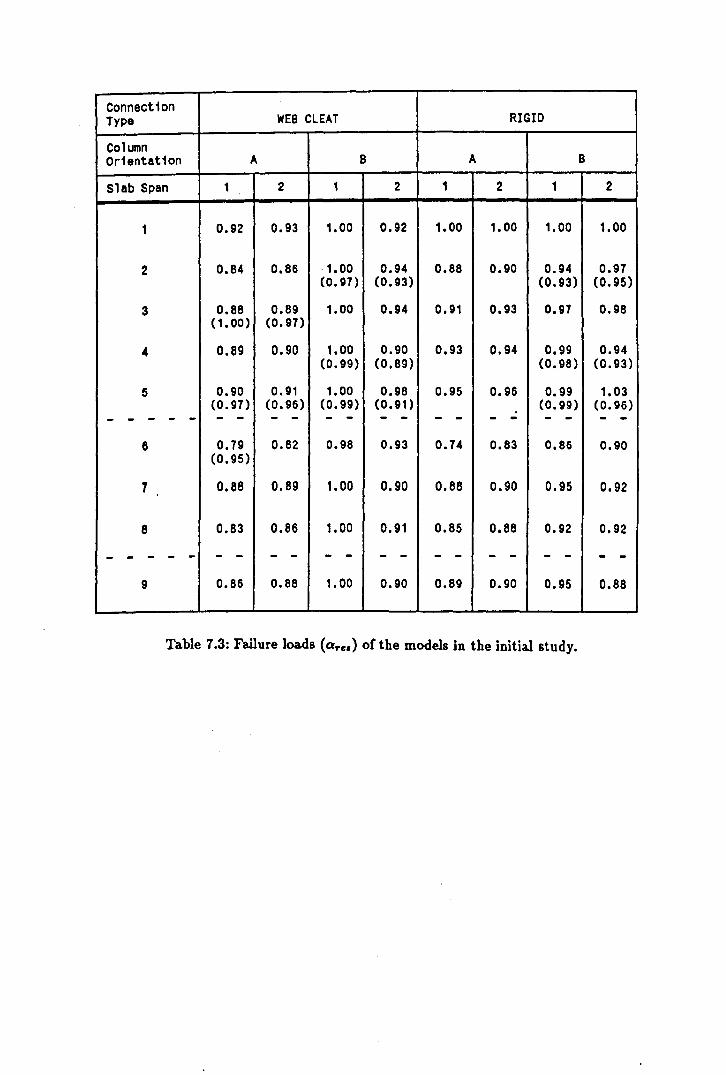
Connection Type WEe CLEAT RIGID
Column Or1entation A B A B
Slab Span 1 2 1 2 1 2 1 2
1 0.92 0.93 1.00 0.92 1.00 1.00 1.00 1.00
2 0.84 0.86 ·1.00 0.94 0.88 0.90 0.94 0.97 (0.97) (0.93) (0.93) (0.95)
3 0.88 0.89 1.00 0.94 0.91 0.93 0.97 0.98 (1.00) (0.97)
4 0.89 0.90 1.00 0.90 0.93 0.94 0.99 0.94 (0.99) (0.89) (0.98) (0.93)
5 0.90 0.91 1.00 0.98 0.95 0.96 0.99 1.03 (0.97) (0.96) (0.99) (0.91) (0.99) (0.96)
- - - - - - - - - - - - - - - - - - - - -6 0.79 0.82 0.98 0.93 0.74 0.83 0.86 0.90
(0.95)
7 0.88 0.89 1.00 0.90 0.88 0.90 0.95 0.92
8 0.83 0.86 1.00 0.91 0.85 0.88 0.92 0.92
- - - - - - - - - - - - - - - - - - - - -9 0.86 0.88 1.00 0.90 0.89 0.90 0.95 0.88
Table 7.3: Failure loads (are.) of the models in the initial study.

Column Arrangement WEB CLEAT RIGID
I :I: 1.40 1.44 ,
-f-7t- 1.30 1.43
I ::r: 1.38 1.42
I
:r 1.30 1.43
I Table 7.4: Failure loads (apin) of the sub assemblages when loaded at
the column head only.
Section Section Mpx Mpy reference serial size (kNm) (kNm)
81 305x127x48 U8 194.0 24.0
82 406x178x74 UB 412.0 56.0
83 686x254x140 UB 1210.0 130.0
C1 152x152x23 UC 45.0 14.0
C2 203x203x46 UC 137.0 49.0
C3 305x305x97 UC 396.0 131.0
Table 7.5: Plastic moment capacities of the sections used in the second phase of the study.

stiffness ratios Kbx/Kcy ( Ibx.Lc/lcy.Lb )
Section C1 C2 C3 reference
B1 16.2 4.6 0.9
B2 46.8 12.2 2.6
B3 233.2 61.0 12.9
Table 7.6: Stiffness ratios for the different beam and column combinations.
Column Column L/ryy Squash load Pinned-end axial Ref
C1
C2
C3
serial size (L =3.8m) Psq (kN) load capacity Pp1n (kN)
152x152x23 UC 103.3 820.0. 40.9.0
203x203x46 UC 74.4 1620..0. 1133.0 -305x3o.5x97 UC 49.5 3380..0. 2894.0.
Table 7.7: Nominal column squash loads and ultimate capacities determined from the finite element program.

Beams connected to COLUMN C1 Pult/Ppin
Web Cleat Connection Rigid Connection Load case
B1 B2 B3 B1 B2 B3
1 1.28 1.35 1.40 1.44 1.44 1.45 (1.39) (1.43)
2 1.17 1.32 1.39 1.26 1.37 1.43 (1.34) (1.42)
6 1.03 1.25 1.37 1.06 1.32 1.41 (1.27) (1. 40)
9 1.12 1.26 1.34 1.25 1.37 1.43 (1.32) (1.41)
Table 7.8a: Values of ltpin for column Cl with different beam sizes.
Beams connected to COLUMN C2 Pult/Ppin
Web Cleat Connection Rigid Connection Load case
B1 B2 83 81 82 83
1 1.09 1.13 1.16 1.20 1.21 1.21 (1.16) (1.20)
2 1.04 1.11 1.16 1.10 1.18 1.20 (1.14) (1.19)
6 0.98 1.08 1.14 0.97 1.14 1.20 (1.09) (1.18)
9 1.01 1.07 1.11 1.09 1.18 1.20 (1.12) (1.18)
Table 7.8b: Values of ltpin for column C2 with different beam sizes.

Beams connected to COLUMN C3 Pult/Pp1n
Web Cleat Connection Rigid Connection Load case
B1 B2 B3 B1 B2 B3
1 1.02 1.03 1.04 1.05 1.07 1. 07 (1.04) (1.06)
2 1.00 1.02 1.04 1.00 1.05 1.06 (1.03) (1. 05)
6 0.99 1.01 1.03 0.94 1.03 1.06 (1.01) (1.04)
9 1.00 1.01 1.02 1.00 1.05 1.07 (1.02) (1.05)
. Table 7.8c: Values of Qpin for column C9 with different beam sizes.
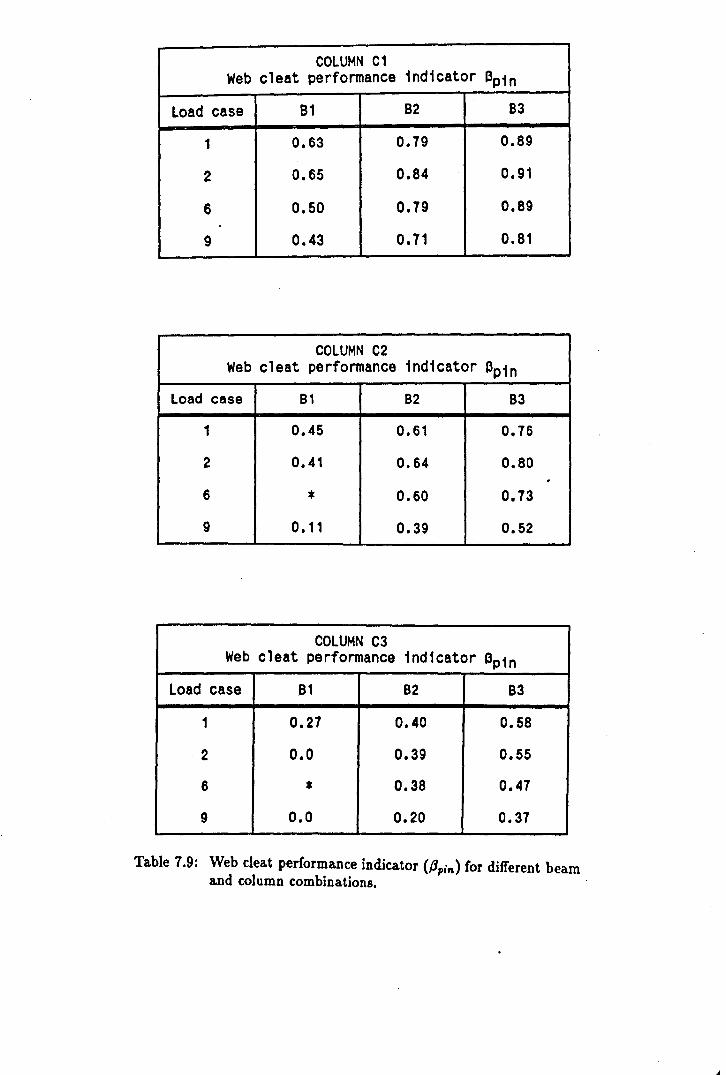
COLUMN C1 Web cleat performance indicator Bpin
Load case 81 82 83
1 0.63 0.79 0.89
2 0.65 0.84 0.91
6 0.50 0.79 0.89 .
9 0.43 0.71 0.81
COLUMN C2 Web cleat performance indicator Bpin
Load case 81 82 83
1 0.45 0.61 0.76
2 0.41 0.64 0.80 . 6 * 0.60 0.73
9 0.11 0.39 0.52
COLUMN C3 Web cleat performance 1ndicator Bpin
Load case 81 82 83
1 0.27 0.40 0.58
2 0.0 0.39 0.55
6 * 0.38 0.47
9 0.0 0.20 0.37
Table 7.9: Web cleat performance indicator (fJpin) for different beam and column combinations.

Effect of beam loading on simple 5.5m spans
B1 B2 B3 Beam load
kN/m M/Mpx ¢sp M/Mpx ¢sp M/Mpx ¢sp kNm mRads kNm mRads kNm mRads
46.8 (w1) 0.91 16.2 0.43 5.6 0.15 1.1
90.0 (w2) - - 0.83 10.9 0.28 2.2
160.0 (w3) - - - - 0.50 3.8
Table 7.10: Effect of the different loading intensities wl, w2 and w3 on the beams Bl, B2 and B3 over a. simple 5.5m span.
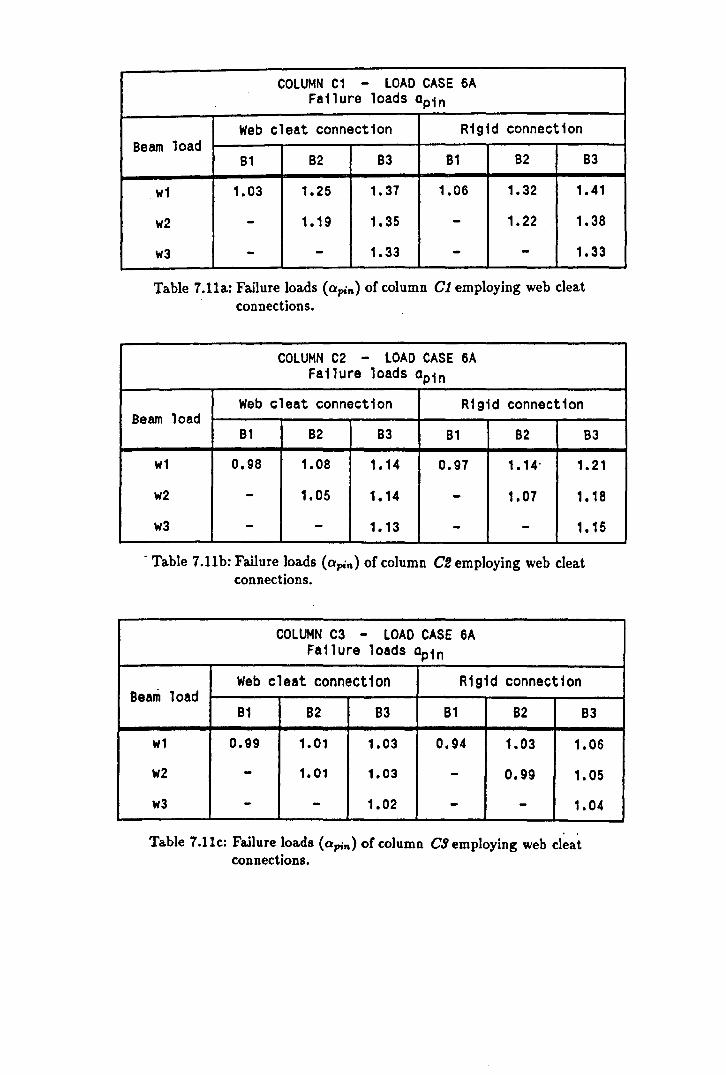
COLUMN C1 - LOAD CASE 6A Failure loads Qpin
Web cleat connect1on Rigid connection Beam load
B1 B2 B3 Bl B2 B3
wl 1.03 1.25 1.37 1.06 1.32 1.41
w2 - 1.19 1.35 - 1.22 1.38
w3 - - 1.33 - - 1.33
Table 7.lla: Failure loads (apin) of column Cl employing web cleat connections.
COLUMN C2 - LOAD CASE SA Failure loads Qpin
Web cleat connection Rigid connection Beam load
Bl B2 B3 Bl B2 B3
wl 0.98 1.08 1.14 0.97 1.14· 1. 21
w2 - 1.05 1.14 - 1.07 1.18
w3 - - 1.13 - - 1.15
. Table 7.11b: Failure loads (apin) of column ce employing web cleat connections.
COLUMN C3 - LOAD CASE 6A Fa1lure loads Qpin
Web cleat connection Rigid connection Beam load
B1 B2 B3 81 B2 B3
wl 0.99 1.01 1.03 0.94 1.03 1.06
w2 - 1.01 1.03 - 0.99 1.05
w3 - - 1.02 - - 1.04
Table 7.Uc: Failure loads (apin) of column C3 employing web cleat connections.

c C CD C')
...... 0
tJ\)'Q "f,\oi
. \'1." ~c,"f,
~ rn N ~
N ~ )(
~ ~
0'-----
Figure 7.1: Arrangement of the subframe and subframe model used in the study.
-O.15py
-O.15py
compression tension
Figure 7.2: Assumed pattern of column residual stresses.
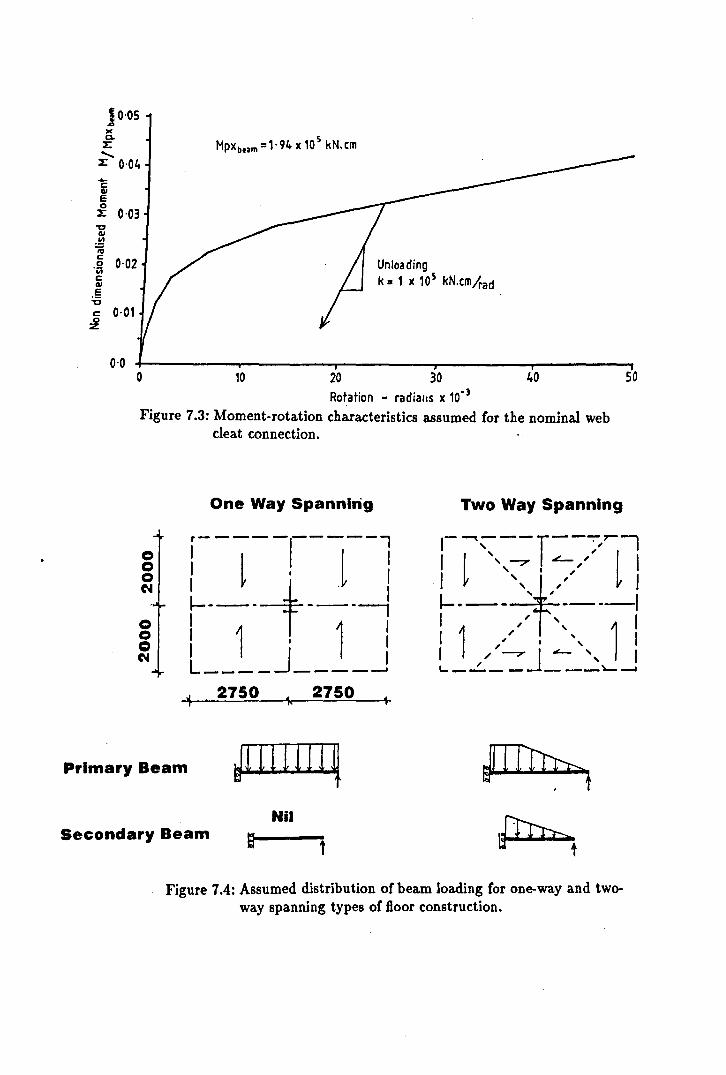
10'05 &J )( Q.
l: ....... l: 0·04 .. c ell E 0 l: 0·03 't:I ell
.!a ;0 c
0·02 0 'ijj C ell
.5 't:I
e 0·01 0 z
0·0 0
5 Hpxbnm =1·94x10 kN.cm
10 20
Unloading k = 1 X 10⁵ kN.cmlrad
30 Rotation - radialis x 10-3
40
Figure 7.3: Moment-rotation characteristics assumed for the nominal web cleat connection.
o o o toI
o o o toI
Primary Beam
Secondary Beam
One Way Spanning Two Way Spanning
2750 2750 ..
JI rr III q Nil
a t
Figure 7.4: Assumed distribution of beam loading for one-way and twoway spanning types of floor construction.
50
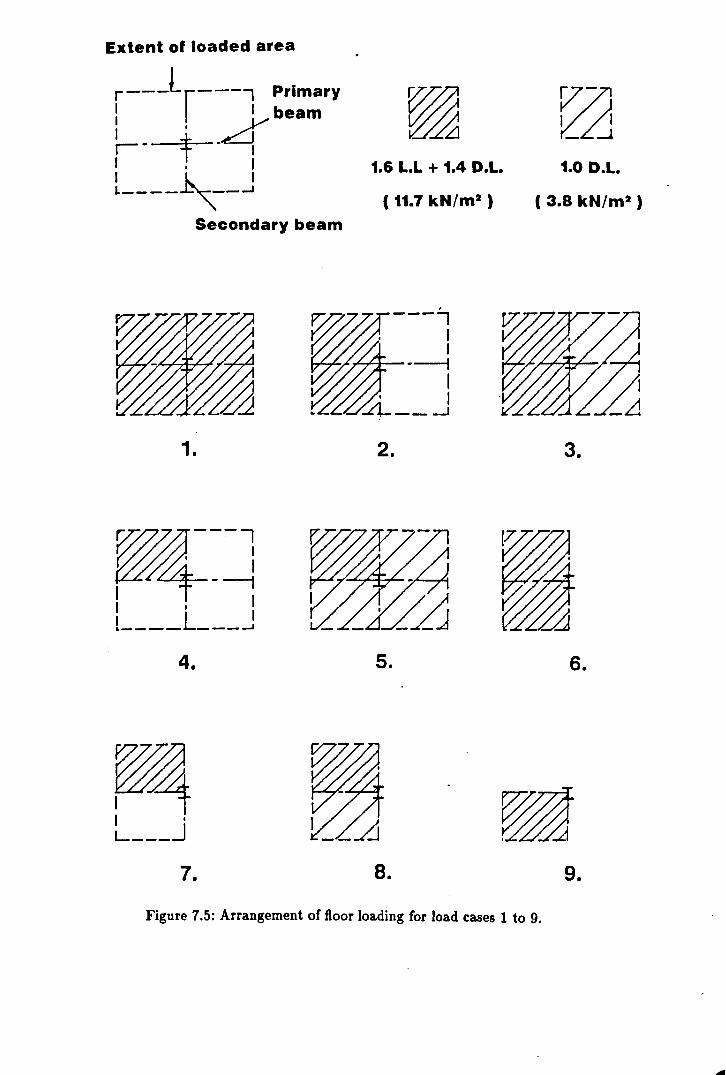
Extent of loaded area
r---lr--l-:::':'Y ~ ~- f -L.{ I . I 1.6 L.L + 1.4 D.L.
l ____ ~--J (11.7 kN/m2)
1.0 D.L.
( 3.8 kN/m2) Secondary beam
1. 2. 3.
4. 5. 6.
8. 9.
Figure 7.5: Arrangement of floor loading for load cases 1 to 9.
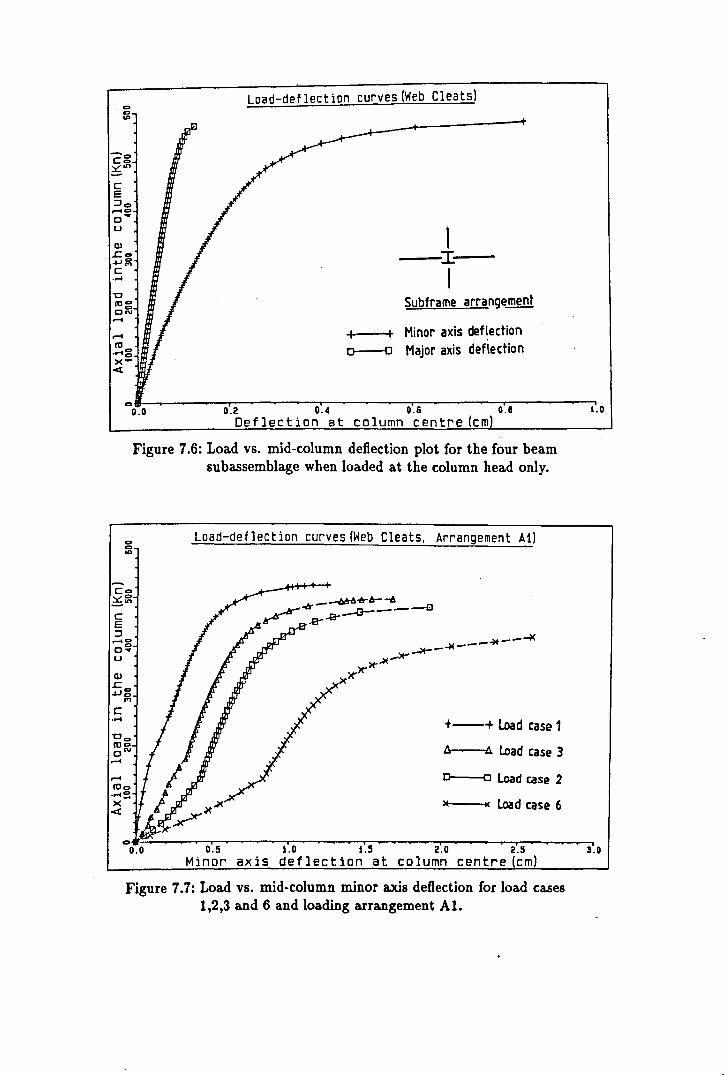
e> e> ..,
cg ~'" c E ::Ie>
,.... co o~
U
Ql ,t;;e>
"'-':>: c .~
Load-deflection curves (Web Cleats)
, --:I;--
I Subframe arrangement
I I Minor axis deflection 0---0 Major axis deflection
co~.o--~------~Or.2------~~O~.4~~----~~O.~6------~~O~.8~----~~~'.O
.......
co co ..,
....... 100 .f"'4~
>< <
Deflection at column centre (em) ..
Figure 7.6: Load VS. mid-column deflection plot for the four beam subassemblage when loaded at the column head only.
Load-deflection curves (Web Cleats. Arrangement Ai)
+--+ load case 1
A--Il. load case 3
0---0 Load case 2
)( I( load case 6
e>O·.~O~~~~O~:5~------~1:70------~I~:5~------~2:~O--------2T:5--------~3:0 Minor axis deflection at column centre (cm)
Figure 7.7: Load VS. mid-column minor axis deflection for load cases 1,2,3 and 6 and loading arrangement Al.

-1.0
Mid-column moments.
-0.5 o
Cl ---
C2-·-·
C3----
./. Column top ././ \ moments.
" . ..J " . .--'.'-~ . .---:::::..--~
0.5 1.0
Minor axis moments MY/MPy
Figure 7.8: Plot of the top and mid-column minor axis bending moments for load case 6A with beam Bl and a rigid connection.
CXpln -. 1. 06 CXpin - 0.97 CXpin _ 0.94
Cl C2 C3
Figure 7.9: Minor axis bending moments at the point of failure for load case 6A with beam Bl and a rigid connection.

do
" " /
"
,. ,. ,. ..".---
/ M removed do 1- - - - - - ·:;;"d~+db
I I
I I M applied
/ I
/ " /
Pinned-end column, no moment applied.
Pinned-end column with moment applied.
Tolal mid-column displacemenl Cd)
Figure 7.10: Plot ofload vs. minor column axis displacement for a illustrating the adverse effect of the P-c5 effect on initial disturbing moments.
d-

,..... c '0. '6 ........
"0 0
..Q CP L.. .= '0 l.I...
,..... c '0. (f ........
"0 0
..Q CP L.. :J
'0 l.I...
Loading W 1 - Columns C 1,C2 and C3
1.5
1.4-• Web cleat - C1
+ Rigid - C1 1.3
• Web cleat - C2
1.2 A Rigid - C2
1.1 )( Web cleat - C3
1 'I Rigid - C3
0.9 0 2 4- 6 6 10 12 14
Beam stiffness (Kb/Kb 1) Figure 7.11: Plot offailure load (opin) vs. beam stiffness for load
intensity wI.
Loading w2 - Columns C 1,C2 and C3 1.5
1.4 •
I 1.3 .
1.2
J: 1.1
~ 1 -
• Web cleat - C1
+ Rigid - C1
• Web cleat - C2
A Rigid - C2
)( Web cleat - C3
'I Rigid - C3
0.9 . 0 2 4 6 6 10 12 14
Beam stiffness (Kb/Kb 1)
Figure 7.12: Plot of failure load (Opin) va. beam stiffness for load intensity w2.

,-... c
'Q.
:t "'0 0 0
Q) ~
.2 '0 I..L.
........ . 5 0.
~
"'0 0 0
Q) ~ :J
'0 u..
Beam 3 - Columns C 1,C2 and C3
1.5
1.4 : • Web cleat - C 1
: • + Rigid - C1
1.3
0 Web cleat - C2
1.2 - • .. 6 RigId - C2 •
1.1 )( Web cleat - C3 ,. ,. ... ,. II K
1 ... RIgId - CJ
0.9 40 60 80 100 120 140 160
Beam loading (kN/m)
Figure 7.13: Plot of failure load (0".,,) VB. beam load intensity for a type B3 beam.
Beam 2 - Columns C 1,C2 and C3
1.5
1.4 • Web cleat - C1
~ 1.3
1.2
+ RIgId - C1
• Web cleat - C2
1.1 ~ 6 Rigid - C2
)( Web cleat - C3 .. 1 :--- -==::::::::: ... Rigid - C3
0.9 40 60 80 100 120 140 160
Beam loading (kN/m)
Figure 7.14: Plot offailure load (0".,,) VB. beam load intensity for a type B2 beam.

Chapter 8
The Design of Non-sway Frames
with Semi-Rigid Connections.
8.1 Introduction
One of the principal objectives of this research project was to use the observations on
semi-rigid frame behaviour from both experimental and numerical studies to investigate,
and where appropriate enhance, existing methods of design. This chapter of the thesis
is devoted to this objective.
Included in this chapter is a comprehensive historical review of the development of present
'codified' methods of isolated column design and 'state of the art' methods for the design
of semi-rigid frames. Also included are the author's own proposals for semi-rigid design
under both ultimate and serviceability loading conditions. In each case, the proposed
design techniques have been verified against the response of the full scale frame tests
FI, reported in chapter 5. In line with the need to provide steelwork designers with the
option of performing relatively conservative designs requiring only the minimum of effort,
the author has supplemented his proposed in-depth technique with possible alternative
8.1
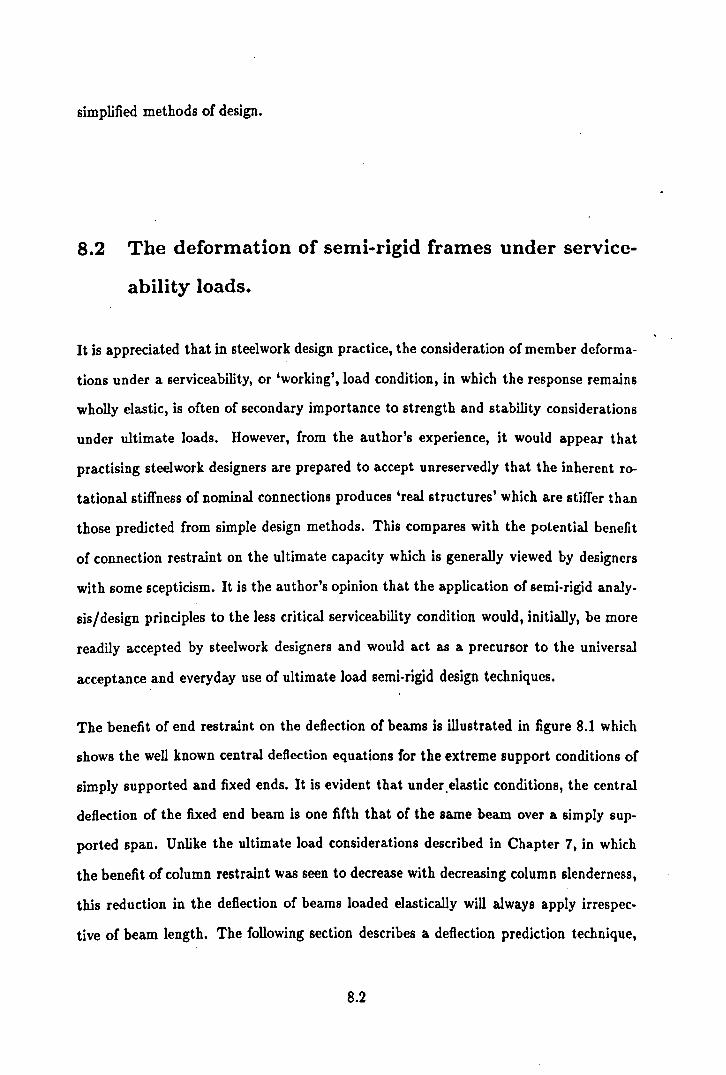
simplified methods of design.
8.2 The deformation of semi-rigid frames under service
ability loads.
It is appreciated that in steelwork design practice, the consideration of member deforma
tions under a serviceability, or 'working', load condition, in which the response remains
wholly elastic, is often of secondary importance to strength and stability considerations
under ultimate loads. However, from the author's experience, it would appear that
practising steelwork designers are prepared to accept unreservedly that the inherent ro
tational stiffness of nominal connections produces 'real structures' which are stiffer than
those predicted from simple design methods. This compares with the potential benefit
of connection restraint on the ultimate capacity which is generally viewed by designers
with some scepticism. It is the author's opinion that the application of semi-rigid analy
sis/design principles to the less critical serviceability condition would, initially, be more
readily accepted by steelwork designers and would act as a precursor to the universal
acceptance and everyday use of ultimate load semi-rigid design techniques.
The benefit of end restraint on the deflection of beams is illustrated in figure 8.1 which
shows the well known central deflection equations for the extreme support conditions of
simply supported and fixed ends. It is evident that under.elastic conditions, the central
deflection of the fixed end beam is one fifth that of the same beam over a simply sup
ported span. Unlike the ultimate load considerations described in Chapter 7, in which
the benefit of column restraint was seen to decrease with decreasing column slenderness,
this reduction in the deflection of beams loaded elastically will always apply irrespec
tive of beam length. The following section describes a deflection prediction technique,
8.2
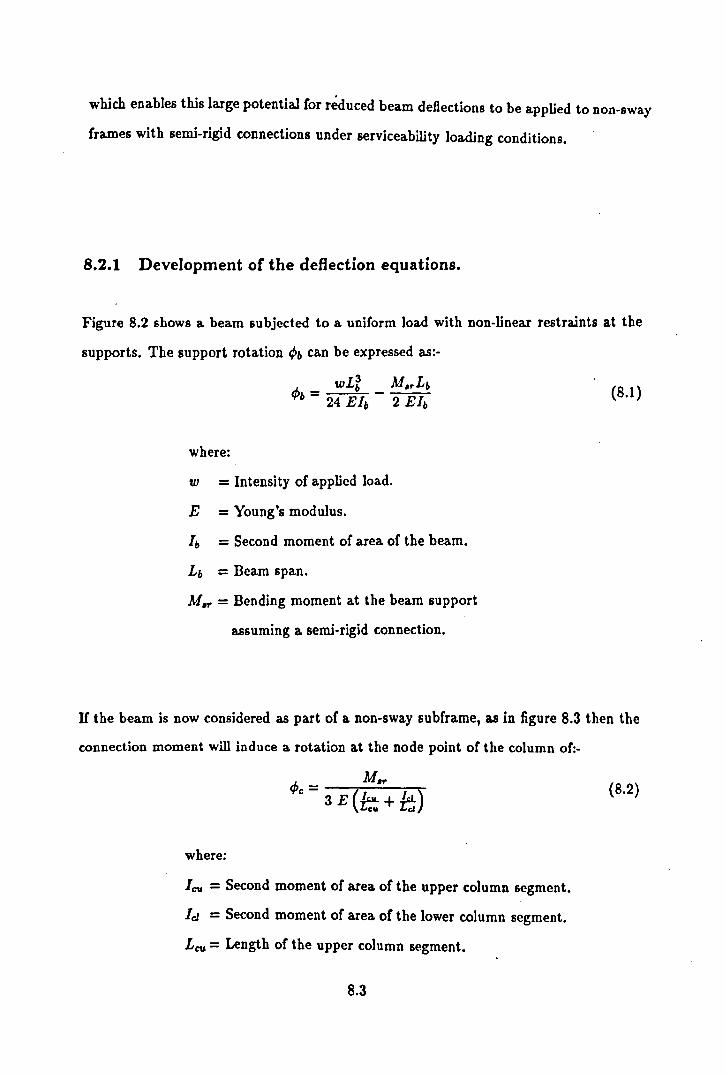
which enables this large potential for reduced beam deflections to be applied to non-sway
frames with semi-rigid connections under serviceability loading conditions.
8.2.1 Development or the deflection equations.
Figure 8.2 shows a beam subjected to a uniform load with non-linear restraints at the
supports. The support rotation tPb can be expressed as:-
4>b = wL: _ M.,.L" 24 BIb 2 EIb
where:
w = Intensity of applied load.
E = Young's modulus.
Ib = Second moment of area of the beam.
L" = Beam span.
M.,. = Bending moment at the beam support
assuming a semi-rigid connection.
(8.1)
If the beam is now considered as part of a non-sway subframe, as in figure 8.3 then the
connection moment will induce a rotation at the node point of the column of:-
where:
leu = Second moment of area of the upper column segment.
Id = Second moment of area of the lower column segment.
Leu = Length of the upper column segment.
8.3
(8.2)

Lcl = Length of the lower column segment.
If the upper and lower column segments are the same length and section size then this
equation reduces to:-.J.. _ M.,.Lc Y'c - 6 E1c (8.3)
It should be noted that the column node rotation has been derived assuming that the
remote ends of the column segments to be pinned. This will of course result in a lower
column stiffness than that of a column with more realistic boundary conditions, but will
produce a conservative over-estimation of the beam deformations.
The net rotation of the connection ( 4>b - 4>c) can therefore be expressed in terms of the
connection moment and the frame geometry:-
(8.4)
The linear relationship between connection moment and connection rotation in the above
equation has been plotted in figure B.4 as the frame response line. It evident from the
figure that when the connection moment is zero, equation B.4 intersects the abscissa at
a rotation equivalent to that of a simply supported beam, <P'Pin ' When the connection
rotation is zero, the equation intersects the ordinate at a value equivalent to the rigid
frame connection moment, Mrigirl.
As in beam line theory [B.1], the non-linear moment-rotation characteristics of a con
nection can be superimposed onto the plot as in figure 8.4. The intersection point of
the moment-rotation curve with the plot of equation B.4 represents the connection mo
ment and corresponding rotation which is compatible with the stiffness characteristics
of the beam and column members. By substituting this connection moment, M." into
equation 8.1 the support rotation, the distribution of bending moments and hence the
deflected shape of the beam shown in figure 8.3 can be determined. It is clear however,
8.4

that the inclusion of the non-linear characteristics of the connection in this approach is
not appropriate for 'everyday' design calculations.
Bjorhovde, in a recent appraisal of end restraint on column strength [8.2], stated that
the support rotations of simply supported beams of practical dimensions, subjected to
their maximum allowable uniform load, were generally less than 0.0092 radians. That
is:-
(8.5)
At this rotation, he proposed that there was only a small overestimation of the restraining
moment calculated using the linear initial tangent stiffness of the connection, Ci (figure
8.5) - the non-linear characteristics of typical connections only becoming significant at •
larger rotations. For a beam in a semi-rigid frame, the maximum connection rotation
under serviceability conditions will obviously be less than that of a similar beam acting
over a simple span. It suggests therefore that in this instance, in which serviceability
loading has been considered, the linear representation of the non-linear moment-rotation
connectio~ response will result in a more accurate assessment of connection moment than
that assumed by Bjorhovde.
From figure 8.6 the overestimation of the apparent connection moment, M;r, based
on the assumption of a linear connection stiffness, compared to the actual connection
moment, M,r is evident. It is interesting to note however that as the gradient oC the
plot of equation 8.4 becomes smaller, Le. long span beams connected to slender columns,
the overestimation of the connection moment reduces. This implies that certain frame
geometries will be relatively insensitive to the linear simplification of the non-linear
connection moment rotation response. It also suggests that, when applied to frames,
there is the potential for further re~uctions in the inaccuracies accepted by Bjorhovde
for the restraining moment due to semi-rigid connections.
8.5
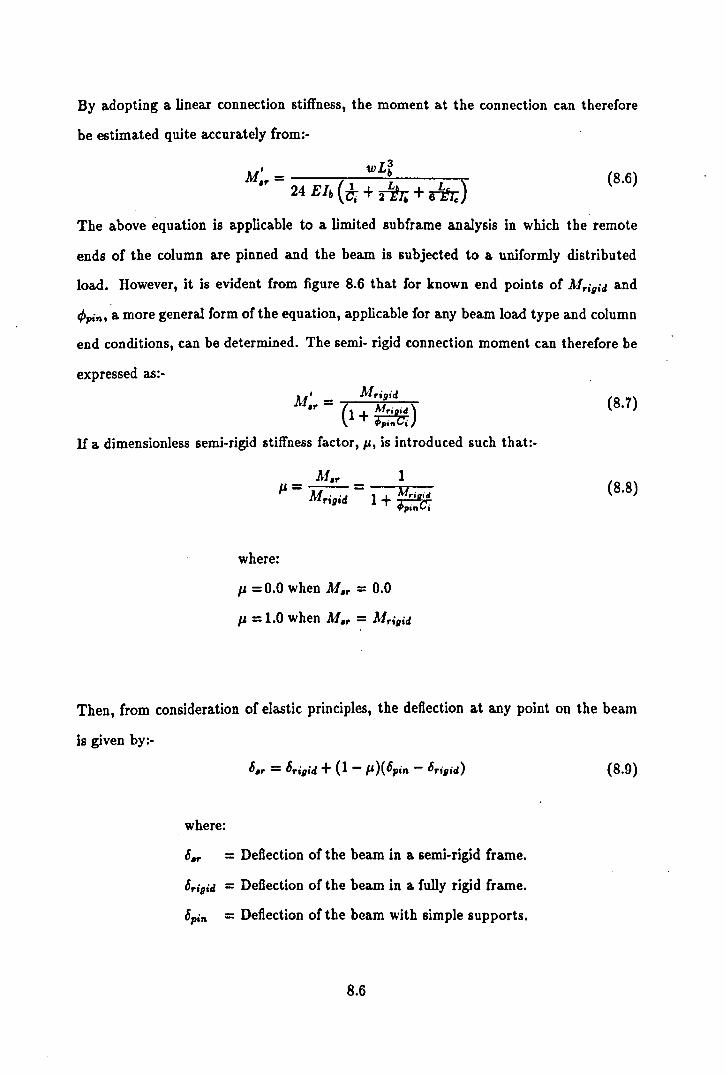
By adopting a linear connection stiffness, the moment at the connection can therefore
be estimated quite accurately from:-
M' _ wL: .,. - 24 Elb (t; + 21/. + ~) (8.6)
The above equation is applicable to a limited suhframe analysis in which the remote
ends of the column are pinned and the beam is subjected to a uniformly distributed
load. However, it is evident from figure 8.6 that for known end points of klrigid and
,ppi"" a more general form of the equation, applicable for any beam load type and column
end conditions, can be determined. The semi- rigid connection moment can therefore be
expressed as:-
J,l ' Mrigid
.r = (1 + rriI1C~) pen,
(8.7)
If a dimensionless semi-rigid stiffness factor, p, is introduced such that:-
M.r 1 1'- ---
- M,igid - 1 + rri,C" pin,
(8.8)
where:
I' = 0.0 when M.,. = 0.0
I' = 1.0 when M.r = Mrigid
Then, from consideration of elastic principles, the deflection at any point on the beam
is given by:-
where:
6.,. = Deflection of the beam in a semi-rigid frame.
6r igid = Deflection of the beam in a fully rigid frame.
6pin = Deflection of the beam with simple supports.
8.6
(8.9)
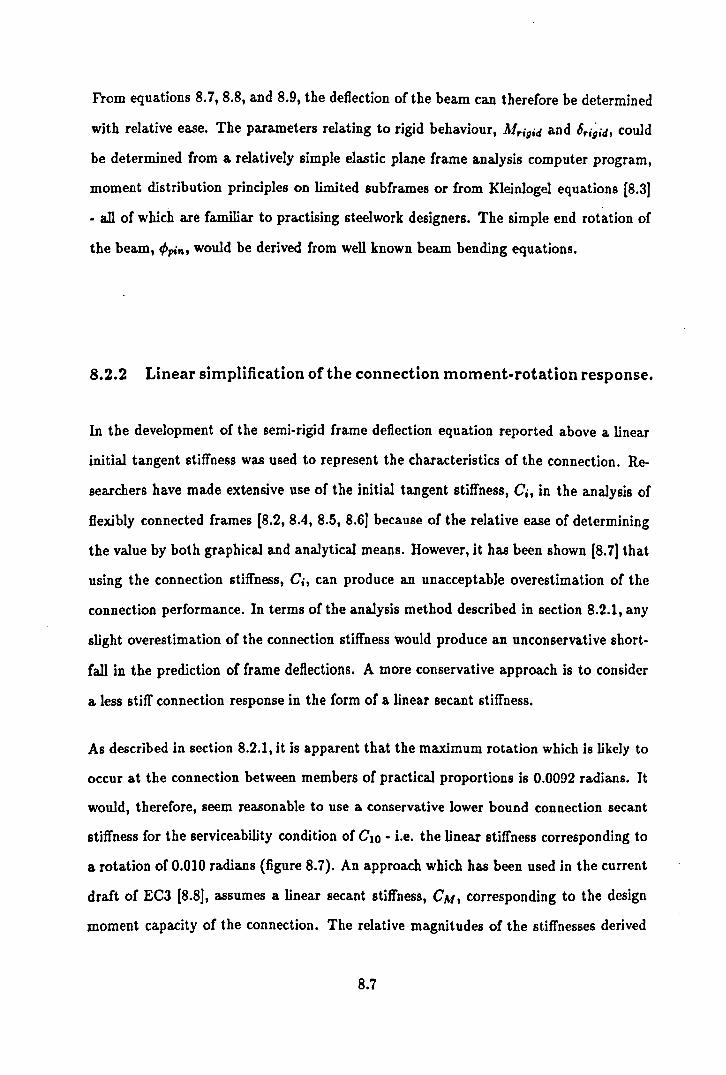
From equations 8.7, 8.8, and 8.9, the deflection of the beam can therefore be determined
with relative ease. The parameters relating to rigid behaviour, Mrigid and 6r i;id, could
be determined from a. relatively simple elastic plane frame analysis computer program,
moment distribution principles on limited subframes or from Kleinlogel equations [8.3]
- all of which are familiar to practising steelwork designers. The simple end rotation of
the beam, <Ppin, would be derived from well known beam bending equations.
8.2.2 Linear simplification of the connection moment-rotation response.
In the development of the semi-rigid frame deflection equation reported above a linear
initial tangent stiffness was used to represent the characteristics of the connection. Re
searchers have made extensive use of the initial tangent stiffness, Ci, in the analysis of
flexibly connected frames [8.2, 8.4, 8.5, 8.6] because of the relative ease of determining
the value by both graphical and analytical means. However, it has been shown [8.7] that
using the connection stiffness, Ci, can produce an unacceptable overestimation of the
connection performance. In terms of the analysis method described in section 8.2.1, any
slight overestimation of the connection stiffness would produce an un conservative short
fall in the prediction of frame deflections. A more conservative approach is to consider
a. less stiff connection response in the form of a linear secant stiffness.
As described in section 8.2.1, it is apparent that the maximum rotation which is likely to
occur at the connection between members of practical proportions is 0.0092 radians. It
would, therefore, seem reasonable to use a conservative lower bound connection secant
stiffness for the serviceability condition of Clo - i.e. the linear stiffness corresponding to
a. rotation of 0.010 radians (figure 8.7). An approach which has been used in the current
draft of Ee3 [8.8], assumes a. linear secant stiffness, CM, corresponding to the design
moment capacity of the connection. The relative magnitudes of the stiffnesses derived
8.7

using these two techniques would of course depend on the nature of the connection. For
a very stiff connection, it is likely that the moment capacity would be achieved at a
rotation less than 0.010 radians. However, for a moderately stiff connection to a flexible
column web panel, the deformation dependent CIO secant stiffness will be close to the
initial tangent stiffness and the reverse may well be true.
An alternative linear representation of connection stiffness has been proposed by Barakat
and Chen [8.7] for use in a simplified method of semi-rigid frame analysis. They propose
a linear secant stiffness, Cko, corresponding to the rotation of the connection, <Po, at the
intersection point of the initial tangent stiffness, Ci, with the ultimate moment capacity
of the connection. The procedure is illustrated in figure 8.8.
It is clear that there are a number of different ways of producing a linear stiffness 'equiv
alent' to the non-linear connection response. It would suggest therefore that this is an
area which warrants further research to determine a single universally accepted linear
representation of connection stiffness which is appropriate for design under serviceabil
ity and ultimate load conditions. In terms of the serviceability condition, this could be
achieved by conducting a parametric study using a non-linear semi-rigid frame analysis
program [8.9] to investigate the size of connection rotations for a range of practical beam
and column sizes under 'working' loads. The aim would be to 'add more weight' to the
maximum rotation proposed by Bjorhovde, on which the linear stiffness ClO was based,
and to quantify the limits of application.
8.2.3 Validation of the semi-rigid frame deflection equations.
This section presents a comparison of the predicted deformations from the equations
reported in section 8.2.1 with the observed deflections of the full scale frame test F1
reported in chapter 5. Figure 8.9 shows the arrangement of the test frame indicating the
8.8
particular increment of beam loading which closely approximated to the serviceability
limit· state assuming simple beam spans, i.e.
where:
Wult W,er" = 1.5
W,er" = Serviceability load.
Wult = Ultimate design load.
(8.10)
The observed experimental deflection measurements at this particular load increment
were used throughout the comparative study. An elastic plane frame analysis computer
program was used to determine the bending moments and deflections of the same frame
with fully rigid connections subjected to the same loading conditions. Table 8.1 presents
a summary of the measured experimental semi-rigid moments and the calculated fully
rigid moments at each of the joints on the frame.
The predicted semi-rigid frame deflections were calculated assuming the range of differ
ent linear connection stiffnesses introduced in section 8.2.2. namely the initial tangent
stiffness (Ci), the secant stiffness at a rotation of 0.010 radians (CIO ), the secant stiffness
corresponding with the design moment of the connection (CM) and that proposed by
Barakat and Chen (Cleo). In each case, the stiffnesses were determined from the mea
sured moment-rotation plots of the individual frame connections reported in Chapter 6.
A design moment of 21. 75 kN.m for the 12mm thick end-plate connection, extracted from
reference 8.10, was used in determining the CM secant stiffness. The ultimate moment
capacities Mult of the connections, used to determine Cleo, were those observed in the
isolated connection tests reported in Chapter 6.
Table 8.2 contains a summary of the different linear connection stiffnesses whilst table
8.3 presents a summary of the predicted semi-rigid connection moments calculated using
equation 8.7 and the corresponding 'p' factors from equation 8.8. I~ should be noted that,
8.9

due to a faulty rotation measurement device, the experimental moment-rotation data for
joint'!' is not available. It has therefore been assumed that the measured stiffness of
this particular connection is equal to that of joint 'c' - a geometrically similar connection
arrangement subjected to a similar disturbing moment. In addition, the ultimate design
connection moment of 21.75 kN .m. was only achieved at joint 'j' of those nodes on the
external columns. As a result, the CM secant connection stiffness for the remaining
external column connections, '1', 'e' and 'c', was assumed equal to that of joint 'j'.
An appraisal of the data in table 8.2 shows that, as discussed in chapter 6, there is a large
difference between the stiffness of connections located on the minor axis of internal and
external columns. This was attributed to the effects of beam continuity and column web
flexibility as have been discussed in chapter 6. In addition, it also appears that large
differences can occur between the stiffness of nominally similar connection types with
the same beam and column arrangement (e.g. joint 'd' and joint 'f'). However, what is
perhaps of most significance is that whilst the initial tangent stiffness, Ci, of joint 'd' is
600% larger than the secant stiffness, Clo, for the same connection and moment-rotation
response, the resulting '1" factor, and hence semi-rigid connection moment (table 8.3),
is only 13% larger. It would appear therefore that this particular frame is relatively
insensitive to large variations in the assumed linear stiffness of the beam to column
connections - the most difficult parameter to determine accurately.
Due to the obvious difference in the nature and response of connections at either end of
the primary beams in this particular frame, an average '1" factor has been derived for
each beam (table 8.4). The factor Pove is effectively the numerical mean of the two 'I' '
factors at the beam supports. Table 8.5 presents a summary of the predicted semi-rigid
frame mid-beam deflections, calculated using equation 8.9 and the data in table 8.4, for
each of the four different linear connection stiffnesses. The simply supported span, rigid
frame and actual experimental mid-beam deflections are also presented in the table for
comparison. Table 8.6 presents a direct comparison between the predicted semi-rigid
deflections and those measured in the full scale frame test, whilst table 8.7 compares the
8.10

predicted deflections with those calculated assuming simple beam supports.
It is evident from tables 8.S and 8.6 that the predicted semi-rigid deflections compare
favourably with those observed in the experimental frame test. As expected, there is a
very close agreement when an initial linear stiffness, Ci, is assumed, with only a small
under estimation of deflection on two of the four primary beams. Using the lower bound
linear secant stiffness, CIO, all the predicted deflections are higher than actual, however
the correlation is still reasonably close. In all cases, the predicted deflection of beam
B8 produced the largest discrepancy. It should be noted however that the applied load
to this particular beam produced very small deflections and that, in the absence of
experimental data, an assumed moment-rotation response had been used for joint '1'.
The deflections predicted using the CM linear secant stiffness are close to those obtained
using a ClO stiffness. As discussed in chapter 6, beam continuity negated the effect of
column web flexibility thus producing a stiff connection with the internal column. At
this location therefore, the CM stiffness was significantly larger than the deformation
dependent stiffness Clo. At the opposite end of the beam, where continuity effects were
not present, the CM stiffness was smaller than Clo. These two reverse trends cancelled
out when the factor 'Pa.ve' was determined, thereby predicting similar deflections. Table
8.7 shows that even by adopting a conservative estimation of the linear secant connection
stiffness, there is a significant reduction ,in the predicted deflections compared with those
derived from simple calculations. Using a linear secant stiffness, Clo, the minimum
improvement resulted in a 39% reduction of the deflection of the corresponding simply
supported beam.
It is the author's opinion that the close correlation which has been achieved with the
experimental data from the full-scale frame test verifies the ability of the proposed ser
viceability design/analysis technique to accurately predict the deflections of beams in
semi-rigid, non-sway frames. In addition, the apparent insensitivity of the technique to
variations in the selection of the linear connection stiffness suggests that it is a method
8.11

suitable for use in practical steelwork design.
8.2.4 Summary of the serviceability design technique.
This section presents a brief summary of the principal steps involved in carrying out the
above serviceability check.
1. Determine the serviceability loading (l.0G Ie + 1.0Q Ie)
2. Perform a linear elastic analysis of the frame assuming fully rigid joints (mem
ber sizes having been determined from an ultimate load design).
3. Assuming a similar connection type throughout, extract the rigid central de
flections, 6r igid, and rigid connection moments, Mrigid, for a critical 'internal'
beam and an 'end-bay' beam.
4. Determine the end rotations of the two beam types assuming simple supports,
q,pin'
5. Use an appropriate linear connection stiffness, C, and equation 8.7 to deter
mine the semi-rigid connection moments, M;r'
6. Determine the P.Atle factor for the two beams from equation 8.8. and use equa
tion 8.9 to determine the central deflection of the beams.
8.12

In the validation of the method described in section 8.2.3, it was necessary to derive an
average I' factor because of the dramatic difference in the moment-rotation response of
connections to the minor axis of internal and external columns. Where beams frame
into the major column axis, in which the same connection produces a similar moment
rotation response irrespective of presence of beam continuity, it is proposed that a single
I' factor from anyone joint would be applicable throughout the whole frame. This would
result in a substantial simplification of the technique. The author suggests that the
analysis technique, together with this proposal, should be validated, by others, against
the experimental data from the second frame test F2 (Chapter 6), in which the primary
beams were connected to the major column axis.
8.2.5 The potential benefits of predicting reduced deflections.
In the current British steelwork design code [8.11], the maximum permissible deflection of
beams, when subjected to live loading only, is limited to span/360. Therefore, for a given
beam type, there is a particular combination of applied load and beam span for which
the above deflection restriction is more critical than ultimate strength considerations.
This is particularly common in the case of long span beams supporting relatively light
roof coverings where there is a high ratio of live to dead loading. Figure 8.10 shows a
plot of the maximum permissible simple beam spans which satisfy both the strength and
deflection requirements in BS5950: Part 1 [8.11] for two grade 43 steel beams subjected
to different characteristic loads. The shaded zones on the plot represent the combinations
of load and beam span which satisfy the strength requirements, but which exceed those
for deflection. It should be noted that if higher material strengths had been considered,
e.g. grade 50, these shaded zones would have been more extensive. Clearly, adopting
a method of deflection prediction which incorporates the beneficial effects of semi-rigid
joint action would produce economies for structural arrangements situated within these
8.13
zones. For the particular member sizes and live load ratio which have been considered,
the transition from strength to deflection control occurs at a relatively large span to
depth ratio of 25. However, in situations where the live load ratio was significantly
larger, this transition point would occur at a much reduced span to depth ratio.
One other area where the inclusion of semi-rigid joint characteristics would produce
economies is in the field of composite construction. Experimental studies have shown
that the action of the concrete floor slab causes a dramatic increase in the connection
stiffness compared with that ofthe bare steel frame [S.12]. This suggests that restrictions
on the deflection of composite beams in frames could be relaxed and thus make more
effective use of the potentially large resistance moments. Accurate prediction of the
actual deflections of bare steel frames could have significant cost benefits when applied
to composite frames during the construction stage. In certain circumstances of large
spans, prudent use of the bare steel connection stiffness in the deflection prediction
could alleviate the need for propping during the concreting operation [S.13].
It is hoped that the possible economies discussed above could be explored by others to
assess the feasibility of the deflection prediction method for use in practical steelwork
design. Whatever economies are shown to be possible, it is the author's belief that rei·
atively simple analytical tools should be available to practising steelwork designers to
enable a more accurate, and confident, prediction of 'real frame' behaviour.
8.3 The ultimate design strength of beam-columns.
Previous research into the analysis and design of semi-rigid frames has concentrated al·
most entirely on the ability to predict the behaviour under ultimate loads. This section
of the thesis contains a brief review of design methods, past and present, for both re-
S.14

strained and unrestrained beam-columns and includes the author's proposals for possible
future developments. For a comprehensive historical review of past research in ihis area,
the discerning reader should consult references 8.14 and 8.15.
8.3.1 The beam-column problem.
The loading conditions on beam-column members with open sections can be categorised
into three separate cases (figure 8.11):-
1. With the thrust applied eccentric to the minor axis (or if eccentric to the
major axis, then the column is prevented from deflecting out of this plane
by appropriate bracing), in which case the member will collapse by excessive
deformation in this plane.
2. The thrust is applied with an eccentricity about the major axis, in which case
the column will collapse by deflecting in the minor axis and twisting (i.e.,
similar to lateral-torsional beam buckling).
3. The thrust is applied with an eccentricity about both axes, in which
case the member will collapse by biaxial bending and twisting.
Case 1 represents an interaction between column buckling and simple uniaxial beam
bending, case 2 represents an interaction between column buckling and beam buckling
whilst case 3 represents the interaction of column buckling and biaxial beam bending.
Clearly case 3 represents the more general case, with the other cases being more limited
versions.
8.15

The magnitude of the actions applied to beam-columns, P, M~ and M", can be expressed
conveniently as a single point on a thee-dimensional interaction diagram. Likewise,
the combinations of loading which meet the failure criteria can also be expressed as
a series of points on the diagram in the form of an interaction failure surface (figure
8.12). Clearly combinations of loading which fall outside the appropriate interaction
surface will result in an unsafe column design. In the case of a stocky member, in which
instability phenomena are not present, the limiting load components are dictated by
material strength considerations. The end points of the interaction surface for stocky
columns are therefore well defined. However, depending on the geometrical properties,
unbraced length and support conditions, the end points ofthe interaction for more slender
columns will fall short of those dictated by material yield. The problem is therefore to
define the end points of the appropriate interaction surface and to take due account of
the effects of residual stress, member imperfections and variation in material properties
which will have a direct influence on the concavity or convexity of the interaction surface.
The general form of the interaction surface can be expressed as:-
(8.11)
Equations of this type represent by far the most common method of beam-column design
specified in international steelwork design codes. The author has therefore presented a
brief overview of the development of explicit forms of this equation which are widely
used in North American design practice.
8.16

8.3.2 The development of interaction equations.
A starting point for many design equations considers the uniaxial bending condition
(case 1 in section 8.3.1) with interaction being of the form:-
where:
P = Axial thrust at failure.
Pu = Ultimate load for a centrally loaded column for
buckling in the plane of the applied load.
M = Maximum bending moment at failure.
Mu = Ultimate moment capacity in the absence of axial load.
(8.12)
The value of M can be taken as the maximum primary moment for the case of a stocky
column. However, the maximum moment in the case of slender columns will be dependent
on the applied primary moment and secondary effects due to member deformation (figure
8.13). To take account ohhis effect, the maximum moment at the mid-height of a column
subjected to an axial load, P, and equal and opposite end moments, Mo , can be expressed
approximately by [8.16]:-
ltfmo.z = Mo ( 1 P ) 1 - r-
(8.13)
in which Pe is the elastic critical load of the member. Substituting into equation 8.12
gives the design formula
(8.14)
which was first recommended by the S.S.R.C. and which has been included in several
codes. A direct comparison ofthis equation and the early numerical studies by Galambos
and Ketter [8.17] is presented in reference 8.18. Comparisons based on more recent
numerical studies are presented in reference [8.19].
8.17
Equation S.14 was considered to be unduly conservative in instances where the member
was in double curvature. The equation was therefore refined to take account of unequal
end moments and/or transverse loading between the points of support in the plane of
bending. The maximum value of end moment }.Io was replaced by an equivalent uniform
moment Meq given by:-
(S.15)
Studies of the in-plane problem [S.15, 8.20] and the lateral torsional buckling problem
[8.21], have shown that a simple and reasonably accurate correlation results if Cm is
given by:-
Cm = 0.6 + 0.4,8 ~ 0.4 . (S.16)
where:
f3 = the ratio of the smaller end moments to the larger.
(-:-1.0 ~ ,8 ~ +1.0)
This led to the modified design form of interaction equation 8.14:-
(8.17)
Work by a number of researchers [S.15, S.21, 8.22] on the effects of lateral- torsional
buckling on the strength of members loaded about the strong axis of bending, case 2 in
section 8.3.1, resulted in an expression for the elastic critical load of:-
where:
ME = Elastic critical moment for lateral-torsional buckling.
Pell = Elastic critical load for minor axis flexural buckling.
Pf> = Elastic critical load for pure torsional buckling.
8.18
(8.18)

This led to the general design equation:-
where:
P = Applied load.
PUII = Axial load producing failure in the absence
of bending moment, computed for weak axis
bending.
Mo = Maximum applied first order moment.
Mil. = Moment producing failure in the absence of
axial load, allowing for lateral torsional
buckling.
em = Moment reduction factor.
(8.19)
This equation is of a similar form to that of equation 8.17, which deals with member
deformation in the plane of the applied moment. However, the terms in the denomi
nator now take account of the out-of-plane effects. Comparisons of equation 8.19 with
numerical data have been performed by Vinnakota [8.23].
Equations 8.17 and 8.19 are special cases of the more general beam-column problem,
case 3 in section 8.3.1. It has been shown that these two particular equations provide
good descriptions of the P - M" and P - Mz interaction for'!' and 'H' sections. It was
suggested that the general case can be derived from an empirical combination of these
two equations to give:-
(8.20)
It should be noted that under the appropriate loading conditions, this equation reduces
to the uniaxial bending equations presented above (eqns. 8.17 and 8.19). This particular
formula is that currently used in North American design practice and forms the basis of
8.19

many commonly used biaxial interaction design equations in other international design
codes. However, comparisons with numerical studies by Chen and Atsuta [8.15] 'as shown
in figure 8.14 have demonstrated that due to the convex nature of the true interaction,
equation 8.20 is highly conservative under certain loading conditions. Based on his work
on the behaviour of short columns, Tebedge [8.24] proposed that the following non-linear
expression could be applied to intermediate and slender columns:-
where:
Mucz = Ultimate moment capacity from eqn. 8.19
MuCfl = Ultimate moment capacity from eqn. 8.17
fJ = Factor depending on BID ratio of section.
(8.21)
A quantitative assessment of the accuracy of equations 8.20 and 8.21 was performed
by Pillai [8.25] on experimental data from tests by Birnsteil [8.26], Chubkin [8.27] and
Kloppel and Winkelmann [8.28]. He concluded that equation 8.21 was an almost perfect
predictor in terms of the mean value for p'e.t! PC4/C of 1.05. However, with a standard
deviation of 0.101, this meant that 31% of the results were overpredicted, i.e. unsafe.
8.3.3 The interaction equations in BS 5950: Part 1.
The British Steelwork Design Code, BS5950: Part 1 [8.11], uses the following interaction
equations in clause 4.8.3.3.1 for the buckling criteria of beam- columns.
(8.22)
8.20

mzMz + mllMII < 1.0 Maz M all --
(8.23)
where:
F = Applied axial load.
py = Design strength of the material.
Mb = Buckling resistance moment.
mz,1I = Equivalent uniform moment factor.
Ag = Gross cross-sectional area.
ZII = Minor axis elastic section modulus.
Maz = Maximum buckling moment about the major axis
in the presence of axial load.
M(JII = Maximum buckling moment about the minor axis
in the presence of axial load.
Equation 8.22, which is of a similar format to equation 8.20 in the above section, has
been developed specifically as a simple design method. In instances where significant
moments are applied, a less conservative solution requiring more design effort can be
derived from equation 8.23, the so called 'more exact approach'.
8.3.4 The application of interaction equations to steel frame design in
BS 5950: Part 1.
The interaction equations described above have been derived, and subsequently verified,
by considering known end forces and end conditions on isolated structural elements. This
is of course an idealistic simplification as beam- columns are, in re~ty, component parts
8.21

of real structures in which the forces and end conditions are dictated by interconnecting
members. However, there are approximate methods within BS 5950 for incorporating
frame response characteristics into isolated member design.
For multi-storey non-sway frames designed using the 'simple design' technique in BS
5950, in which the connections are assumed to act as true pins, the moment applied to
the column is derived by considering the vertical end reaction of interconnecting beams
acting at an eccentricity of 100mm from the column °face, or at the centre of stiff bearing
- whichever is the greater. Recent experimental studies of two-dimensional steel frame
behaviour [8.10] have shown this eccentricity, which has a value of 100mm irrespective of
connection type, beam size or frame configuration, to be grossly in error. Despite this,
and the lack of a theoretical background to the method, it remains today one of the most
commonly used methods of determining the column moments in simple frames since it
was first introduced in the 1930's.
In BS 5950, the rotational restraint which is present at the ends of column segments due
to the stiffness of adjoining members, is catered for in isolated column design by use of
the effective length concept. By using appropriate effective length factors, the length of
an equivalent pinned-end column can be determined which has the same critical load as
the full height restrained column. For non-sway frames with positive end restraint, the
effective length factor is usually less than unity. Use of the 'standard' cases for known
end conditions in clause 4.7.2 of the code results in effective length factors which are
typically in the range 0.8 to 1.0. This has a direct effect on the design column capacity
by increasing the ultimate axial capacity, P", and where restraint to lateral-torsional
buckling is present, the buckling resistance moment, Mb, both of which are terms in the
denominator of the interaction equation (eqn. 8.22).
The effective length concept, which has its origins in the work carried out by Euler in
the eighteenth century, has formed the basis of strut design for many years. However,
the selection of appropriate effective length factors is very much based on the intuition,
8.22
and in some instances courage, of the individual engineer, particularly in the case of
non-standard structural arrangements. This compares with the more exact approach
given in appendix E of BS5950 for determining the effective lengths of columns in rigid
frames. Here, the total restraint at the upper and lower ends of a column, derived from
consideration of the adjoining members, are used to derive the column's critical load
(effective length ratio) from alignment charts.
8.3.5 Beam-column design allowing for semi-rigid connection response.
The recently superseded British Standard for steelwork design, BS 449 Part 1 [8.29],
permitted the use of semi-rigid design principles. A detailed description of the technique
was issued as supplement No. 1 to the code, denoted as document PD 3343, and was
effectively a re-print of reference 8.30. The method included the use of design charts
derived from the moment-rotation response of four classes of simple connection A, B, C
and D.1t is interesting to note that the stiffnesses of these four classes of connection were
assumed to be directly proportional to the beam depth. This enabled a prediction of the
connection response for beam depths which fell outside the bounds of the limited experi
mental work on which the standard curves were based. Using the appropriate charts the
beam support moments, and hence the reduced span moments, could be determined with
rela.tive ease. Columns were then designed to resist the out-of-balance beam moments
at anyone level, in addition to those moments resulting from the eccentricity of beam
reaction. However, to prevent potentially large moments being assumed in the column
design, which would result in significant increases in the weight of column steel, the beam
restraint moments were restricted to 10% of the free bending moment.
In BS 5950, the current version of the code, a simplified method of semi-rigid design
is stated by which 10% of the free beam bending moment can be transferred, via the
8.23

connection, to the column. However, in this latest version, the guidance on 'standard'
connection response has been omitted. Instead, the onus is now placed on the designer
to ensure that the connection is capable of withstanding the transferred moment.
Whilst the above methods incorporate the beneficial distributions of bending moments
associated with semi-rigid connection behaviour, guidance on the beneficial effects on
column stability is clearly limited. In addition, the methods do not appear to take
into account the frame, or subframe, geometry. Using such methods, caution should be
exercised when designing long span beams supported on slender columns as the moment
transferred through a fully rigid connection may well be less than 10% of the free beam
bending moment.
The problem of developing a simplified design method which incorporates the beneficial
effects of semi-rigid connection behaviour on column stability, was addressed by Lui and
Chen [8.31]. Based on the results from tests on 83 isolated end restrained columns, they
proposed that the effective length of a column member could be expressed as:-
Le = k L
where:
k = 1.000 - 0.017 a (for a < 23)
k = 0.600 (for a > 23)
and
a - C -1JP;
M"c = Plastic moment capacity of the column.
C = Linear connection stiffness.
(8.24)
For design purposes, the researchers then suggested a simpler and more conservative
approach by recommending fixed k values that depended on the axis of bending as well
as the column slenderness. Although a reasonable assumption, the suggested k values,
8.24
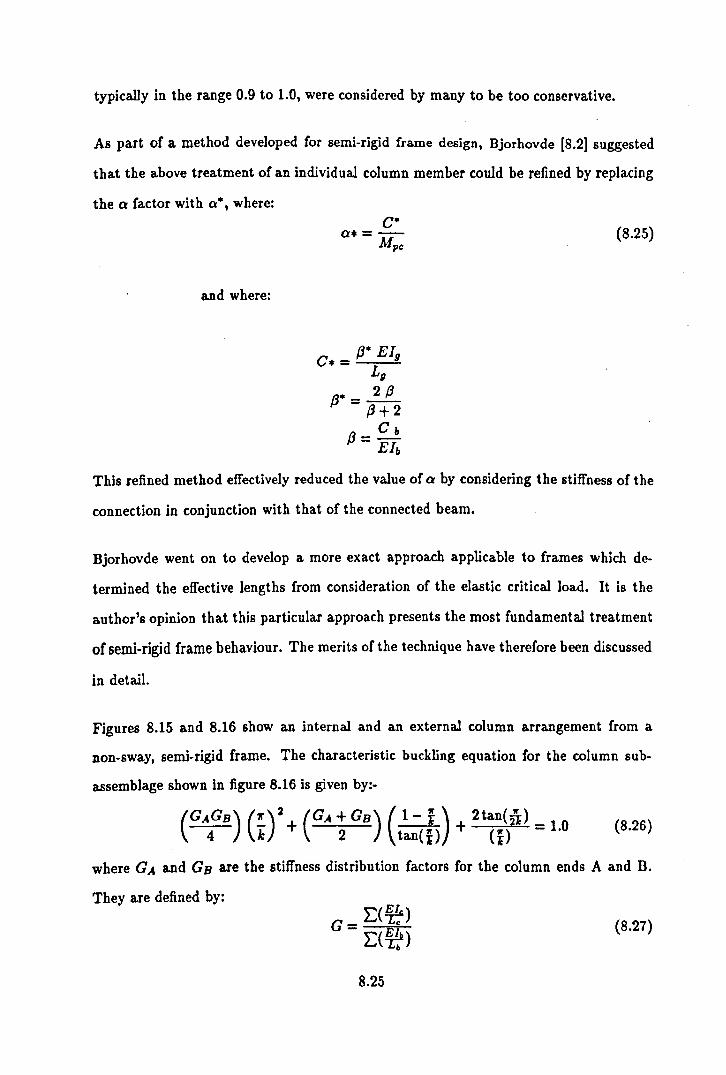
typically in the range 0.9 to 1.0, were considered by many to be too conservative.
As part of a method developed for semi-rigid frame design, Bjorhovde [8.2] suggested
that the above treatment of an individual column member could be refined by replacing
the 0 factor with 0*, where:
(8.25)
and where:
This refined method effectively reduced the value of 0 by considering the stiffness of the
connection in conjunction with that of the connected beam.
Bjorhovde went on to develop a more exact approach applicable to frames which de
termined the effective lengths from consideration of the elastic critical load. It is the
author's opinion that this particular approach presents the most fundamental treatment
of semi-rigid frame behaviour. The merits of the technique have therefore been discussed
in detail.
Figures 8.15 and 8.16 show an internal and an external column arrangement from a
non-sway, semi-rigid frame. The characteristic buckling equation for the column sub
assemblage shown in figure 8.16 is given by:-
(GAGB) (~)2 + (GA + GB) ( 1- f) 2tan(jlJ _ 10
4 k 2 tan( I ) + ( I ) -. (8.26)
where GA and GB are the stiffness distribution factors for the column ends A and B.
They are defined by:
(8.27)
8.25
G therefore expresses the relative stiffness of the columns with respect to the beams at a
particular node point. A higher value of G reflects the reduced rotational restraint at a
column node point from smaller, less stiff, beams. To take account of the end-restraint
from semi-rigid connections, the modified restrained distribution factor is given by:
. E(¥) G = e (8.28) C·
5 The value of C·, defined in equation 8.2e, effectively reduces the total stiffness of the
beams by including the stiffness characteristics of the connection.
In the case of the interior column (figure 8.15), the moment-rotation plots for the two
connections on either side of the column at the same level are shown in figure 8.17. As
the column fails by buckling, one of the connections will continue to 'close', whilst the
adjacent connection on the opposite side of the column will start to 'open'. It is clear
that the tangent stiffness of the closing connection (Cc) will be significantly less than the
stiffness of the unloading connection (Cu ). Bjorhovde assumed that the total restraint at
the column node was that due solely to the unloading connection, conservatively ignoring
any contribution from the 'closing' connection. In terms of the external column, this
assumption meant that the total restraint at the base of the column shown in figure 8.16
was taken as zero.
Having determined the appropriate reduced distribution factors for the particular sub
assemblage arrangement, the column effective length factors were determined from align
ment charts, similar to those in appendix E of BS 5950: Part 1. Preliminary calculations
by Bjorhovde have shown that by using this technique, there was the potential saving of
15%-20% in the weight of materials.
Whilst the above technique presents an in-depth appraisal of column stability, Bjorhovde
makes no mention of the effect of bending moments resulting from semi-rigid joint ac
tion. Recently however, Barakat and Chen [8.7] proposed a practical method of semi-rigid
frame analysis which combined the appraisal of column stability by Bjorhovde with a
linear elastic frame analysis to determine the distribution of design column moments.
8.26
The linear connection stiffness used in the linear elastic model, C"o, was a conservative
modification of the initial tangent stiffness, Ci, which takes into account the' ultimate
moment capacity of the section. This particular linear approximation of connection re
sponse was introduced in section 8.2.2. Comparisons with 'exact' second order numerical
studies had shown that the assumed linear connection stiffness, C"o, gave a very close
prediction of the semi-rigid frame bending moments.
The method proposed by Barakat and Chen required the use of a linear elastic computer
program which had the facility for including the linear stiffness response of the connec
tions. Although computer software with this facility is becoming increasingly popular, it
is not at present widely available in this country. As an alternative, the computer anal
ysis could be replaced by the method developed by the author for serviceability design
described in section 8.2.3. Using this approach the semi-rigid frame moments can be
determined from a more widely available simple rigid frame analysis computer program
or, alternatively, from conventional rigid subframe manual computation techniques. The
design sequence could therefore be summarised as follows:-
1. Determine the ultimate loading on the frame.
2. Assume appropriate member sizes, i.e. as in rigid frame design.
3. Assume an appropriate linear connection stiffness, e.g. CM, C"o'
4. Perform an elastic frame analysis using the method described in section 8.2.3
to determine the distribution of semi-rigid moments.
5. Determine the distribution factors (G factors) at the upper and lower ends
of the column including the contribution from the linear connection stiffness.
These can be conveniently derived from the linear elastic analysis. e.g.
8.27
a* - L(e) - LJl· (e>
or, for use in the alignment charts in BS 5950,
K* - E(e) - Ep· (~) + E(e)
(Note that Jl.lb/ Lb is the stiffness of one beam only,
the less stiff of the two on either side of an interior column)
(8.29)
(8.30)
7. From alignment charts, determine the critical load (effective length) of the
column.
8. Check the adequacy of the column using the appropriate interaction formula.
9. Divide the semi-rigid frame moments by 1.5 and perform a serviceability beam
deflection check using eqn. 8.9.
In the above procedure the effect of the out-of-plane, secondary beam, moments is only
taken into account at the end of the design process when the different components in
the interaction equation are summed. The assumption is, therefore, that the out-of
plane moments have no effect on the in-plane stiffness of the frame. One other major
simplification, common to all methods which rely on the use of alignment charts, is
that the restraint factors, K and a, are based on the elastic stiffness of the members
intersecting at a column node. It should be noted however that at the point of ultimate
load, the individual member stiffnesses will be significantly different due to the presence
of plastic zones.
Appendix C contains a set of 'hand' calculations which were performed using this method
to predict the ultimate capacity of the lower column C6/0-1 in frame test Fl (Chapter
8.28

5). The ultimate column capacities were derived by considering both the 'simplified'
(pages C1 to C5) and the 'more exact' (pages C6 and C7) interaction equations in
BS5950 Part 1. The linear connection stiffness assumed in the derivation of the semi-
rigid connection moments, Cleo, is that proposed by Chen as discussed in section 8.2.2.
This same stiffness has been used to derive the column restraint in the calculation of the
critical load (effective length factors) from the alignment charts. It is appreciated that
when considering column stability, the unloading stiffness of the connection (C" = Ci),
as proposed by Bjorhovde would be more appropriate. However, it is quite probable that
the increased design effort, and confusion, involved in considering two different stiffnesses
for the same connection, i.e. one for moment distribution and one for stability, could not
be justified.
The connection stiffnesses used in the 'hand' calculation were those determined directly
from the plots of the measured experimental moment- rotation response. The aim was to
achieve the closest possible correlation with the observed experimental frame behaviour.
However, to comply with the findings reported in chapter 6, the connection stiffnesses .
. used in the design process must be those derived from a cantilever type connection test,
or those from a cruciform test which have been modified to take account of the column
web flexibility effects.
It is evident from the calculations in Appendix C that the design process produces a rea
sonable approximation to the semi-rigid frame moments. Although the ultimate capacity
is underestimated when using both the 'simplified' and the 'more exact' interaction equa
tions, the P,ut/ Pile. ratio is significantly smaller than those in section 8.3.7 where the
simplified method of assessing the effective length has been used. It should be noted that
the similarity in the predicted ultimate load using the 'simplified' approach (567kN) and
the 'more exact' approach (570kN) is due to the increased conservatism of the 'more
exact' appfJach when the disturbing moments are small· as in this instance.
Perhaps the most significant aspect of the calculation is that the effective length factor
8.29

for the column appears to be 0.56. This is significantly less than that which would be
inferred from the basic guidance on standard effective length factors given in the code.
Despite the fact that the column minor axis was restrained on one side only, and a 47%
reduction in beam stiffness had been applied to take account of the connection stiffness,
the K2 factor for the column top was relatively low with a value of 0.28. From the
alignment charts it is evident that even if the base of the column had been pinned, Kl
= 1.0, then the effective length factor would have been 0.76. This compares with the
suggested value of 0.7 in the code when both ends of the column are fully restrained in
direction.
It is appreciated that the highly conservative 'standard' values of effective length factors
stated in the code were chosen to reflect the difficulty of achieving a fully rigid, infinitely
stiff, end condition in practice. However, as suggested from the alignment chart, and as
observed in the parametric study performed to investigate column base stiffness (chapter
2), columns do not necessarily require large rotational restraint to achieve large increases
in the critical load. Designers have not been able to utilise this phenomenon unless they
have been performing a rigid frame design, in which case use of the alignment charts
is permitted. Adopting the design procedure discussed above would, therefore, allow
the calculation of realistic effective lengths for a much wider range of frame types. The
application of this philosophy is discussed further in section 8.3.7 which compares simple
interaction design predictions with experimental and analytical behaviour and proposes
a modification to 'standard' effective length values.
8.3.6 The 'variable stiffness' method.
The design techniques which have been discussed in the previous sections have concen
trated on defining the appropriate terms for use in an interaction type equation. However,
8.30

the 'vanishing stiffness' method, developed by Wood [8.32] for rigid frame design, uses
a different approach. It applies the concept of 'deteriorated critical load " defined as the
load at which the overall stiffness of the remaining elastic parts of the structure become
zero, to identify the ultimate capacity of members in a frame. The method therefore
defines the vanishing of frame stiffness rather than the attainment of a limiting stress as
the primary factor influencing member stability. The collapse load is defined as:-
p = C'.R'.PE
where:
PE = The Euler load of the pinned-end column.
C' = Ratio of the critical load to the Euler load,
thereby representing the end conditions of the
column - usually read from alignment charts.
R' = The stiffness reduction factor.
(8.31)
The effects of major and minor axis disturbing moments are taken into account by
modifying the stiffness reduction factor. For the case of a large major axis moment, the
reduction in column stiffness is given approximately by:-
(8.32)
where:
F = Collapse load! squash load ratio.
MGiE = Allowable major axis moment.
MmGiE = Maximum applied column end moment.
m = Correction factor to allow for the pattern of
bending moments.
8.31
The inclusion of the collapse load factor, F, in the derivation of the reduced member
stiffness means that the collapse load is determined using an iterative process.'
Roberts [8.331 proposed a method by which the above procedure, specifically developed
for fully rigid frames, was adapted for use in non-sway semi-rigid frame design. The
method used a modified version of the technique in document PD 3343 whicb introduced
the concept of standard semi-rigid connection stiffnesses, as discussed in section 8.3.6,
for the design of the major axis beams. The secondary beams, connected to the mi
nor column axis, were designed elastically assuming a fully rigid connection. Using the
nomenclature adopted by Horne for plastic design, this corresponds to an SzEII config
uration. From the beam design, the moments acting on the column can be determined
and the variable stiffness method, described above, used to determine the critical load.
Comparisons with existing structures showed that by using this design method, material
weight savings of the order of 10% could be achieved.
Recently, Shea [8.34] used a modified version of the variable stiffness method to compare
design predictions with the numerical models studied by the author in Chapter 7. The
method included an equivalent beam stiffness, which incorporated a linear connection
stiffness component, and proposed a modified version of the stiffness reduction factor.
Whilst a relatively close correlation was observed between the design predictions and the
numerical data, the 'variable stiffness' approach overestimated the capacity of the column
in most cases - i.e. it was unsafe. This effect was most noticeable where large moments
were applied to the minor column axis. It appeared that the proposed formulation for
the deterioration of column stiffness was not sufficiently sensitive to large changes in the
applied column moments. It is dear that further developments of this technique for use
in semi-rigid frames should concentrate on refining this particular aspect of the method.
Whilst the 'variable stiffness' method represents a valid concept and is arguably 'more
correct' than the interaction approach, it also represents a significant departure from
the limiting stress principles which have been used by designers for many years. Conse-
8.32

quently, it is anticipated that designers would be resistant of its use in frame design.
8.S.7 Observations on the application of the BS 5950 simple design
method.
In this section, the data obtained from the experimental studies of sub assemblage re
sponse (Chapter 2), frame response (Chapter 5) and the analytical parametric study
(Chapter 7) are compared with the predictions of the 'simple' design method in BS
5950. The aim of this study is not to validate, or otherwise, the 'simple' interaction for
mula, but merely to illustrate the potential increases in strength which can result from
semi- rigid action.
The ultimate load capacities have been derived using the interaction equation 8.22 pre
sented in section 8.3.3 using the appropriate 'standard' effective length factors recom
mended in the code. In each case, the design moments have been derived on the assump
tion that the beam reactions, at the end of the beam loading phase, act at an eccentricity
of 100mm from the column face. Where possible, material properties corresponding to
those observed in the experimental studies have been used in the design comparisons
[8.35].
It is important to note that throughout this appraisal, the enhanced capacity of the
experimental and analytical studies has been expressed in the non- dimesionalised form
Pee." Pile. - i.e. the increased a.x.ialload which can be sustained, over that predicted from
the design, for a given pattern of disturbing moments. This is not necessarily the same
as a universal load factor against collapse in which the effect of a 'pro-rata' increase in
the loading from the beams would have to be taken into account.
A summary of the comparison between the design predictions and the experimental
8.33

subassemblage tests, part of the parametric study and the full scale frame test Fl is
presented in tables 8.8, 8.9 and 8.10 respectively. The various columns in the tables show
the moments at the column head, Mz and Mil' both design and actualj the effective
length factors extracted from clause 4.7.2 of the code which are considered to closely
reflect the degree of column restraint present; the design column capacity in the absence
of disturbing moments, P~; the design ultimate capacity, Pde.; the actual minor axis
moments at the column head at the point of maximum load, M;i and the actual maximum
load carried, Pte."
There are a number of significant observations which can be made from the above tables
regarding the assessment of effective length and the prediction, and subsequent effect,
of the applied disturbing moments. For clarity, these two issues have been discussed
separately in the following sections. In each case a refinement, or in the case of applied
moments an alternative, to the present methods of simple frame design have been pro
posed which take greater account of the benefits of simple connection restraint. Due to
the emphasis on experimental investigation in this particular research study, the avail
able time in which to validate these design proposals has been limited. The proposals
are therefore of a preliminary nature. However, it is hoped that these proposals will
be of use to other researchers presented with the task of formulating simple methods of
semi-rigid frame design.
8.S.8 The assessment of effective lengths in simple frame design.
It is evident from tables 8.8, 8.9 and 8.10 that in addition to the ultimate design ca
pacities, Pde., the design values P~, Le. ultimate capaci~y in the absence of disturbing
moments, are significantly less than the actual ultimate capacities, Pte." This is quite
surprising in view of the large disturbing column moments which were present in some of
8.34
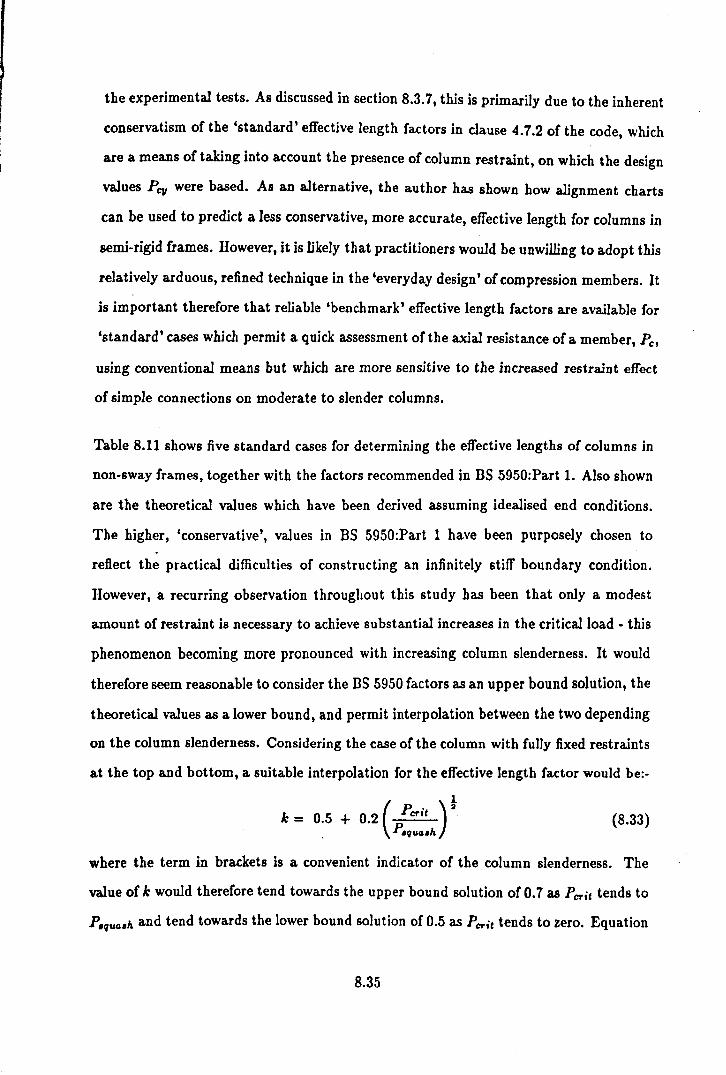
the experimental tests. As discussed in section 8.3.7, this is primarily due to the inherent
conservatism of the 'standard' effective length factors in clause 4.7.2 of the code, which
are a means of taking into account the presence of column restraint, on which the design
values PC71 were based. As an alternative, the author has shown how alignment charts
can be used to predict a less conservative, more accurate, effective length for columns in
semi-rigid frames. However, it is likely that practitioners would be unwilling to adopt this
relatively arduous, refined technique in the 'everyday design' of compression members. It
is important therefore that reliable 'benchmark' effective length factors are available for
'standard' cases which permit a quick assessment ofthe axial resistance of a member, Pc,
using conventional means but which are more sensitive to the increased restraint effect
of simple connections on moderate to slender columns.
Table 8.11 shows five standard cases for determining the effective lengths of columns in
non-sway frames, together with the factors recommended in BS 5950:Part 1. Also shown
are the theoretical values which have been derived assuming idealised end conditions.
The higher, 'conservative', values in BS 5950:Part 1 have been purposely chosen to .
reflect the practical difficulties of constructing an infinitely stiff boundary condition.
However,a recurring observation throughout this study has been that only a modest
amount of restra.int is necessary to achieve substantial increases in the critical load • this
phenomenon becoming more pronounced with increasing column slenderness. It would
therefore seem reasonable to consider the BS 5950 factors as an upper bound solution, the
theoretical values as a lower bound, and permit interpolation between the two depending
on the column slenderness. Considering the case of the column with fully fixed restraints
at the top and bottom, a suitable interpolation for the effective length factor would be:-
1
k = 0.5 + 0.2 ( P erie ) 2
. P.qua.h (8.33)
where the term in brackets is a convenient indicator of the column slenderness. The
value of k would therefore tend towards the upper bound solution of 0.7 as P erie tends to
P.quo.h and tend towards the lower bound solution of 0.5 as P erie tends to zero. Equation
8.35

,
B.33 can be rearranged such that:-
(8.34)
therefore:
(8.35)
k _ 0.5 - j
1 - 0 2 (2L-) 2" . p.,uo." k -;. 0.7 (8.36)
Other forms of the equation, which may be applied to the other standard column support
conditions (cases 1 and 3) are proposed in Table B.l1. A similar type of equation has also
been proposed for those 'standard' end conditions for which there is a range of theoretical
effective lengths, namely cases 2 and 4. In this instance, the precise form of the equation
has been derived intuitively based on the nature of the equations for cases 1, 3 and 5.
Therefore, rather than using a. single effective length factor, the designer would have the
option to expend slightly more design effort to enhance the effective length by taking into
account the column slenderness. This 'enhanced' assessment of effective length would
still rely on the intuitive selection of appropriate column end conditions by the designer.
However, it is evident that significantly less design effort would be required than is
necessary to accurately derive the effective length from alignment charts, as described in
section B.3.4., in which an assessment of the relative beam stiffnesses is required.
It is appreciated that the proposed simplified approach will only predict a significant
improvement in the effective length of columns with a. moderate to high slenderness,
typically where the Euler buckling load, PE, is less than 1.5 times the squash load,
p.qua./l. In the case of UC type sections, this corresponds approximately io a slenderness
in excess of BO for grade 43 steel, decreasing to 65 for grade 50 steel.
Applying the approach to column C6/0-1 in the frame test, i.e. the lower segment,
the effective length factor is given as 0.71 (case 4, Table B.11). This compares with a
value of 0.80 inferred from the current BS 5950 recommendations, and a value of 0.56
B.36

derived from the alignment chart in the refined semi-rigid design approach presented in
Appendix C. Whilst the improvement in effective length using this approach falls short
of that predicted using the alignment chart, it does equate to a 15% increase in the axial
column resistance, p~, compared to that using the current 'standard' BS 5950 effective
length guidelines.
Clearly, the proposed modifications to standard effective length guidelines need to be
thoroughly validated with experimental and numerical data before they could ever ap
pear as recommendations for design. However, it is believed that such an exercise would
be justified as the proposals provide a theoretical basis for the simple assessment of ef-,
fective lengths, and one in which the inherent sensitivity of relatively slender columns to
end restraint is incorporated.
8.8.9 The treatment of column disturbing moments in simple frame
design.
It is evident from tables 8.8, 8.9 that the approach given in BS 5950:Part 1 for the design
of simple frames overestimates the column minor axis disturbing moments at the end
of beam loading in both the subassemblage tests and the numerical study. Due to the
additive nature of the terms in the interaction equation, this results in quite a large
underestimation of the ultimate load capacity, e.g. case 6 in table 8.9. In the frame
test however (table 8.10), the observed minor axis moments at the centre column were
significantly greater than that predicted using the 'simple' approach. This was primarily
due to the large stiffness of the particular connection and the resulting high moment
which was attracted from the beams. This disparity clearly demonstrates the inadequate
and arbitrary nature of the simple method of assuming a 100mm beam eccentricity to
derive the column disturbing moments in frames.
8.37

In all cases, the applied design disturbing moments bear no resemblance to those present
on the column at the point of maximum load. This is demonstrated in figure 8~18 which
shows the design distribution of bending moment and those at the ultimate condition
for the minor column axis of one of the models investigated in the parametric study.
The deformation, and hence increased end rotation, of the restrained column as failure
approaches causes the applied moment to be shed back to the beams. In some cases, a
full reversal of the moment is observed. This phenomenon adds weight to the inadequacy
of present methods of appraising disturbing moments in simple frames.
Gent and Milner [8.36] investigated the effects of load shedding on the behaviour of
restrained, biaxially loaded, small scale steel sub assemblages. They concluded that in
most cases, the specimens studied failed at loads quite close to their squash loads despite
the presence of large disturbing moments and, in all cases, at loads greater than that
predicted from the then current British steelwork design code, BS449 [8.29]. Due to the
effects of moment shedding, about both axes, the column sections acted as 'plastic props'.
Therefore, rather than concentrate on the precise magnitude of the applied moments,
they proposed that disturbing moments could be treated in a similar fashion to initial
imperfections. This led to the development of a permissible stress strut curve which was
based on the tangent modulus, Et concept. Rather than achieving significant economies
in specified weight of columns, the proposed method significantly simplified the design
process.
In the parametric study reported in chapter 7, a similar conclusion was made regarding
the effect of disturbing moments from beams. It was observed that in nearly all the
models studied, the value of o(pin was greater than unity, i.e. the ultimate capacity of
the restrained column with disturbing moments at one end only was larger than that
of the axially loaded pinned-end column. This implied that the benefit of connection
restraint was greater than the detrimental effect of the disturbing moments from the
beams.
8.38

It would be convenient therefore to completely ignore the disturbing moments from
the beams and design columns simply as struts with an appropriate effective length,
possibly using a modified strut curve based on the tangent modulus concept. Clearly,
this approach would result in a dramatic simplification of the design process. It is
evident however that the limited parametric study reported in chapter 7 would need to be
extended to investigate the Qpin factor for a much wider range of structural arrangements
and to determine the limits of application of this philosophy.
In developing the above approach using Qpin factors, it must be remembered that the
enhanced column loads in many cases, particularly for edge or corner columns, are due
to a reversal of moment at the column head. This reversed moment is sustained by
effectively lowering the free bending moment diagram for the interconnecting beam,
thereby increasing the maximum span moment. Whether this increase would result in a ., beam span moment which is greater than the simple span moment (see figure 8.19) for all
practical beam and column combinations needs to be investigated. Obviously, increasing
the weight of beam steel for the sake of a lighter column is not desirable as it would
probably result in an overall increase in the total weight of the structure. It should be
noted that in the case of interior columns, the reversal of column head moment does not
necessarily have a significant effect on the interconnecting beams. This was observed in
the full scale frame tests reported in chapter 5 and its effect on the connection moment
rotation response were discussed at length in chapter 6.
On the assumption that future studies reveal that disregarding the column disturbing
moments can significantly increase the cost of beams in the end bay of a structure, the
author has proposed a relatively straight-forward method of column design which would
limit the reliance on a full reversal of moment at the column head. The method uses a
concept similar to that proposed by Gent and Milner but with one or two amendments.
Rather than use a modified buckling curve to take account of the initial disturbing
moments, the strength of the section at the column centre is assessed using minor axis
moments derived from the deflected shape of the column at the point of moment reversal.
8.39

The design forces and deformed column shape are shown in figure 8.20. It is assumed
that at the point of moment reversal the rotation at the column head, <Pc, is the same
as that at the end of a simply supported beam, <PfJ, and that the column deforms into
the shape of a symmetrical half sine- wave. The deflection at the column centre, 6c , can
therefore be easily determined and hence the design minor axis moment due to the design
axial load acting through this eccentricity. The stability of the column is then checked
by assessing the residual stiffness of the column, in a similar manner to that proposed by I
Gent and Milner. The method is best illustrated by considering the example in Appendix
C (pages C8 and C9) in which the method is used to predict the capacity of the numerical
model 6A with a one-way spanning floor system which was reported in chapter 7.
It is evident that the assumed deflection of 19.6mm at the column centre at the point of
moment reversal is very close to that which was predicted from the finite element model
(20.3mm). Consequently the design minor axis moment of 8.4 kN.m is close to that
observed from the program (9.1 kN.m). The design axial load of 360 kN, which produces
first yield at column centre, compares favourably with the load predicted from the finite
element program of 400.5 kN at the point of moment reversal and a load of 420.0 kN at
failure. Under this design condition, the stability of the column was checked by ensuring
that the design axial load was less than the Euler load when the full minor axis inertia
of the elastic section was taken into account. This implies that the member has residual
stiffness and would not, therefore, rely on restraint from the beams.
It is a.ppreciated that the approach presented in Appendix C considers only the simple
uniaxial case. However, the approach can be modified to consider biaxial effects. The
work by Gent and Milner had shown that complete reversal of the major axis moments at
the column head occurred in nearly all the specimens they studied. This was principally
due to the large major axis moments which were applied and the resulting major axis
failure of the column. The design approach they proposed took into account the effect of
major axis moments by assuming the compression flange of the section was fully plastic,
the stability assessment being performed on the out-of-plane stiffness of the elastic tension
8.40

flange only. This is a principle which could be adopted in the approach proposed by the
author presented in Appendix C.
However, when applied to frames with simple connections, it is expected that the applied
major axis moments will be somewhat more modest than those considered by Gent
and Milner. As a result, major axis failure of the column, and thus reversal of the
major axis head moment, is unlikely to occur. Indeed, one observation which has been
prevalent throughout this study, particularly in the sub assemblage tests, is that major
axis moments tend to remain relatively unchanged after application of the beam loads
right up to the point of column collapse. It is proposed therefore that the actual applied
major axis moment is considered in the design method proposed above. The strength
criterion (local capacity check) at the column centre would then be of the form:-
p + AlII + ME < 1.0 P,qucuh MplI Mp:c-
(8.37)
with the stability check being performed, as before, assuming the whole section remains
elastic. Of course the applied major axis moment could be determined using the present
approach by assuming a lOOmm eccentricity of beam reaction. However, a more satis
factory alternative would be to consider the true semi-rigid moment by considering the
I' factors as described in section 8.3.5.
The above design approach is clearly geared towards the appraisal of columns with mod
erate to high slenderness. For stocky columns with small minor axis disturbing moments,
it is evident that there may be insufficient capacity for column head rotation to occur
thereby preventing a reversal of the column head moment to zero. Indeed this was ob
served in the case of column 'C3', the largest column considered in the parametric study
described in chapter 7. However, due to the inclusion of a 'greater than actual' column
deformation, it is anticipated that the above procedure would produce a conservative
result by underestimating the ultimate capacity.
As discussed in the introduction, the proposed design procedure is of a preliminary nature
and clearly warrants additional study. The principal areas requiring further attention
8.41

are:-
1. How the method could be applied to internal columns and take into account
the effects of column continuity.
2. Defining the limits for which lateral torsional buckling can be ignored.
3. The degree of conservatism when applied to stocky columns with small dis
turbing moments.
Whilst it has been shown that the above design approach produces a reasonable predic
tion of the behaviour of one of the sub assemblage columns, it is clear that a thorough
verification is required to fully validate the technique. It is envisaged that this could
take the form of a parametric study of column subassemblage behaviour, possibly using
an analytical tool similar to that reported in Chapter 4. Typically, the study could
investigate the accuracy of the approach for different beam/column combinations, con
nection types, applied disturbing moments, loading sequences, column slendernesses and
base restraint conditions. It is hoped that the study, and subsequent comparisons with
design predictions, would concentrate on investigating which are of practical proportions
comparable to those encountered in 'real structures'.
8.4 Conclusions.
1. A method has been proposed for analysing semi-rigid non-sway frames under
serviceability loading in which the members remain elastic. The predicted
deflections compare favourably with those observed in the experimental full
8.42
scale frame test F1.
2. Comparisons of numerical and experimental data with the ultimate load de
sign equations clearly illustrate the inadequacy of the present method of simple
frame design in BS 5950:Part 1.
3. It has been demonstrated in the form of hand calculations how an ultimate
load design technique proposed by the author can be applied to column C6 in
frame test Fl. The predicted column failure load was significantly closer to
the actual when compared to that predicted from present BS 5950.
4. The author has proposed a 'simple' method of frame design in which the de
sign minor axis moments are derived from consideration of the applied axial
load acting through the deformed shape of the column. This method gave a
close prediction of the ultimate capacity of one of the sub assemblages in the
parametric study (the only one studied).
References.
8.1 Nethercot, D.A., 'Joint action and the design of steel frames. " The Strucural Engineer, Vol. 63A, No. 12, Dec. 1985, pp. 371-379.
8.2 Bjorhovde, R., IEffect of end restraint on column strength. practical applications.', A.I.S.C. Engineering Journal, Vol. 20, No.1, First quarter, 1984, pp. 1-13.
8.43
8.3 Kleinlogel, A., 'Rigid frame formulas', Frederick Ungar Publishing Co., U.S.A., 1952.
8.4 Azizinamini, A., Bradburn, J.H. and Radziminski, J.B., 'Initial stiffness of semi-rigid beam to column connections.', Journal Constructional Steel Research, No.8, 1987, pp. 11-90.
8.5 Jones, S.W., Kirby, P.A. and Nethercot, D.A., 'Effect of semi-rigid connections on steel column strength. " Journal of Constructional Steel Research, No.1, Sept. 1980, pp. 38-46.
8.6 . Lothers, J .E., 'Elastic end restraint equations for semi-rigid connections. " Trans. Am. Soc. Civil Engrs., No. 116, 1951, pp. 480-502.
8.7 Barakat, M. and Chen, W.F., 'Practical analysis of semi-rigid frames.', A.I.S.C. Engineering Journal, Second quarter 1990, pp. 54-68.
8.8 Eurocode No.3, 'Design of steel structures: Part 1: Genral rules for buildings', Draft version, Commission of the European Communities.
8.9 Poggi, C. and Zandonini, R., 'Behaviour and strength of steel frames with semi-rigid connections', in 'Flexibility and steel frames', Ed. W.F. Chen, Am. Soc. Civil Eng., 1985, pp. 57-76.
8.10 Davison, J.B., 'Strength of beam-columns in flexibly connected steel frames', Ph.D. Thesis, Department of Civil and Structural Engineering, University of Sheffield, U.K., June 1987.
8.11 British Standard BS 5950, 'The structural use of steelwork in buildings, Part 1: Code of practice for design in simple and continuous construction: 1I0t rolled sections.', London, British Standards Institution, 1985.
8.12 Davison, J.B., Lam, D. and Nethercot, D.A., 'Semi-rigid action of composite joints', The Structural Engineer (in press).
8.13 Wright, H.D. and Francis, R.W., 'Tests on compos ire beams with low levels of shear connection' , The Structural Engineer, Vol. 68, No. 15, August 1990, pp. 293-298. .
8.14 Chen, W.F., and Santathadaporn, S., 'Review of Column Behaviour under Biaxial Loading.', Am. Soc. Civil Engrs., Journal Struct. Div., Vol. 94, No. ST12, pp. 2999-3021, 1968.
8.15 Chen, W.F., and Atsuta, T., 'Theory of Beam-Columns.', Vols. 1 and 2, McGrawHill, New York, 1977.
8.44

I 8.16 Johnston, B.G., 'Guide to Stability Design Criteria for Metal Structures. "
(SSRC) 3rd ed., Wiley, New York, 1976.
8.17 Galambos, T.V., and Ketter, R.L., 'Columns under Combined Bending and Thrust. " Trans. Am. Soc. Civil Engrs., Vol. 126, Part 1, 1961, pp. 1-25.
8.18 Massonnet, C., and Save, M., 'Plastic Analysis and Design.', Vol. 1, Beams and Frames, Blaisdell Publishing Co., New York, 1965.
8.19 Lu, L.W., Shen, Z.Y., and Hu, X.R., 'Inelastic Instability Research at Lehigh University.', 'Instability and Plastic Collapse of Steel Structures. " (ed .
. L.J. Morris), Granada, London, 1983.
8.20 Austin, W.F., 'Strength and Design of Metal Beam-Columns. " Am. Soc. Civil Engrs., Journal Struct. Div., Vol. 87, No. ST4, 1961, pp. 1-34.
8.21 Horne, M.R., 'The Flezural-Torsional Buckling of Members 0/ Symmetrical 1-Section under Combined Thrust and Unequal Terminal Moments.', Q.J. Mech. Appl. Math., No.4, 1956.
8.22 Hill. H.N., and Clark, J.W., 'Lateral Buckling of Eccentrically Loaded 1-Section Columns. " Trans. Am. Soc. Civil. Engrs., Vol. 116, 1951, p. 1179.
8.23 Vinnakota, S., 'Finite Difference Method for Plastic Beam-Columns.', in 'Theory of Beam-Columns.', (W.F. Chen and T. Atsuta), McGraw-Hill, New York,
1977, Chapter 10.
8.24 Tebedge,N., and Chen, W.F., 'Design Criteria for Steel H-Columns Under Biaxial Loading.', Am. Soc. Civil Engrs., Journal Struct. Div., Vol. 100, No. ST3, March 1974, pp. 579-598.
8.25 Pillai, U.S., 'An Assessment of CSA Standard Equations Jor Beam-Column Design. " Can. Journal Civil Engrs., Vol. 8, 1981.
,
8.26 Birnstiel, C., 'Ezperiments on H-Columns under Biazial Bending. ',Am. Soc. Civil Engrs., Journal Struct. Div., Vol. 94, No. ST10, 1968, pp. 2429-2450.
8.27 Chubkin, G.M., 'Ezperimental Research on Stability oj Thin Plate Steel Members with Biazial Eccentricity.', in 'Analysis oj Spatial Structures', Vol. 5, Moscow, Paper 6, 1959.
8.28 Kloppel, K. and Winkelmann, E., 'Ezperimentale und theoretishe untersuchungen uber die traglast von ztDeiachsig assussermittig gedruckten Btahlstaben', Stahlbau, 1962, Vol. 31, pp. 33.
8.29 British Standard BS 449: Part 1, 'The use oj structural steel in buildings.', British Standards Institution, London, 1971
8.45

8.30 Steel Structures Research Committee, Final report, H.M.S.O., London, 1936.
8.31 Lui, E.M. and Chen, W.F., 'Strength of columns with small end restraint.', The Structural Engineer, Vol. 61H, No.1, Part H, 1983, London, pp. 17-26.
8.32 Wood, R.H., 'A new approach to column design - with special reference to restrained steel stanchions.', H.M.S.O, London, 1974.
8.33 Roberts, E.H., 'Semi-rigid design using the variable stiffness method of column design', Joints in structural steelwork, ed. Howlett, J.H., Jenkins
. W.M. and Stainsby, R., London, Pen tech Press, 1981, pp. 5.36-5.49
8.34 Shea, T.C., 'Variable stiffness design of steel columns.', M.Sc.(Eng.) Thesis, University of Sheffield, September 1989.
8.35 Gibbons, C., 'The strength of biaxially loaded beam-columns in flexibly connected steel frames. Volume 2: A sUrvey of the mechanical and geometric properties of structural steel sections', Ph.D. thesis, Department of Civil and Structural Engineering, University of Sheffield, Dec. 1990.
8.36 Gent, A.R. and Milner, H.R., 'The ultimate load capacity of elastically restmined H-eolumns under biaxial bending', Proc. Inst. Civil Engrs., No. 41, 1968, pp. 685-704.
8.46

,
Beam connection moments
Connection Joint Rigid frame moment Test frame moment type reference Mrigid (kN.m) Mtest (kN.m)
Minor axis d 29.5 21.2 INTERNAL f 33.6 30.1 column i 33.8 30.6
k 30.3 26.9
Minor axis c 5.2 4.9 EXTERNAL e 10.9 1.2 column j 12.8 10.9
1 4.8 3.4
Table 8.1: Summary of the rigid connection moments and actual the actual test frame moments.
Connection Joint Connection stiffness kN.m/rad type reference
Ci C10 CM Cko
Minor axis d 90900 22100 54300 56000 INTERNAL f 14800 7400 12400 10600 column i 18400 5000 10800 10100
k 23500 13300 18100 18000
Minor axis c 3800 2400 1400* 2000 EXTERNAL e 2500 1250 1400* 1300 column j 6800 2400 1400* 3500
1 3800* 2400* 1400* 2000
Table 8.2: Linear stiffnesses determined from the actual experimental connection moment-rotation da.ta..
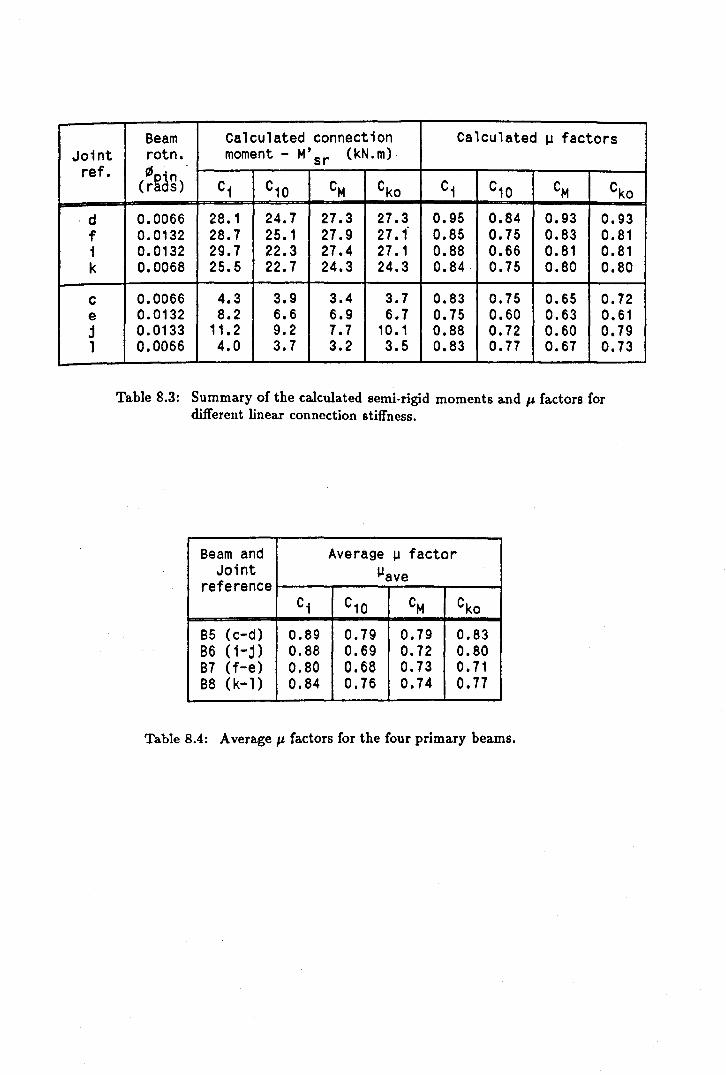
Joint ref.
·d f 1 k
c e j 1
Beam Calculated connection Calculated ~ factors rotn. moment - M'sr (kN.m)
(~Rd~) Ci C10 CM Cko Ci C10 CM eko
0.0066 28.1 24.7 27.3 27.3 0.95 0.84 0.93 0.93 0.0132 28.7 25.1 27.9 27.1 0.85 0.75 0.83 0.81 0.0132 29.7 22.3 27.4 27.1 0.88 0.66 0.81 0.81 0.0068 25.5 22.7 24.3 24.3 0.84· 0.75 0.80 0.80
0.0066 4.3 3.9 3.4 3.7 0.83 0.75 0.65 0.72 0.0132 8.2 6.6 6.9 6.7 0.75 0.60 0.63 0.61 0.0133 11.2 9.2 7.7 10.1 0.88 0.72 0.60 0.79 0.0066 4.0 3.7 3.2 3.5 0.83 0.77 0.67 0.73
Table 8.3: Summary of the calculated semi-rigid moments and Il factors for different linear connection stiffness.
Beam and Average ~ factor Joint Ilave
reference C1 C10 CM eko
B5 (c-d) 0.89 0.79 0.79 0.83 86 (i-j) 0.88 0.69 0.72 0.80 B7 (f-e) 0.80 0.68 0.73 0.71 B8 (k-l) 0.84 0.76 0.74 0.77
Table 8.4: Average p. factors for the four primary beams.

8eam and Simple Rigid Predicted semi-rigid Measured Joint span frame deflection lSsr (mrn) test beam
reference ~~~ lSf,tM1 d deflection Ci C10 CM Cko lStest (mrn)
85 (c-d) 10.16 1.20 2.19 2.99 3.08 2.72 2.60 86 (i-j) 20.45 8.50 9.93 12.20 11.85 10.89 10.48 87 (f-e) 20.39 8.60 10.96 12.37 11.78 12.00 9.30 88 (k-l) 10.33 1.40 2.83 3.54 3.72 3.45 2.40
Table 8.5: Comparison of the pinned, rigid, actual and predicted mid-beam deflections.
Beam and lSsr - lStest lSsr / lStest Joint (mm)
reference Ci C10 CM Cko Ci C10 CM Cko
B5 (c-d) -0.41 0.39 0.48 0.12 0.84 1.15 1.18 1.05 B6 (i-j) -0.55 1.72 1.37 0.41 0.95 1.16 1.13 1.04 B7 (f-e) 1.66 3.07 2.48 2.70 1.17 1.33 1.27 1.29 B8 (k-l) 0.43 1.14 1.32 1.05 1.18 1.47 1.55 1.43
Table 8.6: Comparison of predicted d,efiections with actual.
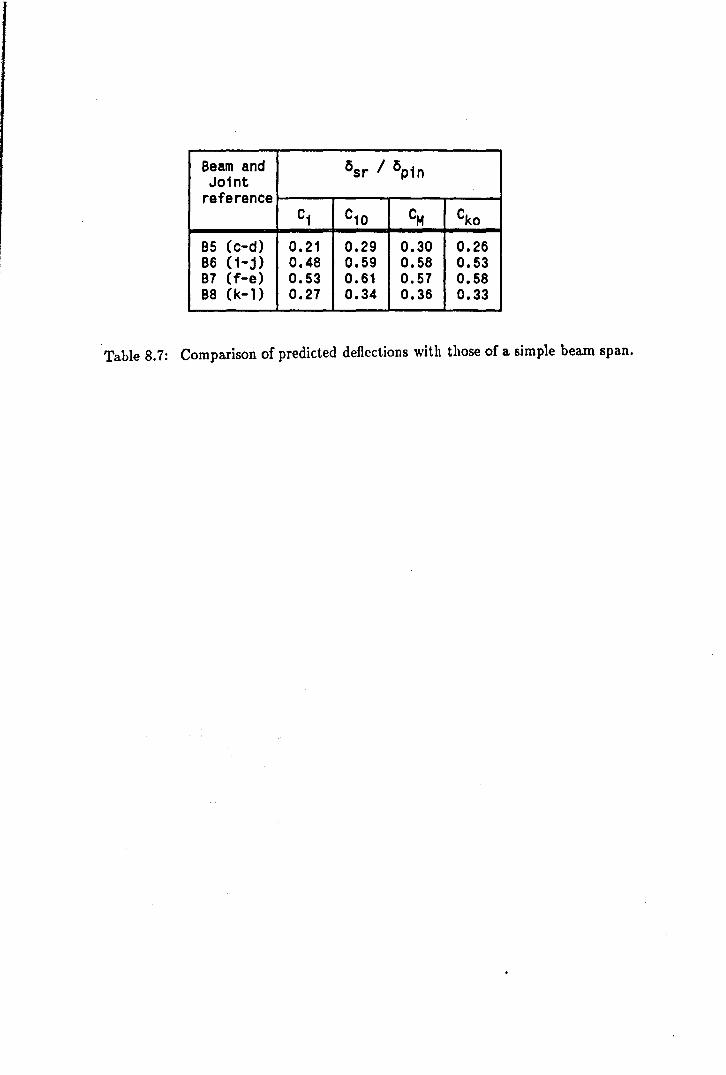
8eam and 6sr / 6p1n Jo1nt
reference Ci C10 CM Cko
85 (c-d) 0.21 0.29 0.30 0.26 86 (1-j) 0.48 0.59 0.58 0.53 B7 (f-e) 0.53 0.61 0.57 0.58 B8 (k-l) 0.27 0.34 0.36 0.33
Table 8.7: Comparison of predicted deflections with those of a simple beam span.

Comparison of design predictions with subassemblage test data
Design values Actual values Test . M ' My'cen Ptest
Ptest Number Mx My La.. PCY Pdes Mx My 'I -"'[ Pdes
kN.m kN.m kN kN kN.m kN.m kN.m kN.m kN
S1 8.8 4.5 0.8 286 213 5.0 0.8 -5.0 V.5 468 2.20 S2 8.8 0.0 0.8 279 244 8.V -0.8 -8.9 8.V 503 2.06 S3 8.8 0.0 0.8 308 269 8.3 -0.1 -V.V 10.2 542 2.01 54 8.8 5.0 0.8 294 211S V.8 2.6 -1S.1 9.1 494 2.29 55 5.3 3.0 0.8 295 248 1.V 0.6 -8.1 11.1 47V 1. 93 86 5.3 3.0 0.8 295 248 3.4 2.3 -3.8 5.8 614 2.47 87 7.9 4.5 0.8 300 229 4.9 2.0 -V.O 12.6 490 2.14 S8 14.9 0.0 0.8 300 234 9.7 -1.1 -8.V 11.0 482 2.05 89 16.7 0.0 0.8 293 222 16.6 -2.1 -10.5 10.8 526 2.37 S10 23.2 0.0 0.8 289 191 23.9 -0.2 -10.0 11.8 520 2.72
Table 8.8: Predicted ultimate loads of the sub assemblage tests using the 'simple' design method.
Comparison of deslgn predlctlons wlth numerlcal model.
Design values Actual values Hodel Ptest
Number Mx My L Pcy Pdes Mx My M ' My'cen Ptest -1:e• 'I Pde, kN.m kN.m kN kN kN.m kN.m kN.m kN.m kN
1 0.0 0.0 0.9 397 397 0.61 -0.43 -4.52 6.05 524 1.32 2 - 0.0 12.9 0.9 397 188 0.28 2.28 -4.27 8.58 480 2.55 3 0.0 8.7 0.9 397 256 0.38 1.10 -4.50 7.73 497 1.94 4 0.0 1S.4 0.9 397 293 0.14 1.43 -4.52 7.04 507 1.73 5 0.0 4.4 0.9 397 326 0.28 0.65 -4.64 8.68 514 1.57 6 0.0 12.9 0.95 384 182 0.27 5.27 -2.05 11.10 420 2.31 7 0.0 6.4 0.95 384 283 0.13 3.28 -3.28 8.62 465 1.64 8 0.0 8.5 0.V5 384 250 0.18 4.09 -2.44 V.5V 440 1. 71S V 0.0 6.4 0.95 384 283 0.11 3.33 -3.42 V.24 459 1. 62
Table 8.9: Predicted ultimate loads of subassemblages in the parametric study using the 'simple' design method.
Design values Actual values Column Ptllt
Mx My Le PCY Pdes MI( My M ' pt • st Reference L 'I
Pde. kN.1I! kN.m kN kN kN.m kH.m kN.m kN
C5/1-2 Top 5.9 1.8 14.7 -1.7 -10.8 O.V 476 363 860 1.82
C5/1-2 Bot 0.0 1.8 6.2 3.4 -0.9
C5/0-1 Top 0.0 1.8 2.1 5.2 3.2 0.8 648 512 779 1.52
C5/0-1 Bot 0.0 0.0 0.3 -2.7 -14.0
C6/0-1 Top 5.V 1.8 8.8 1.8 -7.2 0.8 648 487 758 1.55
C6/0-1 Bot 0.0 0.0 3.9 0.8 -15.V
Table 8.10: Predicted ultimate loads of column segments in frame test Fl using the 'simple' design method.

Effective length factors (K)
Support 8S5950 Theory Proposed condition
1 1.0 1.0 1.0
"( J 0.7 not ) 0.85
2 0.85 0.5-1.0 1 - 0.15[PE~i
(, PSq
0.7 not > 0.85 3 0.85 0.7
1 - 0.15 [PE~ i 7il: ~Sq
C 0.6 not > 0.8
4 - 0.5-0.7 1 - 0.2 ~PE-r
7;'7; PSq
:Lf.t 0.5 not> 0.7
5 0.7 0.5 1 - 0.2
rE-J' 7/7 PSq
Table 8.11: Proposed modification to the standard effective length factors in BS 5950.

5 wL4
384 EI
I Iw/ml I
~-+ ==:::::::::===+ ==+ ======---' ~ 000
Figure 8.1: Comparison of the mid-span deflections for a beams with simple supports and fully rigid supports.
Msr ~ ~ ~ (/rn~ ~ ~ ~
Msr
~b ~b
~b q Lfi MsrLb
= - 2 Elb 24 Elb
Figure 8.2: General equation for the rotation at the supports of beam flexibly connected beam.

leu Leu Msr Msr
( Ib ') Lb
I- -I leI LeI
Figure 8.3: Beam and column subframe with semi-rigid beam to column connections.
-1 -.
~ ~+J:L :::a
Mrigid 2 E1b 6 E1c -~ ~ Q)
S Connection 0 Msr response S ~ 0 .... ~ () Q)
Frame ~ ~ response 0 u
M pin
9'sr 9' pin
Connection rotation (~- 9'c)
Figure 8.4: Plot of equation 8.4, the frame line, and a typical non-linear connection moment- rotation response.

-~ Linear approximation '-'"
~
~ (I)
s 0
M'sr S True non-linear response
~ Msr 0 ...... ~ () (I)
~ ~ 0 u
fP = 0.0092 radians
Connection rotation (fPb - 9'c)
Figure 8.5: Plot illustrating the overestimation of the semi-rigid moment for a given rotation when using the linear initial tangent stiffness.
Linear S' '-'" Mrigid a pproxima tion
~ (I)
S S ~ o ...... ~ () (I)
~ ~ o U
True non-linear response
M pin L-.l.. ___ --+---------:...-----rp ~r 9' sr rp pin
Connection rotation (9'b - rpc)
Figure 8.6: Plot showing the 'frame line" non-linear connection momentrotation response and the initial tangent stiffness approximation.
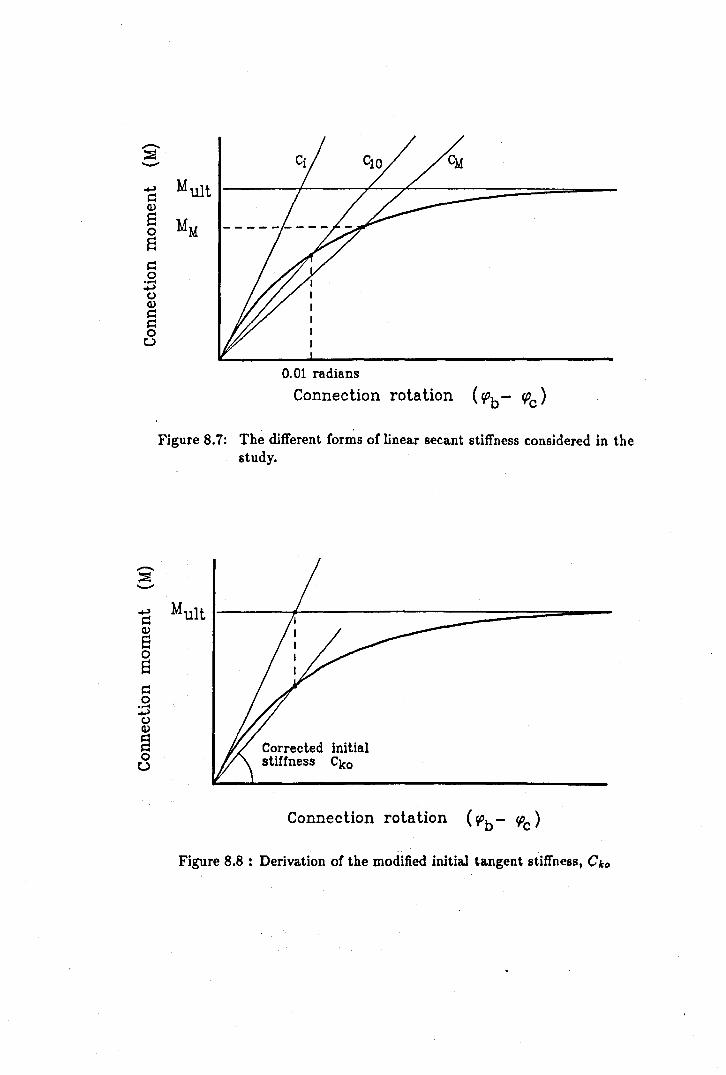
--. ::a --~ Mult r:: Q)
S MM 0
S r:: 0 ..... ~ () Q)
r:: r:: 0 u
0.01 radians
Connection rotation (~b - ~c)
, ,
Figure 8.7: The different forms of linear secant stiffness considered in the
--. ::a --~
r:: Q)
S 0 S
= 0 ..... ~ () Q)
~ 0
U
Mult
study.
Corrected initial stiffness eko
Connection rotation ( ~b - ~c)
"
Figure 8.8 : Derivation of the modified initial tangent stiffness, Cleo

@---17kN 17kN 3SkN 35kN
®--- l PBS l l PBe l 1243 1237 1249 124S
34kN 34kN 17kN 17kN
@---l PB7 l J PB6 J
1233 T 1228 1220 1243
@--- .... .. ... .. ..
Elevation
Figure 8.9 : Arrangement of test frame Fl illustrating the serviceability loadings.
-20 .5 19
18 6 17 g- 16 E 15 g 14
.&J CD 13 Q. 12 E 11 II)
CD 10 :0 9 ;; In 8 ~ 7
CD 0.. 6
W live = 15 . wdead
• +
305)(127)(37 UB Deflection limit Strength limit
533)(210)(82 UB
A
Deflection limit
Strength limit
54-~~--~~~~---r-'--r~---r-'--r~---r-~-r~ 7 8 9 ~O 11 12 13 14 15 16 17 18 19 20 2122 23 24 25
CharacterIstIc beam load. (kN/m)
Figure 8.10: Plot of permissible beam spans against applied load illustrating the zones where deflection considerations dominate the design.
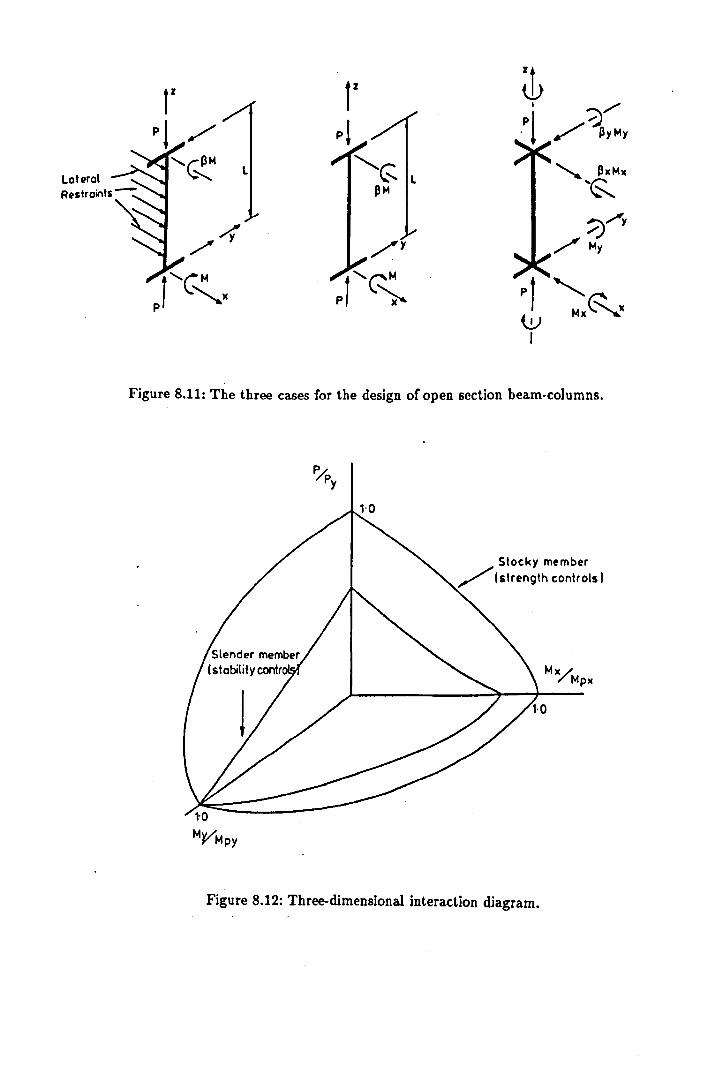
l
W I " MX~X
Figure 8.11: The three cases for the design of open section beam-columns.
Stocky m~mb~r /Istrength controls I
Figure 8.12: Three-dimensional interaction diagram.
Mx ..... /MplC

P ~M PM,p
M(1-~)/L H
L
I I I I I
Bending moment -El d2v
d z2
(primary)
Figure 8.13: The amplification of the maximum moment due to the deformation of slender columns.
0·1. Eq.e·20
0-2 Eq.8·20-+--
-- Wex31 (Light) - -- W11.xl.26 (Heavy)
p/py = 0'3
00 0·2 0·1. 0·6 o·e '·0
MX/Mpx
Figure 8.14: Comparison of equation 8.20 with numerical studies.

connection
A 'closes' ~ .
failed IcLc column~
Figure 8.15: Buckled shape of an internal column showing the direction of connection rotation.
connection 'opens'
connection 'closes'
A
/'
failed column
Figure 8.16: Buckled shape of an external column showing the direction of connection rotation.
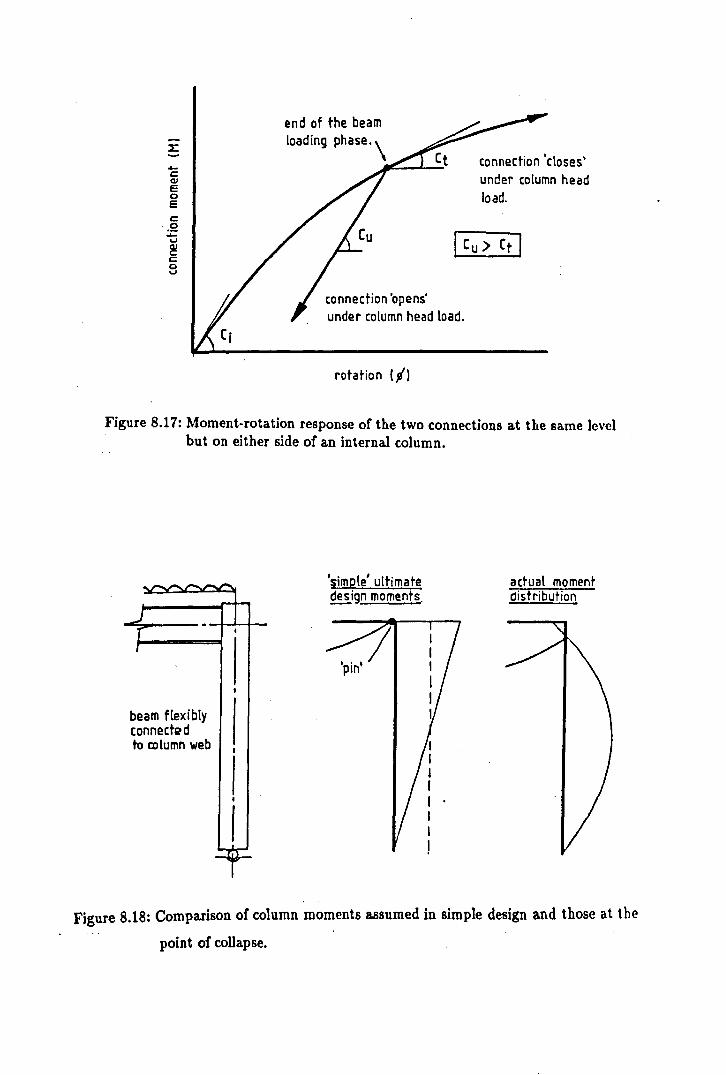
..... C QJ E o E c o :;: .... ! c o ....
end of the beam loading phase. \
connection 'opens' under column head load.
rotation (I)
connection 'closes' under column head load.
Figure 8.17: Moment-rotation response of the two connections at the same level but on either side of an internal column.
beam flexibly connedi'd to column web
'simple' ultimate design moments.
actual moment dis tribution
Figure 8.18: Comparison of column moments assumed in simple design a.nd those at the
point of collapse.

reversal of column head moment increases the beam span moment,
beam span moment may be greater than max simple span moment.
Figure 8.19: Effect of column head moment reversal on the maximum span moments of an end bay beam.
at the point of moment reversal at the column head:
Ie a;b • w L~ 24 E Ib
Figure 8.20: Deformed shape of an edge column when the column head moment rcvcrses to zero.
Chapter 9
Proposals for Future Work.
9.1 Introduction
Throughout this thesis, the author has highlighted aspects of the work which would
benefit most from further research. For clarity, and for the benefit of those who wish to
pursue these studies, a brief summary of the most significant areas for future work have
been collated in this section.
9.2 Connection moment-rotation.
One of the fundamental assumptions of semi-rigid behaviour has been that connections
'unload' with a stiffness, Cu , equal to that of the initial tangent stiffness, Ci. However,
it was disclosed in chapter 6 that, under certain conditions, this assumption may not
necessarily be valid. In the full scale frame tests, it was observed that the unloading
stiffness of the primary beam connection to the minor axis of the internal column was
9.1
significantly less than Ci. This was a result of the combined effects of beam continuity,
column web flexibility - accentuated by an imbalance of beam loads - and a connection
reversal which was a result of column deformations rather than load removal. Clearly,
not all of these parameters were present in the isolated connection tests on which the
initial assessments of semi-rigid connection response were based.
The unloading stiffness of a connection is an important parameter which has been used
in a number of semi-rigid design techniques. It is important therefore that its value
can be proven for all conditions of loading and structural arrangement. The author has
proposed a semi-empirical trea.tment of semi-rigid connection response which would en
able the effect of the above parameters to be investigated without the need to develop
complex experimental test procedures (section 8.5.5). It combines the experimentally de
termined connection moment-rotation response, e.g. from a cruciform test in which web
flexibility effects are not present, with a. finite element model of the column web panel.
Combining these two stiffness components, possibly by adopting the mathematical ex
pressions proposed by the author, it should be possible to determine the total effective
column restraint for different combinations of beam load, beam size and column web
panel size. In the first instance, the effectiveness of the technique could be assessed by
trying to predict the moment-rotation response of a connection in an isolated cantilever
test arrangement with the experimental data from a cruciform connection test [9.1].
9.3 The parametric study.
The details of an in-depth parametric study which was conducted on both flexibly and
rigidly connected subassemblages was reported in Chapter 7. The study investigated
subassemblages which were of practical proportions and which were subjected to realistic
load conditions. A number of significant conclusions were made regarding the effects of
9.2
column orientation, beam stiffness and the difficulty of producing a failure load which
was less than that of a pinned end column (Le. 0pin ~ 1.0).
Although a large number of different numerical models were analysed, the study was
clearly limited when compared to the vast number of structural arrangements that might
be encountered in practice. It is proposed therefore that the present study should be
used as a base and extended to investigate the effects of long span beams, different sized
beams on either side of the column, load history, different column lengths, the restraint
effect from simple column bases and the effect of a wider range of different beam to
column connection types.
9.4 The full-scale frame tests.
An in-depth report on the experimental testing of the two full-scale frames, Fl and F2,
is presented in Chapter 5. It is evident that a large number of parameters were measured
during the tests and, consequently, a large amount of data collected. In those sections
which discuss and assess the results from the two tests, only a relatively limited amount
of data has been presented. This typically comp~ises the most significant responses of
load-moment and load-deflection for the beams and columns. Further studies are there
fore necessary to investigate the measured connection bolt forces, moment- deflection
responses, the spread of material yield, the interaction between primary and secondary
bending moments and comparison with the results from other frame tests.
Chapter 4 reported the detailed comparison which had been performed between the ob
served experimental subassemblage behaviour and that predicted from a sophisticated
finite element computer program. At the time of writing, there was no equivalent an
alytical tool capable of modelling the full-scale frame tests. However, it is envisaged
9.3

that in the near future such an analytical capability will become available. In such an
event, other researchers will be able to use the frame test data to verify their analytical
predictions and then use the validated program to investigate the applicability of sub
assemblage behaviour in the context of frame response.
9.5 The design of semi-rigid frames.
Chapter 8 contains a review of past and present semi-rigid design methods and includes
the author's proposals for the design of frames under ultimate and serviceability loading
conditions. Although the predictions from the methods have been compared with the
measured response of test frame FI, it is clear that a much more detailed and extensive
comparison is required to fully verify and, if necessary, modify the proposed design
techniques. Once verified, the design method could then be subjected to trials which
would identify the limits of application, the possible economies in specified steel weight
and the potential cost penalties resulting from increased design time.
One key parameter present in both the 'in-depth' and 'simplified' design methods pro
posed by the author was the rotation at the support of a simple beam, ¢pin' Although
Bjorhovde has suggested that the maximum value of ¢pin is 0.0092 radians for most
practical framing arrangements [9.2], it is the author's opinion that further work needs
to be carried out to substantiate this assumption.
9.4

9.6 Future experimental studies of semi-rigid frame be
haviour.
Experimental research has already been conducted to investigate the behaviour of iso
lated connections in steel frames with composite concrete floor slabs [9.3]. The results of
the study have shown that large increases were observed in both the connection stiffness
and moment capacity when compared to the 'bare steel' condition. It is therefore pos
tulated that there is a large potential for applying semi-rigid design principles to frames
of this particular type of construction. It has already been proposed that experimental
studies should be carried out on limited column subassemblages and full-scale three
dimensional frames with composite concrete floor construction. In the event of such
tests being performed, the author hopes that the experimental researchers will consult,
and were necessary employ, the experimental procedures and instrumentation techniques
which have been developed for the equivalent 'bare steel' studies reported in this thesis.
9.7 The strengthening of existing steel stanchions.
The recent popularity of building refurbishment has often resulted in loads being applied
to existing steel columns which are larger than those originally intended. In some cases,
steel columns have had to be strengthened by adding steel plates which effectively in
creases the area of the column flanges. This is quite a complex process as the existing
steelwork has to be de- stressed, either by jacking or reducing the applied dead and live
loads to a minimum, so that the most effective use is made of the new, additional steel
area. It is proposed by the author that under certain conditions where the increase in
applied load is moderate and the existing connections relatively flexible, i.e. additional
9.5

strength cannot be proven by conventional semi-rigid design techniques alone, then the
connection can be modified to enhance the unloading stiffness and hence reduce the de
sign effective length of the column. This would have the advantage of avoiding welding
around the central region of the column and would alleviate the need to 'de-stress' the
existing structural element.
Figure 9.1 shows a typical modification to the connection as envisaged by the author.
The minor axis rotation at the column head would be resisted by a system of ties/struts
via the torsional resistance of the major axis beam connections. The effect of increased
disturbing moments associated with stiffer connections would not arise in this instance
as the beam deformations and support rotations resulting from applied floor loads would
'be present at the time the ties/struts were installed. It is evident that whilst such a
system would be relatively easy to install, the analysis of the force distributions would
be complex and the method would have limited application. However, the author has
included it here as a possible area warranting further study.
9.8 The use of tension control bolts.
Tension control bolts (T.C.B.'s) are a new type of structural steelwork fastener which
has recently arrived on the U.K. market. The bolts are made from high strength steel
and are available in diameters ranging from 16mm up to 33mm. The bolt comprises a
rounded head, conventional nut and a modified threaded shaft. The bolt, together with
the fixing procedure, is illustrated in figure 9.2. The unique design of the bolt enables
it to be tightened with relative ease up to a predefined torque with the aid of a special
hand held power tool. As a result, the bolt exhibits a non-slip property similar to that
of a High Strength Friction Grip (H.S.F.G.) bolt, but with the advantage of a much
simplified fixing procedure.
9.6
It is clear that if such a bolt was used in a cleated beam to column connection, the
detrimental effect of bolt slip on the moment-rotation response of the connection would
be alleviated. The result would be a much more predictable, and in most cases stiffer,
connection behaviour. It is expected that the present relatively high cost of these bolts
would exclude their use in conventional 'simple' semi-rigid frames. However, with an in
creasing demand and increased distribution this situation may well change. In any event,
it is proposed by the author that the influence of this particular bolt on the semi-rigid be
haviour of steelwork connections should be investigated experimentally with subsequent
analytical frame studies to investigate the potential economic benefits of this advanced
bolt.
References.
9.1 Celikag, M., 'Moment-rotation behaviour of steel beam-to-column connections.', Ph.D. Thesis, Department of Civil and Structural Engineering, University of Sheffield, U.K., Februrary 1990.
9.2 Bjorhovde, R., 'Effect of end restraint on column strength. practical applications.', A.I.S.C. Engineering Journal, Vol. 20, No.1, First quarter, 1984, pp. 1-13.
9.3 Davison, J.B., Lam, D. and Nethercot, D.A., 'Semi-rigid action 0/ composite joints', The Structural Engineer (in press).
9.7

. direction of column failure .
Figure 9.1: Possible method of increasing the restraint to the head of an existing column.
Belore clamping
1 Bolt lip
o 14+----1
'E~----2
-H----3
2 Tension control diameter 3 Thread
During cllmplng
+---8 -t-HI----- 9
L~~~t:t:";;.~ reaction tension control diameter
H~~W--- .. _ .......... -Tfastening torque
~~;::~~=--5
.. Nut 5 Washer 6 Connected part 7 Connected part 8 Outer socket 9 Inner socket
~--6
"""'---7
Aher cllmplng
Tht bon "leIS 10 I", /ISltnlng torqu, ,nd she". ,"", lorque conlrol grOOrf when Ih' required lension Is ",ched
Figure 9.2: Installa.tion of a tension control bolt (T.e.B.).
Chapter 10
Conclusions.
This thesis has reported the findings of an experimental study into the behaviour of
a series of 10 full-scale column subassemblages and 2 full-scale multi-storey frames in
which the general condition of non-sway, 3-dimensional response has been considered.
The princjpal aim of the study was to examine the extent to which the inherent semi
rigid moment-rotation characteristics of 'simple' beam to column connections (Le. those
connections which are invariably assumed in steelwork design to act as 'pins' incapable
of transferring moment) influence the behaviour of rectilinear steel structures.
Also reported is a comparison between the behaviour observed in the subassemblage tests
with that predicted by a sophisticated finite element computer program developed by
others at the University of Sheffield. The close correlation which was achieved validated
the ability of this analytical tool to accurately predict the response of flexibly connected
3-dimensionaJ subassf'mbla.ges. The relatively limited observations on sub assemblage
response from the experimental testBwere then extended by using this computer program
to conduct a parametric study which examined the influence of semi-rigid connection
characteristics on a wide range of subassemblage configurations.
Due to the emphasis on experimental testing in this research project, the time devoted
10.1
to formulating semi-rigid design methods has been limited. Although a number of design
approaches which incorporate the inherent benefits of semi-rigid joint action have been
proposed by the author, the principal objective of formulating a single concise thoroughly
validated design approach, which can be used by practising designers, has not been
achieved. It is evident that for such a target to be attained, extensive parametric studies
are required using sophisticated computer software similar to that described above. In
chapter 9, which summarises the proposals for future work, this topic has been addressed
by highlighting possible extensions to the author's parametric study and semi-rigid design
proposals.
This final chapter presents a concise itemised summary of the major conclusions that
may be drawn from the execution of the research study and the interpretation of the re
sults which have been obtained. For the convenience of the reader, the conclusions have
been categorised under the headings experimentation techniques, connection behaviour,
frame and subassemblage response and frame design techniques. Where appropriate, the
source of the conclusions in the main body of the thesis has been cited for easy reference.
10.1 Experimentation techniques.
1. A preliminary analytical study undertaken to optimise the experimental set
up had shown (section 2.2.2) that the efl"ects of column behaviour due to the
small amounts of friction at a column end intended to be 'pin~ed' can be sig
nificant. The problem can be alleviated by introducing a fixed, or near fixed,
connection. It has been shown that the deviation in performance of such
a support condition has a negligible effect on the performance of relatively
slender columns and therefore provides a more consistent and easily defined
experimental boundary condition.
10.2

2. A technique has been developed (section 2.3.3) by which the centroidal axis
of relatively slender columns can be deformed in the weak direction into the
shape of a smooth bow of prescribed amplitude under elastic conditions. By
adopting this technique, an element of consistency was achieved between the
different sub assemblage tests and the subsequent analytical modelling of sub
assemblage behaviour was much simplified.
3. A technique has been developed (section 3.2) by which the readings from seven
strategically placed L.V.D.T.'s can be used to monitor each of the six com
ponents of 3-dimensional deformation at a specific point on a member. The
measurement system was designed to satisfy the requirements of ease of use,
unrestricted access in and around the testing rig and a low cost achieved by
utilising rea.dily available proprieta.ry measurement devices. Extensive studies
of the performance of a prototype arrangement clearly validated the accuracy
of the measurement technique.
4. An accurate measure of the internal actions, forces and moments occurring
in a steel 'H' section can be computed by performing a linear least-square
error approximation of the strains measured from a cluster containing 're
dundant' strain gauges (section 3.3). The benefits of this approach are most
pronounced for stress distributions in the elastic-plastic range where the of
ten erratic measurements from individual gauges in yielded zones tend to be
rationalised. The validity of the approach was proven by the close correlation
which was achieved between the total load applied to the subassemblage spec
imens and the axial load measured from the cluster strain gauges well into
the elastic-plastic range.
10.3
10.2 Connection behaviour.
1. It was reported in chapter 6 that, due to the effect of column web panel flex
ibility, the connection moment- rotation response measured from an isolated
'cantilever' connection test can be quite different from that measured from an
isolated 'cruciform' test (chapter 6). However, the moment-rotation responses
measured from these two types of test were, in general, similar to connection
response observed in the subassemblage and frame test for the corresponding .
structural arrangement (i.e. connection response to an internal column was
similar to that from a 'cruciform' test whilst that to an external column was
similar to that observed in a 'cantilever' test). Surprisingly, there was little
evidence of permanent deformation of any of the connection elements in either
the subassemblage or frame tests, certainly less than that which has been ob
served in many tests on isolated connections. This was principally due to the
relatively small connection rotations (typically less than 0.025 radians) which
were observed at the point of maximum applied load.
2. For the particular arrangement in which a pair of beams frame into the column
web, it has been shown (section 6.5) that due to the effects of beam conti
nuity and web flexibility the unloading connection stiffness (C,,) is not neces
sarily equal to the initial tangent stiffness (e.). The full 'loading-unloading'
response for a connection in this particular arrangement does not, therefore,
correspond to the measured response from either a conventional 'cantilever' or
a 'cruciform' connection test. This discrepancy.clearly illustrated a deficiency
in the present experimental procedures for assessing isolated connection re
sponse. An improved experimental test method has therefore been proposed,
together with an alternative semi-empirical approach, in which all the param
eters influencing the performance of beam to column connections are included.
10.4
3. A /3",n factor, which is a measure of the increase in strength of a column re
strained by semi-rigid connections compared to that achieved using fully rigid
connections, has been used to illustrate the reduced 'efficiency' of a web cleat
connection as the column slenderness is decreased (section 7.6).
10.3 Frame and subassemblage response.
1. A very close agreement has been achieved between the measured response
of the subassemblage test specimens and the predictions of a sophisticated
finite element computer program developed specifically for analysing three
dimensional column subassemblages (chapter 4). The degree of correlation
which has been attained has validated the program and demonstrated its use
fulness as an analytical research tool.
2. The parametric study reported in chapter 7 used the finite element program
introduced above to investigate the performance of a range of different column
subassemblage configurations employing a number of different member sizes
for both web-cleat and fully rigid connection types. The predicted ultimate
capacities were presented in the form of an o",n factor, defined as the ratio
of the failure load of a semi-rigidly restrained column to that of the pinned
end column. This showed that Cor subassemblages comprising a 3.8m long
column with web-cleat connections and SUbjected to a wide range of loa.ding
conditions, the beneficial effect oC connection restraint on the ultimate col
umn capacity out-weighed the detrimental effect of the transCerred disturbing
moment in nearly all cases. Only when subjected to the most onerous loading
pattern with a single beam connection to the minor axis of a stocky column,
in which strength criteria rather than buckling dictated the ultimate capacity,
did the detrimental effect of the disturbing moment out-weigh the benefit of
10.5

connection restraint (section 7.6). However, the maximum reduction in the
failure load compared to that of the pinned-end column was only of the or
der of a few percent. Under IUch loading conditions, it is interesting to note
that the predicted ultimate capacities of the corresponding rigidly connected
sub assemblages were leBB than those for the subassemblages with web-cleat
connections due to the more onerous effect of the increased column disturbing
moment. The results from this aspect of the study clearly demonstrated that
the enhancing effect of column restraint is more pronounced on columns of
greater slenderness. In addition, it showed that significant improvements can
be achieved in the axial capacity if, for a given floor loading, the column is
orientated such that the load on the major axis beam is maximised, whilst
the load on the minor axis beam, and hence the column minor axis disturbing
moment, is minimised.
3. Despite inducing significant major axis disturbing moments, all the columns
in both the experimental and numerical studies failed as a result of excessive
minor axis deformation. In some of the frame test columns, this was accom
panied by large twist rotations at the mid-height of the column· particularly
as the ultimate load was approached (sections 2.5.1 and 5.10). It was also
evident from the frame tests reported in chapter 5 that column segments in
multi-storey steel frames do not behave as isolated elements, but that there
is significant interaction between adjacent segments at all stages of loading.
This is particularly apparent at the point of fa.i1ure where a column, which
may have initially been providing restraint, transfers a disturbing moment to
an adjacent column as it deforms plastically. In one instance in frame test FI,
this resulted in the progressive failure of a particular column segment initiat
ing the failure of the adjacent lower segment •.
4. A recurring observation throughout the study was that the capacity of the col-
10.6
umn sections in both the experimental and numerical studies was enhanced
by the shedding of the minor axis disturbing moment. In instances where
an initial disturbing moment was applied, this often resulted in a complete
reversal of moment at the column head. Where there was no appreciable
disturbing moment, the restraining column head moment simply increased in
size without reversing. In both cases however, a pattern of minor axis mo
ments were developed at the ultimate condition in which the head moment
arising from the connection restraint was of the opposite sign to the moment
at the column centre. The redistribution of major axis moments was, in most
cases, negligible by comparison and only occurred when the column had little
residual stiffness as the failure load was approached.
5. It is evident from both the experimental and numerical studies which have
been conducted that the moment-rotation characteristics of 'simple' bolted
steelwork connections have a significant influence on the ultimate capacity,
. distribution of bending moments and deflection of 'non-sway' steel subassem
. blages and frames.
10.4 Frame design.
1. Comparisons of the ultimate column capacities obtained from both the exper
imental and analytical studies with those predicted from 'simple' frame design
techniques show that present methods of 'simple' non-sway frame design are
very conservative (section 8.3.7). This was attributed to a number of factors.
(a) The pattern of column moments assumed in design Is not representa
tive of the actual distribution of moments at failure, particularly (or
the minor axis of columns with a moderate to high slenderness.
10.1

(b) The actual disturbing moment from the beams does not correspond
with that assumed in 'simple' design where the vertical beam reaction
is considered to act at the centre of stiff bearing subject to a minimum
distance of lOOmm from the column face.
( c) The combined effect of forces and moments acting on a column ap
pear to be less onerous than that inferred from the additive nature of
the terms in the interaction equation.
(d) The guidance on the effective length, and hence the critical load, of
columns with standard idealised end conditions is, in most cases, very
conservative.
2. The author has proposed a number of ultimate limit state design approaches
in which the inherent benefits of semi-rigid frame action are taken into account
and consequently predict failure loads reasonably close to those observed in
the experimental and analytical studies. Firstly, it was evident from the ini
tial parametric study that small amounts of column restraint have a more
pronounced effect on columns of greater slenderness. A method has been
proposed in section 8.3.8 which utilises this phenomenon to provide a quick
assessment of effective length in which the column slenderness is taken into
account. This was developed as a modification to the present 'simple' method •
of column design. Using this approach, effective lengths were predicted which
were closer to those observed in the experimental tests when compared to
those predicted using current guidance. In addition a method of column de
sign was proposed (section 8.3.9) in which the column was considered as part
of a frame rather than as an isolated element. The forces were derived by
considering the deformed shape of the member at the condition when the
10.8
transferred minor axis moment reduced to zero during the moment reversal
stage. Comparisons with numerical data showed that this approach gave a
close prediction of the column deformation, the actual mid-column moments
and hence the ultimate capacity.
3. A method proposed by the author in section 8.2 for predicting the. deflec-
. tion of semi-rigid frames under serviceability loading conditions gave a good
correlation with the measured deflections in frame test Fl. In addition, it
appeared that the proposed technique was relatively insensitive to the precise
magnitude of the assumed linear connection stiffness. It was also shown how
this method could be extended to generate the design moments and column
effective lengths under ultimate loading conditions.
10.9