The Strelau Temperament Inventory as a Broad ... - CiteSeerX
21
Archrves ojClrnrcd Neuropsychology, Vol. 2, pp 307-327, 1987 O&37-6177/87 $3 00 + ,013 Prmted I” the USA All rights reserved CopyrIght ‘L 1987 National Academy of Neuropsychologlsts The Strelau Temperament Inventory as a Broad Classification System James R. Barclay Unrversny of Kentucky The Strelau Temperament Inventory (STI) is an instrument designed by Jan Strelau to measure broad characteristics of the central nervous system. In a study reported here an Amerrcan version of it was admrnistered to a group of introduc- tory psychology students, along with the 16PF test and an adJective check list. The findings of this study suggests that the ST1 does measure high and low reactrvrty m individuals and may have potentral uses for the classiftcatron of temperament characteristics in indrvrduals, particularly as a process of determin- ing approprrate learning or behavroral strategies designed to enhance learnrng. There is a rising interest in the exploration and definition of the nature of temperament. Although American studies have by and large avoided the formulation of Allport (1961) viewing temperament as a biologically-an- chored set of characteristics and concentrating on observed and psychomet- ric properties associated with temperament, (Barclay, 1983a; Buss & Plomin, 1975; Thomas & Chess, 1977) recently there has been an effort to formulate what are the core notions of temperament in a round-table discus- sion between Goldstein et al. (1987). Some of the conclusions reached in this interactive session were: (a) the construct of temperament is helpful despite the inability to define precisely how it interacts with environmental influ- ences (one observer noted that we have the same problem with the construct of intelligence); (b) temperament includes elements of activity (energy, in- tensity, vigor and pace of movement in both speech and thought, but not their contents), (c) temperament is characterized by varying degrees of reac- I am indebted to Dr. Robert Baker of the Psychology Department at the University of Kentucky in making his class available for the testing involved in this study. Requests for reprints should be sent to James R. Barclay, Educational and Counseling Psychology, University of Kentucky, 251 Dickey Hall, Lexington, KY 40506. 307 at Penn State University (Paterno Lib) on September 11, 2016 http://acn.oxfordjournals.org/ Downloaded from
-
Upload
khangminh22 -
Category
Documents
-
view
1 -
download
0
Transcript of The Strelau Temperament Inventory as a Broad ... - CiteSeerX

Archrves ojClrnrcd Neuropsychology, Vol. 2, pp 307-327, 1987 O&37-6177/87 $3 00 + ,013
Prmted I” the USA All rights reserved CopyrIght ‘L 1987 National Academy of Neuropsychologlsts
The Strelau Temperament Inventory as a
Broad Classification System
James R. Barclay
Unrversny of Kentucky
The Strelau Temperament Inventory (STI) is an instrument designed by Jan
Strelau to measure broad characteristics of the central nervous system. In a study
reported here an Amerrcan version of it was admrnistered to a group of introduc-
tory psychology students, along with the 16PF test and an adJective check list.
The findings of this study suggests that the ST1 does measure high and low
reactrvrty m individuals and may have potentral uses for the classiftcatron of
temperament characteristics in indrvrduals, particularly as a process of determin-
ing approprrate learning or behavroral strategies designed to enhance learnrng.
There is a rising interest in the exploration and definition of the nature of temperament. Although American studies have by and large avoided the formulation of Allport (1961) viewing temperament as a biologically-an- chored set of characteristics and concentrating on observed and psychomet- ric properties associated with temperament, (Barclay, 1983a; Buss & Plomin, 1975; Thomas & Chess, 1977) recently there has been an effort to formulate what are the core notions of temperament in a round-table discus- sion between Goldstein et al. (1987). Some of the conclusions reached in this interactive session were: (a) the construct of temperament is helpful despite the inability to define precisely how it interacts with environmental influ- ences (one observer noted that we have the same problem with the construct of intelligence); (b) temperament includes elements of activity (energy, in- tensity, vigor and pace of movement in both speech and thought, but not their contents), (c) temperament is characterized by varying degrees of reac-
I am indebted to Dr. Robert Baker of the Psychology Department at the University of Kentucky
in making his class available for the testing involved in this study.
Requests for reprints should be sent to James R. Barclay, Educational and Counseling Psychology, University of Kentucky, 251 Dickey Hall, Lexington, KY 40506.
307
at Penn State University (Paterno L
ib) on September 11, 2016
http://acn.oxfordjournals.org/D
ownloaded from

308 J R. Barclay
tivity, in terms of approach or withdrawal from stimuli, including emo- tionality and sociability; (d) temperament has its origins in biological predis- positions, and (e) temperament shows above all a unifying element in individual differences that tends to manifest a high degree of behavioral stability over time.
One of the major gaps in this symposium cited by one commentator, was the ignoring of the contributions of Eastern Bloc countries, particularly the work of Jan Strelau (1983). Strelau and other Russian and Polish colleagues have done a considerable amount of research relating to the properties of the central nervous system and temperament. Strelau has developed an invento- ry (The Strelau Temperament Inventory) that is anchored in physiological reactions. The purpose of this paper is to critique some of the research already done with this instrument and to report a study using a modified form of the ST1 along with an adjective check-list (Barclay, 1983a) and the Sixteen Personality Factor Test (Cattell, Eber, & Tatsuoka, 1970; Krug, 1981).
RATIONALE
The Problem of Measuring Biologically-Anchored Characteristics
A great part of the difficulty in temperament studies is related to two problems. The first of these is the tendency of American psychometric research to foster a horizontal analysis of personality as most usually depicted in profiles. This approach tends to support an observational or empirical tradition in this country that views all traits as equal. This position also tends to analyze traits in terms of high and low scores and to classify individuals into categories or bins that are seen more or less to be permanent structures. Judgments about categories to be assigned are often part of an internal set of rules (take the highest three scales yielding a code) or fit the characteristics into a structural system based on another discipline (DSM- III, American Psychiatric Association, 1980).
An alternative approach is to view observable or empirical traits as specif- ic manifestations of larger more centrally organized components of the central nervous system. This approach tends to view personality as hierar- chically-ordered and manifesting itself in dimensions that are subject to modification and change within a given range of biologically anchored components. This approach is much more relevant to the construct of tem- perament and is the one favored by Royce (1973, Royce & Mos, 1979), Powell, (1975), and Strelau (1983).
But when one chooses the hierarchical approach, the second problem is immediately evident, that is, how to determine psychometric properties of biologically anchored dimensions. Although no one really denies the fact
at Penn State University (Paterno L
ib) on September 11, 2016
http://acn.oxfordjournals.org/D
ownloaded from

Temperament Classification 309
that there are biological components to personality and behavior, the diffi- culty is identifying such characteristics from brain operation (Powell, 1979).
Given the fact that the brain appears to operate in a hierarchy of compo- nents that involve cell stimuli and response, assemblies that work together, interlocking components in terms of specific neural centers, hemispheres, and multiple enervation of parts to the whole, it is virtually impossible to match up any of the known sources of measurement, for example, electro- chemical ones, responsive behavior, and psychometrics, to any specific brain function. Thus as Powell has observed we are almost always constrained to make inferences about linkages between observed behavior and brain opera- tions.
Nonetheless, both British researchers such as Eysenck (1957, 1970) and Gray (1970, 1972) as well as the Russian and Eastern Bloc research reported by Strelau have tried to anchor empirically-observable characteristics to elements of the central nervous system. Strelau (1983, p. 117) argued with some Russian scientists over the question of whether psychologists should be concerned about central nervous system components. He points out that Pavlov’s use of the term “behavior” was in his thinking a synonym for “higher nervous activity.” Psychologists should be conversant with such processes states Strelau because the equilibrium between the organism and its environment is regulated through conditioned reflex activity that has its anatomical basis in the central nervous system. In addition, if we are to consider the research of Bandura (1977) and Kelvin (1969) it is most likely that our original (as well as continuing) behavior is shaped strongly by implicit interpersonal expectations imposed on us by our parents, peers, mentors, and models. These expectations provide a continual barrage of implied threats and social pressures, and it is most likely because of individ- ual differences in arousal, excitation and inhibition that dispositional pat- terns of coping become stabilized over time.
Differences Between Eastern and Western Theories
Eysenck’s theory (1957, 1970) postulates direct neural connections rela- tive to the constructs of extroversion and introversion. But his theory was advanced initially as a set of hypotheses. Eysenck maintains that extroverts differ from introverts, with respect to the speed with which excitation and inhibition are produced, the strength of excitation and inhibition obtained, and the speed with which the inhibition is dissipated. These differences are related to stimulus-response connections and properties of the physical structure of the brain. Individuals in whom excitatory potential is generated slowly and in whom excitatory potentials so generated are relatively weak, are predisposed to develop extroverted patterns of behavior; individuals in
at Penn State University (Paterno L
ib) on September 11, 2016
http://acn.oxfordjournals.org/D
ownloaded from

310 .I R. Barday
whom excitatory potentials are strong are predisposed to develop introverted patterns of behavior.
Crucial to the understanding of Eysenck’s theory is an understanding of what is meant by excitation and inhibition. Excitation concerns the ease with which impulses can travel from neuron to neuron in a very general sense, but it also includes the growth of connections between specific neurons (learn- ing). Inhibition includes both Pavlov’s distraction by an external source or an internal gradual buildup of resistance to a conditioned reflex. Eysenck’s theory has been the most prominent Western view on the biological compo- nents and characteristics of temperament. And yet there has been a tendency to equate the biological components with psychometric properties. Thus, for example, extroversion and introversion are seen as points along a psy- chometric continuum. This leads in test interpretation to the categorization of individuals as either extroverts or introverts. Powell (1979) has faulted this tendency pointing out that one must consider excitation, inhibition, strength of arousal and intensity of arousal as a complex of interacting biological components that actually lead to a matrix of 32 cells, only one of which represents the classical introvert and another one the classical extro- vert .
Soviet and Eastern Bloc researchers from Pavlov on have been interested in identifying the characteristics of temperament as a form of nervous sys- tem typology. Until recently, they have had little interest in relating this body of research to psychometrics. According to Strelau (1983) the work of Neby- litsyn (1972) has summarized Eastern Bloc studies by suggesting a division of nervous system properties into primary and secondary ones. There is much agreement on the primary properties, but considerable disagreement on secondary ones. Rather than take this discussion far afield, our focus will be with the primary ones.
The four primary ones are identified as strength, mobility, dynamism, and lability. Gilliland (1985, p. 161) provides a succinct description of these primary properties: “The strength property refers to the endurance of work- ing capacity of the nerve cells. Traditionally, the term strength of the ner- vous system has referred to excitatory neural process strength with reference to inhibitory neural process strength as such. Mobility is believed to reflect the speed in substituting one process for another, that is the ability to relearn or recondition rapidly. Lability represents a property that mediates the gen- eration or termination rate of nervous processes. The fourth property, dyna- mism, reflects the speed and ease of conditioned response formation mani- fested in the initial adaptation capacity of the organism” (italics are mine not the author’s).
Each of these four primary properties are derived from the two major components of excitation and inhibition. Thus each primary property repre- sents (in psychometric terms) a continuum somewhere on an intersect be-
at Penn State University (Paterno L
ib) on September 11, 2016
http://acn.oxfordjournals.org/D
ownloaded from

Temperament CIassification 311
tween excitation and inhibition. One of the most important derived elements of Strelau’s formulation of these components is what he calls “balance” or a ratio of the sum of excitation responses divided by the sum of inhibition responses. The ratio obtained from these two major forces provides an index as to how individuals are governed in terms of their ability to do long-lasting and intensive work, and their ability to regain control and restrain them- selves from such activities. Individuals who have an equal excitation and inhibition thrust tend to show an index of 1 .OO. Individuals who are energet- ic and uninhibited tend to have an index greater than 1.00, and those who are more inhibited tend to have indices lower than 1 .OO.
The ratio score or what Strelau terms “balance” appears to provide a good means of distinguishing between high reactive and low reactive indi- viduals. Although the comparison between Eysenck’s terminology and Stre- lau’s is not exact, individuals who are highly reactive (i.e., with low ratio scores and a poor balance between excitation and inhibition) tend to be introverts, sensation avoiders, more anxious with regard to punishment, more impulsive with regard to rewards, and more efficient in learning. Indi- viduals who are low on reactivity (i.e., with high ratio scores favoring con- siderably excitation over inhibition) tend to be extraverts, sensation-seekers, low anxious with regard to punishment, less impulsive with regard to re- wards, and less efficient in learning.
A number of studies highlight differences between high reactive and low- reactive individuals. Kozlowski (1977) found in a study of decision-making that low-reactive individuals tended to favor precipitous and hazardous deci- sions, whereas high-reactive ones tended to be cautious. In terms of learning tasks where such tasks were analyzed as primary direct ones or auxiliary indirect ones that modify, enhance or explain the primary ones, Materska (1978) found that high school students who were low-reactive tended to favor the primary direct tasks over the auxiliary indirect and exploratory ones. On the contrary, high-reactive individuals tend to show more auxiliary responses. In addition, Strelau (1983) reported that low-reactive individuals tend more often to be mountain climbers, and glider pilots, basketball and volleyball players, and high-reactive individuals more often non-sportsmen.
Strelau ‘s Temperament Inventory
One of the problems in Eastern Bloc research is that studies of tempera- ment involve physiological measures and laboratory situations. Given the thrust of research with central nervous system properties, Strelau formula- ted an inventory based as closely as possible on the findings of laboratory studies. He constructed a 150 item questionnaire that is derived mainly from laboratory research with central nervous system properties.
Since the common biological components recognized by many research-
at Penn State University (Paterno L
ib) on September 11, 2016
http://acn.oxfordjournals.org/D
ownloaded from

312 J. R. Barclay
ers were: strength of excitation, strength of inhibition and mobility, Strelau focused on these three major dimensions. He also included one secondary property which he called “balance” and was the ratio obtained when the score of inhibition was divided into the score of excitation.
Strelau defined strength of excitation as: “the ability to do long-lasting intensive work, speed of recovery after fatigue and intensive activity, persist- ence and ease in coping with obstacles.” Strength of inhibition is defined as “the ability to regain control, the ability to refrain from a given activity, and restrained speech.” Finally, mobility of the nervous system is defined as “ease of passing from one activity to another, ability to organize behavior in situations requiring different kinds of activity, and uninhibited social con- tacts” (Strelau, 1983, p. 116).
Strelau attempted first in the development of his instrument to associate his findings with laboratory experiments. Many of these experiments used measures of arousal and conditioning. This was certainly consistent with the work of Hebb (1955) and Berlyne (1960) and the formulation of Gray (1964) that suggested arousability to be at the source of high and low reactive individuals. In Eastern Bloc terminology a weak nervous system was equated with high reactivity and a strong nervous system with low reactivity. Though there are differences relative to the physiological mechanisms in- volved in such laboratory studies, it would seem that a consensus indicates that the reticular-formation cortex loop and the limbic system of the brain are the basic sources of the reactivity dimension (Strelau, 1985).
Strelau’s formulation of his inventory (STI) used the measures of excita- tion, inhibition, mobility and balance (ratio) that were consistent with labo- ratory research. There were four studies which directly related to the validity of his scales. He found that there were correlations between his scales and the referent extinction with reinforcement method as regards GSR (Khalik, 1972), strength of excitation measured in a CR eyelid procedure (Samonov, 1974) and two other studies that examined correlations done by Russian psychologists who compared the estimation of strength as diagnosed by the Strelau with the diagnosis of excitation and inhibition by the method of change of simple RT under repeated applied stimuli (Dorfman, 1976, Vyatkin & Chekirov, 1976). Strelau reports all correlations of ST1 scales with physiological measures to be significant at the .05 level or better (Strelau, 1983, p. 135).
In addition Terelak (1974) looked at pilots who had both high and low alpha indices and found that there were positive correlations between excita- tion and balance (suggesting that the higher the level of excitation, the higher the ratio score or preponderance of excitation over inhibition). Zar- zycka (1980) examined the ST1 scores of train drivers who have accidents and those who do not. She was able to identify 59 accident makers in a random sample of 174 drivers but also found negative correlations between
at Penn State University (Paterno L
ib) on September 11, 2016
http://acn.oxfordjournals.org/D
ownloaded from

Temperament Classification 313
excitation and balance, suggesting that the higher the excitation score, the lower the ratio score, thus leading perhaps to more rash decisions and impul- sive behavior.
Recently, there have been other studies reported. Carlier (1985) did a factor analysis of Strelau’s scales and related them both to the Eysenck Personality Inventory and Cattell’s Anxiety Questionnaire. Gilliland (1985) presents data showing correlations between the STI, the Eysenck Personality Questionnaire and the Zuckerman sensation seeking scales. Relatively small samples of students were used in most of these studies. However, the ST1 excitation scale loads both on neuroticism and anxiety as well as inhibition and mobility, and for those who wish to identify the biologically based variable of excitation with specific psychometric variables, these findings appear problematic.
One of the major contributions of Strelau’s work is that he has attempted to anchor the psychometric properties of his inventory on laboratory re- search findings. In so doing, however, he has had to compromise one of the three major criteria of value in the methodological domain. This is preci- sion. Every researcher has to attempt to meet the criteria of generalizability, precision and realism (Brinberg & McGrath, 1985). If one utilizes the labo- ratory, great precision and control of behavioral variables can be had. But the generalizability and realism of the findings are suspect. If one chooses the field setting, there may be more realism, and possibly more generaliza- bility, but less precision. Notwithstanding this fact, Strelau’s inventory is more laboratory based than any other presently known instrument.
Thus far, in evaluating the STI, the European studies appear to be highly supportive of relationships to physiological studies. The studies of Carlier and Gilliland in relating the ST1 in a linear way to certain Western psycho- metric scales are somewhat ambivalent. This may well be that the ST1 is based on laboratory studies whereas many Western scales are derived from a logical-rational point of construction. Because of these conflicting findings, the present study sought to relate the ST1 to the 16 PF, perhaps the most rigorous of factor-analytic derived inventories and to the adjectival ratings section of the Barclay Classroom Assessment System (Barclay, 1983a) that forms part of a three-fold input to a multi-trait, multi-method approach to estimating temperament.
METHOD
The ST1 was translated into English as included in the appendix to Stre- lau’s (1983) book. Permission was obtained from the author to use the inventory. The English of the translation was British-English and was there- fore slightly modified in certain words by the writer to be more consistent with the American usage of English. Two items were not appropriate to
at Penn State University (Paterno L
ib) on September 11, 2016
http://acn.oxfordjournals.org/D
ownloaded from

314 .l R. Barclay
American culture and were dropped. In this study, the two shorter forms were used and randomly distributed to the sample. One was called form A and the other form B. In addition to the STI, the 16 Personality Factor test was administered as well as an adjective checklist developed by Barclay (1983a) as a part of the Barclay Classroom Assessment System.’
The adjective checklist consists of a series of adjectives which are present- ed to the individual and the individual rates the extent to which the adjective is descriptive of his or her personal characteristics. For example, an individ- ual would be asked whether the adjective “optimistic” could be applied to his or her behavior. A “yes” response would mean that the adjective is generally applicable and appropriate, a “no” response would mean that the adjective is seldom or never appropriate. A ? (question) response means that the adjective is sometimes appropriate. This same format is the one used by the STI. The adjectives are grouped into four scales: PHL, for phlegmatic or stable introverted traits; SAN, sanguine for extroverted stable traits; MEL, melancholic for introverted unstable traits; and CHL, choleric for extrovert- ed unstable traits. The ST1 yields four scores: excitation, inhibition, mobili- ty, and a composite ratio score which indicates the proportion between excitation over inhibition.
These three tests were administered to a group of 85 beginning introduc- tory psychology students at the University of Kentucky in the fall semester of 1985. There were 45 males and 40 females who completed all testing materials. The majority of these individuals ranged in age from 19 to 24. The testing was administered during class time and all students earned credit for the class by completing the STI, the 16PF, and the adjective check-list.
The data analysis included correlations between the 16 PF variables and the eight proceeding variables. It also included correlations with the second- order factors of the 16 PF and a factor analysis of all variables.
A comparison of the two forms of the Strelau Inventory indicated that there were no significant differences observed between them. Comparisons between males and females indicated that there were no significant differ- ences between males/females in seven of the eight scales. The eighth scale, the ratio between excitation and inhibition, showed a significant difference between males and females. Therefore in computing T-scores for each of the scales, the total sample was used in all cases except the ratio score where separate sex norms were developed. For the 16PF, the raw scores were used for correlations. However, in the computation of second-order factors the separate published norms for males and females were used.
‘Supplementary materials including copies of the Strelau and Barclay Adjectival Ratings may
be obtained from the author. In addition, information on the tentative norms developed for these scales and a micro-computer program for estimating temperament dimensions drawn
from these sources may also be obtained.
at Penn State University (Paterno L
ib) on September 11, 2016
http://acn.oxfordjournals.org/D
ownloaded from

Temperament Classification 31s
RESULTS
Tables 1 and 2 provide summaries of the correlations obtained between certain variables. For clarity purposes, only significant correlations are re- ported and those in a zero-order format. Table 1 provides a summary of zero-order correlations for the four adjective-checklist variables, and Table 2 provides a summary of zero-order correlations for the ST1 variables.
Table 1 provides some interesting information about the relationship of self-reported adjectives to the STI. Both stable scales (PHL and SAN) show positive correlations with the ST1 excitation scale, whereas the unstable scales (MEL and CHL) show negative correlations. The differences between the stable scales are also highlighted by the ST1 inhibition, mobility and ratio correlations. Introverted stable high scorers (PHL) tend to show a significant correlation with inhibition, but no significant correlations with mobility or the ratio score, suggesting that they are stable, controlled, not very flexible and balanced in their excitation and inhibition thrusts. Outgo- ing stable individuals (SAN) tend to show a high score on mobility, and higher ratio scores. The rest of the correlations suggest that this is because they are venturesome, outgoing, happy-go-lucky, self-assured, and relaxed.
The findings for the unstable scales (MEL and CHL) show that high scorers on these self-reported adjectives tend to have low scores on both inhibition and excitation. MEL is associated with apprehensiveness, tense- ness, passivity, and undisciplined behavior. CHL is associated with suspi- ciousness, tough-mindedness, and emotional instability.
Table 2 provides some descriptive analyses of what the ST1 dimensions appear to be related to. Excitation is associated with a high level of energy and it is also associated with high outgoing stable traits, the ability to shift, a venturesome uninhibited response association, internal stable traits, emo- tional stability, enthusiasm, assertiveness, competition, and self-sufficiency. It also shows a significant relationship to higher levels of inhibition. Other correlations reflect an experimental free-thinking approach, an outgoing warm-hearted, forthright, genuine, and relaxed stance towards others.
Inhibition appears to be closely related to introversion, but stable trait characteristics. It shows a significant relationship to emotional stability, to a tender-minded sensitivity to others, to mild characteristics, to a trusting and accepting point of view and to a relaxed stance. It is definitely not related to unstable behavior.
Mobility appears to be related to a large extent to extroversion, since a higher score on mobility tends to be associated with venturesome, bold, enthusiastic, assertive, aggressive, outgoing, and dominant behavior. Mobil- ity also shows a high relationship to excitation, and a tendency to be a joiner and follower in the sense that individuals with a high mobility score tend to be more socially attuned to others.
at Penn State University (Paterno L
ib) on September 11, 2016
http://acn.oxfordjournals.org/D
ownloaded from

TA
BL
E
1
Zer
o-O
rder
C
orre
latio
ns
for
Adj
ectiv
e Se
lf-R
atin
gs
PHL
(I
ntro
vert
ed-S
tabl
e)
SAN
(E
xtro
vert
ed-s
tabl
e)
ME
L
(Int
rove
rted
-Uns
tabl
e)
CH
L
(Ext
rove
rted
-Uns
tabl
e)
Var
iabl
e R
D
escr
tptto
n V
aria
ble
R
Des
crip
tton
Var
iabl
e R
D
escr
iptio
n V
aria
ble
R
Des
crip
tion
SAN
.6
6*
Q3
.42*
E
X
.40*
IN
36
A
.3
3
err
.27
2 ;2
-
.22
0 ~
.31
44
- .3
9 M
EL
~
.44*
CH
L
~ .5
7*
Ext
rove
rted
- St
able
C
ontr
olle
d ST
1 E
xcit
ST1
Inhi
b.
Out
goin
g C
onsc
ient
ious
D
epen
dent
Se
lf-A
ssur
ed
Rel
axed
U
nsta
ble
Intr
over
sion
U
nsta
ble
Ext
rove
rsio
n
PHL
.6
6*
H
.60*
E
X
.60*
A
.5
3*
MO
.5
0*
F .4
5*
:3
.40
.31
RA
TIO
.3
7
Ql
.25
Q4
- .2
6
0 -
.32
CH
L
p.35
Q2
- .3
9 M
EL
-
.53*
Intr
over
ted
Stab
le
Ven
ture
som
e ST
1 E
xcit.
O
utgo
ing
ST1
Mob
. H
appy
-go-
Luc
ky
Stab
le
Con
trol
led
ST1
Rat
io
Exp
erim
enta
l
CH
I
0 Q4
H
:3
A
MO
F H
Rel
axed
IN
Self
-Ass
ured
U
nsta
ble
Ext
rove
rsio
n G
roup
D
epen
dent
U
nsta
ble
Intr
over
sion
PHL
-
.44’
St
able
In
trov
ersi
on
EX
~
.52*
ST
1 Ex
cit
SAN
c
.56*
.44*
.4
0*
.22
~ .2
1 -
.25
- .3
3 -
.34
- .3
4 ~
.39
- .4
1*
~ .5
3 -
.58*
Ext
rove
rted
U
nsta
ble
Gui
lt-Pr
one
Ten
se
Uni
nhib
ited
Pass
ive
Und
isci
plin
ed
Det
ache
d ST
1 M
ob.
Sobe
r,
Seri
ous
Shy,
Thr
eate
ned
ST1
Inhi
b
Stab
le
Ext
rove
rsto
n E
mot
iona
l
ME
L
44
L
0 1 G
EX
SA
N
43
IN
C
PHL
~
.57*
St
able
In
trov
ersi
on
.41*
35
.2
9 -
.21
- .2
8 -
.32
- .3
5 -
.37
- .4
6*
Intr
over
ted
Uns
tabl
e T
ense
Su
spic
ious
A
ppre
hens
tve
Self
-Rel
iant
E
xped
ient
ST
1 E
xcit.
E
xtro
vert
ed-S
tabl
e U
ndis
ctpl
ined
ST
1 In
hib.
- .4
8*
Em
ot.
Inst
abili
ty
N=
85
*
=p
at
.OO
Ol;
all
othe
r co
rrel
atio
ns
stgm
fica
nt
at
.05
or b
ette
r.
at Penn State University (Paterno Lib) on September 11, 2016http://acn.oxfordjournals.org/Downloaded from

TA
BL
E
2 Z
ero-
Ord
er
Cor
rela
tion
s w
ith
ST1
Scal
es
Exc
itatio
n In
hibi
tion
Mob
ility
R
atio
(B
alan
ce)
Var
iabl
e R
D
escr
iptio
n V
aria
ble
R
Des
crip
tion
Var
iabl
e R
D
escr
iptio
n V
aria
ble
R
Des
crip
tion
SAN
MO
H
PHL
C
E
F Q3
; A
:4
CH
L
0 ME
L
.60*
St
able
E
xtro
vers
ion
.59*
ST
1 M
ob.
.55*
V
entu
reso
me
.55*
ST
1 B
alan
ce
.40*
St
able
In
trov
ersi
on
.38
Em
ot.
Stab
i. .3
5 A
sser
tive
.28
Ent
husi
astic
.26
Self
-Suf
fici
ent
.26
ST1
Inhi
b.
.24
Exp
erim
enta
l .2
2 O
utgo
ing
- .2
1 Fo
rthr
ight
~
.24
Rel
axed
-
.32
Uns
tabl
e E
xtro
vers
ion
- .3
7 Se
lf-A
ssur
ed
- .5
1*
Uns
tabl
e In
trov
ersi
on
PHL
C
I EX
E
L
ME
L
CH
L
44
Rat
io
.36
Stab
le
Intr
over
sion
.2
8 E
mot
iona
l St
abili
ty
.27
Sens
itivi
ty
.26
ST1
Exc
it.
- .2
6 H
umbl
e-M
ild
- .3
0 T
rust
ing
- .4
0*
Uns
tabl
e In
trov
ersi
on
- .4
6*
Uns
tabl
e E
xtro
vers
ion
- .5
8*
Rel
axed
-
.62*
ST
1 B
alan
ce
H
EX
F PHL
R
atio
E
A Q1
.56*
V
entu
reso
me
.54*
ST
1 E
xcit.
.53*
E
xtro
vers
ion
.50*
St
able
In
trov
ersi
on
.34
ST1
Bal
ance
.32
Dom
inan
t .2
9 O
utgo
ing
.29
Exp
erim
enta
l
- .2
2 Fo
rthr
ight
-
.26
Follo
wer
EX
E
H
SAN
M
O
44
B
I IN
.53*
ST
1 E
xcit.
.44*
A
sser
tive
.39
Ven
ture
som
e .3
7 St
able
E
xtro
vers
ion
.34
ST1
Mob
.
.30
Ent
husi
astic
.2
8 E
xper
imen
tal
.25
Ten
se,
Dri
ven
- .2
8 C
oncr
ete
Thi
nkin
g -
.3 1
Se
lf-R
elia
nt
- .6
2*
ST1
Inhi
bitio
n
N=
85
*
=p
at
.OO
OI,
othe
r co
rrel
atio
ns
sign
ific
ant
at
.05
or b
ette
r,
at Penn State University (Paterno Lib) on September 11, 2016http://acn.oxfordjournals.org/Downloaded from

318 .I R. Barclay
The ratio score shows some very interesting relationships. As will be recalled the ratio score is the product of the division of inhibition into excitation. Thus a low ratio (less than 1 .OO) would indicate that inhibition is higher than excitation and a high ratio score that excitation is higher than inhibition. High ratio scores are associated with higher levels of excitation, assertive aggressive behavior, uninhibited adventuresome behavior, external stable traits, higher levels of mobility and traits of enthusiasm, experimental free-thinking, tense and driven behavior. Higher ratios are also associated negatively with factor B of the 16 PF suggesting a concrete mode of think- ing. Higher ratio scores are also characterized by high levels of tough-mind- ed self-reliance and lower levels of inhibition.
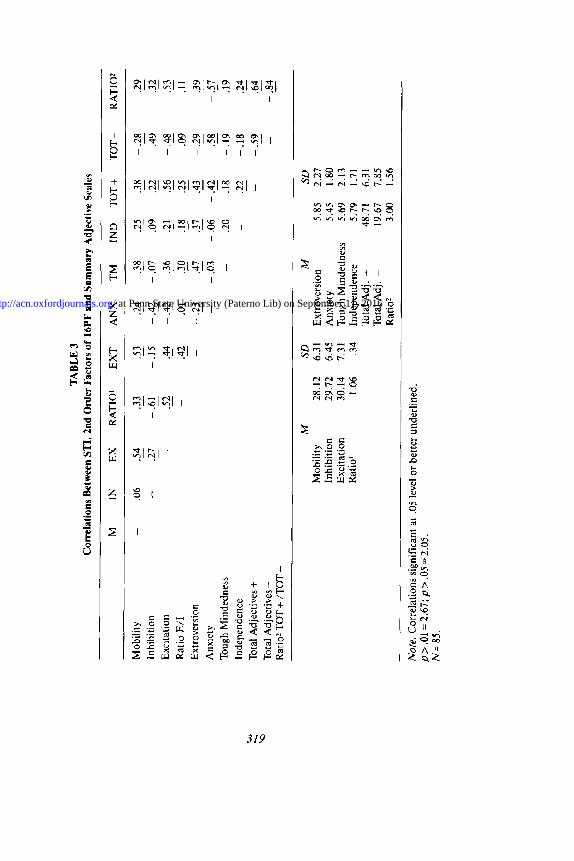
Tables 3-5 present further analyses. Table 3 provides the correlations between ST1 scales and the second-order factors of the 16 PF. In addition the total positive adjective scales (PHL and SAN) were combined to repre- sent TOT + and the negative scales (MEL and CHL) to represent TOT - . A second ratio score was obtained by dividing TOT - into TOT + (ratio 2).
Table 4 provides regressions run using the non-ST1 variables as dependent ones and ST1 mobility and ratio scores as independent ones. The ratio score was used in these analyses because it provides a composite of excitation and inhibition indices. Finally, Table 5 presents the varimax rotation of the factor analysis of the adjectival ratings, the ST1 scales and the 16 PF scales.
In Table 3 of primary interest is the fact that mobility appears to show an equal positive relationship both to the ST1 excitation scale and the 16 PF extroversion factor. It also shows a positive relationship to positive adjective descriptors and a negative relationship to anxiety. Thus it would appear that mobility is related to positive self-evaluation, and reasonably high levels of excitation and extroversion. The ST1 ratio score correlates positively with extroversion, but does not show any significant relationship to either anxiety or the composite ratio of adjectival descriptors. It would thus seem that the ratio score represents a variety of components that can be centered on the notion of flexibility, lack of rigidity and sensitivity to contextual settings.
The regressions suggest that both mobility and the ST1 ratio score show relatively good prediction of unstable or stable behavior. Perhaps this is so because these two sets of adjectives most directly reflect flexibility either in a negative way (MEL) or in a positive manner (SAN). From the rest of the regressions it is apparent that the ST1 ratio score shows a high degree of prediction for all of the 16 PF second-order factor scores.
Finally, the factor analysis in Table 5 identifies four factors: emotional stability, extroversion, activity, and what appears to be interpretable as a kind of driven compulsion. Mobility and the ST1 ratio score appear to load on factors 2, 3, and 4 whereas only the ST1 excitation score loads on factor 1. Such findings might suggest that emotional stability is more of a contex- tual dimension, influenced more often by social situations. If this interpreta-
at Penn State University (Paterno L
ib) on September 11, 2016
http://acn.oxfordjournals.org/D
ownloaded from
TA
BL
E
3 C
orre
lati
ons
Bet
wee
n ST
I,
2nd
Ord
er F
acto
rs
of
MP
F
and
Sum
mar
y A
djec
tive
Sc
ales
M
IN
EX
R
AT
IO’
EX
T
AN
X
TM
IN
D
TO
T +
T
OT
-
RA
TIO
*
Mob
ility
.0
6 .z
_3
J .5
3 -.2
4 .3
8 .2
5 .3
8 -
.28
.29
Inhi
bitio
n -
.27
- .6
1 -.
Is
-.42
-.G
-.G
.z
- .G
-
Exc
itatio
n -
.g
.44
-Z
.36
.z
- .4
8 .5
3
Rat
iolE
/I
- .4
2 .G
.C
I
.u
.56
.E
.25
.G
.G
Ext
rove
rsio
n -
- .2
3 .z
.x
.4
3 -
.29
- .0
6 -.4
2 .5
8
.z
Anx
iety
-
- .0
3 -
.z
Tou
gh
Min
dedn
ess
- .2
0 .1
8 -.G
.1
9
Inde
pend
ence
-
.22
- .I
8 -
.g
Tot
al
Adj
ectiv
es
+ -
- s9
- .F
T
otal
A
djec
tives
-
- -.8
4 R
atio
? T
OT
+ /
TO
T
- -
M
SD
M
SD
Mob
ility
28
.12
6.31
E
xtro
vers
ion
5.85
2.
27
Inhi
bitio
n 29
.72
6.45
A
nxie
ty
5.45
1.
80
Exc
itatio
n 30
.14
7.31
T
ough
M
inde
dnes
s 5.
69
2.13
R
atio
’ 1.
06
.34
Inde
pend
ence
5.
79
1.71
T
otal
A
dj.
+ 48
.71
6.31
T
otal
A
dj.
- 19
.67
7.85
R
atio
2 3.
00
1.56
Not
e.
Cor
rela
tions
si
gnif
ican
t at
.0
5 le
vel
or b
ette
r un
derl
ined
. p>
.O
l = 2
.67;
p>
.05
= 2
.05.
N
=
85.
at Penn State University (Paterno Lib) on September 11, 2016http://acn.oxfordjournals.org/Downloaded from

320 J R. Barclay
TABLE 4 Summary of Regressions
Dependent Variable Predictors Coefficient Beta Wgt. Multiple RZ -
MEL (unstable introvert characteristics)
PHL (stable introvert Mobility ,008 ,161 characteristics) Constant 20.64
SAN (stable extrovert characteristics)
Mobility ,268 ,420 Ratio’ 2.654 .225 Constant 15.43
CHL (unstable extrovert characteristics)
EXTROVERSION (second- order 16 PF factor)
ANXIETY (second-order 16 PF factor)
TOUGH MINDEDNESS (second- order 16 PF factor)
INDEPENDENCE (second- order 16 PF factor)
Mobility Ratio’ Constant
Ratio’ Mobility Constant
Ratio* Sex Mobility Ratio Constant
Ratio2 Sex Mobility Ratio’ Constant
Ratio2 Sex Mobility Ratio’ Constant
Ratio’ 1.95 ,177 Sex 4.64 ,135 Mobility ,371 ,136 Ratio’ 6.84 ,135 Constant 27.48
- ,266 - ,388 1.811 .I43
15.39
3.05 ,229 - .163 - ,226 11.15
3.67 ,252 4.18 ,092 1.24 ,344
19.78 ,296 - 14.58
- ,656 - ,567 7.881 ,219
- ,442 - ,154 8.46 ,159
66.13
.849 ,062 10.98 ,258
.85 ,252 16.06 ,255 - 2.800
.365 ,133
.161 ,026
,540 ,292
,261 ,068
,643 ,414
3624 ,390
.498 .248
.346 .120
tion is accurate, the ST1 contributions to factors 2, 3, and 4 may reflect more trait characteristics than factor 1. Since Strelau (1983, p. 176) suggests that excitation is primarily a measure of reactivity, that is, determining the stabil- ity of reactions to different stimuli, with high reactivity being associated with low excitation, it is possible that factor 1 represents more of a set of state characteristics than traits. What this suggests is that patterns of stable and unstable behavior may be more susceptible to psychotherapy and change. Such a conclusion would favor the notion that extroversion, activi-
at Penn State University (Paterno L
ib) on September 11, 2016
http://acn.oxfordjournals.org/D
ownloaded from

TA
BL
E
5
Fac
tor
Ana
lysi
s (V
arm
imax
R
otat
ion)
Fact
or
1
Em
otio
nal
Stab
ility
Fact
or
2 Fa
ctor
3
Loa
ding
E
xtro
vers
ion
Loa
ding
A
ctiv
ity
Fact
or
4
Dri
ven
Loa
ding
C
ompu
lsio
n L
oadi
ng
C
Q,
EX
SA
N
L
CH
L
ME
L
44
0
Em
otio
nal
Stab
ility
C
ontr
olle
d E
xcita
tion-
activ
ity
Stab
le
Ext
rove
rsio
n T
rust
ing-
acce
ptin
g U
nsta
ble
Ext
rove
rsio
n U
nsta
ble
Intr
over
sion
R
elax
ed
tran
quil
.716
A
.413
.3
29
.308
-.
3ll
- ,3
97
- .5
57
- .6
32
Self
ass
ured
~
,761
F H
SAN
M
O
E QZ
Out
goin
g .7
29
EX
E
xcita
tion
.758
R
atio
’ R
atio
E
/l
,754
Hap
py-g
o-lu
cky
.633
M
O
Ven
ture
som
e/bo
ld
.586
H
St
able
,5
16
Rat
io’
Mob
ility
,3
82
F A
sser
tive/
,3
05
SAN
co
mpe
titiv
e Fo
llow
er/jo
iner
-.6
57
Q,
Mob
ility
V
entu
reso
me/
bold
R
atio
E
/l
Hap
py-g
o-lu
cky
Stab
le
Ext
rove
rsio
n
.591
Q
4 .5
86
E
.475
C
HL
,4
35
INH
,3
50
Ten
se
.394
A
sser
tive
Com
petit
ive
,332
U
nsta
ble
Ext
rove
rsio
n ,3
01
Inhi
bitio
n -
.848
Exp
erim
enta
l Fr
ee-t
hink
ing
Ass
ertiv
e C
ompe
titiv
e Fo
rthr
ight
/ ge
nuin
e U
nsta
ble
Intr
over
sion
,316
E
N
ME
L
,305
- .3
6l
- .3
82
Eig
enva
lue
%
Var
ianc
e %
Cum
ulat
ive
Var
ianc
e
5.49
3.
65
1.38
1.
27
39.2
26
. 9.
9 9.
1
39.2
65
.3
75.1
84
.2
Not
e.
Loa
ding
s of
.3
0 an
d ab
ove
repo
rted
. N
=
85.
at Penn State University (Paterno Lib) on September 11, 2016http://acn.oxfordjournals.org/Downloaded from

322 J. R. Barclay
ty, and driven compulsion are more appropriately viewed as trait characteris- tics linked directly to the central nervous system.
DISCUSSION
From the data analysis it would appear that the Strelau scales can be clarified as to what they represent by the correlational analyses with the self- report adjectives and the 16 PF scales. Excitation is clearly related to stable behavior rather than being dichotomously associated with extroversion. There are a number of correlations that establish this fact. But a balance between excitation and inhibition appears also to be related to stable behav- ior. Clearly it would seem that excitation without some inhibition leads to hazardous and rash decision-making and most likely to poor interpretations of reality leading to unstable behavior. This is demonstrated in the signifi- cant negative relationships between CHL, and MEL and excitation. The same relationship exists with CHL and MEL and inhibition.
The factor analysis reported is also very interesting in that the factor structure of the adjective scales, the 16 PF and the ST1 is virtually identical with the common factor structure of the CPI and the 16PF determined by Stroup and Manderscheid (1977). In their first factor (general adjustment) the significant loadings from the 16 PF are 43, 0, 44, and L. All of these are included in the present factor analysis for factor 1. In addition, the Strelau Excitation scale correlates significantly with Q3, 0, and 44. Like- wise, for Stroup and Manderscheid’s (1977) second factor (extroversion-in- troversion) the significant loadings from the 16 PF are found in A, F, 42, and H. Excitation also correlates significantly with A, F, and H, and loads on this factor.
What is most interesting about this analysis is that by including the Strelau, the commonality of the base of the factor structure is extended. The CPI probably represents the best instance of a rationally-derived personality inventory. The 16 PF probably represents the best instance of a factor- derived personality inventory. By including the Strelau and arriving at virtu- ally the same configuration of factors and components, a biologically-de- rived instrument is included. The conclusion that appears most warranted from this judgment is that personality inventories carefully developed from the rational, factor-analytic and physiological frameworks yield a set of common dimensions that provide a basis for a usable classification system in psychological assessment.
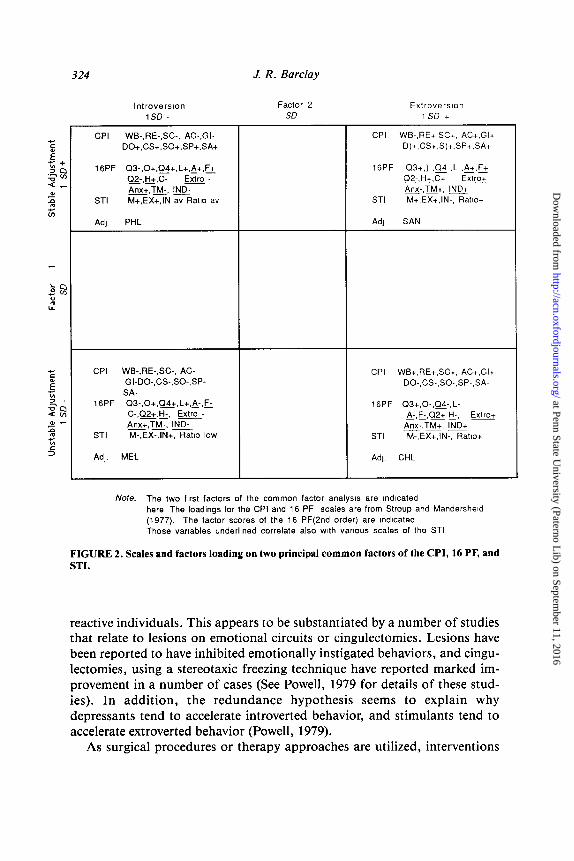
To illustrate the meaning of this last statement Figure 1 provides a two- dimensional nine cell grid to represent the descriptive dimensions of this classification system. The horizontal plane represents a broad categoriza- tion of extroversion versus introversion, and the vertical plane, good adjust- ment versus neurotic adjustment. Figure 2 provides the CPI, and 16 PF
at Penn State University (Paterno L
ib) on September 11, 2016
http://acn.oxfordjournals.org/D
ownloaded from

FIGURE 1. Interpretation of scales and factors loading on two principal common factors of the CPI, 16 PF, and STI.
scales that load on each of these cells. 16 PF variables that are underlined correlate significantly with certain Strelau variables, and those are identified in the footnote.
This broad classification system has two major implications for further research and study. First of all, by gradually identifying the components that exist in each of the extreme quadrants of this grid, and extending them to other tests and instruments, we may become more clearly aware of exactly what are the biological mechanisms involved. There is a general agreement today that the reticular-activating loop with involvement in the limbic sys- tem is at the core of differences in arousal, speed of reaction, and duration of reaction. There is also the hypothesis that such differences are really related to an abundance of brain connections in introverts or high reactive individuals, and a lesser number of such connections in extroverts or low
Temperament Classification 323
Cautious. Inhibited
Persistant. Ambitious.
Serious, Active, Introverted.
Anxious. Tender-Mmded.
Follower, Flexible, Controlled,
Low Reactive. HI Ratlo
Energetvz. Thorough,
Practical. Organtzed.
Aggresswe, Ambmous.
Responsible, Enthwatlc,
Extroverted, Self-Confident.
Tough-MInded. Leader,
Flexible, Controlled
Low Reactive, HI Ratlo
Cautious. Changeable,
MoodyJnhlblted, Restricted
I” Outlook, Defenwe.
Self-AbasIng, Introverted.
Anxious. Sensltwe.
Follower. RIgId,
High Reactwe, Lo Ratlo
Energetic. Impulwe,
Aggresswe. Ambltlous.
Restricted I” Outlook.
Defenwe, Demanding,
Inflexible,
High Reactwe, Lo Ratlo
Note. The two fwst factors of the common factor analysts are mdlcated
here The mterpretatlons are drawn from CPl.lEiPF. and STI scales
at Penn State University (Paterno L
ib) on September 11, 2016
http://acn.oxfordjournals.org/D
ownloaded from
324 J. R. Barclay
lntroverslon Factor 2 Extroversion
1% - SD 1.m +
CPI WB-,RE-,SC-, AC-.GI- CPI WB-,RE+.SC+, AC+,GI+
DO+,CS+,SO+,SP+.SA+ D)+,CS+.S)+.SP+.SA+
16PF a-.O+.Q~+,L+,~+,F+ 16PF m+,)-.aQ-,L-,n+,F+
Q2- H+ C- _*_* &- Q2- H+ C+ - 1-3 Extra+
Am+ TM- IND_
STI -‘-’
Am- TM+, IND+
M+.EX+.IN a” Ratlo a” STI -‘- M+,EX+.IN-, Ratlo+
Ad] PHL Ad1 SAN
CPI WB-,RE-SC-, AC-
GI-DO-,CS-,SO-,SP-
SA-
16PF Q3-.0+,(34+,L+&,F_
C- Q2+.H- a- t__* Am+ TM-. IND_
STI -‘- M-.EX-,IN+, Ratlo low
Adj. MEL
CPI WB+.RE+,SC+. AC+,Gl+
DO-,CS-,SO-.SP-,SA-
16PF Q3c.O.,a@-,L-
A- F- Q2+ H- -1-e_ _I Extra+
Am- TM+, IND+
STI -‘- M-,EX+.IN-, R&o+
Adj. CHL
Note. The two first factors of the common factor analym are Indicated
here The loadings for the CPI and 16 PF scales are from Stroup and Mandersheld
(1977). The factor scores of the 16 PF(2nd order) are Indicated
Those vmables underlined correlate also with various scales of the STI
FIGURE 2. Scales and factors loading on two principal common factors of the CPI, 16 PF, and STI.
reactive individuals. This appears to be substantiated by a number of studies that relate to lesions on emotional circuits or cingulectomies. Lesions have been reported to have inhibited emotionally instigated behaviors, and cingu- lectomies, using a stereotaxic freezing technique have reported marked im- provement in a number of cases (See Powell, 1979 for details of these stud- ies). In addition, the redundance hypothesis seems to explain why depressants tend to accelerate introverted behavior, and stimulants tend to accelerate extroverted behavior (Powell, 1979).
As surgical procedures or therapy approaches are utilized, interventions
at Penn State University (Paterno L
ib) on September 11, 2016
http://acn.oxfordjournals.org/D
ownloaded from

Temperament Classification 325
could be more precisely related to such a classification system. In addition, the use of social learning procedures could be added to this framework, thereby building a more coherent set of data.
The second implication may relate at this time to interventions with school aged children. Strelau (1983) cites findings that: (a) with regard to poor grades given, individuals with low reactivity reacted by an increase in arousal, effort, and behavior, while those with a high reactivity tended to give up; (b) in terms of the use of defense mechanisms, individuals with low reactivity need them less, and those with high reactivity needed them more; (c) with regard to the need for stimulation, those with low reactivity needed this less, and those with high reactivity needed stimulation more; (d) with regard to Machiavellianism, individuals with low reactivity were more prone to such behavior and those with high reactivity less prone; (e) with regard to sensitivity and what Strelau terms “soft touch,” individuals with low reactiv- ity were less likely to be sensitive and those with high reactivity were much more likely to manifest these characteristics; (f) in terms of aspiration level, low reactivity individuals showed a greater thrust than high reactivity chil- dren; and finally, (g) with regard to sensitivity-endurance, low reactive indi- viduals were higher on endurance and lower in sensitivity while high reactive individuals were higher on sensitivity and lower on endurance.
Temperament is not a construct that can be ignored in dealing with adults or children. For the biologically-anchored characteristics of temperament specify a range of potential behavior and mediate learning. The Russian psychologist Merlin (1967, 1970) has made statements that are of the utmost importance to researchers concerned with maximizing learning in the schools. He has suggested that given the known differences in temperament characteristics: (a) we may either ignore such differences (with the conse- quences that stem from such ignoring) or (b) accommodate learning envi- ronments to temperaments (manifestly not very feasible), or (c) teach indi- viduals how to recognize their own strengths and weaknesses and accommodate their own temperament styles to the demands of learning.
Barclay has argued that prevention in the sense of early intervention in differential strategies of learning and adjustment will not become a part of education until there is systematic methodology, that is, computer technolo- gy, to examine individual differences at an early age (Barclay, 1983~). Over the course of 25 years, Barclay has developed a multi-trait, multi-method system that can screen the temperament characteristics of classrooms of children by one testing (Barclay, 1983a, 1983b). A portion of this system was used in this study (the adjective check-list scales). In addition, in a later study (Barclay, 1987), the relationship of the Strelau to a sample of children tested on the Barclay Classroom Assessment System will be discussed with particular reference to the biological basis of sociometric choices.
at Penn State University (Paterno L
ib) on September 11, 2016
http://acn.oxfordjournals.org/D
ownloaded from

326 J. R. Barclay
SUMMARY
This study has looked at the relationship of adjectival ratings and the 16 PF to the Strelau Temperament Inventory. It is apparent from the analysis of the data that there are strong relationships between temperament compo- nents as identified by Strelau in terms of excitation, inhibition, mobility, and self-reported characteristics of stable and unstable extroversion and intro- version. The complementary relationships expressed in this study provide a possible broad classification system for further research and development.
REFERENCES
.4llport, G. W. (1961). Pafrern and growlh m personalrfy. New York: Holt, Rinehart & Win-
ston.
American Psychtatrtc Association. (1980). Dlagnostrc and siarrstrcal manual of mental drsor-
ders (3rd ed.). Washington, DC: American Psychtatrtc Association.
Bandura, A. (1977). Socral learning fheory. Englewood Chffs, NJ: Prentice-Hall.
Barclay, J. R. (1983a). Manual of the Barclav classroom assessment system. Los Angeles:
Western Psychological Services Inc.
Barclay, _I. R. (1983b). A meta-analysts of temperament-treatment interactions wtth alternative
learmng and counseling treatments, DevelopmenIal Review, 3, 410-443.
Barclay, J. R. (1983~). Movmg towards a technology of prevention: a model and some tentative
fmdings Inwted lead article for a special issue on personality assessment. School Psycholo-
gy Review, 12, 228-239
Barclay, J. R. (1987). The temperament basrs of socromelrrcperceplion. Manuscript in prepara- tion, University of Kentucky.
Berlyne, D. E. (1960). Conflict, arousal and curiosity. New York: McGraw-Hill.
Brtnberg, D., & McGrath, J. E. (1985). Vahdity and the research process. Los Angeles: Sage
Publications. Bus,. A. H., & Plomm, R. (1975). A remperament theory of personality development. New
York: John Wiley.
Carlier. M. (1985). Factor analysis of Strelau’s questionnatre and an attempt to validate some of
the factors. In J. Strelau, F. Farley, & A. Gold (Eds.), The brologlcal bases ofpersonahfy
and behavror (Vol. 1). Washington DC: Hemtsphere Publishing Co.
Cattell, R. B., Eber, H. W. and Tatsuoka, M. N. (1970). Handbook of ihe 16PF. Champaign,
Ill.: IPAT. Dorfman, L. Y. (1976). The effect of music’s tempo and harmony on the dynamics of efficiency
restitution after physical overload, dependmg on the strength of the nervous system, B. A.
Vyatkin (Ed.), in Temperament andsport (Vol. 3). Perm [In Russian and cited from Strelau,
1983.1 Eytenck, H. J. (1957). Dynamics and anxrefv and hysferia. London: Routledge and Kegan
Paul. Eysenck, H. J. (1970). The structure of human personalrfv. London: Methuen.
Gtlliland, K. (1985). The temperament Inventory: relattonship to theoretically similar Western personality dimensions and construct validity. In J. Strelau, F. Farley, &A. Gale (Eds.) The
brologrcal bases of personahfy and behavror (Vol. 1). Washington DC: Hemisphere Publish-
tng Co. Goldsmtth, H. H., Buss, A. H., Plomin, R., Rothbart, M., Thomas, A., Chess, S., Hinde, R.
A., & McCall, R. B. (1987). Roundtable: what is temperament? Four approaches. Chdd
Development, 58, 505-529.
at Penn State University (Paterno L
ib) on September 11, 2016
http://acn.oxfordjournals.org/D
ownloaded from

Temperament Classification 327
Gray, J. A. (1964). Pavlov’s typology. Oxford: Pergamon Press.
Gray, J. A. (1970). The physiological basis of introversion-extraversion, Behavior Research and
Therapy, 8, 249-266.
Gray, J. A. (1972). The psychophysiological nature of introversion-extraversion: A modifica-
tion of Eysenck’s theory. In V. D. Nebylitsyn & J. A. Gray (Eds.), Ecological bases of
rndrvidual behavior. New York and London: Academic Press.
Hebb, D. 0. (1955). Drives and the C.N.S. (conceptual nervous system). Psychologrcal Revrew,
62, 243-254.
Khalik, A. V. (1972). The influence of different sources of stress on the sportsman’s kinesthetic
sensitivity in relationship to strength of the nervous system. In B. A. Vyatkin (Ed.), Temper-
ament andsport (Vol. 1). Perm [In Russian and cited from Strelau, 1983.1
Kelvin, P. (1969). The bases of social behaviour. London: Holt, Rinehart and Winston. Kozlowski, C. (1977). Demand for stimulation and probability preferences in gambling deci-
sions, Polish Psychological Bullefin, 8, 67-73 [Cited in Strelau, 1983).
Krug, S. E. (1981). Interpreting 16 PFprofflepatferns. Champaign, IL: IPAT. Materska, M. (1978). [Arttcle in Polish cited in Strelau, 1983.1
Merlin, V. S. (1967). The interrelation between social-typological and individual factors in
personality. Voprosy Psrkhologii, 13, 34-43 [In Russian].
Merlm, V. S. (1970). The relationship between type and individual features of temperament. Voprosy Psikhologii, 16, 21-27 [In Russian].
Nebylitsyn, V. D. (1972). Fundamental properlies of the human nervous system. New York &
London: Plenum Press.
Powell, G. (1979). Brain andpersonahfy. New York: Praeger.
Royce, J. R. (Ed.), (1973). Multivariate analysrs and psychologrcal theory. London & New
York: Academic Press.
Royce, J. R., & Mos, L. P. (Eds.). (1979). Theoretrcal advances in behavror genefus. Alphan aan den Rijn, the Netherlands: Sjthoff and Noordhoff.
Samonov, A. P. (1972). The influence of nervous system properties on activity in extreme
conditions. In B. A. Vyatkin (Ed.), Temperamenr andsport (Vol. 1). Perm [In Russian and
cited from Strelau, 1983.1
Strelau, J. (1983). Temperamenf, actrvrfy, personality. London & New York: Academic Press.
Strelau, J. (1985). Diversity of personality dimensions based on arousal theories: Need for
integration. In J. T. Spence & C. E. Izard (Eds.). Personalrty dimensions based on arousal
theorres. North-Holland, the Netherlands: Elseviere Science Publishers.
Stroup, A. L., & Manderscheid, R. W. (1977). CPI and 16 PF second-order factor congruence.
Journal of Clinrcal Psychology, 34, 1023-1026. Terelak, J. (1974). [Article in Polish cited from Strelau, 19831. Thomas, A., & Chess, S. (1977). Temperament and developmenl. New York: Brunner/Mazel.
Vyatkin, B. A., & Chektrov, M. M. (1976). Typologtcal differences in the Influence of compett- ttve stress on voluntary regulation of activity in wrestlers and individualization of voluntary
training. In B. A. Vyatkin (Ed.), Temperament and Sporf (Vol. 32) Perm [In Russian and
cited from Strelau, 1983.1 Zarzycka, M. (1980). Unpublished PhD thesis, University of Warsaw. [Cited in Strelau, 1983.1
Nofe. In the interests of accuracy in the development of the physiological bases of the Strelau inventory, some citations are listed and cited from Strelau’s book. Some of these citations were simply not available to the author even through the U.S. Library of Congress.
at Penn State University (Paterno L
ib) on September 11, 2016
http://acn.oxfordjournals.org/D
ownloaded from