Psychometric properties of the Temperament and Character Inventory-Revised (TCI-R) in Czech...
12
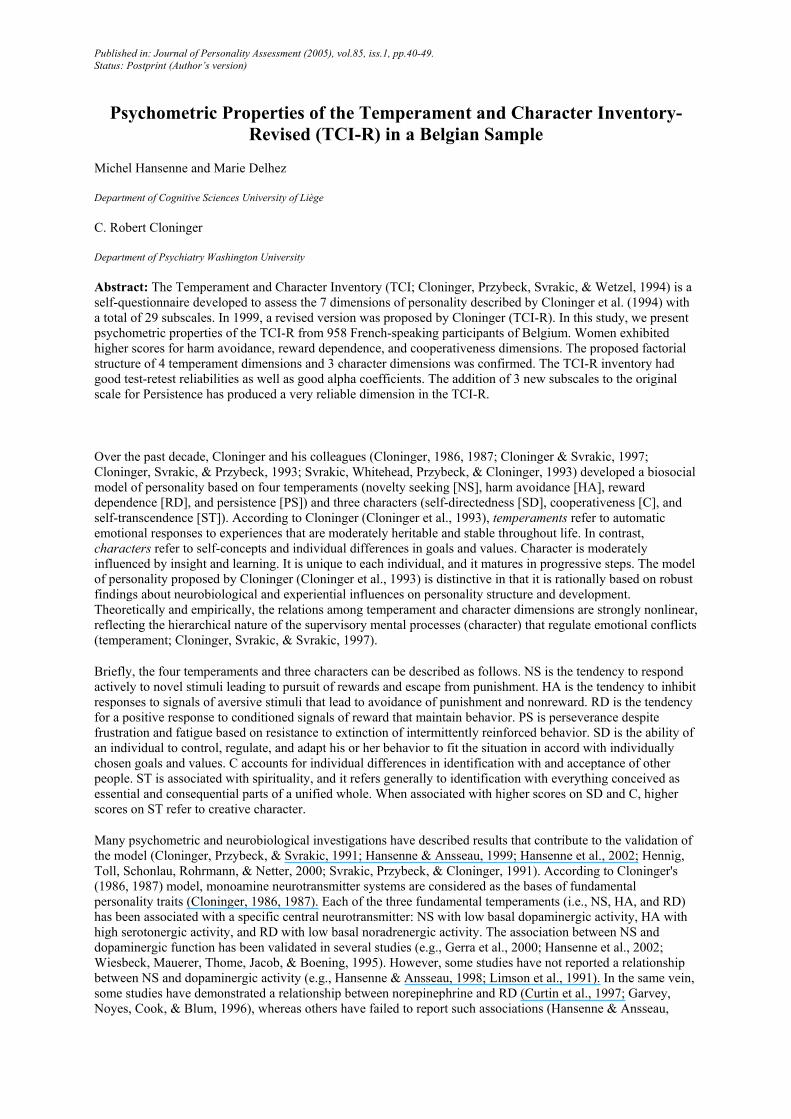
Published in: Journal of Personality Assessment (2005), vol.85, iss.1, pp.40-49. Status: Postprint (Author’s version) Psychometric Properties of the Temperament and Character Inventory- Revised (TCI-R) in a Belgian Sample Michel Hansenne and Marie Delhez Department of Cognitive Sciences University of Liège C. Robert Cloninger Department of Psychiatry Washington University Abstract: The Temperament and Character Inventory (TCI; Cloninger, Przybeck, Svrakic, & Wetzel, 1994) is a self-questionnaire developed to assess the 7 dimensions of personality described by Cloninger et al. (1994) with a total of 29 subscales. In 1999, a revised version was proposed by Cloninger (TCI-R). In this study, we present psychometric properties of the TCI-R from 958 French-speaking participants of Belgium. Women exhibited higher scores for harm avoidance, reward dependence, and cooperativeness dimensions. The proposed factorial structure of 4 temperament dimensions and 3 character dimensions was confirmed. The TCI-R inventory had good test-retest reliabilities as well as good alpha coefficients. The addition of 3 new subscales to the original scale for Persistence has produced a very reliable dimension in the TCI-R. Over the past decade, Cloninger and his colleagues (Cloninger, 1986, 1987; Cloninger & Svrakic, 1997; Cloninger, Svrakic, & Przybeck, 1993; Svrakic, Whitehead, Przybeck, & Cloninger, 1993) developed a biosocial model of personality based on four temperaments (novelty seeking [NS], harm avoidance [HA], reward dependence [RD], and persistence [PS]) and three characters (self-directedness [SD], cooperativeness [C], and self-transcendence [ST]). According to Cloninger (Cloninger et al., 1993), temperaments refer to automatic emotional responses to experiences that are moderately heritable and stable throughout life. In contrast, characters refer to self-concepts and individual differences in goals and values. Character is moderately influenced by insight and learning. It is unique to each individual, and it matures in progressive steps. The model of personality proposed by Cloninger (Cloninger et al., 1993) is distinctive in that it is rationally based on robust findings about neurobiological and experiential influences on personality structure and development. Theoretically and empirically, the relations among temperament and character dimensions are strongly nonlinear, reflecting the hierarchical nature of the supervisory mental processes (character) that regulate emotional conflicts (temperament; Cloninger, Svrakic, & Svrakic, 1997). Briefly, the four temperaments and three characters can be described as follows. NS is the tendency to respond actively to novel stimuli leading to pursuit of rewards and escape from punishment. HA is the tendency to inhibit responses to signals of aversive stimuli that lead to avoidance of punishment and nonreward. RD is the tendency for a positive response to conditioned signals of reward that maintain behavior. PS is perseverance despite frustration and fatigue based on resistance to extinction of intermittently reinforced behavior. SD is the ability of an individual to control, regulate, and adapt his or her behavior to fit the situation in accord with individually chosen goals and values. C accounts for individual differences in identification with and acceptance of other people. ST is associated with spirituality, and it refers generally to identification with everything conceived as essential and consequential parts of a unified whole. When associated with higher scores on SD and C, higher scores on ST refer to creative character. Many psychometric and neurobiological investigations have described results that contribute to the validation of the model (Cloninger, Przybeck, & Svrakic, 1991; Hansenne & Ansseau, 1999; Hansenne et al., 2002; Hennig, Toll, Schonlau, Rohrmann, & Netter, 2000; Svrakic, Przybeck, & Cloninger, 1991). According to Cloninger's (1986, 1987) model, monoamine neurotransmitter systems are considered as the bases of fundamental personality traits (Cloninger, 1986, 1987). Each of the three fundamental temperaments (i.e., NS, HA, and RD) has been associated with a specific central neurotransmitter: NS with low basal dopaminergic activity, HA with high serotonergic activity, and RD with low basal noradrenergic activity. The association between NS and dopaminergic function has been validated in several studies (e.g., Gerra et al., 2000; Hansenne et al., 2002; Wiesbeck, Mauerer, Thome, Jacob, & Boening, 1995). However, some studies have not reported a relationship between NS and dopaminergic activity (e.g., Hansenne & Ansseau, 1998; Limson et al., 1991). In the same vein, some studies have demonstrated a relationship between norepinephrine and RD (Curtin et al., 1997; Garvey, Noyes, Cook, & Blum, 1996), whereas others have failed to report such associations (Hansenne & Ansseau,
-
Upload
farmingdale -
Category
Documents
-
view
1 -
download
0
Transcript of Psychometric properties of the Temperament and Character Inventory-Revised (TCI-R) in Czech...
Published in: Journal of Personality Assessment (2005), vol.85, iss.1, pp.40-49.
Status: Postprint (Author’s version)
Psychometric Properties of the Temperament and Character Inventory-
Revised (TCI-R) in a Belgian Sample
Michel Hansenne and Marie Delhez
Department of Cognitive Sciences University of Liège
C. Robert Cloninger
Department of Psychiatry Washington University
Abstract: The Temperament and Character Inventory (TCI; Cloninger, Przybeck, Svrakic, & Wetzel, 1994) is a
self-questionnaire developed to assess the 7 dimensions of personality described by Cloninger et al. (1994) with
a total of 29 subscales. In 1999, a revised version was proposed by Cloninger (TCI-R). In this study, we present
psychometric properties of the TCI-R from 958 French-speaking participants of Belgium. Women exhibited
higher scores for harm avoidance, reward dependence, and cooperativeness dimensions. The proposed factorial
structure of 4 temperament dimensions and 3 character dimensions was confirmed. The TCI-R inventory had
good test-retest reliabilities as well as good alpha coefficients. The addition of 3 new subscales to the original
scale for Persistence has produced a very reliable dimension in the TCI-R.
Over the past decade, Cloninger and his colleagues (Cloninger, 1986, 1987; Cloninger & Svrakic, 1997;
Cloninger, Svrakic, & Przybeck, 1993; Svrakic, Whitehead, Przybeck, & Cloninger, 1993) developed a biosocial
model of personality based on four temperaments (novelty seeking [NS], harm avoidance [HA], reward
dependence [RD], and persistence [PS]) and three characters (self-directedness [SD], cooperativeness [C], and
self-transcendence [ST]). According to Cloninger (Cloninger et al., 1993), temperaments refer to automatic
emotional responses to experiences that are moderately heritable and stable throughout life. In contrast,
characters refer to self-concepts and individual differences in goals and values. Character is moderately
influenced by insight and learning. It is unique to each individual, and it matures in progressive steps. The model
of personality proposed by Cloninger (Cloninger et al., 1993) is distinctive in that it is rationally based on robust
findings about neurobiological and experiential influences on personality structure and development.
Theoretically and empirically, the relations among temperament and character dimensions are strongly nonlinear,
reflecting the hierarchical nature of the supervisory mental processes (character) that regulate emotional conflicts
(temperament; Cloninger, Svrakic, & Svrakic, 1997).
Briefly, the four temperaments and three characters can be described as follows. NS is the tendency to respond
actively to novel stimuli leading to pursuit of rewards and escape from punishment. HA is the tendency to inhibit
responses to signals of aversive stimuli that lead to avoidance of punishment and nonreward. RD is the tendency
for a positive response to conditioned signals of reward that maintain behavior. PS is perseverance despite
frustration and fatigue based on resistance to extinction of intermittently reinforced behavior. SD is the ability of
an individual to control, regulate, and adapt his or her behavior to fit the situation in accord with individually
chosen goals and values. C accounts for individual differences in identification with and acceptance of other
people. ST is associated with spirituality, and it refers generally to identification with everything conceived as
essential and consequential parts of a unified whole. When associated with higher scores on SD and C, higher
scores on ST refer to creative character.
Many psychometric and neurobiological investigations have described results that contribute to the validation of
the model (Cloninger, Przybeck, & Svrakic, 1991; Hansenne & Ansseau, 1999; Hansenne et al., 2002; Hennig,
Toll, Schonlau, Rohrmann, & Netter, 2000; Svrakic, Przybeck, & Cloninger, 1991). According to Cloninger's
(1986, 1987) model, monoamine neurotransmitter systems are considered as the bases of fundamental
personality traits (Cloninger, 1986, 1987). Each of the three fundamental temperaments (i.e., NS, HA, and RD)
has been associated with a specific central neurotransmitter: NS with low basal dopaminergic activity, HA with
high serotonergic activity, and RD with low basal noradrenergic activity. The association between NS and
dopaminergic function has been validated in several studies (e.g., Gerra et al., 2000; Hansenne et al., 2002;
Wiesbeck, Mauerer, Thome, Jacob, & Boening, 1995). However, some studies have not reported a relationship
between NS and dopaminergic activity (e.g., Hansenne & Ansseau, 1998; Limson et al., 1991). In the same vein,
some studies have demonstrated a relationship between norepinephrine and RD (Curtin et al., 1997; Garvey,
Noyes, Cook, & Blum, 1996), whereas others have failed to report such associations (Hansenne & Ansseau,

Published in: Journal of Personality Assessment (2005), vol.85, iss.1, pp.40-49.
Status: Postprint (Author’s version)
1998; Limson et al., 1991). Concerning the relationship between serotonergic function and HA, some studies
have provided data that validate the theoretical association (Hansenne & Ansseau, 1999; Hansenne et al., 1997).
The Temperament and Character Inventory (TCI; Cloninger, Przybeck, Svrakic, & Wetzel, 1994) is a 226-item
self-questionnaire developed by Cloninger et al. to assess the seven dimensions of personality. The variances
explained by the rotated factors after promax rotation ranged from 4.4% to 2.0%, which is 17.7% to 8.0% of the
total variance in the 25 factors (Cloninger et al., 1993). Cloninger et al. (1993) reported significant relationships
among the seven dimensions: C was positively correlated with both RD (.54) and SD (.57), whereas SD was
negatively correlated with HA (-.47). Weaker correlations were found between PS and HA (-.27), between C and
HA (-.28), between SD and PS (.28), and between ST and RD (.28). Hansenne, Le Bon, Gauthier, and Ansseau
(2001) reported similar correlations within a Belgian sample. Many psychometric studies have confirmed the
structure of the Cloninger's (Cloninger et al., 1993) model. Pélissolo and Lépine (2000), as well as Hansenne et
al. (2001), provided confirmatory findings from the French version of the TCI. In addition, several studies have
validated the structure of the questionnaire (Brändström et al., 1998; Gutierrez et al., 2001; Tomina et al., 2000).
However, Gana and Trouillet (2003) presented an unsuccessful attempt to validate the structure of the TCI.
The TCI provides quantitative measures of personality that are clinically useful in psychiatry and psychology
(Cloninger & Svrakic, 1997). First, the TCI provides personality measures that quantify individual differences in
vulnerability to many Axis I disorders (e.g., major depressive disorder, anxiety disorders, eating disorders,
substance dependencies, and also psychoses). Indeed, several studies have demonstrated that depressed patients,
even in remission states, have higher HA scores and that severity of depression correlates with HA (Corruble,
Duret, Pélissolo, Falissard, & Guelfi, 2002; Grucza, Przybeck, Spitznagel, & Cloninger, 2003; Hansenne et al.,
1999; Marijnissen, Tuinier, Sijben, & Verhoeven, 2002). Moreover, patients who fail to respond to
antidepressant treatments generally have higher HA scores before treatment than the others. Overall, these results
support various relationships between depression and HA: an influence of the depressive state on a trait measure,
a vulnerability model (HA would be a susceptibility factor for depression), and a scar model with elevated HA
scores even after remission of acute depressive symptoms. Other temperament dimensions, NS and RD, are not
consistently associated with depressive status, but the character dimension of SD is often low when compared to
participants without depressive disorders. Additional studies have found a predictive value of HA scores for
suicidal attempts (Bulik, Sullivan, & Joyce, 1999; Engstrom, Brändström , Sigvardson, Cloninger, & Nylander,
2004). Furthermore, in a sample of schizophrenia patients (Eklund, Hansson, & Bengtsson-Tops, 2004), SD was
highly correlated with psychological health. Moreover, Van Ammers, Sellman, and Mulder (1997) found a
significant correlation between the NS dimension and use of alcohol, cannabis, caffeine, and nicotine in
schizophrenia patients, suggesting that NS behaviors contribute to substance use in schizophrenia.
Second, the TCI is a reliable instrument to assess personality disorders: lower SD and C scores have been found
consistently in individuals with personality disorders (Bayon, Hill, Svrakic, Przybeck, & Cloninger, 1996;
Svrakic et al., 1993). Personality disorders have been shown to be characterized by low SD and low C regardless
of the cluster or category of personality disorder (Svrakic et al., 1993). Therefore, these two dimensions have
been proposed to be the core features of personality disorders. Besides this general finding, patients in clusters A
(aloof), B (impulsive), and C (fearful) were differentiated respectively by low RD, high NS, and high HA. More
specifically, high NS, low RD and low HA characterize antisocial personality disorder, whereas low NS, high
RD, and high HA characterize avoidant personality disorder (Svrakic et al., 1993). In addition, SD was
significantly correlated with personality disorders assessed by a Dutch questionnaire (de la Rie, Duijsens, &
Cloninger, 1998). Moreover, significant negative correlations occurred between C and most personality
disorders.
The TCI has been translated in many foreign languages used on all continents including Swedish, Dutch,
Japanese, Spanish, and French (Brändström et al., 1998; de la Rie et al., 1998; Pélissolo & Lépine, 1997, 2000;
Tanaka, Sakamoto, Kijima, & Kitamura, 1998). The French version of the TCI is well validated (Pélissolo &
Lépine, 2000), and it is used in the French-speaking part of Belgium (Hansenne, 1999; Hansenne et al., 1999).
Normative data from a Belgian sample were published (Hansenne et al., 2001). Interestingly, Belgian normative
data are similar to French ones (Pélissolo & Lépine, 2000) but different from the American norms (Cloninger et
al., 1993). Compared to American norms, both Belgian and French individuals exhibited lower scores on NS,
PS, and ST dimensions, and conversely, Belgian and French individuals had higher scores on HA.
In recent times, Cloninger (1999) developed a revised version of the TCI (TCI-R) introducing two major
modifications. First, the original TCI was a true-false questionnaire, but in the TCI-R, the participants must
respond on a 5-point Likert scale ranging from 1 (definitively false) to 5 (definitively true) to enhance the
precision of measurement for subscales. Second, in the original TCI, PS was measured by only one short scale,
Published in: Journal of Personality Assessment (2005), vol.85, iss.1, pp.40-49.
Status: Postprint (Author’s version)
whereas in the TCI-R, this dimension has 35 items and four subscales (eagerness of effort vs. laziness; work
hardened vs. spoiled, ambitious vs. underachieving, perfectionist vs. pragmatist) to improve its description and
measurement. In addition, the TCI-R adds a new subscale for RD (RD2; open to warm communication
vs.aloofness).
Until recently, few data have been available about the TCI-R. Brändström, Richter, and Nylander (2003)
demonstrated structural equivalence of the TCI and the TCI-R from a cross-cultural perspective among healthy
participants from Sweden and Germany. Moreover, the reliability coefficients for the revised version were higher
than those found for the TCI within both samples. Pélissolo et al. (in press) found a good factorial structure for
the TCI-R and similar to those shown with the TCI in general and clinical populations. Robust factors were
obtained for RD and PS in the TCI-R, even more clearly than in the TCI. All dimensions obtained higher alpha
Cronbach coefficients with the TCI-R than with the TCI. Last, Gutierrez-Zotes et al. (2004) provided normative
data of the Spanish version of the TCI-R and found higher reliability coefficients for all the dimensions. The aim
of this study is to provide further psychometric validity of the TCI-R for the French TCI-R in a Belgian sample.
MATERIALS AND METHOD
The study was conducted on a sample of 958 adults from the French part of Belgium. The sample was made up
of 546 women with a mean age of 33.6 years (range from 17 to 70 years, SD = 15.1) and 412 men with a mean
age of 36.2 years (range from 17 to 70 years, SD = 14.9). Among the participants, 352 were undergraduate
students (284 women) who were enrolled in psychological courses. The other participants consisted of student's
relatives. All participants gave informed consent to participate in the study.
A 2-week retest was proposed for a subsample of 95 participants, but only 77 filled out the TCI-R for a second
time. This subsample comprised 68 women (mean age of 19.8, SD = 1.8) and 9 men (mean age of 20.8, SD =
1.9) who were all undergraduate students. Moreover, a 6-month retest was obtained in a different subsample of
40 participants (30 women with a mean age of 22.7, SD = 8.5 and 10 men with a mean age of 31.8, SD = 15.7).
This subsample included undergraduate students (28) and relatives.
The participants filled out the French version of the 240 items of the TCI-R. Undergraduate students answered
the questionnaire during a course, and the other participants responded at home. The translation was performed
by Pélissolo, Notides, Musa, Téhérani, and Lépine (2000), who previously translated the TCI in French
(Pélissolo & Lépine, 2000).
After the completion, one author (M. Hansenne) checked if the participants filled all the items and if they
responded appropriately to the five validity items. A total of 26 participants were not included in the study
according to incomplete responses (more than 5 lacking responses) and/or poor validity items (at least one poor
validity item).
First, scale and subscale means and their distributions were examined, and Pearson's correlations were performed
between scales as well as between the scales and age. Second, gender differences on TCI-R scales and subscales
were examined with multivariate analysis of covariance, with TCI-R scores as dependent variables, gender as an
independent variable, and age as cofactor. Cohen's d effect size measures were also computed after controlling
for age. Third, test-retest reliabilities were assessed using the two-way random effects model intraclass
correlation coefficient (ICC; 2,1; McGraw & Wong, 1996). Additionally, a one-way repeated measure analysis
of variance (ANOVA) with the factor of time as well as Cohen's d effect size measures were calculated. Fourth,
the internal consistency was estimated with the Cronbach's αcoefficient. The coefficients for the dimensions
were derived from all the individual items (i.e., all NS items and not NS1, NS2, NS3, NS4 as items). Fifth, the
structure of the TCI-R was evaluated by a principal component analysis rotating the factors by promax.
Temperaments and characters were analyzed separately. The relations among the temperament dimensions are
nearly linear and the relations among the character dimensions are also nearly linear. However, the relationships
among the temperament and character dimensions are strongly nonlinear, which would create problems in a
factor analysis examining all the dimensions simultaneously. Nonlinearity is shown by the fact that there are no
one-to-one (linear) relationships among configurations of temperament with configurations of character: There is
extensive equifinality (i.e., different temperaments are associated with the same character configuration) and
multifinality (i.e., the same temperament configuration has different character outcomes; see Cloninger, 2000,
2004; Cloninger et al., 1997). For example, factor analysis would force HA and SD into a single factor because
they are moderately correlated, especially in immature people, but they are in fact dissociable biologically and
developmentally as shown by distinguishing between personality disorders and anxiety disorders (there are
nonanxious personality disorders and anxious mature people).

Published in: Journal of Personality Assessment (2005), vol.85, iss.1, pp.40-49.
Status: Postprint (Author’s version)
The criterion for identifying the number of factors to extract was based on parallel analysis (Glorfeld, 1995;
O'Connor, 2000). Indeed, the factor analysis literature has clearly indicated that researchers should not use the
default decision rule of eigenvalues greater than 1 or examination of scree plots of eigenvalues. In parallel
analysis, the rational is to select the number of components that account for more variance than the components
derived from random data.
RESULTS
The mean scores for TCI-R scales and their subscales are presented in Table 1. Multivariate analysis showed that
women exhibited significantly higher scores for HA, RD, and C dimensions than men. For the C dimension, all
the subscale scores were higher in women, whereas for the HA and RD dimensions, one subscale did not differ
between the two groups (respectively, HA4 and RD4). Moreover, NS4 and PS3 subscale scores were lower in
women, whereas SD4 was higher. Alpha coefficients ranged from 0.45 (RD4) to 0.90 (HA and PS), with a mean
value of 0.70. Globally, the internal consistency of the scales was good, whereas the internal consistency of the
subscales was not so good, with many of them below 0.70. Concerning the dimensions, NS had the lowest alpha
value (0.78).
TABLE 1: TCI-R Scale and Subscale Means, Standard Deviations, Cronbach alpha, and Cohen's d Among the
Sample
Total Women Men
TCI-R Dimensions M SD α M SD M SD
F
(df = 1952)
P
da
NS1 (exploratory excitability) 31.2 5.4 .63 31.4 5.3 30.8 5.5 0.71 .39 0.055
NS2 (impulsiveness) 24.0 5.3 .58 24.2 5.2 23.7 5.4 2.53 .11 0.103
NS3 (extravagance) 25.8 6.3 .78 26.1 6.6 25.6 6.0 1.43 .23 0.078
NS4 (disorderliness) 19.1 4.4 .57 18.5 4.1 20.0 4.6 40.30 <.00l 0.412
Novelty seeking (NS) 100.2 14.2 .78 100.2 14.4 100.0 13.9 0.19 .67 0.028
HA1 (anticipatory worry) 30.6 6.2 .78 32.3 6.7 28.4 6.3 78.84 <.00l 0.576
HA2 (fear of uncertain) 22.4 5.3 .74 23.7 5.2 20.7 5.1 87.74 <.00l 0.607
HA3 (shyness with strangers) 20.6 6.1 .85 21.4 6.2 19.6 5.9 16.17 <.00l 0.261
HA4 (fatigability) 20.4 5.3 .73 20.6 5.3 20.2 5.2 0.93 .34 0.063
Harm avoidance (HA) 94.0 18.2 .90 97.9 18.1 88.9 17.0 58.42 <.00l 0.496
RD1 (sentimentality) 28.9 4.2 .57 29.9 4.1 27.6 4.0 74.76 <.00l 0.561
RD2 (open to warm communication) 34.4 5.9 .72 35.5 6.0 32.9 5.8 43.27 <.00l 0.426
RD3 (attachment) 19.8 4.9 .59 20.4 5.2 18.9 4.4 19.20 <.00l 0.284
RD4 (dependence) 18.7 3.8 .45 18.8 3.8 18.4 3.7 1.83 .18 0.088
Reward dependence (RD) 101.7 13.4 .81 104.6 13.8 97.8 12.3 57.42 <.00l 0.491
PS1 (eagerness of effort) 30.2 5.6 .76 30.4 5.3 29.9 6.0 5.46 .02 0.151
PS2 (work hardened) 27.9 5.0 .76 27.6 4.7 28.3 5.2 3.09 .07 0.114
PS3 (ambitious) 32.9 5.8 .73 32.3 5.8 33.7 5.7 13.50 <.00l 0.238
PS4 (perfectionist) 26.7 5.3 .69 26.4 5.4 27.1 5.2 2.76 .09 0.108
Persistence (PS) 117.8 18.4 .90 116.8 18.2 119.1 18.7 2.07 .15 0.093
SD1 (responsibility) 29.1 5.1 .73 29.2 4.8 28.9 5.5 1.77 .18 0.086
SD2 (purposefulness) 21.8 4.0 .67 21.9 4.0 21.8 3.9 0.14 .70 0.024
SD3 (resourcefulness) 17.8 3.3 .60 17.6 3.2 18.1 3.4 4.17 .04 0.132
SD4 (self-acceptance) 33.2 7.3 .73 33.7 7.3 32.5 7.3 11.22 <.00l 0.217
SD5 (congruent second nature) 38.1 5.8 .48 37.8 5.8 38.5 5.7 1.44 .23 0.078
Self-directedness (SD) 140.1 17.4 .81 140.3 17.4 139.9 17.4 1.20 .27 0.071
C1 (social acceptance) 30.5 4.5 .59 31.1 4.6 29.7 4.4 25.07 <.00l 0.325
C2 (empathy) 18.2 3.1 .58 18.8 2.9 17.4 3.1 50.07 <.00l 0.459
C3 (helpfulness) 30.9 4.0 .57 31.5 4.0 30.0 3.9 35.18 <.00l 0.385
C4 (compassion) 25.2 6.5 .88 26.0 6.2 24.1 6.6 26.25 <.00l 0.332
C5 (principled) 29.3 4.5 .52 30.2 4.0 28.2 4.8 50.54 <.00l 0.461
Cooperativeness (C) 134.1 16.3 .85 137.6 15.5 129.4 16.3 68.82 <.00l 0.538
ST1 (self-forgetfulness) 29.9 6.2 .70 29.7 6.4 30.2 6.1 1.50 .22 0.079
ST2 (transpersonal identification) 21.4 5.1 .70 21.1 5.0 21.7 5.2 1.76 .18 0.086
ST3 (spiritual acceptance) 19.6 6.5 .79 19.8 6.4 19.2 6.6 2.08 .14 0.094
Self-transcendence (ST) 70.8 14.4 .85 70.6 14.4 71.2 14.5 0.12 .73 0.022
Note. Gender differences are shown by multivariate analysis of covariance. TCI-R = Temperament and Character Inventory-Revised. a
Cohen's d values were computed from the F-test output, which controls for the influence of age.

Published in: Journal of Personality Assessment (2005), vol.85, iss.1, pp.40-49.
Status: Postprint (Author’s version)
The correlations among the four dimensions of temperament and the three dimensions of character are
summarized in Table 2. Only correlations greater than .20 were significant (p < .001). Significant negative
correlations associated NS with HA (-.29) and age (-.22) and HA with PS (-.29) and SD (-.45). Significant
positive correlations associated RD with C (.51), PS with SD (.34), and SD with C (.41) and age (.27).
Separate factorial analyses were performed for temperaments and characters. Factors were retained as long as the
ith eigenvalue from the actual data was greater than the ith eigenvalues from the random value. For the
temperaments, principal component analysis identified four factors with eigenvalues greater than those computed
by the parallel analysis (Table 3). Figure 1 displays the eigenvalues of the actual and simulated data. The
eigenvalues for the first six factors were, respectively, 3.66, 2.66, 2.18, 1.13, 0.98, and 0.87. The four factors
accounted for 23%, 17%, 14%, and 7% of the variance (60% cumulatively). The fourth factor is not readily
differentiated from the fourth random factor in the parallel analysis (eigenvalue of 1.13 for real data vs. 1.11 for
simulated data). The standardized factor loading following promax rotation showed that in the four-factor
solution, PS, HA, RD, and NS factors were robust. The subscale NS1 loaded also negatively on Factor 2 (HA).
TABLE 2: Correlations Among Temperament and Character Scales of the TCI-R
NS HA RD PS SD C ST
NS
HA -.29 — — — — — —
RD .13 -.01
P -.15 -.29 .04 — — — —
SD -.15 -.45 .10 .34 — — —
CO -.16 -.08 .51 .16 .41 — —
ST .07 -.09 .20 .12 -.12 .09 —
Age -.22 -.10 -.12 .19 .27 .11 .09
Note. Underlined coefficients are significant at p < .001. TCI-R = Temperament and Character Inventory-Revised; NS = Novelty Seeking;
HA = Harm Avoidance; RD = Reward Dependence; PS = Persistence; SD = Self-Directedness; C = Cooperativeness; ST = Self-
Transcendence.
TABLE 3: Factor Structure of the Subscales of the Temperaments From the TCI-R After Promax Rotation
Temperaments Factor 1 Factor 2 Factor 3 Factor 4
NS1 .20 -.46 .32 .53
NS2 -.17 -.08 -.07 .74
NS3 -.20 -.09 .29 .60
NS4 -.15 -.28 -.06 .71
HA1 -.16 .80 .09 -.16
HA2 -.16 .80 -.01 -.37
HA3 -.21 .74 -.29 -.17
HA4 -.39 .68 .03 -.12
RD1 .21 .27 .56 .06
RD2 .18 -.20 .86 .15
RD3 -.08 -.10 .78 .16
RD4 -.10 .17 .52 -.17
PS1 .83 -.21 .10 -.13
PS2 .85 -.31 .02 -.10
PS3 .82 -.17 .03 .10
PS4 .86 -.20 .04 -.23
Note. Theoretically expected loadings are underlined. TCI-R = Temperament and Character Inventory-Revised; NS = Novelty Seeking; HA
= Harm Avoidance; RD = Reward Dependence; PS = Persistence.

Published in: Journal of Personality Assessment (2005), vol.85, iss.1, pp.40-49.
Status: Postprint (Author’s version)
For the character scales, principal component analysis identified three factors with eigenvalues greater than those
provided by the parallel analysis (Table 4). These accounted for 27%, 17%, and 13% of the variance (57%
cumulatively).
Figure 2 shows the eigenvalues of the actual and simulated data. The eigenvalues for the first 6 factors were,
respectively, 3.49, 2.24, 1.70, 0.89, 0.73, and 0.64. The standardized factor loading following promax rotation
showed that C and ST factors were robust. For SD, SD1, SD2, SD3, and SD5, subscales loaded consistently,
whereas SD4 subscale had only very weak loading (.29). In fact, the SD4 subscale loaded more strongly on
Factor 1 (C).
Table 5 presents the test-retest reliabilities of TCI-R scales and subscales. All ICCs were statistically significant.
At 2 weeks, all the scales and subscales showed good to very good reliabilities, with ICCs ranging from .69 to
.94. For the scales, ICCs were very high (.81 for ST to .94 for PS). For the subscales, only two subscales had
ICC values lower than .77 (C2 and C5). The one-way repeated measures ANOVA showed that HA and ST were
lower at the retest, whereas NS was higher. Concerning the subscales, HA1, HA2, HA3, RD1, and all the ST
subscales were lower at retest, although NS2, NS4, and SD5 were higher. In contrast, reliability of TCI-R scales
and subscales at 6 months was a little weaker, particularly for the NS scale. ICCs ranged from .46 to .84. For the
scales, the lowest fidelity was observed for NS (.53) and the highest for SD (.84). For the subscales, lowest
reliabilities were observed for NS4 (.58), HA2 (.59), HA4 (.46), RD4 (.47), PS2 (.56), SD1 (.55), and C5 (.59).
The oneway repeated measures ANOVA showed that only NS3 and HA4 were higher at retest, whereas NS1,
RD1, and RD4 were lower.
FIGURE 1: Scree plot of eigenvalues derived from the principal component analysis (promax rotation)
computed on the temperament's subscales of this data (actual data). Eigenvalues of the simulated data are
obtained from parallel analysis. The inspection of the two curves justify the extraction of four factors: The first 4
factors derived from the actual data exhibit higher eigenvalues than the first 4 factors obtained by parallel
analysis, but the fifth factor from the actual data has lower eigenvalue than the fifth factor given by parallel
analysis.
TABLE 4: Factor Structure of the Character Subscales From the TCI-R After Promax Rotation
Characters Factor 1 Factor 2 Factor 3
SD1 .33 .74 -.20
SD2 .27 .71 .18
SD3 .18 .80 -.06
SD4 .56 .29 -.34
SD5 .23 .80 -.01
C1 .74 .31 .14
C2 .61 .20 .41
C3 .78 .32 .07
C4 .75 .18 -.03
C5 .61 .10 -.03
ST1 -.11 -.06 .80
ST2 .16 .09 .80
ST3 .07 -.08 .75
Note. Theoretically expected loadings are underlined. TCI-R = Temperament and Character Inventory-Revised; SD = Self-Directedness; C =
Cooperativeness; ST = Self-Transcendence.
Published in: Journal of Personality Assessment (2005), vol.85, iss.1, pp.40-49.
Status: Postprint (Author’s version)
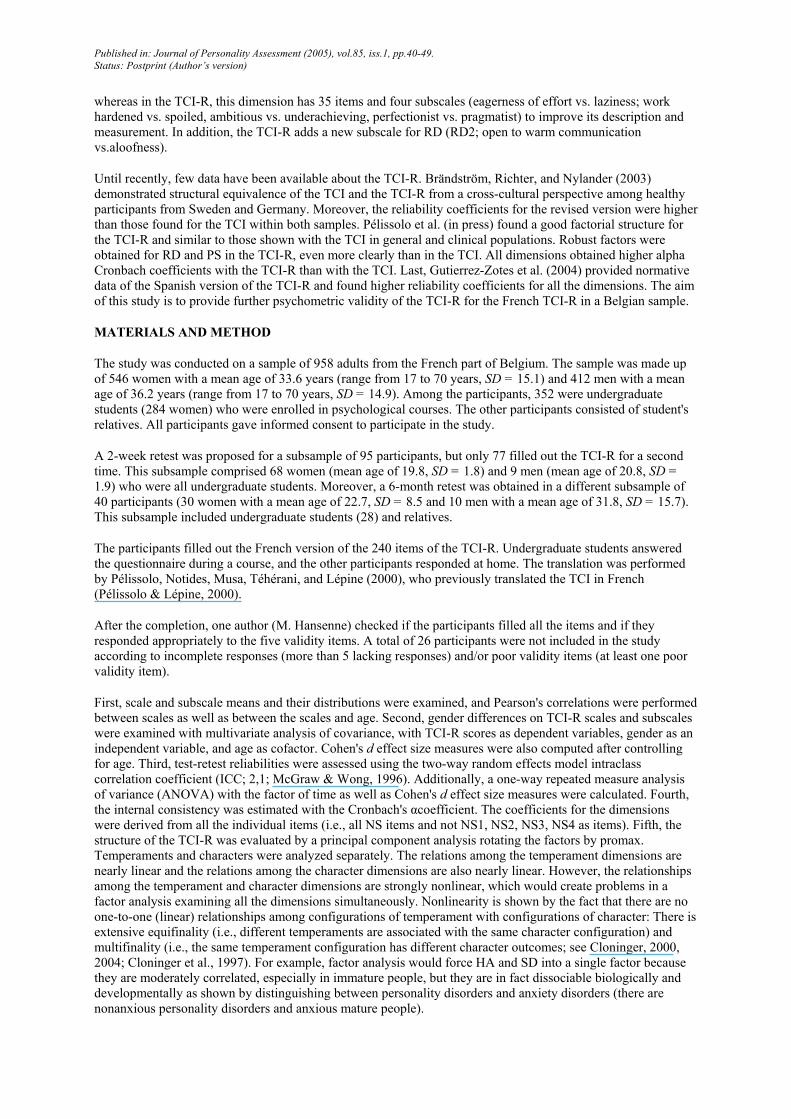
FIGURE 2: Scree plot of eigenvalues derived from the principal component analysis (promax rotation)
computed on the character's subscales of this data (actual data). Eigenvalues of the simulated data are obtained
from parallel analysis. The inspection of the two curves justify the extraction of three factors: the first 3 factors
derived from the actual data exhibit higher eigenvalues than the first 3 factors obtained by parallel analysis, but
the fourth factor from the actual data has lower eigenvalue than the fourth factor given by parallel analysis.
DISCUSSION
Since the introduction of the TCI-R by Cloninger in 1999, few data have been available in the literature
(Brandström et al., 2003; Gutierrez-Zotes et al., 2004; Pélissolo et al., in press). In this study, we provided
further psychometric properties of the French version of the TCI-R administered to a Belgian sample. Overall,
the factorial structure of the TCI-R was good. For the temperaments, PS is now a very robust factor, with factor
loadings higher than 0.80 for the four subscales. This point is of interest because PS contains 35 items in the
revised version of the TCI, whereas it had only 8 items in the TCI. The inclusion of PS subscales is therefore a
useful extension. This is confirmed by the excellent alpha coefficient (0.90) and excellent test-retest reliability
(0.94 at 2 weeks). The factor of HA was also robust, and its internal consistency is similar to PS value (0.90).
The RD factor was less strong, mainly because RD1 and RD4 displayed poorer factor loadings. In contrast, the
internal consistency of this scale was good (0.81). Again, NS was less robust; NS1 and NS3 exhibited lower
factor loadings, and in consequence, NS showed the lowest internal consistency as revealed by its lower alpha
coefficient (0.78). It should be noted that this factor is smaller and less well defined than the others and that it is
not readily differentiated from the random factor in parallel analysis. However, its composition is relatively
consistent with theoretical expectations, which argues for its retention. The factorial structure found here for the
character dimensions is confirmed, except for the SD subscale SD4 that appeared to be less specific. The
inspection of Table 4 shows that SD4 loaded positively (.56) on the C scale. This means that self-acceptance
(SD4) has an important relationship with the C dimension. The theoretical issue about the relationship of SD4 to
C and SD is discussed in depth elsewhere (Cloninger, 2004). Briefly, character development involves nonlinear
adaptive changes among all aspects of personality and cannot be adequately represented in terms of linear
dimensions alone (Cloninger, 2004). Self-acceptance (SD4) measures the emotional aspects of SD that are
associated with C, but SD4 develops more slowly than C. In a relatively young sample such as that studied here,
SD4 was not well developed.
Brändström et al. (2003) did not describe the factorial analysis results of the TCI-R, but they provided
comparisons of the factor structures of the TCI and the TCI-R based on principal axis factor analysis with
oblimin rotations that have shown congruence coefficients mostly above .90, suggesting high similarity in the
factor structures of both versions of the questionnaire. Brändström et al. (2003) reported that Cronbach alpha
coefficients for the revised version were on average higher than those found for the TCI in both Swedish and
German versions (i.e., 0.60 to 0.87 for the TCI and 0.82 to 0.90 for the TCI-R) as well as higher than those found
in this study. Pélissolo et al. (in press) found that the factorial structure of the TCI-R was comparable to the one
reported in this study. For the temperaments, PS was clearly identified as well as RD, and NS1 loaded negatively
on the HA factor. For the characters, Pélissolo et al. demonstrated also that SD4 loaded positively on the C
factor. Similarly to our results, Pélissolo et al. found high Cronbach alpha coefficients for all the dimensions
(from 0.80 to 0.92). High Cronbach alpha coefficients were also reported by Gutierrez-Zotes et al. (2004; from
0.77 for NS to 0.85 to SD), but these authors did not perform factorial analysis.
Interestingly, the factor analysis results of this study are consistent with those found with the TCI by Pélissolo
and Lépine (1997) and almost identical to those reported by Cloninger et al. (1993) and Hansenne et al. (2001).
Indeed, previous TCI studies reported that subscale NS 1 (exploratory excitability) loaded more on the HA factor

Published in: Journal of Personality Assessment (2005), vol.85, iss.1, pp.40-49.
Status: Postprint (Author’s version)
(Hansenne et al., 2001; Lépine, Pélissolo, Téodorescu, & Téhérani, 1994; Pélissolo & Lépine, 1997). In this
study, we also found this association. Moreover, within the TCI, SD4 had already shown poor factor loading on
SD (Hansenne et al., 2001).
TABLE 5: Test-Retest Reliabilities at 2 Weeksa and at 6 Monthsb
2 Weeks 6 Months
TCI-R Dimensions Test Retest ICC F(l, 77) P dc Test Retest ICC F(1, 39) P d
c
NS1 (exploratory excitability) 32.9 32.8 .82 0.17 .67 0,047 30.9 29.4 .65 6.01 .02 0.393
NS2 (impulsiveness) 24.2 25.0 .83 6.97 <.0l 0,301 23.4 24.1 .60 0.87 .35 0.149
NS3 (extravagance) 26.6 26.9 .89 0.19 .65 0,050 24.1 26.3 .66 9.61 <.0l 0.496
NS4 (disorderliness) 19.3 20.1 .81 9.76 <.0l 0,356 18.9 19.1 .58 0.09 .75 0.048
Novelty seeking (NS) 103.2 104.8 .92 8.01 <.0l 0,323 97.2 96.7 .53 0.47 .82 0.110
HA1 (anticipatory worry) 32.8 31.6 .85 9.73 <.0l 0,355 32.7 32.9 .68 0.07 .79 0.042
HA2 (fear of uncertain) 22.8 22.2 .85 5.14 .02 0,258 24.4 24.4 .59 0.01 .91 0.016
HA3 (shyness with strangers) 22.3 21.6 .94 7.16 <.0l 0,305 23.4 24.4 .69 2.27 .13 0.241
HA4 (fatigability) 21.3 21.4 .81 0.09 .75 0,034 21.0 23.0 .46 7.01 .01 0.424
Harm avoidance (HA) 99.3 96.7 .91 12.02 <.0l 0,395 101.4 104.7 .72 2.66 .11 0.261
RD1 (sentimentality) 30.2 29.5 .78 6.52 .01 0,291 30.5 29.0 .64 7.40 <.0l 0.436
RD2 (open to warm
communication)
35.7 35.6 .90 0.01 .93 0,011 34.4 34.0 .66 0.23 .63 0.077
RD3 (attachment) 21.1 21.2 .86 0.01 .93 0,011 20.1 20.1 .74 0.01 .96 0.016
RD4 (dependence) 20.5 20.0 .79 3.32 .07 0,208 17.1 19.8 .47 24.3 <.00l 0.789
Reward dependence (RD) 107.4 106.4 .89 2.99 .08 0,197 102.3 103.0 .77 0.20 .65 0.072
PS1 (eagerness of effort) 29.4 29.6 .81 0.08 .77 0,032 29.1 29.5 .78 0.59 .44 0.123
PS2 (work hardened) 27.2 27.1 .85 0.18 .66 0,048 26.7 26.9 .56 0.07 .78 0.042
PS3 (ambitious) 33.2 33.5 .89 0.85 .36 0,105 33.2 33.5 .73 0.14 .70 0.060
PS4 (perfectionist) 27.2 27.3 .89 0.20 .64 0,051 26.3 26.1 .64 0.04 .83 0.032
Persistence (PS) 117.0 117.6 .94 0.26 .60 0,058 115.4 116.1 .77 0.12 .72 0.055
SD1 (responsibility) 29.8 30.2 .79 0.69 .40 0,095 28.5 29.2 .55 0.96 .33 0.157
SD2 (purposefulness) 22.5 22.5 .82 0.01 .92 0,011 21.4 21.5 .81 0.05 .82 0.036
SD3 (resourcefulness) 17.9 17.5 .86 2.69 .10 0,187 17.3 17.3 .72 0.02 .89 0.023
SD4 (self-acceptance) 30.9 31.3 .89 0.70 .41 0,095 30.8 29.8 .63 1.14 .29 0.171
SD5 (congruent second
nature)
36.8 37.6 .87 4.93 .03 0,253 37.3 36.5 .62 1.01 .31 0.161
Self-directedness (SD) 137.9 139.2 .93 2.08 .15 0,164 135.4 134.4 .76 0.28 .59 0.085
C1 (social acceptance) 30.7 30.7 .77 0.11 .74 0,038 30.0 30.3 .73 0.26 .61 0.082
C2 (empathy) 19.3 19.3 .76 0.02 .89 0,016 18.5 18.8 .65 0.70 .40 0.134
C3 (helpfulness) 30.8 30.7 .83 0.18 .66 0,048 30.3 29.9 .74 0.61 .43 0.125
C4 (compassion) 24.8 25.0 .92 0.33 .56 0,065 24.7 23.9 .82 1.10 .29 0.168
C5 (principled) 29.9 29.2 .69 3.77 .06 0,221 29.4 28.7 .59 1.57 .21 0.201
Cooperativeness (C) 135.5 134.9 .91 0.38 .53 0,070 132.9 131.7 .84 0.51 .47 0.114
ST1 (self-forgetfulness) 30.2 28.7 .77 22.94 <.0l 0,546 30.0 30.1 .71 0.02 .87 0.023
ST2 (transpersonal
identification)
20.9 19.9 .80 11.85 <.0l 0,392 19.9 20.2 .71 0.22 .63 0.075
ST3 (spiritual acceptance) 20.0 18.9 .85 14.13 <.0l 0,428 20.2 20.6 .63 0.21 .64 0.073
Self-transcendence (ST) 71.1 67.5 .81 29.9 <.0l 0,623 70.1 70.9 .77 0.24 .62 0.078
Note. TCI-R = Temperament and Character Inventory-Revised; ICC = intraclass correlation coefficients; d = Cohen's d effect size. aN = 78. bN = 40. cCohen's d values were computed from the F test output, which takes into account the correlation between baseline and retest scores
in this within-subjects design.
Test-retest reliability of TCI-R scales and subscales at 2 weeks was very satisfactory, but the ICCs obtained at 6
months were merely fair to good, a result suggesting that consistency of the scales over time is perhaps a
weakness of the TCI-R and more particularly for the NS scale. This was confirmed by higher differences in
effect size for test-retest at 6 months. Effects sizes at 2 weeks were only moderate (0.20) for ST and ST subscales
ST1 and ST2. Nevertheless, the limited sample size for the retest at 6 months could have contributed to the weak
ICC coefficients.
Published in: Journal of Personality Assessment (2005), vol.85, iss.1, pp.40-49.
Status: Postprint (Author’s version)
In contrast to our results, Pélissolo et al. (in press) provided very good test-retest data on 21 psychiatric patients
(3-week interval) and 15 healthy participants (1-week interval) with the TCI-R. The ICC coefficients ranged
from .82 to .93, and the ICC coefficients for NS were .91 and .93, respectively, in the clinical sample and in
healthy participants. Unfortunately, neither Brändström et al. (2003) nor Gutierrez-Zotes et al. (2004) have
computed test-retest coefficients. However, Cloninger et al. (1991) reported 6-month test-retest correlations from
a previous instrument (Tridimensional Personality Questionnaire) that were comparable to those found in this
study (i.e., .79 for HA, .70 for RD, and .76 for NS). The main difference appears for the NS dimension. Pélissolo
and Lépine (1997) reported very high ICC coefficients for the TCI scales among a sample of 65 undergraduate
students for an interval of 32 days between test and retest. They provided only the scales' ICCs, and no
information was available concerning subscales. In general, 2-week ICC values of this study were similar to
those reported by Pélissolo and Lépine (1997).
The results show that gender influences significantly some dimensions of the TCI-R. Specifically, women
exhibited higher scores on HA, RD, and C than men. Pélissolo et al. (in press) found higher TCI-R scores on RD,
SD, and C among women. Again, with the TCI-R, Gutierrez-Zotes et al. (2004) reported that women scored
higher on HA, RD, and C, although men scored higher on PS. Approximately the same effects were observed for
the TCI among 322 representative Belgian participants (Hansenne et al., 2001), with the exception that in the
TCI study, SD was lower in women. Moreover, Cloninger et al. (1993) showed that women had higher scores on
the C scale and also the ST subscale ST3. With the French version of the TCI, Pélissolo and Lépine (1997) also
found that women tended to have higher scores on HA and RD. One may question these gender differences.
Concerning higher HA scores in women found in this study and in the study of Gutierrez-Zotes et al. (2004), it is
usually reported that women are on average more anxious than men, and several epidemiological studies have
reported a greater prevalence of anxiety disorders among women (Fullerton et al., 2001; Sheikh, Leskin, &
Klein, 2002). Moreover, it was suggested from a twin study that the increased prevalence of anxiety disorders in
women may occur because anxiety sensitivity could be heritable in women (Jang, Stein, Taylor, & Livesley,
1999). An alternative explanation may be that men underreport depressive and anxiety symptoms because it is
socially undesirable for them to admit mental health problems (Vredenburg, Kramers, & Flett, 1986).
This study showed that the TCI-R scales were weakly related among themselves. Pélissolo et al. (in press) found
also weak correlations among scales of the TCI-R. Moreover, the relationships are consistent with those reported
by Cloninger et al. (1993) and by Hansenne et al. (2001) for the TCI. The highest correlation in this study was
observed between RD and C, suggesting that individuals characterized by attachment, dependency, and
sentimentality exhibit good empathy, compassion, and social acceptance. This higher association was probably
caused by the addition of a RD2 subscale (openness to warm communication) within the RD scale. The second
highest correlation found here related SD with HA. In the study conducted by Pélissolo et al. (YEAR), SD was
highly negatively correlated with HA (-.60). This relation can mean that the anxious participants had more
difficulties choosing goals and personal values and that they did not accept themselves. In addition, several
studies have demonstrated that some dimensions, especially the NS dimension, varied with age (Cloninger et al.,
1991; Hansenne et al., 2001; Le Bon, Staner, Tecco, Pull, & Pelc, 1998; Lépine et al., 1994). Moreover, SD and
C scores were reported to have a strong correlation with age (Cloninger et al., 1993). This study confirms the
relationship between both NS and SD scales and age. Last, SD and C were associated. This point confirms that
these two scales are interrelated developmen-tally as a person matures and validates the effectiveness of adding
them to create a maturity score used to determine the presence or absence of personality disorders (Bayon et al.,
1996; Cloninger & Svrakic, 1997).
Finally, it is interesting to observe that the mean scores of the main dimensions obtained in our sample were
consistent with those reported by the other European studies that used the TCI-R (Brändstrom et al., 2003;
Gutierrez-Zotes et al., 2004, Pélissolo et al., in press). This means that German, Spanish, Sweden, French, and
Belgian participants have approximately the same mean scores on the dimensions proposed by Cloninger and
colleagues (Cloninger etal., 1993) and that cultural differences found in these countries do not influence mean
personality dimensions among the population.
Several limitations of this study should be acknowledged. First, although the sample was beyond the typical
college student sample, it comprised more women (546) than men (412). The sex disparity within the sample
between students and relatives was even more problematic. Indeed, there were more men in the relative group
(374) than in the student group (68), whereas for women, the two groups were comparable (282 vs. 264). This
occurred because there were more female students in psychology courses in Belgium, and so to compensate this
bias, we recruited more men in the relative group. However, we have no information about the proportion of
students within the relative group. Second, and more important, this validation study was limited to the TCI-R
data, and we have no external criteria or other personality dimensions provided by other tests to relate with the

Published in: Journal of Personality Assessment (2005), vol.85, iss.1, pp.40-49.
Status: Postprint (Author’s version)
results. In short, the study lacks evidence of convergent or discriminant validity. Further studies should be
conducted in which the TCI-R is completed in conjunction with other measures of personality. More particularly,
the relationships between the TCI-R and the Five-factor model inventory (Revised NEO Personality Inventory
[NEO-PI-R]) would be of interest because some studies have already assessed the relationships between the
previous version of the questionnaire (TCI) and the NEO-PI-R (De Fruyt, Van De Wiele, & Van Heeringen,
2000; MacDonald & Holland, 2002).
In conclusion, this study confirms that the revised version of the TCI displays relatively good psychometric
properties. Particularly, the PS dimension appears to be a robust dimension that is well measured by the TCI-R.
The self-acceptance subscale SD4 was weakly correlated with the other SD subscales in this young sample, so its
development should be further examined in a longitudinal study or in an older population. Globally, the results
presented here give further support of the psychobiological model proposed by Cloninger and his colleagues
(Cloninger et al., 1993). However, because temperament scales and character scales are conceptualized as having
nonlinear rather than linear links, it is difficult to incorporate them in a single integrated factor model, and
consequently, this point constitutes a psychometric limitation of the TCI-R.
REFERENCES
Bayon, C, Hill, K., Svrakic, D. M, Przybeck, T. R., & Cloninger, C. R. (1996). Dimensional assessment of personality in an out-patients
sample: Relations of the systems of Million and Cloninger. Journal of Psychiatric Research, 30, 341-352.
Brändström, S., Richter, J., & Nylander, P. O. (2003). Further development of the temperament and character inventory. Psychological
Reports, 93, 995-1002.
Brändström, S., Schlette, P., Przybeck, T. R., Lundberg, M., Forsgren, T., Sigvardson, S., et al. (1998). Swedish normative data on
personality using the Temperament and Character Inventory. Comprehensive Psychiatry, 39, 122-128.
Bulik, C. M., Sullivan, P. E, & Joyce, P. R. (1999). Temperament, character and suicide attempts in anorexia nervosa, bulimia nervosa and
major depression. Acta Psychiatrica Scandinavica, 100, 27-32.
Cloninger, C. R. (1986). A unified biosocial theory of personality and its role in the development of anxiety states. Psychiatric
Developments, 3, 167-226.
Cloninger, C. R. (1987). A systematic method for clinical description and classification of personality variants. Archives of General
Psychiatry, 44, 573-588.
Cloninger, C. R. (1999). The Temperament and Character Inventory—Revised. St Louis, MO: Center for Psychobiology of Personality,
Washington University.
Cloninger, C. R. (2000). Biology of personality dimensions. Current Opinion in Psychiatry, 13, 611-616.
Cloninger, C. R. (2004). Feeling good: The science of well-being. New York: Oxford University Press.
Cloninger, C. R., Przybeck, T. R., & Svrakic, D. M. (1991). The tridimensional personality questionnaire: US normative data. Psychological
Reports, 69, 1047-1057.
Cloninger, C. R., Przybeck, T. R., Svrakic, D. M, & Wetzel, R. D. (1994). The Temperament and Character Inventory (TCI): A guide to its
development and use. St Louis, MO: Center for Psychobiology of Personality, Washington University.
Cloninger, C. R., & Svrakic, D. M. (1997). Integrative psychobiological approach to psychiatric assessment and treatment. Psychiatry, 60,
120-141.
Cloninger, C. R., Svrakic, D. M., & Przybeck, T. R. (1993). A psychobiological model of temperament and character. Archives of General
Psychiatry, 50, 975-990.
Cloninger, C. R., Svrakic, N. M., & Svrakic, D. M. (1997). Role of personality self-organization in development of mental order and
disorder. Development and Psychopathology 9, 881-906.
Corruble, E., Duret, C, Pélissolo, A., Falissard, B., & Guelfi, J. D. (2002). Early and delayed personality changes associated with depression
recovery? A one-year follow-up study. Psychiatry Research, 109, 17-25.
Curtin, E, Walker, J. P., Peyrin, L., Soulier, V., Badan, M., & Schulz, P. (1997). Reward dependence is positively related to urinary
monoamines in normal men. Biological Psychiatry, 42, 275-281.
De Fruyt, E, Van de Wiele, L., & Van Heeringen, C. (2000). Cloninger's psychobiological model of temperament and character and the Five-
factor model of personality. Personality and Individual Differences, 29, 441-452.

Published in: Journal of Personality Assessment (2005), vol.85, iss.1, pp.40-49.
Status: Postprint (Author’s version)
de la Rie, S. M., Duijsens, I. J., & Cloninger, C. R. (1998). Temperament, character and personality disorders. Journal of Personality
Disorders, 12, 362-372.
Eklund, M., Hansson, L., & Bengtsson-Tops, A. (2004). The influence of temperament and character on functioning and aspects of
psychological health among people with schizophrenia. European Psychiatry, 19, 34-41.
Engstrom, C, Brändström, S., Sigvardson, S., Cloninger, C. R., & Nylander, P. O. (2004). Bipolar disorder. III: Harm avoidance a risk factor
for suicide attempts. Bipolar Disorders, 6, 130-138.
Fullerton, C. S., Ursano, R. J., Epstein, R. S., Crowley, B., Vance, K., Kao, T. C, et al. (2001). Gender differences in posttraumatic stress
disorder after motor vehicle accidents. American Journal of Psychiatry, 158, 1486-1491.
Cana, K., & Trouillet, R. (2003). Structure invariance of the Temperament and Character Inventory (TCI). Personality and Individual
Differences, 34, 1-13.
Carvey, M. J., Noyes, R., Cook, B., & Blum, N. (1996). Preliminary confirmation of the proposed link between reward-dependence traits and
norepinephrine. Psychiatry Research, 65, 61-64.
Gerra, G., Zaimovic, A., Timpano, M., Zambelli, U., Delsignore, R., & Brambilla, E (2000). Neuroendocrine correlates of temperamental
traits in human. Psychoneuroendocrinology 25, 479-496.
Glorfeld, L. W. (1995). An improvement on Horn's parallel analysis methodology for selecting the correct number of factors to retain.
Educational and Psychological Measurement, 55, 377-393.
Grucza, R. A., Przybeck, T. R., Spitznagel, E. L., & Cloninger, C. R. (2003). Personality and depressive symptoms: A multi-dimensional
analysis. Journal of Affective Disorders, 74, 123-130.
Gutierrez, E, Torrens, M., Boget, T, Martin-Santos, R., Sangorrin, J., Perez, G, et al. (2001). Psychometric properties of the Temperament
and Character Inventory (TCI) questionnaire in a Spanish psychiatric population. Acta Psychiatrica Scandinavica, 103, 143-147.
Gutierrez-Zotes, J., Bayon, C, Montserrat, C, Valero, J., Labad, A., Cloninger, C. R., et al. (2004). Temperament and Character Inventory
Revised (TCI-R). Standardization and normative data in a general population sample. Adas Españolas de Psiquiatría, 32, 8-15.
Hansenne, M. (1999). P300 and personality: An investigation with the Cloninger model of personality. Biological Psychology, 50, 143-155.
Hansenne, M., & Ansseau, M. (1998). Catecholaminergic function and temperament in major depressive disorder: A negative report.
Psychoneuroendocrinology, 23, 477-483.
Hansenne, M., & Ansseau, M. (1999). Harm avoidance and serotonin. Biological Psychology, 51, 77-81.
Hansenne, M., Le Bon, O., Gauthier, A., & Ansseau, M. (2001). Belgian normative data of the Temperament and Character Inventory.
European Journal of Psychological Assessment, 17, 56-62.
Hansenne, M., Pinto, E., Pitchot, W., Reggers, J., Scantamburlo, G., Moor, M., et al. (2002). Further evidence on the relationship between
dopamine and novelty seeking: A neuroendocrine study. Personality and Individual Differences, 33, 967-977.
Hansenne, M., Pitchot, W., Gonzalez Moreno, A., Machurot, P.-Y., Reggers, J., & Ansseau, M. (1997). The harm avoidance dimension of
the tridimensional personality questionnaire and 5-HT1A activity in depression. Biological Psychiatry, 42, 959-961.
Hansenne, M., Reggers, J., Pinto, E., Kjiri, K., Ajamier, A., & Ansseau, M. (1999). Temperament and Character Inventory (TCI) and
depression. Journal of Psychiatric Research, 33, 31-36.
Hennig, J., Toll, C, Schonlau, P., Rohrmann, S., & Netter, P. (2000). Endocrine responses after d-fenfluramine and ipsapirone challenge:
Further support for Cloninger's tridimensional model of personality. Neuropsychobiology 41, 38-47.
Jang, K. L., Stein, M. B., Taylor, S., & Livesley, W. J. (1999). Gender differences in the etiology of anxiety sensitivity: A twin study. The
Journal of Gender-Specific Medicine, 2, 39-44.
Le Bon, O., Staner, L., Tecco, J., Pull, C, & Pelc, I. (1998). Le questionnaire tridimensionnel de la personnalite (TPQ): Validation dans une
population francophone. [Tridimensional Personality Questionnaire (TPQ): Validation in a French-speaking control population].
L'encéphale, 14, 40-45.
Lépine, J.-P., Pélissolo, A., Téodorescu, R., & Téhérani, M. (1994). Evaluation des propriétés psychométriques de la version française du
questionnaire tridimensionnel de la personnalité (TPQ). [Evaluation of the psychometric properties of the French version of the
Tridimensional Personality Questionnaire (TPQ)]. L'Encéphale, 20, 747-753.
Limson, R., Goldman, D., Roy, A., Lamparski, D., Ravitz, B., Adinoff, B., et al. (1991). Personality and cerebrospinal fluid monoamine
metabolites in alcoholics and controls. Archives of General Psychiatry, 48, 437-441.

Published in: Journal of Personality Assessment (2005), vol.85, iss.1, pp.40-49.
Status: Postprint (Author’s version)
MacDonald, D. A., & Holland, D. (2002). Examination of the relations between the NEO Personality Inventory-Revised and the
Temperament and Character Inventory. Psychological Reports, 91, 921-930.
Marijnissen, G., Tuinier, S., Sijben, A. E., & Verhoeven, W. M. (2002). The Temperament and Character Inventory in major depression.
Journal of Affective Disorders, 70, 219-223.
McGraw, K. O., & Wong, S. P. (1996). Forming inferences about some intraclass correlation coefficients. Psychological Methods, 1, 30-46.
O'Connor, B. P. (2000). SPSS and SAS programs for determining the number of components using parallel analysis and Velicer's MAP test.
Behavior Research Methods, Instruments and Computers, 32, 396-402.
Pélissolo, A., & Lépine, J.-P. (1997). Traduction française et premières études de validation du questionnaire de personnalité TCI. [French
translation and first validation studies of the personality questionnaire TCI]. Annales Médico-Psychologiques, 155, 497-508.
Pélissolo, A., & Lépine, J.-P. (2000). Normative data and factor structure of the Temperament and Character Inventory (TCI) in the French
version. Psychiatry Research, 94, 67-76.
Pélissolo, A., Mallet, L., Baleyte, J.-M., Michel, G., Cloninger, C. R., Allilaire, J.-F, et al. (in press). The Temperament and Character
Inventory-Revised (TCI-R): Psychometric characteristics of the French version. Acta Psychiatrica Scandinavica.
Pélissolo, A., Notides, C, Musa, C, Téhérani, M., & Lépine, J.-P (2000). French translation of the Temperament and Character Inventory-
Revised. Unpublished manuscript.
Sheikh, J. I., Leskin, G. A., & Klein, D. F (2002). Gender differences in panic disorder: Findings from the National Comorbidity Survey.
American Journal of Psychiatry, 159, 55-58.
Svrakic, D. M., Przybeck, T. R., & Cloninger, C. R. (1991). Further contribution to the conceptual validity of the unified biosocial model of
personality: US and Yugoslav data. Comprehensive Psychiatry, 32, 195-209.
Svrakic, D. M., Whitehead, C, Przybeck, T. R., & Cloninger, C. R. (1993). Differential diagnosis of personality disorders by the seven-factor
model of temperament and character. Archives of General Psychiatry, 50, 991-999.
Tanaka, E., Sakamoto, S., Kijima, N., & Kitamura, T. (1998). Different personalities between depression and anxiety. Journal of Clinical
Psychology, 54, 1043-1051.
Tomina, T, Aoyama, H., Kitamura, T, Sekiguchi, C, Murai, T, & Matsuda, T. (2000). Factor structure of psychobiological seven-factor
model of personality: A model-revision. Personality and Individual Differences, 29, 709-729.
Van Ammers, E. C, Sellman, J. D., & Mulder, R. T. (1997). Temperament and substance abuse in schizophrenia: Is there a relationship?
Journal of Nervous and Mental Diseases, 185, 283-288.
Vredenburg, K., Krames, L., & Flett, G. (1986). Sex differences in the clinical expression of depression. Sex Roles, 14, 37-49.
Wiesbeck, G. A., Mauerer, C, Thome, J., Jacob, F, & Boening, J. (1995). Neuroendocrine support for a relationship between "novelty
seeking" and dopaminergic function in alcohol-dependent men. Psychoneuroendocrinology 20, 755-761.


![La rivista del Turismo TCI Febbraio[1]](https://static.fdokumen.com/doc/165x107/631b01c3d5372c006e03bf8c/la-rivista-del-turismo-tci-febbraio1.jpg)