Item-Level Psychometric Analysis of the Psychosocial ... - MDPI
Upload
independentCategory
view
1download
0
007) 59–68
Intelligence 35 (2Psychometric intelligence and achievement: A cross-laggedpanel analysis☆
Marley W. Watkins a,⁎, Pui-Wa Lei a, Gary L. Canivez b
a Pennsylvania State University, Department of Educational and School Psychology and Special Education, 125 CEDAR Building, University Park,PA 16802, United States
b Eastern Illinois University, United States
Received 13 January 2006; received in revised form 1 April 2006; accepted 18 April 2006
Available online 5 June 2006Abstract
There has been considerable debate regarding the causal precedence of intelligence and academic achievement. Someresearchers view intelligence and achievement as identical constructs. Others believe that the relationship between intelligence andachievement is reciprocal. Still others assert that intelligence is causally related to achievement. The present study addressed thisdebate with a cross-lagged panel analysis of WISC-III and achievement test scores of 289 students assessed for special educationeligibility with a test–retest interval of 2.8 years. The optimal IQ–achievement model reflected the causal precedence of IQ onachievement. That is, the paths from IQ scores at time 1 to IQ and achievement scores at time 2 were significant whereas the pathsfrom achievement scores at time 1 to IQ scores at time 2 were not significant. Within the limits imposed by the design and sample,it appears that psychometric IQ is a causal influence on future achievement measures whereas achievement measures do notsubstantially influence future IQ scores.
© 2006 Elsevier Inc. All rights reserved.Keywords: Intelligence; Achievement; Causality; Longitudinal
Tests of intelligence and academic achievement areubiquitous in American schools. For example, it isestimated that school psychologists administer between1.5 and 1.8million intelligence tests each year (Gresham&Witt, 1997), resulting in more than five million students
enrolled in special education programs (Kamphaus,☆ Note: This research was supported, in part, by an Eastern IllinoisUniversity Faculty Development Grant and a Pennsylvania StateUniversity College of Education Alumni Society Faculty ResearchInitiation Grant. The authors wish to express their gratitude to theschool psychologists who generously responded to our request fordata.⁎ Corresponding author.E-mail address: [email protected] (M.W. Watkins).
0160-2896/$ - see front matter © 2006 Elsevier Inc. All rights reserved.doi:10.1016/j.intell.2006.04.005
Petoskey, & Rowe, 2000). While more difficult to count,evaluations by clinical psychologists are also likely toinclude tests of intelligence and achievement (Budd, Felix,Poindexter, Naik-Polan, & Sloss, 2002).
In current usage, intelligence tests are thought tomeasure general reasoning skills that are predictive ofacademic achievement (Parker & Benedict, 2002). Indeed,concurrent IQ–achievement correlations are substantial(Naglieri & Bornstein, 2003) and, consequently, compar-isons of IQ and achievement scores constitute one of theprimary methods of diagnosing learning disabilities (Yen,Konold, & McDermott, 2004). However, intelligence andachievement tests often contain some items or tasks that
appear to access information that is taught in school (i.e.,
Fig. 1. Conceptual model of a cross-lag design for IQ and achievementmeasured on two sequential occasions.
60 M.W. Watkins et al. / Intelligence 35 (2007) 59–68
vocabulary, arithmetic) and there has been considerabledebate regarding the separateness or distinctiveness ofintelligence and academic achievement (Flanagan,Andrews, & Genshaft, 1997; Lubinski & Dawis, 1992).This apparent overlap in test coverage, among other factors,
has led some to view intelligence and achievement asFig. 2. Final simplified, longitudinal, cross-lagged model of IQ and achievindicates time 2 testing. Nonsignificant loadings deleted for simplicity. PC=Arrangement, BD=Block Design, VO=Vocabulary, OA=Object Assemblcomprehension, Calc=math calculation, Reas=math reasoning, VC=Verbbetween errors of SM1 and SM2, Comp1 and Comp2, and Reas1 and Reas2measures are free. Parameter estimates are standardized.Fig. 3. Model 1. NotVC=WISC-III Verbal Comprehension and PO=WISC-III Perceptual Organ
identical constructs. For example, Ceci (1991) assertedthat, “the contents of achievement tests and the contents ofso-called intellectual aptitude tests as they are currentlyconstructed are highly similar and inseparable both theo-retically and statistically” (p. 708). Others have suggestedthat the relationship between intelligence test scores andeducational achievement is reciprocal, mutually influenc-ing each other (Brody, 1997). This interactivist view wasexemplified by Stanovich's (1986) Matthew effect: the“tendency of reading itself to cause further development inother related cognitive abilities, i.e., IQ, such that “the richget richer and the poor get poorer” (p. 21). Subsequently,special education researchers have suggested that onlyachievement tests should be used to identify children withlearning disabilities (Fletcher, Morris, & Lyon, 2003;Siegel, 1989, 1999). Finally, some researchers assert thatintelligence is causally related to achievement (Jensen,2000).
This debate is not new. The same questions regardingthe relationship between intelligence and achievement havebeen asked for decades. As cogently stated by Crano,Kenny, and Campbell (1972), “does the acquisition of
specific skills or the learning of specific informationement across time. Note: Suffix of 1 indicates time 1 and suffix of 2Picture Completion, IN=Information, SM=Similarities, PA=Picture
y, CM=Comprehension, Basic=basic word reading, Comp=readingal Comprehension, and PO=Perceptual Organization. Correlationsare fixed to 0; errors between the remaining pairs of time 1 and time 2e: Suffix of 1 indicates time 1 and suffix of 2 indicates time 2 testing.ization. Parameter estimates are standardized.
the causal precedence of ability and achievement.
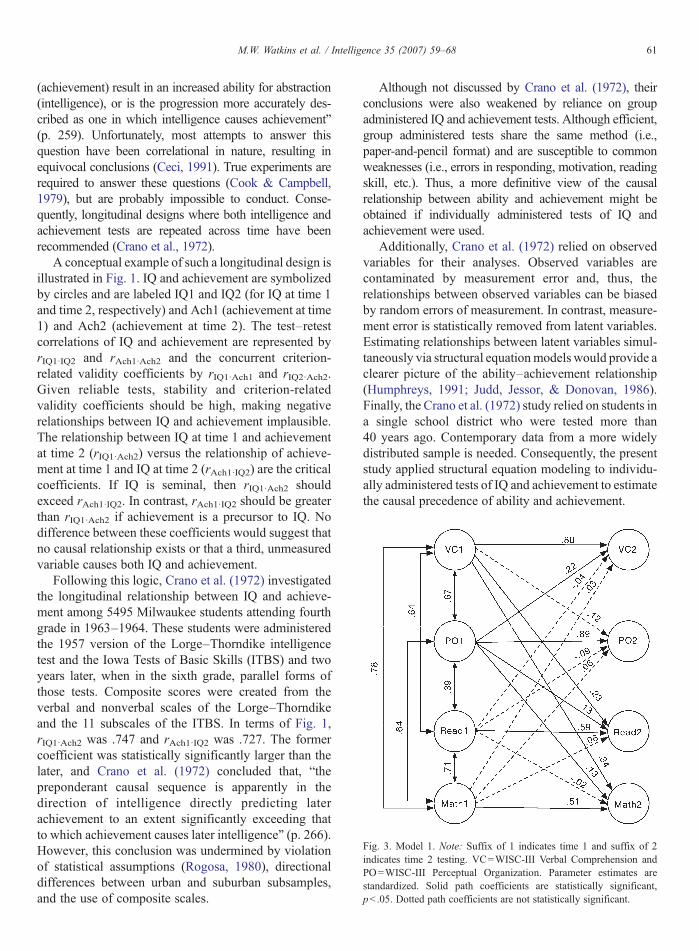
Fig. 3. Model 1. Note: Suffix of 1 indicates time 1 and suffix of 2indicates time 2 testing. VC=WISC-III Verbal Comprehension andPO=WISC-III Perceptual Organization. Parameter estimates arestandardized. Solid path coefficients are statistically significant,
61M.W. Watkins et al. / Intelligence 35 (2007) 59–68
(achievement) result in an increased ability for abstraction(intelligence), or is the progression more accurately des-cribed as one in which intelligence causes achievement”(p. 259). Unfortunately, most attempts to answer thisquestion have been correlational in nature, resulting inequivocal conclusions (Ceci, 1991). True experiments arerequired to answer these questions (Cook & Campbell,1979), but are probably impossible to conduct. Conse-quently, longitudinal designs where both intelligence andachievement tests are repeated across time have beenrecommended (Crano et al., 1972).
A conceptual example of such a longitudinal design isillustrated in Fig. 1. IQ and achievement are symbolizedby circles and are labeled IQ1 and IQ2 (for IQ at time 1and time 2, respectively) and Ach1 (achievement at time1) and Ach2 (achievement at time 2). The test–retestcorrelations of IQ and achievement are represented byrIQ1·IQ2 and rAch1·Ach2 and the concurrent criterion-related validity coefficients by rIQ1·Ach1 and rIQ2·Ach2.Given reliable tests, stability and criterion-relatedvalidity coefficients should be high, making negativerelationships between IQ and achievement implausible.The relationship between IQ at time 1 and achievementat time 2 (rIQ1·Ach2) versus the relationship of achieve-ment at time 1 and IQ at time 2 (rAch1·IQ2) are the criticalcoefficients. If IQ is seminal, then rIQ1·Ach2 shouldexceed rAch1·IQ2. In contrast, rAch1·IQ2 should be greaterthan rIQ1·Ach2 if achievement is a precursor to IQ. Nodifference between these coefficients would suggest thatno causal relationship exists or that a third, unmeasuredvariable causes both IQ and achievement.
Following this logic, Crano et al. (1972) investigatedthe longitudinal relationship between IQ and achieve-ment among 5495 Milwaukee students attending fourthgrade in 1963–1964. These students were administeredthe 1957 version of the Lorge–Thorndike intelligencetest and the Iowa Tests of Basic Skills (ITBS) and twoyears later, when in the sixth grade, parallel forms ofthose tests. Composite scores were created from theverbal and nonverbal scales of the Lorge–Thorndikeand the 11 subscales of the ITBS. In terms of Fig. 1,rIQ1·Ach2 was .747 and rAch1·IQ2 was .727. The formercoefficient was statistically significantly larger than thelater, and Crano et al. (1972) concluded that, “thepreponderant causal sequence is apparently in thedirection of intelligence directly predicting laterachievement to an extent significantly exceeding thatto which achievement causes later intelligence” (p. 266).However, this conclusion was undermined by violationof statistical assumptions (Rogosa, 1980), directionaldifferences between urban and suburban subsamples,
and the use of composite scales.Although not discussed by Crano et al. (1972), theirconclusions were also weakened by reliance on groupadministered IQ and achievement tests. Although efficient,group administered tests share the same method (i.e.,paper-and-pencil format) and are susceptible to commonweaknesses (i.e., errors in responding, motivation, readingskill, etc.). Thus, a more definitive view of the causalrelationship between ability and achievement might beobtained if individually administered tests of IQ andachievement were used.
Additionally, Crano et al. (1972) relied on observedvariables for their analyses. Observed variables arecontaminated by measurement error and, thus, therelationships between observed variables can be biasedby random errors of measurement. In contrast, measure-ment error is statistically removed from latent variables.Estimating relationships between latent variables simul-taneously via structural equationmodels would provide aclearer picture of the ability–achievement relationship(Humphreys, 1991; Judd, Jessor, & Donovan, 1986).Finally, the Crano et al. (1972) study relied on students ina single school district who were tested more than40 years ago. Contemporary data from a more widelydistributed sample is needed. Consequently, the presentstudy applied structural equation modeling to individu-ally administered tests of IQ and achievement to estimate
pb .05. Dotted path coefficients are not statistically significant.

Fig. 5. Model 3. Note. Suffix of 1 indicates time 1 and suffix of 2indicates time 2 testing. VC=WISC-III Verbal Comprehension andPO=WISC-III Perceptual Organization. Parameter estimates arestandardized. Solid path coefficients are statistically significant,pb .05. Dotted path coefficients are not statistically significant.
62 M.W. Watkins et al. / Intelligence 35 (2007) 59–68
1. Method
1.1. Participants
Participants were 289 students (192 male and 97 fe-male) twice tested with theWechsler Intelligence Scale forChildren-Third Edition (WISC-III; Wechsler, 1991) fordetermination of eligibility for special education services.Ethnicity was 78.2% Caucasian, 5.2% Hispanic/Latino,10.4% Black/African American, 1.0% Native American/American Indian, and 5.2%Other/Missing. Students werediagnosed by multidisciplinary evaluation teams accord-ing to state and federal guidelines governing special edu-cation classification. Special education diagnosis uponinitial evaluation included 68.2% learning disability, 8.0%emotional disability, 8.0% mental retardation, 4.5% un-specified, 8.2% other disabilities, and 3.1% not disabled.
The mean test–retest interval was 2.8 years (SD=.50)with a range of .70 to 4.0 years. However, only 3 studentswere retested within one year and only 14 within twoyears. The mean age of students at first testing was9.25 years and ranged from 6.0 to 13.9 years. The meanage of students at second testing was 12.08 and rangedfrom 8.0 to 16.9 years. Additional detailed demographicinformation may be obtained from Canivez and Watkins
(1998, 1999, 2001).Fig. 4. Model 2. Note. Suffix of 1 indicates time 1 and suffix of 2indicates time 2 testing. VC=WISC-III Verbal Comprehension andPO=WISC-III Perceptual Organization. Parameter estimates arestandardized. Solid path coefficients are statistically significant,pb .05. Dotted path coefficients are not statistically significant.
1.2. Instruments
The WISC-III is an individually administered test ofintelligence for children aged 6 years through 16 years,11 months that was standardized on a nationally repre-sentative sample (N=2200) closely approximating the1988 United States Census on gender, parent education(SES), race/ethnicity, and geographic region. TheWISC-III has 13 individual subtests (M=10, SD=3), ten stan-dard and three supplementary, that combine to yieldthree composite scores: Verbal (VIQ), Performance(PIQ), and Full Scale (FSIQ) IQs (M=100, SD=15).In addition, the WISC-III provides four factor-basedindex scores: Verbal Comprehension (VC), PerceptualOrganization (PO), Freedom from Distractibility (FD),and Processing Speed (PS) (M=100, SD=15). Giventhat the VC and PO factors are robust across ex-ceptional populations (Watkins & Kush, 2002), thosetwo factors were included in this study. Eight subtestscompose the VC (Information, Vocabulary, Similari-ties, and Comprehension) and PO (Object Assembly,Block Design, Picture Completion, and Picture Ar-rangement) factors. Full details of the WISC-III and itsstandardization are presented in Wechsler (1991). Ad-ditional reliability and validity data are provided bySattler (2001) as well as Zimmerman and Woo-Sam
(1997).
2, suggesting that the measures were likely invariant.
Fig. 6. Model 4. Note. Suffix of 1 indicates time 1 and suffix of 2indicates time 2 testing. VC=WISC-III Verbal Comprehension andPO=WISC-III Perceptual Organization. Parameter estimates arestandardized. Solid path coefficients are statistically significant,
1 With only two first-order ability factors (VC and PO), a second-order factor (g) could not be statistically identified. Even if aconstraint was imposed to allow the model to be identified, thesecond-order model would have been statistically equivalent to thefirst-order model and, therefore, non-informative. Oh, Glutting,Watkins, Youngstrom, and McDermott (2004) demonstrated that bothg and VC contributed to the prediction of academic achievement,although g was at least three times more important than VC. Similarresults have been reported for other measures of intelligence(Gustafsson & Balke, 1993; Keith, 1999; Glutting, Watkins, Konold,& McDermott, in press). In short, when general and specific abilityconstructs are compared to achievement constructs, g usuallyaccounts for the largest proportion of variance in achievement.Consequently, psychometric intelligence or ability in this studycontained variance attributable to the first-order factors (VC and PO)
63M.W. Watkins et al. / Intelligence 35 (2007) 59–68
Academic achievement was measured by a total of 5tests or combinations of tests. However, contemporaryversions of the Woodcock–Johnson Tests of Achieve-ment, Wechsler Individual Achievement Test, and Kauf-man Test of Educational Achievement were used in morethan 90% of the cases. In reading, all achievement testsincluded separate basic word reading and reading com-prehension subtests (M=100, SD=15). In math, separatecalculation and reasoning subtests (M=100, SD=15)were available for all academic achievement instruments.
1.3. Procedure
Two thousand school psychologists were randomlyselected from the National Association of SchoolPsychologists membership roster and invited via mail toparticipate by providing test scores and demographic dataobtained from recent special education triennial reevalua-tions. Data were voluntarily submitted on 667 cases by145 school psychologists from 33 states. Of these cases,289 contained scores for the requisite eight WISC-III andfour academic achievement subtests. These 289 caseswere provided by 67 school psychologists from 27 states.
1.4. Analyses
There were no serious departures from univariate
pb .05. Dotted path coefficients are not statistically significant.
normality (Onwuegbuzie & Daniel, 2002). Univariate
skewness of the 24 variables (12 at time 1 and 12 at time 2)ranged from − .31 to .54 and univariate kurtosis rangedfrom − .41 to 2.12 (Mardia's normalized multivariatekurtosis=5.88). EQS (Bentler, 2002; Bentler & Wu,2002) was used for model estimation, and robustmaximum likelihood solutions with Satorra and Bentler(1994) correction to chi-square and standard error esti-mates were requested. Because the robust solution wasvery similar to the normal theory solution and the chi-square difference was of primary interest for modelcomparisons, without loss of generality the normal theorymaximum likelihood solution was reported.
The two-step modeling strategy for hybrid models(Kline, 1998, p. 251–252)was followed. The first stepwasto identify a measurement model that fit the datasatisfactorily and the second step was to explore thestructural relationship among the latent variables. An 8-factor (4 factors for each time point: 2 WISC-III factors[VC and PO]1 and 2 achievement factors [reading andmath]) confirmatory factor analysis (CFA) model wasfitted to the data allowing errors of the samevariable acrosstime to correlate for each variable and all factors to be inter-correlated (Fig. 2 shows how the observed variablesloaded on the factors). One loading for each latent factorwas fixed to 1 to set its scale, and the covariance matrixwas analyzed. The final CFA model, with the across-timecorrelated errors for similarities (SM), reading compre-hension (Comp), and Mathematical reasoning (Reas)excluded because they were statistically non-significantat the .05 level, fit the data reasonably well (χ2=370.51,df=215, RMSEA=.05, SRMR=.047, CFI= .97). Allfactor loadings were statistically significant at the .05level, as were factor covariances. The acceptable fit of thisCFA model to the data lent support to the separability ofthe measured intelligence and achievement constructs.
The factor loadingswere similar across time 1 and time
as well as variance from the unmodeled second-order g factor.

factors were allowed to affect their respective time 2
Table 1Wechsler Intelligence Scale for Children-Third Edition andachievement scores of 289 students twice tested for special educationeligibility
Time 1 Time 2
Mean SD Mean SD
Picture Completion 8.7 3.2 9.0 3.3Information 7.8 3.1 8.1 3.1Similarities 8.2 3.2 8.6 3.1Picture Arrangement 8.6 3.6 9.0 4.0Block Design 8.5 3.6 8.3 4.1Vocabulary 8.2 3.0 7.5 2.9Object Assembly 8.4 3.4 8.6 3.6Comprehension 8.9 3.6 8.4 3.6Full scale IQ 89.6 15.0 89.3 16.3Verbal Comprehension Index 91.2 14.9 90.7 14.9Perceptual Organization Index 92.5 16.6 93.6 18.3Basic word reading 82.9 14.0 84.0 14.8Reading comprehension 85.5 13.8 89.0 15.7Math calculation 86.9 15.2 85.9 17.5Math reasoning 91.4 15.5 91.9 15.9
Fig. 7. Model 5. Note. Suffix of 1 indicates time 1 and suffix of 2indicates time 2 testing. VC=WISC-III Verbal Comprehension andPO=WISC-III Perceptual Organization. Parameter estimates arestandardized. Solid path coefficients are statistically significant,pb .05. Dotted path coefficients are not statistically significant.
64 M.W. Watkins et al. / Intelligence 35 (2007) 59–68
Watkins and Canivez (2001) demonstrated factor invari-ance across time for these same WISC-III subtests.However, it was not clear if the achievement subtestswere also invariant across time. ACFAmodel constrainingthe factor loadings for WISC-III factors [VC and PO] andachievement factors [reading and math] to be equal acrosstime 1 and time 2 was examined to test this factorialinvariance hypothesis. The model provided similarparameter estimates and similar overall model fit to theoriginal CFAmodel (χ2=390.62, df=223, RMSEA=.051,SRMR=.054, CFI=.99), suggesting that the same con-structs were measured across time. Because the primaryinterest of the study was the structural relations among thetime 1 and time 2 factors and because a better fitting CFAmodel would provide a better baseline model for thatpurpose, structural relations were tested based on the ori-ginal CFA model.
Causal hypotheses among the latent factors weretested while the measurement part of the hybrid modelremained the same as the final CFA model describedabove. The structural models of interest are listed below(see Figs. 3–7):
M1: All four time 1 latent factors had direct paths to allfour time 2 factors.
M2: Each of the IQ time 1 factors had direct paths to all
four time 2 factors, and each of the time 1achievement factors had a direct path to its time 2achievement factor.
M3: Each of the achievement time 1 factors had directpaths to all four time 2 factors, and each of thetime 1 IQ factors had a direct path to its time 2 IQfactor.
M4: Each of the IQ time 1 factors had a direct path toits time 2 factor and to both time 2 achievementfactors, while each of the time 1 achievementfactors had a direct path to its time 2 achievementfactor alone.
M5: Each of the achievement time 1 factors had adirect path to its time 2 factor and to both time 2IQ factors, while each of the time 1 IQ factors hada direct path to its time 2 IQ factor alone.
M1 was the most general among the five models andwas expected to provide the best model-data fit. Ifintelligence and achievement mutually influence eachother as suggested by Ceci and Williams (1997), then allstructural path coefficients from time 1 to time 2 of M1would be similar in magnitude and perhaps statisticallysignificant. However, if intelligence was causally relatedto achievement as suggested by Jensen (2000), then M2would not be significantly worse than M1 in terms ofoverall model fit and M2 would provide a better model-data fit than M3.
M4 was similar to M2 except that time 1 IQ factorswere allowed to affect their respective time 2 factors only.M5 was similar to M3 except that time 1 achievement

Table 2Correlation matrices for Wechsler Intelligence Scale for Children-Third Edition and achievement subtest scores at time 1 (lower triangle) and time 2(upper triangle)
PC IN SM PA BD VO OA CM Basic Comp Calc Reas
PC 1 0.46 0.51 0.51 0.59 0.54 0.60 0.45 0.24 0.35 0.39 0.44IN 0.41 1 0.66 0.51 0.55 0.73 0.42 0.59 0.56 0.64 0.62 0.70SM 0.46 0.65 1 0.51 0.60 0.75 0.46 0.66 0.42 0.54 0.55 0.63PA 0.55 0.44 0.46 1 0.62 0.54 0.55 0.56 0.29 0.47 0.52 0.52BD 0.61 0.37 0.46 0.53 1 0.58 0.67 0.53 0.37 0.50 0.53 0.58VO 0.43 0.64 0.64 0.44 0.43 1 0.48 0.72 0.49 0.60 0.57 0.67OA 0.56 0.27 0.36 0.52 0.66 0.32 1 0.47 0.20 0.32 0.39 0.43CM 0.49 0.61 0.56 0.48 0.40 0.66 0.42 1 0.36 0.50 0.55 0.65Basic 0.20 0.47 0.44 0.23 0.24 0.42 0.13 0.32 1 0.78 0.57 0.55Comp 0.28 0.53 0.48 0.34 0.30 0.41 0.20 0.36 0.79 1 0.66 0.70Calc 0.38 0.52 0.48 0.43 0.38 0.41 0.33 0.42 0.53 0.58 1 0.80Reas 0.42 0.62 0.58 0.48 0.50 0.54 0.42 0.58 0.48 0.58 0.73 1
Note: PC=Picture Completion, IN=Information, SM=Similarities, PA=Picture Arrangement, BD=Block Design, VO=Vocabulary, OA=ObjectAssembly, CM=Comprehension, Basic=basic word reading, Comp=reading comprehension, Calc=math calculation, Reas=math reasoning.
65M.W. Watkins et al. / Intelligence 35 (2007) 59–68
factors only. If VC and PO did not influence each other,then M4 would not provide a significantly worse fit thanM2. Similarly, if reading and math achievement did notinfluence each other, M5 would not provide a signifi-cantly worse fit than M3. In that case, Jensen's (2000)hypothesis could be tested by comparing the relative fit ofM4 and M5.
2. Results
Descriptive statistics for the WISC-III IQ and factorindex scores across test and retest occasions arepresented in Table 1, the correlations between IQ andachievement tests at both times in Table 2, and the
correlations between IQ and achievement tests acrossTable 3Correlation matrices for Wechsler Intelligence Scale for Children-Third Edit
Time 2 PC IN SM PA BD VO
PC 0.63 0.38 0.45 0.48 0.60 0.43IN 0.48 0.75 0.61 0.48 0.48 0.61SM 0.51 0.61 0.63 0.48 0.53 0.63PA 0.55 0.43 0.39 0.68 0.54 0.46BD 0.61 0.45 0.51 0.57 0.80 0.48VO 0.54 0.66 0.63 0.54 0.51 0.75OA 0.59 0.34 0.36 0.50 0.62 0.39CM 0.46 0.58 0.57 0.54 0.46 0.60Basic 0.23 0.48 0.44 0.24 0.30 0.46Comp 0.40 0.58 0.55 0.45 0.44 0.54Calc 0.38 0.54 0.51 0.48 0.45 0.48Reas 0.43 0.63 0.58 0.52 0.50 0.57
Note: PC=Picture Completion, IN=Information, SM=Similarities, PA=PicAssembly, CM=Comprehension, Basic=basic word reading, Comp=readingdiagonal entries are test–retest coefficients.
time in Table 3. Although somewhat lower than theWISC-III standardization sample, IQ scores wereconsistent with other samples of students with disabil-ities (Kavale & Nye, 1985–86). The average correlationbetween IQ scores at time 1 and achievement scores attime 2 was .466 whereas the average correlation betweenachievement scores at time 1 and IQ scores at time 2 was.398. As per the conceptual framework illustrated inFig. 1, rIQ1·Ach2N rAch1·IQ2 provides preliminary supportfor the causal precedence of IQ scores.
The model fit indices for M1 to M5 are provided inTable 4 and the path coefficients are illustrated in Figs.3–7. Fit criteria were those identified by Hu and Bentler(1999) as most likely to protect against both Type I and
Type II errors: critical values of ≥ .96 for CFI combinedion and achievement subtest scores across time
Time 1
OA CM Basic Comp Calc Reas
0.57 0.46 0.17 0.25 0.37 0.460.38 0.56 0.51 0.46 0.50 0.620.42 0.57 0.39 0.41 0.49 0.590.48 0.47 0.22 0.31 0.39 0.490.68 0.47 0.26 0.32 0.45 0.550.44 0.69 0.41 0.40 0.44 0.600.68 0.46 0.14 0.21 0.33 0.410.41 0.71 0.30 0.33 0.39 0.570.24 0.37 0.78 0.67 0.49 0.470.39 0.48 0.65 0.65 0.57 0.630.40 0.48 0.48 0.51 0.66 0.660.46 0.59 0.44 0.48 0.60 0.75
ture Arrangement, BD=Block Design, VO=Vocabulary, OA=Objectcomprehension, Calc=math calculation, Reas=math reasoning. Bold

Table 4Fit indices for five hypothesized IQ–achievement models
Models χ2 df CFI RMSEA SRMR χ2 Δ
M1 437.32 221 .961 .059 .049 – –M2 439.94 227 .962 .058 .049 vs. M1: χ26=2.62M3 448.28 227 .959 .060 .049 vs. M1: χ26=10.96M4 465.46 229 .957 .061 .051 vs. M2: χ22=25.52⁎
vs. M1: χ28=28.14⁎
M5 531.81 229 .947 .068 .064 vs. M3: χ22=83.53⁎
vs. M1: χ28=94.49⁎
Note. χ28,95=15.51, χ26,95=12.59, χ
22,95=5.991.
⁎pb .05.
66 M.W. Watkins et al. / Intelligence 35 (2007) 59–68
with values ≤ .06 for the RMSEA and ≤ .08 for theSRMR index. According to these criteria, the data fitM1, M2, and M3 quite well. However, several paths ofM1 (mostly achievement at time 1 to IQ at time 2) weresmall in magnitude and not statistically significant. M2was not significantly worse that M1. Removal of thenonsignificant achievement to IQ paths from M1resulted in essentially the same models. Although M3was also not significantly worse fitting than M1 by thechi-square difference test, the chi-square differencevalue (10.96) was much higher than that between M1and M2 (2.62) for the same gain in degrees of freedom.Additionally, several statistically significant coefficientsin M3 (Read1→VC2, PO2, and Math2) were negative,which made little theoretical sense, and there was anout-of-bound standardized path coefficient (N1.0 forMath1→Math2). Given these anomalies, the solution ofM3 did not seem interpretable. M4 was significantlyworse than M2 and M5 was significantly worse thanM3. Hence, models M3, M4, and M5 were not selected.M2 was deemed to be the most parsimonious model thatbest fit the data. The final simplified, longitudinal, cross-lagged model of IQ and achievement across time ispresented in Fig. 2.
3. Discussion
There has been considerable debate regarding theseparateness of psychometric IQ and academic achieve-ment. Researchers have variously speculated thatcurrent achievement causes future IQ, current IQ causesfuture achievement, and IQ and achievement aremutually influential. In the absence of true experiments,longitudinal designs where both IQ and achievementtests are repeated across time have been recommendedfor estimating the relationship of IQ and achievement.Using structural equation modeling to remove thebiasing effect of measurement error, this current cross-
lagged panel analysis found that the optimal ability–achievement model reflected the causal precedence ofpsychometric IQ on achievement. That is, the pathsfrom IQ at time 1 to IQ and achievement at time 2 weresignificant whereas the paths from achievement at time1 to IQ at time 2 were not significant.
From a theoretical perspective, the construct ofintelligence is expected to precede and influence thedevelopment of academic achievement because “schoollearning itself is g-demanding” (Jensen, 1998, p. 279).Historically, intelligence tests were devised by Binet tomeasure students' ability to succeed in school and thisfundamental characteristic has been empirically sup-ported for more than 100 years (Kamphaus, 2001). Thisnotion of intelligence estimating a student's ability tosucceed in school assumes the temporal precedence ofintelligence to achievement. The concept of causality iscomplex (Kenny, 1979), so terms like influence andprecedence may be preferred. Regardless, the presentstudy supports the view that intelligence, as measured bythe VC and PO dimensions of theWISC-III, influences oris related to future achievement whereas reading andmathachievement do not appear to influence or are not relatedto future psychometric intelligence.
From an applied perspective, researchers have assertedthat, “observed correlations between tests of readingachievement and tests of intelligence may often be anartifact of shared variance contributed by language basedabilities that influence performance on both sets of mea-sures” (Vellutino, Scanlon, & Tanzman, 1998, p. 375).Following this logic, impairments in reading would, overtime, result in deleterious effects on IQ scores, subse-quently making IQ a poor predictor of achievementamong students with learning disabilities (Fletcher,Coulter, Reschly, & Vaughn, 2004; Siegel, 1989). Thatis, “low scores on the IQ tests are a consequence, not acause, of… reading disability” (Siegel, 1998, p. 126). Thisposition was not confirmed by the present results nor bythose ofKline, Graham, and Lachar (1993), who found IQscores to have comparable external validity for students ofvarying reading skill. Nor was such a conceptualizationsupported by the relatively high long-term stability ofWISC-III IQ scores among more than 1000 students withdisabilities (Canivez & Watkins, 2001; Cassidy, 1997).Further, IQ has been a protective factor in several studies.In a longitudinal analysis, Shaywitz et al. (2003) foundthat two groups of impaired readers began school withsimilar reading skills and socioeconomic characteristics,but those students with higher cognitive ability becamesignificantly better readers as young adults. A meta-analysis of intervention research for adolescents with LDdemonstrated that IQ exercised similar protective effects
(Swanson, 2001). An epidemiological analysis of a
67M.W. Watkins et al. / Intelligence 35 (2007) 59–68
representative national sample of 1268 students discoveredthat cognitive abilities afforded significant protection fromlearning disabilities (McDermott, Goldberg,Watkins, Stan-ley, & Glutting, in press). Finally, a New Zealand 25-yearlongitudinal study found strong relationships between IQ atage 7 and 8 and academic achievement at ages 18–25 years, independent of childhood conduct problems aswell as family and social circumstances (Fergusson,Horwood, & Ridder, 2005). In sum, considerable evidencecontradicts the assertion that IQ has no predictive orseminal relationship with academic achievement.
Although avoiding some of the weaknesses ofprevious studies, the results of this investigation must beconsidered within the limits of its design, sample, andmethods. First, participants were all involved in specialeducation. Thus, results cannot be generalized todissimilar students. Second, generalization of resultsmay be limited because these data were not obtained byrandom selection. Third, there was no way to validate theaccuracy of test scores provided by participating schoolpsychologists. Although internal consistency of compos-ite scores was verified during data entry, administration,scoring, or reporting errors could have influenced results.Finally, the use of reevaluation cases means that thosestudents whowere no longer enrolled in special educationwere not reevaluated and thus not part of the sample.
With due consideration of these caveats, the presentstudy provides evidence that psychometric intelligence ispredictive of future achievement whereas achievement isnot predictive of future psychometric intelligence. Thistemporal precedence is consistent with the theoreticalposition of Jensen (2000) that intelligence bears a causalrelationship to achievement and not the other way around.
References
Bentler, P. M. (2002). Title EQS 6 structural equations programmanual. Encino, CA: Multivariate Software, Inc.
Bentler, P. M., &Wu, E. J. C. (2002). EQS 6 for Windows user's guide.Encino, CA: Multivariate Software, Inc.
Brody, N. (1997). Intelligence, schooling, and society. AmericanPsychologist, 52, 1046−1050.
Budd, K. S., Felix, E. D., Poindexter, L. M., Naik-Polan, A. T., &Sloss, C. F. (2002). Clinical assessment of children in childprotection cases: An empirical analysis. Professional Psychology,Research and Practice, 33, 3−12.
Canivez, G. L., & Watkins, M. W. (1998). Long term stability of theWISC-III. Psychological Assessment, 10, 285−291.
Canivez, G. L., & Watkins, M. W. (1999). Long term stability of theWechsler Intelligence Scale for Children-Third Edition amongdemographic subgroups: Gender, race, and age. Journal of Psy-choeducational Assessment, 17, 300−313.
Canivez, G. L., & Watkins, M. W. (2001). Long term stability of theWechsler Intelligence Scale for Children-Third Edition among
students with disabilities. School Psychology Review, 30, 361−376.Cassidy, L.C. (1997). The stability of WISC-III scores: For whom aretriennial re-evaluations necessary? Unpublished doctoral disserta-tion, University of Rhode Island.
Ceci, S. J. (1991). How much does schooling influence generalintelligence and its cognitive components? A reassessment of theevidence. Developmental Psychology, 27, 703−722.
Ceci, S. J., & Williams, W. M. (1997). Schooling, intelligence, andincome. American Psychologist, 52, 1051−1058.
Cook, T. D., &Campbell, D. T. (1979).Quasi-experimentation: Designand analysis issues for field settings. Chicago: Rand McNally.
Crano, W. D., Kenny, D. A., & Campbell, D. T. (1972). Doesintelligence cause achievement?: A cross-lagged panel analysis.Journal of Educational Psychology, 63, 258−275.
Fergusson, D. M., Horwood, L. J., & Ridder, E. M. (2005). Show methe child at seven II: Childhood intelligence and later outcomes inadolescence and young adulthood. Journal of Child Psychologyand Psychiatry, 46, 850−858.
Flanagan, D. P., Andrews, T. J., & Genshaft, J. L. (1997). Thefunctional utility of intelligence tests with special educationpopulations. In D. P. Flanagan, J. L. Genshaft, & P.L. Harrison(Eds.), Contemporary intellectual assessment: Theories, tests, andissues (pp. 457−483). New York: Guilford.
Fletcher, J. M., Coulter, W. A., Reschly, D. J., & Vaughn, S. (2004).Alternative approaches to the definition and identification of learningdisabilities: Some questions and answers. Annals of Dyslexia, 54,304−331.
Fletcher, J. M., Morris, R. D., & Lyon, G. R. (2003). Classification anddefinition of learning disabilities: An integrative perspective. In H.L. Swanson, K. R. Harris & S. Graham (Eds.), Handbook oflearning disabilities (pp. 30−56). New York: Guilford.
Glutting, J.J., Watkins, M.W., Konold, T.R., & McDermott, P.A. (inpress). Distinctions without a difference: The utility of observedversus latent factors from the WISC-IV in estimating reading andmath achievement on the WIAT-II. Journal of Special Education.
Gresham, F. M., & Witt, J. C. (1997). Utility of intelligence tests fortreatment planning, classification, and placement decisions: Recentempirical findings and future directions. School PsychologyQuarterly, 12, 249−267.
Gustafsson, J. -E., & Balke, G. (1993). General and specific abilities aspredictors of school achievement. Multivariate Behavioral Re-search, 28, 407−434.
Hu, L., & Bentler, P. M. (1999). Cutoff criteria for fit indexes incovariance structure analysis: Conventional criteria versus newalternatives. Structural Equation Modeling, 6, 1−55.
Humphreys, L. G. (1991). Causal inferences from observational data:Use a redesigned cross-lagged methodology. Intelligence, 15,151−156.
Jensen, A. R. (1998). The g factor: The science of mental ability.Westport, CT: Praeger.
Jensen, A. R. (2000). The g factor and the design of education. Paperpresented at the annual meeting of the American PsychologicalAssociation, Washington, DC (August).
Judd, C. M., Jessor, R., & Donovan, J. E. (1986). Structural equationmodels and personality research. Journal of Personality, 54, 149−198.
Kamphaus, R. W. (2001). Clinical assessment of child and adolescentintelligence (2nd ed.). Boston: Allyn and Bacon.
Kamphaus, R. W., Petoskey, M. D., & Rowe, E. W. (2000). Currenttrends in psychological testing of children. Professional Psychol-ogy, Research and Practice, 31, 155−164.
Kavale, K. A., &Nye, C. (1985–86). Parameters of learning disabilitiesin achievement, linguistic, neuropsychological, and social/behav-
ioral domains. Journal of Special Education, 19, 443−458.
68 M.W. Watkins et al. / Intelligence 35 (2007) 59–68
Keith, T. Z. (1999). Effects of general and specific abilities on studentachievement: Similarities and differences across ethnic groups.School Psychology Quarterly, 14, 239−262.
Kenny, D. A. (1979). Correlation and causality. New York: Wiley.Kline, R. B. (1998). Principles and practice of structural equation
modeling. New York: The Guilford Press.Kline, R. B., Graham, S. A., & Lachar, D. (1993). Are IQ scores valid
for children who are poor readers? Psychological Assessment, 5,400−407.
Lubinski, D., & Dawis, R. V. (1992). Aptitudes, skills, and proficiencies.InM.D.Dunnette&L.M.Hough (Eds.),Handbook of industrial andorganizational psychology, Vol. 3 (2nd ed.) (pp. 1−59). Palo Alto,CA: Consulting Psychology Press.
McDermott, P.A., Goldberg, M.M., Watkins, M.W., Stanley, J.L., &Glutting, J.J. (in press). A nationwide epidemiologic modelingstudy of learning disabilities: Risk, protection, and unintendedimpact. Journal of Learning Disabilities.
Naglieri, J. A., & Bornstein, B. T. (2003). Intelligence and achieve-ment: Just how correlated are they? Journal of PsychoeducationalAssessment, 21, 244−260.
Oh, H. -J., Glutting, J. J., Watkins, M. W., Youngstrom, E. A., &McDermott, P. A. (2004). Correct interpretation of latent versusobserved abilities: Implications from structural equation modelingapplied to the WISC-III and WIAT linking sample. Journal ofSpecial Education, 38, 159−173.
Onwuegbuzie, A. J., & Daniel, L. G. (2002). Uses and misuses of thecorrelation coefficient. Research in the Schools, 9, 73−90.
Parker, D. R., & Benedict, K. B. (2002). Assessment and intervention:Promoting successful transitions for college students with ADHD.Assessment for Effective Intervention, 27(3), 3−24.
Rogosa, D. (1980). A critique of cross-lagged correlation. Psycholog-ical Bulletin, 88, 245−258.
Satorra, A., & Bentler, P. M. (1994). Corrections to test statistics andstandard errors in covariance structure analysis. In A. von Eye &C.C.Clogg (Eds.), Latent variables analysis: Applications for develop-mental research (pp. 399−419). Thousand Oaks, CA: Sage.
Sattler, J. M. (2001). Assessment of children: Cognitive applications
Shaywitz, S. E., Shaywitz, B. A., Fulbright, R. K., Skudlarski, P.,Mencl, W. E., Constable, R. T., et al. (2003). Neural systems forcompensation and persistence: Young adult outcome of childhoodreading disability. Biological Psychiatry, 54, 25−33.
Siegel, L. S. (1989). IQ is irrelevant to the definition of learningdisabilities. Journal of Learning Disabilities, 22, 469−478.
Siegel, L. S. (1998). The discrepancy formula: Its use and abuse. In B.K. Shapiro, P. J. Accardo, & A.J. Capute (Eds.), Specific readingdisability: A view of the spectrum (pp. 123−135). Timonium, MD:York Press.
Siegel, L. S. (1999). Issues in the definition and diagnosis of learningdisabilities: A perspective on Guckenberger v. Boston University.Journal of Learning Disabilities, 32, 304−319.
Stanovich, K. E. (1986). Matthew effects in reading: Some con-sequences of individual differences in the acquisition of literacy.Reading Research Quarterly, 21, 360−407.
Swanson, H. L. (2001). Research on interventions for adolescents withlearning disabilities: Ameta-analysis of outcomes related to higher-order processing. Elementary School Journal, 101, 331−348.
Vellutino, F. R., Scanlon, D. M., & Tanzman, M. S. (1998). The casefor early intervention in diagnosing specific reading disability.Journal of School Psychology, 36, 367−397.
Watkins, M.W., & Canivez, G. L. (2001). Longitudinal factor structureof the WISC-III among students with disabilities. Psychology inthe Schools, 38, 291−298.
Watkins, M. W., & Kush, J. C. (2002). Confirmatory factor analysis ofthe WISC-III for students with learning disabilities. Journal ofPsychoeducational Assessment, 20, 4−19.
Wechsler, D. (1991). Wechsler Intelligence Scale for Children-ThirdEdition. San Antonio, TX: The Psychological Corporation.
Yen, C. -J., Konold, T. R., & McDermott, P. A. (2004). Does learningbehavior augment cognitive ability as an indicator of academicachievement? Journal of School Psychology, 42, 157−169.
Zimmerman, I. L., & Woo-Sam, J. M. (1997). Review of the criterion-related validity of the WISC-III: The first five years. Perceptualand Motor Skills, 85, 531−546.
(4th ed.). San Diego: Jerome M. Sattler.
Copyright © 2022 FDOKUMEN