The State of Global Learning Poverty: 2022 Update - UNICEF
78
1 The State of Global Learning Poverty: 2022 Update | The State of Global Learning Poverty: 2022 Update In partnership with
-
Upload
khangminh22 -
Category
Documents
-
view
0 -
download
0
Transcript of The State of Global Learning Poverty: 2022 Update - UNICEF

1 The State of Global Learning Poverty: 2022 Update |
The State of Global Learning Poverty: 2022 Update
In partnership with

2 The State of Global Learning Poverty: 2022 Update |
The State of Global Learning Poverty: 2022 Update
CONFERENCE EDITION June 23, 2022

3 The State of Global Learning Poverty: 2022 Update |
Cover photo: © Liderina - stock.adobe.com

4 The State of Global Learning Poverty: 2022 Update |
Acknowledgments
First and foremost, the World Bank, United Nations Educational, Scientific and Cultural Organization
(UNESCO), the United Nations Children’s Fund (UNICEF), the Foreign, Commonwealth, and Development
Office (FCDO), the United States Agency for International Development (USAID), and the Bill & Melinda
Gates Foundation (BMGF) would like to recognize all the ministries of education, teachers, communities,
and families that have worked tirelessly to protect the learning of millions of students during the
pandemic.
This report was prepared by a core team consisting of the following colleagues: João Pedro Azevedo,
Halsey Rogers, Ellinore Ahlgren, Maryam Akmal, Marie-Helene Cloutier, Elaine Ding, Ahmed Raza, and Yi
Ning Wong (World Bank); Silvia Montoya (UIS); Borhene Chakroun, Gwang-Chol Chang, and Sonia
Guerriero (UNESCO Headquarters); Pragya Dewan, Suguru Mizunoya, Nicholas Reuge, Kenneth Russell,
and Haogen Yao (UNICEF Headquarters); Rona Bronwin (FCDO); Joanie Cohen-Mitchell (USAID); and Clio
Dintilhac and Izzy Boggild-Jones (BMGF). The work was carried out under the overall guidance of Mamta
Murthi, Alberto Rodriguez, Jaime Saavedra, and Omar Arias (World Bank); Stefania Giannini (UNESCO);
Robert Jenkins (UNICEF); Alicia Herbert (FCDO); LeAnna Marr (USAID); and Benjamin Piper (BMGF).
The team is extremely grateful to Luis Crouch (RTI International) and to Gabriel Demombynes, Deon
Filmer, Laura Gregory, Alaka Holla, and Yevgeniya Savchenko (World Bank) for serving as peer reviewers.
The team would also like to thank Kevin Carey, Maria Marta Ferreyra, Andrea C. Guedes, Keith E.
Hansen, Auguste Tano Kouame, Martin Raiser, and Seynabou Sakho for their comments and
suggestions.
The invaluable support of the communication and advocacy teams of our institutions—Kristyn Schrader-
King, Karolina Ordon, Stefano De Cupis, David Moore, and Diana Styvanley (World Bank); Cynthia
Guttman (UNESCO); Ann Marie Wilcock, Anja Nielsen, and Georgina Diallo (UNICEF); Kate McGeown
(FCDO); Ashley Massey (USAID); and Izzy Boggild-Jones (BMGF)—is greatly appreciated.
We apologize for any omissions and express our sincerest thanks to everyone, whether named here or
not, who graciously gave their time and expertise.

5 The State of Global Learning Poverty: 2022 Update |
Foreword
The deep pre-COVID learning crisis has been made even more severe by the pandemic. One of the
most intuitive indicators of the learning crisis is the learning poverty rate, which measures the share of
children who cannot read a simple text with comprehension by age 10. Widespread learning poverty
predated the pandemic: this report shows that in 2019, before the pandemic hit, the learning poverty
rate was already estimated at 57 percent in low- and middle-income countries, and that in Sub-Saharan
Africa it was 86 percent. Moreover, global progress against learning poverty had already stalled:
between 2015 and 2019, there was no reduction in global learning poverty. Reading, together with
writing, numeracy, and socioemotional skills, is a building block for all the other education outcomes
that societies care about. The very high level of global Learning Poverty is a signal that many education
systems, despite their progress in the recent decades at improving access to schools, have not delivered
learning. The magnitude of the learning challenge in the developing world is immense, and it is now
even larger than before as a consequence of the pandemic.
Since the onset of COVID-19, the school closures and disruptions caused by the pandemic have likely
driven learning poverty rate much higher still. The 2022 simulations presented in this report that build
on the most up-to-date data and evidence on learning and the impacts of the pandemic suggest global
learning poverty in low- and middle-income countries has surged to an estimated 70 percent. The
increases have been especially large in South Asia and in Latin America and the Caribbean, the regions
where schools have been closed the longest. Because universal foundational skills are essential to the
flourishing of individuals and societies, this widespread learning poverty threatens to undermine the
future of today’s children and the economic prospects of their countries.
Concerted action against learning poverty is urgently needed now, with every society prioritizing the
welfare of today’s children and youth. To safeguard the future, it is essential to make this a turning
point. We need to ensure a sharp acceleration of learning, starting in the short term with a robust
recovery from the COVID shock. There will be nothing automatic about this recovery and acceleration.
Just reopening schools does not heal the scars of the pandemic, let alone solve the problems that
caused such high levels of learning poverty even before COVID. Policymakers, schools, teachers, and
families will need better strategies, bolstered by additional financing and support, to recover and
accelerate learning, especially for those most harmed by the school closures. In most countries, those
most harmed are not only marginalized minorities or the very poor; despite efforts in many countries to
reach students with some type of remote learning, the vast majority have seen their learning process
seriously impacted. The stagnation of global progress since 2015 shows that education systems were
already failing in reducing learning poverty. To provide opportunity for all children, this has to change—
and change will require both political and technical advances that ensure effective approaches for
promoting foundational learning reach all children and youth. This report lays out a menu of policy
options for doing this. It is essential for governments to set clear priorities for tackling learning poverty
and figuring out which approaches work best in their countries.
Fighting this learning crisis is the challenge of our times if we do not want to lose this generation of
children and youth. Investing in their education is a precondition to avoid a future negative shock to
productivity, earnings, and welfare; is essential for social stability, peace, and security; is critical for
building fairer societies and ensuring equality of opportunities for all; and is essential to change

6 The State of Global Learning Poverty: 2022 Update |
mindsets regarding the urgency of climate change. This is a global challenge, and a collective effort is
needed to raise awareness and support national efforts.
A global coalition can support these national efforts, which is why our six organizations are working
together very closely on the agenda of foundational learning. This coalition is advancing on various
fronts. First, we are speaking with one voice on the vital importance of foundational skills to the SDGs.
Learning poverty is one key indicator of this, as it stands in for a broader set of foundational skills that all
children need for further education, employment, and citizenship. At the same time, we are working
closely together on other fronts—closing the learning data gap, building evidence on how to promote
foundational learning for all children, and providing coordinated financial and technical support to
countries that show real commitment to reducing learning poverty. We are confident that countries can
turn the tide on reducing learning poverty, accelerating learning, and building the foundations for more
prosperous and equitable societies.
Jaime Saavedra Stefania Giannini Robert Jenkins Alicia Herbert LeAnna Marr Benjamin Piper
World Bank UNESCO UNICEF FCDO USAID Bill & Melinda Gates Foundation

7 The State of Global Learning Poverty: 2022 Update |
Executive Summary
• Even before COVID-19, the world was facing a learning crisis, with nearly 6 out of every 10 ten-year-olds in low- and middle-income countries suffering from learning poverty—meaning they were unable to read and understand a simple story.
• Now COVID-19 pandemic school closures and disruptions have deepened the crisis, sharply increasing learning poverty and exacerbating the inequalities in education.
• Without urgent action to reduce learning poverty, we face a learning and human capital catastrophe.
• If children do not acquire the basics of literacy—together with numeracy and other foundational skills—the futures of hundreds of millions of children around the world, and their societies, are at grave risk.
• There is a narrow window to act decisively to recover and accelerate learning.
• This will require firm political commitment and implementation of evidence-based approaches for rapid impact.
• The good news is that the core policies that can help recover learning lost to the pandemic will also address the deeper underlying learning crisis that predated COVID-19, accelerating learning and delivering long-term benefits for economies and societies.
Global learning poverty is at crisis levels and continues to worsen in the wake of the worst shock to
education and learning in a century. The learning poverty indicator was launched by the World Bank
and the UNESCO Institute for Statistics in 2019 to spotlight the global learning crisis. High rates of
learning poverty are an early signal that education systems are failing to ensure that children develop
critical foundational skills and thus are far from reaching, and in many cases are not on track to reach,
the SDG 4 target of universal quality education for all by 2030. This makes it much harder for children to
acquire the technical and higher-order skills needed to thrive in increasingly demanding labor markets,
and for countries to develop the human capital needed for sustained, inclusive economic growth.
The learning crisis long predated COVID-19. New data presented in this report confirms that learning
poverty was very high even before the pandemic hit: in 2019, the average global learning poverty rate
in low- and middle-income countries was 57 percent. In other words, nearly 6 out of 10 children were
not acquiring even minimal proficiency in literacy by age 10 before the pandemic hit. And in Sub-
Saharan Africa, 86 percent of children already suffered from learning poverty in 2019.
Even more concerning, progress against learning poverty had already stalled before COVID-19. The
new data shows that between 2015 and 2019, global learning poverty rose further from 53 percent—
the baseline estimate when the learning poverty indicator was launched—to 57 percent. This stagnation
marks a change from the 2000-2015 period, when global learning poverty had fallen from 61 to 53
percent.1
Since then, the pandemic has led to an unprecedented disruption of schooling and learning around
the world. Globally, between February 2020 and February 2022, education systems were fully closed for

8 The State of Global Learning Poverty: 2022 Update |
in-person schooling for about 141 days on average. In South Asia and Latin America and the Caribbean,
children lost on average 273 and 225 full days of school, respectively. As a response to the school
closures, almost all countries implemented different strategies of remote learning. As countries realized
that, due to the lack of connectivity and the existence of a wide digital divide, it was not possible to rely
only on the internet to provide learning materials or any type of interaction between students and
teachers, they relied on TV and radio, which expanded quickly across the globe. However, these efforts
were very heterogenous across regions in terms of strategies, depth of supply, and usage. Evidence is
accumulating that the capacity of these remote learning efforts to substitute for in-person learning is
very low. As a result, in many countries the school closures led to large learning losses. This is true even
in countries with high internet penetration and higher levels of digital skills among the teaching force.
The simulation results based on the latest available data and evidence indicate that the pandemic has
likely caused a sharp increase in global learning poverty, to an estimated 70 percent (Figure 1), and
exacerbated inequalities in education. To assess the potential impact of the pandemic in education we
simulate possible changes in Learning Poverty. The simulation modeling for this report shows that 7 out
of 10 children in low- and middle-income countries could now be suffering from learning poverty. This
means that an additional 1 out of every 8 children in low- and middle-income countries is now in
learning poverty, and that all of the gains in learning poverty that low- and middle-income countries
recorded since 2000 have been lost The increases in learning poverty have likely been largest in South
Asia and in Latin America and the Caribbean, due to the very long school closures in those regions. In
both regions, school closures were long and widespread across the territory, and schools were kept
shuttered even after economies started to gradually open and even after vaccines started to be
available for large segments of the population. In both regions, lack of connectivity for about half of the
population precluded the use of internet for remote learning or to distribute learning material. Use of
TV and radio for remote learning expanded quickly in many countries, but that was not enough to
provide meaningful learning to most students. Only the richer segments of the population—those with
broadband connectivity, access to devices for the use of each family member, a place to study,
availability of books and learning material, and a conducive home environment, among other
conditions—were able to maintain a reasonable level of education engagement. On the other hand, in
Sub-Saharan Africa and in East Asia and the Pacific, with the exception of a few specific countries, school
closures were much shorter. Comparing across income levels, in middle-income countries the likely
increases in learning poverty were generally much larger than in low-income countries. This pattern
stems largely from the longer school closures in middle-income countries and their higher levels of in-
school learning during normal times. In all these countries, the efforts to expand remote learning were
insufficient to compensate for the impacts of school closures.

9 The State of Global Learning Poverty: 2022 Update |
Figure 1. Learning Poverty Globally and by Region—2015 and 2019, with 2022 Simulation Estimates
Note: Numbers for 2022 are simulations. The global figure is for all low- and middle-income countries. Regional and global figures are all
population-weighted averages. For the East Asia and Pacific region, the 2015 and 2019 averages are not directly comparable, due to major
improvements in data quality and availability and new assessments recently available for the two years. This report follows the World Bank
regional classification; for details, please see this page.2
0.0
10.0
20.0
30.0
40.0
50.0
60.0
70.0
80.0
90.0
100.0
2015 2019* 2022**
Learning crisis (Pre-pandemic)
Learning crisis (Simulation)
The simulation model shows that because of the long school closures and the ineffectiveness of
remote learning attempts during the pandemic, 7 out of 10 children in low- and middle-income
countries could now be suffering from learning poverty. That would mean that due to this
shock, an additional 1 out of every 8 children in low- and middle-income countries are now in
learning poverty, and all of the gains in learning poverty that low- and middle-income countries
recorded since 2000 have been lost. But this is a simulation. Learning losses can be reversed if
urgent action is taken.
Europe and Central Asia
Global
South Asia
Latin America and Caribbean
Sub-Saharan Africa
East Asia and Pacific
Middle East and North Africa

10 The State of Global Learning Poverty: 2022 Update |
Recent data available for a few countries corroborates the expectation that learning losses might be
very large. Emerging data that measures actual learning levels of children in reopened school systems
around the world in many cases corroborates the predictions of large learning losses.3 For example, data
available for the State of São Paulo in Brazil (one year after the onset of the pandemic), for the state of
Karnataka in India, and for a few states in Mexico shows learning losses equivalent to the extent of the
school closure—meaning that one year of school closures maps to roughly one year of normal learning
that was not achieved or was forgotten.
The very high levels of learning poverty, both before COVID and now, violate children’s right to
education. After all the hard work by so many families and educators to provide education for all,
manifested in rising enrollments, it is unacceptable that 70 percent of children in low- and middle-
income countries may not be reading with comprehension at even a minimally adequate level.
Moreover, parents are often not aware of how little their children are learning, because of the lack of
effective use of learning assessments. This violates the trust that families have placed in education—
trust that has led to 90 percent enrollment at primary level in the low- and middle-income countries—
and it undermines realizing the high returns that investments in education can deliver to children and
their communities
Coming on top of the widespread pre-COVID learning poverty, the learning losses from the pandemic
could generate a major shock to human capital accumulation and productivity. Lost foundational
learning will translate into lower levels of skills, which in turn will reduce productivity and earnings of
today’s children once they enter the workforce. Research using systematic measures of adult skills
shows that even among those with the same level of schooling, those with better literacy and numeracy
skills earn substantially more.4 Lost foundational learning due to the shock will ultimately translate into
lower levels of adult skills, which in turn will reduce productivity and earnings of today’s children once
they enter the workforce. These human capital impacts from disruptions can have substantial effects on
the affected generation; in Zimbabwe, children whose schooling was reduced by a drought in the 1980s
saw their lifetime earnings fall by 14 percent.5 During the Ebola outbreak, teenage pregnancies
increased in some communities by as much as 65 percent,6 and some girls never returned to the
classroom after schools reopened, due to increased rates of sexual abuse and exploitation, as well as
teenage pregnancies.7
A swift response is essential: not only was learning poverty already high, but the recent learning
losses could be compounded over time, making the cost of inaction especially high. Many education
systems were already unable to ensure learning, and now students are returning to school with even
less of the foundations needed to benefit from instruction. Evidence from past disruptions to education,
such as the 2005 Pakistan earthquake, shows that without recovery measures, learning losses may grow
even more after children return to school, if the curriculum and teaching do not adjust to meet
students’ learning needs.8 As students fall further behind the curriculum, the risk grows that many will
The very high levels of learning poverty, both before COVID and now,
violate children’s right to education.

11 The State of Global Learning Poverty: 2022 Update |
become disengaged and ultimately drop out of school. Even if they remain in school, this dynamic could
lead to a much greater range of learning levels in the classroom, which makes it even more challenging
for teachers to meet the needs of their students. Actions that countries take in the short term—even
over just the next year—could therefore make a big difference for the longer-term learning trajectory of
a generation at risk.
Without action, the current generation of students now risks losing $21 trillion in lifetime earnings in
present value, or the equivalent of 16 percent of today’s global GDP. Relative to current incomes, this
economic cost is disproportionately borne by low- and middle-income countries, in which this
generation of students could lose $11 trillion of lifetime earnings.9 In addition to this intergenerational
inequality shock, evidence is mounting that the shock has worsened inequality within the current
generation of children, as those from lower socioeconomic backgrounds and other disadvantaged
groups have suffered larger learning losses.10 Putting this as annual earnings equivalent, in low- and
middle- income countries, this implies that the average person of the school-age generation might see a
reduction in annual income of $975.
Recovery from this major blow to human capital requires national political commitment at all levels,
from the highest political offices to all members of society. A key first step is for political leaders to
highlight to the public the serious threat that the learning crisis poses, the extent it has worsened due to
disruptions in schooling and learning during the pandemic, and to make solving it a top priority. But
commitment at the top levels of government is not enough. Recovering from this massive shock, and
then turning the tide against the longer-term learning crisis that predated COVID, will also require
broader national coalitions for learning recovery and acceleration—coalitions that include families,
educators, civil society, the business community, and other ministries. And this commitment needs to be
further translated into concrete actions at the national and sub-national levels, with better learning
measurement to end the learning data crisis, clear targets for progress, and evidence-based plans
supported by adequate financing and good implementation. National commitments to education
require that all actors align in the design and implementation of reforms with the sole objective of
improving the education and wellbeing of children and youth—not the positions or interests of political
parties or unions, nor the interest of suppliers, vendors, or providers, or any other education
stakeholders, but only the interest of students.
The good news is that there are policies to recover learning losses in the short term, and that these
policies will also allow countries to accelerate learning and take on the deeper pre-pandemic learning
crisis. The RAPID framework for learning recovery and acceleration (recently formulated by the UNICEF,
What to do in the next few months?
It is not enough for children to return to school. The curriculum and teaching must adjust to
meet students’ learning needs. As students fall further behind the curriculum, the risk grows
that many will become disengaged and ultimately drop out of school. Many countries are
already implementing several of the policies in the RAPID framework, but scaling them up to
all children in all countries is urgently needed.

12 The State of Global Learning Poverty: 2022 Update |
UNESCO, and the World Bank) synthesizes the menu of policy interventions that countries could
consider and adapt to their local context—many of which are already being implemented at the country
level, although in different combinations and with varying reach. These interventions also coincide
substantially with those that were most effective at accelerating learning before COVID, based on
evidence from high-performing education systems and rigorously evaluated programs.11 These are
short-term interventions that must be complemented with many other reforms in teachers’ careers and
incentives, curriculum, instructional methods, safety, infrastructure, and management, among others, in
order to sustain acceleration. RAPID focuses on what countries must do—and what many already
doing—during the next few years. The five elements of RAPID are:
• Reach every child and keep them in school: As schools reopen, it is crucial to monitor children’s
enrollment, attendance, and grade progression; understand why some children have not returned
to school; and support them to return and to stay in school. Back-to-school campaigns, family
outreach and early warning systems can help keep children in school, as can removing school
fees, as well as introducing or expanding cash transfers and school feeding programs.
• Assess learning levels regularly: Measuring children’s current learning levels after their return to
school is essential, to help teachers target instruction in the classroom to each child’s starting
point. This requires providing teachers with formative assessment tools that they can easily apply
in the classroom. Regular system assessments of learning are also needed to guide system-level
decisions on how to continue to reduce to learning poverty and dropout..
• Prioritize teaching the fundamentals: Learning recovery efforts should focus on essential missed
content and prioritize the most foundational skills and knowledge, particularly literacy and
numeracy, that students need for learning within and across subjects and for more advanced
learning in the future. This focus is especially important, given the dense and overreaching
curricula implemented in many countries, and it is essential to free teachers from the excessive
burden of having to cover too much material. Learning recovery programs should also help
teachers to improve their teaching of foundational skills, notably through specific and practical
training and teacher guides connected to well-designed student textbooks. Pre-COVID evidence
from countries like Brazil and Kenya showed that a greater focus on foundational learning, with
practical tools to support it, is central to successful learning acceleration as well.
• Increase the efficiency of instruction, including through catch-up learning: To recover missed
learning, school systems need to adopt effective teaching practices that support teachers in their
immediate classroom challenges, as they are receiving children with larger and more varied
learning deficits. These practices include learner-focused recovery strategies such as structured
pedagogy programs, instruction targeted to students’ current learning levels, individualized self-
learning programs, tutoring, and catch-up programs for out-of-school children. In tandem with
these strategies, extending instructional time by modifying the academic year or offering summer
school can further accelerate learning recovery. Several of these interventions, too, were
identified as cost-effective approaches to learning acceleration before COVID.12

13 The State of Global Learning Poverty: 2022 Update |
• Develop psychosocial health and well-being: The pandemic has harmed the mental health and
psycho-social wellbeing of both learners and teachers, compounding risks for those who are
already marginalized. It is crucial to ensure that schools are safe and that children are healthy and
protected from violence and can access basic services—such as nutrition, counselling, water,
sanitation, and hygiene services. Promoting children’s welfare is inherently of great value, and it
also has the benefit of promoting learning: children learn best when they experience joy and a
sense of belonging at school.13
To lead to broad, sustained acceleration of learning, these short-term interventions must be
implemented at scale, and this implementation must be part of a national strategy of structural
reforms over the longer term. Some countries are adopting some of these interventions for learning
recovery—but to avoid huge losses to productivity and inclusion of today’s children, this now needs to
happen much more widely, and it needs to serve as the basis for learning acceleration. While the
interventions can make a substantial difference in the short run even where policy frameworks are
weaker, sustained progress will depend on reforms like ensuring a professionalized teaching career and
ongoing teacher support, providing well-designed textbooks and teaching and learning materials for all,
closing the digital divide, ensuring that schools are safe and inclusive, and investing in managing schools
and the system in a professional way that focuses relentlessly on improving education outcomes.
With the urgent implementation of these policies, it is possible to recover and accelerate learning and
to build more effective, equitable, and resilient education systems. This is what is needed to increase
learning by as much as possible by 2030—and continue that work beyond 2030—and to ensure that all
children and youth have the opportunity to shape the future they deserve.
A key step for political leaders is to highlight for the public the serious threat that the
learning crisis poses and the extent it has worsened due to disruptions in schooling and
learning during the pandemic, and to make solving it a top priority.

14 The State of Global Learning Poverty: 2022 Update |
Contents
Acknowledgments .......................................................................................................................................... 4
Foreword ........................................................................................................................................................ 5
Executive Summary ........................................................................................................................................ 7
Contents ....................................................................................................................................................... 14
Introduction.................................................................................................................................................. 15
Part I: Learning Poverty, pre- and post-COVID .............................................................................................. 18
Learning poverty: What it is and why it matters ........................................................................................ 19
Learning poverty was already very high and not improving before COVID-19 ............................................ 22
The crisis within a crisis: COVID-19 has now made the challenge even greater .......................................... 26
Countries have set very ambitious targets for reducing learning poverty ................................................... 32
Part II: Ending learning poverty: commitment, recovery, and acceleration, guided by better data .............. 35
The first step toward learning recovery and acceleration: Political commitment ....................................... 38
The short-term agenda: Recovering and accelerating learning with the RAPID framework ........................ 40
The longer-term agenda: Sustaining learning acceleration beyond the recovery period ............................. 47
Spotlight: Deep dive on data and measures for fighting learning poverty .................................................... 49
Better data and indicators are crucial for accelerating the fight against learning poverty........................... 49
Better data is needed to fight learning poverty.......................................................................................... 50
Better indicators are needed to fight learning poverty .............................................................................. 52
International coalitions for learning can support and be supported by better data and indicators ............. 54
Conclusion: the urgency for learning recovery and acceleration .................................................................. 55
References .................................................................................................................................................... 57
Annexes ........................................................................................................................................................ 62
Annex 1: List of new international and regional assessments used in the learning poverty update ............ 62
Annex 2: COVID-19 Learning Loss Simulation Analytical Framework .......................................................... 62
Annex 3: Key simulation assumptions ........................................................................................................ 63
Annex 4: Learning poverty by region and income level (2015 and 2019) and simulation results (2022) ...... 66
Annex 5: Detailed 2019 country learning poverty data .............................................................................. 66
Annex 6: Change in learning poverty gap by region and income level ........................................................ 72
Annex 7: Change in learning poverty severity by region and income level .................................................. 72
Annex 8: Global economic cost by region and income level ....................................................................... 73
Annex 9: Per-student average earnings loss (annual) by region and income level ...................................... 73
Annex 10: Per-student average earnings loss (lifetime) by region and income level ................................... 74
Annex 11: Earnings loss as share of average earnings (annual) by region and income level ........................ 74
Endnotes....................................................................................................................................................... 75

15 The State of Global Learning Poverty: 2022 Update |
Introduction
”A world where every child could read is definitely a goal worth pursuing.”
Ayomide Olawale
19-year-old student, Nigeria
All children should be able to read with comprehension by age 10. Reading is a gateway for learning as
the child progresses through school—and conversely, an inability to read slams that gate shut. Beyond
this, when children cannot read, it is usually a clear indication that school systems aren’t well organized
to help children learn in other areas such as math, science, and the humanities. And although it is
possible to learn later in life with enough effort, children who don’t read by age 10—or at the latest, by
the end of primary school—usually fail to master reading later in their schooling career.14
Even before COVID-19, it had become clear that many children around the world were not learning to
read proficiently. While most children were in school, a majority were not acquiring foundational skills.
Moreover, even before the pandemic-driven school disruptions, nearly 260 million children and youth
were not in school.15
This is the leading edge of a learning crisis that threatens countries’ efforts to build human capital and
shared prosperity, and achieve the Sustainable Development Goals (SDGs). Without foundational
learning, students often fail to thrive later in school or when they join the workforce. They don’t acquire
the human capital they need to power their careers and economies once they leave school, or the skills
that will help them become engaged citizens and nurture healthy, prosperous families. When young
people lack these skills, it threatens equity and stability of a nation. And as a major contributor
to human capital deficits, the learning crisis undermines sustainable green growth, poverty reduction,
and shared prosperity at a global and national level. The impacts of schooling and learning on growth
can be very large: Recent research estimates that three-quarters of differences in long-term growth
across countries can be explained by differences in levels of learning of the population.16
To acutely spotlight the learning crisis, in October 2019 the World Bank and the UNESCO Institute for
Statistics launched the concept and indicator of learning poverty,17 drawing on new data produced in
the context of SDG 4. Learning poverty means being unable to read and understand a simple text by age
10. This indicator brings together schooling and learning indicators: it begins with the share of children
who haven’t achieved minimum reading proficiency (as measured in schools) and is adjusted by the
proportion of children who are out of school (and are assumed not able to read proficiently).
This report provides the first update of the global and regional learning poverty numbers, and it
reaffirms that even before COVID, learning poverty was very high and progress in reducing it had
stalled. The average global learning poverty rate was 57 percent in low- and middle-income countries in
2019, with the rate reaching 86 percent in Sub-Saharan Africa. Even more concerning, after significant
global progress in reducing learning poverty between 2000 and 2015, progress had stalled between
2015 and 2019.

16 The State of Global Learning Poverty: 2022 Update |
Since then, COVID has likely sharply increased learning poverty: simulations of the impacts of the
COVID-driven school disruptions and ensuing economic shocks clearly point to an amplification of the
severe pre-pandemic learning crisis. Our best estimate is that the global learning poverty rate may now
have reached 70 percent, with especially large increases in South Asia and in Latin American and the
Caribbean, the regions where schools have been closed the longest. Action is urgently needed now—
business as usual is not sufficient to heal the scars of the pandemic, and it will certainly not accelerate
progress enough to meet the ambitions of SDG 4.
This report adds to other recent evidence presented on the impacts of the pandemic. With Mission:
Recovering Education, UNESCO, UNICEF, and the World Bank joined forces in early 2021 to provide
guidance and support to countries navigating the crisis. Several joint public goods have been produced
aligning messages, surveys, and protocols to help countries respond to the dramatic consequences of
COVID on this generation of students. In December 2021, the World Bank, UNESCO, and UNICEF warned
in The State of the Global Education Crisis that the pandemic was leading to unprecedented losses in the
human capital of the current generation of students, and that governments had to act quickly to reverse
the damage. Then in March 2022, the Where Are We in Learning Recovery? report (UNICEF, UNESCO,
and the World Bank) laid out a strategy, the RAPID framework, that could help countries guide the
learning recovery. This report reinforces those messages with the first update of the global and regional
learning poverty rates, together with updated simulations showing a substantial surge in learning
poverty since the pandemic. It also lays out an agenda for action, built around political commitment and
interventions to recover and accelerate learning. This report expands the partnership of co-signers to
include other major actors in international education and development—UK’s FCDO, USAID, and the Bill
& Melinda Gates Foundation. By aligning around a unified message on the importance of recovering and
accelerating foundational learning, the co-signing organizations seek to highlight the need for countries
to act urgently and decisively. Finally, this report is accompanied by a companion Guide for Learning
Recovery and Acceleration, also co-signed by all six institutions, that provides detailed guidance and
concrete country examples on interventions for learning recovery and acceleration.
Rapid learning recovery is indeed possible. There are resources and concrete actions—summarized in
the RAPID framework—available for every education system to help their children recover lost
learning, and to use the recovery to reduce learning poverty and accelerate long-term progress. The 5-
part RAPID framework captures essential policy actions of a learning recovery and acceleration program,
and its acronym conveys a sense of the urgency required to meet the challenges brought by this global
shock to education—and by the pre-COVID learning crisis. Recovery and acceleration require improving
instruction at scale, for all children, by making sure that education systems: (i) Reach every child and
keep them in school; (ii) Assess learning levels regularly; (iii) Prioritize the fundamentals; (iv) Increase
the efficiency of instruction, including through catch-up learning; and (v) Develop the psychosocial
health and well-being of children and teachers. A robust learning recovery program built around these
approaches, sustained over time, can serve as a springboard for also tackling the pre-pandemic learning
crisis and giving all children the opportunity to achieve the future they deserve.
This report expands on each of these key points. Part I presents the latest data on global and regional
learning poverty rates, both just before COVID hit and today, to map out the scale of the global learning
crisis. Part II summarizes how countries can recover and accelerate learning with political commitment
and an evidence-based RAPID-informed strategy. Finally, taking a deeper look at the learning poverty
data, the report argues that behind the learning crisis there is a learning data gap. Without timely data,

17 The State of Global Learning Poverty: 2022 Update |
it is impossible to get an accurate understanding of the magnitude of the challenge and institute
effective policies to accelerate the fight against learning poverty. The report therefore includes a
Spotlight deep dive into the data and indicators needed to inform the fight against learning poverty,
and more broadly to monitor whether countries are on track to meet their broader education and
learning goals.
18 The State of Global Learning Poverty: 2022 Update |
Part I: Learning Poverty, pre- and post-COVID
"When I was at the age of 12, I was unable to read and write nor spell my own name, and because
of this, communication became harder by the day… No one should have to experience the same
shame and embarrassment I constantly felt as a child due to my incapacity/incapability to read
and write well. If I became the minister of education in my country, I would see to it that every
child by the age of 10 is able to read and write well."
Grace Erika Meki Jumah
16-year-old student, Malawi
• Even before COVID-19, the world was facing a learning crisis, with nearly 6 of every 10 children in low- and middle-income countries suffering from learning poverty—meaning they were unable to read and understand a simple text.
• Pandemic-driven school closures have deepened the crisis, sharply increasing learning poverty to an estimated 70 percent and exacerbating the inequalities in education.
• Without urgent action to reduce learning poverty, we face a learning catastrophe.
COVID-19 has caused unprecedented disruptions to schooling. At the peak of the COVID-related school
closures, 1.6 billion children in 188 countries were impacted. Globally, between February 2020 and
February 2022, education systems were fully closed for in-person schooling for about 141 days on
average. While some countries quickly reopened schools, the closures were especially long in South Asia
(273 days on average), Latin America and the Caribbean (225 days), and the Middle East and North
Africa (183 days).
While recent data on academic learning, school participation, socioemotional wellbeing, and
enrollment remains patchy, evidence is mounting from many countries that these closures
substantially reduced learning and increased learning inequality around the world. In many
countries—and especially in low- and middle-income countries—data from new measurements of
student learning is confirming that remote learning was largely ineffective and a poor substitute for in-
person schooling.18 Most countries did not have well-designed remote learning systems at scale set up
before the pandemic, and despite great efforts and investments, the systems hastily constructed as
school closed did not have the necessary reach or quality. Moreover, the closures led to or exacerbated
deep inequalities in learning outcomes, along dimensions of geography, gender, age/grade,
socioeconomic status, ability, and more. For example, there is evidence that the decline in learning
resulting from limiting the school experience to only remote schooling, is likely greater for younger
children, who benefit most from quality in-person interactions, and whose families are less likely to
prioritize their learning during school closures. There is also evidence that widespread school closures
have disproportionally affected students from disadvantaged backgrounds, who are less likely than their
peers to have the necessary connectivity, books, instructional material, and physical space to work and
study at home and to be strongly supported to learn at home.19

19 The State of Global Learning Poverty: 2022 Update |
This section provides an update on one important global indicator for measuring the learning losses
due to the pandemic: the rate of learning poverty. The learning poverty rate is a signal of how far a
system is from reaching the SDG 4 target of universal quality education for all by 2030. The new
evidence on learning poverty reveals both the pre-pandemic learning crisis in basic education and the
damage done by the pandemic.
Learning poverty: What it is and why it matters
Children have a human right to quality education, and foundational skills are essential to fulfilling that
right. SDG 4 commits all signatories to ensure that, by 2030, “all girls and boys complete free, equitable
and quality primary and secondary education.” At the primary level, this means that every child should
both complete primary school and achieve at least minimum proficiency in reading and numeracy (and
other skills). Moreover, foundational skills power individual careers as well as the social and economic
prosperity of nations. Reducing learning poverty, and improving all educational outcomes in general, is
central to improving health, peace, security and stability, equality of opportunity, and the mindsets
change needed to address the climate change challenges at a local and global level.
The learning poverty rate measures the proportion of children who are unable to read a simple text
with comprehension by age 10. Launched in 2019 by the World Bank and the UNESCO Institute for
Statistics, the learning poverty rate is calculated by combining the share of primary-age children who are
out of school with the share who are in school but have not achieved this minimum proficiency in
reading by the end of primary. In other words, it captures both schooling and learning, and it is aligned
with the SDG 4 indicators measuring whether all primary-age children are in school (SDG 4.1.4) and
acquiring meaningful skills by the end of primary (SDG 4.1.1b). Box 1 gives more detail on how learning
poverty and other related indicators are calculated.
Of course, learning how to read is only an early milestone, albeit an important one, for a good quality
education. The pandemic has shown the role of schools as a central part of the social fabric of society,
providing children with knowledge and cognitive skills, socioemotional skills, and executive function
development. Schools provide children an opportunity to learn subjects as diverse as mathematics,
science, arts, and citizenship and to develop socioemotional skills and physical and mental health, and
so much more.
Why does reading with comprehension matter?
Learning Poverty serves as a useful early signal of risks to broader education quality.
• Reading is such a foundational skill for higher levels of learning and for most of the
educational outcomes that societies care about.
• Systems that ensure that all children learn to read tend to do well in promoting other
domains of learning too—so high learning poverty signals other weaknesses.
• The Learning Poverty rate measures what share of all children are not able to read with
comprehension, including both those who are in school and not learning and those who are
not even in school. It therefore indicates the society’s failure to give children the
fundamental skills they need for life.

20 The State of Global Learning Poverty: 2022 Update |
Yet learning poverty can be a useful early warning measure of how deep the learning crisis was before
the pandemic, and of how the pandemic has deepened this crisis. Some of the main reasons that
learning poverty serves as a useful early signal of broader education quality are: first, reading is such a
foundational skill for other subjects and for higher levels of learning; second, systems that ensure that
all children learn to read tend to do well in promoting other domains of learning too; and third, the
learning poverty rate combines schooling and learning in a single easy-to-understand indicator. For all
these reasons, this report focuses on learning poverty, but always as a stand-in for the deeper learning
and schooling crisis.

21 The State of Global Learning Poverty: 2022 Update |
Box 1. Learning poverty and related concepts explained
Learning poverty means being unable to read and understand a simple text by age 10. The indicator combines the share of primary-aged children out of school, who are defined as schooling-deprived (SD), and the share of pupils below a minimum proficiency in reading, who are defined as learning-deprived (LD).
Learning poverty = Schooling deprivation + [(1- Schooling deprivation) x Learning deprivation] Learning deprivation is defined as the share of children at the end of primary who read below the minimum proficiency level, as defined by the Global Alliance to Monitor Learning (GAML) in the context of the SDG 4.1.1b monitoring for reading. This is calculated for those children who are attending school.
Schooling deprivation is defined as the share of primary-aged children who are out of school. All out-of-school children are assumed to be below the minimum proficiency level in reading. This dimension is linked to SDG 4.1.4 (the out-of-school rate).
This figure shows a hypothetical example of how learning poverty is calculated using data on learning deprivation and schooling deprivation.
Figure 2. How Learning Poverty is Calculated
Beyond learning poverty and its constituent indicators, there are two other learning indicators that measure the learning status of children who are below the minimum proficiency level in reading:
Learning poverty gap captures the average distance of a learning-deprived child to the minimum proficiency level and indicates the average increase in learning required to eliminate learning poverty. It helps capture the average learning shortfall among children under the minimum proficiency level.
Learning poverty severity captures the inequality of learning among the learning-poor population. The severity measure can distinguish between an increase in the learning gap driven by students near the threshold and one driven by those at the very bottom of the learning distribution.
For more information, see Azevedo (2020) and Azevedo et al (2021).

22 The State of Global Learning Poverty: 2022 Update |
This next section presents new estimates of learning poverty in 2019, just before COVID-19 hit, and
compares them with comparable estimates from 2015, and then discusses simulations of how much
learning poverty is likely to have increased during the pandemic. These new statistics on the state of
learning poverty are meant to inspire and guide country policy responses, which will be discussed in Part
II of the report.
Learning poverty was already very high and not improving before COVID-19
When the UNESCO Institute for Statistics and the World Bank first launched the learning poverty
measure in 2019, the global 2015 estimate was 53 percent.20 In other words, over half of all 10-year-old
children in low- and middle-income countries had not acquired even the minimum reading skills
necessary for all subsequent learning. In fact, the situation is even worse than this indicates. While the
concept aims to capture learning of 10-year-olds, due to shortcomings in available data, many of the
children covered by the data were not tested until at least age 12—yet they had not yet acquired
foundational reading skills even at that point.
New data presented in this report show that in 2019, the global learning poverty rate was even higher
than previously thought: 57 percent of children in low- and middle-income countries were living in
learning poverty. Since the original learning poverty estimates were produced three years ago, new
internationally comparable assessments of student learning have been carried out in several regions—
Latin America and Caribbean, East Asia, and Sub-Saharan Africa. This new data thus gives us a more
recent global and regional picture of the learning crisis on the eve of the pandemic, and also one with
somewhat better country coverage. Out of 144 low- and middle-income countries, we now have data
within the Learning Poverty reporting window for 69 countries and for approximately 81 percent of the
relevant school-age population, compared with 62 countries and a population coverage of 80 percent in
the original report. The number of reporting countries has increased in all regions except in the Middle
East and North Africa and in South Asia, where the number remained constant.
Children in Sub-Saharan Africa suffered from the worst learning poverty by far even before the
pandemic, but learning poverty was very high in other regions too. In 2019, the learning poverty rate
was 86 percent in Africa and above 50 percent in three other regions—the Middle East and North Africa
(63 percent), South Asia (60 percent), and Latin America and the Caribbean (52 percent) (Figure 3a).
Disturbingly, progress against learning poverty had stalled even before COVID-19. There had been
improvement before 2015, as global learning poverty fell from 61 to 53 percent between 2000 and
2015.21 Against this backdrop, the increase in learning poverty between 2015 and 2019, from 53 to 57
percent, is especially concerning. While there are issues with precise comparability because of improved
measurement, including better learning assessments (as explained in Box 2), it is clear that there was no
progress at the global level during this period. For the two regions—Sub-Saharan Africa and Latin
American and the Caribbean—that repeated earlier regional assessments in 2019, the results showed
little or no improvement, as Figure 3a shows.22 The increase in the global learning poverty rate is also
driven partially by continuing demographic shifts, such as Sub-Saharan Africa’s increasing share of the
world’s school-age children. While some countries in the region, such as Kenya and South Africa, have
had programs that succeeded in improving literacy at significant scale, Sub-Saharan Africa remains the

23 The State of Global Learning Poverty: 2022 Update |
region with the highest learning poverty, and population growth in the region has contributed to driving
up the global learning poverty rate.
Box 2: What is behind the new (higher) estimates of pre-COVID global learning poverty?
There are three factors underlying the higher estimate of global learning poverty in 2019 (compared
with 2015): changes driven by better measurement using new data sources, actual changes captured by
updated learning or schooling deprivation measures, and demographic shifts.
• The first factor is changes due to better measurement using new data sources. Improvements in
learning measurement occurred mainly in East Asia and the Pacific. When the learning poverty
measure was first calculated, most countries in the region relied on learning estimates from their
National Learning Assessments. Since then, SEAMEO and UNICEF have released the results for the
first round of the Southeast Asia Primary Learning Metrics (SEA-PLM), which offers far greater
comparability with the proficiency standards determined by the Global Proficiency Framework.
This improvement in measurement led to higher rates of learning poverty in the East Asia and the
Pacific region in 2019. While it is not possible to pinpoint exactly how learning poverty changed in
the region, it is clear that the rate is higher than previously estimated. In addition, the 2019
estimates incorporate improved measures of enrollment in 41 countries where learning
deprivation estimates have not changed. While the net effect of those revisions on the global and
regional aggregates is negligible in most cases, in South Asia they result in an increase in the
regional learning poverty estimate from 58 to 60 percent.
• The second factor is actual increases as captured by consistent movements in the components of
the learning poverty indicator—that is, changes in either learning or schooling deprivation. For the
most part, the lack of progress in learning poverty between 2015 and 2019 can be ascertained
most clearly by observing changes captured by the temporally comparable learning assessments
in Latin America and the Caribbean and Sub-Saharan Africa (LLECE and PASEC, respectively). Both
assessment programs show virtually no improvement in the respective region during this period.
• The third factor contributing to the 2015-2019 changes is the demographic shifts in the relevant
school-age populations. Most notably, the population weight of Sub-Saharan Africa, a region with
extremely high learning poverty, increased over this period.
While better measurement is behind the higher estimates of global learning poverty, we can safely
conclude that global progress against learning poverty stalled during the period just before the
pandemic. A simple decomposition suggests that changes associated to better measurement (new sources
of data) account for about 50 percent of the overall observed change in the global learning poverty rate
between 2015 and 2019, from 53 to 57 percent, while actual changes and demographic shifts account for
the remaining 50 percent. Thus, while better measurement is behind part of the higher global learning
poverty rate, it is clear that there has not been global progress against learning poverty in the years before
COVID-19 hit. In any case, we now also have a better measure of the deep pre-COVID learning crisis than
we did before. With consistent effort to keep improving data availability and quality (as the Spotlight
section of this report emphasizes), it will be possible to track learning poverty trends consistently in more
and more countries.

24 The State of Global Learning Poverty: 2022 Update |
Figure 3 Learning Poverty (Pre-Pandemic)
(a) By Region (Low- and Middle-Income
countries only)
(b) By Income group (including High-Income
countries)
Note: The global figure (a) is for low- and middle-income countries. Regional and global figures are all population-weighted averages. For the
East Asia and Pacific region and Lower-middle-income countries, the 2015 and 2019 averages are not directly comparable, due to major changes
in the country composition and assessments used for the two years. This report follows the World Bank regional classification; for details, please
see this page.23
21
35
13
10
5152
63 63
5860
87 86
53
57
0
10
20
30
40
50
60
70
80
90
100
2015 2019*
98
3029
56
60
90 91
0
10
20
30
40
50
60
70
80
90
100
2015 2019*
Europe and Central Asia
Global (LICs+MICs)
South Asia
Latin America and Caribbean
Sub-Saharan Africa
East Asia and Pacific
Middle East and North Africa
Low-income
Lower-middle-income
Upper-middle-income
High-income

25 The State of Global Learning Poverty: 2022 Update |
Results by income groups show extremely high and persistent learning poverty rates among low-
income countries. The learning poverty estimates for 2019 show that 9 out of 10 children in low-income
countries remained in learning poverty (Figure 3b). Results for lower-middle income countries also show
a significant increase; however, this is mostly driven by the relatively high population weight of East Asia
and the Pacific lower-middle-income countries, which saw improvements in learning data, as discussed
in Box 2.
Beyond the high levels of learning poverty, the high levels of inequality in learning are a serious
concern. High levels of learning inequality can reflect the inequality of opportunities in the access to
good quality of education. High learning inequality has implications for the effectiveness of instruction in
the classroom, as it impacts how teachers teach to students of varying learning levels in their
classrooms. It requires teachers to further adapt instruction to meet students’ learning levels to prevent
low-performing students from falling further behind. There is emerging evidence that even before
COVID, learning inequality was on the rise in regions such as Latin America and the Caribbean (Box 3).
The pre-COVID changes in learning poverty make it very clear that just returning to business as usual after school reopening cannot be the goal of education systems in low and middle-income countries. Even before the pandemic, education systems were in a deep crisis of low learning and substantial learning inequality. To safeguard the future of children and their societies as a whole, education systems must therefore not only recover lost learning, but also continue to accelerate learning to end the learning crisis.

26 The State of Global Learning Poverty: 2022 Update |
The crisis within a crisis: COVID-19 has now made the challenge even greater
How much has COVID-19 worsened the learning poverty problem globally? The update of the learning
poverty data can give us only a pre-COVID baseline because no learning data is yet available from
internationally comparable learning assessments carried out since the start of the pandemic.24 To allow
targeting of resources and measurement of progress, improving the availability of learning data needs to
be a priority going forward, as discussed below. For now, it is important to gauge the likely magnitude of
the pandemic’s impacts through simulations. The results from those simulations are deeply concerning.
Box 3. Learning inequality was on the rise even before COVID-19: Evidence from Latin America and the Caribbean and implications for instruction
Beyond high overall levels of learning poverty in Latin American and the Caribbean, learning inequality was increasing in the region prior to the pandemic. The Regional Comparative and Explanatory Study (ERCE) assessment results shown in Figure 4 below illustrate that learning inequality was on the rise in the region prior to the pandemic. Between 2013 and 2019, learning inequality in math and reading for students in grade 6 increased in all countries in the region. On average, learning inequality increased by 38 percent in math and 49 percent in reading. The countries with the largest increases in inequality during the period were the Dominican Republic, where learning inequality increased by 61 percent for math and 76 percent for reading, followed by Guatemala, with 45 percent for math and 67 percent for reading.
Figure 4. Increase in learning inequality between 2013 and 2019 for grade 6, by country and subject
Note: Changes in inequality are measured using changes in the Gini index of the distribution of test scores in each year. Source: Own calculations based on the Global Learning Assessment Database (GLAD).
There is evidence that school closures during the COVID-19 crisis may have further increased learning inequality in Latin America and the Caribbean and beyond. Students in hard-to-reach areas, students with disabilities, and socio-economically disadvantaged students often had limited access to effective remote learning. For example, research indicates that socio-economically disadvantaged students were disproportionately affected by learning losses during the pandemic compared to their peers, as seen in the United States, the Netherlands, Pakistan, and Mexico, among other countries. The increase in inequality of learning has implications for the effectiveness of instruction in the classroom. The increase exacerbates a pre-pandemic problem in education: how teachers instruct students of varying learning levels at the same time. Higher learning inequality among students means teachers must cater to a larger spread of learning levels within their classrooms. When teachers do not adjust to students’ learning levels, their instruction becomes less effective and poor educational outcomes persist, as students are left behind. Sources: Muralidharan, Singh, and Ganimian 2019; UNICEF, UNESCO, and World Bank 2021
0%
20%
40%
60%
80%
PER MEX CRI ARG NIC PAN PRY URY ECU BRA HND COL GTM DOM
Maths Reading

27 The State of Global Learning Poverty: 2022 Update |
Figure 5. Share of the student population by national school closure status according to UNESCO school monitoring calendar by region
Source: UNESCO School Closure Calendar as of June 2022.

28 The State of Global Learning Poverty: 2022 Update |
The learning poverty simulations estimate how COVID-driven school closures have affected learning
poverty and what the global learning poverty rate is in 2022. To this end, we build on the most recent
pre-pandemic learning data, using evidence on the expected learning gain, data on the length of school
closures, and the impacts of shocks on school dropouts, among other relevant data (see Annex 2 for a
summary of the simulation conceptual model and Annex 3 for definitions and main assumptions and
parameters used in the simulations).25 The use of scenario-based simulations is not new, but it gained
prominence during the pandemic as a tool to help governments assess the potential consequences of a
shock of unprecedent magnitude. The main parameters of the simulation model are the following:
• Learning gains normally achieved during a regular school year before COVID. The higher the rates
of expected learning gains observed when schools are open, the higher the learning losses when
schools close. These expected learning gains vary across country income levels and remain
constant across scenarios (see Annex 3).
• Income shocks’ impact on enrollments. Simulations also partially capture the (much smaller)
potential cumulative effects of household income shocks over the past two years on student
school enrollment in primary education. This effect is negligible because evidence from both
before and during COVID shows that at the primary-school level, income shocks typically have
small effects on enrollment.26 This component varies across countries based on country-specific
enrollment-income elasticities and growth projections and remains constant across scenarios.
• Observed duration of school closures, which ranged from a few weeks in some countries to
nearly two years in others. We incorporate the latest country-specific school closure data, which
covers two full years of schooling during COVID, from February 2020 to February 2022. As Figure
5 shows, there are significant differences in the school-opening policies of governments around
the world. This component varies across countries and remains constant across scenarios.
• Partial closure estimates, the share of students in a school system who are assumed to be
affected by partial closures. Partial closures can be by geographic location or by certain grades or
can cover all students if a hybrid model is adopted. Very few countries have been able to monitor
the share of their system partially closed. This parameter varies across scenarios.
• Effectiveness of mitigation strategies during school closures, the country’s ability to ensure
some learning continuity while schools were closed; this parameter varies by country’s income
level and across scenarios (see below).
Evidence so far on the last of these factors indicates that mitigation strategies, and remote learning in
particular, were typically not effective. The simulations therefore assume that during school closures,
children in low- and middle-income countries learned on average only 5 to 20 percent of what they
usually learn while schools were open. While some governments were able to respond swiftly to school
closures by providing a variety of effective remote learning modalities, many were not. Most notably, 40
percent of countries in Sub-Saharan Africa did not provide any remote learning strategy despite full or
partial school closures of about one year.27 Even in countries that did provide remote learning solutions,
provision of remote learning did not always result in take-up by students. Surveys of schools28 and
households reveal that many children, especially in low-income countries, were not able to engage in
remote learning at all.29 Some countries experienced a “remote learning paradox” where the chosen
remote learning approach was not suitable to the needs of the majority of the students, contributing to
uneven take-up. 30 According to a survey of education ministries by UNESCO, UNICEF, World Bank and
OECD (2021), over a third of low- and lower-middle income countries that provided lessons through

29 The State of Global Learning Poverty: 2022 Update |
radio or TV reported that less than half of primary school students were reached by radio or TV.31 Even
students who were able to receive some distance education often spent much less time learning than if
they would have during in-person instruction, and they were exposed to pedagogies and curricula that
had been hurriedly adapted to remote learning. Moreover, teachers often did not receive adequate
training in remote instruction and digital skills.32 In several countries in Sub-Saharan Africa, fewer than 1
in 5 primary school students maintained contact with their teacher during school closures.33 Finally, as
discussed below, data from actual measurement of learning losses support the assumption that
mitigation was not effective: newly collected data on learning levels emerging from some low- and
middle-income countries shows major learning losses across a range of contexts.34
For purposes of illustration, we focus our discussion based on outcomes from the intermediate
scenario. The results in terms of global and regional learning poverty levels do not vary dramatically
across the scenarios (Annex 4). Our preference for the intermediate scenario in the narrative builds on
our understanding of the evidence to date, which suggests that: the mitigation strategies put in place
have largely been ineffective (as discussed above); and many countries with educational systems that
reported partial closures (on average for the last two years) were largely fully closed. The parameter
choices under the intermediate scenario reflect that evidence. As more and better data becomes
available, we will be able to continuously improve these estimates.
According to the latest simulations,35 the global learning poverty rate among low and middle-income
countries is expected to have risen to 70 percent, based on data up to February 2022. This is a massive
increase from the 57 percent rate of 2019. That is, as a result of the pandemic, the learning poverty rate
is likely 13 percentage points higher, and an additional 1 out of every 8 children in low- and middle-
income countries is now in learning poverty. This means that all of the gains in learning poverty that
low- and middle-income countries recorded since 2000 have been lost.36 Moreover, the damage may be
even larger than these simulated figures suggest. In the regions and countries with very high pre-
pandemic learning poverty, the pandemic-related shocks could have pushed children who were already
below the minimum proficiency level in reading further behind.
South Asia and Latin America and the Caribbean are likely to have suffered the largest increases in
learning poverty.37 Both regions have seen very long school closures, of at least 273 and 225 days on
average, respectively. These two regions also had the largest share of students affected by partial school
closures as of early 2022 (Figure 5). As a result, children have missed out on a substantial amount of in-
person learning. Learning poverty is estimated to have risen from 52 to 79 percent in Latin America and
the Caribbean, and from 60 to 78 percent in South Asia (Figure 6a). That is, in both regions the share of
children in learning poverty may have increased by around twenty percentage points or more in just the
past two years. This means that after nearly two years without in-person schooling, children who, for
instance, are returning to Grade 4 would have to rely mostly on whatever learning foundations they had
acquired by Grade 2. Beyond basic education, learning-adjusted years of schooling—meaning the
number of years of schooling that, adjusted for quality, a child born today can expect to complete—are
expected to have fallen from 7.8 to 6.0 in LAC and from 6.5 to 4.9 in South Asia.
In Sub-Saharan Africa, the region that already suffered from the highest levels of pre-pandemic
learning poverty, the biggest impact will be to cause children who are already learning-poor to fall
further behind.38 In many Sub-Saharan African countries, school closures lasted only a few months, and
the resulting increase in the learning poverty rate is likely to be smaller (from 86 to 89 percent; see

30 The State of Global Learning Poverty: 2022 Update |
Figure 6a). Yet this increase will be accompanied by a further deepening of learning poverty for children
below the minimum reading proficiency threshold. Children with the weakest foundational literacy
before school closures are most likely to have suffered learning loss, especially if their families are not
literate.39 These losses in the region come on top of a severe pre-COVID learning crisis. Before the
pandemic, the average child in the region could expect to complete only 5 learning-adjusted years of
schooling by age 18. With learning outcomes already so poor and many children, especially girls, already
buffeted by conflict and poverty, the projected loss of 0.6 years will be another blow to the region’s
prospects to build human capital if learning is not recovered and accelerated quickly.
In low-income countries, learning poverty is likely to have remained extremely high, while in all other
country-income groups, especially lower-middle-income countries, it likely deteriorated. The
simulation results indicate that in 2022, 9 out of 10 primary-age children in low-income countries remain
in learning poverty. In lower-middle-income countries, in contrast, learning poverty is likely to have
increased sharply, by an estimated 16 percentage points (Figure 6b). While high-income countries also
saw a significant relative increase, given their low baselines, they have stronger capacity and readiness
to respond to the shock. The challenge is especially great in low-income countries, given that even
before COVID, education systems failed to achieve even minimal levels of reading proficiency.
Actual learning data now emerging from numerous countries supports the conclusion that there have
been very large learning losses. Systematic measurement of learning losses typically could not happen
while schools remained closed, but new learning results have appeared from a growing number of
systems as schools reopened. Early findings from high-income countries showed that most had suffered
significant learning losses, even though they entered the crisis better equipped for remote learning.40
More recent results from both lower- and upper-middle-income countries find even larger losses,41 and
in some countries, each month of school closures has caused the loss of a month’s worth of typical pre-
crisis learning or even more.42 In São Paulo (Brazil), which was one of the first large jurisdictions to
rigorously measure learning losses, the declines were so large that students were back at the learning
levels of 10 years earlier in reading and 14 years earlier in math. 43 In India, between 2017 and 2021,
average language scores for 5th-graders on the national assessment declined from 319 to 309, and
average math scores from 310 to 284. Such declines in these and other middle-income countries are
consistent with the large increases in learning poverty derived from the simulations. The results from
low-income countries also corroborate the simulations. Again, consistent with the simulation results,
given that the pre-COVID learning poverty rates were already so high, a number of low-income countries
that have measured learning loss do not show significant increases in learning poverty.44

31 The State of Global Learning Poverty: 2022 Update |
Figure 6. Learning Poverty (Simulations)
(a) By Regions (Low- and Middle-Income countries
only)
(b) By Income Groups (including High-Income
countries)
Note: Numbers for 2022 are based on simulations. The global figure is for all low- and middle-income countries. Regional and global figures are
all population-weighted averages. This report follows the World Bank regional classification; for details, please see this page.
The economic cost of the global learning crisis continues to grow while growing faster among low- and
middle-income countries. Based on data through February 2022, and the simulations assumptions
presented in Annex 2 and 3, this generation of students worldwide now risks losing $21 trillion in
lifetime earnings in present value due to school closures,45 or the equivalent of 16 percent of today’s
global GDP. This cost far exceeds the $10 trillion estimated in 2020, and even the $17 trillion estimated
35
45
10
14
52
79
63
70
60
78
8689
57
70
0
10
20
30
40
50
60
70
80
90
100
2019 2022**
8
14
29
43
60
77
9192
0
10
20
30
40
50
60
70
80
90
100
2019 2022**
Europe and Central Asia
Global (LICs+MICs)
South Asia
Latin America and Caribbean
Sub-Saharan Africa
East Asia and Pacific
Middle East and North Africa
Low-income
Lower-middle-income
Upper-middle-income
High-income

32 The State of Global Learning Poverty: 2022 Update |
in 2021. Students from low- and middle-income countries now risk losing $11 trillion in lifetime
earnings. Urgent action is needed to head off these huge long-term costs.46 As discussed next, these
negative impacts that could accumulate over the coming years can be reversed with swift and decisive
policy action.
Evidence from past disasters reinforces the conclusion from the simulations that the long-term
impacts on human capital and productivity could be large. Disrupted schooling may not be made up
later, and the trauma of shocks can therefore produce differences that are observable many years
later.47 For example, in the United States, young people who were aged 14–17 during the 1916 polio
pandemic in the United States ended up with lower educational attainment than their slightly older
peers, whose schooling had not been disrupted. 48 This can have major economic impacts: in Zimbabwe,
the 1982–84 drought ultimately led to 0.4 grade less of completed schooling for the affected generation
of children, which then reduced their lifetime earnings by 14 percent.49 During the Ebola outbreak,
teenage pregnancies increased in some communities by as much as 65 percent,50 and some girls never
returned to the classroom after schools reopened, due to increased rates of sexual abuse and
exploitation, as well as teenage pregnancies.51
A swift response is essential: not only was learning poverty already high, but the recent learning
losses could be compounded over time, making the cost of inaction especially high. Education systems
were already unable to ensure learning, and now students are returning to school with even less of the
foundations needed to benefit from instruction. Evidence from past disruptions to education shows that
without recovery measures, learning losses may grow even more after children’s return to school, if the
curriculum and teaching do not adjust to meet students’ learning needs. In the four years after a 2005
earthquake in Pakistan that closed schools for about 3 months, students who had lived closest to the
fault line lost learning equivalent to 1.5 to 2 years of schooling.52 In other words, the extent of learning
losses was far greater than would be expected based simply on the length of the school closures, likely
because the affected children learned less in each year after reenrolling in school. It is possible that
teachers weren’t equipped to promote learning recovery or that they felt compelled to stick to the
original curriculum, and so children fell further behind. As students fall further behind the curriculum,
the risk grows that many will become disengaged and ultimately drop out of school. Even if they remain
in school, this dynamic could lead to a much greater range of learning levels in the classroom, which
makes it even more challenging for teachers to meet the needs of their students. Actions that countries
take in the short term—even over just the next year—could therefore make a big difference for the
longer-term trajectory of a generation at risk.
Countries have set very ambitious targets for reducing learning poverty
In the wake of these unprecedented shocks to education, countries are nonetheless showing ambition
in setting national education targets to be achieved by 2030 under the SDGs. Under SDG 4, countries
have committed to targets for progress toward the global ambition of ensuring that all children learn. In
2015, the international community committed to define intermediate benchmarks on selected SDG 4
indicators. The process, which began in 2017, resulted in the selection of seven benchmark indicators in
2019, including the minimum proficiency level by the end of primary and the percentage of children who
reach the end of primary, two indicators that are aligned to the learning poverty indicator. By 2022, 89
low- and middle-income countries and 139 countries in total have made progress on their national

33 The State of Global Learning Poverty: 2022 Update |
analysis and consultations and have shared with UNESCO their commitments on learning or out-of-
school targets for 2030.53
When we add up those national targets for low- and middle-income countries, we find that their
collective goal is aligned with halving learning poverty by 2030. The aggregate goal implies reducing
learning poverty to 42 percent by 2030, which means nearly halving it from the likely 2022 level of 70
percent.54 This reflects an aspiration set by countries themselves, and to make serious progress toward
it, governments, educators, communities, families, civil society, and development partners must
collectively commit to learning recovery and acceleration, starting now.
Figure 7. Learning Poverty – history, simulation results, and targets
Source: Authors’ calculation. National targets, refers to the population weighted aggregation of national targets reported to UIS; and, Quality of
Education, refers to “Quality education for all” as stated in the SDG 4.
Given historical trends, this collective target—resulting from the aggregation of national targets—is
extremely ambitious, especially after the pandemic. Just before the pandemic, the World Bank set for
itself the ambition to support countries in at least halving the global learning poverty rate by 2030, from
53 percent to 26 percent. Calculations showed this would have required nearly tripling the 2000-2015
global rate of progress. Now, it is clear the challenge is even greater—both because progress had
0
10
20
30
40
50
60
70
80
2015 2019 2022 2030
Lear
nin
g P
ove
rty
(%)
Quality of Education
For All
National Targets
COVID simulations
Global Estimate 2019
Global Estimate 2015
With the pandemic impacts, the world is now further away from the SDG target of quality
basic education for all, in which by the end of primary, all children would be attaining the
foundational skills they need for life. Accelerated efforts are needed to reverse the trend
and move faster towards eliminating Learning Poverty.

34 The State of Global Learning Poverty: 2022 Update |
already stalled in the 2015-2019 period, and because with the COVID pandemic learning poverty is
expected to have shot upward by 2022 (Figure 6a). If global learning poverty is now 70 percent as
suggested by the latest global simulations, the world would need to triple the rate of progress achieved
between 2000 and 201555 to reduce learning poverty even to around 55 percent by 2030. This would be
an incredible achievement, given the new starting point, yet it would still fall short of the collective
global goal of 42 percent, let alone the SDG 4 target of ensuring that all children can read by 2030
(Figure 7). In fact, it would not quite match the 53 percent learning poverty rate that the world had
already achieved in 2015.
These findings call for greater commitment and greater effort, not resignation. The high levels of
learning poverty violate children’s right to education. After all the hard work by so many families and
educators to provide education for all, it is unacceptable that only a quarter of children in low- and
middle-income countries are now enrolled in school and reading with comprehension at a minimally
acceptable level. The high trust that families have placed in education by ensuring 90 percent
enrollment at primary level is not being rewarded with adequate learning outcomes, and this could
undermine future trust and investments in education. Saving the futures of children and youth—and of
their societies—demands healing the wounds inflicted by the pandemic, starting with ensuring that
education systems can support children to acquire foundational skills. And that is not enough:
collectively we need to build on that short-term learning recovery to take on the learning crisis that
predated COVID-19.
The high trust that families have placed in education by ensuring 90 percent enrollment at
primary level is not being rewarded with adequate learning outcomes, and this could
undermine future trust and investments in education.
35 The State of Global Learning Poverty: 2022 Update |
Part II: Ending learning poverty: commitment, recovery, and acceleration, guided by better data
"...In the streets, there are no skills, no talent and no compassion; you had to fight for
everything—and most importantly, there are no books..."
Ayomide Olawale
19-year-old student, Nigeria
“...Schools haven't cut back much on their curricular expectations and "ineffective" learning
becomes detrimental for students in the long run…It's a struggle to tackle the never-ending
list of assignments, especially with mental health issues in teens being at an all-time high.”
Shirin Rajesh
16-year-old student, India
“...everyone learns at different paces, and teachers are having trouble taking all this
into consideration when planning classes...“
Najya Gause
16-year-old student, The Netherlands
• Despite the learning crisis, some education systems showed before COVID that it is possible to accelerate learning dramatically and at scale.
• Since the pandemic hit, many education systems have taken concerted actions to recover and accelerate learning.
• Learning recovery and acceleration must start with sustained political commitment at the national level.
• The RAPID framework for learning recovery and acceleration offers a menu of policies for recovery and acceleration, many of which have already been implemented at the national level.
• Decisive action can not only recover learning lost from the pandemic, but also address the deeper underlying learning crisis and end learning poverty.
Part I has shown that the deep pre-COVID learning crisis has been made even worse by the pandemic.
More than half of all children were already suffering from learning poverty just before the pandemic,
and progress in reducing learning poverty had already stalled. Now, after the unprecedented disruptions
to schooling, the global learning poverty rate is estimated at 70 percent. And in countries where learning
poverty was extremely high already, COVID has blocked progress: both in Sub-Saharan Africa as a region
and among low-income countries globally, learning poverty has now remained stagnant at nearly 90

36 The State of Global Learning Poverty: 2022 Update |
percent for the last 7 years. This lack of foundational skills threatens to undermine countries’ ability to
meet their aspirations.
Yet despite these global trends, some education systems showed before COVID that it is possible to
accelerate learning dramatically and at scale. For example, the municipality of Sobral in the Brazilian
state of Ceará was ranked 1,366 in the national index that measures quality of education in Brazil in
2005; twelve years later, it had leapt to the top spot at the national level. Sobral achieved this dramatic
learning acceleration by putting the success of every student at the top of the political agenda, using
student assessments effectively to track progress and inform classroom instruction, adopting a focused
curriculum that prioritized foundational skills (especially reading), and by preparing and supporting
teachers to provide high-quality instruction. Similarly, the Tusome program in Kenya used practical
teacher training, supported by classroom assessment, focused curriculum, structured teachers’ guides,
and aligned learning materials, to raise the number of children reaching national benchmarks in English
and Kiswahili from roughly 35 percent to 65 percent between 2015 and 2019.56
And since the pandemic hit, many education systems have taken concerted action to recover and
accelerate learning. The state of Gujarat, India, for example, realigned the entire curriculum for the first
quarter of the academic year to focus on foundational learning. Results from the Periodic Assessment
Tests (PAT), a weekly formative assessment that began pre-pandemic, were used to personalize remote
education to the level of each student during school closures. In addition, Gujarat has used a mix of low-
and high-tech interventions to deliver personalized, adaptive education to each student. In Ghana, the
Ministry of Education launched a back-to-school campaign that rolled out rapid learning assessments,
targeted instruction, and remedial education to students in over 10,000 schools across the country.
Upon school re-openings in January 2021, the Ghana Education Service supported teachers in all schools
to dedicate the first eight to twelve weeks of school to assess all learners, review concepts taught in
previous years, and provide targeted, remedial instruction. While evidence on the effectiveness of
programs like these is still emerging, these interventions are consistent with what pre-COVID evidence
showed is effective to accelerate learning.
Drawing on recent experiences with accelerating learning at scale, UNICEF, UNESCO, and the World
Bank recently proposed the RAPID strategy for learning recovery and acceleration.57 The pandemic has
shown that the policies that lead to learning in the recovery and acceleration phase post-COVID are for
the most part the same policies that lead to general learning outcomes improvement. The application of
the RAPID strategy over time will not only recover learning in the post-COVID period but can also
address the underlying pre-pandemic learning crisis. RAPID is an acronym capturing the five policy
domains of the framework (Box 4).

37 The State of Global Learning Poverty: 2022 Update |
Together, these five policy domains work to focus on ensuring that all children are in school and
learning through effective methods that prioritize foundational skills and student well-being. For
learning to improve sustainably and at scale, policies under these domains will need to ensure that
school leaders and teachers in every classroom improve their everyday practices. Given the scale of the
challenges and the competition for funding, countries will need to maximize their efforts to improve the
quality and effectiveness of instruction and increase instructional time, while also making sure that all
children are in the classroom and learn.
These interventions should start immediately, and they can begin to deliver results in the short term.
The RAPID framework highlights elements that do not require a thorough system strengthening to begin
improving outcomes in the short term, and many involve deploying current resources more efficiently.
For example, the RAPID interventions do not require highly qualified teachers or highly professional
school leadership, but encourages provision of tools to support the current educators more effectively.
Those system-strengthening elements are crucial to build over the longer term, of course, and structural
reforms will be needed more generally to sustain the short-term learning gains. But decisive action
should not wait until countries have strong systems, because the cost of short-term inaction would be
too high.
Before discussing and illustrating the five policy domains of the RAPID framework in more detail, we first
outline the preconditions needed to design and implement effective policies in these five areas
sustainably and at scale.
Box 4: How the RAPID framework aims to help recover and accelerate learning
The domains of the RAPID framework aim to equip schools to get learning happening in the short term in challenging circumstances. For example, it aims to answer questions like the following:
• Reach every child and keep them in school: How can we ensure that children return and
remain motivated in school after having long been disengaged from school and having lost critical learning?
• Assess learning levels regularly: How can teachers know what a child’s level of learning is
after schools have reopened, so they can target the right support to her and help her catch up on the learning she has missed out on?
• Prioritize teaching the fundamentals: How can a 4th-grade child read and understand the
science text from the curriculum without even the basic reading skills he was meant to acquire in 2nd and 3rd grade while schools were closed?
• Increase the efficiency of instruction, including through catch-up learning: How can a
teacher effectively teach 4th-grade reading to a classroom of 30 or 40 children whose current reading comprehension is at a 1st- or 2nd- grade level at best?
• Develop psychosocial health and well-being: How can we support children to feel welcome
back at school and to manage the anxiety stemming from the pandemic, school reengagement, and catch-up learning?

38 The State of Global Learning Poverty: 2022 Update |
The first step toward learning recovery and acceleration: Political commitment
Recovery and acceleration must start with political commitment at the national level. Political leaders
need to prioritize learning recovery and acceleration in national strategies to build back better from the
pandemic by committing the leadership and resources necessary to tackle the amplified learning crisis.
This requires first acknowledging the extent of the learning crisis—a crucial step, given that in a recent
survey, 80 percent of government officials overestimated literacy proficiency in their countries58—and
the extent to which this crisis can damage the growth and development prospects of their countries.
Political commitment must also center on raising the achievement levels of the lowest achievers and the
most disadvantaged. To inspire and guide progress, leaders should lay out a vision of education that
prepares all children and youth for a lifelong learning journey, and active participation in social life and
productive work—and they should highlight that this starts with ensuring that, at a minimum, all
children learn to read. Committed leaders can help their societies understand that foundational learning
is the critical building block to achieving all the other education priorities and other important national
goals, and they can rally key stakeholders around the need to prioritize it. In the current context, this
awareness-raising is especially important in societies that have given less attention to learning losses
and the impacts of school closures and to the pre-COVID learning crisis. In Latin America, despite the
nearly two years of school closures, the media gave far less attention to closures and learning losses
(relative to other topics) than did media in other regions (Figure 8). But in general, there is a lack of
understanding of the magnitude education challenge. In a recent survey to policymakers in 35 low- and
middle-income countries,59 when asked point-blank “is there a learning crisis in your country”, 81% of
officials said yes. But when asked about the share of 10-year-olds who could read a simple text, they
grossly overestimated the children’s skills. On average, they said that 47% of children could read, while
the real number for those country was on average 25%. They recognized that there was a problem, but
not the magnitude of the problem.
Wider societal mobilization for education is needed to support high-level commitment and create
national learning coalitions. Without broader societal support, strong commitment from the
government will not be enough, both immediately and especially over the longer term to sustain the
commitment. This starts with genuine policy and social dialogue with all stakeholders. Recovering the
learning losses of children and youth requires the efforts of educators, providers, suppliers of education
inputs, families, and administrators throughout the system. If they are not aware of the scale of the
losses and its consequences, and they do not share the commitment to recovering those losses and
accelerating progress, education systems are likely simply to return to business as usual, with lifelong
negative consequences for today’s students. Recovery and acceleration will need to be cross-sectoral,
meaning that health and other sectors in charge of social policy, among others, need to commit too.
Other key societal groups—like the business community and civil society organizations—also need to be
part of national coalitions, to build momentum around reducing learning poverty and make it more
sustainable. National commitment to education requires that all actors align in the design and
implementation of reforms with the sole objective of improving children’s and youth education and
wellbeing. Politics or economic interests must not contaminate the decision-making process in
education. It is not the positions or interests of political party or unions, nor the interest of suppliers,
vendors or providers, or any other education stakeholders, that should matter, but exclusively the
interests of students.

39 The State of Global Learning Poverty: 2022 Update |
A key sign of commitment is the regular measurement of learning to diagnose learning gaps and
target action. Different types of assessments of student learning will be necessary to guide the
response. First, countries need to measure learning at the system level, so they can understand the
current levels of learning and identify which groups have lost learning the most. Second, teachers need
to be equipped with easy-to-use tools for measuring foundational learning in the classroom; this will
allow them to target instruction to the post-pandemic level of learning of each student.
Another sign of commitment—and a tool for sustaining momentum—is setting clear and widely
understood targets to focus efforts. While many countries have reported targets or benchmarks for
progress for the SDG 4 monitoring process (as discussed in Part 1), these targets have often not been
shared and discussed widely by different societal groups, which could limit their effectiveness in
spurring change. The post-COVID recovery period offers an opportunity to broaden social buy-in. Once a
country has a baseline measurement of student learning after schools reopen, it can use this baseline to
set targets for recovery. Targets should cover both enrollment and learning, and they should be
straightforward enough that they can be used to rally support from teachers and the broader coalition
of societal groups supporting learning. In addition to overall targets, it is important to set targets
specifically for the groups of children who have been left furthest behind, for example because of their
gender or socioeconomic status.
Finally, commitment requires providing adequate financing for education to meet the set targets. In
their responses to COVID-19, countries have allocated less than 3 percent of their fiscal stimulus
packages on education. In low- and middle-income countries, the share has been even lower, averaging
just 1 percent.60 Overall, education budgets declined initially after the onset of the COVID-19 pandemic
in 65 percent of low- and lower-middle-income countries.61 While the emergency health response took
priority at the outset of the pandemic, there is an urgent need now to address the wider fallout of the
pandemic and make up for the neglect of education. Providing enough financing today—and using it
more efficiently, on effective interventions and students with the greatest needs—will lead to long-term
savings on dealing with the costs of dropout, low skills productivity, and widening income inequality.
Global coalitions for education should provide support for countries that show a strong political
commitment to learning recovery and acceleration. After the unprecedented shock that COVID-19 has
brought to education systems, countries need more support than usual from the international
community. In part, this support should come in the form of tools and capacity-building support for
learning recovery that draws on evidence from around the world. Evidence on effective recovery
strategies in the wake of COVID is only now accumulating and getting it to stakeholders quickly is crucial.
The international community should also provide strategic financing for education—not as a substitute
for what countries should provide, but to fund innovations and system strengthening that makes
existing domestic spending more effective and efficient. One example is supporting efforts to close the
existing gaps in learning assessments, data, and evidence needed to guide effective education spending.
Another is financing practical teacher guides, training, and learning materials.

40 The State of Global Learning Poverty: 2022 Update |
Figure 8. Media attention to selected education and health topics during the pandemic, for selected countries and regions
Note: To examine attention to issues of learning loss in school closure in Latin America (Argentina, Bolivia, Brazil, Chile, Colombia, Costa Rica,
Guatemala, Honduras, Mexico, Panama, and Uruguay) and elsewhere, global news mentions of related terms were analyzed using the Media
Cloud tool. This data visualization employs Media Cloud to analyze the daily frequency of the appearance of individual terms in national
newspapers in 18 countries over the period January 2020 to December 2021. Media Cloud gathers the full universe of stories published in
newspapers available online from those countries. We evaluate the fraction of those stories which include specific terms in English or their
Spanish or Portuguese equivalents: “learning loss,” “remote learning,” “school closure,” “unemployment,” and “vaccine.” We interpret the share
of total newspaper mentions of a term as an indication of the intensity of public interest in the topic captured by the term.
Source: Azevedo, Demombynes, and Wong (2022) using Media Cloud from January 2020 to December 2021.
The short-term agenda: Recovering and accelerating learning with the RAPID framework
Building on political commitment, countries can adapt the RAPID framework62 for learning recovery
and acceleration to their own national contexts to recover and make rapid progress, starting
immediately. The framework summarizes a menu of policies, many of which have already been
implemented at the national level in different countries and address the multiple challenges of the
recovery and acceleration process.

41 The State of Global Learning Poverty: 2022 Update |
Figure 9 RAPID Framework for learning recovery and acceleration
Source: UNICEF, World Bank, and UNESCO (2022).
The five domains of RAPID are focused on ensuring that all children and youth are in school and building
the foundational skills that they will need for all further success in school and beyond:
Reach every child and keep them in school. The most immediate policy action is to keep schools
open and get children back in school. Because they were the least well served by remote learning,
students from marginalized backgrounds are most at risk now of failing to return or subsequently
dropping out. As schools reopen, it is crucial to monitor children’s enrollment, attendance, and grade
progression; understand why some children have not returned to school; and support them to return
and to stay in school. Back-to-school campaigns, family outreach and early warning systems can help
keep children in school, as can removing school fees, introducing cash transfers and school feeding
programs. In Ghana, for example, a successful back-to-school campaign involving taskforces made up
of government, CSOs, and media, carried out district-level activities through radio, TV, and
community events, achieving nearly 100 percent re-enrollment at the end of 2021.63 In Lebanon, $23
million in cash support will go to youth aged 13-18 from extremely poor families at risk of dropping
out of school as a result of pandemic-related shocks.64
What to do in the next few years to move the needle on learning?
Short-term actions are essential, and so is political commitment for their implementation.
Countries can adapt elements of the RAPID framework for learning recovery and acceleration to
their own national contexts to recover and make rapid progress, starting immediately. The
framework summarizes a menu of policies, many of which have already been implemented at the
national level in different countries; this support must now reach all children in all countries.
Reopen schools safely and keep them open
Promote returning to the classroom through back-to-school campaigns
Provide cash transfers to poor families
Use early warning systems to identify at-risk students
Use approaches that align instruction with learning needs: targeted instruction; structured pedagogy; tutoring; self-guided learning
Support teachers continuously: build practical pedagogical and digital skills
Expand instructional time
Enhance learning with technology
Assess learning losses at national/ sub-national level
Provide teachers with tools for classroom level measurement
Adjust curriculum across and within subjects
Prioritize numeracy, literacy, socioemotional skills
Focus instruction on closing the gaps between desired and actual student learning in specific subjects
Build teachers’ capacity to support their students’ wellbeing and identify students in need of specialized services
Support teacher wellbeing and resilience
Invest in students' safety, nutrition, and access to water, sanitation, and hygiene facilities

42 The State of Global Learning Poverty: 2022 Update |
Assess learning levels regularly. Assessments are useful for two different purposes in the learning
recovery and acceleration process. First, it is essential to provide teachers with classroom
assessments of children’s current learning levels will help guide their learning recovery journey. This
will allow teachers to target instruction to each child’s level. Second, measures of learning at the
system level can help make informed decisions on where and how to mobilize resources to reverse
learning poverty and drop-out among those most vulnerable. For example, in November 2021, the
State of Guanajuato in Mexico administered a large-scale assessment to more than 600,000 students.
November 2021 assessments are being analyzed in reference to pre-pandemic results to measure
learning losses during the period of school closures, assess how these learning losses differ for
different demographic groups, and identify specific content areas where students require support.65
In São Paulo, Brazil, the state created guidelines for classroom-level diagnostics and prioritized
supporting teachers to deploy formative and summative assessment tools to support learning
recovery.
Prioritize teaching the fundamentals. Given the staggering loss in instructional time, learning
recovery efforts should focus on essential missed content and prioritize the most foundational skills
and knowledge, particularly literacy and numeracy, that students need for learning within and across
subjects and for more advanced learning in the future. Providing teachers with prioritization
guidance is important, given the very dense and overambitious curricula that exist in many countries
and that teachers, particularly in the public sector, are instructed to follow. It is essential to allow
teachers to prioritize flexibly in the short term the core essential skills and knowledge children need
in their respective grades. It also requires helping teachers to improve their quality of teaching of
foundational skills—including by using structured pedagogy approaches as needed, proven across
many contexts, that include practical teacher guides connected to well-designed student textbooks.
And children should be taught in a language that they use and understand, which is often not the
case now. In the Philippines, the Department of Education published the Basic Education Learning
Continuity Plan, which streamlined the K-12 curriculum into essential learning competencies for the
2020-21 school year.66 In Indonesia, teachers are provided diagnostic assessment tools and
guidelines to interpret student results in local languages for core subjects.67
Increase the efficiency of instruction, including through catch-up learning. To recover missed
learning, school systems need to adopt effective teaching practices that support teachers in their
immediate classroom challenges, as the teachers are receiving children with larger and more varied
learning deficits. These practices include learner-focused recovery strategies. These include
structured pedagogy programs, instruction targeted to students’ learning levels, individualized self-
learning programs, tutoring, and catch-up programs for dropouts. In tandem with these strategies,
extending instructional time by modifying the academic year or offering summer school can further
accelerate learning recovery. Improving the quality of teaching and targeting it to the level of the
student is the single most crucial intervention for reversing the decline in learning progress (see Box
5). In Nepal, the government is gradually adopting a Teaching at the Right Level (TaRL) intervention
to fast-track learning recovery. The intervention design includes TaRL implementation through
community schoolteachers and trained NGO facilitators in 20 schools, providing targeted instruction
for 2-3 hours each day for ten weeks. In Zambia, a catch-up program combined the principle of ability
grouping with a condensed curriculum, and trained teachers on implementing remedial activities for
those most behind in learning.68

43 The State of Global Learning Poverty: 2022 Update |
Develop psychosocial health and well-being. The pandemic has harmed the mental health and
psycho-social wellbeing of both learners and teachers, and it has compounded risks for those who
are already marginalized—including girls and women, children with disabilities, children affected by
conflict or displacement, and others. Meeting the mental health and psychosocial needs of children,
youth, and their teachers is not only important in itself, but also crucial for ensuring learning
recovery. Critical to learning and wellbeing is ensuring that schools are safe and that children are
healthy and protected from violence and can access basic services—notably, nutrition, counselling,
water, sanitation, and hygiene services, which are especially critical to ensure that girls re-enroll and
remain in school. Liberia, for example, developed 30-minute radio lessons on early grade literacy that
wove in opportunities for students to reflect on their feelings and find productive ways to deal with
them.69 North Macedonia incorporated stress-reducing exercises for teachers in their educational
television programming.70

44 The State of Global Learning Poverty: 2022 Update |
Box 5. Supporting teachers and improving learning
The pandemic has resulted in classrooms that are more diverse in terms of student skills and
attainment than before. Past and emerging evidence shows us that school closures have resulted in
classrooms that are more diverse in student attainment than before (for example, analysis emerging
after the 2005 earthquake from Pakistan, in Andrabi, Daniels and Das 2020 shows widening learning
inequalities within affected areas), meaning teachers will need skills for teaching students with
differing learning needs.
Teachers need the skills to adjust learning to the needs of students now more than ever, and
policies that train and support teachers remain at the heart of learning and learning recovery.
Professional development and continuous support that aligns with evidence on what works to change
instructional practices and accelerate learning will be needed to support teachers and improve
learning. Complementary actions, such as improvements in teaching and learning materials, and
supportive management systems and school leaders, also play a part in enabling effective teaching.
Examples of programs that support teaching and learning:
• Structured pedagogy in Kenya: Tusome is a flagship partnership between USAID and
the Ministry of Education (MOE). Tusome focuses on four key interventions: enhancing
classroom instruction, improving access to learning materials, expanding instructional support
and supervision, and collaborating with key system-level literacy actors. Students made
substantial gains in English (proportion of non-readers fell from 38 to 12%) and Kiswahili
(proportion of non-readers fell from 43% to 19%).
• Targeted instruction in Ghana: The Ministry of Education, with support from the World Bank,
rolled out a pilot targeted instruction intervention, with rapid student assessment and remedial
education in over 10,000 basic (kindergarten, primary and lower secondary) schools across the
country. Between December 2020 and February 2021, 70,000 teachers nationally were trained
in targeted instruction. The intervention dedicated 2 hours per week, 3 days a week to targeted
instruction in English and Math.
• Self-guided learning in Uruguay: Computer-assisted self-guided learning has been implemented
at a national scale with Plataforma Adaptativa de Matemática (PAM) by Plan Ceibal, a digital
online tool for students and teachers that adapts content to skill level and provides immediate
personalized feedback. The content has been adapted to the national curriculum. An evaluation
showed that primary students using PAM increased on average 0.2 standard deviations in math
test scores and that the impact was greater for disadvantaged students.
Teachers are central to the success of the RAPID framework. None of the five principles will succeed
without prepared, supported, and motivated teachers, and systems will need to make sure to gain
teachers’ commitment and incorporate their perspectives into the strategy implementation. Another
key element will be to provide teachers the space for them to collaborate and learn from each other;
in the face of an unprecedented challenge, figuring out how best to recover learning will require
experimentation and learning in the classroom.
Sources: Andrabi, Daniels, and Das 2020; USAID 2017; Perera & Aboal 2019

45 The State of Global Learning Poverty: 2022 Update |
The “RAPID” acronym highlights the need for speed in getting children learning as quickly as possible.
For countries hit hard by the school closures, without prompt action there is a serious risk that the
learning losses suffered over the past two years could become permanent, with cumulating effects and
long-term intergenerational impacts. Countries that adopt policies in these five domains—tailored to
their own contexts—can quickly begin to recover the learning losses and improve equity and resilience
of education systems against future shocks.
The RAPID interventions will also accelerate learning in countries that had smaller learning losses but
that already faced very high levels of learning poverty before COVID. These include many low-income
countries where school closures were of shorter duration. Most elements of RAPID—for example,
prioritizing teaching of foundational skills, and targeting instruction to the level of the student—are not
just for learning recovery, but also for acceleration. In fact, much of the evidence supporting most of the
RAPID interventions comes from the pre-COVID period, when they were shown to accelerate
foundational learning from a more typical baseline.
For concrete guidance and examples on how to implement the RAPID framework, the six co-signing
institutions of this report have also developed the companion Resource Guide on Learning Recovery
(Box 6). The Resource Guide provides detailed options and country examples under each of the five
policy areas of the strategy. Because new evidence on how best to promote learning recovery is
constantly emerging from around the world, it is written as a living document that can be frequently
updated with new examples.

46 The State of Global Learning Poverty: 2022 Update |
Box 6: The Guide for Learning Recovery and Acceleration
A companion resource detailing how countries can recover and accelerate learning
The Guide for Learning Recovery and Acceleration is a detailed resource on how countries can apply
the RAPID framework to tackle learning losses caused by the COVID-19-related disruptions to
education and achieve a sustained acceleration of learning. Specifically, it demonstrates how to
design and apply a contextually suitable Learning Recovery Program to recover and accelerate
learning.
The 5-part RAPID framework, first presented in the March 2022 joint UNICEF, UNESCO, and World
Bank report, captures the essential policy areas of such a Learning Recovery Program. It also
conveys a sense of urgency: countries must move rapidly to meet the challenges brought by the
global shock to education. While the first two policy areas, Reach every child and keep them in
school and Assess learning levels regularly, are essential for monitoring and planning, the remaining
policy areas constitute a menu of strategies to improve teaching and learning that can be combined
and adapted to the context.
The Guide draws on evidence from what has worked to improve learning outcomes in low- and
middle-income countries, including systematic reviews of education interventions and the work of
the Global Education Evidence Advisory Panel (GEEAP). GEEAP consists of leading researchers and
practitioners in education, and the panel’s two reports highlight “smart buys” in education—cost-
effective approaches to improving learning—and offer recommendations for education
policymakers on how to promote learning during COVID-19.
The Guide features a menu of policy actions, examples, case studies, considerations for
implementation, and links to additional resources. It offers guidance on how some of these policy
actions may vary by country capacity. It highlights examples from the past that have worked to
accelerate learning, such as the success with structured pedagogy through the Tusome program in
Kenya. But it also spotlights new initiatives grounded in evidence, such as Ghana’s targeted
instruction initiative as part of their learning recovery response after COVID-19. The resource has
been designed to facilitate and advance policy dialogue as education systems shape their
interventions to recover and accelerate learning.
The Guide is meant to build on the wealth of knowledge produced and systematized by the six
partner organizations of this report, drawing from the hard work of practitioners, governments,
NGOs, and researchers around the globe. It complements the messages in this report with in-depth
advice on policy options. The Guide is intended to be a living document and will be updated in the
future as we learn more about what countries are doing to recover from the crisis.
Sources: World Bank, the Bill & Melinda Gates Foundation, FCDO, UNESCO, UNICEF, and USAID 2022; UNICEF, UNESCO, and World Bank
2022; Global Education Evidence Advisory Panel 2020; Global Education Evidence Advisory Panel 2022.

47 The State of Global Learning Poverty: 2022 Update |
The longer-term agenda: Sustaining learning acceleration beyond the recovery period
Our goal must be more than recovery and short-term acceleration. Recovering lost learning and
accelerating learning in the short term is a crucial first step, but it cannot mean returning to the pre-
pandemic learning crisis. We should aspire to a world where all children read and do basic math by age
10—one in which all children and youth, regardless of background, have the foundational learning to
acquire more complex cognitive, socioemotional, and technical skills to fulfill their potential. The
pandemic provides a unique opportunity to collectively face the learning crisis head on, by finally
prioritizing foundational learning for all, and building systems that can achieve it at scale.
Figure 10. Learning trajectories pre- and post-COVID
Source: Adapted from UNESCO, UNICEF, and World Bank (2021). “The State of the Global Education Crisis: A Path to Recovery.”
If countries sustain and build on the learning recovery packages, they can accelerate learning well
beyond the pre-pandemic trends. If sustained over time and supported by structural reforms, each of
the elements of the RAPID framework will contribute to this longer-run goal of acceleration, preventing
a return to the ineffective business-as-usual approaches of the pre-pandemic period (Learning Recovery
and Acceleration Trajectory, in Figure 10).71 Reaching every child, especially in primary and lower
secondary, will help reach the hundreds of millions of children who were out of school even before the
pandemic. Regularly assessing student learning will help guide efforts of policymakers and teachers who
previously had to operate in the dark. Prioritizing foundational learning, rather than trying and failing to
deliver overambitious curricula, will ensure that all children have a strong basis for further learning. The
instructional techniques to increase efficiency of instruction, if sustained over time, will prove far more
cost-effective at promoting learning even after recovery; these techniques include structured pedagogy
and teaching students at their level. And continuing to develop psychosocial health and well-being will
result in students learning more and choosing to stay in school longer and being better equipped for
their lives beyond school.

48 The State of Global Learning Poverty: 2022 Update |
Over the longer term, sustained progress to reduce learning poverty will also require coupling the
RAPID interventions with reforms to strengthen education systems. There is an opportunity now to
use learning recovery as a springboard for longer-term learning acceleration. Seizing it requires not only
sustaining the political commitment to education, but also carrying out structural reforms to strengthen
education systems. These reforms include, for example, defining a clear path to ensuring a
professionalized teaching career and ongoing teacher support, providing well-designed textbooks and
teaching and learning materials for all, closing the digital divide, ensuring that schools are safe and
inclusive, and investing in managing schools and the system in a professional way that focuses
relentlessly on improving education outcomes. Such system-strengthening will take longer to bear fruit,
in terms of better learning outcomes—which means that it cannot be depended on for short-term
recovery and acceleration, but also that it should start as soon as possible.

49 The State of Global Learning Poverty: 2022 Update |
Spotlight: Deep dive on data and measures for
fighting learning poverty
• Without high-quality, regular, and comparable learning data, countries are flying blind in the fight against learning poverty.
• Broadly speaking, education systems need two main types of learning data: system-level and classroom-level.
• To institute effective policies to fight Learning Poverty, it is important for countries to have temporally comparable measures of learning for at least 2 grades (and 2 subjects), so they can understand how much children are learning between grades.
• Multidimensional indicators such as learning poverty can help align the multiple objectives of the education system, such as ensuring access and quality of learning.
Better data and indicators are crucial for accelerating the fight against learning poverty
Data on student learning is a critical tool for accelerating the fight against learning poverty.
Policymakers may use such data to inform policy action by getting key insights, such as the scale of the
learning challenge, trends in learning over time, and inequalities in student learning. Such data can also
help understand which policies to improve learning have worked or not worked. Additionally, indicators
using such data, such as Learning Poverty, can play a key role in focusing policy conversations on the
urgent need to fight learning poverty. Apart from policymakers, teachers and school administrators may
use learning data to improve classroom practice and make decisions about what to teach and how to
modify classroom practices.
Yet existing efforts to collect and use data tend to be fragmented and infrequent, especially in low-
and middle-income countries, where the effects of the learning crisis are most severely felt. For
example, in some countries assessments are a one-off activity, with no clear pedagogical or policy
implications. Even where assessments are carried out multiple times, they are often not temporally
comparable, limiting their use to gather insights about trends in learning and analysis on impacts of
education policies. For example, in some countries, national assessments are often not comparable over
time. Without such comparability it is impossible to track performance over time. In some instances, the
time between data collection and report publication is so long that data is no longer policy relevant by
the time the findings are made public.
Without good quality, regular, and comparable learning data, countries are flying blind in the fight
against learning poverty. Without such data, policy makers do not know whether they are on track to
improve learning outcomes and whether their policies are geared towards success. Similarly, without
such data, teachers do not know whether children are on track to meet their learning goals. It will be
incredibly hard for countries without learning data to implement policy measures that can help recover
COVID-19 learning losses.

50 The State of Global Learning Poverty: 2022 Update |
Better data is needed to fight learning poverty
Broadly speaking, education systems need two main types of learning data: (i) system-level data and
(ii) classroom-level data.
System-level learning data—such as data collected through regional or international assessments,
household survey data such as MICS-FLM, and national assessments—provides an overall indication of
learning performance. It can provide information about the depth of the learning challenge, as well as
learning trends over time. The learning poverty indicator uses some of this system-level data from
international and regional assessments such as PIRLS, TIMSS, LLECE, PASEC, and SEA-PLM.
Furthermore, there are tools and methodologies available to countries to make system-level
assessment data more useful for monitoring meaningful learning progress. One example is policy
linking, a judgement-based methodology through which educators are asked to evaluate the difficulty of
items in a given context. This methodology can be used to link learning outcomes from existing
assessments to the Global Proficiency Framework and thereby to make comparisons over time and
across countries. Another tool is the MILO (Monitoring Impacts on Learning Outcomes) initiative, which
has allowed countries to measure the impact of COVID-19 on learning while also allowing reporting
against SDG 4.1.1b benchmarks through the Assessments for Minimum Proficiency Levels for SDG 4.1.1b
(AMPL-b) tests.72 The assessment material was derived from the UIS’s Global Item Bank, which is a
shared repository of assessment questions for reading and math. National assessments also have the
option of integrating comparable testlets in their instruments.
In additional to system-level data, it is vital to have quality classroom-level data about the
performance of students. Such data can be gathered through formative classroom assessments, yielding
information about the effectiveness of teaching. Teachers may use such information to implement
tailored instructional techniques to adapt to the learning levels of individual children. Such information
can also help teachers understand progress against curricular standards and provide responsive and on-
going learning support to children. This positive feedback loop is more important than ever after
prolonged COVID-19-related school closures, which have caused some children to lose more learning
than others.
Taking a deeper look at the Learning Poverty data demonstrates that behind the learning crisis
highlighted in Part 1 is a learning data crisis. Without timely data, it is impossible to get an accurate
understanding of the magnitude of the challenge and institute effective policies to accelerate the fight
against learning poverty. In the new data release summarized in Part 1 of this report, learning poverty
estimates are available for only 122 out of 217 countries. In the remaining countries, there are no
learning poverty estimates due to missing learning data or in some cases, missing enrollment data.
Around half of low-income countries do not have any learning poverty estimates at all. The lack of
learning data is particularly acute in Sub-Saharan Africa (Figure 11), where 24 countries lack any learning
poverty estimates. Even for countries for which learning poverty estimates exist, sometimes there are
questions about the reliability of the data (prompted, for example, by significant decreases in learning
poverty that are not easily explained by policy reform). These doubts underline the need to improve
technical capacity in learning assessments at the country level and to use multiple sources of data to
triangulate information on learning.
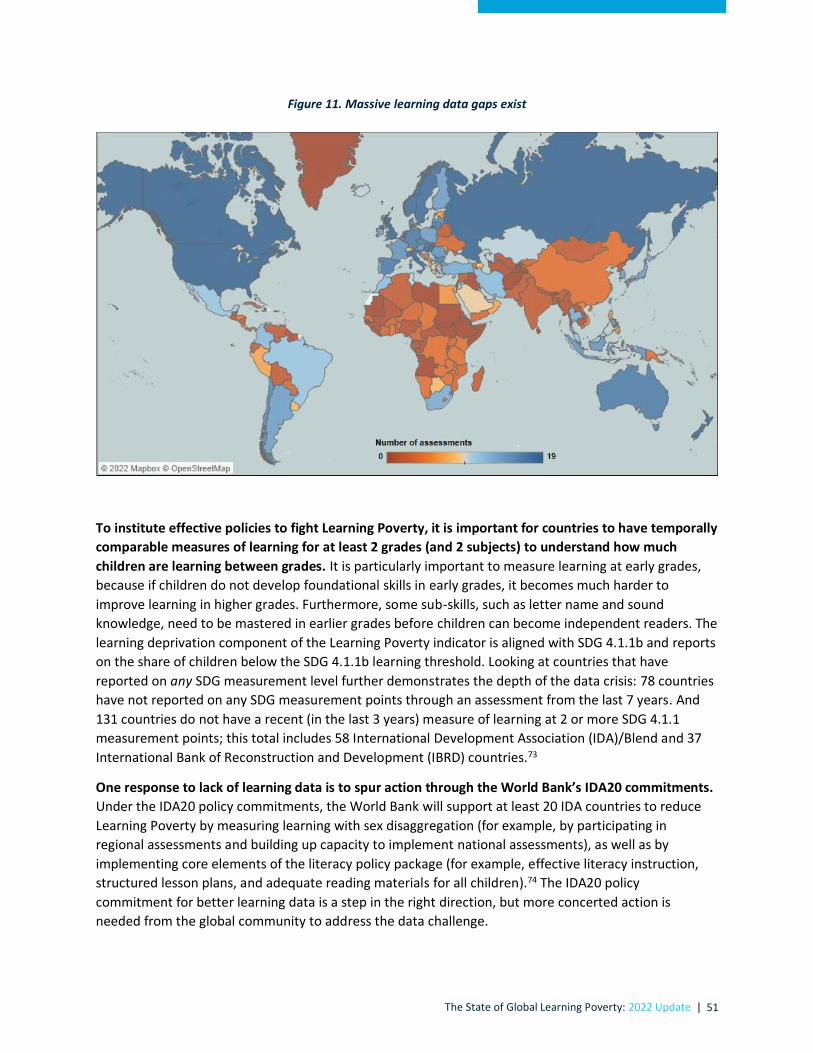
51 The State of Global Learning Poverty: 2022 Update |
Figure 11. Massive learning data gaps exist
To institute effective policies to fight Learning Poverty, it is important for countries to have temporally
comparable measures of learning for at least 2 grades (and 2 subjects) to understand how much
children are learning between grades. It is particularly important to measure learning at early grades,
because if children do not develop foundational skills in early grades, it becomes much harder to
improve learning in higher grades. Furthermore, some sub-skills, such as letter name and sound
knowledge, need to be mastered in earlier grades before children can become independent readers. The
learning deprivation component of the Learning Poverty indicator is aligned with SDG 4.1.1b and reports
on the share of children below the SDG 4.1.1b learning threshold. Looking at countries that have
reported on any SDG measurement level further demonstrates the depth of the data crisis: 78 countries
have not reported on any SDG measurement points through an assessment from the last 7 years. And
131 countries do not have a recent (in the last 3 years) measure of learning at 2 or more SDG 4.1.1
measurement points; this total includes 58 International Development Association (IDA)/Blend and 37
International Bank of Reconstruction and Development (IBRD) countries.73
One response to lack of learning data is to spur action through the World Bank’s IDA20 commitments.
Under the IDA20 policy commitments, the World Bank will support at least 20 IDA countries to reduce
Learning Poverty by measuring learning with sex disaggregation (for example, by participating in
regional assessments and building up capacity to implement national assessments), as well as by
implementing core elements of the literacy policy package (for example, effective literacy instruction,
structured lesson plans, and adequate reading materials for all children).74 The IDA20 policy
commitment for better learning data is a step in the right direction, but more concerted action is
needed from the global community to address the data challenge.

52 The State of Global Learning Poverty: 2022 Update |
Better indicators are needed to fight learning poverty
Education systems often have multiple goals, such as improving learning, increasing school access,
improving economic opportunities, and increasing female labor force participation, to name a few.
Multidimensional indicators such as Learning Poverty can help bring alignment across these multiple
objectives of the education system. For example, the Learning Poverty indicator helps capture various
critical dimensions of education system goals—learning outcomes, schooling (access and age-grade
distortions), and learning inequality, whether between groups (for example, by gender) and within
groups (for example, among children below the minimum proficiency threshold as captured through the
Learning Poverty Severity indicator, described in greater detail below).
The Learning Poverty indicator matters even more in the context of COVID-19. Both of the key
dimensions of the Learning Poverty indicator—schooling and learning—have been affected by COVID-19
shocks. As documented in the UNESCO, UNICEF, and World Bank State of the Global Education Crisis
report75, students have been experiencing learning losses across a range of contexts, from low- to high-
income.
These learning and enrollment shocks could have opposite effects on Learning Deprivation, the
percent of children below the minimum proficiency threshold at the end of primary. For example,
learning losses due to COVID-19 school closures may increase the percent of children below the
minimum proficiency threshold, and cause the average Learning Deprivation rate to go up. However, if
at the same time, there is increased dropout among the lowest-performing children below the minimum
proficiency threshold, whether due to prolonged school closures or to the economic impacts of the
crisis, the average Learning Deprivation rate (defined as it is among children in school) could fall. Given
these opposite impacts, the average Learning Deprivation rate may appear to stay constant, while
children may be facing acute learning losses and increased dropout, and increased Learning Poverty.
Understanding the direction of these effects through the Learning Poverty indicator and its key sub-
components (Schooling Deprivation and Learning Deprivation) is critical to inform policy action to
protect children from the negative schooling and learning impacts of the crisis. This is important given
that some of the impacts of the crisis are showing up as large learning losses for enrolled children, as
well as through lower enrollment rates. We need detailed and nuanced policy responses to guide action
to keep children in school and to recover and accelerate learning.
Some recent analysis suggests that learning losses are concentrated among poor students, as
documented in the Netherlands, Italy, United States, Mexico, Bangladesh, and Ghana.76 Children from
poorer households are more likely to be below the minimum proficiency threshold. Learning Poverty
focuses on children below the minimum proficiency threshold. This is important because in many
countries, most children are below the minimum threshold, and their experience is unlikely to be
captured well by measures that only look at the share of children above the minimum proficiency
threshold. Even with rapid gains, many of these below-threshold children will not rise above the
threshold. Therefore, there is a need to complement the Learning Poverty measure with other
indicators that capture in more detail the learning needs of children below the minimum threshold.
Measures such as the Learning Poverty Gap or Learning Poverty Severity can help understand the
learning needs of children below the minimum threshold. For example, the Learning Poverty Gap helps
show how far students are behind the minimum proficiency level on average. Countries with a large
Learning Poverty Gap will need to direct more resources and efforts targeted specifically at children at

53 The State of Global Learning Poverty: 2022 Update |
the bottom. This can be done through facilitating structured pedagogy methods in classrooms so that
teachers can better address the complex and interweaving learning gaps experienced by students at the
bottom. The Learning Poverty Gap indicator allows a policy focus on sub-skills, such as mastering letter
names and sounds, that are essential for children to acquire to become proficient readers. Learning
Poverty Severity helps indicate the inequality of learning among children below the threshold. Countries
experiencing high Learning Poverty Severity will need to adopt a sharp focus on addressing learning
inequality among children at the bottom through tailored and targeted instruction. This can be done
through adapting teaching to the level and needs of the children. These complementary measures can
help unveil important differences among countries or regions with similar levels of learning poverty, and
can indicate the amount of effort required (Figure 12a) to tackle the challenge, as well its complexity
(Figure 12b).77
Figure 12 Learning Poverty, Learning Poverty Gap, and Learning Poverty Severity by regions
(a) Regions with similar levels of learning poverty
might have very different levels of learning poverty
depth, as measured by the learning poverty gap.
(b) Regions with similar learning poverty gaps might
have very different levels of learning poverty inequality
among the learning-poor, as measured by the learning
poverty severity.
Note: Definitions of learning poverty, learning poverty gap and learning poverty severity can be found in Box 1. Learning poverty gap and
learning poverty severity results can be found in Annexs 6 and 7.
Global (Low- and Middle-income
countries only)
East Asia and
Pacific
Europe and
Central Asia
Latin America
and Caribbean
Middle East and
North Africa
South Asia
Sub-Saharan
Africa
0%
5%
10%
15%
20%
25%
30%
0 20 40 60 80 100
Lear
nin
g P
ove
rty
Gap
Learning Poverty
Global (Low- and Middle-income
countries only)
East Asia and Pacific
Europe and
Central Asia
Latin America
and Caribbean
Middle East and
North Africa
South Asia
Sub-Saharan
Africa
0%
5%
10%
15%
20%
25%
0% 10% 20% 30%
Lear
nin
g P
ove
rty
Seve
rity
Learning Poverty Gap

54 The State of Global Learning Poverty: 2022 Update |
International coalitions for learning can support and be supported by better data and indicators
Ending the learning data gaps is a pre-requisite to ending Learning Poverty. International coalitions can
and should support better learning data and indicators. Initiatives such as the Learning Data Compact
are an excellent effort to foster better coordination among different actors involved with data
production and use.78 A key aim of the Compact is to ensure that all countries, especially low-income
countries, have at least one quality measure of foundational learning by 2025 and two by 2030. Through
better coordination, it is possible to avoid duplication of efforts and resources, and ensure that
resources are directed towards the production and use of timely and actionable learning data. This is
critical to ensure that we not only recover COVID-19 learning losses, but also accelerate learning to
ensure that all children get a good education.

55 The State of Global Learning Poverty: 2022 Update |
Conclusion: the urgency for learning recovery and acceleration
This report shows that the global learning poverty rate is even higher than previously thought: an
estimated 7 of every 10 children in low- and middle-income countries now suffer from learning
poverty, meaning that they cannot read a simple text with comprehension by age 10. New data shows
that in 2019, before the pandemic hit, the learning poverty rate was already 57 percent in low- and
middle-income countries, and that in Sub-Saharan Africa it reached 86 percent. Moreover, global
progress against learning poverty had already stalled. Since then, the COVID-driven school disruptions
have sharply increased learning poverty, to an estimated 70 percent today. The increases have been
especially large in South Asia and in Latin America and the Caribbean, the regions where schools have
been closed the longest.
Concerted action against learning poverty is urgently needed now—both to recover learning and to
accelerate it in countries that already suffered from very high learning poverty. There will be nothing
automatic about learning recovery, let alone acceleration. Just reopening schools is not enough, and
pre-pandemic business as usual will not heal the scars of the pandemic. First, many children have lost or
never acquired the foundations—especially literacy, numeracy, and core socioemotional skills—needed
for further learning. If they return to classrooms where they are taught using pre-pandemic curricula
that assume these foundations, many will flounder. As a result, learning inequalities that widened
during the pandemic could become permanent. Systems will need better strategies, bolstered by
additional financing, that are designed to promote recovery quickly. Second, even if systems do manage
to return to the pre-pandemic status quo of 2019, with its 57 percent rate of learning poverty, that will
not be enough. The stagnation of global progress since 2015 shows that education systems were not
successful in reducing learning poverty. To provide opportunity for all children, this has to change—and
change will require both technical and political advances.
The most important factor is national political commitment and the domestic coalitions for learning.
Learning poverty will fall only with sufficient society-wide commitment to foundational learning for all
children. This requires political leaders who are willing to highlight the challenge and set serious targets
for solving it; education systems that monitor learning and its drivers; teachers and other educators who
contribute to and agree with the plan for moving forward; civil society and business groups that push
politicians to prioritize foundational learning for all; and households who are engaged and supported in
helping their children learn. National commitments to education require that all actors align in the
design and implementation of reforms with the sole objective of improving children’s and youth
education and wellbeing. It is not the positions or interests of political parties or unions, nor the interest
of suppliers, vendors or providers, or any other education stakeholders that should matter, but only the
interests of students. With coalitions like these, solving the learning crisis becomes possible.
From a technical perspective, the RAPID framework offers evidence-based actions in five policy areas
that countries can use to promote learning recovery and acceleration, starting in the short term.
These actions build on proven innovations from around the world. But they are very different from what
many education systems do under business as usual, so meaningful learning recovery and acceleration
will require focused, intentional change at scale. The policies included in the RAPID framework are all

56 The State of Global Learning Poverty: 2022 Update |
selected because they can begin delivering results in the short term; they do not require well-developed
education systems. The good news is that, once countries have implemented these changes, they will
find that most of the same RAPID policies will also reduce learning poverty over the longer term.
A global coalition can support these national efforts, which is why our six organizations are working
together so closely on the agenda of foundational learning. This coalition is advancing on various
fronts. First, we are speaking with one voice on vital importance of foundational skills to the SDGs.
Learning poverty is one key indicator of this, but it stands in for a broader set of foundational skills that
all children need for further education, employment, and citizenship. Second, we have committed to
solving the learning data crisis, because countries cannot improve what they do not measure. Third, we
all support evidence and analysis on how to promote foundational learning for all children. Evidence on
what works for learning recovery and acceleration, and in what contexts, will continue to grow in the
months and years ahead, and our organizations are committed to learning from countries’ innovations
and sharing the lessons.79 Fourth, for a set of countries who are showing real commitment to prioritize
the reduction of learning poverty, we provide support in all these areas, accompanied by financing.80
To accelerate long-term progress against learning poverty, it is crucial to sustain these approaches
beyond the immediate recovery and acceleration period and couple them with key structural reforms.
To recover learning losses, countries must put children on an accelerated learning trajectory to bring
children back to pre-pandemic levels. But that is not enough, given how poor pre-pandemic levels and
trajectories were. There is an opportunity now to use learning recovery as a springboard for longer-term
learning acceleration, and that opportunity must not be missed. Seizing it requires strong, sustained
political commitment and ambitious action, founded on the understanding that any deficit in
foundational learning is unacceptable. Sustained longer-term acceleration will require more structural
reforms to strengthen education systems. These include, for example, defining a clear path to ensuring a
professionalized teaching career and ongoing teacher support, providing well-designed textbooks and
teaching and learning materials for all, closing the digital divide, ensuring that schools are safe and
inclusive, and investing in managing schools and the system in a professional way that focuses
relentlessly on improving education outcomes.
Big challenges call for even greater commitment and greater effort, not acquiescence. The high levels
of learning poverty violate children’s right to education. After all the hard work by so many families and
educators to provide education for all, it is unacceptable that less than one-third of children in low- and
middle-income countries are now enrolled in school and reading with comprehension at a minimally
acceptable level. The high trust that families have placed in education by ensuring 90 percent
enrollment at primary level is not being rewarded with adequate learning outcomes, and this could
undermine future trust and investment in education. Saving the futures of children and youth—and of
their societies—demands healing the wounds inflicted by the pandemic, starting with ensuring that
education systems can support children to acquire foundational skills. And that is not enough:
collectively we need to build on that short-term learning recovery to take on the learning crisis that
predated COVID-19. This can serve as a strong foundation for a reimagined education system—one that
is inclusive, resilient, and effective, helping all children fully develop their potential. This future is the
one our children and youth deserve.

57 The State of Global Learning Poverty: 2022 Update |
References
Alderman, Harold, John Hoddinott, and Bill Kinsey. 2006. “Long Term Consequences of Early Childhood Malnutrition.” Oxford Economic Papers 58 (3): 450–74. doi:10.1093/oep/gpl008
Andrabi, Tahir, Benjamin Daniels, and Jishnu Das. 2020. “Human Capital Accumulation and Disasters: Evidence from the Pakistan Earthquake of 2005.” Journal of Human Resources, 0520. doi:10.3368/jhr.59.2.0520-10887R1
Angrist, Noam, Andreas de Barros, Radhika Bhula, Shiraz Chakera, Chris Cummiskey, Joseph DeStefano, John Floretta, Michelle Kaffenberger, Benjamin Piper, and Jonathan Stern. 2021. “Building Back Better to Avert a Learning Catastrophe: Estimating Learning Loss from COVID-19 School Shutdowns in Africa and Facilitating Short-Term and Long-Term Learning Recovery.” International Journal of Educational Development 84 (July): 102397. doi:10.1016/j.ijedudev.2021.102397
Ardington, Cally, Gabrielle Willis, and Janeli Kotze. 2021. “COVID-19 Learning Losses: Early Grade Reading in South Africa.” International Journal of Educational Development, August, 102480. doi:10.1016/j.ijedudev.2021.102480
Azevedo, João Pedro. 2020. Learning Poverty : Measures and Simulations. Policy Research Working Paper No. 9446. World Bank, Washington, DC http://hdl.handle.net/10986/34654
Azevedo, João Pedro, Maryam Akmal, Marie-Helene Cloutier, and Yi Ning Wong. 2022. “Covid-19 Learning Loss Simulations: Global Update.” World Bank, Policy Research Working Paper.
Azevedo, João Pedro, Amer Hasan, Diana Goldemberg, Koen Geven, Syedah Aroob Iqbal, Simulating the Potential Impacts of COVID-19 School Closures on Schooling and Learning Outcomes: A Set of Global Estimates, The World Bank Research Observer, Volume 36, Issue 1, February 2021, Pages 1–40, https://doi.org/10.1093/wbro/lkab003
Azevedo, João Pedro, Diana Goldemberg, Silvia Montoya, Reema Nayar, Halsey Rogers, Jaime Saavedra, and Brian William Stacy. 2021. “Will Every Child Be Able to Read by 2030? Defining Learning Poverty and Mapping the Dimensions of the Challenge.” Working Paper. Washington, DC: World Bank. doi:10.1596/1813-9450-9588
Azevedo, João Pedro, Gabriel Demombynes and Yi Ning Wong. 2022. Why Has the Pandemic Not Sparked More Concern for Learning Losses in Latin America?. World Bank Blog (forthcoming).
Bandiera, Oriana, Niklas Buehren, Markus Goldstein, Imran Rasul and Andrea Smurra. 2019. “The Economic Lives of Young Women in the Time of Ebola: Lessons from an Empowerment Program.” World Bank Policy Research Working Paper 8760. Available online at http://documents.worldbank.org/curated/en/452451551361923106/pdf/WPS8760.pdf
Béteille, Tara, Elaine Ding, Ezequiel Molina, Adelle Pushparatnam, and Tracy Wilichowski. 2020. “Three Principles to Support Teacher Effectiveness During Covid-19.” https://documents1.worldbank.org/curated/en/331951589903056125/pdf/Three-Principles-to-Support-Teacher-Effectiveness-During-COVID-19.pdf

58 The State of Global Learning Poverty: 2022 Update |
Buffie, Edward, Christopher Adam, Luis-Felipe Zanna, and Kangni Kpodar. 2022. “Loss-of-Learning and the Post-Covid Recovery in Low-Income Countries,” IMG Working Papers No. 22/25, . https://www.elibrary.imf.org/downloadpdf/journals/001/2022/025/001.2022.issue-025-en.xml
Bulat, Jannae. 2020. “Evaluating the Use of Radios to Promote Learning in Liberia During COVID-19 | SharEd.” https://shared.rti.org/content/evaluating-use-radios-promote-learning-liberia-during-covid-19
CONFEMEN. 2014. “PASEC 2014 Education System Performance in Francophone Sub-Saharan Africa.” https://www.pasec.confemen.org/wp-content/uploads/2015/12/Rapport_Pasec2014_GB_webv2.pdf
———. 2019. “PASEC 2019 Education System Quality in Francophone Sub-Saharan Africa.” http://www.pasec.confemen.org/wp-content/uploads/2021/01/RapportPasec2019_sitePasec.pdf
Crawfurd, Lee, Susannah Hares, and Ana Luiza Minardi. 2021. “New Data on Learning Loss in Pakistan.” Center For Global Development. May 11. https://www.cgdev.org/blog/new-data-learning-loss-pakistan
Crawfurd, Lee, Susannah Hares, Ana Minardi, and Justin Sandefur. 2021. "Understanding Education Policy Preferences: Survey Experiments with Policymakers in 35 Developing Countries." Center for Global Development Working Paper 596.
Crouch, Luis. 2020. “Systems Implications forCore Instructional Support from Sobral (Brazil), Puebla (Mexico), and Kenya.” RISE. https://riseprogramme.org/sites/default/files/publications/20200708_RISE%20Insight%202020_20_Crouch_Systems.pdf
Donnelly, Robin, and Harry Anthony Patrinos. 2021. “Learning Loss during Covid-19: An Early Systematic Review.” Prospects, November, 1–9. doi:10.1007/s11125-021-09582-6
Global Education Evidence Advisory Panel. 2020. “Cost-Effective Approaches to Improve Global Learning.” https://documents1.worldbank.org/curated/en/719211603835247448/pdf/Cost-Effective-Approaches-to-Improve-Global-Learning-What-Does-Recent-Evidence-Tell-Us-Are-Smart-Buys-for-Improving-Learning-in-Low-and-Middle-Income-Countries.pdf
———. 2022. “Prioritizing Learning during COVID-19 : The Most Effective Ways to Keep Children Learning during and Post-Pandemic.” Text/HTML. https://documents.worldbank.org/en/publication/documents-reports/documentdetail/114361643124941686/Recommendations-of-the-Global-Education-Evidence-Advisory-Panel
Gibbs, Lisa, Jane Nursey, Janette Cook, Greg Ireton, Nathan Alkemade, Michelle Roberts, H. Colin Gallagher, et al. 2019. “Delayed Disaster Impacts on Academic Performance of Primary School Children.” Child Development 90 (4): 1402–12. doi:10.1111/cdev.13200
Gobierno del Estado de Guanajuanto. 2021. “Inicia Aplicación de RIMA; Evaluación Estandarizada Que Coloca a Guanajuato Como Referente.” November 21.

59 The State of Global Learning Poverty: 2022 Update |
https://boletines.guanajuato.gob.mx/2021/11/29/inicia-aplicacion-de-rima-evaluacion-estandarizada-que-coloca-a-guanajuato-como-referente/
Gust, Sarah, Eric Hanushek, and Ludger Woessmann. Forthcoming. “Global Universal Basic Skills: Current State and Implications for World Development.” Finance and Development, IMF
Hanushek, Eric A., Guido Schwerdt, Simon Wiederhold, and Ludger Woessmann. 2013. “Returns to Skills around the World: Evidence from PIAAC.” Working Paper 19762. National Bureau of Economic Research. doi:10.3386/w19762
Hevia, Felipe J., Samana Vergara-Lope Tristan, Anabel Velásquez-Durán, and David Calderón Martín del Campo. 2021. “Estimation of the Fundamental Learning Loss and Learning Poverty Related to COVID-19 Pandemic in Mexico.” International Journal of Educational Development, November, 102515. doi:10.1016/j.ijedudev.2021.102515
IEA. 2019. “IEA TIMSS 2019.” https://www.iea.nl/studies/iea/timss/2019
Josephson, Anna, Talip Kilic, and Jeffrey D. Michler. 2020. “Socioeconomic Impacts of COVID-19 in Four African Countries.” Working Paper. Washington, DC: World Bank. doi:10.1596/1813-9450-9466
Meinck, Sabine, Julian Fraillon, and Rolf Strietholt, eds. 2022. “The Impact of the COVID-19 Pandemic on Education: International Evidence from the Responses to Educational Disruption Survey (REDS).” UNESCO. https://unesdoc.unesco.org/ark:/48223/pf0000380398
Meyers, Keith, and Melissa A. Thomasson. 2017. “Paralyzed by Panic: Measuring the Effect of School Closures during the 1916 Polio Pandemic on Educational Attainment.” 23890. NBER Working Papers. National Bureau of Economic Research, Inc. https://ideas.repec.org/p/nbr/nberwo/23890.html
Ministry of Education and Culture, Indonesia. n.d. “Assessment and Learning Center - Ministry of Education and Culture.” https://pusmenjar.kemdikbud.go.id/
Modern Ghana News. 2021. “GES Trains Taskforce to Ensure Students Return to School.” Modern Ghana News, December 1. https://www.modernghana.com/news/1054898/ges-trains-taskforce-to-ensure-students-return.html
Moscoviz, Laura, and David K. Evans. 2022. “Learning Loss and Student Dropouts during the COVID-19 Pandemic: A Review of the Evidence Two Years after Schools Shut Down.” https://www.cgdev.org/publication/learning-loss-and-student-dropouts-during-covid-19-pandemic-review-evidence-two-years
Montoya, Silvia, and Manos Antoninis. 2020. “Benchmarks for the SDG 4 Indicators: A political and technical basis for discussion.” 7th meeting for the TCG (27-29 October 2020). UNESCO.
Munoz-Najar, Alberto, Alison Gilberto, Amer Hasan, Cristobal Cobo, Joao Pedro Azevedo, and Maryam Akmal. 2021. “Remote Learning During COVID-19: Lessons from Today, Principles for Tomorrow.” Washington, DC: World Bank. https://openknowledge.worldbank.org/handle/10986/36665
Peterman, Amber, Alina Potts, Megan O’Donnell, Kelly Thompson, Niyati Shah, Sabine Oertelt-Prigione, and Nicole van Gelder. 2020. “Pandemics and Violence Against Women and Children.” CGD Working

60 The State of Global Learning Poverty: 2022 Update |
Paper 528. Washington, DC: Center for Global Development. https://www.cgdev.org/publication/ pandemics-and-violence-against-women-and-children
Risso-Gill, Isabelle, and Leah Finnegan. 2015. Children’s Ebola Recovery Assessment: Sierra Leone. Save the Children, World Vision International and Plan International and UNICEF
Saavedra Chanduvi, Jaime, Christian Aedo Inostroza, Omar S. Arias Diaz, Adelle Pushparatnam, Marcela Gutierrez Bernal, and Halsey Rogers. 2020. “Realizing the Future of Learning : From Learning Poverty to Learning for Everyone, Everywhere.” Text/HTML. Washington, DC.: World Bank. https://documents.worldbank.org/en/publication/documents-reports/documentdetail
SEA-PLM. 2019. “SEA-PLM 2019.” https://www.seaplm.org/
SEDUC-SP. 2021. “Legislação - Central de Atendimento.” http://www.educacao.sp.gov.br/lise/sislegis/pesqorient.asp?ano=2021
Storey, Nathan, and Qiyang Zhang. 2021. “A Meta-Analysis of COVID Learning Loss.” Preprint. EdArXiv. doi:10.35542/osf.io/qekw2
TIMSS. 2015. “TIMSS 2015 International Reports.” https://timss2015.org/#/?playlistId=0&videoId=0
———. 2019. “About TIMSS 2019.” https://timssandpirls.bc.edu/timss2019/
UNESCO. 2021a. “Uneven Global Education Stimulus Risks Widening Learning Disparities.” https://unesdoc.unesco.org/ark:/48223/pf0000379350
UNESCO. 2021b. “UNESCO COVID-19 Education Response: Education Sector Issue Notes.” 7.4. https://unesdoc.unesco.org/ark:/48223/pf0000377841/PDF/377841eng.pdf.multi
UNESCO, UNICEF, World Bank, and OECD. 2021a. “What’s Next? Lessons on Education Recovery: Findings from a Survey of Ministries of Education amid the COVID-19 Pandemic.” Washington, DC: World Bank. https://openknowledge.worldbank.org/handle/10986/36393
UNESCO, UNICEF, World Bank, and OECD. 2021b. “Global Education Monitoring Report (GEM).” https://en.unesco.org/gem-report/taxonomy/term/238
UNESCO Institute for Statistics (UIS). 2019. “New Methodology Shows That 258 Million Children, Adolescents and Youth Are Out of School.” UIS/2019/ED/FS/56. Fact Sheet No. 56.
———. 2021. “SDG 4 Data Digest 2021 National SDG 4 benchmarks: Fulfilling our neglected commitment”. Paris and Montreal: UNESCO.
———. 2022. “COVID-19 in Sub-Saharan Africa: Monitoring Impacts on Learning Outcomes”. Paris and Montreal: UNESCO.
UNESCO Institute for Statistics (UIS) and Global Education Monitoring Report (GEMR). 2022. "Setting commitments—Countries’ national SDG 4 benchmarks." Paris: UNESCO. July 7th, in press.

61 The State of Global Learning Poverty: 2022 Update |
UNICEF, UNESCO, and World Bank. 2022. “Where Are We on Education Recovery?” UNICEF. https://www.unicef.org/media/117626/file/Where%20are%20we%20in%20Education%20Recovery?.pdf
Valerio, Alexandria, Maria Laura Sanchez Puerta, Namrata Tognatta, and Sebastian Monroy-Taborda. 2016. “Are There Skills Payoffs in Low- and Middle-Income Countries?: Empirical Evidence Using STEP Data.” Working Paper. Washington, DC: World Bank. doi:10.1596/1813-9450-7879
World Bank. n.d. “World Bank Country and Lending Groups – World Bank Data Help Desk.” https://datahelpdesk.worldbank.org/knowledgebase/articles/906519-world-bank-country-and-lending-groups
———. 2018. “World Development Report 2018: Learning to Realize Education’s Promise.” Washington, DC: World Bank. https://www.worldbank.org/en/publication/wdr2018
———. 2019. “Ending Learning Poverty: What Will It Take?” Washington, DC: World Bank. https://openknowledge.worldbank.org/handle/10986/32553
———. 2022a. “Lebanon Emergency Crisis and COVID-19 Response Social Safety Net Project Page.” Washington, DC: World Bank. https://projects.worldbank.org/en/projects-operations/document-detail/P173367?type=projects
———. 2022b. “Building Back Better from the Crisis: Toward a Green, Resilient and Inclusive Future.” Washington, DC: World Bank. https://documents1.worldbank.org/curated/en/163861645554924417/pdf/IDA20-Building-Back-Better-from-the-Crisis-Toward-a-Green-Resilient-and-Inclusive-Future.pdf
———. 2022c. “Learning Data Compact – UNESCO, UNICEF, and the World Bank Unite to End the Learning Data Crisis.” Washington, DC: World Bank. https://www.worldbank.org/en/news/factsheet/2021/06/30/learning-data-compact-unesco-unicef-and-the-world-bank-unite-to-end-the-learning-data-crisis
World Bank, UNESCO, and UNICEF. 2021. “The State of the Global Education Crisis: A Path to Recovery.” https://documents.worldbank.org/en/publication/documents-reports/documentdetail/416991638768297704/The-State-of-the-Global-Education-Crisis-A-Path-to-Recovery
World Bank, the Bill & Melinda Gates Foundation, FCDO, UNESCO, UNICEF, and USAID. 2022. Guide for
Learning Recovery and Acceleration: Using the RAPID Framework to Address COVID-19 Learning
Losses and Build Forward Better. Washington, DC: World Bank.
https://www.worldbank.org/en/topic/education/publication/the-rapid-framework-and-a-guide-for-
learning-recovery-and-acceleration

62 The State of Global Learning Poverty: 2022 Update |
Annexes
Annex 1: List of new international and regional assessments used in the learning poverty update
TIMSS 2019
TIMSS 2019 is an international assessment covering 64 countries and 8 benchmarking systems in multiple regions across the world.81 The 2015 round covered 57 countries.82 TIMSS tests children in mathematics and science in grades 4 and 8. We use results for grade 4 science for calculating learning poverty measures.1 The field work for the assessment started in 2018 and ended in 2019.83 We use TIMSS 2019 results for calculating learning poverty measures for 11 countries in the June 2022 release: Albania, Armenia, Chile, Croatia, Cyprus, Japan, Korea Rep, Montenegro, North Macedonia, Serbia, and Turkey.
SEA-PLM 2019
SEA-PLM 2019 is a regional assessment covering 6 countries in Southeast Asia. It tests children in the subjects of reading, writing, mathematics, and global citizenship in grade 5.84 We use results for grade 5 reading for calculating learning poverty measures. The field work for the assessment started in 2019 and ended in 2019.85 The first round of the assessment done in 2019 is used for the learning poverty update. We use SEA-PLM 2019 results for calculating learning poverty measures for 6 countries in the June 2022 release: Cambodia, Lao PDR, Malaysia, Myanmar, Philippines, and Vietnam.
PASEC 2019
PASEC 2019 is a regional assessment covering 14 countries in Sub-Saharan Africa. The 2014 round covered 10 countries.86 PASEC tests children in the subjects of language, mathematics, and reading in grades 2 and 6.87 We use results for grade 6 reading for calculating learning poverty measures. The field work for the assessment started in 2018 and ended in 2019.88 We use PASEC 2019 results for calculating learning poverty measures for 14 countries in the June 2022 release: Benin, Burkina Faso, Burundi, Cameroon, Chad, Congo Dem Rep, Congo Rep, Cote d’Ivoire, Gabon, Guinea, Madagascar, Niger, Senegal, and Togo.
LLECE 2019
LLECE 2019 is a regional assessment covering 16 countries in Latin America. The 2013 round, also known as TERCE was carried out in 15 countries. Results of LLECE 2013 were reported on two scales: the then, newly established, TERCE scale, and a scale compatible with the previous round, SERCE, used primarily for historical comparability. For reporting on Learning Poverty, UNESCO and the World Bank chose to use LLECE 2019 results expressed on the SERCE scale, which defined the minimum proficiency level as those students reaching Level 3 in language (or a score above 514 points). We use LLECE 2019 (SERCE scale) results for calculating learning poverty measures for 15 countries in the June 2022 release: Argentina, Brazil, Colombia, Costa Rica, Dominican Republic, Ecuador, El Salvador, Guatemala, Honduras, Mexico, Nicaragua, Panama, Paraguay, Peru, and Uruguay.
AMPL-b 2021
The MILO (Monitoring Impacts on Learning Outcomes) initiative has allowed countries to measure the impact of COVID-19 on learning while also allowing reporting against SDG 4.1.1b benchmarks through the Assessments for Minimum Proficiency Levels for SDG 4.1.1b (AMPL-b) tests.89 The assessment material was derived from the UIS’s Global Item Bank, which is a shared repository of assessment questions for reading and math, and follows closely the Global Proficiency Framework benchmarks agreed by countries and development partners as part of SDG 4.1.1 monitoring. National assessments also have the option of integrating comparable testlets in their instruments. We use AMPL-b 2021 results for calculating learning poverty measures for Zambia in the June 2022 release.

63 The State of Global Learning Poverty: 2022 Update |
Annex 2. COVID-19 Learning Loss Simulation Analytical Framework
The analytical framework underlying the simulations presented in this paper is largely the same as in
Azevedo et al. (2021), with one important extension – the new model allow for systems to be partially
closed, something that the previous model did not account for. We can conceptualize that the current
cohort of students is observed just before the crisis and during the crisis. We assume that for a given
level of education quality, a student’s learning is linear relative to the amount of time spent at school.
The length of school closures, assuming no mitigation, will reduce the amount of time students will be
exposed to learning opportunities. The learning loss will be due to two effects: (1) If schools close
between two time periods without mitigation, learning is not expected to progress, and (2) As students
disengage from the educational system, part of the student's stock of learning will be forgotten. The
learning loss due to each of these mechanisms will depend on mitigation effectiveness.
Furthermore, the income shock from reduced economic activity due to COVID-19 may increase
dropouts. The income shock may lead to more families pulling their children out of school to work, or
because they cannot afford schooling. Therefore, we can expect that some of the learning loss will take
place in terms of the total quantity of education that students are expected to receive throughout their
school life.
Figure A2.1. Pathways of learning loss and simulation parameters
Annex 3. Key simulation assumptions
We model different scenarios (optimistic, intermediate, pessimistic) using the following key
assumptions:
• School productivity. School productivity (or expected learning gain) refers to how much students are expected to learn while in school. These calculations are based on the literature on school productivity, unexpected school closures, and summer learning loss. Learning gains (in Harmonized Learning Outcomes points per year) vary depending on the income level of the country—50 points for high-income, 40 for upper-middle-income, 30 for lower-middle-income, and 20 for low-income countries (on a scale where the standard deviation is 100) and do not vary by simulation scenario. Learning gains for Learning Poverty are adjusted by their assessment-specific standard deviation.

64 The State of Global Learning Poverty: 2022 Update |
• Income shocks’ impact on enrollments. Simulations also partially capture the (much smaller) potential cumulative effects of household income shocks over the past two years on student school enrollment in primary education. This effect is negligible because evidence from both before and during COVID shows that at the primary-school level, income shocks typically have small effects on enrollment.90 This component varies across countries based on country-specific enrollment-income elasticities and growth projections and remain constant across scenarios.
• School closures. We use country-specific data on the length of school closures from the UNESCO tracker, which categorizes systems as fully closed, partially closed, fully open, and on scheduled breaks. This parameter varies by countries and does not vary by simulation scenario.
• Partial school closures. Share of the school system partially closed varies both temporally and spatially in the model. Temporally, we have information about whether schools were fully or partially closed in each country each week, from the UNESCO tracker. Spatially, however, most countries were not able to properly monitor school status by geographic location or by grades in details. Therefore, in the simulations we incorporate this country-specific temporal information from the UNESCO tracker in the scenarios, and we combine it with the assumption that partial closures affect 75%, 85%, or 100% of students, depending on the scenario.
• Mitigation effectiveness. Mitigation effectiveness is measured on a scale between 0% and 100%. Mitigation effectiveness varies across scenarios based on the income level of the country. In no case do we expect the mitigation to be as effective as classroom instruction and to fully compensate losses from school closures. Mitigation effectiveness, 𝑚, conceptually brings together three elements:
o the government supply (or expected coverage) of alternative education modalities o the ability of households to access (or take up) these alternative modalities
o the effectiveness of the alternative modalities
Mitigation effectiveness varies by country-income level and scenario.
For each scenario, the simulation model generates measures of learning losses in terms of: Learning
Poverty, Harmonized Learning Outcomes (HLO), Learning Adjusted Years of Schooling (LAYS), Learning
Poverty Gap, Learning Poverty Severity, and PISA scores. The LAYS measure is also used to generate the
estimates reported in Part 1 on the present value of future earnings losses for the current generation of
children.

65 The State of Global Learning Poverty: 2022 Update |
Table A3.1 Global simulation parameters
Current Global Simulations
School productivity (in HLO points / year) in a regular school year
Varies by countries’ income level. Learning gains (in HLO points per year) vary depending on the income level of the country: 50 for high-income, 40 for upper-middle income, 30 for lower-middle income, and 20 for low-income countries (on a scale with the SD=100). They are the same across scenarios.
School closures Weekly country-specific data from UNESCO school closures tracker for February 2020 – February 2022. School status for each country is observed as either fully open, fully closed, partially closed, or on scheduled breaks.
Partial school closure
• Optimistic: Partial closures are assumed to affect 75% of the student population.
• Intermediate: Partial closures are assumed to affect 85% of the student population.
• Pessimistic: Partial closures are treated as full closures.
Mitigation Effectiveness
• Optimistic: Mitigation measures have a middle level of effectiveness (10% for LICs, 14% for LMICs, 20% for UMICs and 30% for HICs).
• Intermediate and Pessimistic: Mitigation measures have a low level of effectiveness (5% for LICS, 7% for LMICs, 10% for UMICs, 15% for HICs).
Income-enrollment elasticities Country-specific income-enrollment elasticities estimated using household surveys for primary and secondary school-age children separately.
Baseline Values
Global Learning Poverty Database from June 2022, updated from 2019 release of Learning Poverty . Includes PASEC 2019, TIMSS 2019, LLECE 2019, and new assessments, SEA-PLM 2019, and AMPL-b 2021 (Zambia), as well as NLAs from Lesotho with items to make it comparable to international surveys. The new Learning Poverty window for aggregate estimates is ±4 assessment years around 2019. There are some exceptions: Afghanistan, Kyrgyzstan, Lesotho, Pakistan, Tunisia, Uganda, and Yemen. Global HCI database from 2021.
Population Estimates for 2019 were used for aggregate calculations.
Length of period in calendar years 2
Economic projections Economic forecasts are from Global Economic Prospects (GEP) June 2021 (for 2020) and January 2022 (for 2021).
Note: Adapted from Azevedo et al (2022)
Scenarios Summary • Optimistic: Mitigation measures have a middle level of effectiveness (10% for LICs, 14% for LMICs, 20% for
UMICs and 30% for HICs). Partial closures are assumed to affect 75% of the student population.
• Intermediate: Mitigation measures have a low level of effectiveness (5% for LICS, 7% for LMICs, 10% for
UMICs 15% for HICs). Partial closures are assumed to affect 85% of the student population.
• Pessimistic: Mitigation measures have a low level of effectiveness (5% for LICS, 7% for LMICs, 10% for UMICs
15% for HICs). Partial closures are treated as full closures.

66 The State of Global Learning Poverty: 2022 Update |
Annex 4: Learning poverty by region and income level (2015 and 2019) and simulation results (2022)
2015 2019* 2022*
Optimistic Intermediate Pessimistic
World 48.0 51.9 62.4 64.3 65.5
Global (Low- and Middle-income countries only) 52.7 57.0 68.2 70.0 71.2
By Region (Low- and Middle-income countries only)
East Asia and Pacific 21.2 34.5 43.0 44.6 45.6
Europe and Central Asia 13.3 10.4 13.3 14.1 14.5
Latin America and Caribbean 50.8 52.3 74.9 79.0 81.1
Middle East and North Africa 63.3 63.4 69.1 70.0 70.5
South Asia 58.2 59.8 75.7 78.0 79.6
Sub-Saharan Africa 86.7 86.3 89.0 89.4 89.7
By Income Level
High-income 9.1 8.0 11.8 13.6 14.7
Upper-middle-income 30.3 29.4 41.0 43.1 44.2
Lower-middle-income 55.8 60.4 74.5 76.7 78.3
Low-income 89.5 90.6 91.6 91.7 91.8
Source: 2022 simulation results taken from Azevedo et al., 2022.
Annex 5: Detailed 2019 country learning poverty data
Country Name Learning Poverty
Learning Deprivation
Schooling Deprivation
Year of Assessment
Assessment
Afghanistan 93.4 87.0 49.6 2013 NLA
Albania 16.5 14.3 2.6 2019 TIMSS
Algeria 67.9 66.5 4.1 2007 TIMSS
American Samoa
None
Andorra
None
Angola
None
Antigua and Barbuda
None
Argentina 59.1 58.9 0.5 2019 LLECES
Armenia 27.2 19.9 9.2 2019 TIMSS
Aruba
None
Australia 8.6 5.5 3.2 2016 PIRLS
Austria 13.3 2.4 11.1 2016 PIRLS
Azerbaijan 23.3 19.2 5.0 2016 PIRLS
Bahamas, The
None
Bahrain 32.1 30.6 2.1 2016 PIRLS
Bangladesh 58.2 56.0 5.0 2017 NLA
Barbados
None
Belarus
None
Belgium 6.4 5.1 1.3 2016 PIRLS

67 The State of Global Learning Poverty: 2022 Update |
Belize 76.4 74.8 6.5 2001 PIRLS
Benin 55.8 54.5 2.8 2019 PASEC
Bermuda
None
Bhutan
None
Bolivia
None
Bosnia and Herzegovina
None
Botswana 50.8 44.3 11.7 2011 PIRLS
Brazil 46.9 45.6 2.4 2019 LLECES
British Virgin Islands
None
Brunei Darussalam
None
Bulgaria 15.2 5.2 10.5 2016 PIRLS
Burkina Faso 73.9 67.1 20.7 2019 PASEC
Burundi 95.8 95.5 6.6 2019 PASEC
Cabo Verde
None
Cambodia 90.0 89.0 9.3 2019 SEA-PLM
Cameroon 71.9 69.8 7.1 2019 PASEC
Canada 4.3 4.3 0.0 2016 PIRLS
Cayman Islands
None
Central African Republic
None
Chad 94.4 92.4 26.5 2019 PASEC
Channel Islands
None
Chile 27.2 23.2 5.2 2019 TIMSS
China 18.2 18.2 0.0 2016 NLA
Colombia 51.4 50.2 2.2 2019 LLECES
Comoros 86.0 82.3 20.8 2008 PASEC
Congo, Dem Rep 96.6 90.8 63.2 2019 PASEC
Congo, Rep 70.0 66.4 10.7 2019 PASEC
Costa Rica 34.0 33.3 1.1 2019 LLECES
Cote d'Ivoire 82.6 78.0 21.1 2019 PASEC
Croatia 4.5 2.5 2.0 2019 TIMSS
Cuba 27.9 25.1 3.8 2006 LLECES
Curacao
None
Cyprus 9.9 7.9 2.2 2019 TIMSS
Czech Republic 13.8 3.0 11.2 2016 PIRLS
Denmark 3.6 2.6 1.0 2016 PIRLS
Djibouti
None
Dominica
None
Dominican Republic 77.7 76.3 6.1 2019 LLECES
Ecuador 65.9 65.1 2.4 2019 LLECES
Egypt, Arab Rep 69.6 69.2 1.4 2016 PIRLS
El Salvador 69.1 62.1 18.4 2019 LLECES
Equatorial Guinea
None
Eritrea
None
Estonia
None
Eswatini
None
Ethiopia 90.4 88.7 14.8 2015 NLA

68 The State of Global Learning Poverty: 2022 Update |
Faroe Islands
None
Fiji
None
Finland 2.6 1.7 0.9 2016 PIRLS
France 6.9 6.3 0.6 2016 PIRLS
French Polynesia
None
Gabon 30.7 23.7 9.1 2019 PASEC
Gambia, The
None
Georgia 15.3 13.5 2.0 2016 PIRLS
Germany 14.4 5.5 9.4 2016 PIRLS
Ghana
None
Gibraltar
None
Greece 7.7 5.5 2.3 2001 PIRLS
Greenland
None
Grenada
None
Guam
None
Guatemala 78.5 75.9 10.8 2019 LLECES
Guinea 82.7 77.8 21.9 2019 PASEC
Guinea-Bissau
None
Guyana
None
Haiti
None
Honduras 79.3 74.3 19.5 2019 LLECES
Hong Kong SAR, China 4.2 1.4 2.8 2016 PIRLS
Hungary 5.9 2.9 3.1 2016 PIRLS
Iceland 9.3 6.8 2.7 2006 PIRLS
India 56.1 53.7 5.1 2017 NLA
Indonesia 52.8 49.4 6.8 2015 TIMSS
Iran, Islamic Rep 35.2 35.1 0.2 2016 PIRLS
Iraq
None
Ireland 2.3 2.3 0.0 2016 PIRLS
Isle of Man
None
Israel 11.7 9.0 2.9 2016 PIRLS
Italy 4.4 2.1 2.3 2016 PIRLS
Jamaica
None
Japan 3.6 1.8 1.8 2019 TIMSS
Jordan 62.5 50.0 25.1 2015 TIMSS
Kazakhstan 2.2 1.9 0.3 2016 PIRLS
Kenya
None
Kiribati
None
Korea, Dem People's Rep
None
Korea, Rep 3.2 0.8 2.5 2019 TIMSS
Kosovo
None
Kuwait 51.1 49.4 3.4 2016 PIRLS
Kyrgyz Republic 64.5 63.8 1.9 2014 NLA
Lao PDR 97.7 97.5 8.5 2019 SEA-PLM
Latvia 4.0 0.8 3.2 2016 PIRLS
Lebanon
None

69 The State of Global Learning Poverty: 2022 Update |
Lesotho 97.0 96.6 12.1 2014 NLA
Liberia
None
Libya
None
Liechtenstein
None
Lithuania 3.0 2.7 0.3 2016 PIRLS
Luxembourg 3.0 1.2 1.7 2006 PIRLS
Macao SAR, China 5.6 2.4 3.2 2016 PIRLS
Madagascar 93.9 93.7 3.1 2019 PASEC
Malawi
None
Malaysia 42.0 41.7 0.5 2019 SEA-PLM
Maldives
None
Mali 90.9 82.3 48.4 2002 PASEC
Malta 28.0 26.8 1.5 2016 PIRLS
Marshall Islands
None
Mauritania 94.8 92.9 25.8 2004 PASEC
Mauritius 40.5 38.0 4.0 2006 PASEC
Mexico 47.6 47.2 0.8 2019 LLECES
Micronesia, Fed Sts
None
Moldova 11.0 8.7 2.5 2006 PIRLS
Monaco
None
Mongolia 39.5 38.1 2.3 2007 TIMSS
Montenegro 27.1 24.7 3.1 2019 TIMSS
Morocco 64.9 63.8 3.1 2016 PIRLS
Mozambique
None
Myanmar 89.5 89.3 1.9 2019 SEA-PLM
Namibia
None
Nauru
None
Nepal
None
Netherlands 2.3 1.3 1.0 2016 PIRLS
New Caledonia
None
New Zealand 11.4 10.0 1.5 2016 PIRLS
Nicaragua 78.9 78.1 3.7 2019 LLECES
Niger 90.4 85.6 33.5 2019 PASEC
Nigeria
None
North Macedonia 40.9 38.2 4.3 2019 TIMSS
Northern Mariana Islands
None
Norway 6.0 5.8 0.2 2016 PIRLS
Oman 41.8 40.9 1.4 2016 PIRLS
Pakistan 77.0 65.0 34.2 2014 NLA
Palau
None
Panama 78.5 75.2 13.2 2019 LLECES
Papua New Guinea
None
Paraguay 77.7 74.7 12.2 2019 LLECES
Peru 44.4 43.6 1.5 2019 LLECES
Philippines 90.9 90.4 5.0 2019 SEA-PLM
Poland 4.8 2.0 2.8 2016 PIRLS

70 The State of Global Learning Poverty: 2022 Update |
Portugal 6.0 3.0 3.1 2016 PIRLS
Puerto Rico
None
Qatar 35.7 33.8 2.8 2016 PIRLS
Romania 17.9 14.1 4.4 2011 PIRLS
Russian Federation 3.5 0.9 2.7 2016 PIRLS
Rwanda
None
Samoa
None
San Marino
None
Sao Tome and Principe
None
Saudi Arabia 38.2 36.7 2.5 2016 PIRLS
Senegal 68.6 58.9 23.5 2019 PASEC
Serbia 9.8 8.2 1.8 2019 TIMSS
Seychelles
None
Sierra Leone
None
Singapore 2.8 2.7 0.0 2016 PIRLS
Sint Maarten (Dutch part)
None
Slovak Republic 23.2 6.6 17.8 2016 PIRLS
Slovenia 5.4 3.7 1.8 2016 PIRLS
Solomon Islands
None
Somalia
None
South Africa 78.9 77.9 4.4 2016 PIRLS
South Sudan
None
Spain 4.5 3.4 1.1 2016 PIRLS
Sri Lanka 14.8 14.0 0.9 2015 NLA
St Kitts and Nevis
None
St Lucia
None
St Martin (French part)
None
St Vincent and the Grenadines
None
Sudan
None
Suriname
None
Sweden 2.3 1.9 0.4 2016 PIRLS
Switzerland
None
Syrian Arab Republic
None
Tajikistan
None
Tanzania
None
Thailand 23.4 21.9 1.9 2011 TIMSS
Timor-Leste
None
Togo 81.7 80.6 5.3 2019 PASEC
Tonga
None
Trinidad and Tobago 20.6 19.7 1.2 2016 PIRLS
Tunisia 65.5 65.1 1.2 2011 TIMSS
Turkey 14.5 9.9 5.1 2019 TIMSS
Turkmenistan
None
Turks and Caicos Islands
None
Tuvalu
None
Uganda 81.9 81.1 4.4 2014 NLA

71 The State of Global Learning Poverty: 2022 Update |
Ukraine 27.9 18.3 11.7 2007 TIMSS
United Arab Emirates 32.8 32.4 0.6 2016 PIRLS
United Kingdom 3.5 3.2 0.3 2016 PIRLS
United States 4.3 3.9 0.4 2016 PIRLS
Uruguay 43.6 43.4 0.4 2019 LLECES
Uzbekistan
None
Vanuatu
None
Venezuela, RB
None
Vietnam 18.1 18.1 0.0 2019 SEA-PLM
Virgin Islands (US)
None
West Bank and Gaza
None
Yemen, Rep 94.7 93.5 17.8 2011 TIMSS
Zambia 98.5 98.2 14.9 2019 AMPLB
Zimbabwe
None
Source: UIS and World Bank Global Learning Poverty database, 2022. Note: “LLECES” represents LLECE results in the SERCE scale.

72 The State of Global Learning Poverty: 2022 Update |
Annex 6: Change in learning poverty gap by region and income level
Pre-COVID 2022
Baseline Optimistic Intermediate Pessimistic
World 14.2% 17.1% 17.6% 18.0%
Global (Low- and Middle- income countries only) 15.6% 18.7% 19.2% 19.5%
By Region (Low- and Middle- income countries only)
East Asia and Pacific 4.9% 6.1% 6.3% 6.5%
Europe and Central Asia 4.2% 5.3% 5.6% 5.8%
Latin America and Caribbean 10.7% 15.3% 16.2% 16.6%
Middle East and North Africa 24.4% 26.5% 26.9% 27.1%
South Asia 17.0% 21.5% 22.1% 22.6%
Sub-Saharan Africa 26.8% 27.6% 27.8% 27.8%
By income level
High-income 2.7% 4.0% 4.6% 5.0%
Upper-middle-income 4.7% 6.6% 6.9% 7.1%
Lower-middle-income 16.8% 20.8% 21.4% 21.8%
Low-income 27.8% 28.1% 28.1% 28.2%
Source: Azevedo et al., 2022
Annex 7: Change in learning poverty severity by region and income level
Pre-COVID 2022
Baseline Optimistic Intermediate Pessimistic
World 9.9% 12.0% 12.3% 12.6%
Global (Low- and Middle- income countries only) 10.9% 13.0% 13.4% 13.6%
By Region (Low- and Middle- income countries only)
East Asia and Pacific 2.7% 3.3% 3.4% 3.5%
Europe and Central Asia 3.6% 4.6% 4.9% 5.0%
Latin America and Caribbean 5.3% 7.6% 8.0% 8.2%
Middle East and North Africa 14.7% 15.9% 16.2% 16.3%
South Asia 11.8% 14.9% 15.4% 15.7%
Sub-Saharan Africa 20.7% 21.4% 21.5% 21.6%
By income level
High-income 2.1% 3.1% 3.6% 3.9%
Upper-middle-income 2.6% 3.6% 3.8% 3.8%
Lower-middle-income 11.0% 13.6% 14.0% 14.3%
Low-income 22.6% 22.8% 22.8% 22.9%
Source: Azevedo et al., 2022

73 The State of Global Learning Poverty: 2022 Update |
Annex 8: Global economic cost by region and income level
Global aggregate economic cost at present value by region, income group, and lending type (in trillions of 2017 PPP $)
Current losses ($ trillions)
Optimistic Intermediate Pessimistic
Global 16.6 20.6 22.8
Global (Low- and Middle- income countries only) 9.4 11.1 12.1
By Region (Low- and Middle- income countries only)
East Asia and Pacific 3.9 4.7 5.1
Europe and Central Asia 0.8 1.0 1.1
Latin America and Caribbean 2.3 2.7 2.9
Middle East and North Africa 0.3 0.3 0.4
South Asia 1.6 1.9 2.0
Sub-Saharan Africa 0.5 0.5 0.6
By income level
High-income 7.5 9.8 11.1
Upper-middle-income 5.8 6.9 7.6
Lower-middle-income 3.1 3.6 3.9
Low-income 0.2 0.2 0.2
Source: Azevedo et al., 2022
Annex 9: Per-student average earnings loss (annual) by region and income level
Per student average earnings loss in annual terms by region, income group, and lending type (2017 PPP $)
Current Losses ($)
Optimistic Intermediate Pessimistic
Global $1,289 $1,598 $1,743
Global (Low- and Middle- income countries only) $822 $975 $1,051
By Region (Low- and Middle- income countries only)
East Asia and Pacific $678 $781 $836
Europe and Central Asia $974 $1,171 $1,266
Latin America and Caribbean $1,661 $2,014 $2,186
Middle East and North Africa $825 $937 $980
South Asia $652 $738 $793
Sub-Saharan Africa $329 $382 $410
By income level
High-income $2,499 $3,223 $3,543
Upper-middle-income $1,275 $1,508 $1,624
Lower-middle-income $494 $560 $602
Low-income $155 $169 $178
Source: Azevedo et al., 2022

74 The State of Global Learning Poverty: 2022 Update |
Annex 10: Per-student average earnings loss (lifetime) by region and income level
Per student average lifetime earning loss at present value by region, income group, and lending type (2017 PPP $)
Current Losses ($)
Optimistic Intermediate Pessimistic
Global $23,514 $29,162 $31,800
Global (Low- and Middle- income countries only) $14,993 $17,780 $19,166
By Region (Low- and Middle- income countries only)
East Asia and Pacific $12,365 $14,240 $15,255
Europe and Central Asia $17,778 $21,362 $23,091
Latin America and Caribbean $30,306 $36,751 $39,890
Middle East and North Africa $15,061 $17,098 $17,886
South Asia $11,898 $13,464 $14,472
Sub-Saharan Africa $5,996 $6,962 $7,478
By income level
High-income $45,594 $58,794 $64,644
Upper-middle-income $23,258 $27,514 $29,625
Lower-middle-income $9,019 $10,217 $10,975
Low-income $2,820 $3,081 $3,255
Source: Azevedo et al., 2022
Annex 11: Earnings loss as share of average earnings (annual) by region and income level
Earnings loss as a share of average earnings by region, income group, and lending type
Current Losses (%)
Optimistic Intermediate Pessimistic
Global 8.8% 10.4% 11.3%
Global (Low- and Middle- income countries only) 8.8% 10.2% 11.1%
By Region (Low- and Middle- income countries only)
East Asia and Pacific 8.3% 9.8% 10.7%
Europe and Central Asia 5.8% 6.9% 7.5%
Latin America and Caribbean 13.9% 16.3% 17.6%
Middle East and North Africa 5.6% 6.4% 6.7%
South Asia 12.5% 14.4% 15.8%
Sub-Saharan Africa 4.6% 5.1% 5.5%
By income level
High-income 9.1% 12.0% 13.5%
Upper-middle-income 8.3% 9.9% 10.8%
Lower-middle-income 10.0% 11.5% 12.5%
Low-income 4.9% 5.4% 5.8%
Source: Azevedo et al., 2022

75 The State of Global Learning Poverty: 2022 Update |
Endnotes
1 World Bank 2019. 2 World Bank n.d. 3 World Bank, UNESCO, and UNICEF 2021. 4 Hanushek et al. 2013; Valerio et al. 2016. 5 Alderman, Hoddinott, and Kinsey 2006. 6 Rissa-Gill and Finnegan 2015 and Peterman et al. 2020. 7 Bandeira et al 2019. 8 Andrabi, Daniels, and Das 2020. 9 Other recent studies also show that the macroeconomic impacts of the loss of human capital will be greater in the low- and middle-income countries in relative terms (Buffie et al. 2022). 10 World Bank, UNESCO, and UNICEF 2021. 11 World Bank 2018; Crouch 2020; Global Education Evidence Advisory Panel 2020; Global Education Evidence Advisory Panel 2022. 12 Global Education Evidence Advisory Panel 2020. 13 Saavedra Chanduvi et al. 2020. 14 Azevedo et al. 2021. 15 UNESCO Institute for Statistics (UIS) 2019. 16 Gust, Hanushek, and Woessmann forthcoming. 17 World Bank 2019. 18 World Bank, UNESCO, and UNICEF 2021; Donnelly and Patrinos 2021; Storey and Zhang 2021; Moscoviz and Evans 2022. 19 Ardington, Willis, and Kotze 2021; Hevia et al. 2021. 20 Throughout this document, the global learning poverty rate refers to the rate for all low- and middle-income countries. 21 World Bank 2019. 22 The updated global figure incorporates new learning data from other regions as well. In East Asia and the Pacific, the new higher numbers reflect the availability of a new regional assessment, SEA-PLM. This assessment is better aligned with SDG global proficiency framework (GPF), and it has replaced a number of National Learning Assessments that were being used for the interim reporting of the SDGs. Finally, this update includes data for a few countries that are reporting learning poverty for the first time, thanks to innovations promoted by UIS and USAID. These innovations use new methods to align national learning assessments with the GPF and have created very cost-effective learning assessments developed to report on minimum proficiency level used for SDG 4.1.1b, such as the AMPL-B (Assessment for the Minimum Proficiency Level – B). 23 World Bank n.d. 24 One notable exception is the AMPL-B program led by UIS, which produced learning loss estimates for 6 Sub-Saharan countries. 25 For details on the simulations model and assumptions please see Azevedo et al. 2022. 26 See Azevedo et al. 2021 and Moscoviz and Evans 2022 for a summary of that evidence. 27 Muñoz-Najar et al. 2021. 28 Responses to Educational Disruption Survey, Meinck et al. 2022 29 UNESCO et al. 2021a. 30 Muñoz-Najar et al. 2021a. 31 UNESCO et al. 2021a. 32 UNESCO et al. 2021a. 33 Josephson, Kilic, and Michler 2020. 34 World Bank, UNESCO, and UNICEF 2021.

76 The State of Global Learning Poverty: 2022 Update |
35 As described in Annex 3, of the three scenarios, we report and he intermediate scenario is simulated based on the following: (1) schools were closed for a time period based on actual data for February 2020 – February 2022 using the UNESCO school closures tracker, (2) all mitigation measures have had a low level of effectiveness, although different by income level (3) partial school closures are assumed to affect 85% of the student population (4) For countries with learning data (LAYS, LP, or PISA) but no school closure data, we impute missing values for share of school system closed by using the regional average by income level. For more details, please see Azevedo et al. 2022. 36 Azevedo et al. 2021 shows that the global historical rate of progress was approximately 0.7 learning poverty points per year (Table 9). At this rate of progress, the 13-percentage-point increase in learning poverty would be equivalent to 19 years of the observed average global rate of progress in this indicator. 37 See Table A.2 and A.3 for aggregate and country-level results. 38 See Annex 6 and 7 for results by Learning Poverty Gap and Learning Poverty Severity. 39 Angrist et al. 2021. 40 Donnelly and Patrinos 2021. 41 Moscoviz and Evans 2022. 42 World Bank, UNESCO, and UNICEF 2021. 43 SEDUC-SP 2021. 44 Moscoviz and Evans 2022. 45 See Annex 8 for further simulation results on the economic cost for different aggregates. 46 This simulation results include High-income countries. See Table A.6 for other aggregates. See Azevedo et al. 2022 for more details of the simulation. 47 Gibbs et al. 2019. 48 Meyers and Thomasson 2017. 49 Alderman, Hoddinott, and Kinsey 2006. 50 Rissa-Gill and Finnegan 2015 and Peterman et al. 2020. 51 Bandeira et al. 2019. 52 Andrabi, Daniels, and Das 2020. 53 Montoya and Antoninis 2020 and UNESCO Institute for Statistics (UIS) 2021. 54 UNESCO Institute for Statistics (UIS) and Global Education Monitoring Report (GEMR) (2022) 55 Azevedo, Goldemberg, et al. 2021. 56 UNICEF, UNESCO, and World Bank 2022. 57 UNICEF, UNESCO, and World Bank 2022. 58 Crawfurd, Hares, and Minardi 2021. 59 Crawfurd, Hares, Minardi, and Sandefur, 2021 60 UNESCO 2021a. 61 UNESCO et al. 2021b. 62 UNICEF, UNESCO, and World Bank 2022. 63 Modern Ghana News 2021. 64 World Bank 2022a. 65 Gobierno del Estado de Guanajuato 2021. 66 UNESCO 2021b. 67 Ministry of Education and Culture, Indonesia n.d. 68 UNESCO 2021b. 69 Bulat 2020. 70 Béteille et al. 2020. 71 The slope of the post-pandemic business-as-usual is intentionally drawn as lower than the pre-pandemic learning trajectory. This is because, as explained in World Bank, UNESCO, and UNICEF 2021, and drawing especially on Andrabi, Daniels, and Das 2020, there is a risk that if students who are well behind the curriculum return to classrooms that do not adjust to their learning levels, they will learn more slowly. 72 See Appendix B at UNESCO Institute for Statistics (UIS) 2022.

77 The State of Global Learning Poverty: 2022 Update |
73 International Development Association (IDA) countries have low per capita incomes and lack the financial ability to borrow from the International Bank of Reconstruction and Development (IBRD). Blend countries qualify for both IDA and IBRD loans. For further details on World Bank country classifications visit: https://datahelpdesk.worldbank.org/knowledgebase/articles/378834-how-does-the-world-bank-classify-countries 74 World Bank 2022b. 75 World Bank, UNESCO, and UNICEF 2021. 76 Moscoviz and Evans 2022. 77 For a more detailed discussion on the policy implications of measures such as learning poverty gap and learning poverty severity please see Azevedo 2020. 78 World Bank 2022c. 79 The World Bank and UNICEF in partnership with several other organizations have recently launched the Global Education Recovery Panel (GEAP) and the FLN Hub (https://www.flnhub.org/) 80 For more information check the Accelerator Program launched by the World Bank in partnership with Bill & Melinda Gates Foundation, U.K.’s Foreign, Commonwealth & Development Office (FCDO), UNICEF, and USAID. https://www.worldbank.org/en/news/feature/2020/11/20/world-bank-launches-accelerator-countries-program-to-improve-global-foundational-learning 81 TIMSS 2019. 82 TIMSS 2015. 83 IEA 2019. 84 SEA-PLM 2019. 85 SEA-PLM 2019. 86 CONFEMEN 2014. 87 CONFEMEN 2019. 88 CONFEMEN 2019. 89 UNESCO Institute for Statistics (UIS) 2022. 90 See Azevedo et al. 2021 and Evans and Moscoviz 2022 for a summary of that evidence.

In partnership with