The Soil Microbial Community and Grain Micronutrient Concentration of Historical and Modern Hard Red...
18
Sustainability 2011, 3, 500-517; doi:10.3390/su3030500 sustainability ISSN 2071-1050 www.mdpi.com/journal/sustainability Article The Soil Microbial Community and Grain Micronutrient Concentration of Historical and Modern Hard Red Spring Wheat Cultivars Grown Organically and Conventionally in the Black Soil Zone of the Canadian Prairies Alison G. Nelson 1 , Sylvie A. Quideau 2 , Brenda Frick 3 , Pierre J. Hucl 3 , Dil Thavarajah 3,† , M. Jill Clapperton 4 and Dean M. Spaner 1, * 1 Department of Agricultural, Food and Nutritional Science, University of Alberta, 410 Agriculture/ Forestry Centre, Edmonton, AB, T6G 2P5, Canada; E-Mail: [email protected] 2 Department of Renewable Resources, University of Alberta, 751 General Services Building, Edmonton, AB, T6G 2H1, Canada; E-Mail: [email protected] 3 Department of Plant Sciences, University of Saskatchewan, 51 Campus Drive, Saskatoon, SK, S7N 5A8, Canada; E-Mails: [email protected] (B.F.); [email protected] (P.H.) 4 Lethbridge Research Centre, Agriculture and Agri-Food Canada, 5403 1st Avenue South, Lethbridge, AB, T1J 4B1, Canada; E-Mail: [email protected] † Current address: School of Food Systems, North Dakota State University, Harris Hall 223, Fargo, ND 58105, USA; E-Mail: [email protected]. * Author to whom correspondence should be addressed; E-Mail: [email protected]; Tel.: +1-780-492-2328; Fax: +1-780-492-4265. Received: 6 January 2011; in revised form: 26 February 2011 / Accepted: 2 March 2011 / Published: 4 March 2011 Abstract: Micronutrient deficiencies in the diet of many people are common and wheat is a staple food crop, providing a carbohydrate and micronutrient source to a large percentage of the world’s population. We conducted a field study to compare five Canadian red spring wheat cultivars (released over the last century) grown under organic and conventional management systems for yield, grain micronutrient concentration, and soil phospholipid fatty acid (PLFA) profile. The organic system had higher grain Zn, Fe, Mg and K levels, but lower Se and Cu levels. There was no trend in the results to suggest that modern western Canadian hard red spring cultivars have lower grain micronutrient content than historical cultivars. Wheat cultivar choice is important for maximizing grain nutrient levels, OPEN ACCESS
-
Upload
independent -
Category
Documents
-
view
3 -
download
0
Transcript of The Soil Microbial Community and Grain Micronutrient Concentration of Historical and Modern Hard Red...
Sustainability 2011, 3, 500-517; doi:10.3390/su3030500
sustainability ISSN 2071-1050
www.mdpi.com/journal/sustainability
Article
The Soil Microbial Community and Grain Micronutrient
Concentration of Historical and Modern Hard Red Spring
Wheat Cultivars Grown Organically and Conventionally in the
Black Soil Zone of the Canadian Prairies
Alison G. Nelson 1, Sylvie A. Quideau
2, Brenda Frick
3, Pierre J. Hucl
3, Dil Thavarajah
3,†,
M. Jill Clapperton 4 and Dean M. Spaner
1,*
1 Department of Agricultural, Food and Nutritional Science, University of Alberta, 410 Agriculture/
Forestry Centre, Edmonton, AB, T6G 2P5, Canada; E-Mail: [email protected] 2 Department of Renewable Resources, University of Alberta, 751 General Services Building,
Edmonton, AB, T6G 2H1, Canada; E-Mail: [email protected] 3 Department of Plant Sciences, University of Saskatchewan, 51 Campus Drive, Saskatoon, SK,
S7N 5A8, Canada; E-Mails: [email protected] (B.F.); [email protected] (P.H.) 4 Lethbridge Research Centre, Agriculture and Agri-Food Canada, 5403 1st Avenue South,
Lethbridge, AB, T1J 4B1, Canada; E-Mail: [email protected]
† Current address: School of Food Systems, North Dakota State University, Harris Hall 223, Fargo,
ND 58105, USA; E-Mail: [email protected].
* Author to whom correspondence should be addressed; E-Mail: [email protected];
Tel.: +1-780-492-2328; Fax: +1-780-492-4265.
Received: 6 January 2011; in revised form: 26 February 2011 / Accepted: 2 March 2011 /
Published: 4 March 2011
Abstract: Micronutrient deficiencies in the diet of many people are common and wheat is
a staple food crop, providing a carbohydrate and micronutrient source to a large percentage
of the world’s population. We conducted a field study to compare five Canadian red spring
wheat cultivars (released over the last century) grown under organic and conventional
management systems for yield, grain micronutrient concentration, and soil phospholipid
fatty acid (PLFA) profile. The organic system had higher grain Zn, Fe, Mg and K levels,
but lower Se and Cu levels. There was no trend in the results to suggest that modern
western Canadian hard red spring cultivars have lower grain micronutrient content than
historical cultivars. Wheat cultivar choice is important for maximizing grain nutrient levels,
OPEN ACCESS
Sustainability 2011, 3
501
which was influenced by management system. It is evident that the emphasis on elevated
grain quality in the western Canadian hard red spring class has resulted in the retention of
micronutrient quality characters. Three fungal PLFAs were indicators for the organic
system, and all three of these indicators were positively correlated with grain Cu
concentration. In the organic system, percent arbuscular mycorrhizal fungi were negatively
correlated with grain Zn and Fe concentrations, and positively correlated with grain Mn,
Cu, K concentrations and grain yield. The organic system had higher levels of fungi in the
soil, including arbuscular mycorrhizal fungi. Organic management practices appear to
result in elevated levels of grain micronutrient concentration. The hard red spring breeding
effort in and for the black soil zone of the northern Great Plains also appears to have led to
no diminishment of grain micronutrient concentration. It is evident that both the agronomic
system and breeding strategies in this region can be exploited for future increases in grain
micronutrient concentration.
Keywords: Triticum aestivum L.; organic agriculture; conventional agriculture;
micronutrients; antioxidants; phospholipid fatty acid analysis; arbuscular mycorrhizal fungi
1. Introduction
Consumers purchase organic food products because they perceive these foods to have unique and/or
superior quality attributes relative to conventional foods [1]. Organic food products are viewed as
more healthy, safe and/or environmentally friendly than conventional food products [1]. Consumers
list a number of benefits of organic products as important in their choice to buy organic from most
important to least important: health, environment, taste, animal welfare, minimal processing, novelty
and fashion [2]. Despite the perceived benefits of consuming organic foods, organic certification is
based on the process used to produce the good, not on the product itself; meaning that organic
certification is not a guarantee of the quality attributes of the product [3]. Many of the perceived
attributes of organic products cannot be measured, and necessitate faith on the part of the consumer
that the desired attributes are present [4].
Micronutrients play important roles in human body functioning and health. Deficiencies are most
generally present in developing countries, often affecting women and children [5]. However, at least
half the US population fails to meet the recommended dietary allowance for the micronutrients
magnesium (Mg), calcium (Ca), and zinc (Zn) [6]. The essential trace elements Zn, copper (Cu) and Se
are antioxidant micronutrients. They play a key role in the body’s defenses against free radicals and
reactive oxygen molecules as constituents of antioxidant exzymes..Increasing mineral nutrient content
of crops, or biofortification, can help prevent nutrient deficiencies. Biofortification may be achieved
through agronomic measures to increase the availability of mineral elements in the soil, as well as the
development and use of crops with increased ability to absorb nutrients [7]. Globally, wheat is a major
source of nourishment and the main source of carbohydrates in temperate areas [8]. There has been
speculation that the development of high yielding cultivars in association with input intensification has
Sustainability 2011, 3
502
resulted in lower levels of micronutrients in grains produced in conventional environments. In a
meta-analysis study, Worthington [9] reported that organic crops contained significantly more Fe
and Mg than conventional crops. There were nonsignificant trends showing a higher content of
nutritionally significant minerals in organic crops. Murphy et al. [10] reported, in a Pacific Northwest
USA study of 63 historical and modern wheat cultivars that, while grain yield has increased over time,
the concentrations of all minerals except Ca have decreased. They further reported that the decrease in
mineral concentration over the past 120 years occurred mainly in the soft white wheat and not the hard
red market class in the western USA.
Soils, climate, crop type and cultivar, management practices and post-harvest factors can all affect
the nutritional quality of crops [11]. Research into nutritional differences between organic and
conventional crops has yielded conflicting results or small differences [12]. Mäder et al. [13] reported
few differences in nutrient content of organic and conventional wheat grain in a long-term field study.
Ryan et al. [14] found that the nutritional value of organic grain was slightly better than conventional
grain, with higher Zn and Cu concentrations in organic wheat. However, the authors concluded that
universal statements about differences between organic and conventional management were not useful;
but that knowing the underlying mechanisms leading to nutritional quality differences could lead to
improved nutritional quality. In another long-term field study, Turmel et al. [15] reported that
differences in grain mineral content of organic and conventional wheat are dependent on the system’s
crop rotation (annual grain vs. perennial forage-grain rotation).
Soil microbes affect soil fertility in many ways, for instance through their influence on organic
matter turnover, mineral immobilization and dissolution, and soil aggregation [16]. As well, soil
microbes such as Rhizobia bacteria and arbuscular mycorrhizal fungi form plant symbioses, improving
plant nutrient supply or uptake. While management practices can alter microbial communities directly,
for the most part, management practices change microbial communities indirectly by altering soil
properties affecting microbial diversity. Because most microbes are heterotrophic, soil organic matter
content and the type and amount of organic materials added to the soil are two critical soil factors
affecting microbial diversity [17]. Genetic differences within a crop species (i.e., cultivar differences)
may play a role in the structure of the microbial community. Differences have been found in microbial
communities associated with different wheat and canola (Brassica napus L.) cultivars [18].
Both organic and conventional cropping systems involve the combination of a number of different
management practices (chemical use, tillage, crop rotation and crop choice). Despite the ranges of
management practices used in organic and conventional cropping systems, there are a number of
factors which commonly differ between the two systems. On the western Canadian prairies, according
to research conducted over the last 10 years, organic systems tend to have higher organic matter,
more weeds, 10 to 50% lower grain yields and lower phosphorus (P) levels than conventional
systems [19,20]. The absence of inorganic fertilizers and pesticides in organic systems generally leads
to greater weed populations, higher tillage intensities, and lower soil nutrient levels. Thus, at least in
extensive grain producing systems of the northern Great Plains, organic systems generally
tend to present greater biotic and abotic stresses to production systems than their conventional
counterparts. This is, in part, because these stresses cannot be managed through chemical pesticides
and fertilizer [20].
Sustainability 2011, 3
503
Organic systems often have more diverse crop rotations and higher plant diversity within fields than
conventional systems. Organic systems employ a number of practices that serve to increase organic
matter content, generally resulting in slightly higher levels of organic matter in organic systems versus
conventional systems [21,22]. Some studies have reported shifts in microbial communities with
organic versus conventional management [21,23], while others have reported no differences between
microbial communities under the two management systems [24,25].
We hypothesized that the stress levels associated with organic management systems would result in
higher levels of micronutrients in the grain, and specifically those with antioxidant properties. We
further hypothesized that western Canadian historic hard red spring cultivars would have higher
mineral content than modern cultivars, especially in organic systems; and that those organic systems
would have a more diverse microbial community structure. Thus, the objectives of this study were to
compare the concentrations of seven minerals, including Se, Cu, Mn, Zn, Fe, Mg and K in a subset of
hard spring wheat cultivars grown over the last 100 years in western Canada in both conventional and
organic environments. We were also interested in exploring the effect of the microbial community
structure in the two management systems on micronutrient content.
2. Materials and Methods
We reported the effect of cultivar and management system (organic vs. conventional) on agronomic
traits, soil biotic data and breadmaking quality traits using the present experimental design [26]. The
present study is thus a continuation of a reported study where the experimental design is similar in
many respects. To summarize, we grew five western Canadian spring wheat cultivars (AC Elsa,
Glenlea, Marquis, Park and AC Superb) (see descriptions in McCallum and DePauw (2008)) in
four-replicate, randomized complete block experiments: one organically managed site and one
conventionally managed site in 2005, 2006 and 2007 in Edmonton, AB (55°34′ N, 113°31′ W). The
cultivars were chosen to represent spring wheat cultivars commonly grown in western Canada over the
past century (Table 1). The two sites were located within 500 m of one another with the same soil type
(Orthic Black Chernozem) and topography. Plot dimensions were 4 m by 1.38 m, with 6 rows spaced
23 cm apart, seeded with a no-till double disk drill (Fabro Enterprises Ltd., Swift Current, SK, Canada)
in May. The 5 ha organic site has been in a long term, three-year rotation of experimental spring-sown
grain, followed by a fall-sown rye (S. cereal L.) taken for silage the following year, followed by a
triticale (X Triticosecale Wittmack)-pea (P. sativum L.) mixture again harvested for silage. The entire
organic site has been managed organically since 1999. The conventional site is in a long term
four-year rotation in the following order: (1) experimental canola (B. napus L.) plots, (2) triticale-pea
mixtures (or uniform pea) harvested as silage, (3) experimental spring wheat plots, and (4) barley
(H. vulgare L.) silage.
Sustainability 2011, 3
504
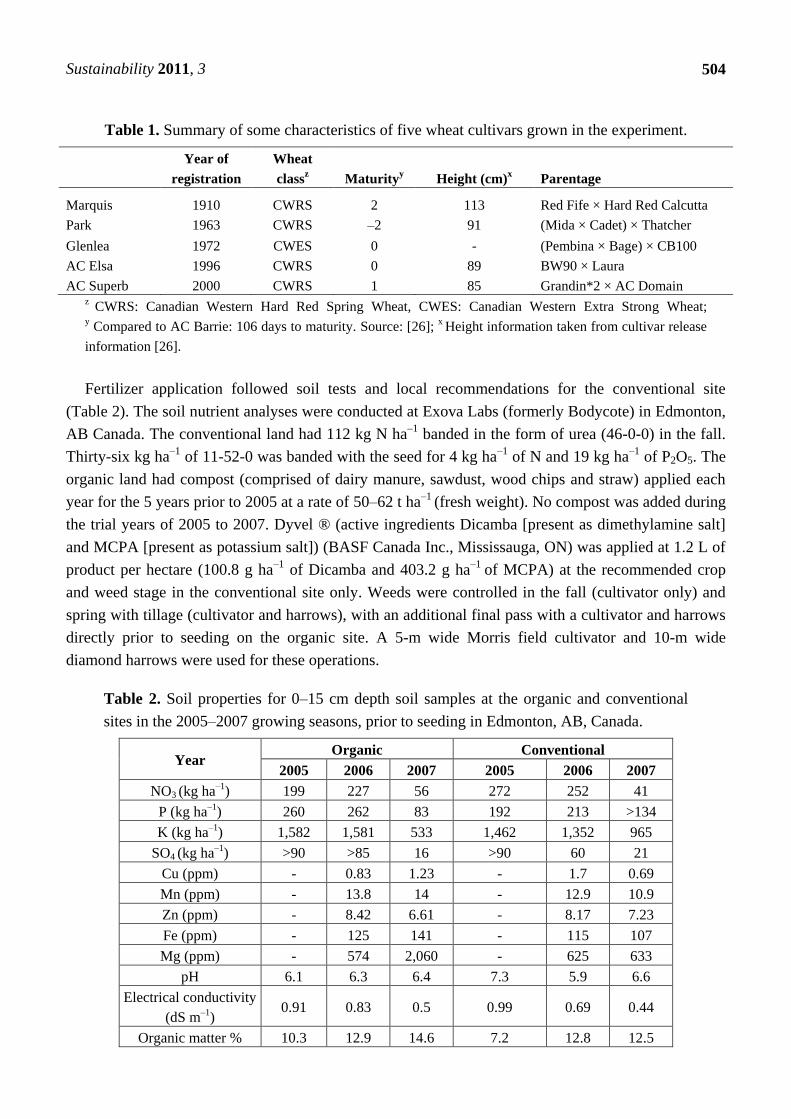
Table 1. Summary of some characteristics of five wheat cultivars grown in the experiment.
Year of
registration
Wheat
classz Maturity
y Height (cm)
x Parentage
Marquis 1910 CWRS 2 113 Red Fife × Hard Red Calcutta
Park 1963 CWRS –2 91 (Mida × Cadet) × Thatcher
Glenlea 1972 CWES 0 - (Pembina × Bage) × CB100
AC Elsa 1996 CWRS 0 89 BW90 × Laura
AC Superb 2000 CWRS 1 85 Grandin*2 × AC Domain z
CWRS: Canadian Western Hard Red Spring Wheat, CWES: Canadian Western Extra Strong Wheat; y Compared to AC Barrie: 106 days to maturity. Source: [26];
x Height information taken from cultivar release
information [26].
Fertilizer application followed soil tests and local recommendations for the conventional site
(Table 2). The soil nutrient analyses were conducted at Exova Labs (formerly Bodycote) in Edmonton,
AB Canada. The conventional land had 112 kg N ha–1
banded in the form of urea (46-0-0) in the fall.
Thirty-six kg ha–1
of 11-52-0 was banded with the seed for 4 kg ha–1
of N and 19 kg ha–1
of P2O5. The
organic land had compost (comprised of dairy manure, sawdust, wood chips and straw) applied each
year for the 5 years prior to 2005 at a rate of 50–62 t ha–1
(fresh weight). No compost was added during
the trial years of 2005 to 2007. Dyvel ® (active ingredients Dicamba [present as dimethylamine salt]
and MCPA [present as potassium salt]) (BASF Canada Inc., Mississauga, ON) was applied at 1.2 L of
product per hectare (100.8 g ha–1
of Dicamba and 403.2 g ha–1
of MCPA) at the recommended crop
and weed stage in the conventional site only. Weeds were controlled in the fall (cultivator only) and
spring with tillage (cultivator and harrows), with an additional final pass with a cultivator and harrows
directly prior to seeding on the organic site. A 5-m wide Morris field cultivator and 10-m wide
diamond harrows were used for these operations.
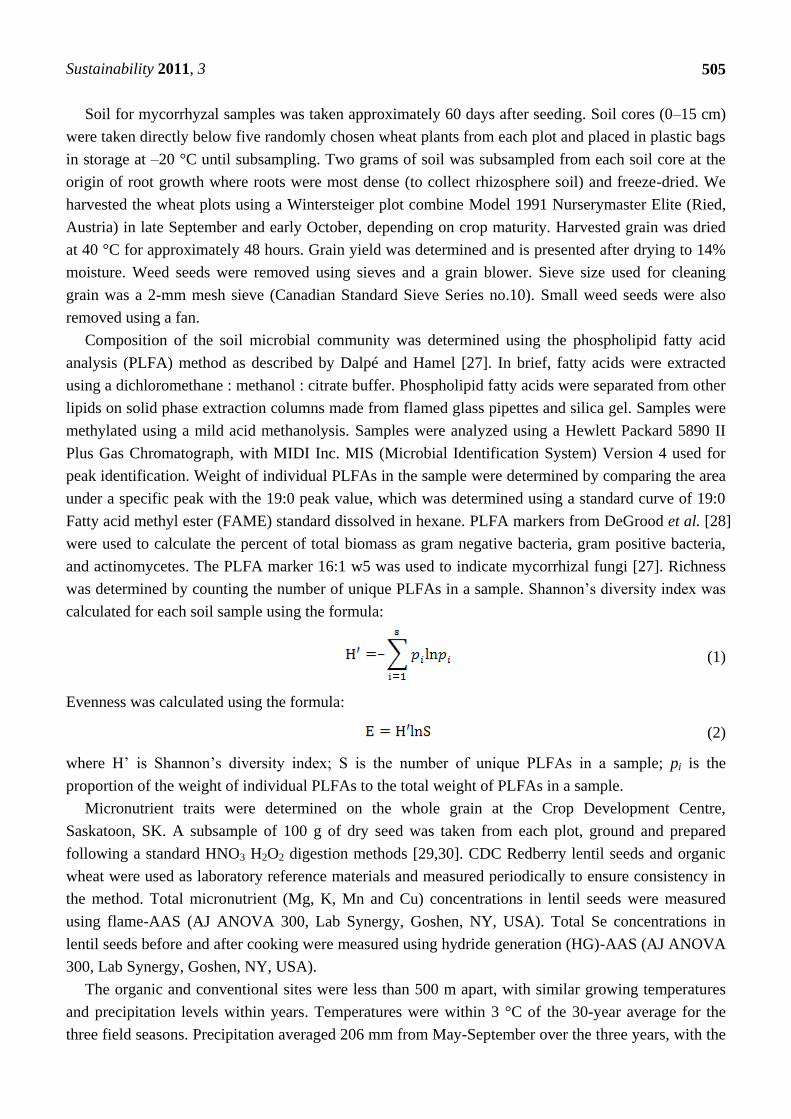
Table 2. Soil properties for 0–15 cm depth soil samples at the organic and conventional
sites in the 2005–2007 growing seasons, prior to seeding in Edmonton, AB, Canada.
Year Organic Conventional
2005 2006 2007 2005 2006 2007
NO3 (kg ha–1) 199 227 56 272 252 41
P (kg ha–1) 260 262 83 192 213 >134
K (kg ha–1) 1,582 1,581 533 1,462 1,352 965
SO4 (kg ha–1) >90 >85 16 >90 60 21
Cu (ppm) - 0.83 1.23 - 1.7 0.69
Mn (ppm) - 13.8 14 - 12.9 10.9
Zn (ppm) - 8.42 6.61 - 8.17 7.23
Fe (ppm) - 125 141 - 115 107
Mg (ppm) - 574 2,060 - 625 633
pH 6.1 6.3 6.4 7.3 5.9 6.6
Electrical conductivity
(dS m–1) 0.91 0.83 0.5 0.99 0.69 0.44
Organic matter % 10.3 12.9 14.6 7.2 12.8 12.5
Sustainability 2011, 3
505
Soil for mycorrhyzal samples was taken approximately 60 days after seeding. Soil cores (0–15 cm)
were taken directly below five randomly chosen wheat plants from each plot and placed in plastic bags
in storage at –20 °C until subsampling. Two grams of soil was subsampled from each soil core at the
origin of root growth where roots were most dense (to collect rhizosphere soil) and freeze-dried. We
harvested the wheat plots using a Wintersteiger plot combine Model 1991 Nurserymaster Elite (Ried,
Austria) in late September and early October, depending on crop maturity. Harvested grain was dried
at 40 °C for approximately 48 hours. Grain yield was determined and is presented after drying to 14%
moisture. Weed seeds were removed using sieves and a grain blower. Sieve size used for cleaning
grain was a 2-mm mesh sieve (Canadian Standard Sieve Series no.10). Small weed seeds were also
removed using a fan.
Composition of the soil microbial community was determined using the phospholipid fatty acid
analysis (PLFA) method as described by Dalpé and Hamel [27]. In brief, fatty acids were extracted
using a dichloromethane : methanol : citrate buffer. Phospholipid fatty acids were separated from other
lipids on solid phase extraction columns made from flamed glass pipettes and silica gel. Samples were
methylated using a mild acid methanolysis. Samples were analyzed using a Hewlett Packard 5890 II
Plus Gas Chromatograph, with MIDI Inc. MIS (Microbial Identification System) Version 4 used for
peak identification. Weight of individual PLFAs in the sample were determined by comparing the area
under a specific peak with the 19:0 peak value, which was determined using a standard curve of 19:0
Fatty acid methyl ester (FAME) standard dissolved in hexane. PLFA markers from DeGrood et al. [28]
were used to calculate the percent of total biomass as gram negative bacteria, gram positive bacteria,
and actinomycetes. The PLFA marker 16:1 w5 was used to indicate mycorrhizal fungi [27]. Richness
was determined by counting the number of unique PLFAs in a sample. Shannon’s diversity index was
calculated for each soil sample using the formula:
(1)
Evenness was calculated using the formula:
(2)
where H’ is Shannon’s diversity index; S is the number of unique PLFAs in a sample; pi is the
proportion of the weight of individual PLFAs to the total weight of PLFAs in a sample.
Micronutrient traits were determined on the whole grain at the Crop Development Centre,
Saskatoon, SK. A subsample of 100 g of dry seed was taken from each plot, ground and prepared
following a standard HNO3 H2O2 digestion methods [29,30]. CDC Redberry lentil seeds and organic
wheat were used as laboratory reference materials and measured periodically to ensure consistency in
the method. Total micronutrient (Mg, K, Mn and Cu) concentrations in lentil seeds were measured
using flame-AAS (AJ ANOVA 300, Lab Synergy, Goshen, NY, USA). Total Se concentrations in
lentil seeds before and after cooking were measured using hydride generation (HG)-AAS (AJ ANOVA
300, Lab Synergy, Goshen, NY, USA).
The organic and conventional sites were less than 500 m apart, with similar growing temperatures
and precipitation levels within years. Temperatures were within 3 °C of the 30-year average for the
three field seasons. Precipitation averaged 206 mm from May-September over the three years, with the
Sustainability 2011, 3
506
30-year average being 341 mm. Differences between the two systems are likely due to the different
management strategies and the resulting differences in nutrient levels (Table 2) and weed pressure.
Analyses of data were performed using the PROC MIXED procedure of SAS (version 9.1, SAS
Institute). The experiment was analysed as a split plot with management system as the main plot and
cultivar as the sub plot. Using such an analysis implies that one complete block was grown per year.
Thus, years were treated as blocks and were considered as a random effect in both combined analysis
and in the analyses by management system. Blocks within site were considered as random sampling
units. Cultivar and management system (where applicable) were considered as fixed effects. All
interactions with random effects were also considered random. We also analyzed data by management
system, combined over years. For both analyses, years and blocks were considered random and
management system and cultivar were considered fixed effects. Pearson correlations were conducted
on plot means for the organic and conventional sites. The split-plot design has a decreased precision
for main plot (management) comparisons [31], which was of interest to us. Preliminary analysis
revealed no significant differences in microbial community among the wheat cultivars in the organic
system. We discuss and report differences between treatments only when P ≤ 0.05, except for the
mixed model analysis of the experiment, where P ≤ 0.10 was used as a significance level appropriate
for the small experimental size [31].
The structure of the microbial community (PLFA) for the entire experiment, and for the two
management systems separately was characterized with non-metric multidimensional scaling (NMS)
ordination using PC-ORD (version 5, MjM Software Design). Statistical analyses were conducted on
the mean laboratory results of the five sub-samples per plot. Fatty acids present in less than 10% of the
samples were omitted from the analysis. A total of 43, 47 and 40 unique PLFAs were used in the
combined management system, organic and conventional ordinations, respectively. The PLFA data
were arcsine square-root transformed prior to ordination. A Sorensen (Bray-Curtis) distance
measurement was used in all ordinations. Biplots were used to show the relationship between grain
micronutrient concentration, yield and PLFA ordination scores. Significant differences between
management system, year and wheat cultivars were evaluated on the NMS analyses using a
multi-response permutation procedure (MRPP). Indicator species analyses were used to evaluate the
relationship between individual PLFAs and the two management systems.
The experiments were conducted on a single organic/conventional site comparison and differences
between the management systems are therefore specific to the site soil and growing conditions. These
results should be interpreted in conjunction with further data compiled in this region (e.g., [20]).
3. Results
Yields were significantly lower in the organic system than the conventional system (2.74 vs.
5.02 t ha–1
, respectively) (Table 3). AC Superb (the most modern and semi-dwarf cultivar) yielded the
most grain, and Marquis (the oldest cultivar) the least in both systems. Flour yield was significantly
higher in the conventional system than the organic system. AC Elsa (a modern tall cultivar) had the
highest flour yields in both the organic and conventional systems. Full agronomic and baking quality
data and analyses for this study have been reported elsewhere [26].
Sustainability 2011, 3
507
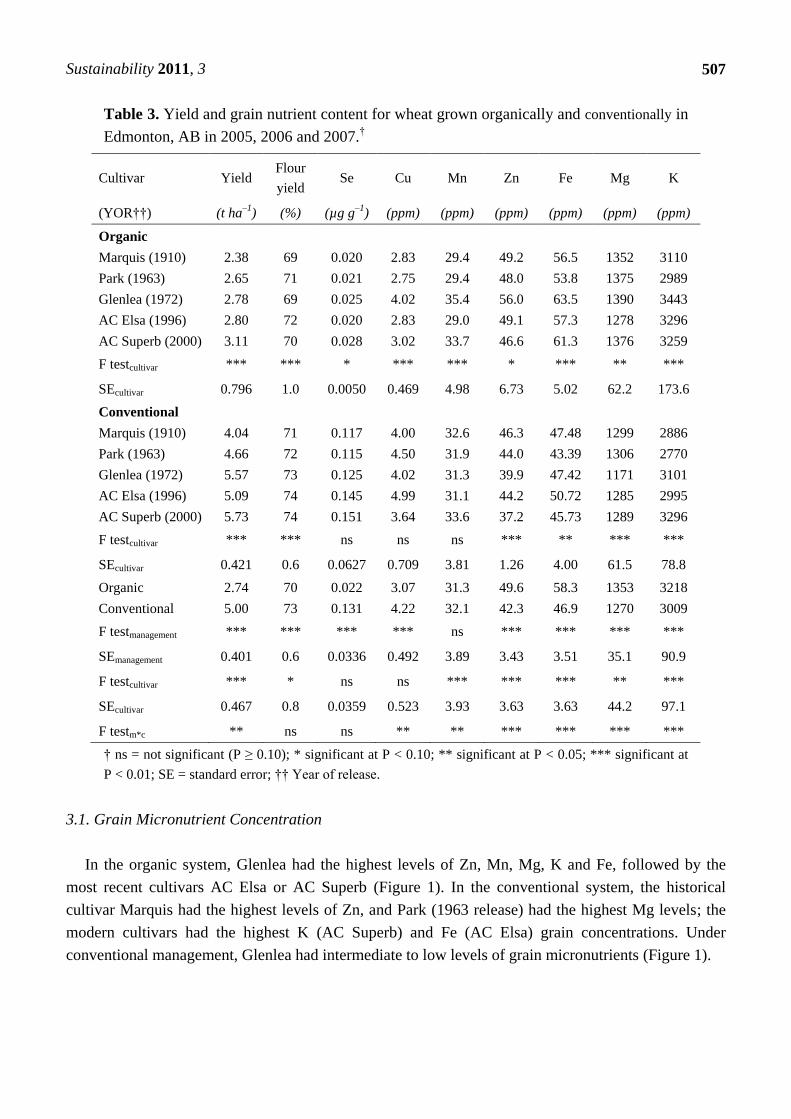
Table 3. Yield and grain nutrient content for wheat grown organically and conventionally in
Edmonton, AB in 2005, 2006 and 2007.†
Cultivar Yield Flour
yield Se Cu Mn Zn Fe Mg K
(YOR††) (t ha–1
) (%) (µg g–1
) (ppm) (ppm) (ppm) (ppm) (ppm) (ppm)
Organic
Marquis (1910) 2.38 69 0.020 2.83 29.4 49.2 56.5 1352 3110
Park (1963) 2.65 71 0.021 2.75 29.4 48.0 53.8 1375 2989
Glenlea (1972) 2.78 69 0.025 4.02 35.4 56.0 63.5 1390 3443
AC Elsa (1996) 2.80 72 0.020 2.83 29.0 49.1 57.3 1278 3296
AC Superb (2000) 3.11 70 0.028 3.02 33.7 46.6 61.3 1376 3259
F testcultivar *** *** * *** *** * *** ** ***
SEcultivar 0.796 1.0 0.0050 0.469 4.98 6.73 5.02 62.2 173.6
Conventional
Marquis (1910) 4.04 71 0.117 4.00 32.6 46.3 47.48 1299 2886
Park (1963) 4.66 72 0.115 4.50 31.9 44.0 43.39 1306 2770
Glenlea (1972) 5.57 73 0.125 4.02 31.3 39.9 47.42 1171 3101
AC Elsa (1996) 5.09 74 0.145 4.99 31.1 44.2 50.72 1285 2995
AC Superb (2000) 5.73 74 0.151 3.64 33.6 37.2 45.73 1289 3296
F testcultivar *** *** ns ns ns *** ** *** ***
SEcultivar 0.421 0.6 0.0627 0.709 3.81 1.26 4.00 61.5 78.8
Organic 2.74 70 0.022 3.07 31.3 49.6 58.3 1353 3218
Conventional 5.00 73 0.131 4.22 32.1 42.3 46.9 1270 3009
F testmanagement *** *** *** *** ns *** *** *** ***
SEmanagement 0.401 0.6 0.0336 0.492 3.89 3.43 3.51 35.1 90.9
F testcultivar *** * ns ns *** *** *** ** ***
SEcultivar 0.467 0.8 0.0359 0.523 3.93 3.63 3.63 44.2 97.1
F testm*c ** ns ns ** ** *** *** *** ***
† ns = not significant (P ≥ 0.10); * significant at P < 0.10; ** significant at P < 0.05; *** significant at
P < 0.01; SE = standard error; †† Year of release.
3.1. Grain Micronutrient Concentration
In the organic system, Glenlea had the highest levels of Zn, Mn, Mg, K and Fe, followed by the
most recent cultivars AC Elsa or AC Superb (Figure 1). In the conventional system, the historical
cultivar Marquis had the highest levels of Zn, and Park (1963 release) had the highest Mg levels; the
modern cultivars had the highest K (AC Superb) and Fe (AC Elsa) grain concentrations. Under
conventional management, Glenlea had intermediate to low levels of grain micronutrients (Figure 1).

Sustainability 2011, 3
508
Figure 1. Grain Se, Cu, Mn, Zn, Fe, Mg and K content for five spring wheat cultivars
grown organically (dark bars) and conventionally (light bars) in 2005–2007 in Edmonton,
AB. Error bars show standard error for management × cultivar.
Sustainability 2011, 3
509
There were significant management × cultivar interactions for Cu, Mn, Zn, Fe, Mg and K (Table 3).
AC Elsa grown conventionally had higher levels of grain Cu than AC Elsa, Marquis and Park grown
organically. Organically grown Glenlea had higher grain Mn, Zn, Fe, Mg and K concentrations than
other organically and conventionally grown cultivars. In the organic system, Glenlea grain had higher
Mn, Fe and K levels than Park, higher Mn and Mg levels than AC Elsa and higher Zn concentration
than AC Superb. Organically grown Glenlea grain also had higher Fe than conventional Park and AC
Superb, and higher K concentration than conventional Park and Marquis grain.
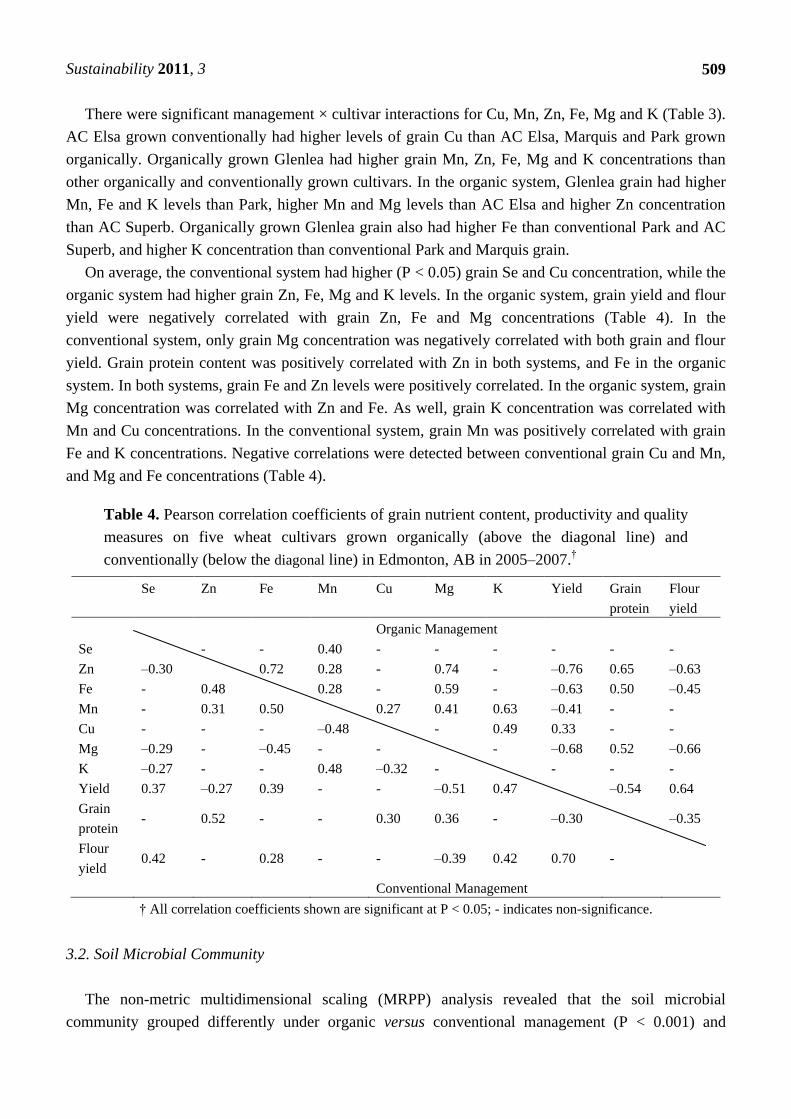
On average, the conventional system had higher (P < 0.05) grain Se and Cu concentration, while the
organic system had higher grain Zn, Fe, Mg and K levels. In the organic system, grain yield and flour
yield were negatively correlated with grain Zn, Fe and Mg concentrations (Table 4). In the
conventional system, only grain Mg concentration was negatively correlated with both grain and flour
yield. Grain protein content was positively correlated with Zn in both systems, and Fe in the organic
system. In both systems, grain Fe and Zn levels were positively correlated. In the organic system, grain
Mg concentration was correlated with Zn and Fe. As well, grain K concentration was correlated with
Mn and Cu concentrations. In the conventional system, grain Mn was positively correlated with grain
Fe and K concentrations. Negative correlations were detected between conventional grain Cu and Mn,
and Mg and Fe concentrations (Table 4).
Table 4. Pearson correlation coefficients of grain nutrient content, productivity and quality
measures on five wheat cultivars grown organically (above the diagonal line) and
conventionally (below the diagonal line) in Edmonton, AB in 2005–2007.†
Se
Zn Fe Mn Cu Mg K Yield Grain
protein
Flour
yield
Organic Management
Se - - 0.40 - - - - - -
Zn –0.30 0.72 0.28 - 0.74 - –0.76 0.65 –0.63
Fe - 0.48 0.28 - 0.59 - –0.63 0.50 –0.45
Mn - 0.31 0.50 0.27 0.41 0.63 –0.41 - -
Cu - - - –0.48 - 0.49 0.33 - -
Mg –0.29 - –0.45 - - - –0.68 0.52 –0.66
K –0.27 - - 0.48 –0.32 - - - -
Yield 0.37 –0.27 0.39 - - –0.51 0.47 –0.54 0.64
Grain
protein - 0.52 - - 0.30 0.36 - –0.30 –0.35
Flour
yield 0.42 - 0.28 - - –0.39 0.42 0.70 -
Conventional Management
† All correlation coefficients shown are significant at P < 0.05; - indicates non-significance.
3.2. Soil Microbial Community
The non-metric multidimensional scaling (MRPP) analysis revealed that the soil microbial
community grouped differently under organic versus conventional management (P < 0.001) and
Sustainability 2011, 3
510
between years; with the management effect having a stronger effect than years (data not shown).
Cultivars exhibited no significant grouping patterns. There were significant grouping patterns in the
management × cultivar interaction. Nevertheless, the individual comparisons suggest that all cultivars
grown under the organic management system group differently than all cultivars grown under
conventional management.
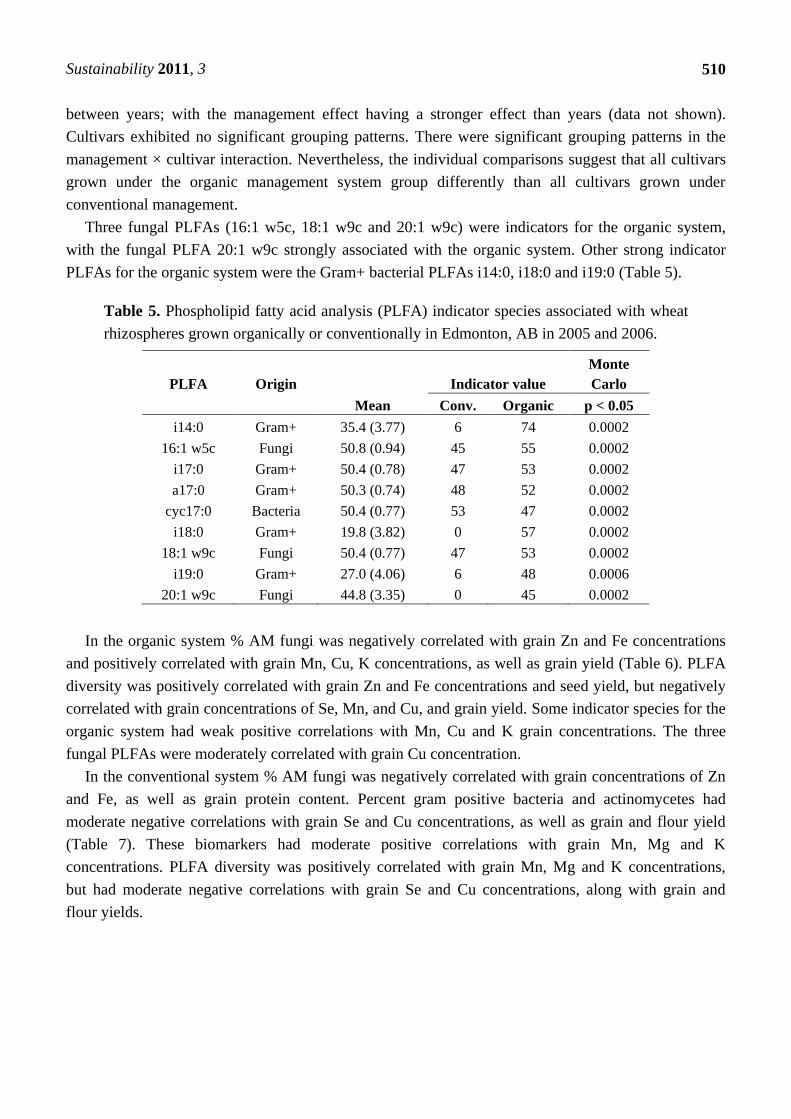
Three fungal PLFAs (16:1 w5c, 18:1 w9c and 20:1 w9c) were indicators for the organic system,
with the fungal PLFA 20:1 w9c strongly associated with the organic system. Other strong indicator
PLFAs for the organic system were the Gram+ bacterial PLFAs i14:0, i18:0 and i19:0 (Table 5).
Table 5. Phospholipid fatty acid analysis (PLFA) indicator species associated with wheat
rhizospheres grown organically or conventionally in Edmonton, AB in 2005 and 2006.
PLFA Origin Indicator value
Monte
Carlo
Mean Conv. Organic p < 0.05
i14:0 Gram+ 35.4 (3.77) 6 74 0.0002
16:1 w5c Fungi 50.8 (0.94) 45 55 0.0002
i17:0 Gram+ 50.4 (0.78) 47 53 0.0002
a17:0 Gram+ 50.3 (0.74) 48 52 0.0002
cyc17:0 Bacteria 50.4 (0.77) 53 47 0.0002
i18:0 Gram+ 19.8 (3.82) 0 57 0.0002
18:1 w9c Fungi 50.4 (0.77) 47 53 0.0002
i19:0 Gram+ 27.0 (4.06) 6 48 0.0006
20:1 w9c Fungi 44.8 (3.35) 0 45 0.0002
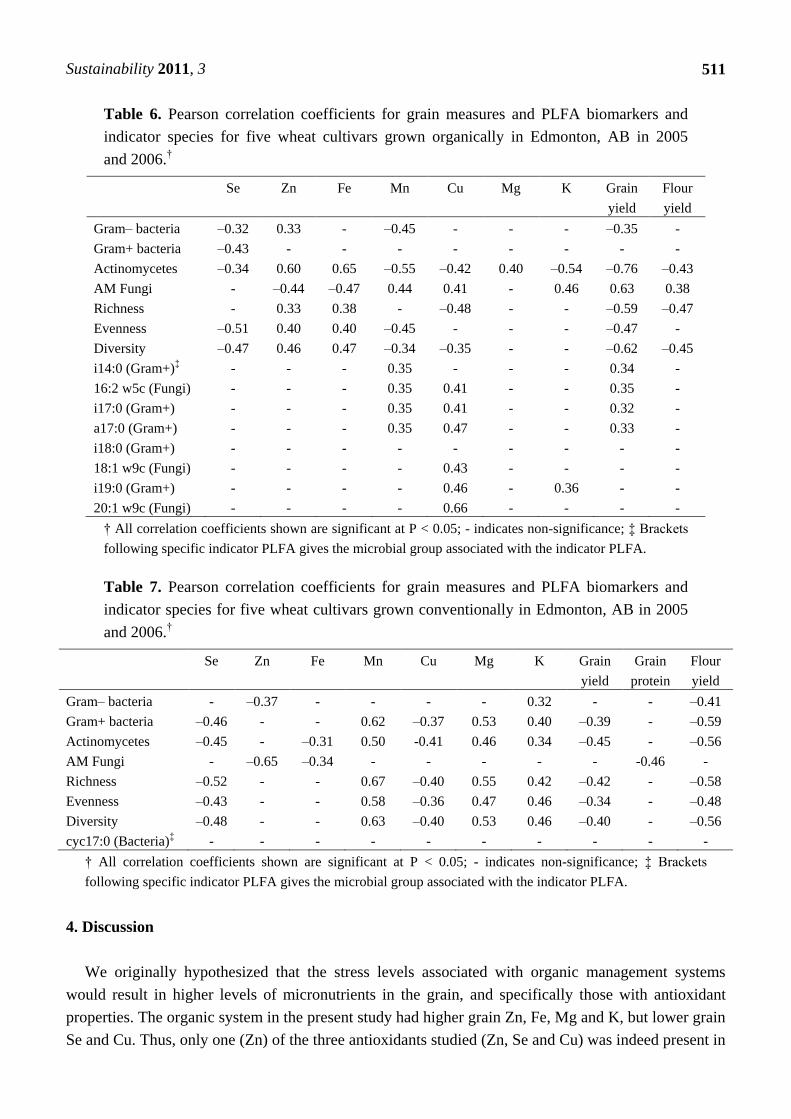
In the organic system % AM fungi was negatively correlated with grain Zn and Fe concentrations
and positively correlated with grain Mn, Cu, K concentrations, as well as grain yield (Table 6). PLFA
diversity was positively correlated with grain Zn and Fe concentrations and seed yield, but negatively
correlated with grain concentrations of Se, Mn, and Cu, and grain yield. Some indicator species for the
organic system had weak positive correlations with Mn, Cu and K grain concentrations. The three
fungal PLFAs were moderately correlated with grain Cu concentration.
In the conventional system % AM fungi was negatively correlated with grain concentrations of Zn
and Fe, as well as grain protein content. Percent gram positive bacteria and actinomycetes had
moderate negative correlations with grain Se and Cu concentrations, as well as grain and flour yield
(Table 7). These biomarkers had moderate positive correlations with grain Mn, Mg and K
concentrations. PLFA diversity was positively correlated with grain Mn, Mg and K concentrations,
but had moderate negative correlations with grain Se and Cu concentrations, along with grain and
flour yields.
Sustainability 2011, 3
511
Table 6. Pearson correlation coefficients for grain measures and PLFA biomarkers and
indicator species for five wheat cultivars grown organically in Edmonton, AB in 2005
and 2006.†
Se Zn Fe Mn Cu Mg K Grain
yield
Flour
yield
Gram– bacteria –0.32 0.33 - –0.45 - - - –0.35 -
Gram+ bacteria –0.43 - - - - - - - -
Actinomycetes –0.34 0.60 0.65 –0.55 –0.42 0.40 –0.54 –0.76 –0.43
AM Fungi - –0.44 –0.47 0.44 0.41 - 0.46 0.63 0.38
Richness - 0.33 0.38 - –0.48 - - –0.59 –0.47
Evenness –0.51 0.40 0.40 –0.45 - - - –0.47 -
Diversity –0.47 0.46 0.47 –0.34 –0.35 - - –0.62 –0.45
i14:0 (Gram+)‡ - - - 0.35 - - - 0.34 -
16:2 w5c (Fungi) - - - 0.35 0.41 - - 0.35 -
i17:0 (Gram+) - - - 0.35 0.41 - - 0.32 -
a17:0 (Gram+) - - - 0.35 0.47 - - 0.33 -
i18:0 (Gram+) - - - - - - - - -
18:1 w9c (Fungi) - - - - 0.43 - - - -
i19:0 (Gram+) - - - - 0.46 - 0.36 - -
20:1 w9c (Fungi) - - - - 0.66 - - - -
† All correlation coefficients shown are significant at P < 0.05; - indicates non-significance; ‡ Brackets
following specific indicator PLFA gives the microbial group associated with the indicator PLFA.
Table 7. Pearson correlation coefficients for grain measures and PLFA biomarkers and
indicator species for five wheat cultivars grown conventionally in Edmonton, AB in 2005
and 2006.†
Se Zn Fe Mn Cu Mg K Grain
yield
Grain
protein
Flour
yield
Gram– bacteria - –0.37 - - - - 0.32 - - –0.41
Gram+ bacteria –0.46 - - 0.62 –0.37 0.53 0.40 –0.39 - –0.59
Actinomycetes –0.45 - –0.31 0.50 -0.41 0.46 0.34 –0.45 - –0.56
AM Fungi - –0.65 –0.34 - - - - - -0.46 -
Richness –0.52 - - 0.67 –0.40 0.55 0.42 –0.42 - –0.58
Evenness –0.43 - - 0.58 –0.36 0.47 0.46 –0.34 - –0.48
Diversity –0.48 - - 0.63 –0.40 0.53 0.46 –0.40 - –0.56
cyc17:0 (Bacteria)‡ - - - - - - - - - -
† All correlation coefficients shown are significant at P < 0.05; - indicates non-significance; ‡ Brackets
following specific indicator PLFA gives the microbial group associated with the indicator PLFA.
4. Discussion
We originally hypothesized that the stress levels associated with organic management systems
would result in higher levels of micronutrients in the grain, and specifically those with antioxidant
properties. The organic system in the present study had higher grain Zn, Fe, Mg and K, but lower grain
Se and Cu. Thus, only one (Zn) of the three antioxidants studied (Zn, Se and Cu) was indeed present in
Sustainability 2011, 3
512
the grain in greater concentrations in the organic system studied here. Selenium was present in very
low concentrations in the wheat grain in this study when compared with other studies of similar ilk
[13,32]. The Se concentration of wheat cultivars has been reported to be more influenced by soil
supply than genotype [32]. Some studies have reported some differences in wheat nutrient content
grown organically versus conventionally [13-15]. However, the choice of management practices
(e.g., tillage practices, crop rotation, fertility amendments) used within both of the systems under the
specific local conditions will have an effect on soil fertility, and the subsequent grain nutrient
concentration. Farmyard manure has been reported to provide a sustained supply of Cu and Zn to
cropping systems, increasing yields and improving wheat Cu and Zn uptake over fallow for at least
three years following manure application [33]. Ryan et al. [14] reported that organic systems increased
wheat grain Cu, N and Zn and decreased grain Fe and Mn, but concluded that differences in mineral
contents were due to specific management practices chosen by producers, not from the overall
management system. Turmel et al. [15] concluded that differences in mineral content of wheat grown
organically and conventionally was dependent on crop rotation. Decreased grain yield, and possibly
smaller grain size, may, in part, account for increased grain nutrient concentration in the present
organic system. We further hypothesized that historic western Canadian hard red spring cultivars
would have higher mineral content than modern cultivars, especially in organic systems; and that those
organic systems would have a more diverse microbial community structure. Significant interaction
effects of management × cultivar indicate that the choice of wheat cultivar to maximize grain
micronutrient level is dependent on management system. Glenlea grown organically had the highest
grain nutrient levels compared to cultivars grown either organically and conventionally. Glenlea was
the only Canadian extra strong wheat grown in the trial. Glenlea is generally characterized as having
medium protein content and stronger gluten than the other cultivars studied [34]. Recently, it was
reported that the introduction of semi-dwarf high-yielding cultivars has coincided with a decrease in
wheat grain Cu, Zn, Fe and Mg contents [35]. However, our results suggest no trend to lower grain
mineral concentrations in the modern, high-yielding red spring wheat cultivars in Western Canada.
This result is similar to that of Murphy et al. [10] who reported a neutral trend between year of release
and grain mineral content of hard red spring wheat cultivars of the Pacific Northwest. Murphy et al.
[10] did report a decline in all minerals tested (except Ca) in soft white wheat, where yield has been
successfully increased through breeding (apparently at the expense of some quality characters).
Canadian hard spring bread wheat breeding programs have emphasized grain quality and disease
resistance over the last century. It is evident that this emphasis on elevated grain quality in the western
Canadian hard red spring class has resulted in retention of micronutrient quality characters and not an
erosion of this quality characteristic.
Negative relationships between grain yield and grain Se, Zn, Fe, Mg and P have been reported in
bread wheat [7]. In the organic system, grain Zn, Fe, Mn and Mg concentrations were negatively
correlated with grain yield. However, in the conventional system only grain Zn and Mg concentrations
had weak and moderate (respectively) negative associations with yield. In both the organic and
conventional systems there was a positive relationship between grain Zn and Fe concentrations.
Rawat et al. [36] found wheat accessions with high Fe content also had high Zn content,
leading the authors to hypothesize that the nutrients shared similar uptake, translocation and
deposition mechanisms.
Sustainability 2011, 3
513
In the organic system of the present study, the presence of AM fungi appears to have improved the
uptake of Mn and Cu, but had a detrimental effect on Zn uptake. The indicator species for the organic
system were positively correlated with grain Mn and Cu concentrations. Specifically, the PLFA
biomarkers for fungi were all moderately correlated to grain Cu concentration, indicating that soil
fungi played a role in plant Cu fertility.
In both the organic and conventional systems, % AM fungi were negatively correlated with grain
Zn and Fe concentrations. In the organic system, % AM fungi and weight of AM fungi were positively
correlated with Mn and Cu concentrations of wheat grain, as well as grain yield. Mycorrhizae can
increase plant uptake of a number of nutrients, including: N, P, K, Ca, Mg, S, Fe, Mn, Cu and Zn
[14,37-40], however, where mycorrhizae are most beneficial is in the uptake of relatively immobile
nutrients such as phosphorus, copper and zinc [41].
Phospholipid fatty acid diversity was positively correlated with grain nutrient concentration of some
nutrients in both the organic and conventional systems, but differing nutrients in the two systems.
Diversity was also negatively correlated with some grain mineral concentrations. In both systems,
diversity was negatively correlated with grain Se and Cu concentrations, as well as grain yield.
The soil microbial community structure was different under the two management systems. The
management practices that differed between the organic and conventional systems (crop rotation, along
with fertility, pest management and tillage regimes) can all affect soil microbes, so we expected to see
differences between the community structures of the two systems. Differences between organic and
conventional management systems have been previously reported [21,23]. Differences are generally
expected between microbial communities of organic and conventional cropping systems, and instances
of no significant differences have been attributed to overriding effects of soil type and/or time of
sampling [21,24,25].
All but one of the indicator species of PLFAs were indicators for the organic system. The three
fungal PLFA biomarkers found in the soil were biomarkers for the organic cropping system, including
biomarker 16:1 w5c, which is used as a biomarker for AM fungi. Mycorrhizal potential, and actual
colonization has been reported to be greater in grasslands, organic and low-input systems versus
conventional systems [42-44]. This is largely attributed to the fact that the application of phosphorus
fertilizers, even at low rates, decreases root colonization of mycorrhizal fungi [14,42]
5. Conclusions
The organic system in the present study had higher grain Zn, Fe, Mg and K, but lower grain Se and
Cu. Wheat cultivar choice appears to be important for maximizing grain nutrient levels, and varies
depending on the management system. It is evident that the emphasis on elevated grain quality in the
western Canadian hard red spring class has resulted in the retention of micronutrient quality characters.
The organic system had higher levels of fungi in the soil, including AM fungi, and these fungi
biomarkers appeared to play a role in grain Cu concentration.
With elevated levels of micronutrients seemingly a component of both organic management
practices and the general hard red spring breeding effort in western Canada, it is evident that both the
agronomic system and breeding efforts in this region may lead to future increases.
Sustainability 2011, 3
514
Organic and conventional management systems have different soil microbial communities, and
these communities can play a role in soil fertility and final grain nutritional content. This study focused
on the effect of Canadian hard spring wheat cultivar choice on soil microbial communities and crop
nutritional quality within organic and conventional systems in the black soil zone of the northern Great
Plains. Further studies are required to determine the impact of other agronomic cropping practices such
as tillage, fertility management and a larger subset of wheat cultivars to identify best management
practices within organic and conventional systems for soil fertility and final crop quality.
It has been mentioned throughout the literature that increasing micronutrient levels in grain is but a
small component of improving health outcomes for the many people in both the developed and
developing world suffering nutrient deficiencies. Nevertheless, the results of the present study suggest
that nutritional advances in the micronutrient content of wheat can be made through the choice of
management system and through plant breeding. Such advances do not necessarily have to come at the
expense of elevated or stable grain yield.
Acknowledgements
We thank Alireza Navabi, Klaus Strenzke, Derrick Kanashiro, Brian Bowen, Holley Yorston,
Frances Reilly, Carla Ollenberger, Alana Kornelsen, Corrina Murdoch, and Madison Derworiz for
technical support. We gratefully acknowledge the Natural Sciences and Engineering Research Council
of Canada (NSERC), Alberta Ingenuity, and the University of Alberta for scholarship support to
A. Nelson. We further gratefully acknowledge financial support to D. Spaner through a Discovery
Grant from NSERC and a research grant from the Alberta Crop Industry Development Fund.
References
1. Yiridoe, E.K.; Bonti-Ankomah, S.; Martin, R.C. Comparison of consumer perceptions and
preference toward organic versus conventionally produced foods: A review and update of the
literature. Renew. Agr. Food Syst. 2005, 20, 193-205.
2. Lockie, S.; Haplin, D.; Gordon, R.; Pearson, D. Understanding the market for organic food.
In Organic Agriculture: A Global Perspective; Kristiansen, P., Taji, A., Reganold, J., Eds.;
Comstock Publishing Associates: Ithaca, NY, USA, 2006; pp. 245-258.
3. Brandt, K.; Mølgaard, J.P. Food quality. In Organic Agriculture: A Global Perspective;
Kristiansen, P., Taji, A., Reganold, J., Eds.; Comstock Publishing Associates: Ithaca, NY, USA,
2007; pp. 305-327.
4. Ritson, C.; Oughton, E. Food consumers and organic agriculture. In Understanding Consumers of
Food Products; Frewer, L., van Trijp, H., Eds.; CRC Press: Boca Raton, FL, USA, 2007;
pp. 254-272.
5. World Health Organization/Food and Agriculture Organization of the UN. Vitamin and Mineral
Requirements in Human Nutrition, 2nd ed.; WHO: Bangkok, Thailand, 1998.
6. Cordain, L.; Eaton, S.B.; Sebastian, A.; Mann, N.; Lindeberg, S.; Watkins, B.A.; O’Keefe, J.H.;
Brand-Miller, J. Origins and evolution of the Western diet: Health implications for the 21st
century. Am. J. Clin. Nutr. 2005, 81, 341-354.
Sustainability 2011, 3
515
7. White, P.J.; Broadley, M.R. Biofortification of crops with seven mineral elements often lacking in
human diets—iron, zinc, copper, calcium, magnesium, selenium and iodine. New Phytol. 2009,
182, 49-84.
8. Leonard, W.H.; Martin, J.H. Cereal Crops; MacMillan Publishing: New York, NY, USA, 1963.
9. Worthington, V. Nutritional quality of organic versus conventional fruits, vegetables, and grains.
J. Alternative Compl. Med. 2001, 7, 161-173.
10. Murphy, K.M.; Reeves, P.G.; Jones, S.S. Relationship between yield and mineral nutrient
concentrations in historical and modern spring wheat cultivars. Euphytica 2008, 163, 381-390.
11. Hornick, S.B. Factors affecting the nutritional quality of crops. Am. J. Alternative Agr. 1992, 7,
63-68.
12. Bourn, D.; Prescott, J. A comparison of the nutritional value, sensory qualities, and food safety of
organically and conventionally produced foods. Crit. Rev. Food Sci. Nutr. 2002, 42, 1-34.
13. Mäder, P.; Hahn, D.; Dubois, D.; Gunst, L.; Alföldi, T.; Bergmann, H.; Oehme, M.; Amadò, R.;
Schneider, H.; Graf, U.; Velimirov, A.; Fließbach, A.; Niggli., U. Wheat quality in organic and
conventional farming: Results of a 21 year field experiment. J. Sci. Food Agr. 2007, 87,
1826-1835.
14. Ryan, M.H.; Derrick, J.W.; Dann, P.R. Grain mineral concentrations and yield of wheat grown
under organic and conventional management. J. Sci. Food Agr. 2004, 84, 207-216.
15. Turmel, M.-S.; Entz, M.H.; Bamford, K.C.; Thiessen Martens, J.R. The influence of crop rotation
on the mineral nutrient content of organic vs. conventionally produced wheat grain: Preliminary
results from a long-term field study. Can. J. Plant Sci. 2009, 89, 915-919.
16. Davis, J.; Abbott, L. Soil fertility in organic farming systems. In Organic Agriculture: A Global
Perspective; Kristiansen, P., Taji, A., Reganold, J., Eds.; Comstock Publishing Associates: Ithaca,
NY, USA, 2006; pp. 25-51.
17. Shannon, D.; Sen, A.M.; Johnson, D.B. A comparative study of the microbiology of soils
managed under organic and conventional regimes. Soil Use Manag. 2002, 18, 274-283.
18. Siciliano, S.D.; Theoret, C.M.; de Freitas, J.R.; Hucl, P.J.; Germida, J.J. Differences in the
microbial communities associated with the roots of different cultivars of canola and wheat. Can. J.
Microbiol. 1998, 44, 844-851.
19. Entz, M.H.; Guilford, R.; Gulden, R. Crop yield and soil nutrient status on 14 organic farms in the
eastern portion of the northern Great Plains. Can. J. Plant Sci. 2001, 81, 351-354.
20. Snyder, C.; Spaner, D. The sustainability of organic grain production on the Canadian Prairies—a
review. Sustainability 2010, 2, 1016-1034.
21. Bossio, D.A.; Scow, K.M.; Gunapala, N.; Graham, K.J. Determinants of soil microbial
communities: Effects of agricultural management, season, and soil type on phospholipid fatty acid
profiles. Microb. Ecol. 1998, 36, 1-12.
22. Shepherd, M.A.; Harrison, R.; Webb, J. Managing soil organic matter—implications for soil
structure on organic farms. Soil Use Manag. 2002, 18, 284-292.
23. Lundquist, E.J.; Scow, K.M.; Jackson, L.E.; Uesugi, S.L.; Johnson, C.R. Rapid response of soil
microbial communities from conventional, low input, and organic farming systems to a wet/dry
cycle. Soil Biol. Biochem. 1999, 31, 1661-1675.
Sustainability 2011, 3
516
24. Wander, M.M.; Hedrick, D.S.; Kaufman, D.; Traina, S.J.; Stinner, B.R.; Kehrmeyer, S.R.;
White, D.C. The functional significance of the microbial biomass in organic and conventionally
managed soils. Plant Soil 1995, 170, 87-97.
25. Girvan, M.S.; Bullimore, J.; Pretty, J.N.; Osborn, A.M.; Ball, A.S. Soil type is the primary
determinant of the composition of the total and active bacterial communities in arable soils.
Appl. Environ. Microbiol. 2003, 69, 1800-1809.
26. Nelson, A.G.; Quideau, S.; Frick, B.; Niziol, D.; Clapperton, J.; Spaner, D. Spring wheat
genotypes differentially alter soil microbial communities and wheat breadmaking quality in
organic and conventional systems. Can. J. Plant Sci. 2011, in press.
27. Dalpé, Y.; Hamel, C. Arbuscular mycorrhizae. In Soil Sampling and Methods of Analysis, 2nd ed.;
Carter, M.R., Gregorich, E.G., Eds.; CRC Press: Boca Raton, FL, USA, 2007; pp. 355-378.
28. DeGrood, S.H.; Claassen, V.P.; Scow, K.M. Microbial community composition on native and
drastically disturbed serpentine soils. Soil Biol. Biochem. 2005, 37, 1427-1435.
29. Thavarajah, D.; Thavarajah, P.; Sarker, A.; Vandenberg, A. Lentils (Lens culinaris Medikus
Subspecies culinaris): A whole food for increased iron and zinc intake. J. Agric. Food Chem.
2009, 57, 5413-5419.
30. Thavarajah, D.; Vandenberg, A.; George, G.N.; Pickering, I.J. Chemical form of selenium in
naturally selenium-rich lentils (Lens culinaris L.) from Saskatchewan. J. Agric. Food Chem. 2007,
55, 7337-7341.
31. Steel, R.G.D.; Torrie, J.H.; Dickey, D.A. Principles and Procedures of Statistics: A Biometrical
Approach.;WCB McGraw-Hill: Madison, WI, USA, 1997.
32. Zhao, F.J.; Su, Y.H.; Dunham, S.J.; Rakszegi, M.; Bedo, Z.; McGrath, S.P.; Shewry, P.R.
Variation in mineral micronutrient concentrations in grain of wheat lines of diverse origin.
J. Cereal Sci. 2009, 49, 290-295.
33. Mishra, B.N.; Prasad, R.; Gangaiah, B.; Shivakumar, B.G. Organic manures for increased
productivity and sustained supply of micronutrients Zn and Cu in a rice-wheat cropping system.
J. Sustain. Agr. 2006, 28, 55-66.
34. McCallum, B.D.; DePauw, R.M. A review of wheat cultivars grown in the Canadian prairies.
Can. J. Plant Sci. 2008, 88, 649-677.
35. Fan, M.S.; Zhao, F.J.; Fairweather-Tait, S.J.; Poulton, P.R.; Dunham, S.J.; McGrath, S.P.
Evidence of decreasing mineral density in wheat grain over the last 160 years. J. Trace Elem. Med.
Biol. 2008, 22, 315-324.
36. Rawat, N.; Tiwari, V.K.; Singh, N.; Randhawa, G.S.; Singh, K.; Chhuneja, P.; Dhaliwal, H.S.
Evaluation and utilization of Aegilops and wild Triticum species for enhancing iron and zinc
content in wheat. Genet. Resour. Crop Evol. 2009, 56, 53-64.
37. Al-Karaki, G.; McMichael, B.; Zak, J. Field response of wheat to arbuscular mycorrhizal fungi
and drought stress. Mycorrhiza 2004, 14, 263-269.
38. Cruz, C.; Green, J.J.; Watson, C.A.; Wilson, F.; Martins-Loução, M.A. Functional aspects of root
architecture and mycorrhizal inoculation with respect to nutrient uptake capacity. Mycorrhiza
2004, 14, 177-184.

Sustainability 2011, 3
517
39. Mohammad, M.J.; Malkawi, H.I.; Shibli, R. Effects of arbuscular mycorrhizal fungi and
phosphorus fertilization on growth and nutrient uptake of barley grown on soils with different
levels of salts. J. Plant Nutr. 2003, 26, 125-137.
40. Mohammad, M.J.; Pan, W.L.; Kennedy, A.C. Chemical alteration of the rhizosphere of the
mycorrhizal-colonized wheat root. Mycorrhiza 2005, 15, 259-266.
41. Habte, M. The roles of arbuscular mycorrhizas in plant and soil health. In Biological Approaches
to Sustainable Soil Systems; Uphoff, N., Ball, A.S., Fernandes, E.C.M., Herren, H., Husson, O.,
Laing, M., Palm, C., Pretty, J., Sanchez, P., Eds.; Taylor & Francis Group LLC: Boca Raton, FL,
USA, 2006; pp. 129-148.
42. Mäder, P.; Edenhofer, S.; Boller, T.; Wiemken, A.; Niggli, U. Arbuscular mycorrhizae in a
long-term field trial comparing low-input (organic, biological) and high-input (conventional)
farming systems in a crop rotation. Biol. Fertil. Soils 2000, 31, 150-156.
43. Entz, M.H.; Penner, K.R.; Vessey, J.K.; Zelmer, C.D.; Thiessen Martens, J.R. Mycorrhizal
colonization of flax under long-term organic and conventional management. Can. J. Plant Sci.
2004, 84, 1097-1099.
44. Oehl, F.; Sieverding, E.; Mäder, P.; Dubois, D.; Ineichen, K.; Boller, T.; Wiemken, A. Impact of
long-term conventional and organic farming on the diversity of arbuscular mycorrhizal fungi.
Oecologia 2004, 138, 574-583.
© 2011 by the authors; licensee MDPI, Basel, Switzerland. This article is an open access article
distributed under the terms and conditions of the Creative Commons Attribution license
(http://creativecommons.org/licenses/by/3.0/).