Multinucleon mechanisms in (gamma,N) and (gamma,NN) reactions
arX
iv:a
stro
-ph/
0112
326v
2 2
5 Fe
b 20
02
The Soft Gamma-Ray Spectral Variability of Cygnus X-1
M. L. McConnell1,9, A. A. Zdziarski2, K. Bennett5, H. Bloemen4, W. Collmar3, W.
Hermsen4, L. Kuiper4, W. Paciesas7, B. F. Phlips6, J. Poutanen8, J. M. Ryan1, V.
Schonfelder3, H. Steinle3, and A. W. Strong3
ABSTRACT
We have used observations of Cygnus X-1 from the Compton Gamma-Ray Observatory(CGRO) and BeppoSAX to study the variation in the MeV γ-ray emission between the hardand soft spectral states, using spectra that cover the energy range 20 keV up to 10 MeV. Thesedata provide evidence for significant spectral variability at energies above 1 MeV. In particular,whereas the hard X-ray flux decreases during the soft state, the flux at energies above 1 MeVincreases, resulting in a significantly harder γ-ray spectrum at energies above 1 MeV. This be-havior is consistent with the general picture of galactic black hole candidates having two distinctspectral forms at soft γ-ray energies. These data extend this picture, for the first time, to energiesabove 1 MeV. We have used two different hybrid thermal/non-thermal Comptonization modelsto fit broad band spectral data obtained in both the hard and soft spectral states. These fitsprovide a quantitative estimate of the electron distribution and allow us to probe the physicalchanges that take place during transitions between the low and high X-ray states. We find thatthere is a significant increase (by a factor of ∼ 4) in the bolometric luminosity as the sourcemoves from the hard state to the soft state. Furthermore, the presence of a non-thermal tail inthe Comptonizing electron distribution provides significant constraints on the magnetic field inthe source region.
Subject headings: accretion, accretion disks — black hole physics — gamma rays: observations — stars:individual (Cygnus X-1) — X-rays: stars
1. Introduction
High energy emission from galactic black holecandidates (GBHCs) is characterized by variabil-
1Space Science Center,University of New Hampshire,Durham, NH 03824
2N. Copernicus Astronomical Center, Warsaw, Poland3Max Planck Institute for Extraterrestrial Physics,
Garching, Germany4Space Research Organization of the Netherlands
(SRON), Utrecht,The Netherlands5Astrophysics Division, ESTEC, Noordwijk, The
Netherlands6Naval Research Laboratory, Code 7650, Washington,
DC 203757University of Alabama at Huntsville, Huntsville, AL
358998Astronomy Division, P.O. Box 3000, 90014 University
of Oulu, Finland9e-mail: [email protected]
ity on time scales ranging from msec to months.In the case of Cygnus X-1, it has long been rec-ognized that, on time scales of several weeks, thesoft X-ray emission (∼ 10 keV) generally varies be-tween two discrete levels (e.g., Priedhorsky et al.1983; Ling et al. 1983; Liang & Nolan 1983). Thesource seems to spend most (∼ 90%) of its timein the so-called low X-ray state, characterized bya relatively low flux of soft X-rays and a relativelyhigh flux of hard X-rays (∼ 100 keV). This stateis sometimes referred to as the hard state, basedon the nature of its soft X-ray spectrum. On occa-sion, it moves into the so-called high X-ray state,characterized by a relatively high soft X-ray fluxand a relatively low hard X-ray flux. This stateis sometimes referred to as the soft state, basedon the nature of its soft X-ray spectrum. Thereare, however, some exceptions to this general be-
1

havior. For example, HEAO-3 observed, in 1979,a relatively low hard X-ray flux coexisting with alow level of soft X-ray flux (Ling et al. 1983, 1987).Ubertini et al. (1991) observed a similar behaviorin 1987.
Observations by the BATSE, OSSE, COMP-TEL and EGRET instruments on the ComptonGamma-Ray Observatory (CGRO), coupled withobservations by other high-energy experiments(e.g., SIGMA, ASCA and RXTE) have provideda wealth of new information regarding the emis-sion properties of galactic black hole candidates.One important aspect of these high energy radia-tions is spectral variability, observations of whichcan provide constraints on models which seek todescribe the global emission processes. Based onobservations by OSSE of seven transient galacticblack hole candidates at soft γ-ray energies (i.e.,below 1 MeV), two γ-ray spectral shapes havebeen identified that appear to be well-correlatedwith the soft X-ray state (Grove et al. 1997, 1998;Grove 1999). In particular, these observations de-fine a breaking γ-ray spectrum that correspondsto the hard (low) X-ray state and a power-law γ-ray spectrum that corresponds to the soft (high)X-ray state.
A thorough understanding of the nature ofthese systems requires modeling that cannot onlyexplain the individual spectra, but can also ex-plain the transitions between the various spectralstates (e.g., Grove et al. 1998; Liang 1998; Pouta-nen 1998a). In recent years, a general theoreticalpicture of the accretion flow in Cygnus X-1 hasemerged which appears to provide a reasonableexplanation of the spectral data in both the lowand high X-ray states. This model includes an in-ner optically-thin, geometrically-thick advection-dominated accretion flow (ADAF) surrounded byan outer, geometrically-thin, optically-thick accre-tion disk (Esin et al. 1998). The outer disk ischaracterized by a blackbody spectrum. ADAFflows (e.g., Narayan 1996) are characterized bytheir relatively low radiative efficiencies and by atwo-temperature structure, with the ions nearlyvirial at Ti ∼ 1012 K and the electrons at Te ∼ 109
K. The high temperature of the ADAF leads to anextended, quasi-spherical geometry. Hot optically-thin ADAFs exist only below a certain critical ac-cretion rate. The transition radius between theADAF and the thin disk therefore depends on the
accretion rate. At higher accretion rates, where itis more difficult to support the ADAF, the tran-sition radius moves to smaller radii, closer to theblack hole. The ADAF region is largely responsi-ble for the hard X-ray flux (∼ 20−100 keV), whilethe outer thin disk is generally responsible for thesoft X-ray flux (∼ 2 − 10 keV).
In the context of this general model, the spec-tral state of Cygnus X-1 depends on the ac-cretion rate. At low accretion rates, the innerADAF extends out to a transition radius of ∼ 100Schwarzschild radii (Esin et al. 1998). In thisconfiguration, the ADAF region makes a signif-icant contribution to the hard X-ray flux. Athigher accretion rates, it becomes more difficultto support the ADAF. The ADAF region thereforeshrinks, and the transition radius moves inward,although there may exist a low-density ADAFcorona surrounding the thin disk (Narayan et al.1998). The level of hard X-ray flux decreases dueto the smaller volume of the ADAF region, whilethe level of soft X-ray flux increases due to thelarger size of the thin disk region. In this sce-nario, the hard state corresponds to a relative lowaccretion rate, with the spectrum dominated bythe ADAF region, and the soft state correspondsto a relatively high accretion rate, with the spec-trum dominated by the blackbody of the outerthin disk region. Small changes in the accretionrate (on the order of 10–15%) may be sufficientto trigger a transition between the hard and softstates (Esin et al. 1998).
The ADAF model described above provides aconsistent framework for understanding the essen-tial dynamics and spectra of black hole accretionflows. In the context of this framework, how-ever, simple thermal Comptonization models ap-pear unable to account for all of the spectral fea-tures, especially the hard power-law tail that isseen at energies above ∼ 600 keV (Gierlinski et al.1999). Poutanen & Coppi (1998) used a geometrysimilar to that described above (Poutanen et al.1997) and assumed some (unspecified) source ofnon-thermal electrons that remains constant dur-ing the spectral state transitions. This suggeststhat the non-thermal component may play a moresignificant role, especially at higher energies, dur-ing the high X-ray state, where the ADAF contri-bution is suppressed.
Hybrid thermal/non-thermal plasmas have of-
2

ten been successfully used to model the observeddata (e.g., Gierlinski et al. 1999; Poutanen &Coppi 1998). Based on the assumption thatthe spectrum results from inverse Compton scat-tering of a thermal photon spectrum by ener-getic electrons, the underlying electron populationcould be described as a combination of a ther-mal Maxwellian and a power-law tail extendingto higher energies. The presence of a non-thermalcomponent is often assumed a priori, without anyspecific model to explain the origin, although theexistence of such distributions is clearly estab-lished in the case of solar flares (e.g., Coppi 1999)and it is therefore natural to expect that similardistributions exist elsewhere in the universe (e.g.,Crider et al. 1997; Gierlinski et al. 1997; Poutanen& Svensson 1996; Poutanen 1998a; Poutanen &Coppi 1998; Coppi 1999). Others have consideredphysical mechanisms by which non-thermal elec-tron distributions might be developed. For exam-ple, both stochastic particle acceleration (Dermeret al. 1996; Li et al. 1996) and MHD turbulence(Li & Miller 1997) have been proposed as mecha-nisms for directly accelerating the electrons. Theion population might also contribute to the non-thermal electron distribution in the case where atwo-temperature plasma develops (e.g., Dahlbackaet al. 1974; Shapiro et al. 1976; Chakrabarti &Titarchuk 1995). With ion population tempera-tures approaching kTi ∼ 1012 K, πo productionfrom proton-proton interactions may take place(e.g., Eilik 1980; Eilik & Kafatos 1983; Mahade-van et al. 1997). The πo component may thenlead, via photon-photon interactions between theπo-decay photons and the X-ray photons, to pro-duction of energetic (nonthermal) e+ − e− pairs.Jordain & Roques (1994) used this concept to fitthe hard X-ray tails of not only Cygnus X-1, butalso GRO J0422+32 and GX 339-4, as measuredby both SIGMA and OSSE. While retaining astandard thermal Comptonization spectrum (Sun-yaev & Titarchuk 1980) to explain the emission atenergies below 200 keV, they used πo productionto generate the nonthermal pairs needed to fit thespectrum at energies above ∼ 200 keV.
The power-law spectra seen in the high X-raystate have also been modeled as resulting frombulk-motion Comptonization (e.g., Ebisawa et al.1996b; Titarchuk et al. 1997; Laurent & Titarchuk1999). In this model, the flow becomes quasi-
spherical within the inner-most stable orbit. Thenearly relativistic flow of the free-falling electronsgives rise to the Comptonization of ambient pho-tons. This model predicts power-law spectra, witha slope that depends on the mass acretion rate.The difficulty with this model is that it predictsspectral sharp cutoffs below 500 keV, a result thatis clearly inconsistent with the observed spectra.Although we cannot rule out bulk motion Comp-tonization as a contributor to the spectrum atlower energies, it is clearly not capable of account-ing for the high energy emission.
Improvements in the theoretical modeling ofspectral state transitions can be expected to arisefrom improved observations at energies above 600keV. It will be important to understand how thispart of the spectrum, most likely dominated bynon-thermal emission, changes during the spectraltransition. Of particular interest will be observa-tions that can discern a clear cutoff in the spectraat high energies. The precise energy of the cutoff isa function of the compactness of the source region,since it is influenced by γ−γ opacity. A measure ofthe cutoff energy, possibly coupled with measure-ments of the 511 keV e± annihilation line, will helpconstrain the compactness of the region responsi-ble for the emission and determine the extent towhich e± pairs may play a role in the emissionregion (Poutanen 1998a).
Using hard state data collected during the firstthree years of the CGRO mission, McConnell etal. (2000a) compiled a broad-band hard state spec-trum of Cygnus X-1 using contemporaneous datafrom all four instruments on CGRO (BATSE,OSSE, COMPTEL and EGRET). Unlike previ-ous broad-band studies, these data provided ameasurement of the spectrum at energies above1 MeV. The resulting spectrum showed evidencefor significant levels of non-thermal emission atenergies out to 5 MeV. The spectral shape, al-though consistent with the so-called breakingspectral state (Grove et al. 1997, 1998) of theγ-ray emission, was clearly not consistent withstandard Comptonization models. The hybridthermal/non-thermal model of Poutanen & Svens-son (1996) was used to fit the hard state data, withfits that indicated a thermal electron populationwith a temperature of ∼ 90 keV and a high energypower-law electron component with a spectral in-dex of ∼ 4.5.
3

In May of 1996, a transition of Cyg X-1 into asoft state was observed by RXTE, beginning onMay 10 (Cui 1997). The 2–12 keV flux reached alevel of 2 Crab on May 19, four times higher thanits normal value. Meanwhile, at hard X-ray ener-gies (20-200 keV), BATSE measured a significantdecrease in flux (Zhang et al. 1997). Motivated bythese dramatic changes, a target-of-opportunity(ToO) for CGRO , with observations by OSSE andCOMPTEL began on June 14 (CGRO viewing pe-riod 522.5). Here we report on the results from ananalysis of the CGRO data from this ToO obser-vation, incorporating the high energy results fromCOMPTEL. This includes a comparison with re-sults obtained from an updated analysis of CGRO
soft state data, making use of the same data stud-ied previously by McConnell et al. (2000a). In § 2we describe the CGRO observations of Cygnus X-1 in its hard state. The data analysis is describedin § 3, followed by a discussion of those results in§ 4.
2. Observations
During its nine-year lifetime (1991–2000), theinstruments on CGRO obtained numerous obser-vations of the Cygnus region. The COMPTELexperiment (Schonfelder et al. 1993), imaging theenergy range from about 750 keV up to 30 MeV,collected an extensive set of data, in part due toits rather large (∼ π steradian) field-of-view. TheCOMPTEL data currently provide the best avail-able source of data for studies of Cygnus X-1 atenergies above 1 MeV.
The 20–100 keV time history of Cygnus X-1, asderived from BATSE occultation data, is shownin the center panel of Figure 1. The top panelof Figure 1 shows the 20–100 keV power-law spec-tral index, as derived from the BATSE occultationdata. These data cover most of the CGRO mis-sion, from the launch in April of 1991 until theend of 1999. During the first few months of theCGRO mission (up until October of 1991), all-sky monitoring data from Ginga (1–20 keV) wasavailable, showing that the source was in its lowX-ray state during this period (Kitamoto et al.2000). From October of 1991 until December of1995, there were only sporadic pointed X-ray ob-servations of the soft X-ray flux from Cygnus X-1.It was not until the launch of RXTE, in Decem-
ber of 1995, that continuous data on the soft X-rayflux once again became available. The data fromthe RXTE All-Sky Monitor (ASM) are shown inthe lower panel of Figure 1, in the form of the 2–10keV count rate.
The data shown in Figure 1 dramaticallydemonstrate the general X-ray behavior of CygnusX-1. During the CGRO mission, Cygnus X-1spent about 90% of its time in the hard state.In this state, the soft X-ray flux (2–10 keV) isrelatively low, while the hard X-ray flux (20–100keV) is relatively high. The spectral shape inthe 20–100 keV energy band is a relatively hardpower-law spectrum with a photon spectral index,Γ, near 1.8. The soft state was clearly observedduring the CGRO mission on only two occassions.In each case, the soft state period lasted about 5months. The soft state is characterized by a rela-tively high level of soft X-rays (2–10 keV), a rela-tively low level of hard X-rays (20–100 keV) and arelatively soft spectrum in the 20–100 keV energyband (photon spectral index ∼ 2.5). The soft statewas first observed by CGRO in January of 1994,at a time (prior to the launch of RXTE) whenthere was no soft X-ray monitoring data available.(This transition is clearly seen in Figure 1 nearTJD 9400.) A CGRO target-of-opportunity wasdeclared (CGRO viewing period 318.1) so that allfour CGRO instruments (not just BATSE) couldcollect data. Observations by COMPTEL showedno detectable level of emission. This null result,however, was consistent with an extrapolation ofthe E−2.7 power-law spectrum measured at hardX-ray energies by both BATSE (Ling et al. 1997)and OSSE (Phlips et al. 1996).
The second observation of a soft state tookplace in May of 1996. The transition was firstobserved by RXTE, beginning on May 10 (Cui1997). The 2–12 keV flux reached a level of 2Crab on May 19, four times higher than its nor-mal value. Meanwhile, at hard X-ray energies (20-200 keV), BATSE measured a significant decrease
in flux (Zhang et al. 1997). Motivated by thesedramatic changes, a ToO for CGRO was declaredand observations by OSSE and COMPTEL beganon June 14 (CGRO viewing period 522.5). (Un-fortunately, the EGRET experiment was turnedoff during this viewing period, as part of an ef-fort to conserve its supply of spark chamber gas.)During the ToO, COMPTEL collected 11 days of
4

data (from June 14 to June 25) at a favorable as-pect angle of 5.3. The X-ray flux time historiesnear the time interval associated with VP 522.5are shown in Figure 2.
An early preliminary analysis of COMPTELdata from this second high-state observation re-vealed some unusual characteristics (McConnell etal. 2000b). The 1–3 MeV image (Figure 3) showedan unusually strong signal from Cygnus X-1 whencompared with other observations of similar ex-posure. The flux level was significantly higherthan the average flux seen from earlier observa-tions (McConnell et al. 1994, 2000a). In the 1–3MeV energy band, the flux had increased by a fac-tor of 2.5, from 8.6(±2.7)×10−5 cm−2s−1 MeV−1
to 2.2(±0.4) × 10−4 cm−2 s−1 MeV−1. The ob-served change in flux is significant at a level of2.6σ. In addition, unlike in previous measure-ments, there was no evidence for any emission atenergies below 1 MeV. This fact is explained, inpart, by a slowly degrading sensitivity of COMP-TEL at energies below 1 MeV due to increasing en-ergy thresholds in the lower (D2) detection plane.Part of the explanation, however, appears to bethe presence of a much harder source spectrum.OSSE data collected during this period showed aphoton spectrum similar to that observed in 1994(i.e., a power-law with an index of ∼ 2.5), but at ahigher intensity level, about a factor of two higherin overall normalization. The extrapolation of thismore intense power-law spectrum is entirely con-sistent with the positive detection by COMPTEL.
3. Data Analysis
A more detailed description of the COMP-TEL data analysis is given in McConnell et al.(2000a). Here we provide only a brief overview.The COMPTEL image shown in Figure 3 is amaximum likelihood map derived from VP 522.5data integrated over the energy loss range of 1–3MeV. The contours represent constant values ofthe quantity −2 lnλ, where λ is the likelihood ra-tio. In a search for single point sources, −2 lnλ hasa chi-square distribution with 3 degrees of free-dom. (For instance, a 3σ detection correspondsto −2 lnλ = 14.2.) Cygnus X-1 is clearly visible.The likelihood reaches a value of −2 lnλ = 30.1at the position of Cygnus X-1, which correspondsto a detection significance of 5.5σ. These same
data were used to derive the 1σ, 2σ and 3σ loca-tion confidence contours shown in Figure 4, whichdemonstrate the ability of COMPTEL to locatethe source of emission. In defining constraints onthe source location, −2 lnλ has a chi-square dis-tribution with 2 degrees of freedom. So the 1σ, 2σand 3σ location confidence contours correspond toa change in likelihood of 2.3, 6.2, and 11.8, re-spectively. The contours reflect only the statis-tical uncertainties; systematic effects are not in-cluded. The COMPTEL flux results for VP 522.5are shown in Table 1.
The analysis of COMPTEL data for a weaksource (such as Cygnus X-1) involves generatingan image for each of several energy bands, de-riving the source flux in each energy band, andsubsequently combining these results into a spec-trum (e.g., McConnell et al. 2000a). The imagegeneration process, in turn, requires an instru-ment point-spread-function (PSF) that is depen-dent on some assumed form for the incident pho-ton spectrum. Because the spectrum extractionrelies on an assumed source spectrum (we typi-cally assume an E−2 power-law spectrum), it isnot possible to analyze the COMPTEL data us-ing a simple response function to relate measuredenergy-loss count rates to the incident photon flux.We have therefore resorted to spectral fitting ofCOMPTEL data in photon space. We have pre-viously shown (McConnell et al. 2000a) that thisapproach to COMPTEL spectral analysis worksfine for the range of spectra considered for CygnusX-1. In other words, for the range of parametersconsidered here, there is no evidence of any signif-icant level of spectral compliance in the COMP-TEL spectral analysis.
In previous work (McConnell et al. 2000a), weanalyzed a contemporaneous set of CGRO datacorresponding to the hard state of Cygnus X-1. That analysis was performed entirely in pho-ton space, using one deconvolved spectrum eachfor BATSE, OSSE and COMPTEL. The BATSEspectrum had been generated using the JPL En-hanced BATSE Occultation Package (EBOP; Linget al. 1996, 2000), while the OSSE spectrum wasbased on the results of Phlips et al. (1996). Theanalysis was performed within XSPEC (Arnaud1996) to take advantage of the XSPEC analysistools. In this case, however, the spectral data (phafiles) were generated in units of photons cm−2 s−1
5

and the response function matrices (rsp files) weregenerated as unit matrices. With these data, thespectral fits were effectively being performed inphoton space. This approach greatly simplifiedthe analysis effort.
The analysis employed here for the soft statedata from VP 522.5 represents a significant im-provement over that performed previously in gen-erating a broad-band gamma-ray spectrum forthe hard state. Although the limitations of theCOMPTEL data analysis remain, we have uti-lized more complete spectral response informationfor both BATSE and OSSE, using proper XSPECpha and rsp files. The fundamental nature of theCOMPTEL data (in particular, its reliance on anassumed PSF for extracting source counts) stillprecludes a proper XSPEC analysis of the COMP-TEL data.
Since the BATSE EBOP processing has notbeen carried out for data collected after 1994,EBOP data for VP 522.5 is not available. Instead,we have used data derived from the BATSE team’sstandard Earth occultation analysis (Harmon etal. 2002). The final BATSE spectrum representsa weighted average of the four forward-facing de-tectors.
For consistency, in order to make a more usefulcomparison with the soft state data, we have re-peated the earlier hard state analysis (McConnellet al. 2000a) following the same procedures as wehave used here for the VP 522.5 data. In particu-lar, the updated hard state analysis now also usedBATSE data derived from the standard Earth oc-cultation technique (Harmon et al. 2002). Datafrom nine separate CGRO viewing periods wereused (see Table 1 in McConnell et al. 2000a). Ineach case a weighted average spectrum was derivedfrom the data for use in the final analysis.
Finally, our most recent analysis incorporatesthe BATSE data down to 20 keV and OSSEdata down to 50 keV. Previously, we had usedonly those data above 200 keV. The lower en-ergy threshold of this analysis improves the abil-ity of our fits to constrain the spectral models.At the same time, the lower threshold may alsomake the analysis more sensitive to systematicuncertainties in the low energy response of bothBATSE and OSSE. The OSSE (Johnson et al.1993) data include energy-dependent systematicerrors (estimated from the uncertainties in the
low-energy calibration and response of the detec-tors using both in-orbit and prelaunch calibrationdata), which are most important at the lowest en-ergies, ∼ 3% at 50 keV, decreasing to ∼ 0.3% at& 150 keV. To the BATSE data, we added a 5%systematic error. The COMPTEL data have rela-tively large statistical errors, and thus no system-atic error was added.
3.1. The Average Hard (Low) State Spec-trum
X-rays from Cygnus X-1 in the hard stateare well modeled by thermal Comptonization andCompton reflection (Gierlinski et al. 1997; DiSalvo et al. 2001; Frontera et al. 2001). Thus,we fit the joint data by this model, but also al-lowing for a tail at high electron energies ratherthan the Maxwellian cutoff. This is similar to theapproach used in McConnell et al. (2000a), exceptthat here we have added the Compton reflectioncomponent, which is important at energies belowa few hundred keV.
We first fit the data using the Comptonizationmodel (compps)1 of Poutanen & Svensson (1996),assuming a spherical source geometry. The elec-trons have the total Thomson optical depth ofτ . Their distribution in this model is Maxwellianwith an electron temperature, kT , up to a Lorentzfactor, γmin, above which it is a power law with anindex, p. The power law extends to a large Lorentzfactor, γmax. The precise value of γmax, however,has little effect on the fit to our data as long asγ2max times the seed photon energy is > 10 MeV.
Given that the seed photons peak at a fraction ofkeV (Ebisawa et al. 1996a; Di Salvo et al. 2001),we assume γmax = 103. The Comptonization spec-trum is then Compton-reflected from a cold slab(presumably an accretion disk) subtending a solidangle, Ω (Magdziarz & Zdziarski 1995). A disk in-clination of i = 45 is assumed (as in Gierlinski etal. 1997; Frontera et al. 2001). For this model, wefound Ω is not constrained by our data and we keptit fixed at a typical value Ω/2π = 0.5 (Gierlinski etal. 1997; Gilfanov et al. 1999; Di Salvo et al. 2001).This value also follows from our fit below usinganother theoretical model. The seed photons forComptonization are assumed to be a (multicolor)blackbody emission of the disk with the maximum
1available at ftp://ftp.astro.su.se/pub/juri/XSPEC/COMPPS
6

blackbody temperature of kTs = 0.2 keV, whichapproximately corresponds to a single blackbodytemperature of ∼ 0.13–0.15 keV obtained in thefits of Ebisawa et al. (1996a) and Di Salvo et al.(2001).
During the data analysis, we find some resid-ual discrepancies between the different data sets,as expected for different instruments. First, theBATSE spectrum has a slightly higher normaliza-tion than the OSSE one, and thus we allow theirrelative normalization to be free in the fits. Fur-thermore, the BATSE spectrum is systematicallyslightly softer, by ∆Γ ≃ 0.1 (where Γ is the pho-ton power law index), than the OSSE spectrum.We find that multiplying the BATSE model byan additional power law with that ∆Γ leads to areduction of χ2/ν from 71/48 to 37/47, which ishighly significant at the 2 × 10⁻⁸ level, using theF-test (Bevington & Robinson 1992). Thus, weapply this correction, fixing ∆Γ hereafter at thebest-fit value. The best-fit ratio of the BATSEand OSSE fluxes at 100 keV is then 1.26 (buthigher and lower at higher energies and lower en-ergies, respectively). Furthermore, we find thatthe COMPTEL data at ∼ 1 MeV appear to havesomewhat higher normalization than the BATSEand OSSE ones. The best-fit relative normaliza-tion is ∼ 1.5, consistent with results for the softstate (see below). Given the limited statistics ofthe COMPTEL hard-state data, we fix that rela-tive normalization at 1.5. We note that this yieldsa conservative estimate of the amplitude of thenonthermal tail in Cygnus X-1.
The compps fit results are given in Table 2.They are similar to the preliminary results of Mc-Connell et al. (2000a), who neglected Compton re-flection. We note that the fitted electron distribu-tion is allowed to be significantly different from apure Maxwellian, with a power law tail beginningat a rather low energy. This reflects the fact thatan arbitrary electron distribution peaked at lowenergies yields Comptonization spectra relativelysimilar to those from a pure Maxwellian (Ghis-ellini et al. 1993), apart from the high-energy tailin the former case.
We then fit the same data using a different hy-brid Comptonization model, eqpair (Coppi 1992,1999; Poutanen & Coppi 1998; Gierlinski et al.1999). Unlike compps, which assumed the formof the steady-state electron distribution, eqpair
calculates that distribution self-consistently as-suming instead the electron acceleration to be apower law with an index, Γinj between γmin andγmax. The accelaration takes place in a back-ground thermal plasma with a Thomson opticaldepth of ionization electrons, τi. The steady-stateelectron distribution consists then of a Maxwellianat the temperature, kT , calculated from the bal-ance of Compton and Coulomb gains and losses,and the optical depth, τ , with τ − τi due to thee± pair production. The nonthermal steady-stateelectron distribution is calculated from Coulomband Compton losses of both the accelerated elec-trons and e± pairs produced at nonthermal ener-gies. That distribution, in general, does not havea power law form. Unlike compps, the electron dis-tribution is now a sum of the Maxwellian and thenonthermal part (rather than being a Maxwellianup to γmin and then nonthermal). We assumeγmin = 1.5 and γmax = 103. Unlike the case ofcompps, where the value of γmin determined thetransition from the Maxwellian to the power law,that value has relative little effect on the fit now.
The rates of microscopic processes per unit lighttravel time across the source depend in generalon the plasma compactness, ℓ ≡ LσT/(Rmec
3),where L is a power supplied to the hot plasma, Ris its characteristic size, and σT is the Thomsoncross section (e.g., Svensson 1987). We then de-fine a hard compactness, ℓh, corresponding to thepower supplied to the electrons, and a soft com-pactness, ℓs, corresponding to the power in softseed photons irradiating the plasma (which are as-sumed to be emitted by a blackbody disk). Thecompactnesses corresponding to the electron ac-celeration and to a direct plasma heating (i.e., inaddition to Coulomb energy exchange with non-thermal e± and Compton heating) of the thermale± are denoted as ℓnth and ℓth, respectively, andℓh = ℓnth + ℓth. Details of the model are given inGierlinski et al. (1999).
The eqpair fit results are given in Table 2. Fig-ure 5 shows the spectrum. Figure 6 shows themodel spectral components over the broad energyrange from 0.1 keV to 100 MeV. The nonthermalhigh-energy tail starts at ∼ 1 MeV.
The bolometric flux derived from the eqpair
model is very similar to that in the compps model.Some differences between the values of kT and τmay be attributed to the different treatment of
7

the microphysics (see above). Also, the eqpair
model gives a somewhat better fit to the data thanthe compps model. In addition, the eqpair modelprovides a better constraint on the value of Ω/2π(Table 2). The better fit most likely reflects thefact that more physical processes are accountedfor by eqpair than by compps.
In particular, pair production is important atthe best fit of the eqpair model, which accountsfor τ − τi > 0 in Table 2, and the associated injec-tion of nonthermal e± at low energies. The lattereffect leads to a softening of the nonthermal spec-tra (Svensson 1987) and explains the relatively lowvalue of Γinj (without pair production and in theThomson regime, p would be ≃ Γinj + 1, e.g., Blu-menthal & Gould 1970). On the other hand, at thelowest ℓs allowed by the data, ≃ 0.2, the plasmacompactness is so small that we find basically nopair production, i.e., τ = τi. Thus, the presentdata do not resolve the issue of the role of pairproduction conclusively.
The bolometric luminosity of the average hard-state spectrum, L, equals ∼ 1% of the Eddingtonluminosity, LE ≃ 1.5(M/M⊙) × 1038 erg s−1, as-suming isotropy, a black-hole mass of M = 10M⊙
and a distance of 2 kpc (see discussion and refer-ences in Gierlinski et al. 1999). The best-fit totalcompactness, ℓh+ℓs ∼ 30, corresponds to the char-acteristic dimension of the plasma of ∼ 102GM/c2
under the assumptions as above. The X-ray spec-trum is rather hard, with the amplification of theseed photons by the factor ℓh/ℓs ≃ 17. Only asmall fraction of the power supplied to the plasma,ℓnth/ℓh ≃ 0.08, is used for nonthermal electron ac-celeration.
3.2. Broad-Band Spectrum in the Soft(High) State
As in the case of the hard state, the broad-band spectrum of Cygnus X-1 in the soft state iswell fit by emission from a blackbody disk, Comp-ton scattering by thermal and nonthermal elec-tron components, and Compton reflection with theaccompanying Fe Kα fluorescence line (Gierlinskiet al. 1999; Frontera et al. 2001). However, un-like the hard state, the CGRO data alone (≥ 20keV) cannot determine the parameters of the ther-mal electron distribution. The reason for this isthat, whereas scattering by the thermal electronsdominates up to several hundred keV in the hard
state (see above, also Gierlinski et al. 1997), itdominates only up to ∼ 10 keV in the soft state(Gierlinski et al. 1999, see below). Then, in theCGRO energy range, the spectrum is entirely dueto the emission of the nonthermal electrons andCompton reflection.
Thus, in order to determine the parametersof the electron distribution (including its thermalpart) implied by the CGRO data in the soft state,we combine them with the BeppoSAX data from1996 June 22 (Frontera et al. 2001). These datacover roughly a 90 minute time span during themuch longer 11-day CGRO observation (June 14–25). For the BeppoSAX observation, data fromthree instruments, LECS, HPGSPC and PDS, areusable (Frontera et al. 2001), extending the mea-sured energy range down to 0.5 keV. We allow fora free relative normalization of each set of spec-tral data with respect to that of OSSE. All thenormalization factors are found to be ∼ 1.
We use the same two models (compps andeqpair) as for the hard state. However, sinceour data extend now down to ∼ 0.5 keV, we letkTs free. For the same reason, we need to includethe fluorescent Fe Kα emission, present in bothstates of Cygnus X-1. Since the line is producedby Compton reflection, we need to relate its fluxto the strength of Compton reflection. We fol-low here results of George & Fabian (1991) andZycki & Czerny (1994) and tie the line flux toΩ/2π in such a way that the equivalent width withrespect to the total continuum is ≃ 120 eV whenΩ/2π = 1. Both the line and the reflection contin-uum are assumed to come from an accretion diskextending down to 6GM/c2 (e.g., Gierlinski et al.1999) and with the reflection/fluorescence emissiv-ity following that of a standard thin disk (Shakura& Sunyaev 1973). This results in a relativisticsmearing (Fabian et al. 1989) of both of those spec-tral components. The reflecting surface is allowedto be ionized (Gierlinski et al. 1999; Di Salvo etal. 2001), with the degree of ionization character-ized by the ionization parameter, ξ ≡ 4πFion/n(where Fion is the ionizing flux and n is the re-flector density), and at the temperature of ∼ kTs.The elemental abundances are of Anders & Ebi-hara (1982).
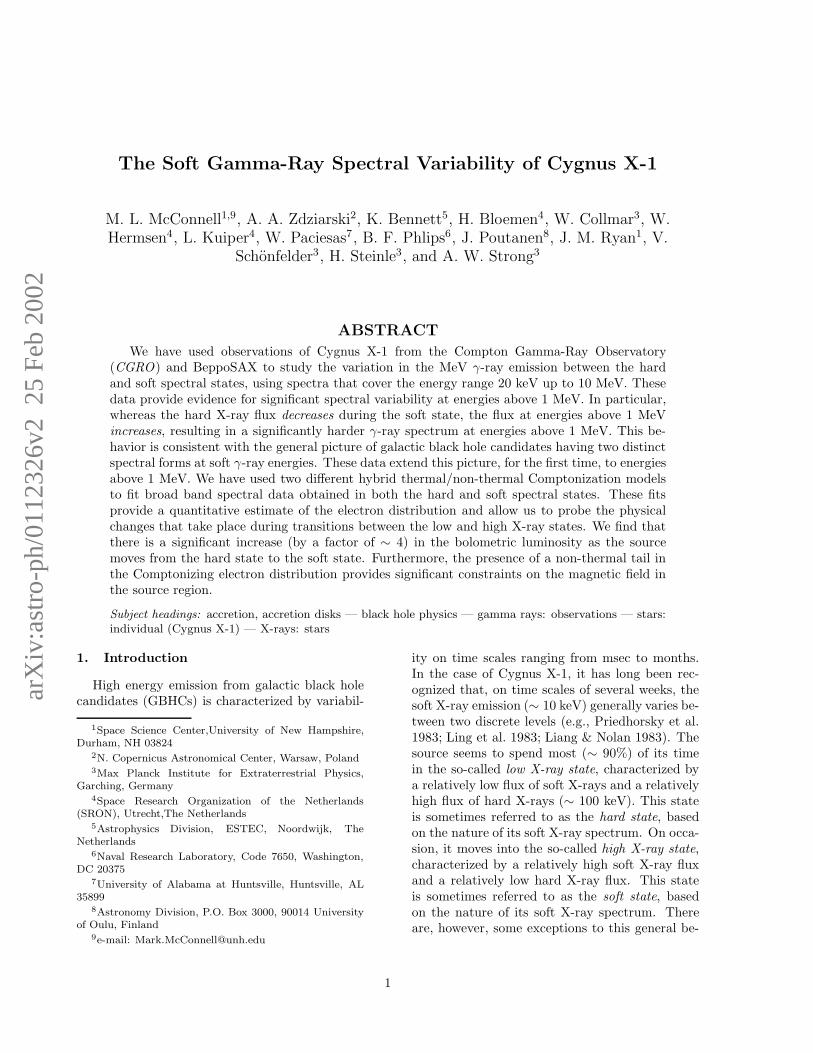
Both compps and eqpair models provide verygood descriptions of our broad-band spectrum.Table 2 gives the fit results and Figure 7 shows the
8

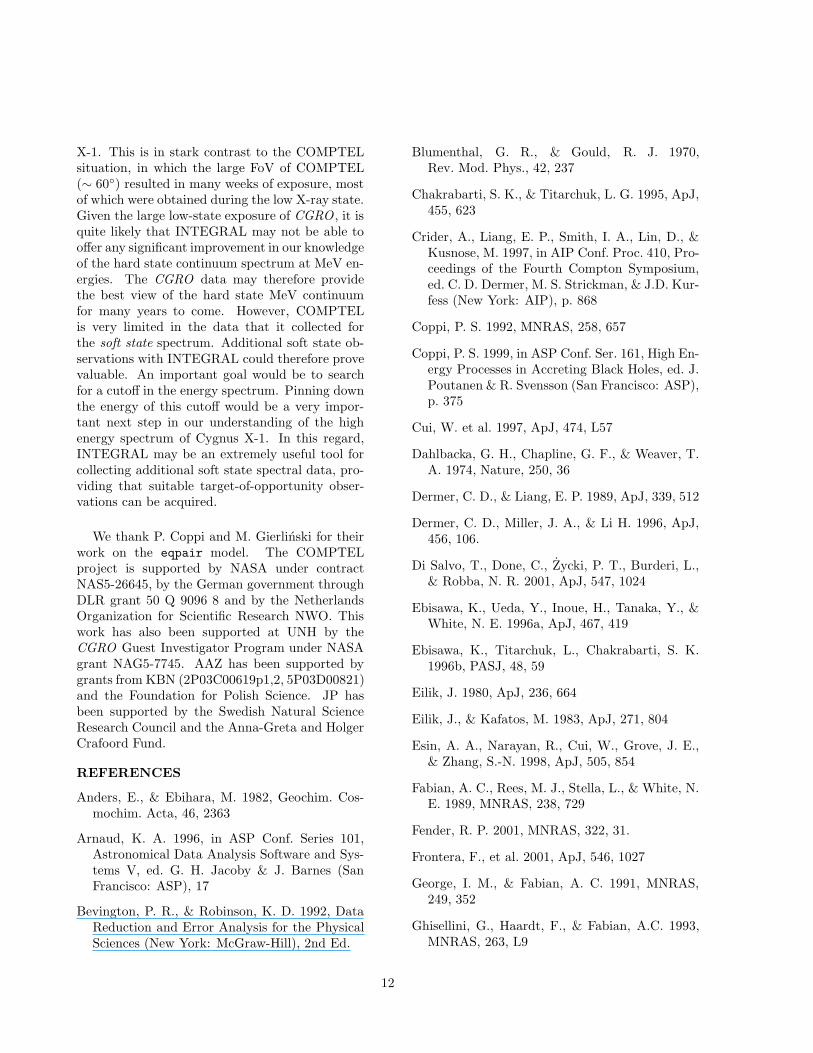
spectrum for the eqpair model. Figure 8 showsthe spectral components of the eqpair fit to thespectrum. Both models predict the power-law–likeemission extending with no cutoff up to 10 MeV,in agreement with the data.
Strong Compton reflection with Ω/2π ∼ 1.3 isseen, similar to the results of Frontera et al. (2001)and those from RXTE (Gilfanov et al. 1999). Alikely cause of Ω > 2π is relativistic anisotropy ofCompton scattering (see a discussion in Gierlinskiet al. 1999). Scattering by nonthermal electrons,forming a power-law like component, dominatesa peaked component from thermal scattering atenergies above several keV (as found by Gierlinskiet al. 1999).
Pair production is unimportant at the best fit.Thus, both models give results fully consistentwith each other. The values of kT are virtuallyidentical, and the small difference in the values ofτ is an artifact of the different treatment of theradiative transfer, and p ≃ Γinj + 1 (as expectedfor dominant Compton cooling in the Thomsonregime, see §3.1).
The bolometric luminosity is about 4 times thatin the hard state, and it is ∼ 0.04LE under thesame assumptions as in §3.1. In contrast to thehard state, only a small fraction of the total lu-minosity, ℓh/(ℓh + ℓs) ≃ 0.15, is emitted by theplasma outside the optically-thick accretion disk,although part of the disk emission is due to re-processing of the hard, plasma, emission (see dis-cussion of the energy balance in Gierlinski et al.1999). Also in contrast to the hard state, most,∼ 0.7, of the power supplied to the plasma is usedfor nonthermal acceleration. Although the elec-tron temperature is very similar in both states,the optical depth in the soft state is ≪ that in thehard state.
4. Discussion
The COMPTEL data alone can be used to drawsome important conclusions regarding the MeVvariability of Cyg X-1. Most importantly, the fluxmeasured by COMPTEL at energies above 1 MeVwas observed to be higher (by a factor of 2.5) dur-ing the soft state (in May of 1996) than it was dur-ing the hard state (as averged over several CGRO
observations). This is in contrast to the lower fluxlevel observed at hard X-ray energies (i.e., near
100 keV) during the soft state. The lack of anydetectable emission by COMPTEL below 1 MeV(i.e., in the 750 keV to 1 MeV energy band) fur-ther suggests a hardening of the γ-ray spectrumduring the soft state.
Inclusion of the BATSE and OSSE spectra addsconsiderably more information regarding the spec-tral variability. Whereas the low-state CGRO
spectrum shows the breaking type spectrum thatis typical of most high-energy observations of CygX-1 (e.g., McConnell et al. 2000a), the high-stateCGRO spectrum shows the power-law type spec-trum that is characteristic of black hole candidatesin their high X-ray state. Our analysis of the softstate data from BATSE, OSSE and COMPTELshows that the spectrum at these energies can bedescribed by a single power-law with a best-fitphoton spectral index of Γ = 2.58 ± 0.03. A sim-ilar spectrum had already been reported for thissame time period (VP 522.5) based on indepen-dent studies with data from both BATSE (Zhanget al. 1997) and OSSE (Gierlinski et al. 1997,1999). A detailed study of the broadband softstate spectrum, based on data from ASCA, RXTEand CGRO/OSSE, was reported by Gierlinski etal. (1999), but they did not include the higherenergy COMPTEL data. The inclusion of theCOMPTEL data in the high state spectrum pro-vides evidence, for the first time, of a continuouspower-law (with a photon spectral index of 2.6)extending beyond 1 MeV, up to ∼ 10 MeV. Noclear evidence for a cutoff in the power-law spec-trum can be discerned from these data.
A power-law spectrum had also been observedby both OSSE and BATSE during the high X-raystate of February, 1994 (CGRO VP 318.1; Phlipset al. 1996; Ling et al. 1997). These earlier datacorrespond to the low level of hard X-ray flux nearTJD 9400 in Figure 1. The spectrum observedduring the 1994 high state showed a similar photonspectral index (Γ = 2.72 vs. Γ = 2.57 for the 1996high state spectrum), but the overall intensity ofthe power law was considerably lower (Gierlinskiet al. 1999). Near 1 MeV, for example, the spec-tral amplitude was about 3 times lower in 1994than it was in 1996. This explains why CygnusX-1 was not observed by COMPTEL during the1994 high state. The extrapolation of the lower-intensity power-law fell below the sensitivity limitof COMPTEL. On the other hand, the intensity
9

observed in 1996 was sufficiently high to allow fora measurement of the spectrum by COMPTEL.
We have used two different hybrid thermal/non-thermal Comptonization models (compps andeqpair) to fit broad band spectral data obtainedin both the hard and soft spectral states. For thehard state analysis, we used data from CGRO cov-ering 20 keV up to 10 MeV. For the soft state anal-ysis, we augmented the CGRO data with lowerenergy data from BeppoSAX to provide improvedconstraints on the spectrum at energies down to0.5 keV. These fits provide a quantitative esti-mate of the electron distribution and allow us toprobe the physical changes that take place dur-ing transitions between the low and high X-raystates. Hybrid Comptonization models have alsobeen used to model the spectra of other black holebinaries in their soft state, such as GRS 1915+105(Zdziarski et al. 2001).
The high energy spectrum of Cygnus X-1 can-not be described by the bulk-motion Comptoniza-tion model alone, which predicts a sharp cutoffabove ∼ 100 keV (Laurent & Titarchuk 1999).The hybrid comptonization models provide anadequate fit to the data without requiring anycontribution from bulk-motion Comptonization.Furthermore, the bulk-motion Comptonizationpower-law for L ∼ 0.04LE corresponding to thesoft state of Cygnus X-1 (see below), was foundby Laurent & Titarchuk (1999) to be very soft,with Γ ≃ 3.5 at , i.e., much softer than theobserved Γ ≃ 2.5 (Gierlinski et al. 1999; Fron-tera et al. 2001). (See also the discussion inZdziarski 2000.) Note that the XSPEC modelof bulk-motion Comptonization, bmc (Shrader &Titarchuk 1998), does not include any high-energycutoff and thus cannot be applied to our data (orany data extending to & 100 keV).
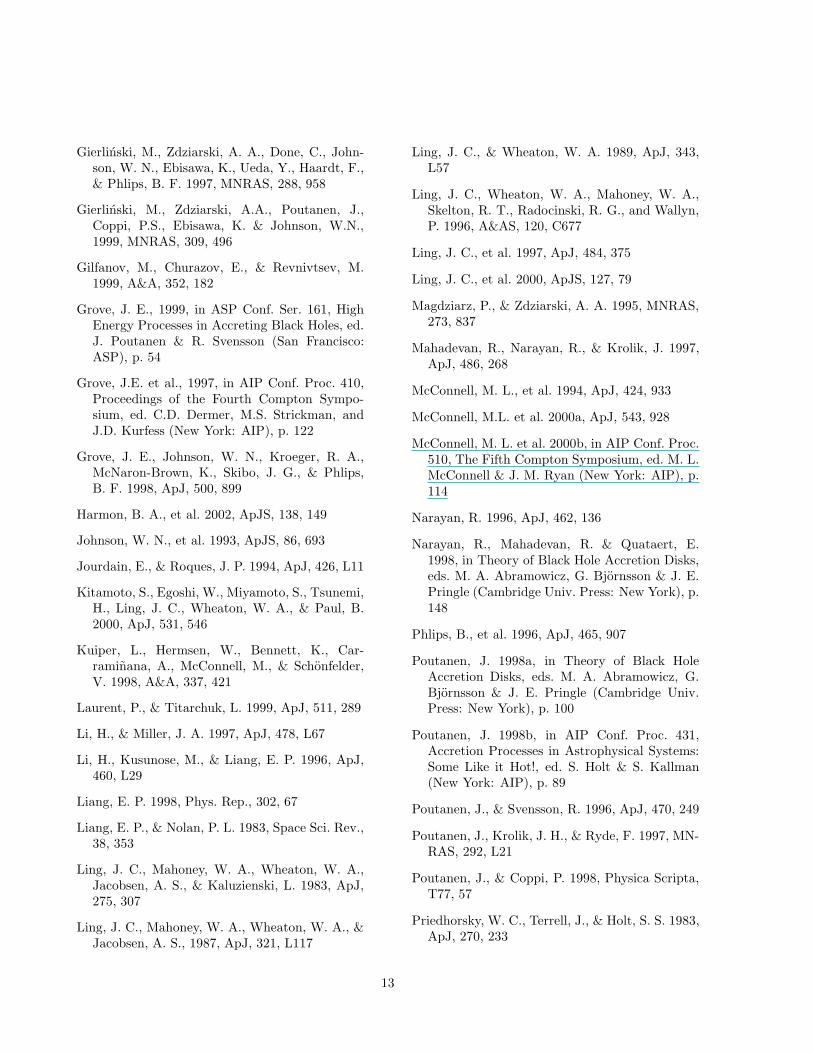
Figure 9 shows a comparison of the spectra inthe two states. For the hard state, we also show atypical spectrum at energies . 25 keV (BeppoSAX
data from Di Salvo et al. 2001). We see that thetwo broad-band spectra cross each other at ∼ 10keV and ∼ 1 MeV. The dashed curve shows themodel obtained by fitting the hard-state data fromCGRO only (§3.1), and assuming NH = 6 × 10²¹
cm−2. We see that this model predicts the low-energy BeppoSAX data relatively well, underesti-mating somewhat the observed spectrum only at. 10 keV due to the presence of a pronounced
soft X-ray excess present in the hard state (Ebi-sawa et al. 1996a; Frontera et al. 2001; Di Salvo etal. 2001), which is neglected in our model fitted tothe data at ≥ 20 keV.
The bolometric flux or luminosity ratio betweenthe soft state in June 1996 and the average for thehard state is ∼ 4. This value is much more thanthe rough estimate of ∼ 1.5 − 1.7 based on theASM and BATSE occultation results (Zhang et al.1997), but is consistent with the results of Fronteraet al. (2001), based on studies with BeppoSAX.Such a large value makes models of the state tran-sition based on a change of accretion rate plausi-ble. Given the larger luminosity in the soft state,the characteristic dimension of the hot plasma inthe soft state based on the compactness fit is sim-ilar to that in the hard state, ∼ 102GM/c2.
These data tend to support the general pic-ture that the transition between the hard and softstates results from a change in the disk transitionradius between a hot inner corona (ADAF) anda cooler outer thin disk (e.g., Esin et al. 1998;Narayan et al. 1998; Poutanen 1998a,b; Poutanen& Coppi 1998). In the hard state, this transi-tion radius is relatively far from the black hole(at ∼ 100 Schwarzschild radii). The spectrumis dominated by Comptonization off the thermalelectrons in the hot inner corona. Radio emis-sion is also more pronounced in this state (Fender2001), with evidence for a radio emitting relativis-tic jet (Stirling et al. 2001). As the transition ra-dius moves inward, perhaps due to an increase inthe accretion rate, the optically thick cool disk in-tercepts a larger fraction of the energy. The ther-mal energy dissipation in the corona is reducedconsiderably and the blackbody disk component(the principal component at soft X-ray energies)becomes more pronounced.
Although our data tend to support the abovepicture, we have not attempted to model the ge-ometry in detail, since the precise geometrical con-figuration of the emitting region is largely un-known. Furthermore, our new data cover the en-ergy range near 1 MeV where geometry effects aredifficult to study. One of the primary goals of thepresent paper is to determine the electron distri-bution of the radiating plasma. Our assumptionof a spherical source geometry provides the neces-sary physics that is required to extract informationon the electron spectrum. We have further pre-
10

sumed that the thermal and nonthermal electronsare in the same physical region. This assumptionis based, in part, on the observations that show anegative correlation between the thermal and non-thermal components. This need not be the casein reality, however, but the present data cannotbe used to determine the extent to which the twopopulations are co-located. A more detailed dis-cussion of geometrical effects in the context of theeqpair model, including Compton reflection andenergy balance, can be found in Gierlinski et al.(1999).
The shape of the electron distribution and itshigh energy tail can best be determined by mea-surements that extend into the MeV energy re-gion. The high-energy cutoff is related to the com-pactness of the source region, since it depends, inpart, on the influence of γ − γ pair production.If γ − γ pair production is an important sourceof opacity, this would imply the presence of a sig-nificant level of e± pairs in the source region. Inthis way, a measure of the high-energy cutoff canhelp determine the nature of the emitting plasma(e − p or e±). Although a measure of e± annihi-lation radiation can also serve as a diagnostic of apair plasma, it is likely that any annihilation radi-ation that may be present would be considerablybroadened (and perhaps blue-shifted), and hencemay not be readily observable. Measurements todate with HEAO-3 (Ling & Wheaton 1989) andwith OSSE (Phlips et al. 1996) provide only up-per limits, or, at best, a marginal (1.9σ) detection(Ling & Wheaton 1989) to the level of e± anni-hilation radiation. This further underscores theneed to define the high-energy cutoff as perhapsthe best means for constraining the source com-pactness and the nature of the emitting region.If INTEGRAL, with its improved line sensitiv-ity, succeeds in measuring an annihilation feature,then constraints on the high-energy cutoff will beeven more valuable.
The presence of a non-thermal tail in the elec-tron distribution can also provide constraints onthe strength of the magnetic field in the source re-gion. As pointed out by Wardzinski & Zdziarski(2001), the presence of even a weak nonthermalelectron tail increases strongly the emissivity ofthe cyclo-synchrotron process with respect to thepure thermal case. If the Compton-scattering elec-trons in Cygnus X-1 were purely thermal, that
process appears in general to be too inefficient toprovide all of seed photons for the Comptoniza-tion under simple assumptions of equipartition(Wardzinski & Zdziarski 2000). Since we do see ablackbody component at low energies (Ebisawa etal. 1996a; Di Salvo et al. 2001), this inefficiency isconsistent with the seed photons for Comptoniza-tion provided by the blackbody rather than by thecyclo-synchrotron photons. On the other hand,the tail parameters obtained by McConnell et al.(2000a) yielded such a copious supply of cyclo-synchrotron seed photons that the correspondingluminosity would become ∼ 102 times that ob-served (Wardzinski & Zdziarski 2001). This con-clusion is confirmed for the tail parameters fit-ted here (G. Wardzinski, private communication).Thus, either the magnetic field in Cygnus X-1 issubstantially below equipartition (at least an or-der of magnitude) or the observed photon tail hasa different origin than that due to a high energyelectrons. In either case, this has important impli-cations for models of the accretion flow in CygnusX-1.
These studies also have implications that gobeyond that of studying individual black holesources. Given the close spectral similarity be-tween black-hole binaries in the hard state andSeyferts (e.g., Zdziarski 2000), it is possible thatsimilar tails are present in the spectra of the latterobjects. Stecker et al. (1999) have suggested thatthe hard tail emission seen in sources like CygnusX-1 might account for an important componentof the cosmic diffuse background radiation in the200 keV – 3 MeV energy band (see also Stecker2001). Note, however, that the tail of CygnusX-1 above 1 MeV contains relatively little flux,1.3% of the bolometric (model) flux, for the fitwith eqpair. If a similar value is characteristicof Seyferts, the combined emission from their highenergy tails may be too weak to account for the ob-served extragalactic MeV background, perhaps ar-guing against the proposal by Stecker et al. (1999).
The next major satellite for this energy range,INTEGRAL, is expected to have only slightly bet-ter continuum sensitivity than COMPTEL at en-ergies near 1 MeV with both its IBIS and SPI ex-periments (Schonfelder et al. 2001). Furthermore,the much narrower FoV of the INTEGRAL instru-ments (∼ 15) will mean that there will likely beonly a limited number of observations of Cygnus
11
X-1. This is in stark contrast to the COMPTELsituation, in which the large FoV of COMPTEL(∼ 60) resulted in many weeks of exposure, mostof which were obtained during the low X-ray state.Given the large low-state exposure of CGRO , it isquite likely that INTEGRAL may not be able tooffer any significant improvement in our knowledgeof the hard state continuum spectrum at MeV en-ergies. The CGRO data may therefore providethe best view of the hard state MeV continuumfor many years to come. However, COMPTELis very limited in the data that it collected forthe soft state spectrum. Additional soft state ob-servations with INTEGRAL could therefore provevaluable. An important goal would be to searchfor a cutoff in the energy spectrum. Pinning downthe energy of this cutoff would be a very impor-tant next step in our understanding of the highenergy spectrum of Cygnus X-1. In this regard,INTEGRAL may be an extremely useful tool forcollecting additional soft state spectral data, pro-viding that suitable target-of-opportunity obser-vations can be acquired.
We thank P. Coppi and M. Gierlinski for theirwork on the eqpair model. The COMPTELproject is supported by NASA under contractNAS5-26645, by the German government throughDLR grant 50 Q 9096 8 and by the NetherlandsOrganization for Scientific Research NWO. Thiswork has also been supported at UNH by theCGRO Guest Investigator Program under NASAgrant NAG5-7745. AAZ has been supported bygrants from KBN (2P03C00619p1,2, 5P03D00821)and the Foundation for Polish Science. JP hasbeen supported by the Swedish Natural ScienceResearch Council and the Anna-Greta and HolgerCrafoord Fund.
REFERENCES
Anders, E., & Ebihara, M. 1982, Geochim. Cos-mochim. Acta, 46, 2363
Arnaud, K. A. 1996, in ASP Conf. Series 101,Astronomical Data Analysis Software and Sys-tems V, ed. G. H. Jacoby & J. Barnes (SanFrancisco: ASP), 17
Bevington, P. R., & Robinson, K. D. 1992, DataReduction and Error Analysis for the PhysicalSciences (New York: McGraw-Hill), 2nd Ed.
Blumenthal, G. R., & Gould, R. J. 1970,Rev. Mod. Phys., 42, 237
Chakrabarti, S. K., & Titarchuk, L. G. 1995, ApJ,455, 623
Crider, A., Liang, E. P., Smith, I. A., Lin, D., &Kusnose, M. 1997, in AIP Conf. Proc. 410, Pro-ceedings of the Fourth Compton Symposium,ed. C. D. Dermer, M. S. Strickman, & J.D. Kur-fess (New York: AIP), p. 868
Coppi, P. S. 1992, MNRAS, 258, 657
Coppi, P. S. 1999, in ASP Conf. Ser. 161, High En-ergy Processes in Accreting Black Holes, ed. J.Poutanen & R. Svensson (San Francisco: ASP),p. 375
Cui, W. et al. 1997, ApJ, 474, L57
Dahlbacka, G. H., Chapline, G. F., & Weaver, T.A. 1974, Nature, 250, 36
Dermer, C. D., & Liang, E. P. 1989, ApJ, 339, 512
Dermer, C. D., Miller, J. A., & Li H. 1996, ApJ,456, 106.
Di Salvo, T., Done, C., Zycki, P. T., Burderi, L.,& Robba, N. R. 2001, ApJ, 547, 1024
Ebisawa, K., Ueda, Y., Inoue, H., Tanaka, Y., &White, N. E. 1996a, ApJ, 467, 419
Ebisawa, K., Titarchuk, L., Chakrabarti, S. K.1996b, PASJ, 48, 59
Eilik, J. 1980, ApJ, 236, 664
Eilik, J., & Kafatos, M. 1983, ApJ, 271, 804
Esin, A. A., Narayan, R., Cui, W., Grove, J. E.,& Zhang, S.-N. 1998, ApJ, 505, 854
Fabian, A. C., Rees, M. J., Stella, L., & White, N.E. 1989, MNRAS, 238, 729
Fender, R. P. 2001, MNRAS, 322, 31.
Frontera, F., et al. 2001, ApJ, 546, 1027
George, I. M., & Fabian, A. C. 1991, MNRAS,249, 352
Ghisellini, G., Haardt, F., & Fabian, A.C. 1993,MNRAS, 263, L9
12
Gierlinski, M., Zdziarski, A. A., Done, C., John-son, W. N., Ebisawa, K., Ueda, Y., Haardt, F.,& Phlips, B. F. 1997, MNRAS, 288, 958
Gierlinski, M., Zdziarski, A.A., Poutanen, J.,Coppi, P.S., Ebisawa, K. & Johnson, W.N.,1999, MNRAS, 309, 496
Gilfanov, M., Churazov, E., & Revnivtsev, M.1999, A&A, 352, 182
Grove, J. E., 1999, in ASP Conf. Ser. 161, HighEnergy Processes in Accreting Black Holes, ed.J. Poutanen & R. Svensson (San Francisco:ASP), p. 54
Grove, J.E. et al., 1997, in AIP Conf. Proc. 410,Proceedings of the Fourth Compton Sympo-sium, ed. C.D. Dermer, M.S. Strickman, andJ.D. Kurfess (New York: AIP), p. 122
Grove, J. E., Johnson, W. N., Kroeger, R. A.,McNaron-Brown, K., Skibo, J. G., & Phlips,B. F. 1998, ApJ, 500, 899
Harmon, B. A., et al. 2002, ApJS, 138, 149
Johnson, W. N., et al. 1993, ApJS, 86, 693
Jourdain, E., & Roques, J. P. 1994, ApJ, 426, L11
Kitamoto, S., Egoshi, W., Miyamoto, S., Tsunemi,H., Ling, J. C., Wheaton, W. A., & Paul, B.2000, ApJ, 531, 546
Kuiper, L., Hermsen, W., Bennett, K., Car-raminana, A., McConnell, M., & Schonfelder,V. 1998, A&A, 337, 421
Laurent, P., & Titarchuk, L. 1999, ApJ, 511, 289
Li, H., & Miller, J. A. 1997, ApJ, 478, L67
Li, H., Kusunose, M., & Liang, E. P. 1996, ApJ,460, L29
Liang, E. P. 1998, Phys. Rep., 302, 67
Liang, E. P., & Nolan, P. L. 1983, Space Sci. Rev.,38, 353
Ling, J. C., Mahoney, W. A., Wheaton, W. A.,Jacobsen, A. S., & Kaluzienski, L. 1983, ApJ,275, 307
Ling, J. C., Mahoney, W. A., Wheaton, W. A., &Jacobsen, A. S., 1987, ApJ, 321, L117
Ling, J. C., & Wheaton, W. A. 1989, ApJ, 343,L57
Ling, J. C., Wheaton, W. A., Mahoney, W. A.,Skelton, R. T., Radocinski, R. G., and Wallyn,P. 1996, A&AS, 120, C677
Ling, J. C., et al. 1997, ApJ, 484, 375
Ling, J. C., et al. 2000, ApJS, 127, 79
Magdziarz, P., & Zdziarski, A. A. 1995, MNRAS,273, 837
Mahadevan, R., Narayan, R., & Krolik, J. 1997,ApJ, 486, 268
McConnell, M. L., et al. 1994, ApJ, 424, 933
McConnell, M.L. et al. 2000a, ApJ, 543, 928
McConnell, M. L. et al. 2000b, in AIP Conf. Proc.510, The Fifth Compton Symposium, ed. M. L.McConnell & J. M. Ryan (New York: AIP), p.114
Narayan, R. 1996, ApJ, 462, 136
Narayan, R., Mahadevan, R. & Quataert, E.1998, in Theory of Black Hole Accretion Disks,eds. M. A. Abramowicz, G. Bjornsson & J. E.Pringle (Cambridge Univ. Press: New York), p.148
Phlips, B., et al. 1996, ApJ, 465, 907
Poutanen, J. 1998a, in Theory of Black HoleAccretion Disks, eds. M. A. Abramowicz, G.Bjornsson & J. E. Pringle (Cambridge Univ.Press: New York), p. 100
Poutanen, J. 1998b, in AIP Conf. Proc. 431,Accretion Processes in Astrophysical Systems:Some Like it Hot!, ed. S. Holt & S. Kallman(New York: AIP), p. 89
Poutanen, J., & Svensson, R. 1996, ApJ, 470, 249
Poutanen, J., Krolik, J. H., & Ryde, F. 1997, MN-RAS, 292, L21
Poutanen, J., & Coppi, P. 1998, Physica Scripta,T77, 57
Priedhorsky, W. C., Terrell, J., & Holt, S. S. 1983,ApJ, 270, 233
13

Schonfelder, V., et al. 1993, ApJS, 86, 629
Schonfelder, V., 2001, in AIP Conf. Proc. 587,GAMMA 2001 - Gamma-Ray Astrophysics2001, ed. S. R. Ritz, N. Gehrels & C. R. Shrader(New York: AIP), p. 809
Shakura, N. I., & Sunyaev, R. A. 1973, A&A, 24,337
Shapiro, S. L., Lightman, A. P., & Eardley, D. M.1976, ApJ, 204, 187
Shrader, C., & Titarchuk, L. 1998, ApJ, 499, L31
Stecker, F. W., Salamon, M. H., & Done, C. 1999,astro-ph/9912106
Stecker, F. W. 2001, in AIP Conf. Proc. 587,GAMMA 2001 - Gamma-Ray Astrophysics2001, ed. S. R. Ritz, N. Gehrels & C. R. Shrader(New York: AIP), p. 432
Stirling, A. M., Spencer, R. E., de la Force, C. J.,Garrett, M. A., Fender, R. P., & Ogley, R.N.2001, MNRAS, 327, 1273
Sunyaev, R. A., & Titarchuk, L. G. 1980, A&A,86, 121
Svensson, R. 1987, MNRAS, 227, 403
Titarchuk, L., Mastichiadis, A., & Kylafas, N. D.1997, ApJ, 487, 834
Ubertini, P., et al. 1991, ApJ, 366, 544
Wardzinski, G., & Zdziarski, A. A. 2000, MNRAS,314, 183
Wardzinski, G., & Zdziarski, A. 2001, MNRAS,325, 963 (Erratum: 327, 351)
Zdziarski, A. A. 2000, in IAU Symp. 195, HighlyEnergetic Physical Processes and Mechanismsfor Emission from Astrophysical Plasmas, ed.P. C. H. Martens, S. Tsuruta & M. A. Weber(San Francisco: ASP), p. 153
Zdziarski, A. A., Grove, J. E., Poutanen, J., Rao,A. R., & Vadawale, S. V. 2001, ApJ, 554, L45
Zhang, S. N. et al. 1997, ApJ, 477, L95
Zycki, P. T., & Czerny, B. 1994, MNRAS, 266, 653
This 2-column preprint was prepared with the AAS LATEXmacros v5.0.
14

100
80
60
40
20
AS
M C
ount
Rat
e (c
ts s
-1)
11500110001050010000950090008500Truncated Julian Day (TJD)
0.5
0.4
0.3
0.2
0.1
Flux (cm
-2 s-1 in 20-100 keV
)
-4.0
-3.5
-3.0
-2.5
-2.0
-1.5
Spe
ctra
l Ind
ex
BATSE Flux (20-100 keV)
BATSE Spectral Index (20-100 keV)
RXTE ASM Count Rate (2-10 keV)
Fig. 1.— X-ray time histories of Cygnus X-1 cov-ering nearly the entire CGRO mission. The hardX-ray data come from BATSE data that are de-rived from Earth occultation analysis in the 20–100 keV energy range. The soft X-ray data (2–10keV) are from the All-Sky Monitor (ASM) on theRossi X-Ray Timing Explorer (RXTE).
120
100
80
60
40
20
0
Count R
ate (cts sec-1)
10400103501030010250102001015010100
Truncated Julian Day (TJD)
0.20
0.15
0.10
0.05
0.00
Flu
x (c
m-2
sec
-1 M
eV-1
)
VP 522.5
BATSE (45-140 keV)
RXTE ASM(2-10 keV)
Fig. 2.— The time interval of CGRO ViewingPeriod 522.5 is shown relative to the hard (upper)and soft (lower) X-ray time histories from BATSEand the RXTE-ASM, respectively. Note the veryrapid transition into and out of the high X-raystate as seen in soft X-rays.
30
20
10
0
-10
-20
Gal
actic
Lat
itude
(de
gs)
90 80 70 60 50 40
Galactic Longitude (degs)
Fig. 3.— COMPTEL imaging of the Cygnus re-gion as derived from 1–3 MeV data collected dur-ing the soft state of June, 1996 (CGRO viewingperiod 522.5). The outer contour (dotted line)represents the effective FoV of COMPTEL (witha 30 radius). The remaining contours representconstant values of the quantity −2 lnλ, where λis the likelihood ratio. The contours start at avalue of 15, with a step size of 5. The likelihoodreaches a value of 30.1 at the location of CygnusX-1 (denoted by the diamond).
15

10
8
6
4
2
0
-2
-4
Gal
actic
Lat
itude
(de
gs)
78 76 74 72 70 68 66 64
Galactic Longitude (degs)
PSR 1951+32
Cyg X-1
Fig. 4.— The 1, 2 and 3-σ location contours de-rived from the likelihood map in Figure 3. Theemission is consistent with a point source at thelocation of Cyg X-1, with no significant contribu-tion from PSR 1951+32, a pulsar that has beendetected in a timing anlaysis of COMPTEL data(Kuiper et al. 1998).
Fig. 5.— The average CGRO spectrum of CygnusX-1 in the hard state fitted with the eqpair model(solid curve). Data points from BATSE and OSSEare represented as blue open circles and red aster-isks, respectively. COMPTEL data are shown asthick crosses. All the data are normalized to thatof OSSE. Upper limits have been removed for thesake of clarity.
Fig. 6.— Components of the eqpair fit for thehard state. All spectra are intrinsic, i.e., correctedfor absorption. The long dashes, short dashes,and dots correspond to the unscattered blackbody,scattering by thermal electrons, and Compton re-flection, respectively. The solid curve is the to-tal spectrum. Scattering by the nonthermal elec-trons accounts for the high-energy tail above thethermal-Compton spectrum given by the shortdashes, starting at ∼ 1 MeV.
16
Fig. 7.— The simultaneous BeppoSAX-CGRO
spectrum of Cygnus X-1 in the soft state fittedwith the eqpair model (solid curve). Included aredata from the LECS (green), HPGSPC (cyan opensquares) and PDS (yellow open triangles) instru-ments on board BeppoSAX and from the OSSE(red asterisks), BATSE (blue open circles) andCOMPTEL instruments on CGRO . All the dataare normalized to that of OSSE.
Fig. 8.— Components of the eqpair fit for thesoft state. All spectra are intrinsic, i.e., correctedfor absorption. The long dashes, short dashes,dot/dashes and dots correspond to the unscatteredblackbody, scattering by thermal electrons, thescattering by nonthermal electrons, and Comptonreflection/Fe Kα fluorescence, respectively. Thesolid curve is the total spectrum.
Fig. 9.— Comparison of the spectra in the hardand soft state of Cygnus X-1, as fitted with theeqpair model (solid curves). All data are nor-malized to that of OSSE. The hard-state data be-low 25 keV represent a typical hard-state spectrum(the BeppoSAX data of Di Salvo et al. 2001), andthe dashed curve shows the corresponding modelobtained by fitting the CGRO data only.
17

Table 1
COMPTEL Flux Measurements for VP 522.5.
Energy Counts in Source Flux(MeV) Dataspace Counts (cm−2 s−1 MeV−1)
0.75 – 1.0 33,066 177 ± 202 5.4(±6.1)× 10−4
1.0 – 1.4 88,086 697 ± 258 5.3(±2.0)× 10−4
1.4 – 2.0 107,010 756 ± 265 2.6(±1.0)× 10−4
2.0 – 5.0 157,457 1092± 273 5.8(±1.5)× 10−5
5.0 – 10.0 30,158 191 ± 90 5.8(±2.7)× 10−6
10.0 – 30.0 7,967 31 ± 31 3.2(±3.2)× 10−7
18

Table 2
Parameters of the hybrid models for the hard and soft state
NH kTs ℓs ℓh/ℓs ℓnth/ℓh γmin p, Γinj kT τi τ Ω/2π ξ F L χ2/ν
hard state, compps
6f 0.2f – – – 1.39+0.51−0.34 5.4+0.4
−0.3 58+18−22 – 2.9+0.6
−0.4 0.5f – 3.38 1.62 37/48
hard state, eqpair
6f 0.2f 1.8+2.5−1.6
17+4−3
0.082+0.088−0.032
1.5f 2.0+0.9−2.0
90a 1.34+0.40−0.50
1.45a 0.52+0.06−0.05
– 3.56 1.70 31/46
soft state, compps
6.0+0.2−0.1
0.39+0.01−0.01
– – – 1.83+0.12−0.12
3.5+0.1−0.1
63+8−8
– 0.18+0.04−0.02
1.4+0.3−0.5
290+350−180
13.1 6.3 199/239
soft state, eqpair
6.0+0.1−0.1
0.37+0.01−0.01
3.2+38−2.1
0.17+0.01−0.01
0.68+0.20−0.12
1.5f 2.6+0.2−0.2
65a 0.11+0.02−0.02
0.11a 1.3+0.3−0.3
100+210−60
13.2 6.3 199/238
Note.—NH, kT , and ξ are in units of 1021 cm−2, keV, and erg cm s−1, respectively. F , the unabsorbed model bolometric flux using the normalization of the OSSEspectrum, and L, the corresponding luminosity assuming isotropy and a distance of 2 kpc are in units of 10−8 erg cm−2 s−1 and 1037 erg s−1, respectively. Parameters fixedin the fit are denoted by ‘f’. The single-parameter uncertainties correspond to a 90% confidence, i.e., ∆χ2 = 2.71.
aThe electron temperature and total optical depth calculated from energy and pair balance for the best-fit model (i.e., not free parameters).
19
Copyright © 2022 FDOKUMEN