International schooling: a sociocultural study - ePrints Soton
Upload
independentCategory
view
3download
0
Research Series No. 57
The Socioeconomic Impact of HIV/AIDS on Education Outcomes in Uganda: School
Enrolment and the Schooling Gap in 2002/03
By Ibrahim Kasirye
Economic Policy Research Centre,
And
Eria Hisali Faculty of Economics and Management, Makerere
University
June 2008
Economic Policy Research Centre (EPRC) 51 Pool Road Makerere University Campus, P. O. Box 7841 Kampala, Uganda Tel: 256-41-541023, Fax: 256-41-541022, Email: [email protected]

See the end of this document for a list of previous papers in the series

The Socioeconomic Impact of HIV/AIDS on Education Outcomes in Uganda: School Enrolment
and the Schooling Gap in 2002/031
By Ibrahim Kasirye
Economic Policy Research Centre,
And
Eria Hisali Faculty of Economics and Management, Makerere University2
1 We thank the anonymous reviewer and participants at the EPRC national dissemination workshop for helpful comments and suggestions. Access to data by the Uganda Bureau of Statistics is gratefully acknowledged. The remaining errors and omissions are our own. Email: [email protected]. 2 The authors prepared this paper with support from ACBF on “Impact of HIV/AIDS on the Ugandan Economy”.

Abstract Due to high prime-age mortality in Uganda, a result of the HIV/AIDS scourge, the number of children who have lost at least one parent continues to rise in the country. The increase in numbers of orphans has challenged the overall socio-protection mechanisms and in particular threatens the country’s ability to achieve education development targets. Using the 2002/03 Uganda National Household Survey, this study investigates the impact of parental death—from HIV/AIDS as well as causes on the school enrolment and grade for age school progression. We find that HIV/AIDS orphans are not significantly less likely to continue schooling but are by far more likely to fall below their appropriate grade. On the other hand, we find that all orphans—regardless of cause of parental death are less likely to continue schooling and the gaps in enrolment decreases at higher levels of household welfare status—poor orphans are significantly less likely to continue schooling.
i

1.0 Introduction Given the increasing prevalence of HIV/AIDS in sub-Saharan Africa (SSA),
understanding the socio-economic impact of the disease is an important policy issue.
The HIV/AIDS pandemic has not only led to great suffering of the victims of the
disease but has also spurred a generation of children without parents. In the sub
region, the number of children who have lost at least one parent increased from 28
million in 1990 to 43 million by 2003, and the proportion of these orphans3 attributed
to HIV/AIDS increased from 2% to 37% during the same period (UNICEF, 2004).
Worse still, in some instances, orphans are also battling with the disease (acquired
through mother to child transmission at birth) which exacerbates their vulnerabilities.
The 2004 Children at the Brink report by UNAIDS estimates that globally 2.1 million
children under the age of 15 were living with HIV/AIDS as of 2004.
Specific to Uganda, although the country’s HIV/AIDS prevalence rate declined from
30% in the early 1990s to the about 6 % by 2004/05 (GoU, 2006a), the number of
orphans continues to rise (Table 1). For example, between 1999/2000 and 2002/3,
the number of orphans increased from 1.7 million to over 2 million children. More
recent estimates indicate that the number of orphans in Uganda had reached 2.3
million children by the end of 2003 (UNICEF, 2007). Furthermore, out of the above
figure at least 45 % are attributed to HIV/AIDS. Given the psychological and
economic effects associated with parental loss, issues relating to orphan’s education
are a priority in Uganda just like other countries battling the effects of the disease.
Indeed, the schooling status of orphans is a matter of public concern in Uganda due
to concerns that the particular category of children may be disadvantaged with
respect to access to social services. For example, the Uganda participatory poverty
assessments report that orphans are faced with inadequate nutrition which affects
the level of concentration while at school (GoU, 2002). As such, government policies
for example the Poverty Eradication Action Plan (2004-2008) considered orphan’s
access to schooling as important in the country’s quest to attain the Millennium
3 Orphans are defined as children below 18 years who have lost at least one parent. They can either be paternal orphans—children who have lost their father but the mother is alive, maternal orphans—children who have lost their mother but father is alive, or double orphans—children who have lost both parents.
2

Development Goals (MDGs). Consequently, during the PEAP implementation, the
Ministry of Gender Labour and Social Development produced an orphan and
vulnerable children’s policy that sought to provide adequate socio-economic
protection of vulnerable groups. Furthermore, the policy advocated for periodic
investigations of the magnitude as well as the various facets of the orphan problem
in Uganda.
Apart from policy pronouncements, a number of programs have been implements in
Uganda to address various orphan vulnerabilities including those that relate to
schooling. Although majority of the interventions have been undertaken at a small
scale—initiated by resource constrained Non Governmental Organizations (NGOs),
a few large scale public interventions—supported by development partners have
also constraints faced by orphans. The most notable public program, which
specifically targeted HIV/AIDS orphans schooling was the Community Led HIV
Initiative (CHAI) project—operational during 2002-2007. This project, implemented in
30 districts in Uganda, paid tuition fees for children from HIV/AIDS affected
households that were unable to enroll in secondary school (Uganda AIDS
Commission, 2007). In northern Uganda, a region with some of the highest HIV/AIDS
prevalence rates (Ciantia, 2004), the project operated as part of the Vulnerable
Groups Sub-projects (VGS) component of the Northern Uganda Social Action Fund
(NUSAF) in 8 districts of the region. In this particular region, communities were
supported to identify the most deserving HIV/AIDS orphans that were not attending
secondary school. Nonetheless, as indicated in our discussions later, the replication
of similar programs at a national scale presents targeting challenges. But even then,
an understanding of the potential effects of such programs on HIV/AIDS orphans
schooling outcomes can provide information on appropriate interventions for the
overall social protection of all vulnerable groups.
Due to paucity of data, only a few studies have investigated the impact of HIV/AIDS
on education in Uganda4. Majority of the studies on Uganda are based on small
samples—covering only a few districts. On the other hand, among the studies based
on nationally representative samples, only a few explicitly focus on parental death
4 Empirical examples include: De Walque, 2007; Yamano et.al, 2006; Deininger et.al, 2003; and Ntozi, 1997.
3

arising from HIV/AIDS. In the present study, we have access to a dataset—the
2002/03 Uganda National Household Survey (UNHS) that for the first time inquired
from households with orphans whether the cause of parental death was due to
HIV/AIDS. Prior and even subsequent national household surveys, do not probe the
cause of death of parents. Apart from the availability of an appropriate dataset which
allows us to identify HIV/AIDS orphans, there are other important reasons for
focusing on the education of HIV/AIDS orphans. Evidence from other African
countries indicates that surviving children may be psychologically affected leading to
school non-attendance, given the stigma that continues to be attached to HIV/AIDS
(Evans and Miguel, 2007).
Consequently, we investigate the impact of HIV/AIDS parental death on children’s
human capital outcomes in Uganda. In particular, we probe the following questions:
(i) does the death of a parent from HIV/AIDS affect the overall likelihood of a child
continuing schooling in Uganda? (ii) For orphans that continue with school, are they
more likely to fall below the appropriate grade? We estimate probit regressions for
school enrolment as well ordinary least squares (OLS) regressions for determinants
of schooling gap. This is defined as the number of years a child in school is below
the appropriate grade. It is derived as the difference between a child’s current age,
the highest grade attained in years and the age of 6 (the recommended age of
starting primary school in Uganda). Furthermore, we investigate whether the
impacts of orphan status on schooling outcomes differ by household welfare status
by including an interaction term for orphan status and an indicator of household
welfare status5. We find that parental death from HIV/AIDS has no significant effect
enrolment of the combined group (6-17 years). However, for the age group 13-17
years, we find that HIV/AIDS orphans are less likely to continue schooling compared
to non HIV/AIDS orphans and the gap decreases at higher levels of household
welfare status. We obtain nearly similar results even with our second indicator of
schooling outcome—the number of years below an appropriate grade. Our results
suggests that HIV/AIDS orphans may be withdrawn from school to look after other
ailing parents but later rejoin schooling.
5 Previous multi-country studies such as Ainsworth and Filmer (2006) and Case et.al (2004) point to fact that orphans may be taken up by relatively well-to-do families.
4

This study is organised as follows. The next section reviews the literature on effects
of parental deaths in developing countries, and provides further justification for an
explicit focus on HIV/AIDS orphans in Uganda. Section three describes the analytical
framework employed, while the subsequent sub-section, describes the data used.
Section four presents the main results of the impacts of HIV/AIDS parental deaths on
children’s schooling status. Finally, section five provides a summary of the
implications of our study findings.
2.0 Literature Review The increasing prime-age mortality in sub-Saharan Africa has spurred a wealth of
studies examining the effects of the orphan status on children’s human capital
outcomes in the sub-Saharan Africa6. The relationship between orphanhood and
schooling status has dominated the literature with very little focus on other
dimensions of human capital such as nutritional status. Although some of the studies
confirm that orphans are disadvantaged with respect to schooling (see e.g. Evans
and Miguel, 2007; Ainsworth et al. 2005; and Case et al. 2004), the empirical
evidence is far from conclusive. Ainsworth and Filmer (2006), for example, based on
survey data from 51 developing countries find no significant differences in the
schooling enrolment of orphans and other children. In an earlier study based on a
panel dataset that surveyed Ugandan households in 1992 and 1999, Deininger et al.
(2003) find that the orphan disadvantage with respect to schooling that existed in
1992 was eliminated by 1999 with the introduction of the universal primary education
(UPE) program. The majority of studies that find no significant results argue that
differences in school enrolments between schooling participation of orphans and
non-orphans are driven by poverty and not orphan status per se.
On the other hand, some studies find evidence of adverse impacts of orphanhood on
schooling participation. Based on a survey of 970 households in Uganda, Yamano
et al. (2006) find that the only female adolescent orphans experience lower school
enrolment compared to other children. Using a five year panel of school children
from 75 schools in Western Kenya, Evans and Miguel (2007) find that orphans are 6 Examples of empirical studies in the recent past include Evan and Miguel (2007);Yamano et al. (2006), Ainsworth and Filmer (2006), Ainsworth et al. (2005); Nyamukapa and Gregson (2005); Gertler et al. (2004); Deininger et al. (2003); Bicego et al. 2003; Case et al. (2004).
5

about 5% less likely to attend school compared to other children. Other studies find
evidence of orphan’s delayed enrolment in school (Ainsworth et al. 2005); lower
school attendance of orphans compared to other children living with orphans (Case
et al. 2004); and higher likelihood of orphans being at a lower than appropriate grade
for age (Bicego et al. 2003). Evidence of significant impacts seems rather
dependent on the methodology used for estimation. A majority of studies that find
significant impacts are based on longitudinal data sets that have the advantage of
controlling for pre-orphan characteristics of children.
Furthermore, a number of studies find differential impacts of parental death on
schooling outcomes according to the type of orphan status i.e. paternal, maternal or
double orphan. Evidence from SSA indicates that maternal orphans suffer more with
regard to decline in human capital outcomes. The study by Evans and Miguel (2007)
finds that the maternal orphan effects on school enrolment are more than twice those
of paternal orphans. Also, Case and Ardington (2006) based on panel data from
Kwazulu-Natal in South Africa show that households with maternal orphans on
average spend much less on schooling expenses compared to households with
children where mothers are alive. Other studies that find adverse impacts of
maternal orphanhood include Nyamukapa and Gregson (2005) in Zimbabwe, and
Ueyama (2007) in Malawi. On the other hand, Ainsworth and Filmer (2006) conclude
that it is not either paternal or maternal orphans that are disadvantaged with respect
to schooling, but double orphans.
As earlier mentioned, only a few studies have examined the relationship between
orphanhood and health status (See e.g. Siaens et al. 2003, Deininger et al, 2003;
Lindblade et al. 2003; and Mishra et al. 2005)7. Siaens et al (2003) based on the
2000/2001 national household survey of Rwanda finds that orphans are
disadvantaged with respect to access to health care and also exhibit the worst
measures of long term health status. For instance, only 15 % of double orphans
have received a BCG vaccine by the age of 5 years while the rate for children with
both parents is more than double at 37%. Regarding long term health status, the
stunting rate of double orphans is 40% compared to only 26 % for children with both 7 This is because the predominant source of orphan data—the household surveys, rarely collect health status information such children’s anthropometric indicators due to cost considerations.
6

parents. A recent study by Mirshra et al (2005) based on demographic and health
data from Kenya also finds that fostered children are more likely to be stunted than
other children. A major drawback for most of the orphan-health status studies is that
their only compare the health status of orphans and non-orphans with no attempt to
control for other factors that may affect this relationship.
As earlier mentioned, due to Uganda’s long history with HIV/AIDS, a number of
studies have also investigated the impact of orphan status on children’s human
capital outcomes (See e.g. Yamano et al., 2006; Deininger et al., 2003; and Ntozi,
1997). Similar to the wider SSA literature, the studies on Uganda have focused more
on the orphan- school participation relationship albeit with mixed results. While
Deininger et.al (2003) find no effect of foster status on school participation; Yamano
et.al. (2006) on the other hand only find significant effects of orphan status on school
participation of adolescents, especially girls.
Notwithstanding the wealth of studies on orphanhood and human capital outcomes
in Uganda, we examine related issues although in a different way. Deininger et al.
(2003) and Yamano et al. (2006) are the works most closely related to this study, but
we do undertake a number of improvements. Unlike the above studies, we use a
more nationally representative household survey and also explicitly identify orphans
due HIV/AIDS. For example, Deininger et al. (2003) utilised panel data of 1,300
households surveyed in 1992 and 1999 and compare the enrolment rates of foster
children to other children. Although the 1992-99 panel dataset was nationally
representative, this particular study relied on foster children. As such, the failure to
identify actual orphans (since the question was not asked in 1992) limits the utility of
the study findings. Evidence from Demographic and Health Surveys indicates that a
significant proportion of foster children’s parents are still alive (Evans and Miguel,
2007). Similarly, the study by Yamano and others is based on a small sample—they
covered only 29 of 55 districts in Uganda in 2003. We utilise a relatively larger
survey and consequently, this permits more representative estimates of the impact of
7

parental death either from HIV/AIDS or other causes on children’s education
outcomes8.
Finally, rather than compare the schooling of HIV/AIDS orphans to non-orphans, we
include interaction terms with various categories of orphan status—to investigate
whether impacts differ the child’s status on the income distribution. Previous works
show that failure to account for household poverty status can result to insignificant
results for impacts of covariates on the use of social services (Glick et.al, 2004). In
addition, we consider the effect of HIV/AIDS orphan status on another education
indicator—the schooling gap. Previous research such as Sssewanyana et al. (2006)
shows that children in school in Northern Uganda are significantly below their
appropriate grade—either due to late enrolment or dropping out and re-entering
school. Consequently, it is important to know how the absence of at least one parent
may affect the timing of joining or continuing in school.
3.0 Methodology
In order to estimate the impact of orphan status on school enrolment, we follow the
approach by Glick et.al (2004) and estimate models for determinants of school
enrolment where different categories orphan status are included as independent
variables. For the school enrolment outcome, we estimate a probit model for current
school enrolment specified as:
(1) )'()1Pr( iij XE βΦ==
where represents enrolment into school for a child, ijE Φ represents a standard
normal cumulative distribution, represents parameters to be estimated while
are covariates that influence school attendance including orphan status. In order
to more accurately interpret the results from the probit estimations, we estimate
marginal effects of the specification in Eq (1). The marginal effects model is specified
as:
'β
iX
8 Another improvement of the present study is the consideration of households both in rural and urban areas. Yamano and others only cover rural areas. As shown in Table 1, the rate of orphanhood in urban areas is much higher than that of rural areas and this is mainly attributed to relatively higher HIV/AIDS prevalence in urban areas and consequently associated prime age mortality (GoU, 2006a). Thus, any work that omits urban orphans seriously underestimates the orphan problem in Uganda.
8

(2) jiij
j XX
Xββφ
β)'(
)]'([=
∂
Φ∂
The interpretation for the estimations from Eq (2) is as follows—it measures the
impact of change in the regressor at the mean on school enrolment.
On the other hand, for the determinants of the number of years below the
appropriate grade, we estimate ordinary least squares (OLS) models specified as
follows:
(3) ijij XGapSc '_ α=
The in all the above specifications capture variables relating to a child’s own
characteristics, those of its households as well as the community in which the child
resides. As earlier mentioned, HIV/AIDS orphan status or any other category of
childhood vulnerability is hypothesized to be among the major constraints to child
schooling.
ijX
4.0 Data sources We use the 2002/3 Uganda National Household Surveys conducted by the Uganda
Bureau of Statistics. This is a multi purpose modelled along the lines of the World
Bank’s Living Standards Measurement Surveys (LSMS), whose key objective was to
track trends in household welfare status. The survey is nationally representative
covering 9,711 households9. Furthermore, the survey is based on a two-stage
simple random sampling design. In the first stage, the Enumeration Area (EA) is the
principal sampling unit and at the second stage, 10 households are randomly
selected from each EA. The socio-economic modules of the surveys capture
information on household demographics, welfare status, housing conditions as well
as schooling and health information. On the other hand, the community module
captures availability and access to social services in the locality.
9 This particular survey comprehensively covers all the districts previously omitted in earlier UNHS surveys with the exception of Gulu district.
9

With regard to parental death, the 2002/03 survey inquires whether the mother and
father are alive for all children below 18 years. Furthermore, for all children below 18
years who have lost at least one parent, the survey inquires whether the parental
death is specifically due to HIV/AIDS. As earlier mentioned, this is the only UNHS
survey where this particular question is asked. Table 2 provides a profile of the
estimated number of orphan by the three categories—paternal, maternal and double
HIV/AIDS orphans10. From the table, it is indicated that about 4% of all children in
Ugandan below 18 years are HIV/AIDS orphans and the majority of HIV/AIDS
orphans have actually lost both parents. Nonetheless, HIV/AID orphans only make
up about 30% of the total orphan population (from tables 1 and 2).
At the spatial level, HIV/AIDS orphans are predominant in urban than rural areas
(6.1% vs. 3.6%). On the other hand, at the regional level, Central Uganda accounts
for the largest proportion of orphans—at least 6.3% of the children in the region are
estimated to be HIV/AIDS orphans. In terms of actual numbers, we estimate that the
total population HIV/AIDS orphans was about 600,000 children in 2002/03 and more
than half of these are double orphans11. Due to the relatively lower reported
HIV/AIDS orphan rates among the general orphan population, in the estimations, we
do not disaggregate further HIV/AID orphans into sub categories such as paternal,
maternal or double orphans. Rather, the further disaggregation is for the whole
orphan sample—regardless of the cause of parental death.
4.2 Variables used in the analysis a) Indicator of Orphan status
Regarding the main variable of interest, the 2002/03 survey inquires about the
survival of both parents from all individuals in the households12. We define an
HIV/AIDS orphan as any child below 18 years who has lost at least one parent and
who reports that the cause of death was HIV/AIDS. Although reported HIV/AID
orphans are a relatively smaller sample of the whole population as alluded to earlier,
10 Paternal orphans are those that have lost only the father; maternal orphans have only lost their mother while double orphans have lost both parents to HIV/AIDS. 11 The figures are considerably much lower than those quoted in the various UNICEF and UNAIDS reports and the difference may be explained that the UNAIDS estimates are best on models of estimated infection and deaths unlike our estimates best on household responses. 12 In this particular survey, the five options considered are: “father and mother alive”, “only father alive”, “only mother alive”, “none alive” and “don’t know”.
10

there are important reasons for focusing HIV/AIDS orphans and not other orphans.
First, as earlier mentioned, parental deaths from HIV/AIDS is traumatising given that
some children are able to see their parents suffering for an extended period of time
and consequently may be psychologically affected which in turn may affect their
human capital outcomes. Second, and most important, this study was undertaken
under a collaborative research project investigating the impacts of HIV/AIDS on the
Ugandan economy; therefore retaining our focus on HIV/AIDS orphans can aid the
comparison of the various impacts of HIV/AIDS on other dimensions of welfare
status. Nonetheless, we do compare the schooling outcomes of HIV/AIDS orphans
to other categories of vulnerable children as this may matter for policy.
(b) Indicators of Schooling
Regarding education, the survey captures information on children’s current schooling
status as well as education attainment (highest grade attained). Consequently, our
first indicator of schooling is current enrolment for children aged 6-17 years and this
serve as our main anchor for school participation for both HIV/AIDS orphans and
other children13. The second indicator is the schooling gap i.e. the number of years a
child is below an appropriate grade. Consequently, the impact of HIV/AIDS as well
as other orphan states on education outcomes of children is investigated via (i) the
differences between enrolment rates of HIV/AIDS orphans and other children and
also among orphans, and (ii) the difference in the schooling gap between HIV/AIDS
orphans and other children and similarly among orphans as a sub category of
children.
(c) Household income
In line with other studies analysing socio-behavioural outcomes in developing
countries, consumption expenditure is used as the measure of household welfare.
Although the 2002/03 survey captures both income and consumption, consumption
expenditures were preferred due to the fact that expenditures are more stable than
income—which fluctuates from year to year. In addition, Uganda being a
predominantly agricultural country, the likelihood of understating income is high.
Thus, consumption expenditures adjusted for intra-household inequalities 13 The empirical analysis is carried out for both the combined group (all children aged 6-17 years) as well as separately for the 6-12 years and 13-17 years groups.
11

(household age and composition effects) using adult equivalence scales, are our
measure of household socio-economic status. In all the estimations, the variable for
consumption per adult equivalent is interacted with the various categories of orphan
status to establish whether orphan impacts differ according to the household’s status
on the welfare distribution.
12

(d) Other Control Variables
In order to capture the child’s own demographic characteristics, the following
variables were included: the gender of the child, an indicator of whether the child is
the oldest son or daughter, and the number of siblings in the household. The
household characteristics include: the total household size, gender of the household
head, and non-income measures of household welfare status such as the education
attainment of the household head. We also include community characteristics in
particular relating to: distance to nearest public primary school, presence of a large
employer within 10kms of the village centre, and the presence on an output market
in the community. Furthermore, we also account for resources at the nearest public
school. These include: the school fees charged (both official fees and contributions
through parent teacher associations), the share of teachers with formal
qualifications, and conditions of the school buildings. Finally, we account for the
spatial location of children by including the regional dummies14. In Table 3, we
provide the means of the variables used in the analysis. From the means, it appears
that on average HIV/AIDS orphans reside in households of relatively higher
socioeconomic status.
4.3 Other issues in estimation. We estimate both combined models for school enrolments and the schooling gap as
well as separate models for the primary schooling age category (6-12 years) and
secondary schooling age category (13-17 years). In addition, we consider each
category of orphan status separately. For example, in order to estimate the impact of
HIV/AIDS orphan status on enrolment; we first include a dummy for HIV/AIDS
orphan status in the probit model and thereafter in another model, an interaction
term of HIV/AID orphan status and household consumption. As such, we estimate
two models for each of the following orphan categories: (1) HIV/AIDS orphans, (2) all
orphans regardless of cause of parental death, (3) paternal orphans, (4) maternal
orphans, and (5) double orphans.
14 We experimented with a number of demographic variables such as number of female adults in the household and the proportion of females among children; however, due to multicollinearity concerns, these particular variables were dropped. Other variables dropped on similar grounds included: household landholding, education attainment of females in the household, and access to electricity in the community.
13
5.0 Results
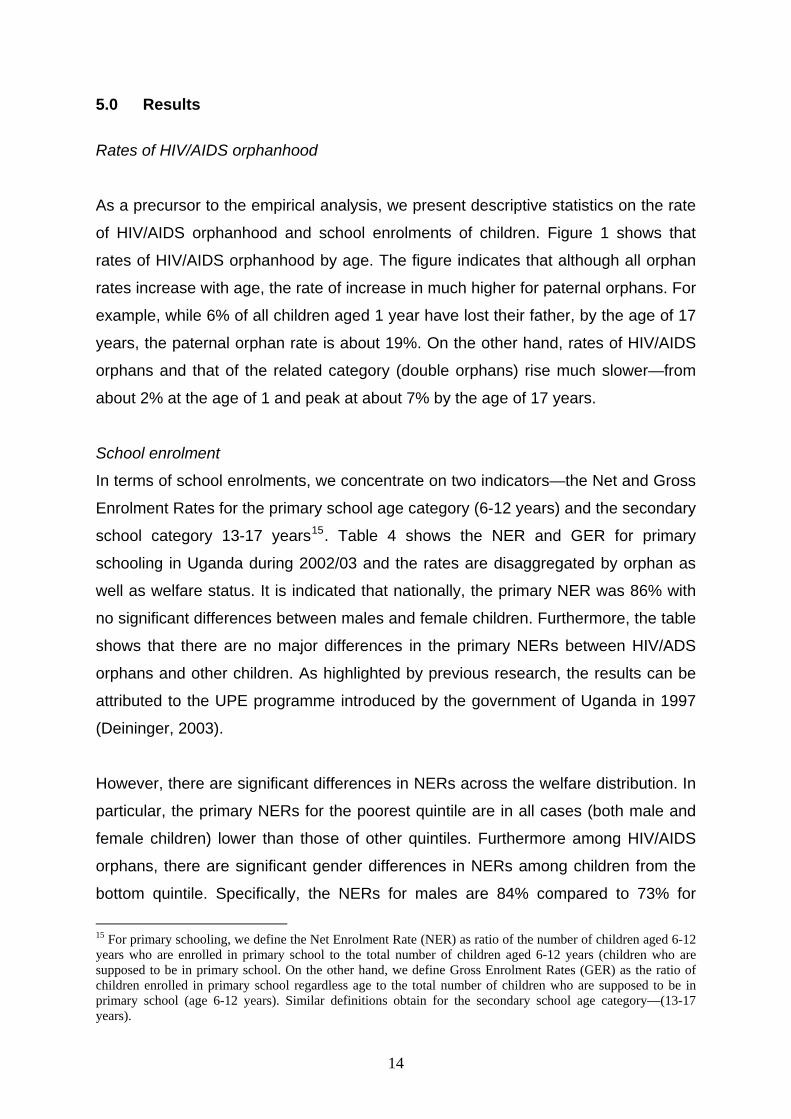
Rates of HIV/AIDS orphanhood
As a precursor to the empirical analysis, we present descriptive statistics on the rate
of HIV/AIDS orphanhood and school enrolments of children. Figure 1 shows that
rates of HIV/AIDS orphanhood by age. The figure indicates that although all orphan
rates increase with age, the rate of increase in much higher for paternal orphans. For
example, while 6% of all children aged 1 year have lost their father, by the age of 17
years, the paternal orphan rate is about 19%. On the other hand, rates of HIV/AIDS
orphans and that of the related category (double orphans) rise much slower—from
about 2% at the age of 1 and peak at about 7% by the age of 17 years.
School enrolment
In terms of school enrolments, we concentrate on two indicators—the Net and Gross
Enrolment Rates for the primary school age category (6-12 years) and the secondary
school category 13-17 years15. Table 4 shows the NER and GER for primary
schooling in Uganda during 2002/03 and the rates are disaggregated by orphan as
well as welfare status. It is indicated that nationally, the primary NER was 86% with
no significant differences between males and female children. Furthermore, the table
shows that there are no major differences in the primary NERs between HIV/ADS
orphans and other children. As highlighted by previous research, the results can be
attributed to the UPE programme introduced by the government of Uganda in 1997
(Deininger, 2003).
However, there are significant differences in NERs across the welfare distribution. In
particular, the primary NERs for the poorest quintile are in all cases (both male and
female children) lower than those of other quintiles. Furthermore among HIV/AIDS
orphans, there are significant gender differences in NERs among children from the
bottom quintile. Specifically, the NERs for males are 84% compared to 73% for
15 For primary schooling, we define the Net Enrolment Rate (NER) as ratio of the number of children aged 6-12 years who are enrolled in primary school to the total number of children aged 6-12 years (children who are supposed to be in primary school. On the other hand, we define Gross Enrolment Rates (GER) as the ratio of children enrolled in primary school regardless age to the total number of children who are supposed to be in primary school (age 6-12 years). Similar definitions obtain for the secondary school age category—(13-17 years).
14

females. Overall, although children from the bottom quintile appear worse off in
terms of enrolment, the magnitude do not seem very large and indeed the results
may point to issues of late enrolment into school among poor children.
Indeed, the lower portion of Table 4 actually confirms that there is significant late
enrolment across the spectrum of children considered. In particular, the national
GER is 125 and this indicates that in 2002/03 about 25% of children in primary
school were out of the recommended age range of 6-12 years. Furthermore, the
primary GERs differ significantly by gender. Specifically, males are more likely to
enrol into primary school out of the recommended age range compared to females.
Also, across the welfare distribution, the GER reduces with an improvement in
household welfare status as measured by per capita adult consumption quintiles.
Finally, the primary GERs of HIV/AIDS orphans are significantly different from
orphans of other causes as well as or non-orphans.
Unlike the relatively higher primary NERs, the corresponding secondary NERs are
much lower (Table 5). In particular, the NERs for children 13-17 years are only 22%
and again the tests for the difference in means by gender across the various
categories of children are not significant. Also worth noting is the fact that orphans
(both due to HIV/AIDS and other reasons) exhibits higher rates of secondary
enrolment compared to non-orphans. This particular result may point to the fact that
orphans are often taken up by households of relatively higher welfare standing than
compared to the orphan’s own parents. Indeed, evidence from other developing
countries show that it is always the well to do families that accept responsibility of
fostering other children (Evan and Miguel, 2006; Gertler et al 2004).
Furthermore, Table 5 shows that there is gross inequity in secondary enrolment. In
particular, the ratio of net secondary enrolment of the richest to the poorest students
is 9.6 (46.9 over 4.9) and the trend is similar for both HIV/AIDS orphans and other
children. In comparison to both sub-Saharan Africa (SSA) and other developing
countries, Uganda’s secondary enrolment rates also remain low. According to the
Education For All 2005/6 Global Monitoring Report, the secondary enrolment rate for
SSA was 28.4 in 2002/3 while the developing countries average was nearly double
at 58.3 (UNESCO, 2006). Overall, the above results show that inequality in
15

secondary schools is more widespread than in primary schools, in the sense that
more children are disadvantaged in relation to the richest 20 % of the households.
The lower panel of Table 5 shows that the secondary GERs are considerably much
higher and this suggests that children—both HIV/AIDS orphans and other children
join the appropriate school grades much later. Overall, the results for the secondary
NERs suggests that either only a few primary school graduates are able to join and
stay in secondary school or that, like in the previous case, children join secondary
school out of the recommended age. The former factor may carry more weight given
previous evidence showing a high school drop our rate in primary school (GoU,
2006c) coupled with limited transition to secondary school.
In order to investigate further whether children join school late or whether their drop
and re-enter school, we examine the schooling gap. Figure 2 plots the average
schooling gap in years by current age status among: HIV/AIDS orphans, orphans
due to other causes and non-orphans. It is indicated that up to the age of 18 years,
the line graphs for HIV/AIDS orphans is all points lower than that of either other
orphans or non-orphans. On average, by the age of 18 years, children currently in
school are 3.5 years below their appropriate grade.
Overall, the descriptive statistics suggest that HIV/AIDS orphans are in no way
worse off, in terms of school participation, compared to other children. However,
mere descriptive statistics does not establish causality. It is important to control for
other factor that may affect the schooling outcomes of children affected by parental
death. Consequently, we examine differences in enrolments and schooling gaps
between orphans and other children through estimation of the models specified in
section 3.
Regression Results
In Table 6, we present the marginal effects results for school enrolment. Since we
are mainly interested in the effects of orphan status, and the fact that the rest of the
other covariates are similar in all the probit models, we only show results for the
16

particular orphan indicator16. For the combined category (6-17 years), column (1)
reports the results for the HIV/AIDS orphan and it is indicated that being an HIV/AID
orphan is positively associated with enrolment however; the results in this particular
case are not significant. In column (2), the indicator for HIV/AIDS orphan status is
interacted with household consumption. Although the signs change—indicating that
HIV/AIDS orphans are less likely to be enrolled, the results remain insignificant—at
even the 10% level of confidence.
In column (3), we now consider the impact of orphan status (regardless of cause of
parental death) on school enrolment. Again, the indicator shows that being an
orphan has no significant impact on school enrolment. However, when we take into
account the welfare status of the child (column 4), we find that on average orphans
are about 30% less likely to enrol in school and the differences in enrolment between
orphans and other children reduces as one moves up the household welfare
distribution. Further analysis by sub category of orphan status (presented in columns
5 to 10) reveals that it is the results for paternal orphans that are driving the above
impacts. In particular, paternal orphans are significantly less likely to continue
schooling compared to either maternal or double orphans. Overall, our results
suggest that the type of parental death (in terms of which of the two parents passes
away first) matters more than the actual cause of parental death.
The above results may be explained by the fact Uganda is a patrilineal society—
where the man remains the most important income earner and consequently,
paternal death may result in more adverse consequence on children—this is
particularly true in developing with poorly developed credit markets17. Given the fact
that at the time of the survey, at least the UPE policy was operational across
Uganda, the significance of paternal orphanhood and its relation to household
income suggest that children continue to face other schooling costs even in the era
of free primary education. On the other hand, as indicated in our descriptive results,
majority of HIV/AIDS orphans are double orphans, but our analysis relating to double
orphan status (column 10) indicates that double orphans are on average not worse
off with regard to schooling. As mentioned earlier, results from cross country studies 16 The detailed results are available from the authors. 17 In this case, the surviving parent can not borrow and continue financing a child’s education.
17

in SSA suggest that orphans are more likely to be taken up by relatively well to do
households (Ainsworth and Filmer, 2006; Case et.al, 2004).
Do the impacts of orphan status differ by a child’s schooling age category? More
specifically, are orphans in the primary school age category (6-12 years)—where
free education exits more likely to enrolled than their counterparts in the secondary
school age category (13-17 years)?18 Indeed, the results from the bottom two
panels of table 6 show that the school age category does—HIV/AIDS and maternal
orphans are significantly less likely to continue schooling for the 13-17 years school
category. HIV/AIDS orphans aged 13-17 years are 57 % less like to be enrolled in
school although the effect is only weakly significant –at the 10% level. On the other
hand, maternal orphans are 55% less likely to be in school for the 13-17 year school
age category.
Two reasons can be advanced for the difference in impacts on enrolment across age
categories. First, as highlighted by Deininger (2003) and Yamano et al. (2006), the
UPE program—which targets the age category 6-12 years may have successfully
addressed the income constraints to school enrolment. Secondly, the significant
impacts for the 13- 17 years age category may be explained by the HIV/AIDS
gestation period—from infection to deaths. According to UNAIDS (2004) the average
duration from infection to death is about 10 years; consequently for the 6-12 years
age range, at least one of the parents may be still surviving where as by the time the
children make their 17th birth day, it is mostly certainly than not that both parents are
dead.
Apart from the possibility that orphans may be taken up by relatively well to do
households, it is also possible that they drop out of school—prior or immediately
after parental death but later rejoin school. This is particularly plausible for HIV/AIDS
orphans if children have to live school and look after ailing parents. If this is the case,
then HIV/AIDS orphans will fall much lower below the appropriate age compared to
other children. Consequently, we examine this issue by estimating OLS regressions
18 In 2002/03, there was no free secondary in Uganda however at the start of 2007; the Government initiated the Universal Secondary Education (USE) scheme. At the time of undertaking this research, it was not possible to investigate what impact USE may have on enrolment for the 13-17 year age category due to data constraints.
18

for determinants of the schooling gap years. Similar to our enrolment estimations, we
interact orphan status with household consumption expenditures—to examine
whether the orphan impacts on the schooling gap differ by welfare status.
Table 7 reports the results for the determinants of the schooling gap and the first
panel shows the results for the combined age categories (6-17 years). Unlike in the
case of school enrolment, column (2) in this particular case shows that HIV/AIDS
orphans are on average about 3 years below their appropriate grade. Also, the
significance of the interaction term indicates that number of years below the
appropriate grade increases at lower levels of household welfare status—poor
HIV/AIDS orphans are more likely to fall below their appropriate grade. Even more
important, in the schooling gap estimations, all the various categories of orphan
status show significant impacts—with average falls below appropriate grade of about
2.5 years. Similar to the case of school enrolments, the schooling gap impacts
significantly differ by schooling age categories (the bottom two panels of table 7).
While orphans aged 6-12 years are on average 1.3 years below their appropriate
grade, the average gap is more than double at 3.6 years for the 13-17 years school
age category. Worse still, among children in the 13-17 year age category, the
magnitude of the gaps are highest for HIV/AIDS and paternal orphans—on average
orphans from the above two categories are about 4 years below their appropriate
grade.
In summary, our results from table 6 show that paternal orphans are less likely to
enrol and continue school; however, our results from table 7 show that orphan status
adversely affects schooling gaps—regardless of category of orphanhood. Thus,
orphans are more likely to missing out on school for a significant number of years
than completely drop out of school. More specific to the issue of HIV/AIDS, our
results show that although HIV/AIDS orphan status has minimal impacts on school
enrolments, it nevertheless has far reaching impacts on appropriate grade
attainment. Unfortunately, due to data limitations, we are unable to investigate
further the direct ways through which parental death from HIV/AIDS or any other
19

cause impacts on: delayed school enrolment; school drop out and re-entry or grade
repetition—the main principal causes of the school gap19.
6.0 Conclusion and Implications
This study investigates the impact of HIV/AIDS orphan status on two schooling
outcomes—school enrolment and the schooling gap. In addition, we examine the
impacts across two age categories—6-12 years (primary school going age category)
and the 13-17 years (secondary school going age category). We find that HIV/AIDS
parental death impacts most on the schooling gap as opposed to actual school
enrolment. For the whole category of orphans, we find that there are less likely to
continue school and the effects are much worse for children from poor households.
Furthermore, the larger impacts on the schooling gap on the 13-17 year age
category suggests, the effects of parental loss may be cumulative. Consequently,
national policies that address the challenge of school drop-outs have the potential to
address vulnerabilities with respect to HIV/AIDS orphans joining or continuing
school.
On the other hand, targeting HIV/AIDS orphans or any other orphans presents
ethical dilemmas. Our results show that all orphan children (regardless of the cause
of parental death) and especially from the poorest households are disadvantaged
with respect to school enrolment. On the other hand, HIV/AIDS orphans as a specific
group are significantly not less likely to continue schooling. Furthermore, a
substantial proportion of poor children are out of school albeit with both parents alive.
Consequently, if only HIV/AIDS orphans or children who have lost at least one
parent are offered support, the largest proportion children would still be out of school,
especially secondary school. However, a national program—the Community-led
HIV/AIDS Initiative (CHAI) component under the Northern Uganda Social Action
Fund (NASAF) experimented with supporting orphans to attend secondary school in
19 Despite the presence of the policy of “automatic promotion”, repetition is also still rampant in primary schools. According to the 2006 Education statistical abstract, at least 13% of children enrolled in primary school were repeaters and this reflects another enormous wastage of resources. On the other hand, repetition rates in secondary schooling are much less pronounced than those for primary schools—only 2% of students enrolled in secondary school are repeaters.
20

8 districts of Northern Uganda. In this particular case, communities affected by
HIV/AIDS selected the most deserving orphans for whom the project paid school
dues. Over a period of 4 years, only 1,677 or about 7 % of the total number of
orphans of secondary school going age in the 8 districts had been supported
(Uganda AIDS Commission, 2007). Thus, replication of such programs requires not
only a large amount of resources but also must recognise the local settings.
Communities in Northern Uganda were able to register some success with the CHAI
program due to their stronger socio-cultural ties. In other parts of the country where
community ties are not that cohesive, identification of beneficiaries would be
problematic due to concerns of elite capture of national programs. Consequently, it is
national programs (of the scale of USE) which do not discriminate children based on
the cause of their vulnerabilities, are likely to succeed in increasing enrolment in
secondary school.
21

7.0 References Ainsworth, M and D. Filmer (2006) “Inequalities in children’s schooling: AIDS, Orphanhood, Poverty and gender” World Development Vol.34 No.6: 1099-1128.
Ainsworth, M et al. (2005) “The Impact of Adult Mortality and Parental Deaths on Primary Schooling in North-Western Tanzania” The Journal of Development Studies Vol 41.
No.3: 412-439.
Bennell, P (2005) “The Impact of AIDS Epidemic on the schooling of Orphans and other Directly Affected Children in Sub-Saharan Africa” Journal of Development Studies,
Vol 41. No.3: 467-488.
Bicego, G et al. (2003) “Dimensions of the emerging orphan crisis in Sub-Saharan Africa,” Social Science and Medicine 56: 1235-1247. Case, A and C. Ardington (2006) “The Impact of Parental Death on School Outcomes: Longitudinal Evidence from South Africa” Demography Vol.43: No.3:401-420 Case, A et al. (2004) “Orphans in Africa: Parental death, poverty, and school enrolment”,
Demography 41(3): 483-508. Ciantia, F (2004) “HIV Seroprevalence in Northern Uganda: The Complex Relationship Between AIDS and Conflict”. Journal of Medicine & The Person (2) No. 4: 172-175.
Deininger, K (2003) “Does Cost of Schooling Affect Enrollment by the Poor? Universal Primary Education in Uganda”. Economics of Education Review Vol.22. No.3 (June). pp.291-305. Deininger et al. (2003) “AIDS-Induced Orphanhood as a Systematic Shock: Magnitude, Impact and Program Interventions in Africa.” World Development, Vol. 31. No. 7: 1201-1220. De Walque (2007) “How Does the Impact of an HIV/AIDS Information Campaign vary with Education Attainment: Evidence from Rural Uganda”. Journal of Development Economics Vol.84:686-714.
22

Evans, D and T. Miguel (2007) “Orphans and Schooling in Africa: A longitudinal analysis,” Demography Vol 44, No.1: 35-57
Gertler, P et al. (2004) “Schooling and Parental Death” The Review of Economics and Statistics Vol. 86 No. 1: 211-225. Glick, P et.al (2004) “Integrating Gender into Benefit Incidence and Demand Analysis” Cornell Food and Nutrition Policy Program Working Paper No. 167 http://www.cfnpp.cornell.edu/images/wp167.pdf Government of Uganda (2006a) Uganda HIV/AIDS Sero-Behavioral Survey 2004-
2005 Ministry of Health and ORC Macro. Kampala ______, (2006b) Health Policy Statement 2006/7 Ministry of Health, Kampala _____, (2006c). Education Statistical abstract 2004. Ministry of Education and Sports, Kampala. _______, (2002) Uganda Participatory Poverty Assessment Process II. Ministry of Finance Planning and Economic Development. Kampala Lindblade, K.A et al (2003) “Health and Nutrition Status of Orphans <6 years old cared for by relatives in Western Kenya” Tropical Medicine International Health Vol 8: 67-72. Mishara, V et al. (2005) “Education and Nutritional Status of Orphans and Children of HIV Infected Parents in Kenya” Demographic Health Research Working Paper No 24. Ntozi, J. P. M. (1997) “Effect of AIDS on children: the problem of Orphans in Uganda” Health Transition Review Supplement to Volume 7: 23-40. Nyamukapa, C and S.Gregson (2005) “Extended family’s and women’s role is safeguarding Orphans education in AIDS-afflicted rural Zimbabwe” Social Science and Medicine Vol. 60:2155-2167. Rosenbaum, P and D. Rubin (1983) “The Central Role of the Propensity Score in Observational Studies for causal effect”. Biometrika Vol.7. No.1: 41-55.
23

Siaen, C et al. (2003) “Are Orphans Especially Vulnerable? Evidence from Rwanda” World Bank Washington, D.C. Ssewanyana, S et al. (2006) “Strengthening the understanding of the dynamics of poverty in
Northern Uganda” mimeo Economic Policy Research Centre.
Ueyama, M (2007) “Mortality, Mobility, and Schooling Outcomes Among Orphans: Evidence from Malawi” IFPRI Discussion Paper No. 00710. Uganda AIDS Commission (2007) Uganda HIV/AIDS Control Project: Progress Report of The CHAI Component for the Period 2006. Kampala UNESCO (2006) EFA Global Monitoring Report, 2005, Paris. UNESCO UNICEF (2007) The State of the World’s Children 2007: Women and children-The double
dividend of gender equality. New York. UNICEF.
________, (2004) Children on the Brink 2004: A Joint Report of New Orphan Estimates and a Framework for Action. New York. UNICEF. Yamano, T et al. (2006) “Living arrangements and Schooling of orphaned children and adolescents in Uganda” Economic Development and Cultural Change Vol. 54: 833-856
24

Figure 1: Rates of Orphanhood by Age, 2002/03 (%)
0
5
10
15
20
25
0 1 2 3 4 5 6 7 8 9 10 11 12 13 14 15 16 17
Age
%
OrphansHIV-AIDSPaternalMaternalDouble
Figure 2: Schooling Gap among 6-25 years old currently in school.
-2
-1
0
1
2
3
4
5
6
7
8
9
6 7 8 9 10 11 12 13 14 15 16 17 18 19 20 21 22 23 24 25
Age
Scho
olin
g G
ap (y
ears
)
Non OrphansAll OrphansAIDS Orphans
25

All All AllRural Urban Rural Urban Rural Urban
Orphans as % of children <18 years 14.4 14.2 15.9 14.7 14.7 17 13.6 12.9 19Percentage of which
Paternal Orphans 8.7 8.6 9.1 8.5 8.3 9.7 8.1 7.7 11.2Maternal Orphans 2.8 2.8 2.3 2.9 3 2.9 2.2 2 3.4
Double Orphans 2.9 2.8 4.5 3.2 3.1 4.4 3.3 3.1 4.3Number of orphansSource: Author's calculations from 1996/7, 1999/00 and 2002/2003 household surveys
Location Location Location
1,753,546 1,831,513 2,071,997
Table 1: Uganda, Proportion and number of children who have lost at least parent, 1996/97-2002/3Survey Year
1996/97 1999/2000 2002/3
Table 2: Profile of HIV/AIDS Orphans in Uganda, 2002/3
All AIDS All AIDS Paternal Maternal Double Paternal Maternal Double
Uganda 3.93 1.44 0.51 1.99 597,620 218,469 76,972 302,179Rural 3.63 1.31 0.47 1.86 484,408 174,360 62,029 248,019Urban 6.07 2.36 0.80 2.90 113,212 44,109 14,943 54,160
Central 6.32 2.69 0.76 2.87 280,948 119,352 33,864 127,732Eastern 2.52 0.97 0.64 0.91 106,694 41,220 27,022 38,452Northern 2.35 0.72 0.08 1.55 66,167 20,325 2,320 43,522Western 3.88 1.01 0.37 2.50 143,811 37,572 13,766 92,473
Notes: * Rate of orphanhood refers to HIV/AIDS orphans as a proportion of all children less than 18 years
Type of orphan status Type of orphan statusNumber of AIDS Orphans*Rate of HIV/AIDS Orphanhood (%)
Source: Author's calculations from the 2002/03 UNHS survey
All
Household without
HIV/AIDS orphans
Household with HIV/AIDS
orphansDemographicsHousehold size 6.9 6.6 8.8No of children 4.5 4.2 5.9No of non orphan children 2.8 2.5 3.9No of orphans 2.8 - 4.2No of aids orphans 1.2 3.2Household HeadAge of household head 41 40.2 48.2Female household head 22.30% 17.40% 37.60%No of female adults 1.5 1.3 1.9No of female elders 1.1 1 1.1Average years of education 6.1 6.3 5.8Housing conditionsNo of sleeping rooms 2.3 2.2 2.8Roof Quality 66.40% 65.30% 86.20%Floor Quality 26.20% 25.20% 39.60%Wall Quality 35.50% 34.80% 46.20%Access to safe water 55.10% 53.40% 56.20%Access to a toilet 54.20% 52.90% 67.30%Electricity 8.50% 7.60% 14.80%Proportion Poor (%) 38.1 39.5 27.2
Table 3: Mean Household Characteristics of the Sample
Source: Author's calcultaions from the 2002/03 UNHS
26

All1 2 3 4 5
All Children 85.9 79.1 85 87.4 90.1 90.9Male 85.5 78.3 86.3 86.6 88.4 91.1
Female 86.3 79.9 83.7 88.2 91.6 90.7Non Orphan 85.5 79.5 84.9 87.6 90.1 89.9
Male 84.9 78.2 86.3 86.4 88.6 89.1Female 86.3 80.9 83.5 88.5 91.4 90.8
Orphan 88 82.6 86.3 89.1 89.9 94.3Male 89.1 82.3 91.2 87.5 89 94.2
Female 87.3 82.8 82.8 90.6 90.9 90.9HIV/AIDS Orphan 87.7 77.6 83.2 89.9 89.7 94.6
Male 88.3 84.3 86.8 85.9 94.4 95.4Female 87.5 73.2 80.7 93 85.6 91.1
All Children 125.2 119.9 126.8 129.8 127.1 122.6Male 128.2 124.3 130.8 130.9 130.6 124.2
Female 122.3 115.1 122.9 128.9 124.1 121.3Non Orphan 126.4 119.2 128.9 129.6 133 123.1
Male 129.9 122.7 131.7 132.6 138.2 127.1Female 124.7 117.3 128.6 128.9 128.9 120.5
Orphan 131.6 127.9 127.3 144.9 127.7 129.1Male 138.2 140.4 136.8 147.9 133.4 130.1
Female 126.7 118.4 120.7 143.2 122.8 129.6HIV/AIDS Orphan 129.3 136.9 110.4 147.1 122.3 124.9
Male 139.9 133.6 130.7 152.1 144.7 131.3Female 120.9 141.9 96.7 143.3 102.5 119.9
Per capita Consumption QuintileTable 4: Uganda Primary Enrollment Rates by Orphan Status (6-12 years), 2002/03
Source: Author's calculation from the 2002/03 UNHS
Gross Enrollment Rates
Net Enrollment Rates
27

All1 2 3 4 5
All Children 22.1 4.9 14.6 23.4 30.7 46.9Male 23.1 6.1 12.6 27.9 31.2 48.8
Female 21 3.3 16.5 18.8 30.2 45.3Non Orphan 20.5 5.1 12.9 23.2 29.8 43.3
Male 20.8 6.6 11.1 28.8 31.6 42.5Female 19.1 3.3 14.7 17.7 27.9 43.9
Orphan 24.5 4.9 19.8 25.1 29.9 49.3Male 25.6 5.3 16.4 27.22 30 55.1
Female 23.6 4.4 22.8 22.9 29.9 44.7HIV/AIDS Orphan 31.2 5.8 27.8 27.6 32.5 55.8
Male 31 7.3 29.1 30.9 29.8 56.4Female 31.2 3.5 26.1 23.6 36.6 55.4
All Children 31.9 8.5 22.4 32.2 46.8 63.1Male 35.4 11.3 23.6 38 50.1 69.5
Female 28.4 5.1 21.1 26.2 43.4 57.5Non Orphan 28.2 7.4 19.5 32.8 43.1 56.7
Male 31 8.8 20.6 40.5 46.4 61.9Female 25.2 5.6 18.4 25.2 39.6 52.3
Orphan 32.7 8.9 25.7 29.9 43.9 63.5Male 36.2 12.3 25 32.8 47.1 70.7
Female 29.3 4.4 26.4 26.7 40.1 57.9HIV/AIDS Orphan 41.6 5.7 33.9 31 49.5 78.3
Male 43.1 7.3 37.2 37.2 46.9 83.7Female 39.9 3.5 29.5 23.8 53.4 74.6
Source: Author's calculation from the 2002/03 UNHS
Table 5: Uganda Secondary Enrollment Rates by Orphan Status (13-18 years), 2002/03Per capita Consumption Quintile
Net Enrollment Rates
Gross Enrollment Rates
28

Dependent Variable Enrolment in school[1] [2] [3] [4] [5] [6] [7] [8] [9] [10]
Age Category 6-17 yearsHIV/AIDS Orphan =1 0.015 -0.317
(1.53) (-1.47)HIV/AIDS Orphan x Household Expenditures 0.022
(1.60)Orphan=1 0.0008 -0.2741
(0.15) (-2.97)**Orphan x Household Expenditure 0.0202
(2.99)**Paternal Orphans=1 0.0038 -0.2739
(0.93) (-2.67)**Paternal Orphans x Household Expenditures 0.0204
(2.76)***Maternal Orphans=1 0.0053 -0.7241
(0.65) (-1.26)Maternal Orphans x Household Expenditures 0.0832
(1.31)Double Orphan=1 0.0235 0.029
(2.38)** (0.26)Double Orphan x Household Expenditures -0.0007
(-.05)R-Squared 0.16 0.18 0.16 0.17 0.16 0.16 0.16 0.16 0.17 0.16Number of observations (N=18,111)
Age Category 6-12 yearsHIV/AIDS Orphan =1 0.0157 -0.3484
(1.33) (-.99)HIV/AIDS Orphan x Household Expenditures 0.0206
(1.09)Orphan=1 0.0077 -0.3439
(1.17) (2.33)**Orphan x Household Expenditure 0.0213
(2.43)**Paternal Orphans=1 0.0042 -0.2875
(.58) (-1.93)*Paternal Orphans x Household Expenditures 0.0182
(1.98)**Maternal Orphans=1 0.0165 -0.0191
(1.73)* (-0.13)Maternal Orphans x Household Expenditures 0.0039
(0.27)Double Orphan=1 0.0135 0.0664
(1.07) (1.03)Double Orphan x Household Expenditures -0.0163
(-0.94)R-Squared 0.19 0.19 0.18 0.2 0.17 0.19 0.18 0.18 0.19Number of observations (N=11,685)
Age Category 13-17 yearsHIV/AIDS Orphan =1 0.0256 -0.5676
(1.51) (-1.72)*HIV/AIDS Orphan x Household Expenditures 0.0433
(1.85)*Orphan=1 -0.0021 -0.4451
(-0.19) (-2.98)***Orphan x Household Expenditure 0.0353
(2.96)***Paternal Orphans=1 0.015 -0.3856
(1.3) (-2.3)**Paternal Orphans x Household Expenditures 0.0324
(2.43)**Maternal Orphans=1 -0.0013 -0.5489
(-0.09) (-2.29)**Maternal Orphans x Household Expenditures 0.039
(2.28)**Double Orphan=1 0.0442 -0.1651
(2.60)*** (-0.58)Double Orphan x Household Expenditures 0.0196
(0.80)R-Squared 0.13 0.15 0.13 0.14 1.3 0.13 0.12 0.13 0.13 0.14Number of observations (N=6,426)
Table 6: Estimates for Marginal Effects for determinants of School Enrolment
charged, log of schol size, share of teachers with formal qualification and conditions of the buildings of the school. Finally, we include dummies regional location
Notes: All estimations also include the following covariates, for the child: gender of the child, household size, number of the childs siblings, dummies for oldest son or daughter. Relating to the household, the following variables are included:, age of the household head (years), gender of the household head, dummies for education attainment of the householdhead (no schooling, some primary, completed primary, some secondary and completed secondary). Included community covariates are: distances to the nearest public primary school, the presence of a large employer within 10kms of the community, and presence of an ouput market. Inaddition, we include variables relating to nearest primary school: log of fees
29

Dependent Variable: Number of years a child is behind a recommended grade [1] [2] [3] [4] [5] [6] [7] [8] [9] [10]
Age Category 6-17 yearsHIV/AIDS Orphan =1 -0.021 2.997
(-0.35) (4.16)***HIV/AIDS Orphan x Household Expenditures -0.329
(-4.20)***Orphan=1 0.133 2.452
(3.60)*** (6.48)***Orphan x Household Expenditure -0.254
(6.15)**Paternal Orphans=1 0.1156 2.5166
(2.92)** (6.24)***Paternal Orphans x Household Expenditures -0.2639
(-5.99)***Maternal Orphans=1 0.0893 2.616
(1.74) (4.14)**Maternal Orphans x Household Expenditures -0.275
(3.99)***Double Orphan=1 0.0469 2.786
(0.72) (3.42)***Double Orphan x Household Expenditures -0.2991
(3.38)**Adjusted R-Squared 0.11 0.14 0.13 0.14 0.12 0.14 0.11 0.13 0.11 0.14Number of observations (N=15,843)
Age Category 6-12 yearsHIV/AIDS Orphan =1 -0.0314 1.841
(-0.53) (2.45)**HIV/AIDS Orphan x Household Expenditures -0.205
(-2.50)**Orphan=1 0.0466 1.361
(1.31) (3.5)***Orphan x Household Expenditure -0.1446
(-3.38)**Paternal Orphans=1 0.0216 1.171
(0.56) (2.83)***Paternal Orphans x Household Expenditures -0.127
(-2.79)***Maternal Orphans=1 0.023 1.857
(0.47) (2.85)***Maternal Orphans x Household Expenditures -0.2001
(-2.81)***Double Orphan=1 -0.0514 1.289
(-0.78) (1.54)Double Orphan x Household Expenditures -0.1468
(-1.61)Adjusted R-Squared 0.06 0.07 0.06 0.08 0.06 0.08 0.07 0.1 0.08 0.09Number of observations (N=10,518)
Age Category 13-17 yearsHIV/AIDS Orphan =1 -0.235 4.062
(-2.5)** (3.82)***HIV/AIDS Orphan x Household Expenditures -0.4659
(4.05)***Orphan=1 -0.0738 3.579
(1.23) (6.27)***Orphan x Household Expenditure -0.397
(6.42)***Paternal Orphans=1 -0.1106 3.9704
(1.74)* (6.54)***Paternal Orphans x Household Expenditures -0.4455
(-6.76)***Maternal Orphans=1 -0.0965 2.145
(1.18) (2.27)**Maternal Orphans x Household Expenditures -0.242
(-2.37)**Double Orphan=1 -0.182 2.8182
(-1.8)* (2.31)**Double Orphan x Household Expenditures -0.326
(-2.47)**Adjusted R-Squared 0.2 0.22 0.19 0.22 0.18 0.21 0.2 0.21 0.19 0.22Number of observations (N=5323)
, the presence of a large employer within 10kms of the community, and presence of an ouput market. Inaddition, we include variables relating to nearest primary school: log of fees charged, log of schol size, share of teachers with formal qualification and conditions of the buildings of the school. Finally, we include dummies for regional location
Table 7: OLS Estimates for Determinants of School Gap
Notes: All estimations also include the following covariates, for the child: gender of the child, household size, number of the childs siblings, dummies for oldest son or daughter. Relating to the household, the following variables are included:, age of the household head (years), gender of the household head, dummies for education attainment of the householdhead (no schooling, some primary, completed primary, some secondary and completed secondary). Included community covariates are: distances to the nearest public primary school
30

ECONOMIC POLICY RESEARCH CENTRE
Research Series
NUMBER
AUTHOR(S)
TITLE
DATE
55 Ibrahim Mike Okumu and Frederick Mugisha
Missing 10 percent out of school children: examining the role of AIDS
June 2008
54 Ibrahim Okumu Mike, Alex Nakajjo & Doreen Isoke
Socioeconomic Determinants of Primary School Dropout: The Logistic Model Analysis
February 2008
53 Akankunda Bwesigye Denis
An assessment of the causal relationship between Poverty and HIV/AIDS in Uganda
February 2008
52 Rudaheranwa N., Guloba M. & W. Nabiddo
Costs of Overcoming Market Entry Constraints to Uganda’s Export-Led Growth Strategy
August 2007
51 Ibrahim Kasirye Vulnerability and Poverty Dynamics in Uganda, 1992-1999
August 2007
50 Sebaggala Richard
Wage determination and wage Discrimination In Uganda
May 2007
49 J. Herbert Ainembabazi
Landlessness within the vicious cycle of poverty in Ugandan rural farm households: Why and how is it born?
May 2007
48 Marios Obwona & Sarah N. Ssewanyana
Development impact of higher education in Africa: The case of Uganda
January 2007
47 Charles A. Abuka, Kenneth A. Egesa, Imelda Atai & Marios Obwona
Firm Level Investment: Trends, determinants and constraints
March 2006
46 John Okidi, Sarah Ssewanyana, Lawrence Bategeka & Fred Muhumuza
Distributional and Poverty Impacts of Uganda’s Growth: 1992 to 2003
December 2005
45 John Okidi, Sarah Ssewanyana, Lawrence Bategeka & Fred Muhumuza
Growth Stategies and Conditions for Pro-poor Growth: Uganda;s Experience
December 2005
44 Marios Obwona, Francis Wasswa and Victoria Nabwaayo
Taxation of the tobacco industry in Uganda:The Case for excise duty on cigarettes
November 2005
43 Marios Obwona & Stephen Ndhaye
Do the HIPC debt initiatives really achieve the debt sustainability objective? Uganda’s experience
August 2005
42 Nichodemus Rudaheranwa
Trade costs relating to transport barriers on Uganda’s trade
May 2004
41 Okurut Francis Nathan Banga Margaret & Mukungu Ashie
Microfinance and poverty reduction in Uganda: Achievements and challenges
April 2004
40 Ssewanyana Sarah, Nabyonga Orem Juliet, Kasirye Ibrahim, David Lawson
Demand for health care services in Uganda implications for poverty reduction
March 2004
39 Ssewanyana N.S., Okidi A.J., Angemi D., & Barungi V.
Understanding the determinants of income inequality in Uganda
March 2004
38 John A. Okidi Trends in Ugandan household assets during the 1990s
March 2004
37 Nichodemus Rudaheranwa, Lawrence Bategeka and Margaret Banga
Beneficiaries of water service delivery in Uganda
October 2003
31

NUMBER
AUTHOR(S)
TITLE
DATE
36 Nichodemus Rudaheranwa, Lawrence Bategeka, Margaret Banga & Ashie Mukungu
Supply Response of Selected Export Commodities in Uganda
October 2003
35 Godfrey Bahiigwa, Frank Ellis, Odd-Helge Fjeldstad & Vegard Iversen
Rural Taxation in Uganda: Implications for Growth, Income Distribution, Local Government Revenue and Poverty Reduction
January 2004
34 David Lawson, Andy McKay & John Okidi
Poverty Persistence and Transitions in Uganda: A Combined Qualitative and Quantitative Analysis
December 2003
33 Michael Atingi Ego & Rachel Kaggwa Sebudde
Measuring Efficiency of a Market in Transition: The Ugandan Foreign Exchange Market
September 2003
32 John A. Okidi & Andrew McKay Poverty Dynamics in Uganda: 1992 to 2000
May 2003
31 Rosetti Nabbumba & Godfrey Bahiigwa
Agricultural Productivity Constraints in Uganda: Implications for Investment
May 2003
30 M.D. Sajjabi Capital Account Liberalization in Uganda: An assessment of the early warning indicators and policy response
July 2003
29 Klaus Deininge, Gloria Kempaka, & Anja Crommelynck
Long-term welfare and investment impact of AIDS-related changes in family composition: Evidence from Uganda
December 2002
28 Klaus Deininger & John Okidi Growth and Poverty reduction in Uganda, 1992-2000: panel data evidence
March 2002
27
Marios Obwona & Adam Mugume Credit Accessibility and Investment Decisions in Uganda’s Manufacturing Sector: An empirical investigation
June 2001
26 Charles A. Abuka & Augustine Wandera
Determinants of Price Level Dynamics in Uganda: Some Stylized Facts and Empirical Evidence
June 2001
25 Godfrey B.A. Bahiigwa Household Food Security in Uganda: An Empirical Analysis
December 1999
24 Bruno R.M. Ocaya The Economic Performance of Highly Indebted African Countries
October 1999
23 Torgny Holmgren, Louis Kasekende Michael Atingi-Ego & Daniel Ddamulira
Aid and Reform in Uganda – Country Case Study
September 1999
22 Paul Okiira Okwi Poverty in Uganda: A Multivariate Analysis
October 1999
21 Godfrey Bahiigwa The Impact of Trade and Investment Policies on the Environment: The Case of the Fisheries Industry in Uganda
September 1999
20 Peter Mijumbi Estimation of Regional Staple Food Demand Elasticities using 1993-4 Uganda National Survey Data
September 1999
19 John Alphonse Okidi The Degree of Socially Sub-optimal Individual Behaviour in Collective Resource Management
September 1999
32

33
NUMBER
AUTHOR(S)
TITLE
DATE
18 John Alphonse Okidi The Potential for Community-based Management of Forest Resources in Uganda
September 1999
17 John Alphonse Okidi Regional Growth Disparities and Household Economic Performance in Uganda
September 1999
16 Gloria Kempaka Exchange Rate Movements and Their Effect on Industrial Production in Uganda
September 1999
15 Marios Obwona Foreign Direct Investment: Leader of Follower
September 1999
14 Marilyn Kamanyire External Financing and Economic Performance: The Case of Uganda
September 1999
13 Darlison Kaija Community and Economic Impact of Export Diversification: The Cut-Flower Industry in Uganda
September 1999
12 Klaus Deininger & John Okidi
Capital Market Access, Factor Demand, and Agricultural Development in Rural Areas of Developing Countries: The case of Uganda
June 1999
11 Fred Kakongoro Muhumuza How Responsive is Tax Revenue to Growth in Uganda
June 1999
10 Charles A. Abuka & David M. Sajjabi
The Importance of Domestic and External Factors in the Appreciation of the Real Exchange Rate in Uganda
March 1999
9 Marios Obwona Estimating Unreported Income of the Self-Employed and Tax Evasion in Uganda: An Expenditure-Based Approach
March 1999
8 Francis Nathan Okurut, Jonathan J.A.O. Odwee & Asaf Adebua
Determinants of Regional Poverty in Uganda
February 1999
7 Adam Mugume & Marios Obwona
Public Sector Deficit and Macroeconomic Performance in Uganda
August 1998
6 Michael Atingi-Ego & Winnie Rwebeyanga
The Effectiveness of the Treasury Bill as an Instrument of Monetary Policy in Uganda
October 1998
5 Marios Obwona Savings Mobilisation and Credit Conduits: Formal and Informal Financial Sector Linkages
January 1998
4 Marios Obwona Determinants of Foreign Direct Investments and their Impact on Economic Growth in Uganda
December 1998
3 Fred Opio The Impact of Structural Adjustment Programme on Poverty and Income Distribution in Uganda
September 1997
2 Marios Obwona & John Ddumba-Ssentamu
Nature and Determinants of Domestic Savings in Uganda
August 1997
1 John Matovu & Luke Okumu
Credit Accessibility to the Rural Poor in Uganda
May 1997

Economic Policy Research Centre (EPRC) 51 Pool Road Makerere University Campus P. O. Box 7841 Kampala, Uganda
Tel: 256-41-541023 Fax: 256-41-541022 Email: [email protected]
Copyright © 2022 FDOKUMEN